of June 7, 2010 This information is current as doi:10.4049/jimmunol.0904101 published online May 26, 2010; J. Immunol. Jagodic Holmdahl, Tomas Olsson, Robert A. Harris and Maja Patrick Leclerc, Rita Nohra, Stefan Lange, Rikard Alan Gillett, Monica Marta, Tao Jin, Jonatan Tuncel, Inflammatory Disease in Rats Regulates Genetically Determined and TNF Production in Macrophages Is Data Supplementary C1 http://www.jimmunol.org/cgi/content/full/jimmunol.0904101/D Subscriptions http://www.jimmunol.org/subscriptions/ online at is The Journal of Immunology Information about subscribing to Permissions http://www.aai.org/ji/copyright.html Submit copyright permission requests at Email Alerts http://www.jimmunol.org/subscriptions/etoc.shtml up at Receive free email alerts when new articles cite this article. Sign Print ISSN: 0022-1767 Online ISSN: 1550-6606. Immunologists, Inc. All rights reserved. Copyright ©2010 by The American Association of Rockville Pike, Bethesda, MD 20814-3994. The American Association of Immunologists, Inc., 9650 is published twice each month by The Journal of Immunology on June 7, 2010 www.jimmunol.org Downloaded from

Welcome message from author
This document is posted to help you gain knowledge. Please leave a comment to let me know what you think about it! Share it to your friends and learn new things together.
Transcript
of June 7, 2010 This information is current as
doi:10.4049/jimmunol.0904101 published online May 26, 2010; J. Immunol.
Jagodic Holmdahl, Tomas Olsson, Robert A. Harris and MajaPatrick Leclerc, Rita Nohra, Stefan Lange, Rikard Alan Gillett, Monica Marta, Tao Jin, Jonatan Tuncel,
Inflammatory Disease in RatsRegulatesGenetically Determined and
TNF Production in Macrophages Is
DataSupplementary
C1http://www.jimmunol.org/cgi/content/full/jimmunol.0904101/D
Subscriptions http://www.jimmunol.org/subscriptions/online at
isThe Journal of ImmunologyInformation about subscribing to
Permissions http://www.aai.org/ji/copyright.html
Submit copyright permission requests at
Email Alerts http://www.jimmunol.org/subscriptions/etoc.shtmlup at
Receive free email alerts when new articles cite this article. Sign
Print ISSN: 0022-1767 Online ISSN: 1550-6606. Immunologists, Inc. All rights reserved.Copyright ©2010 by The American Association ofRockville Pike, Bethesda, MD 20814-3994.The American Association of Immunologists, Inc., 9650
is published twice each month byThe Journal of Immunology
on June 7, 2010 w
ww
.jimm
unol.orgD
ownloaded from

The Journal of Immunology
TNF Production in Macrophages Is Genetically Determinedand Regulates Inflammatory Disease in Rats
Alan Gillett,* Monica Marta,* Tao Jin,† Jonatan Tuncel,‡ Patrick Leclerc,x
Rita Nohra,* Stefan Lange,{ Rikard Holmdahl,‡ Tomas Olsson,* Robert A. Harris,* and
Maja Jagodic*
Dysregulation of TNF is an important pathophysiological phenotype for many diseases. Recently, certain genetically regulated loci
have been identified to regulate several inflammatory diseases. We hypothesized that a region on rat chromosome 4 known to reg-
ulate experimental autoimmune encephalomyelitis, experimental arthritis and experimental autoimmune neuritis harbors a gene
regulating central inflammatory molecules, such as TNF. We therefore mapped TNF production using linkage analysis in the 12th
generation of an advanced intercross line between DA and PVG.AV1 rats, which differ in susceptibility to several inflammatory
conditions. A single TNF-regulating quantitative trait locus with a logarithm of odds score of 6.2 was identified and its biological
effect was confirmed in a congenic rat strain. The profound TNF regulation mapped in congenic strains to the macrophage pop-
ulation. Several TLR signaling cascades led to the same reduced proinflammatory phenotype in congenic macrophages, indicating
control of a convergence point for innate inflammatory activity. The decreased TNF potential and reduced proinflammatory mac-
rophage phenotype in congenic rats was also associated with reduced clinical severity in experimental autoimmune encephalomy-
elitis, pristane-induced arthritis and sepsis experimental models. Determination of genes and mechanisms involved in this
genetically determined TNF regulation will be valuable in understanding disease pathogenesis and aid treatment devel-
opment. The Journal of Immunology, 2010, 185: 000–000.
Oneofthemoststudiedandcentralcytokines in inflammationis TNF (1). Immune and nonimmune cells produce TNF inresponse to infection or immunological injury. Production
of this commonly classified proinflammatory cytokine is mediatedthrough several signaling cascades, most notably TLR4 signaling onLPS stimulation (2). TNF action via TNFR1 and TNFR2 leads toa wide range of both stimulatory and suppressive effects on targetcells, including differentiation, proliferation, and death (3).Regulation of TNF functions is crucial for appropriate immune
activity. Excessive TNF production is associated with rheumatoidarthritis (RA) (4), multiple sclerosis (MS) (5), septic shock (6),
and many animal models of disease. Reduced TNF production isassociated with liver disease and an inability to fight infection (7).Accordingly, many successful attempts have been made to targetTNF therapeutically. One of the most effective treatments forRA is TNF blockade, which includes mAbs to TNF (Infliximaband Adalumimab) and TNFR fusion proteins (Etanercept andLenercept). However, this therapy is ineffective in approximatelyone third of RA cases (8, 9), possibly because not all RA patientshave synovial inflammation due to disease heterogeneity (10). Thesame treatment is approved for Crohn’s disease, psoriatic arthritis,juvenile arthritis, and ankylosing spondylitis (11), but is inef-fective in other immune-mediated diseases, including MS. In fact,patients treated with TNF blockade have had central or peripheraldemyelinating conditions develop. Several patients with rapidlyprogressive MS who were treated with anti-TNF Ab had increaseddisease activity develop (12) and a phase II study of Lenerceptfound increased MS attack frequency (13).Understanding TNF regulation may therefore be important in
determining effective treatment strategies and investigating path-ogenic mechanisms. An interesting aspect of TNF regulation maybe at the genetic level, in which a predisposition to higher or lowerTNF production in various compartments may affect the immunesystems’ ability to respond properly to stress, such as infection ordisease. TNF locus polymorphisms regulate cytokine levels (14)and association of TNF locus genotypes with disease is definedbut difficult to dissect from the HLA contribution (15–18). How-ever, studies defining other genetic regions governing TNF pro-duction are limited (19).In this study, we investigated the genetic influence on the pro-
duction of TNF in different cells and in several animal models ofinflammation. We used linkage analysis of an advanced intercrossline (AIL) made betweenMHC-identical (including the TNF locus)DA and PVG.AV1 rat strains to define a genetic region regulatingTNF production after LPS stimulation. Our work focused on
*Neuroimmunology Unit, Department of Clinical Neuroscience and xRheumatologyUnit, Department of Medicine, Center for Molecular Medicine, ‡Medical Inflamma-tion Research, Karolinska Institutet, Stockholm; and †Department of Rheumatologyand Inflammation and {Institute of Biomedicine, University of Gothenburg, Gothen-burg, Sweden
Received for publication December 21, 2009. Accepted for publication April 24,2010.
This work was supported by the Multiple Sclerosis Society of Canada, the Bibbi andNiels Jensens Foundation, the Montel Williams Foundation, the Swedish Brain Foun-dation, the Torsten and Ragnar Soderbergs Foundation, the Swedish Research Coun-cil, and the 6th Framework Program of the European Union, NeuroproMiSe LSHM-CT-2005-018637 and EURATools LSHG-CT-2005-019015. M.M. was supported bya fellowship from the Portuguese Fundacao para a Ciencia e Tecnologia-ProjectoPOCTI/Formar e Qualificar, Medida 1.1 program.
Address correspondence and reprint requests to Alan Gillett, Karolinska Instititute,Solna, Sweden. E-mail address: [email protected]
The online version of this article contains supplemental material.
Abbreviations used in this paper: AGP, a-1–acid glycoprotein; AIL, advancedintercross line; BM, bone marrow; CIA, collagen-induced arthritis; CM, completemedium; EAE, experimental autoimmune encephalomyelitis; LOD, logarithm of odds;MMP, matrix metalloproteinase; MOG, myelin oligodendrocyte glycoprotein;MS, multiple sclerosis; PIA, pristane-induced arthritis; poly(I:C), polyinosinic-polycytidylic acid; QTL, quantitative trait locus; RA, rheumatoid arthritis; TLDA,TaqMan low density arrays.
Copyright� 2010 by The American Association of Immunologists, Inc. 0022-1767/10/$16.00
www.jimmunol.org/cgi/doi/10.4049/jimmunol.0904101
Published May 26, 2010, doi:10.4049/jimmunol.0904101 on June 7, 2010
ww
w.jim
munol.org
Dow
nloaded from
a region of rat chromosome 4 known to regulate several inflamma-tory diseases, including experimental autoimmune encephalomyeli-tis (EAE) (20), collagen-induced arthritis (CIA) (21), pristane-induced arthritis (PIA) (22), and experimental autoimmune neuritis(23). We identified a quantitative trait locus (QTL) using the 12thgeneration of the AIL and confirmed our findings using congenicrats that captured the biological phenotype. This differential TNFregulation was macrophage-driven and resulted in skewed immu-nocellular phenotypes. Several TLR signaling pathways led to sim-ilar differential TNF production, indicating a common convergenceregulated by genetic variability within the congenic insertion. Thesame genetically regulated pathway leading to a decrease in TNFproduction also reduced the severity of inflammatory diseases in-cluding EAE, PIA, and sepsis.
Materials and MethodsAnimals
DA rats were originally obtained from the Zentralinstitut fur Versuch-stierzucht (Hannover, Germany). MHC-identical PVG.AV1 rats were orig-inally obtained from Harlan UK Limited (Blackthorn, U.K.). CongenicR11 (DA.PVG-[D4Rat108-D4Rat233]) and R23 (DA.PVG-[D4Got60-D4Kini1]) rats were derived from the C4 congenic strain described pre-viously (24). Repeated backcrossing to the DA strain was performed andoffspring genotyped to select for desired recombinants. The AIL F1 gen-eration was established by two reciprocal breeding couples of DA andPVG.AV1. The F2 generation was produced from seven couples each ofF1 rats with DA or PVG.AV1 female founders. Fifty F2 breeding pairs withboth DA and PVG.AV1 female founders generated the third generation.Non-brother–sister random breeding of 50 males and females created thefollowing generations. Animals were bred and housed at the KarolinskaUniversity Hospital (Stockholm, Sweden) or at Scanbur (Sollentuna,Sweden), in polystyrene cages containing aspen-wood shavings with adlibitum food and standard rodent chow and a 12-h light/dark cycle. Theanimals were routinely monitored for pathogens according to a health-monitoring program for rats at the National Veterinary Institute (Uppsala,Sweden). A total of 463 rats (239 males and 224 females) from the 12thgeneration were used for the AIL genotyping and TNF phenotyping. Theseptic arthritis model was performed at Sahlgrenska University Hospital(University of Gothenburg, Sweden). Congenic and control rats weremixed in cages and matched for sex and age. All experiments in this studywere approved and performed in accordance with the guidelines from theSwedish National Board for Laboratory Animals and the European Com-munity Council Directive (86/609/EEC).
Genotype analysis
Genomic DNAwas prepared from ear clippings or tail tips using a standardprotocol. Polymorphic microsatellite markers for genotyping were selectedfromTheRatGenomeDatabase (http://rgd.mcw.edu). Primerswereobtainedfrom Sigma-Aldrich (St. Louis, MO) or Applied Biosystems (Foster City,CA). DNA amplification was performed with PCR using forward primersend-labeled with either [g33P]-ATP or a fluorescent dye (VIC, NED, FAM,and PET) (25). [g33P]-ATP–labeled PCR products were size-fractioned in6% polyacrylamide gels and visualized by autoradiography. Fluorescentlylabeled products were run using an ABI 3730 capillary sequencer and ana-lyzed using GeneMapper v3.7 software (Applied Biosystems) (26). All gen-otypes were evaluated manually and double checked.
Whole blood LPS stimulation
Blood samples were taken from tail tips of rats and collected in Falconlithium heparin Microtainer tubes (Becton Dickinston, Franklin Lakes, NJ).The 2 3 100 ml heparinized blood per rat was added in a 48-well NunclonD Surface plate (Nunc, Roskilde, Denmark) and diluted 1:4 with DMEM(Life Technologies-BRL, Grand Island, NY) containing 1% L-glutamine,1% penicillin-streptomycin, and 1% sodium pyruvate (complete medium[CM], all from Life Technologies, Paisley, Scotland). Duplicate cultureswere stimulated with LPS (Sigma-Aldrich) at a final concentration of 50
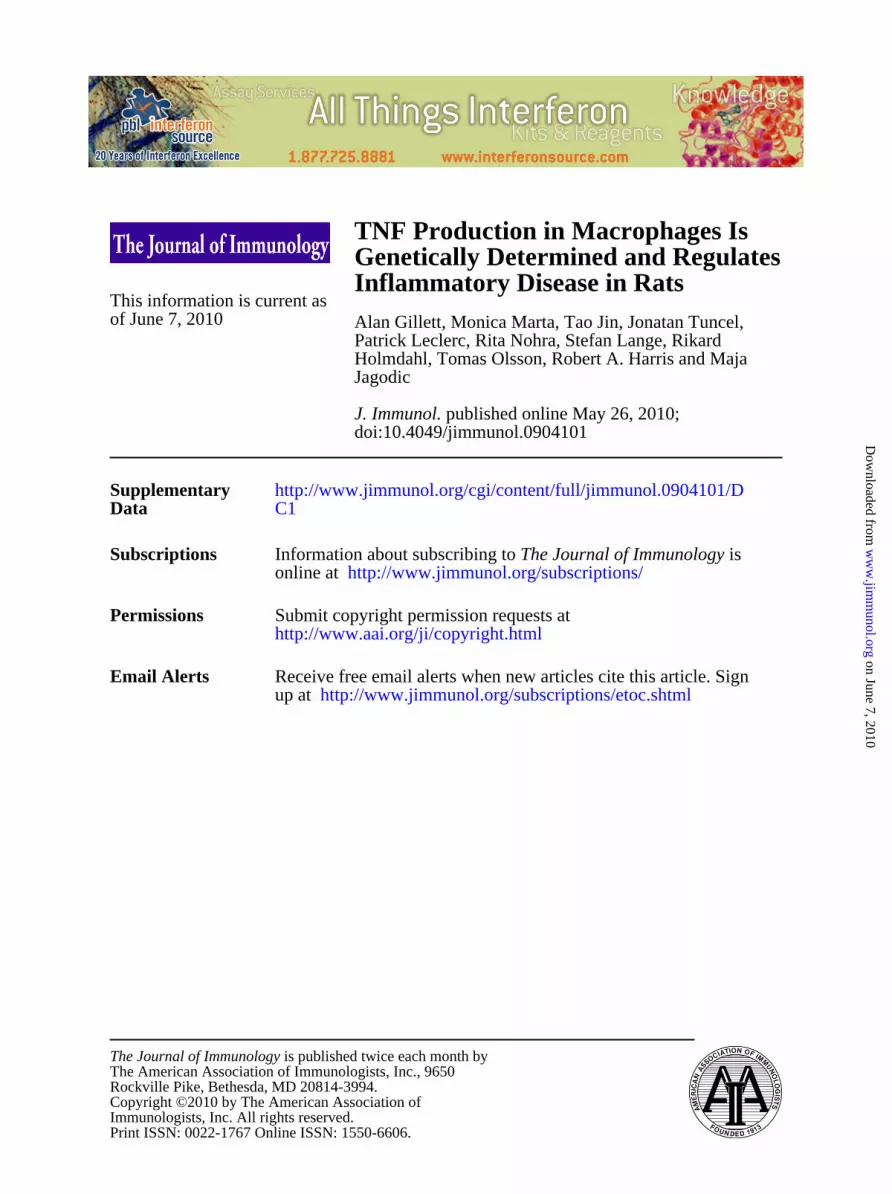
FIGURE 1. Identification of a genomic region regulating TNF pro-
duction. Blood was collected from 463 G12 AIL rats and stimulated with
LPS. TNF levels were determined using ELISA and linked to micro-
satellite genotypes. A, LOD plot versus marker position for a 39 Mb region
of rat chromosome 4. Genotyped markers are listed along the x-axis. A
single QTL with a LOD score of 6.2 at peak marker D4Mit12 was iden-
tified. The confidence interval was determined using external markers from
a 1.5 LOD drop. Congenic rat strain insertions of PVG DNA in a DA
background are illustrated (R11, white, external marker borders from 82.1
to 108 Mb; and R23, gray, external marker borders from 80.6 to 81.7 Mb).
The threshold of family residuals (LOD = 2) is plotted as a dashed line. B,
Variants of the genomic region at D4Mit12 regulate TNF in a dominant
fashion with one allele from the susceptible DA strain being sufficient to
determine high TNF levels. Error bars represent SEM. C, Whole blood
from DA (n = 52), R11 (n = 20), and R23 (n = 29) rats stimulated with LPS
for 18 h, normalized within each experiment to DA. R11 rats produce less
TNF compared with DA. D, No differences in cell population numbers
were detected between DA (n = 5) and R11 (n = 5) blood samples for
CD3+CD4+ and CD3+CD8+ T cells, CD45RA+ B cells, or CD11b+
monocytes. Error bars represent STD. pp, 0.05 using nonparametric Krus-
kal-Wallis ranking test, followed by a Dunn’s posthoc test for B and Mann-
Whitney U test on prenormalized values for C.
2 GENETIC CONTROL OF TNF REGULATES INFLAMMATORY DISEASES
on June 7, 2010 w
ww
.jimm
unol.orgD
ownloaded from
mg/ml, or unstimulated (only CM) and incubated at 37˚C with 5% CO2 for18 h. Supernatants were analyzed in duplicates using a commercial TNFELISA kit (BioSite, Paris, France). Cytokine levels in unstimulated bloodwere below the detection limit (,32.5 rg/ml). Congenic rat experimentswere normalized to DA controls by dividing the congenic average by theDA average, then multiplying by 100.
Cell collection and stimulation
Splenocytes were collected from extracted spleens by mechanical sepa-ration through a mesh screen followed by erythrocyte lysis using 0.84%NH4Cl (Sigma-Aldrich), pH 7.3 and washing with CM plus 5% heat-inactivated FCS (Life Technologies-BRL). Sorting of T, B, and dendriticcells was performed using successive MACS separation columns and beadsaccording the manufacturer’s instructions (Miltenyi Biotech, BergischGladbach, Germany). The i.p. macrophages were collected from sacrificedrats by lavage with 50 ml sterile PBS into the peritoneal cavity. The fluidwas collected and centrifuged for 7 min at 330 3 g before resuspension inCM plus 10% FCS. Cells were plated in 70 cm2 flasks (Nunc) and mediachanged at days 1 and 3. Bone marrow (BM) cells from rat femurs werecollected by flushing through media with a 23-gauge needle. Single-cellsuspensions were prepared and resuspended in CM plus 20% FCS and20% L929 cell line supernatant (L929 SN) to induce macrophage differ-entiation. BM cells were cultured for 8 d with 2 media changes and fora further 2 d without L929 SN. BM and i.p. macrophages were detachedby adding prewarmed (37˚C) 13 trypsin-EDTA (Life Technologies-BRL)and mechanical scraping. Cells (2 3 105) were plated and stimulated for 6or 24 h with 100 ng/ml LPS, 100 U/ml IFN-g (a gift from Dr. P. H. van derMeide, Utrecht University, The Netherlands), combined LPS and IFN-g,100mg/ml zymosan (Sigma-Aldrich), 200mg/ml polyinosinic-polycytidylicacid [poly(I:C)] (Sigma-Aldrich), or 0.5mg/mlConA (Sigma-Aldrich). TNFlevels were determined using a TNF ELISA kit.
Flow cytomentry
Splenocytes and blood cells were collected. RBCs were lysed and removedthrough successive washing with PBS. Cells were stained for 20 min at 4˚Cwith the following Abs: CD3-APC, CD4-PE:Cy5, CD8a-PE, CD11b-FITC, and CD45RA-PE (all from BD Biosciences, San Jose, CA). Stainingwas visualized using a FACS Calibur (Becton Dickinston) with Cell Quest(version 3.2.1f1, BD) and analyzed using FlowJo (version 8.8; TreeStar,Ashland, OR).
Quantitative PCR
Cultured BM macrophages were harvested after 1 and 24 h, respectively,and washed with PBS, resuspended in RLT buffer and RNA was isolatedusing an RNeasy kit (Qiagen, Hilden, Germany), according to the manu-facturer’s recommendations, including DNase I treatment. cDNA wasprepared using an iScript kit (BioRad, Hercules, CA). Expression wasdetermined using TaqMan low density arrays (TLDAs; Applied Bio-
systems). The targets of the TLDA are listed in Supplemental Table I.Probe details are available at the Applied Biosystems Web site (www.appliedbiosystems.com). Minimum information about a microarray exper-iment compliant data are available in the Gene Expression Omnibus (www.ncbi.nlm.nih.gov/geo/) under the accession number GSE21326. Analysisof TLDA targets was performed using relative gene expression to thegeometric mean of 18S, hypoxanthine phosphoribosyltransferase, andGAPDH (27).
Air pouch model
Air pouches were formed in 8- to 10-week-old female rats according tomethods described previously (28). Briefly, 20 ml of 0.2 mm sterile filteredair was injected s.c. at the dorsal midline, caudal, to the scapulae. After 72h, 10 ml sterile air was added to the pouches to reconstitute structure. The10 mg LPS in 2 ml saline (Braun, Melsungen, Germany) was injected intothe pouch on day 4 to induce cytokine production. Rats were sacrificedafter 1 h and 2 ml of 5.4 mM EDTA (Sigma-Aldrich) solution was injectedinto the pouch and collected to harvest the inflammatory exudate. TNFconcentration was determined using a TNF ELISA kit.
EAE model
Recombinant rat myelin oligodendrocyte glycoprotein (MOG), aa 1–125from the N terminus, was expressed in Escherichia coli and purified tohomogeneity by chelate chromatography (29). Eight- to 10-week-old ratswere anesthetized with isofluorane (Forene, Abbott Laboratories, Chicago,IL) and injected with a 200 ml inoculum at the tail base containing either12.5 mg (females) or 30 mg (males) MOG. Animals were weighed andblindly scored daily from day 10 postimmunization. Clinical score wasevaluated as follows: 1) limp tail; 2) hind leg paraparesis (wobbling gait);3) hind leg paralysis; 4) tetraplegia; and 5) moribund state or death. Ratssuffering severe disease (score 4) or 25% weight loss were sacrificed inaccordance with ethical guidelines. A score of 4 was assigned for theremaining days of sacrificed rats. The following clinical parameters wererecorded and calculated: incidence of EAE, namely, signs of EAE presentfor more than 1 d; onset of EAE, namely, first day of clinical signs;duration of EAE, namely, number of days rats showed clinical signs;and cumulative EAE score, namely, sum of the EAE scores obtained fromday 10 until the end of the experiment.
PIA model
PIA was induced by a single intradermal injection of 150 ml pristane(2,6,10,14-tetramethylpentadecane; ACROS Organics, Liege, Belgium) atthe base of the tail in 8- to 10-week-old male rats anesthetized with iso-fluorane. Arthritis development was blindly monitored in all four limbsusing a macroscopic scoring system. Briefly, 1 point was given for eachswollen and red toe, 1 point for each affected midfoot, digit, or knuckle,and 5 points for a swollen ankle (maximum score 15 per limb and 60 perrat). Sera was collected from rats at day 20 postimmunization and a-1–acid
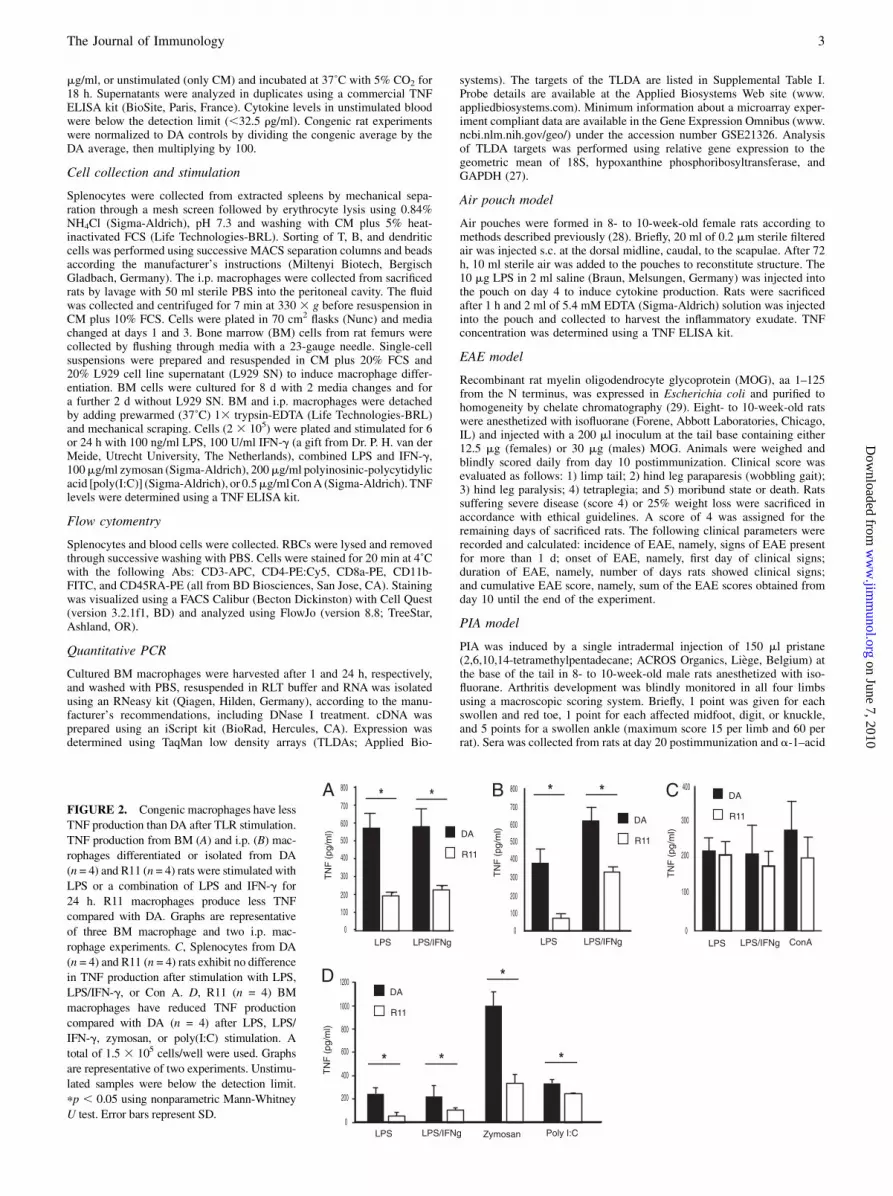
FIGURE 2. Congenic macrophages have less
TNF production than DA after TLR stimulation.
TNF production from BM (A) and i.p. (B) mac-
rophages differentiated or isolated from DA
(n = 4) and R11 (n = 4) rats were stimulated with
LPS or a combination of LPS and IFN-g for
24 h. R11 macrophages produce less TNF
compared with DA. Graphs are representative
of three BM macrophage and two i.p. mac-
rophage experiments. C, Splenocytes from DA
(n = 4) and R11 (n = 4) rats exhibit no difference
in TNF production after stimulation with LPS,
LPS/IFN-g, or Con A. D, R11 (n = 4) BM
macrophages have reduced TNF production
compared with DA (n = 4) after LPS, LPS/
IFN-g, zymosan, or poly(I:C) stimulation. A
total of 1.5 3 105 cells/well were used. Graphs
are representative of two experiments. Unstimu-
lated samples were below the detection limit.
pp , 0.05 using nonparametric Mann-Whitney
U test. Error bars represent SD.
The Journal of Immunology 3
on June 7, 2010 w
ww
.jimm
unol.orgD
ownloaded from

glycoprotein (AGP) levels determined using ELISA according to themanufacturer’s protocol (Life Diagnostics, West Chester, PA).
Septic arthritis model
Eight- to 10-week-old female rats received Staphylococcus aureus LS-1(13 109 CFU/rat) i.v. (30). After each inoculation procedure viable countswere performed in the leftover suspension to confirm the actual number ofadministered bacteria. Rats were weighed and examined for arthritis reg-ularly by a blinded observer. Arthritis was defined as erythema and/or-swelling of the joints. To evaluate the severity of arthritis, a visual clinicalscoring system of 0–3 for each limb was used: 0, normal; 1, mild swellingand/or erythema; 2, moderate swelling; and 3, marked swelling. The ar-thritis index was constructed by adding the scores from all limbs for eachrat (31). Rats were sacrificed by exsanguination under anesthesia on day 5after inoculation. Kidneys were aseptically removed, homogenized, dilutedserially in PBS, and transferred to agar plates containing 5% v/v horseblood (Boule Nordic, Huddinge, Sweden). Bacteria were grown for 24 hand then counted as CFUs in serial dilutions of homogenate. A bioassay
method using the murine hybridoma cell line B9, which is dependent onIL-6 for growth, was used to detect the serum levels of IL-6 (32). B9 cellswere seeded into microtiter plates (5000 cells/well), and dilutions of theserum samples or IL-6 standard were added to the wells. After 68 h in-cubation, [3H]thymidine (Amersham, U.K.) was added; 6 h later the cellswere harvested using a Wallac Tomtec (PerkinElmer, Waltham, MA) andisotype incorporation was measured using a Wallac TriLux 1450 Micro-beta (PerkinElmer).
Statistical analysis
Linkage analysis was performed with the statistical software R/qtl version2.6.2 (33). The natural log of TNF after LPS stimulation of whole bloodwas linked to microsatellite genotypes using a Haley-Knott model. No sex-specific effects were detected. The 95% CI for the identified QTL wasdefined by determining external flanking markers after a drop in a 10-baselogarithm of odds (LOD) of 1.5 (34). Differences in allelic effects of theQTL were measured at D4Mit12 with the nonparametric Kruskal-Wallisranking test using JMP version 6.0 (SAS Institute, Cary, NC). Family
FIGURE 3. Congenic BM macrophages have a reduced proinflammatory phenotype on 24 h zymosan stimulation. A, Relative expression compared with
the geometric mean of hypoxanthine phosphoribosyltransferase, GAPDH, and 18S for inflammatory targets with at least a 2-fold difference between DA
(n = 4) and R11 (n = 4). All targets are listed in Supplemental Table I. B, Schematic diagram of zymosan stimulation of macrophages; left panel, adapted
from the TLR signaling KEGG pathway (04620). Genes in red indicate upregulation in DA macrophages after stimulation. Genes in black indicate no
difference between DA and R11. pp , 0.05 using nonparametric Mann-Whitney U test. Error bars represent SEM.
4 GENETIC CONTROL OF TNF REGULATES INFLAMMATORY DISEASES
on June 7, 2010 w
ww
.jimm
unol.orgD
ownloaded from

residuals were calculated by taking the individual values for each rat minusthe family average. These values were then tested in R/qtl and the highestLOD score set as threshold (LOD = 2) (24). All other p values werecalculated using the nonparametric Mann-Whitney U test, except for in-cidence that was determined using the Fischer exact test.
ResultsIdentification of a genetic region regulating TNF using a ratG12 AIL
We hypothesized that the induction of a TNF response is associatedwith a previously identified disease-regulating region on rat chro-mosome 4 and therefore fine-mapped the genetic region using link-age analysis in a high-resolution AIL derived from DA and PVG.AV1 rats. Blood from 463 rats from the 12th generation of the AILwas collected and subjected to LPS stimulation. The resultingTNF concentration was determined using commercial ELISA.The natural log of the values were calculated to approximate a nor-mal data distribution and linked to genotypes of 17 markers be-tween 78 and 117 Mb.Linkage analysis identified a single QTL regulating TNF pro-
duction upon whole blood LPS stimulation with a LOD score of 6.2at the peak marker D4Mit12, located at 104.6 Mb (Fig. 1A). Theconfidence interval estimation using exterior markers to a 1.5 LODdrop spanned 3 Mb between D4Got215 (102.0 Mb) and D4Rat232(105.0 Mb). A total of 45 annotated genes reside within this ge-nomic region (Supplemental Table II). The peak marker score waswell above the LOD 2 threshold calculated using family residuallevels. DA alleles were linked to higher TNF production in adominant manner (Fig. 1B).
Confirmation of phenotype in congenic rats
To confirm the linkage analysis we bred and tested congenic ratstrains named R11 and R23, which contain PVG insertions ofsections of chromosome 4 in a DA background (Fig. 1A). Bothcongenics were bred from a single, larger congenic allowing us totest the influence of a specific region, R23 or R11, while con-trolling for potential background contamination of donor genome.On LPS stimulation of whole blood, R11 produced reduced levelsof TNF compared with DA; whereas, R23 exhibited no difference(Fig. 1C). We concluded that control of TNF specifically maps tothe R11 insertion, which has external borders of 82.1 and 108.0Mb, and that background genetic contamination does not con-tribute to this phenotype. Cellular population differences inblood did not contribute to the differences in TNF production.CD3+CD4+ and CD3+CD8+ T cell, CD45RA+ B cell, and CD11b+
monocyte proportions were equivalent between the R11 and DAstrains (Fig. 1D).
Differential TNF regulation maps to the macrophagepopulation
We next sought to determine whether TNF production differed ata cellular level and also to determine the cell type responsible forthis difference. The i.p.- and BM-derived macrophages, which mayrepresent varied phenotypes and activation states, were respectivelystimulated with LPS or a combination of LPS and IFN-g, followedby assessment of TNF levels using ELISA. At 6 h (data not included)and 24 h, both DA BM (Fig. 2A) and i.p. (Fig. 2B) macrophageshad increased production of TNF compared with R11 macrophages.Heterogeneous splenocytes were subjected to stimulation with eitherLPS, a combination of LPS and IFN-g or Con A, but exhibitedno difference in TNF production (Fig. 2C). To determine whetherisolated T, B, or dendritic cells were capable of differentiallyproducing TNF, we sorted these cell types from spleens. T cellsexhibited no difference on Con A stimulation (data not included).Sorted B cells and dendritic cells yielded no difference in TNF levels
after LPS stimulation (data not included). We therefore concludedthat genetic polymorphisms between DA and PVG, which lie withinthe R11 congenic profoundly and specifically control macrophageTNF production on LPS stimulation.
Several TLR signaling pathways differentially regulate TNF
We next aimed to determine whether the TNF regulation wasLPS-specific. We targeted several innate immune pathways that usedifferent intracellular signaling molecules and are known to regulateTNF levels. We tested activation of TLR2/6 (zymosan), TLR3 [poly(I:C)], TLR4 (LPS), and the IFN-gR. DA BM macrophages hadincreased TNF production after stimulation with LPS, LPS/IFN-g,poly(I:C), or the yeast cell wall component zymosan, respectively(Fig. 2D). Zymosan stimulation induced the greatest levels of TNFand was used for further mRNA experiments. IFN-g alone causedno TNF production (data not included). We concluded that a con-vergence point of several TLR signaling pathways is geneticallyregulated and leads to differential regulation of TNF in DA andR11 macrophages.
The proinflammatory cascade in macrophages is differentiallyregulated
Upregulation of the influential cytokine TNF is likely to coincidewith an altered macrophage phenotype through direct signaling andindirect cascade effects. To investigate the macrophage phenotypeon stimulation, we analyzed 45 selected inflammatory targets formRNA expression using TLDAs (Supplemental Table I). Expressionwas tested using cDNA from DA and R11 BM macrophages stim-ulated with zymosan for 1 and 24 h, respectively. After 1 h, mac-rophages were characterized by regulated expression of severalinflammatory receptors, including ICAM, decay accelerating factor(DAF1/CD55), FcgR2b, and FcεR2a (Supplemental Fig. 1). After24 h, a more pronounced phenotype was detected. DA macrophagesexhibited.2-fold increases in TNF, VCAM, STAT1, inducible NOsynthase, metallothionein 1a, matrix metalloproteinase (MMP)-9, MMP-12, IFN-gR1, FcgR2b, CXCL10, CD86, CCR7, andCCL22 compared with R11 (Fig. 3A). A range of proinflammatorymolecules representing cytokines, chemokines, receptors, channelproteins, enzymes, and enzyme inhibitors were upregulated inassociation with TNF production in DA macrophages (Fig. 3B).Interestingly, TIMP-3, a known inhibitor of MMP-9 (35), wasupregulated in R11 macrophages early after activation.
TNF regulation in vivo
We next tested the TNF production capacity of DA and R11 ratsin vivo using an LPS-injected air pouch, which is a model of local
FIGURE 4. R11 congenic rats produce less TNF in vivo in an air pouch
model of local inflammation. TNF production measured by ELISA of ex-
udate collected 1 h after LPS injection into air pouches of DA (n = 14) and
R11 (n = 11) rats. Results are representative of two experiments. Error bars
represent SEM. pp , 0.05, using nonparametric Mann-Whitney U test.
The Journal of Immunology 5
on June 7, 2010 w
ww
.jimm
unol.orgD
ownloaded from
inflammation. On introduction of LPS into the air pouch TNF pro-tein levels increase dramatically by 30 min and remain high forseveral hours (36). Our results after 1 h revealed that R11 ratsproduced less TNF on stimulation compared with DA rats withR11 air pouches having a 25% reduction in TNF levels (Fig. 4).
TNF and inflammatory mediator production regulates diseasesusceptibility
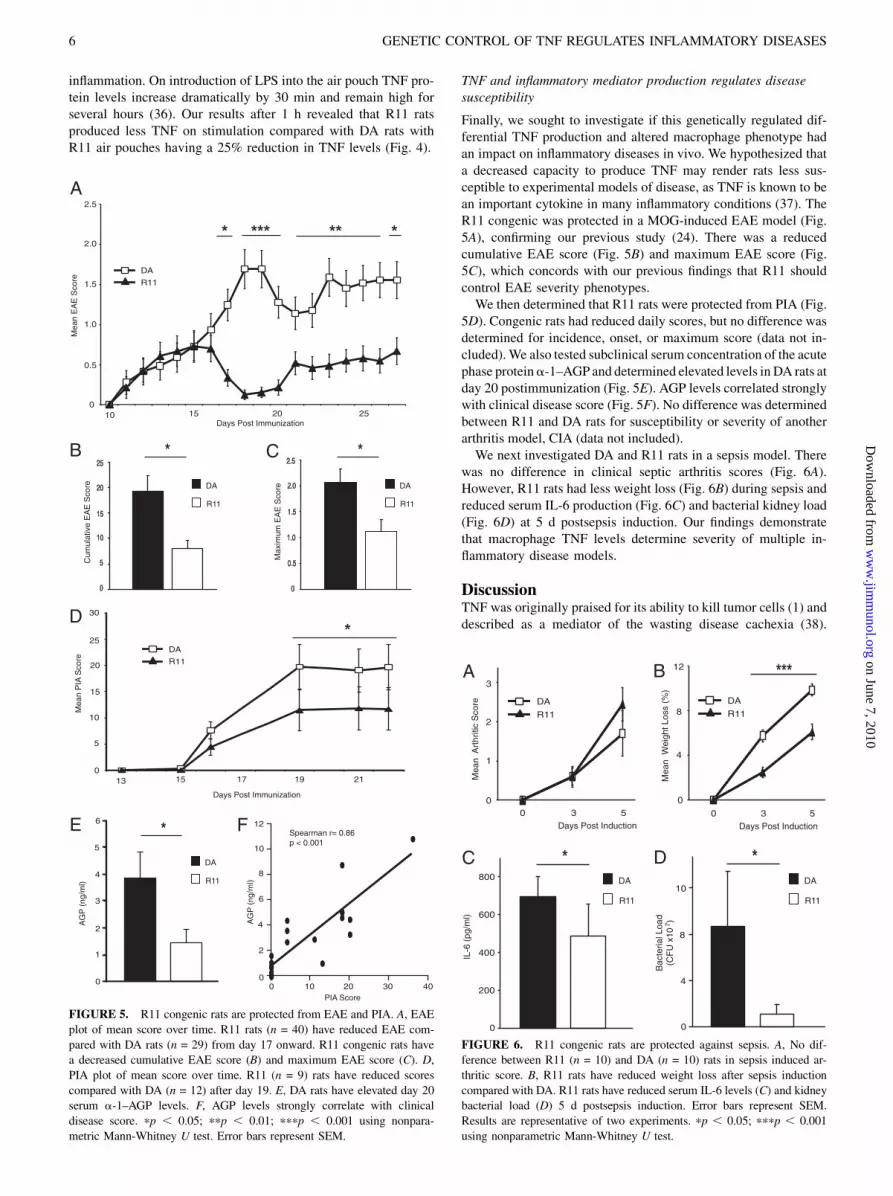
Finally, we sought to investigate if this genetically regulated dif-ferential TNF production and altered macrophage phenotype hadan impact on inflammatory diseases in vivo. We hypothesized thata decreased capacity to produce TNF may render rats less sus-ceptible to experimental models of disease, as TNF is known to bean important cytokine in many inflammatory conditions (37). TheR11 congenic was protected in a MOG-induced EAE model (Fig.5A), confirming our previous study (24). There was a reducedcumulative EAE score (Fig. 5B) and maximum EAE score (Fig.5C), which concords with our previous findings that R11 shouldcontrol EAE severity phenotypes.We then determined that R11 rats were protected from PIA (Fig.
5D). Congenic rats had reduced daily scores, but no difference wasdetermined for incidence, onset, or maximum score (data not in-cluded).We also tested subclinical serum concentration of the acutephase proteina-1–AGP and determined elevated levels in DA rats atday 20 postimmunization (Fig. 5E). AGP levels correlated stronglywith clinical disease score (Fig. 5F). No difference was determinedbetween R11 and DA rats for susceptibility or severity of anotherarthritis model, CIA (data not included).We next investigated DA and R11 rats in a sepsis model. There
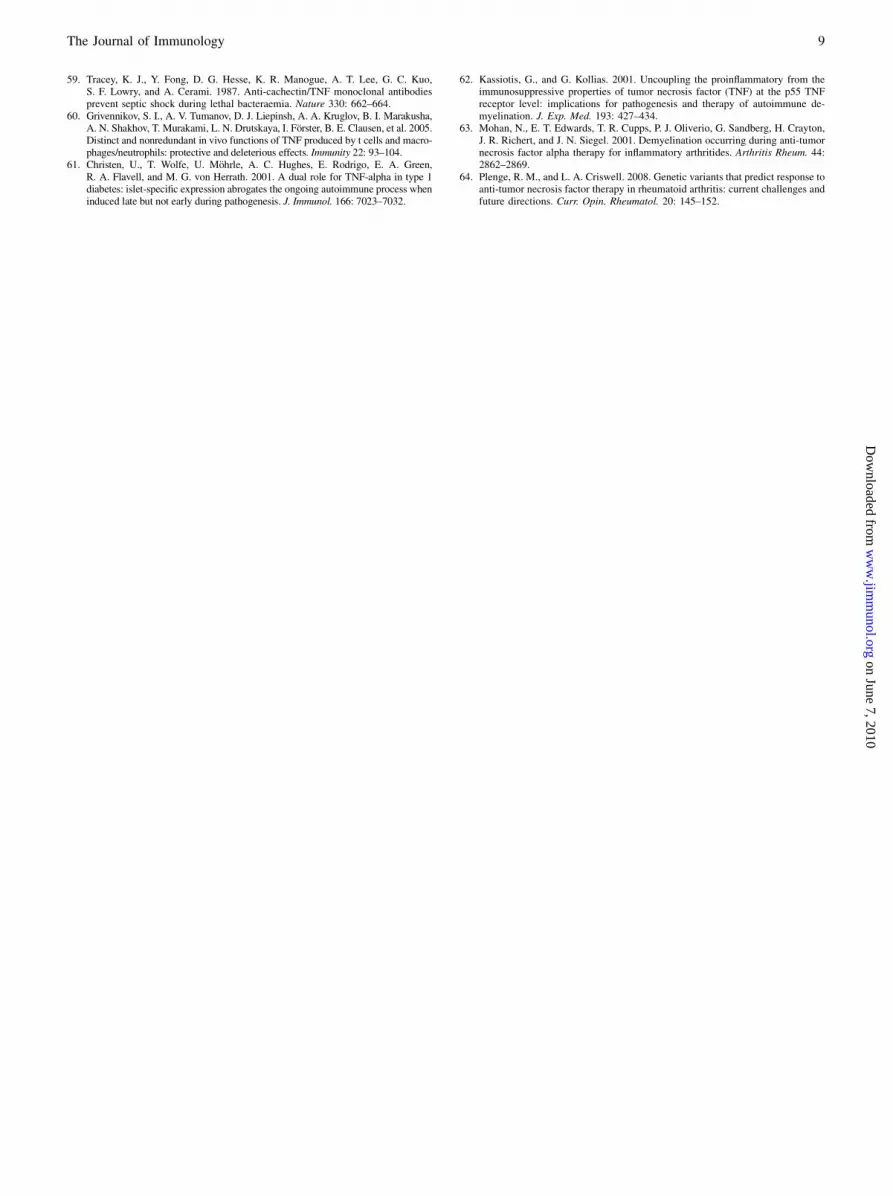
was no difference in clinical septic arthritis scores (Fig. 6A).However, R11 rats had less weight loss (Fig. 6B) during sepsis andreduced serum IL-6 production (Fig. 6C) and bacterial kidney load(Fig. 6D) at 5 d postsepsis induction. Our findings demonstratethat macrophage TNF levels determine severity of multiple in-flammatory disease models.
DiscussionTNF was originally praised for its ability to kill tumor cells (1) anddescribed as a mediator of the wasting disease cachexia (38).
FIGURE 6. R11 congenic rats are protected against sepsis. A, No dif-
ference between R11 (n = 10) and DA (n = 10) rats in sepsis induced ar-
thritic score. B, R11 rats have reduced weight loss after sepsis induction
compared with DA. R11 rats have reduced serum IL-6 levels (C) and kidney
bacterial load (D) 5 d postsepsis induction. Error bars represent SEM.
Results are representative of two experiments. pp , 0.05; pppp , 0.001
using nonparametric Mann-Whitney U test.
FIGURE 5. R11 congenic rats are protected from EAE and PIA. A, EAE
plot of mean score over time. R11 rats (n = 40) have reduced EAE com-
pared with DA rats (n = 29) from day 17 onward. R11 congenic rats have
a decreased cumulative EAE score (B) and maximum EAE score (C). D,
PIA plot of mean score over time. R11 (n = 9) rats have reduced scores
compared with DA (n = 12) after day 19. E, DA rats have elevated day 20
serum a-1–AGP levels. F, AGP levels strongly correlate with clinical
disease score. pp , 0.05; ppp , 0.01; pppp , 0.001 using nonpara-
metric Mann-Whitney U test. Error bars represent SEM.
6 GENETIC CONTROL OF TNF REGULATES INFLAMMATORY DISEASES
on June 7, 2010 w
ww
.jimm
unol.orgD
ownloaded from

However, the understanding of its role in inflammation has greatlyexpanded; TNF can induce apoptosis, cause activation of in-flammatory cells as well as orchestrate immune resolution (37).This may be attributed to different types of TNF (membrane-bound versus secreted), two signaling receptors, localization of theprotein, timing of release, and coactivation with other external andinternal molecules. Our study explored genetically regulated TNFproduction in rats using linkage analysis in a high-resolution AIL,congenic breeding, in vitro cellular phenotyping, and in vivo dis-ease models. We have determined important differences betweenparental DA and congenic R11 rats that regulate TNF levels anddisease severity due to the allele substitution at a single QTL.We mapped TNF production after LPS stimulation, which could
be considered a subphenotype of several diseases with a patho-physiology that includes dysregulated TNF levels. The use ofa simple subphenotype allowed for efficient testing and permitted usto use a single set of AIL rats to define a common genetic regionregulating inflammatory diseases. Several successful human studieshave also used subphenotype mapping. Polymorphisms withinIL2RA, a type 1 diabetes risk gene, are correlated with cellularprotein levels (39) and a strong association exists with the sub-phenotype of circulating levels of the soluble IL2RA biomarker(40). In addition, low-density lipid levels are used as a subpheno-type for cardiovascular and cerebrovascular diseases and provideinformation on disease progression and treatment targets (41). Sim-ilarly, subphenotypes can be used to distinguish subgroup withina disease, as is the case with anticitrulline Ab levels in RA, whichare associated with different genetic determinants (42).We described differential TNF production that is genetically
regulatedbetweenparentalDAandcongenicR11macrophages. TheTNF locus is genetically identical between the strains and thereforedoes not contribute to differential regulation. In vitro experimentsstimulating multiple TLR signaling cascades demonstrated thata common intersection point is affected by the TNF-regulatingalleles at the innate immune system level. MyD88-dependent(TLR2 and 4) and -independent (TLR3 and 4) stimulations (43)were under similar genetic regulation, with DA macrophages pro-ducing more TNF compared with their R11 counterparts. Thus,activation of endosomal TLR3 by poly(I:C) leading to IFN re-sponse factor 3 activation (44), as well as signaling through otherTLRs causing activation and translocation of AP-1 andNF-kB (45),all similarly determined TNF production levels. We speculate thatthe responsible gene is either a signaling modulator or a tran-scription factor that is part of a cascade with widespread inflamma-tory effects. Alternatively, posttranscriptional modifications ofTNF mRNA could equally determine differential protein levelsbetween the strains, as has been previously demonstrated in acti-vated macrophages (46). Furthermore, the initial differences inTNF production by macrophages may result in altered patterns ofstimulation for other cells types, such as T cells, which could ex-acerbate the skewed mRNA and protein cytokine levels in vivo.Thedifferences inTNF levels andalteredmacrophagephenotypes
affected severity of disease but not susceptibility. The biologicaleffect of differential TNF production could be at the peripheralpriming or target restimulation stages when macrophages act asAPCs to T cells and dictate the effector T cell subset, at the mac-rophage effector stage when tissue destruction occurs and/or duringresolutionofongoinginflammation.Withclinicaldifferences inEAEand PIA but not CIA, it seems that T cells may be an importantcomponent determining disease severity (47, 48), as the role ofB cells and Abs in CIA is more relevant (49). In addition, IFN-glevels in T cells are regulated during experimental autoimmuneneuritis by the same locus, which argues for adaptive immunesystem regulation (23). At the same time, the proinflammatory
macrophage phenotype in DA rats would indicate their role aseffector cells contributing to disease severity through damagingMMP expression as well as recruitment of other cells throughchemokine release. In support of this theory, macrophages arefound in MS and EAE lesions as well as RA joints (50–52). Thesepsis experiments determined interesting results; increased TNFassociated with both weight loss, likely due to subclinical diseaseand cachexia, and unexpectedly reduced bacterial clearance,possibly due to macrophage autophagy (53).This genetically regulated pathway leading to higher TNF pro-
duction and proinflammatory activation in macrophages conformswell to previously demonstrated pathogenic roles of TNF. Geneticstudies on TNF in the mouse have employed transgenic andknockout strategies to evaluate the role of TNF in several diseases.Overproduction of TNF in the pancreas of the nonobese diabeticmouse increases the rate of diabetes (54). The TNF2/2 mouse hasreduced arthritis (55) and EAE (56); whereas, the TNFR12/2
mouse is protected from EAE (57) and endotoxin-induced shock(58), which corroborates our findings that reduced TNF signaling isprotective. Furthermore, neutralization of TNF prevents the devel-opment of septic shock in animal models (59), which indicates thatreduced TNF in R11 rats may lead to less severe infection. How-ever, it is important to note that TNF is not always detrimental andthat the role of TNF may change during disease course. T cell-specific TNF ablation results in increased bacterial infection, in-dicating that TNF is required to mount an effective immune re-sponse (60). In addition, dual beneficial and harmful roles ofTNF have been proposed for experimental diabetes (61) and EAE(62). Interestingly, TNF blockade in MS was an ineffective thera-peutic option (13) and some patients treated with TNF blockadehave developed demyelinating conditions (63). Therefore, it is im-portant to dissect different TNF pathways and their roles in differ-ent cell compartments, which can be performed genetically asdemonstrated here.Individually tailored therapy may be achieved through predic-
tion of individuals who are predisposed to high TNF production. Ithas been proposed that genetics may determine TNF blockaderesponse in patients; however, to date no single genetic factor isunequivocally associated with this difference (64). We have usedunbiased linkage analysis to define a region regulating TNFproduction in macrophages. The identification of the responsiblegene(s) will not only provide a potential therapeutic target, butalso enable dissection of mechanism(s) controlling inflammationfor development of new therapies.
DisclosuresThe authors have no financial conflicts of interest.
References1. Carswell, E. A., L. J. Old, R. L. Kassel, S. Green, N. Fiore, and B. Williamson.
1975. An endotoxin-induced serum factor that causes necrosis of tumors. Proc.Natl. Acad. Sci. USA 72: 3666–3670.
2. Poltorak, A., X. He, I. Smirnova, M. Y. Liu, C. Van Huffel, X. Du, D. Birdwell,E. Alejos, M. Silva, C. Galanos, et al. 1998. Defective LPS signaling inC3H/HeJ and C57BL/10ScCr mice: mutations in Tlr4 gene. Science 282: 2085–2088.
3. O’Shea, J. J., A. Ma, and P. Lipsky. 2002. Cytokines and autoimmunity. Nat. Rev.Immunol. 2: 37–45.
4. Husby, G., and R. C. Williams, Jr. 1988. Synovial localization of tumor necrosisfactor in patients with rheumatoid arthritis. J. Autoimmun. 1: 363–371.
5. Hofman, F. M., D. R. Hinton, K. Johnson, and J. E. Merrill. 1989. Tumor ne-crosis factor identified in multiple sclerosis brain. J. Exp. Med. 170: 607–612.
6. Tracey, K. J., B. Beutler, S. F. Lowry, J. Merryweather, S. Wolpe, I. W. Milsark,R. J. Hariri, T. J. Fahey, III, A. Zentella, J. D. Albert, et al. 1986. Shock andtissue injury induced by recombinant human cachectin. Science 234: 470–474.
7. Havell, E. A. 1989. Evidence that tumor necrosis factor has an important role inantibacterial resistance. J. Immunol. 143: 2894–2899.
8. Klareskog, L., D. van der Heijde, J. P. de Jager, A. Gough, J. Kalden,M. Malaise, E. Martın Mola, K. Pavelka, J. Sany, L. Settas, et al; TEMPO (Trial
The Journal of Immunology 7
on June 7, 2010 w
ww
.jimm
unol.orgD
ownloaded from

of Etanercept and Methotrexate with Radiographic Patient Outcomes) studyinvestigators. 2004. Therapeutic effect of the combination of etanercept andmethotrexate compared with each treatment alone in patients with rheumatoidarthritis: double-blind randomised controlled trial. Lancet 363: 675–681.
9. Keystone, E. C., M. H. Schiff, J. M. Kremer, S. Kafka, M. Lovy, T. DeVries, andD. J. Burge. 2004. Once-weekly administration of 50 mg etanercept in patientswith active rheumatoid arthritis: results of a multicenter, randomized, double-blind, placebo-controlled trial. Arthritis Rheum. 50: 353–363.
10. van der Pouw Kraan, T. C., C. A. Wijbrandts, L. G. van Baarsen, F. Rustenburg,J. M. Baggen, C. L. Verweij, and P. P. Tak. 2008. Responsiveness to anti-tumournecrosis factor alpha therapy is related to pre-treatment tissue inflammationlevels in rheumatoid arthritis patients. Ann. Rheum. Dis. 67: 563–566.
11. Hochberg, M. C., M. G. Lebwohl, S. E. Plevy, K. F. Hobbs, and D. E. Yocum.2005. The benefit/risk profile of TNF-blocking agents: findings of a consensuspanel. Semin. Arthritis Rheum. 34: 819–836.
12. van Oosten, B. W., F. Barkhof, L. Truyen, J. B. Boringa, F. W. Bertelsmann,B. M. von Blomberg, J. N. Woody, H. P. Hartung, and C. H. Polman. 1996.Increased MRI activity and immune activation in two multiple sclerosis patientstreated with the monoclonal anti-tumor necrosis factor antibody cA2. Neurology47: 1531–1534.
13. The Lenercept Multiple Sclerosis Study Group and The University of BritishColumbia MS/MRI Analysis Group. 1999. TNF neutralization in MS: results ofa randomized, placebo-controlled multicenter study. Neurology 53: 457–465.
14. Louis, E., D. Franchimont, A. Piron, Y. Gevaert, N. Schaaf-Lafontaine,S. Roland, P. Mahieu, M. Malaise, D. De Groote, R. Louis, and J. Belaiche.1998. Tumour necrosis factor (TNF) gene polymorphism influences TNF-alphaproduction in lipopolysaccharide (LPS)-stimulated whole blood cell culture inhealthy humans. Clin. Exp. Immunol. 113: 401–406.
15. McGuire, W., A. V. Hill, C. E. Allsopp, B. M. Greenwood, and D. Kwiatkowski.1994. Variation in the TNF-alpha promoter region associated with susceptibilityto cerebral malaria. Nature 371: 508–510.
16. Westendorp, R. G., J. A. Langermans, T. W. Huizinga, A. H. Elouali,C. L. Verweij, D. I. Boomsma, J. P. Vandenbroucke, and J. P. Vandenbrouke.1997. Genetic influence on cytokine production and fatal meningococcal disease.Lancet 349: 170–173.
17. Fernandez-Arquero, M., R. Arroyo, A. Rubio, C. Martin, P. Vigil, L. Conejero,M. A. Figueredo, and E. G. de la Concha. 1999. Primary association of a TNF genepolymorphism with susceptibility to multiple sclerosis. Neurology 53: 1361–1363.
18. Martınez, A., M. Fernandez-Arquero, D. Pascual-Salcedo, L. Conejero,H. Alves, A. Balsa, and E. G. de la Concha. 2000. Primary association oftumor necrosis factor-region genetic markers with susceptibility to rheumatoidarthritis. Arthritis Rheum. 43: 1366–1370.
19. Xu, H., E. Wallstrom, K. Becanovic, I. Dahlman, and J. C. Lorentzen. 2002.Identification of rat quantitative trait loci that regulate LPS-induced pro-inflammatory cytokine responses. Scand. J. Immunol. 56: 248–253.
20. Dahlman, I., J. C. Lorentzen, K. L. de Graaf, A. Stefferl, C. Linington,H. Luthman, and T. Olsson. 1998. Quantitative trait loci disposing for bothexperimental arthritis and encephalomyelitis in the DA rat; impact on severity ofmyelin oligodendrocyte glycoprotein-induced experimental autoimmune en-cephalomyelitis and antibody isotype pattern. Eur. J. Immunol. 28: 2188–2196.
21. Remmers, E. F., R. E. Longman, Y. Du, A. O’Hare, G. W. Cannon,M. M. Griffiths, and R. L. Wilder. 1996. A genome scan localizes five non-MHCloci controlling collagen-induced arthritis in rats. Nat. Genet. 14: 82–85.
22. Vingsbo-Lundberg, C., N. Nordquist, P. Olofsson, M. Sundvall, T. Saxne,U. Pettersson, and R. Holmdahl. 1998. Genetic control of arthritis onset,severity and chronicity in a model for rheumatoid arthritis in rats. Nat. Genet.20: 401–404.
23. Huberle, A., A. D. Beyeen, J. Ockinger, M. Ayturan, M. Jagodic, K. L. de Graaf,N. Fissolo, M. Marta, P. Olofsson, M. Hultqvist, et al. 2009. Advanced intercrossline mapping suggests that ncf1 (ean6) regulates severity in an animal model ofguillain-barre syndrome. J. Immunol. 182: 4432–4438.
24. Marta, M., P. Stridh, K. Becanovic, A. Gillett, J. Ockinger, J. C. Lorentzen, M.Jagodic, and T. Olsson. 2010. Multiple loci comprising immune-related genesregulate experimental neuroinflammation. Genes Immun 11: 21–36.
25. Jacob, H. J., K. Lindpaintner, S. E. Lincoln, K. Kusumi, R. K. Bunker, Y. P. Mao,D. Ganten, V. J. Dzau, and E. S. Lander. 1991. Genetic mapping of a genecausing hypertension in the stroke-prone spontaneously hypertensive rat. Cell67: 213–224.
26. Wenz, H., J. M. Robertson, S. Menchen, F. Oaks, D. M. Demorest, D. Scheibler,B. B. Rosenblum, C. Wike, D. A. Gilbert, and J. W. Efcavitch. 1998. High-precision genotyping by denaturing capillary electrophoresis. Genome Res. 8:69–80.
27. Schmittgen, T. D., and K. J. Livak. 2008. Analyzing real-time PCR data by thecomparative C(T) method. Nat. Protoc. 3: 1101–1108.
28. Edwards, J. C., A. D. Sedgwick, and D. A. Willoughby. 1981. The formation ofa structure with the features of synovial lining by subcutaneous injection of air:an in vivo tissue culture system. J. Pathol. 134: 147–156.
29. Amor, S., N. Groome, C. Linington, M. M. Morris, K. Dornmair,M. V. Gardinier, J. M. Matthieu, and D. Baker. 1994. Identification of epitopes ofmyelin oligodendrocyte glycoprotein for the induction of experimental allergicencephalomyelitis in SJL and Biozzi AB/H mice. J. Immunol. 153: 4349–4356.
30. Bremell, T., S. Lange, L. Svensson, E. Jennische, K. Grondahl, H. Carlsten, andA. Tarkowski. 1990. Outbreak of spontaneous staphylococcal arthritis and os-teitis in mice. Arthritis Rheum. 33: 1739–1744.
31. Bremell, T., S. Lange, R. Holmdahl, C. Ryden, G. K. Hansson, andA. Tarkowski. 1994. Immunopathological features of rat Staphylococcus aureusarthritis. Infect. Immun. 62: 2334–2344.
32. Helle, M., L. Boeije, and L. A. Aarden. 1988. Functional discrimination betweeninterleukin 6 and interleukin 1. Eur. J. Immunol. 18: 1535–1540.
33. Broman, K. W., H. Wu, S. Sen, and G. A. Churchill. 2003. R/qtl: QTL mappingin experimental crosses. Bioinformatics 19: 889–890.
34. Dupuis, J., and D. Siegmund. 1999. Statistical methods for mapping quantitativetrait loci from a dense set of markers. Genetics 151: 373–386.
35. Butler, G. S., S. S. Apte, F. Willenbrock, and G. Murphy. 1999. Human tissueinhibitor of metalloproteinases 3 interacts with both the N- and C-terminaldomains of gelatinases A and B. Regulation by polyanions. J. Biol. Chem.274: 10846–10851.
36. Miller, A. J., G. N. Luheshi, N. J. Rothwell, and S. J. Hopkins. 1997. Localcytokine induction by LPS in the rat air pouch and its relationship to the febrileresponse. Am. J. Physiol. 272: R857–R861.
37. Kollias, G., E. Douni, G. Kassiotis, and D. Kontoyiannis. 1999. The function oftumour necrosis factor and receptors in models of multi-organ inflammation,rheumatoid arthritis, multiple sclerosis and inflammatory bowel disease. Ann.Rheum. Dis. 58(Suppl 1): I32–I39.
38. Cerami, A., Y. Ikeda, N. Le Trang, P. J. Hotez, and B. Beutler. 1985. Weight lossassociated with an endotoxin-induced mediator from peritoneal macrophages:the role of cachectin (tumor necrosis factor). Immunol. Lett. 11: 173–177.
39. Dendrou, C. A., V. Plagnol, E. Fung, J. H. Yang, K. Downes, J. D. Cooper,S. Nutland, G. Coleman, M. Himsworth, M. Hardy, et al. 2009. Cell-specificprotein phenotypes for the autoimmune locus IL2RA using a genotype-selectable human bioresource. Nat. Genet. 41: 1011–1015.
40. Lowe, C. E., J. D. Cooper, T. Brusko, N. M. Walker, D. J. Smyth, R. Bailey,K. Bourget, V. Plagnol, S. Field, M. Atkinson, et al. 2007. Large-scale geneticfine mapping and genotype-phenotype associations implicate polymorphism inthe IL2RA region in type 1 diabetes. Nat. Genet. 39: 1074–1082.
41. Ridker, P. M., E. Danielson, F. A. Fonseca, J. Genest, A. M. Gotto, Jr.,J. J. Kastelein, W. Koenig, P. Libby, A. J. Lorenzatti, J. G. Macfadyen, et al;JUPITER Trial Study Group. 2009. Reduction in C-reactive protein and LDLcholesterol and cardiovascular event rates after initiation of rosuvastatin: a pro-spective study of the JUPITER trial. Lancet 373: 1175–1182.
42. Klareskog, L., A. I. Catrina, and S. Paget. 2009. Rheumatoid arthritis. Lancet373: 659–672.
43. Pandey, S., and D. K. Agrawal. 2006. Immunobiology of Toll-like receptors:emerging trends. Immunol. Cell Biol. 84: 333–341.
44. Doyle, S., S. Vaidya, R. O’Connell, H. Dadgostar, P. Dempsey, T. Wu, G. Rao,R. Sun, M. Haberland, R. Modlin, and G. Cheng. 2002. IRF3 mediates a TLR3/TLR4-specific antiviral gene program. Immunity 17: 251–263.
45. Jones, B. W., T. K. Means, K. A. Heldwein, M. A. Keen, P. J. Hill, J. T. Belisle,and M. J. Fenton. 2001. Different Toll-like receptor agonists induce distinctmacrophage responses. J. Leukoc. Biol. 69: 1036–1044.
46. Sariban, E., K. Imamura, R. Luebbers, and D. Kufe. 1988. Transcriptional andposttranscriptional regulation of tumor necrosis factor gene expression in humanmonocytes. J. Clin. Invest. 81: 1506–1510.
47. Ortiz-Ortiz, L., R. M. Nakamura, and W. O. Weigle. 1976. T cell requirement forexperimental allergic encephalomyelitis induction in the rat. J. Immunol. 117:576–579.
48. Vingsbo, C., P. Sahlstrand, J. G. Brun, R. Jonsson, T. Saxne, and R. Holmdahl.1996. Pristane-induced arthritis in rats: a new model for rheumatoid arthritis witha chronic disease course influenced by both major histocompatibility complexand non-major histocompatibility complex genes. Am. J. Pathol. 149: 1675–1683.
49. Stuart, J. M., M. A. Cremer, A. S. Townes, and A. H. Kang. 1982. Type IIcollagen-induced arthritis in rats. Passive transfer with serum and evidence thatIgG anticollagen antibodies can cause arthritis. J. Exp. Med. 155: 1–16.
50. Hauser, S. L., A. K. Bhan, F. Gilles, M. Kemp, C. Kerr, and H. L. Weiner. 1986.Immunohistochemical analysis of the cellular infiltrate in multiple sclerosislesions. Ann. Neurol. 19: 578–587.
51. Lampert, P., and S. Carpenter. 1965. Electron Microscopic Studies on the Vas-cular Permeability and the Mechanism of Demyelination in Experimental Al-lergic Encephalomyelitis. J. Neuropathol. Exp. Neurol. 24: 11–24.
52. Yanni, G., A. Whelan, C. Feighery, and B. Bresnihan. 1994. Synovial tissuemacrophages and joint erosion in rheumatoid arthritis. Ann. Rheum. Dis. 53: 39–44.
53. Sohn, H., K. W. Kim, H. B. Kang, C. J. Won, W. S. Kim, B. Lee, O. J. Kwon,W. J. Koh, S. J. Shin, and H. J. Kim. 2010. Induction of macrophage death byclinical strains of Mycobacterium kansasii. Microb. Pathog. 48: 160–167.
54. Green, E. A., E. E. Eynon, and R. A. Flavell. 1998. Local expression ofTNFalpha in neonatal NOD mice promotes diabetes by enhancing presentationof islet antigens. Immunity 9: 733–743.
55. Campbell, I. K., K. O’Donnell, K. E. Lawlor, and I. P. Wicks. 2001. Severeinflammatory arthritis and lymphadenopathy in the absence of TNF. J. Clin.Invest. 107: 1519–1527.
56. Korner, H., D. S. Riminton, D. H. Strickland, F. A. Lemckert, J. D. Pollard, andJ. D. Sedgwick. 1997. Critical points of tumor necrosis factor action in centralnervous system autoimmune inflammation defined by gene targeting. J. Exp.Med. 186: 1585–1590.
57. Eugster, H. P., K. Frei, R. Bachmann, H. Bluethmann, H. Lassmann, andA. Fontana. 1999. Severity of symptoms and demyelination in MOG-inducedEAE depends on TNFR1. Eur. J. Immunol. 29: 626–632.
58. Pfeffer, K., T. Matsuyama, T. M. Kundig, A. Wakeham, K. Kishihara,A. Shahinian, K. Wiegmann, P. S. Ohashi, M. Kronke, and T. W. Mak. 1993.Mice deficient for the 55 kd tumor necrosis factor receptor are resistant toendotoxic shock, yet succumb to L. monocytogenes infection. Cell 73: 457–467.
8 GENETIC CONTROL OF TNF REGULATES INFLAMMATORY DISEASES
on June 7, 2010 w
ww
.jimm
unol.orgD
ownloaded from
59. Tracey, K. J., Y. Fong, D. G. Hesse, K. R. Manogue, A. T. Lee, G. C. Kuo,S. F. Lowry, and A. Cerami. 1987. Anti-cachectin/TNF monoclonal antibodiesprevent septic shock during lethal bacteraemia. Nature 330: 662–664.
60. Grivennikov, S. I., A. V. Tumanov, D. J. Liepinsh, A. A. Kruglov, B. I. Marakusha,A. N. Shakhov, T. Murakami, L. N. Drutskaya, I. Forster, B. E. Clausen, et al. 2005.Distinct and nonredundant in vivo functions of TNF produced by t cells and macro-phages/neutrophils: protective and deleterious effects. Immunity 22: 93–104.
61. Christen, U., T. Wolfe, U. Mohrle, A. C. Hughes, E. Rodrigo, E. A. Green,R. A. Flavell, and M. G. von Herrath. 2001. A dual role for TNF-alpha in type 1diabetes: islet-specific expression abrogates the ongoing autoimmune process wheninduced late but not early during pathogenesis. J. Immunol. 166: 7023–7032.
62. Kassiotis, G., and G. Kollias. 2001. Uncoupling the proinflammatory from theimmunosuppressive properties of tumor necrosis factor (TNF) at the p55 TNFreceptor level: implications for pathogenesis and therapy of autoimmune de-myelination. J. Exp. Med. 193: 427–434.
63. Mohan, N., E. T. Edwards, T. R. Cupps, P. J. Oliverio, G. Sandberg, H. Crayton,J. R. Richert, and J. N. Siegel. 2001. Demyelination occurring during anti-tumornecrosis factor alpha therapy for inflammatory arthritides. Arthritis Rheum. 44:2862–2869.
64. Plenge, R. M., and L. A. Criswell. 2008. Genetic variants that predict response toanti-tumor necrosis factor therapy in rheumatoid arthritis: current challenges andfuture directions. Curr. Opin. Rheumatol. 20: 145–152.
The Journal of Immunology 9
on June 7, 2010 w
ww
.jimm
unol.orgD
ownloaded from
Related Documents