TM #12 – Existing and Desired Travel Pattern March 2016

Welcome message from author
This document is posted to help you gain knowledge. Please leave a comment to let me know what you think about it! Share it to your friends and learn new things together.
Transcript

TM #12 – Existing and Desired Travel Pattern March 2016

Greater Minnesota Transit Investment Plan
TM#12: EXISTING AND DESIRED TRAVEL PATTERNS | FINAL
Community Design Group (CDG) and Nelson\Nygaard Consulting Associates, Inc. | i
Table of Contents
Page
Introduction ............................................................................................................................................................................1 Methodology and Survey Tools ........................................................................................................................................1 Transit Usage ........................................................................................................................................................................4 Demographics .......................................................................................................................................................................6 Existing and Desired Travel Patterns ............................................................................................................................ 14 Conclusion ........................................................................................................................................................................... 29

Greater Minnesota Transit Investment Plan
TM#12: EXISTING AND DESIRED TRAVEL PATTERNS | FINAL
Community Design Group and Nelson\Nygaard Consulting Associates, Inc. | 1
INTRODUCTION
An interactive online mapping tool was developed to better understand the travel patterns of
current transit users and non-transit users. Information collected through this tool can help
quantify the need for public transportation within and across communities. Analyzing
destinations and travel patterns helps transit agencies and communities identify where
additional or enhanced transit service is desired and where there is a need for further inquiry and
outreach on existing service.
METHODOLOGY AND SURVEY TOOLS
Wikimapping Tool
An interactive online mapping project was created using a Wikimapping platform to gather
transit user and non-transit user existing and desired destination locations. First-time
participants created a login by providing an email address and choosing a username.
Participants tagged their usual destinations on a Google map and could also provide the
destination type such as “work.” Each user’s data was tied to a unique identifier, allowing for
origin-destination analysis and for users to revisit and update the site multiple times without
needing to create a new account.
Instructions on how to interact with the tool were provided through a short tutorial video and
were also written at the top of the mapping page. Participants were asked a series of questions,
including their current level of transit usage, how frequently they travel, and the primary purpose
for traveling to each destination. There was no limit to the number of destinations each user was
able to contribute.
Destination Survey Tool
A simpler destination survey was also available for users uncomfortable with or unable to use the
Wikimapping tool. Similar questions were asked in the survey, including current transit use,
common destinations, and trip purpose. Rather than entering destinations on a map, participants
typed addresses and descriptions of destinations. These destinations were later geocoded and
combined with the destination information received through the Wikimapping tool to
comprehensively map and analyze travel patterns.
Distribution of Tools
The Wikimapping and destination survey tool were available from mid-December 2015 to the end
of February 2016. Both were accessible through the “Get Involved” page of the project website
(Click here to visit the GMTIP Project Website) and were shared in several email blasts to various
stakeholders. Links to the surveys were posted on MnDOT social media pages weekly throughout
the open survey period.

Greater Minnesota Transit Investment Plan
TM#12: EXISTING AND DESIRED TRAVEL PATTERNS | FINAL
Community Design Group and Nelson\Nygaard Consulting Associates, Inc. | 2
Figure 1 Wikimapping Tool
Total respondents and destinations
Destination responses were received from every MnDOT District and several outlying states. In
total, the Wikimap and destination survey yielded 1,481 responses from 341 unique users. Of the
341 unique users, 153 used Wikimaps to enter destinations (45% of users) and 188 used the
destination survey to enter destinations (55% of users). However, Wikimap users entered an
average of 7 destinations per user, while destination survey users entered an average of 2
destinations per user.
Wikimap users entered a total of 1,090 destinations (74% of destinations), while destination
survey users entered 391 destinations (26% of destinations).
Figure 2 depicts the distribution of destinations received from Minnesota. Participants indicated
the primary purpose for travel to each destination received through the Wikimap and destination
survey. Destinations were classified by travel purpose, and were grouped as either Home
locations or Destination locations. To analyze origin-destination travel patterns, Home locations
were assumed to be the origin of each participant’s trip and non-home locations were assumed to
be the destination for each trip. Figure 2 shows all participant home and non-home destinations.

Greater Minnesota Transit Investment Plan
TM#12: EXISTING AND DESIRED TRAVEL PATTERNS | FINAL
Community Design Group and Nelson\Nygaard Consulting Associates, Inc. | 3
Figure 2 Minnesota Destinations Received (Wikimapping and Destination survey)
Figure 3 shows the distribution of destinations within each MnDOT District.

Greater Minnesota Transit Investment Plan
TM#12: EXISTING AND DESIRED TRAVEL PATTERNS | FINAL
Community Design Group and Nelson\Nygaard Consulting Associates, Inc. | 4
Figure 3 Respondent Destinations by MnDOT District
District Number
Name
Number of Destinations
Percent of Total
1 Duluth 122 8%
2 Bemidji 57 4%
3 Brainerd 185 12%
4 Detroit Lakes 72 5%
6 Rochester 176 12%
7 Mankato 211 14%
8 Willmar 123 8%
- Outside of MN 49 3%
Metro Metro 486 33%
Total - 1481
Metro and Out of State Destinations
Generally, destinations from other states and the Twin Cities region are outside the scope of the
Greater Minnesota Transit Investment Plan (GMTIP) and were removed from demographic and
destination analysis. Several rural communities, however, are located within the Metro District
but are eligible to receive funding from MnDOT for transit services and are therefore within the
scope of the GMTIP. Trips that either started or ended in the Metro District but had either an
origin or destination within a rural area were included in analysis. Of the 1,481 destinations, 993
(66% of responses) were either located outside of the Metro District or were associated with a trip
that began or ended in a non-metro area.
Of the 341 unique participants, 252 provided destinations within the area included in the project
scope (73%).
TRANSIT USAGE
Participants were asked to describe their current transit usage, as shown in Figure 4. The majority
of respondents described themselves as non-transit users (76%).

Greater Minnesota Transit Investment Plan
TM#12: EXISTING AND DESIRED TRAVEL PATTERNS | FINAL
Community Design Group and Nelson\Nygaard Consulting Associates, Inc. | 5
Figure 4 Transit Usage Responses
Daily (5-7 days per week)
7%
Often (2-4 days per week)
3%
Regularly (a few times per month)
5%
Sometimes (less than once per
month) 9%
No, I do not currently ride
transit 76%
Trip Purpose
Wikimap and destination survey participants were asked to describe their primary purpose for
traveling to each identified destination. As shown in Figure 5, the most common responses were
home (41% of destinations) and work (37% of destinations). There was not a significant difference
in trip purpose between transit users and non-transit users.

Greater Minnesota Transit Investment Plan
TM#12: EXISTING AND DESIRED TRAVEL PATTERNS | FINAL
Community Design Group and Nelson\Nygaard Consulting Associates, Inc. | 6
Figure 5 Primary Trip Purpose: All Respondents
DEMOGRAPHICS
Participants who responded to the destination survey (55% of respondents) were asked a series of
demographic questions. Wikimap users (45% of respondents) are not included in this sample, as
the format of the mapping program was not able to accommodate a long series of questions.
Income
Respondents who are transit riders are more likely to have lower incomes, with 29% of respondents earning less than $39,999 per year (see Figure 6), as compared with the 14% of non-transit riders who fall within the same income bracket (see Figure 7). There is also a higher percentage of high earners ($100,000+ annually) among transit riders compared with 17% of non-transit riders. Many respondents chose the “Prefer not to answer” option (15% of transit users and 4% of non-transit users). Though every question in the survey was optional, providing a “Prefer not to answer” for questions that may be perceived as potentially intrusive or sensitive can help users feel more comfortable while providing personal information.

Greater Minnesota Transit Investment Plan
TM#12: EXISTING AND DESIRED TRAVEL PATTERNS | FINAL
Community Design Group and Nelson\Nygaard Consulting Associates, Inc. | 7
Figure 6 Income: Transit Users
Figure 7 Income: Non-Transit Users

Greater Minnesota Transit Investment Plan
TM#12: EXISTING AND DESIRED TRAVEL PATTERNS | FINAL
Community Design Group and Nelson\Nygaard Consulting Associates, Inc. | 8
Automobiles per Household
The number of vehicles per household, including motorcycles, was one of the largest single
determinants of whether a participant was a transit user. Whereas 19% of transit users had no
vehicles in their household (see Figure 8), only 1% of non-transit users had no vehicles (see Figure
9). Whereas only 44% of transit users had 2 or more vehicles available for their household, 78% of
non-transit users had two or more vehicles in their household.
Figure 8 Automobiles per Household: Transit Users
4+ 7%
3
15%
2 22%
0 19%
1
37%
Figure 9 Automobiles per Household: Non-Transit Users
4+ 0
14% 1%
1 21%
3
25%
2 39%

Greater Minnesota Transit Investment Plan
TM#12: EXISTING AND DESIRED TRAVEL PATTERNS | FINAL
Community Design Group and Nelson\Nygaard Consulting Associates, Inc. | 9
Household Size
Transit users are slightly more likely to have larger households, with 54% of respondents living in
households of more than 3-4 people, compared to 38% of non-transit users (see Figure 10 and
Figure 11). Living in larger households with fewer vehicles per household member may be a
contributing factor in whether households use transit for daily transportation needs.
Figure 10 Household Size: Transit Users
7+ (5-6) 4% 11%
(1-2) 46%
(3-4) 39%
Figure 11 Household Size: Non-Transit Users
(5-6) 7+ 8% 0%
(3-4) 30%
(1-2) 62%

Greater Minnesota Transit Investment Plan
TM#12: EXISTING AND DESIRED TRAVEL PATTERNS | FINAL
Community Design Group and Nelson\Nygaard Consulting Associates, Inc. | 10
Employment
Transit users are slightly less likely to be employed full-time than non-transit users and are more
likely to be employed part-time (see Figure 12 and Figure 13). The number of transit users
employed part-time may indicate the need for transit service to be available during non-
traditional work hours.
Figure 12 Employment: Transit Users
Unemployed Retired 4%
4%
Employed part- time 22%
Employed full- time 70%
Figure 13 Employment: Non-Transit Users
Unemployed Retired 3%
9%
Employed part-
time 10%
Employed full- time 78%

Greater Minnesota Transit Investment Plan
TM#12: EXISTING AND DESIRED TRAVEL PATTERNS | FINAL
Community Design Group and Nelson\Nygaard Consulting Associates, Inc. | 11
Disability
Figure 14 and Figure 15 show the percentage of respondents who describe themselves as having a
disability. Transit users are more likely to identify as having a disability (25%) as compared to
non-transit users (10%).
Figure 14 Persons with a Disability: Transit Users
Yes 25%
No 75%
Figure 15 Persons with Disability: Non-Transit Users
Yes 10%
No 90%

Greater Minnesota Transit Investment Plan
TM#12: EXISTING AND DESIRED TRAVEL PATTERNS | FINAL
Community Design Group and Nelson\Nygaard Consulting Associates, Inc. | 12
Household Member Age: Over 65
Figure 16 and Figure 17 show that transit users are slightly less likely to have household members
that are over age 65 (13%) as compared with non-transit users (16%). Households with more than
two members over 65 are more likely to be transit users (10% of households) than households
with only one or two members over age 65 (0% of households).
Figure 16 Household Members Over Age 65: Transit Users
(7+)
(1-2)
3%
(3-6) 3% 7%
None 87%
Figure 17 Household Members Over Age 65: Non-Transit Users
(1-2) 16%
None 84%

Greater Minnesota Transit Investment Plan
TM#12: EXISTING AND DESIRED TRAVEL PATTERNS | FINAL
Community Design Group and Nelson\Nygaard Consulting Associates, Inc. | 13
Gender
Female respondents were less likely to be transit riders than male respondents (see Figure 18 and
Figure 19). Only 16% of female respondents were transit users, whereas 34% of male-identified
respondents were transit users. Overall for the destination survey, respondents were more likely
to be female than male (see Figure 20).
Figure 18 Female Transit and Non-Transit Users
Transit User 16%
Non-Transit
User 84%
Figure 19 Male Transit and Non-Transit Users
Transit User
34%
Non-transit user 66%

Greater Minnesota Transit Investment Plan
TM#12: EXISTING AND DESIRED TRAVEL PATTERNS | FINAL
Community Design Group and Nelson\Nygaard Consulting Associates, Inc. | 14
Figure 20 Gender: All Respondents
Prefer not to answer
2%
Male 31%
Other 1%
Female 66%
EXISTING AND DESIRED TRAVEL PATTERNS
Destinations associated with home addresses were analyzed as origin-destination pairs to identify
existing and desired travel patterns. Of the 993 destinations received that fall within the spatial
scope of the project, 100 home addresses could be assigned to a specific geographic location to
create 567 destination pairs. The majority of these participants identified as non-transit users
(72%).
Travel Patterns by Destination
Figure 21 provides an overview of existing and desired travel patterns throughout Minnesota.
Each line of arrows represents a single trip. Orange lines represent non-transit users, while blue
lines designate the trip patterns of transit users.

Greater Minnesota Transit Investment Plan
TM#12: EXISTING AND DESIRED TRAVEL PATTERNS | FINAL
Community Design Group and Nelson\Nygaard Consulting Associates, Inc. | 15
Figure 21 Existing and Desired Travel Patterns

Greater Minnesota Transit Investment Plan
TM#12: EXISTING AND DESIRED TRAVEL PATTERNS | FINAL
Community Design Group and Nelson\Nygaard Consulting Associates, Inc. | 16
Figure 22 shows the number of origin-destination pairs per District. While the majority of trips
(73%) are made within Districts (highlighted in blue) there are many travel patterns between
Districts, especially the metro area.
Figure 22 Origin–Destination Trips by District
DISTRICT Desti-nation
Home
1
2
3
4
METRO
6
7
8
Non- MN
Total
1 56 2 4 62
2 2 14 1 9 1 13 40
3 1 39 2 12 54
4 1 10 1 1 7 1 21
METRO 4 7 46 3 1 3 64
6 5 93 6 104
7 13 1 96 1 111
8 2 3 9 2 8 64 3 91
Out of State 14 2 3 1 - 20
Total 79 14 54 13 98 101 106 71 31 567
Percent of Total 14% 2% 10% 2% 17% 18% 19% 13% 5% 100%
Existing and Desired Travel Patterns by District
An overview of key themes for each District’s origin-destination travel patterns is provided below
that show travel patterns within and across Districts at a higher level of detail. Districts 2 and 4
had similar regional travel patterns and were grouped together. District descriptions are included
below each District Travel Pattern map.

Greater Minnesota Transit Investment Plan
TM#12: EXISTING AND DESIRED TRAVEL PATTERNS | FINAL
Community Design Group and Nelson\Nygaard Consulting Associates, Inc. | 17
Figure 23 District 1
District 1
District 1 had several long distance destinations, with 4 outside of the state, many along the shore
of Lake Superior, and several to the Twin Cities metro area. Intra-district trips were most
concentrated in the Duluth area. Within Duluth, there were a higher proportion of transit-user
respondents than the rest of the District. One non-transit user in the Virginia/Chisholm area
entered 24 unique destinations, accounting for nearly 38% of the origin-destination pairs in
District 1.Travel patterns for District 1 are illustrated in Figure 23.

Greater Minnesota Transit Investment Plan
TM#12: EXISTING AND DESIRED TRAVEL PATTERNS | FINAL
Community Design Group and Nelson\Nygaard Consulting Associates, Inc. | 18
Figure 24 District 2 and 4
District 2 and 4
District 2 and 4 had the lowest levels of participation, with a combined 61 origin-destination pairs
(less than 11% of total origin-destination pairs). Many of these trips covered long distances, with
one non-transit user in Roseau entering 26 destinations, many of which are in the Twin Cities
metro area. The southern portion of the Detroit Lakes District contained a few trips to nearby
areas in District 3 and 8. Travel patterns for District 2 and 4 are illustrated in Figure 24.

Greater Minnesota Transit Investment Plan
TM#12: EXISTING AND DESIRED TRAVEL PATTERNS | FINAL
Community Design Group and Nelson\Nygaard Consulting Associates, Inc. | 19
Figure 25 District 3
District 3
Like most Districts, District 3 had more intra-District trips (72%) than inter-District trips (28%).
Most of this District’s trips are concentrated in the southern portion of the District, nearest the
Twin Cities metro area. District 3 had the second most trips crossing into the Twin Cities metro
area (12). Non-transit users in Sartell and Zimmerman and transit-users in Elk River and east of
Becker contributed the majority of the responses in District 3. Travel patterns for District 3 are
illustrated in Figure 25.

Greater Minnesota Transit Investment Plan
TM#12: EXISTING AND DESIRED TRAVEL PATTERNS | FINAL
Community Design Group and Nelson\Nygaard Consulting Associates, Inc. | 20
Figure 26 District 6
District 6
District 6 had a high number of intra-District trips (89%) with the majority of travel within
Winona and Rochester. Other travel patterns included travel to the metro area and west along
the southern border of the District. Travel patterns for District 6 are illustrated in Figure 26.

Greater Minnesota Transit Investment Plan
TM#12: EXISTING AND DESIRED TRAVEL PATTERNS | FINAL
Community Design Group and Nelson\Nygaard Consulting Associates, Inc. | 21
Figure 27 District 7
District 7
Districts 7 had the most intra- and inter-District trips. Many of the short distance trips were
within and near Mankato and the Le Sueur area. District 7 respondents most often traveled
northeast toward the Twin Cities metro area, or to the east or west throughout southern
Minnesota. Travel patterns for District 7 are illustrated in Figure 27.

Greater Minnesota Transit Investment Plan
TM#12: EXISTING AND DESIRED TRAVEL PATTERNS | FINAL
Community Design Group and Nelson\Nygaard Consulting Associates, Inc. | 22
Figure 28 District 8
District 8
Districts 8 participants traveled within the District, to six (6) different Districts, and several traveled to
destinations out of state to the southwest. The majority of respondents in District 8 traveled
northeast, toward the Twin Cities metro area with several traveling further to District 1 and 3.
Respondents also traveled east to District 6 and southeast to District 7. Travel patterns for District
8 are illustrated in Figure 28.

Greater Minnesota Transit Investment Plan
TM#12: EXISTING AND DESIRED TRAVEL PATTERNS | FINAL
Community Design Group and Nelson\Nygaard Consulting Associates, Inc. | 23
Travel Patterns by County
Similar patterns can be seen when summarizing origin-destination pairs by county. Figure 29
shows travel patterns across counties (shown as lines) and travel patterns within counties (shown
by color and texture). Thin lines indicate a single trip pair, while thicker lines indicate multiple
origin-destination pairs between counties. Travel patterns within counties are shown by color
and texture. Counties that are shown in darker shades indicate a greater numbers of intra-
county trips. Areas without texture indicate counties that had no intra-county trips identified in
the Wikimapping or destination survey exercise. Overall, there are 35 counties with trips within
the counties and 135 unique travel patterns between counties.

Greater Minnesota Transit Investment Plan
TM#12: EXISTING AND DESIRED TRAVEL PATTERNS | FINAL
Community Design Group and Nelson\Nygaard Consulting Associates, Inc. | 24
Figure 29 Travel Patterns Summarized by County

Greater Minnesota Transit Investment Plan
TM#12: EXISTING AND DESIRED TRAVEL PATTERNS | FINAL
Community Design Group and Nelson\Nygaard Consulting Associates, Inc. | 25
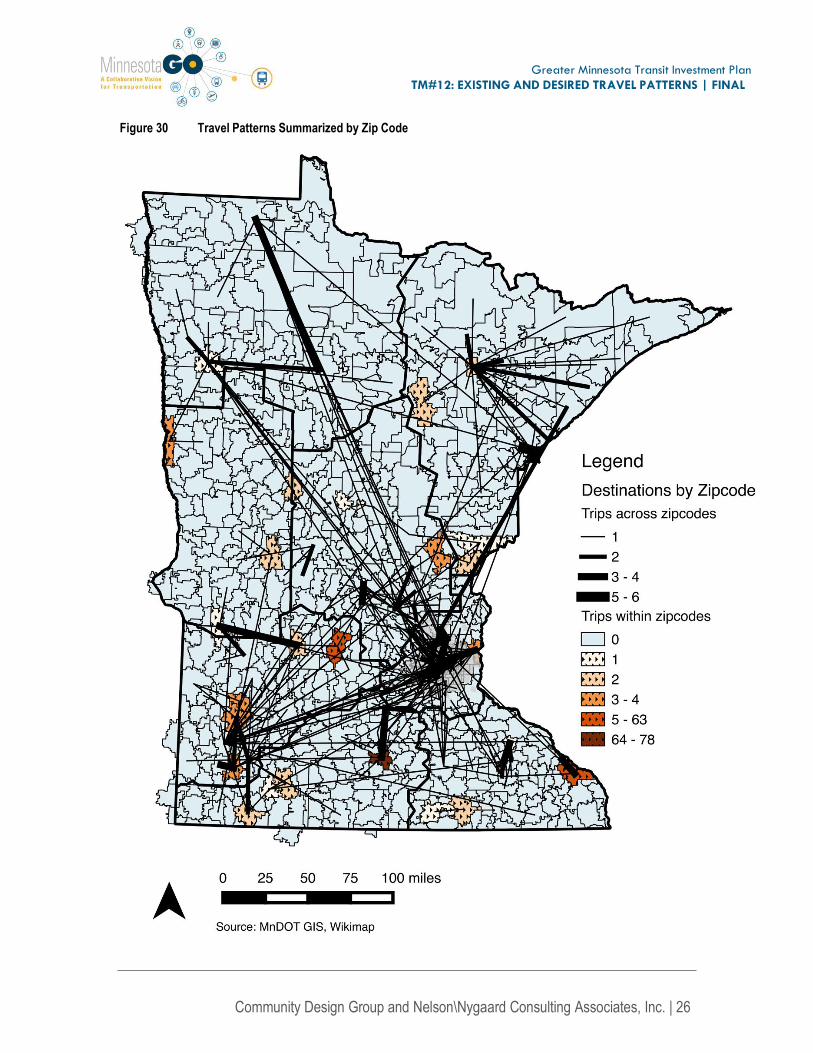
Travel Patterns by Zip code
Figure 30 shows travel patterns within zip codes and between zip codes. Travel within zip codes is
shown through color and texture, with the darker colors indicating a larger number of trips
within the zip code. Trips across zip codes are shown in lines indicating the total summed
number of trips from the same home zip code to the same destination zip code. Thin lines
indicate a single trip, whereas thicker lines represent greater combined numbers of trips
identified by participants.
Greater Minnesota Transit Investment Plan
TM#12: EXISTING AND DESIRED TRAVEL PATTERNS | FINAL
Community Design Group and Nelson\Nygaard Consulting Associates, Inc. | 26
Figure 30 Travel Patterns Summarized by Zip Code

Greater Minnesota Transit Investment Plan
TM#12: EXISTING AND DESIRED TRAVEL PATTERNS | FINAL
Community Design Group and Nelson\Nygaard Consulting Associates, Inc. | 27
Mil
es
City-to-City Travel Patterns
As shown in Figure 31, respondents in District 1 and 2 were more likely on average to travel long
distances to reach city destinations, 137 and 148 miles, respectively. Non-transit users were more
likely to identify destinations that were on average 14 miles farther than transit-user destinations
(see Figure 32).
Figure 33 shows travel patterns between cities in Greater Minnesota. Of the 567 total trips, 235
were between cities, with a large proportion of these entering the metro area. The remaining 332
trips either began, ended, or did not have their origin or destination with a municipal boundary.
Figure 31 City-to-City Travel Patterns: Average Miles per Origin Destination Pair
District Average Miles per Origin-Destination Pair
1 137
2 148
3 28
4 46
METRO 18
6 17
7 28
8 27
Total Average 56
Figure 32 Average Miles per Origin Destination: Transit User vs. Non-Transit User
50
40
30
20
10
0
Transit User Non-Transit User
Average Miles per Trip

Greater Minnesota Transit Investment Plan
TM#12: EXISTING AND DESIRED TRAVEL PATTERNS | FINAL
Community Design Group and Nelson\Nygaard Consulting Associates, Inc. | 28
Figure 33 City-to-City Travel Patterns
Greater Minnesota Transit Investment Plan
TM#12: EXISTING AND DESIRED TRAVEL PATTERNS | FINAL
Community Design Group and Nelson\Nygaard Consulting Associates, Inc. | 29
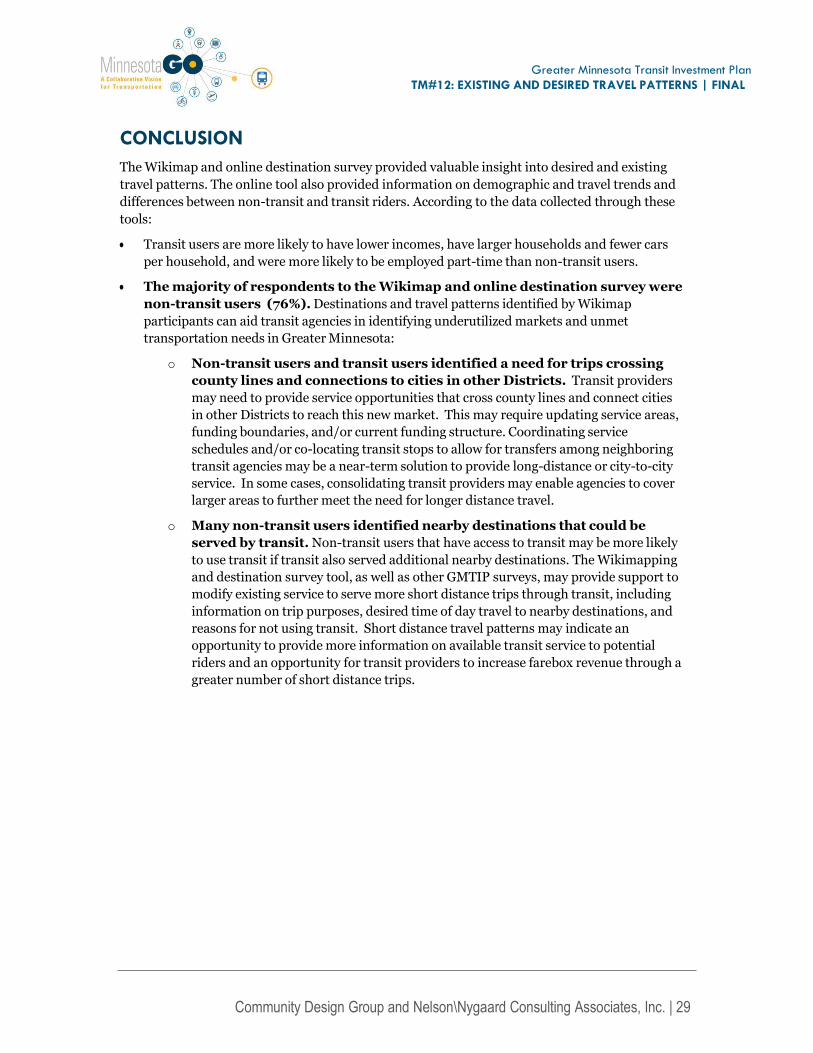
CONCLUSION
The Wikimap and online destination survey provided valuable insight into desired and existing
travel patterns. The online tool also provided information on demographic and travel trends and
differences between non-transit and transit riders. According to the data collected through these
tools:
Transit users are more likely to have lower incomes, have larger households and fewer cars
per household, and were more likely to be employed part-time than non-transit users.
The majority of respondents to the Wikimap and online destination survey were
non-transit users (76%). Destinations and travel patterns identified by Wikimap
participants can aid transit agencies in identifying underutilized markets and unmet
transportation needs in Greater Minnesota:
o Non-transit users and transit users identified a need for trips crossing
county lines and connections to cities in other Districts. Transit providers
may need to provide service opportunities that cross county lines and connect cities
in other Districts to reach this new market. This may require updating service areas,
funding boundaries, and/or current funding structure. Coordinating service
schedules and/or co-locating transit stops to allow for transfers among neighboring
transit agencies may be a near-term solution to provide long-distance or city-to-city
service. In some cases, consolidating transit providers may enable agencies to cover
larger areas to further meet the need for longer distance travel.
o Many non-transit users identified nearby destinations that could be
served by transit. Non-transit users that have access to transit may be more likely
to use transit if transit also served additional nearby destinations. The Wikimapping
and destination survey tool, as well as other GMTIP surveys, may provide support to
modify existing service to serve more short distance trips through transit, including
information on trip purposes, desired time of day travel to nearby destinations, and
reasons for not using transit. Short distance travel patterns may indicate an
opportunity to provide more information on available transit service to potential
riders and an opportunity for transit providers to increase farebox revenue through a
greater number of short distance trips.
Related Documents