ANNUAL REPORT TK DEVELOPMENT A/S | CVR N0. 24256782 PHOTO: SILLEBROEN, SHOPPING CENTRE Frederikssund, Denmark 2012/13

TK_Development_2012_13_Annual_Report
Mar 31, 2016
http://tk-development.com/Files/Billeder/Issuu/Annual%20reports/TK_Development_2012_13_Annual_Report.pdf
Welcome message from author
This document is posted to help you gain knowledge. Please leave a comment to let me know what you think about it! Share it to your friends and learn new things together.
Transcript

| A n n uA l r e p o rt 2 0 1 2 / 1 3 | t k D e v e lo pm e n t A / S | 1 / 1 2 7
A N N U A L R E P O R T
TK DEvELOPmENT A/S | CvR N0. 24256782
pHoto:SILLEBROEN, ShOPPINg CENTREFrederikssund, Denmark
2012/13

2 / 1 2 7 | t k D e v e lo pm e n t A / S | A n n uA l r e p o rt 2 0 1 2 / 1 3 | Ta b l e o f co n T e n Ts
TA B L E O f C O N T E N T S
Page
3 Summary
6 Consolidated financial highlights and key ratios
7 Adjusted strategy and market focus
9 Results for 2012/13 and outlook for 2013/14
19 Market conditions
22 Business concept and knowledge resources
26 Property development
31 Asset management
37 Discontinuing activities
38 Financial targets
39 Risk issues
45 Shareholders
49 Corporate governance
52 Statutory annual corporate social responsibility statement
53 The Supervisory Board
57 The Executive Board
58 Statement by the Supervisory and Executive Boards on the Annual Report
59 Independent auditor’s report
60 Consolidated financial statements
108 Parent company financial statements
127 Company information

s u m m a ry | A n n uA l r e p o rt 2 0 1 2 / 1 3 | t k D e v e lo pm e n t A / S | 3 / 1 2 7
S U m m A R y
r e s u lT s fo r 2 0 1 2 / 1 3
tk Development recorded results of Dkk -326.0 million be-
fore tax for the 2012/13 financial year, compared to Dkk
14.3 million for the year before. results were negatively af-
fected by value adjustments of investment properties and
the impairment of projects, totalling Dkk 341.3 million. this
performance reflects the recent results estimate of about
Dkk -300 million.
the impairment itself does not impact the cash flow posi-
tion.
excluding value adjustments/impairment, the results before
tax amount to Dkk -0.3 million. Based exclusively on the ac-
tivities targeted by the Group’s future strategy and market
focus, the results before tax and value adjustments/impair-
ment amount to Dkk 9.2 million.
In the 2012/13 financial year, deferred tax assets were writ-
ten down by an amount of Dkk 200.5 million, a substantial
portion of which is attributable to the Group’s Danish tax
asset. In June 2012, a Bill proposing changes to the rules
for tax loss carryforwards was passed. For tk Development,
this has considerably lengthened the time horizon for utiliz-
ing tax losses, and thus significantly increased the uncer-
tainty relating to utilization of the tax asset. on the basis of
the changed rules, tk Development identified a need to im-
pair the Group’s Danish tax asset by Dkk 150.0 million, which
was already recognized in Q1 2012/13 and thus forms part
of the total writedown for impairment.
the results after tax amounted to Dkk -493.3 million,
against Dkk 27.0 million in 2011/12.
Consolidated equity totalled Dkk 1,389.7 million at 31 Janu-
ary 2013, corresponding to a solvency ratio of 34.7 %.
management considers the results for the year to be highly
unsatisfactory.
r e v i e w o f s a l e s s T r aT egy
In December 2012, management decided to review the
Group’s sales strategy. tk Development had long expe-
rienced an unsatisfactory market response to its efforts
to sell completed projects and investment properties due
to sluggish demand. the lack of completed project sales
means a substantial portion of the Group’s financial re-
sources is tied up in completed projects. this in turn causes
difficulties in allocating the capital necessary for securing
progress in new projects to be executed on the land in the
Group’s portfolio. In order to harness the long-term, sub-
stantial development potential believed by management to
be inherent in several of the Group’s projects, it was decided
to revise the sales strategy with a view to realizing faster
sales. the changed sales strategy consists of the following
elements:
• Completing the sale of selected, completed projects
and investment properties, even at reduced prices.
• Downsizing the portfolio of land by selling selected
plots that are not essential to tk Development’s future
strategy.
• making several writedowns for impairment of the
Group’s projects, distributed as shown below, which led
to substantially negative results in the 2012/13 finan-
cial year.
• Freeing up cash resources through sales, enabling the
Group to strengthen its financial platform.
• procuring financial resources through sales to regene-
rate momentum and to realize the substantial develop-
ment potential inherent in several of the Group’s pro-
jects.
the changed sales strategy involves writedowns for the im-
pairment of projects, investment properties and the portfo-
lio of land totalling Dkk 341.3 million, distributed among the
following main groups:
• Impairment of the project portfolio as a consequence
of the decision to realize project sales as described
above, a total of Dkk 123.0 million.
• Impairment of the project portfolio, including the deci-
sion to sell land, due in part to the difficult market con-
ditions in the residential segment in poland, a total of
Dkk 151.3 million.
• other impairment based on market conditions and a
longer time horizon for developing and maturing indi-
vidual projects than previously anticipated, a total of
Dkk 67.0 million.

4 / 1 2 7 | t k D e v e lo pm e n t A / S | A n n uA l r e p o rt 2 0 1 2 / 1 3 | s u m m a ry
S U m m A R y
regardless of the difficult market conditions, management
finds it highly unsatisfactory having to make the writedowns
for impairment described above.
a dj u s T e d s T r aT egy a n d m a r k e T fo c u s
Concurrently with the decision to change the sales strategy,
management initiated a review of the Group’s business are-
as for the purpose of assessing its future market platform,
including the countries in which the Group will continue to
operate, and the possibility of trimming costs further.
As described in company announcement no. 6/2013 of 11
march 2013, management has now completed this review
and adopted a changed strategy consisting of the following
elements:
• In addition to its primary business area, property Devel-
opment, tk Development will have a secondary busi-
ness area, Asset management, to consist of owning,
operating, running in, maturing and optimizing complet-
ed projects for a medium-long operating period. Asset
management will be performed on tk Development’s
own books or for third parties.
• tk Development has chosen a market focus that tar-
gets the countries expected to contribute with long-
term, profitable operations in future: Denmark, Sweden,
poland and the Czech republic.
• tk Development will phase out its activities in Finland,
Germany, the Baltic States and russia.
• the Group’s portfolio of projects not initiated (plots of
land) will be reduced over a two-year period to about
Dkk 0.5 billion.
• over a two-year period, the balance sheet will be ad-
justed so as to ensure a solvency ratio of about 40 %.
• overheads will be reduced by around 20 %, with half of
the reduction deriving from the discontinuation of ac-
tivities in several countries.
• Internal and external reporting will be changed to cre-
ate a better overview and highlight values and value
generation in the Group’s business areas.
It is management’s belief that once implemented, these
measures will enable the Group to generate satisfactory re-
turns for its shareholders in future.
P r o P e rT y d e v e lo Pm e n T
In the Swedish town of Gävle, tk Development has devel-
oped a retail park of about 8,300 m². Construction of the
retail park was completed in october 2012. In november
2012, the retail park was handed over to the Swedish prop-
erty company nordika Fastigheter AB for a price of Sek 110
million.
In July 2012, tk Development entered into a conditional
agreement with Heitman regarding the sale of two polish
projects amounting to a total project value of eur 95 mil-
lion. the sale comprises a 70 % stake in the Group’s Galeria
tarnovia shopping centre in tarnów and a new development
project in Jelenia Góra. tk Development realized a minor
profit on the completion of this sale and freed up cash re-
sources. In addition, future profits will be generated in the
form of fee income from the jointly owned company estab-
lished for developing, letting and managing the construction
of the development project. this sale was completed at the
end of 2012. the Group’s ownership interests in the projects
have been reclassified as “Investment properties” and “In-
vestment properties under construction”, respectively.
the first phase of the Group’s project in Bielany, poland, has
been completed. the total project area comprises about
56,200 m², primarily housing consisting of 900-1,000 units,
with 136 being built in the first phase. the sluggishness of
the polish residential market has affected the sales process,
with sales agreements having been signed for about 69 % of
the units in the first phase.
the Group’s project portfolio in the property development
area comprised 452,000 m² at 31 January 2013 (31 January
2012: 635,000 m²).
a s s e T m a n a g e m e n T
the total portfolio of own properties under asset manage-
ment, which thus generates cash flow, comprised 138,250
m² and amounted to Dkk 1,932.1 million at 31 January 2013,
of which investment properties accounted for Dkk 312.1
million. the annual net rent from the current leases corre-
sponds to a return on the carrying amount of 6.7 %. Based
on full occupancy, the return on the carrying amount is ex-
pected to reach 7.9 %.
the operation of these properties is generally proceeding
satisfactorily, and overall the footfall and revenue in the
centres are developing positively.
m a r k e T c o n d i T i o n s
the main challenge currently facing the property sector is
the difficult access to financing. uncertainty on the inter-
s u m m a ry | A n n uA l r e p o rt 2 0 1 2 / 1 3 | t k D e v e lo pm e n t A / S | 5 / 1 2 7
national financial markets continues to adversely affect the
property sector, leading to consistently long decision-mak-
ing processes among financing sources, tenants and inves-
tors alike.
the Group will make the startup of major new projects con-
tingent on obtaining either full or partial financing for them
and on freeing up cash resources from the sale of several
major completed projects.
f i n a n c i a l i s s u e s
At the forthcoming Annual General meeting, the Supervi-
sory Board will request authorization to carry out a capital
increase with gross proceeds of about Dkk 210-231 million.
the capital increase will help generate the cash resources
required to underpin future operations and project flow, and
thus long-term earnings. the capital increase has been dis-
cussed with the Group’s major shareholders, who, together
with a few major private and institutional investors, have giv-
en conditional subscription and underwriting commitments
for the total capital increase.
the Group’s main banker has indicated its preparedness to
prolong tk Development’s credit facilities subject to specific
conditions being met, which includes reducing the operating
credit limit by Dkk 50 million. the prolongation is expected
to be formally accepted immediately after publication of tk
Development’s Annual report 2012/13.
of the total project credits outstanding at 31 January
2013, credits worth Dkk 1.5 billion are due to mature in the
2013/14 financial year, including continuing repayment ob-
ligations on individual project credits of about Dkk 80 mil-
lion. After the reporting date, agreements regarding the re-
financing of Dkk 0.2 billion have been made. moreover, the
Group’s main banker and other credit institutions have indi-
cated their preparedness to prolong existing credit facilities.
When final commitments in this respect have been received,
credit facilities of Dkk 1.1 billion will have been prolonged,
and credit facilities of Dkk 0.3 billion will be due to mature in
2013/14. the Group depends on being able to continue ob-
taining either a prolongation or alternative financing of the
project credits not expected to be repaid upon project sales.
the Group is in ongoing dialogue with the relevant credit in-
stitutions, and management anticipates being able to either
prolong or refinance these project credits. Some of the pro-
ceeds from the capital increase or the cash freed up on the
sale of major completed projects will help reduce the debt
to credit institutions, including project finance loans granted
by a number of the Company’s major shareholders and mem-
bers of management.
o u T lo o k fo r 2 0 1 3 / 1 4
management anticipates positive results before tax for the
continuing activities for the 2013/14 financial year. the
timing and progress of the phase-out of the discontinuing
activities are subject to major uncertainty, and the results
of these activities are therefore not included in the outlook
for next year.
As mentioned above, management has revised the sales
strategy for the Group’s projects and chosen to accept re-
duced prices for selected project sales. thus, management
considers it important for the Group to sell some of its com-
pleted projects and plots of land in the 2013/14 financial
year.
The expectations mentioned in this annual report, including
earnings expectations, are naturally subject to risks and uncer-
tainties, which may result in deviations from the expected re-
sults. various factors may impact on expectations, as outlined
in the section “Risk issues”, particularly the valuation of the
group’s project portfolio.
S U m m A R y

6 / 1 2 7 | t k D e v e lo pm e n t A / S | A n n uA l r e p o rt 2 0 1 2 / 1 3 | co n s o l i daT e d f i n a n c i a l h i g h l i g h Ts a n d k e y r aT i os
C O N S O L I D AT E D f I N A N C I A L h I g h L I g h T S A N D K E y R AT I O S
Dkkm 2008/09 2009/10 2010/11 2011/12 2012/13
f i n a n c i a l h i g h l i g h T s :
net revenue 1,073.2 1,384.9 602.4 359.8 632.3
value adjustment of investment properties, net 57.7 -10.9 30.0 36.7 -37.8
Gross profit/loss 375.0 200.5 256.0 195.8 -139.5
operating profit/loss (eBIt) 201.7 57.5 127.2 65.5 -241.1
Financing, etc. -33.4 -17.9 -53.2 -83.6 -87.4
Profit/loss before tax and writedowns, etc. 98,7 53,8 48,2 -1,2 -0,3
profit/loss before tax 168.0 39.4 74.2 14.3 -326.0
Profit/loss for the year 155.2 25.4 73.6 27.0 -493.3
Balance sheet total 3,816.1 4,377.3 4,622.0 4,639.5 4,009.3
property, plant and equipment 380.8 364.3 394.2 445.2 498.8
of which investment properties/investment properties under construction 366.5 355.1 387.4 440.5 496.3
total project portfolio 2,541.3 3,249.5 3,424.7 3,498.1 3,030.9
Contract work in progress 3.7 17.8 12.2 18.2 0.0
Equity 1,506.0 1,593.4 1,866.0 1,876.4 1,389.7
Cash flows from operating activities -331.7 -582.8 -182.7 -78.8 45.6
net interest-bearing debt, end of year 1,509.5 2,178.9 2,170.2 2,244.9 2,206.1
k e y r aT i o s :
return on equity (roe) 10.5 % 1.6 % 4.3 % 1.4 % -30.2 %
eBIt margin 18.8 % 4.2 % 21.1 % 18.2 % -38.1 %
Solvency ratio (based on equity) 39.5 % 36.4 % 40.4 % 40.4 % 34.7 %
equity value in Dkk per share 50.5 53.4 44.4 44.6 33.0
price/book value (p/Bv) 0.4 0.5 0.5 0.3 0.4
number of shares, end of year 28,043,810 28,043,810 42,065,715 42,065,715 45,065,715
Average numbers of shares, adjusted 28,043,810 28,043,810 35,095,222 42,065,715 45,065,715
earnings per share (epS) in Dkk 5.2 0.9 2.1 0.6 -11.7
Dividend in Dkk per share 0 0 0 0 0
listed price in Dkk per share 21 27 23 14 13
k e y r aT i o s a dj u s T e d fo r wa r r a n T s :
return on equity (roe) 10.5 % 1.6 % 4.3 % 1.4 % -30.2 %
Solvency ratio (based on equity) 39.5 % 36.4 % 40.4 % 40.4 % 34.7 %
equity value in Dkk per share 50.5 53.4 44.4 44.6 33.0
Diluted earnings per share (epS-D) in Dkk 5.2 0.9 2.1 0.6 -11.7
the calculation of key ratios was based on the 2010 guidelines issued by the Danish Society of Financial Analysts.
6 / 1 2 7 | t k D e v e lo pm e n t A / S | F I n A n C I A l StAt e m e n tS 2 0 1 2 / 1 3 | co n s o l i daT e d f i n a n c i a l h i g h l i g h Ts a n d k e y r aT i os

m a n ag e m e n T com m e n Ta ry | A n n uA l r e p o rt 2 0 1 2 / 1 3 | t k D e v e lo pm e n t A / S | 7 / 1 2 7
In connection with presenting its Interim report for Q1-Q3
2012/13 in December 2012, tk Development announced that
the Company’s management would initiate a review of the
Group’s business areas for the purpose of assessing its future
market platform, including the countries in which the Group will
continue to operate, and the possibility of trimming costs fur-
ther.
As described in company announcement no. 6/2013 of 11
march 2013, this review has now been completed, and at a
board meeting on 11 march 2013, i.e. after the reporting date,
the Supervisory Board adopted the revised strategy and busi-
ness model outlined below.
T h e g r o u P ’ s m i s s i o n w i l l b e T h e sa m e
a dj u s T e d s T r aT egy
In addition to its primary business area, property development,
the Group will have a constant portfolio of completed projects
that it will run in/mature to optimize the project value. At times,
this secondary business area may represent a vast balance
sheet total and significantly affect the Group’s results. the two
business areas comprise:
Property development
Developing projects from the conceptual phase through to pro-
ject completion, based on one of several models:
a) Sold projects
• Forward funding
• Forward purchase
b) projects with partners
c) on tk Development’s own books based on a high degree of
confidence in the letting and sales potential
d) Services for third parties.
asset management
owning, operating, maturing and optimizing completed projects
for a medium-long operating period whose length matches the
potential for generating sufficient added value. Asset manage-
ment will be performed on tk Development’s own books and
also for third parties.
i n i T i aT i v e s To r e s To r e a v i a b l e b u s i n e s s
m o d e l
In management’s opinion, attractive earnings can be generat-
ed by implementing development projects when taking into
account the new levels of determining variables in property
development: land prices, construction costs, occupancy level
and investors’ return requirements.
management is also of the opinion that asset management ac-
tivities can yield attractive earnings in future, with the matur-
ing of own projects playing a particularly vital role for obtaining
optimum selling prices.
However, the current challenging market conditions, combined
with the Group’s own circumstances, require calibrating a num-
ber of factors with a view to enhancing the Group’s ability to
create value and thus to restore a viable business model as well
as an attractive investment case for the Group’s shareholders.
management has decided to implement the following adapta-
tions:
1. Focusing on the countries that are expected to contribute
with long-term, profitable operations in future: Denmark,
Sweden, poland and the Czech republic.
2. phasing out the activities in Finland, Germany, the Baltic
States and russia. the phase-out with the resulting clo-
sure of offices and dismissal of employees will be carried
out as soon as possible, but while taking into account that
all the countries in question have projects that need to be
handled optimally so as to avoid an unnecessary erosion
of values.
3. reducing the portfolio of projects not initiated (plots of
land) over a two-year period from the current level of Dkk
1.1 billion to a level of Dkk 0.5 billion.
4. reducing overheads by about 20 %, with half of the re-
duction deriving from the discontinuation of activities in
Germany, the Baltic States and Finland.
the aim is to increase the solvency ratio to a level of about 40
%. As part of fulfilling this target, tk Development will strive
to secure cheaper financing for the Group. At the forthcoming
Annual General meeting, the Supervisory Board will request au-
thorization to carry out a capital increase with gross proceeds
of about Dkk 210-231 million.
The overall mission of TK Development is to create added value by developing real property. The group operates in the property development and services environments, and specializes in being the creative and result-oriented link between tenants and investors.
The group’s mission
A D j U S T E D S T R AT E g y A N D m A R K E T f O C U S

8 / 1 2 7 | t k D e v e lo pm e n t A / S | A n n uA l r e p o rt 2 0 1 2 / 1 3 | m a n ag e m e n T com m e n Ta ry
c h a n g e s To i n T e r n a l a n d e x T e r n a l
r e P o rT i n g
management has decided to change the Group’s internal and
external reporting to create a better overview and highlight val-
ues and value generation in the Group’s business areas.
the business segments will be structured as follows:
• property development activities
• Asset management activities
• Discontinuing activities.
the reporting will be based on property development and asset
management activities, which will be the two main future busi-
ness segments. the activities being phased out will be termed
discontinuing activities, and will be considered a separate seg-
ment for reporting purposes.
the management commentary in this annual report uses this
segmentation.
o r g a n i z aT i o n a l fo c u s o n s eg m e n T s a n d
r i s k s
to underpin the segmentation chosen, it has been decided to
organize the business activities so as to best ensure manage-
ment focus on both property development and asset manage-
ment activities.
the Group will strengthen its risk management by striving
only to initiate projects based on a strict awareness that the
expected earnings will match the project’s complexity, com-
pletion time, tied-up capital and other use of resources. the
portfolio composition and the size of individual projects relative
to the balance sheet total and the Company’s equity are other
significant elements in the Group’s risk management system.
The transformation process to implement the resolved initiatives is expected to take two years, after which the group is assumed to be in the following position:
• the remaining activities will be limited to Denmark, Sweden, poland and the Czech republic.
• the portfolio of projects not initiated (plots of land) will have been reduced from about Dkk 1.1 billion to about Dkk 500 million.
• the balance sheet will have been adjusted, with a solvency ratio of about 40 %.
• Financing costs will have been normalized as a re-sult of the initiatives implemented.
• A platform for normalized earnings will have been established.
• the changes to reporting will have provided a bet-ter overview of the Group’s activities, values, value creation and expected development.
where will the group be in two years?
A D j U S T E D S T R AT E g y A N D m A R K E T f O C U S
m a n ag e m e n T com m e n Ta ry | A n n uA l r e p o rt 2 0 1 2 / 1 3 | t k D e v e lo pm e n t A / S | 9 / 1 2 7
R E S U LT S f O R 2 0 1 2 / 1 3 A N D O U T L O O K f O R 2 0 1 3 / 1 4
tk Development recorded results of Dkk -326.0 million before
tax, which reflects the recent results estimate of about Dkk
-300 million before tax. results after tax amounted to Dkk
-493.3 million. In the 2011/12 financial year, tk Development
recorded a profit of Dkk 14.3 million before tax and Dkk 27.0
million after tax.
At the beginning of the financial year, tk Development anti-
cipated positive results before tax for 2012/13, and manage-
ment considers the realized results highly unsatisfactory.
results were negatively affected by value adjustments of in-
vestment properties and the impairment of projects, totalling
Dkk 341.3 million. the value adjustments and impairment loss-
es themselves do not impact the cash flow position.
excluding value adjustments/impairment, the results before
tax amount to Dkk -0.3 million. Based exclusively on the ac-
tivities targeted by the Group’s future strategy and market fo-
cus, the results before tax and value adjustments/impairment
amount to Dkk 9.2 million.
the balance sheet total amounted to Dkk 4,009.3 million at 31
January 2013 against Dkk 4,639.5 million at 31 January 2012.
Consolidated equity totalled Dkk 1,389.7 million, and the sol-
vency ratio stood at 34.7 %.
the results for 2012/13 and the balance sheet total at 31 Jan-
uary 2013 broken down by the new segments adopted by the
Supervisory Board appear from the tables below.
the results and balance sheet total for each segment, includ-
ing a more detailed account of the elements of the individual
business areas/segments, are described on pages 26-37.
the property Development segment is described on pages
26-30. the description includes information about the
development potential of tk Development’s project portfo-
lio, including an outline of the individual development pro-
jects.
the Asset management segment is described on pages
31-36. the description contains information about tk
Development’s own properties under asset management,
including an outline of the operation and customer influx for
the individual projects.
the Discontinuing activities are described on page 37,
which provide more details about tk Development’s prop-
erties and projects in the countries where management has
decided to phase out activities.
therefore, the financial review below contains a description of
the results and balance sheet total at group level only.
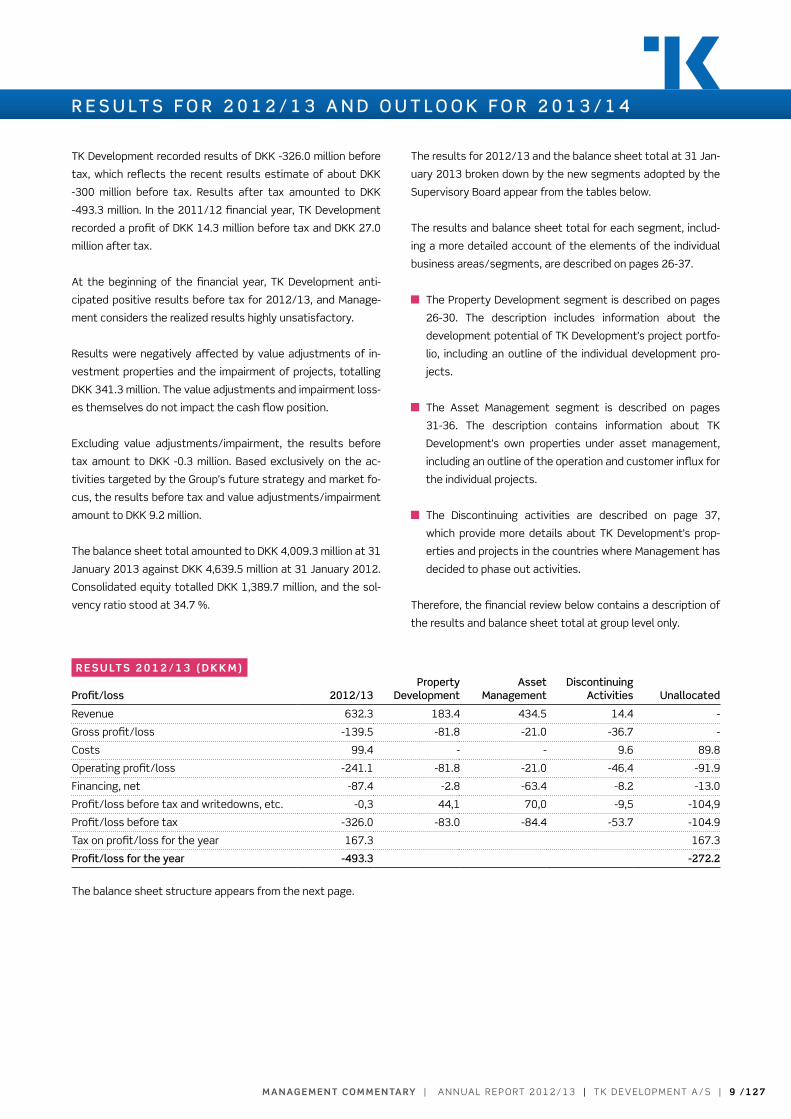
r e s u lT s 2 0 1 2 / 1 3 ( d k k m )
Profit/loss 2012/13Property
DevelopmentAsset
managementDiscontinuing
Activities Unallocated
revenue 632.3 183.4 434.5 14.4 -
Gross profit/loss -139.5 -81.8 -21.0 -36.7 -
Costs 99.4 - - 9.6 89.8
operating profit/loss -241.1 -81.8 -21.0 -46.4 -91.9
Financing, net -87.4 -2.8 -63.4 -8.2 -13.0
profit/loss before tax and writedowns, etc. -0,3 44,1 70,0 -9,5 -104,9
profit/loss before tax -326.0 -83.0 -84.4 -53.7 -104.9
tax on profit/loss for the year 167.3 167.3
Profit/loss for the year -493.3 -272.2
the balance sheet structure appears from the next page.
1 0 / 1 2 7 | t k D e v e lo pm e n t A / S | A n n uA l r e p o rt 2 0 1 2 / 1 3 | m a n ag e m e n T com m e n Ta ry
ac c o u n T i n g P o l i c i e s
the consolidated financial statements and parent financial
statements for 2012/13 for the Group and tk Development
A/S, respectively, are presented in compliance with the Interna-
tional Financial reporting Standards (IFrS), as adopted by the
eu, and in accordance with Danish disclosure requirements for
annual reports of listed companies.
the consolidated financial statements and parent financial
statements for 2012/13 have been presented in accordance
with the financial reporting standards (IFrS/IAS) and IFrIC inter-
pretations applicable for financial years beginning at 1 February
2012.
the implementation of amended financial reporting standards
and interpretations entering into force in 2012/13 has not im-
pacted recognition and measurement in the consolidated fi-
nancial statements and thus has no effect on the earnings per
share and the diluted earnings per share.
the accounting policies have been consistently applied com-
pared to the 2011/12 financial year.
the consolidated financial statements and parent financial
statements are presented in Dkk million, unless otherwise
stated. Dkk is the presentation currency for the Group’s activi-
ties and the functional currency of the parent Company.
i n c o m e s TaT e m e n T
revenue
the revenue for 2012/13 totalled Dkk 632.3 million against
Dkk 359.8 million in 2011/12.
the revenue stems from the sale of projects, rental and fee in-
come, etc.
overview of handed-over projects
Q1 2012/13
• Handover of a minor project in Aarhus, Denmark, which in-
cluded a supermarket for rema1000.
Q2 2012/13
• Handover of the final and second phase of a retail park in
kristianstad, Sweden. In addition to an existing building of
about 4,500 m², which was handed over to the investor
in April 2011, the total project comprises an extension of
about 1,700 m², sold to the same investor. the fully-let ex-
tension was completed and handed over to the investor
in may 2012.
• Completion of a 9,950 m² extension to the Futurum Hra-
dec králové shopping centre in the Czech republic, owned
R E S U LT S f O R 2 0 1 2 / 1 3 A N D O U T L O O K f O R 2 0 1 3 / 1 4
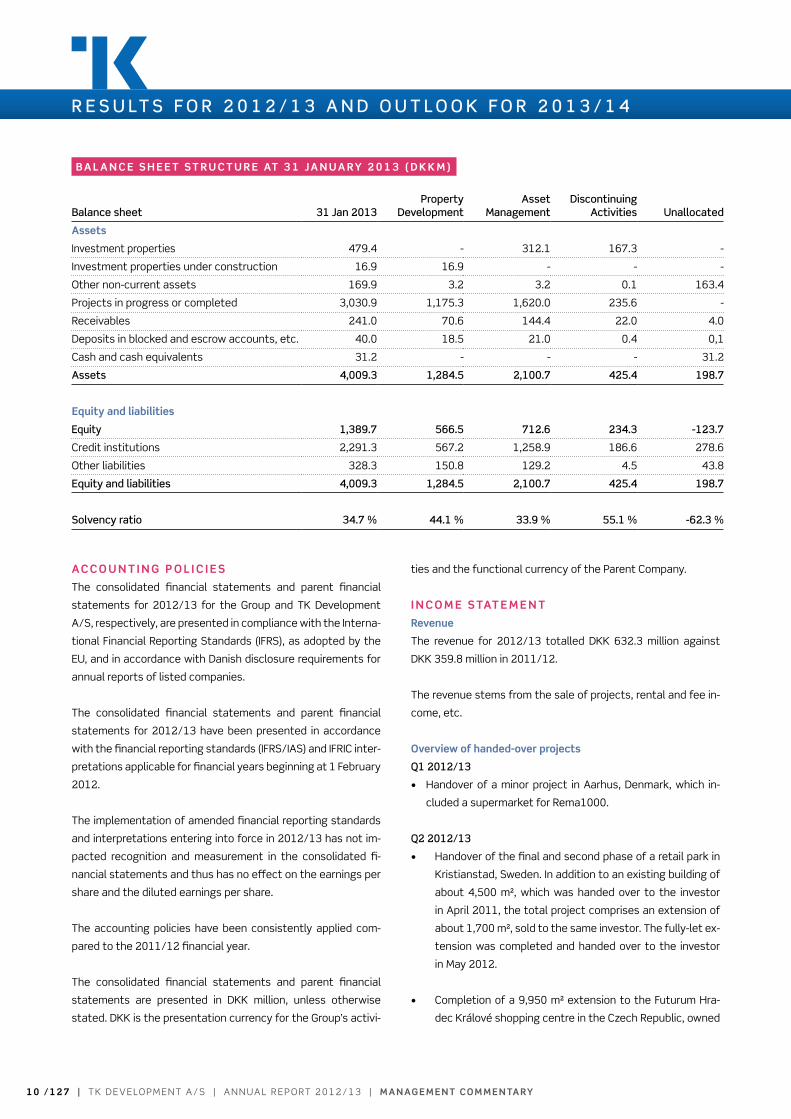
b a l a n c e s h e e T s T r u c T u r e aT 3 1 ja n u a ry 2 0 1 3 ( d k k m )
Balance sheet 31 jan 2013Property
DevelopmentAsset
managementDiscontinuing
Activities Unallocated
assets
Investment properties 479.4 - 312.1 167.3 -
Investment properties under construction 16.9 16.9 - - -
other non-current assets 169.9 3.2 3.2 0.1 163.4
projects in progress or completed 3,030.9 1,175.3 1,620.0 235.6 -
receivables 241.0 70.6 144.4 22.0 4.0
Deposits in blocked and escrow accounts, etc. 40.0 18.5 21.0 0.4 0,1
Cash and cash equivalents 31.2 - - - 31.2
Assets 4,009.3 1,284.5 2,100.7 425.4 198.7
equity and liabilities
Equity 1,389.7 566.5 712.6 234.3 -123.7
Credit institutions 2,291.3 567.2 1,258.9 186.6 278.6
other liabilities 328.3 150.8 129.2 4.5 43.8
Equity and liabilities 4,009.3 1,284.5 2,100.7 425.4 198.7
Solvency ratio 34.7 % 44.1 % 33.9 % 55.1 % -62.3 %

m a n ag e m e n T com m e n Ta ry | A n n uA l r e p o rt 2 0 1 2 / 1 3 | t k D e v e lo pm e n t A / S | 1 1 / 1 2 7
by a joint venture between Ge Capital, Heitman and tk De-
velopment in which tk Development has a 20 % ownership
interest. the newly built premises opened as scheduled on
10 may 2012. tk Development has received fees from the
jointly owned company for letting and construction man-
agement.
Q3 2012/13
• Completion and handover of a minor retail project in viborg,
Denmark, tenanted by Harald nyborg. the project has been
sold to private investors.
Q4 2012/13
• Sale and handover of an 8,300 m2 retail park in the Swed-
ish town of Gävle. Following completion of construction
in october 2012, the retail park was handed over in no-
vember 2012 to the Swedish property company nordika
Fastigheter AB for a price of Sek 110 million. the current
occupancy rate is 94 % (Q1-Q3 2012/13: 94 %), and lease
agreements have been concluded with rusta, Jysk, Sta-
dium outlet and Ö&B. moreover, tk Development has an
option to buy a plot of land for developing additional retail
park premises of about 15,800 m².
• Completion of conditional agreement with Heitman re-
garding the sale of two polish projects: the Group’s Galeria
tarnovia shopping centre in tarnów and a new develop-
ment project in Jelenia Góra. the agreement means that
Heitman has acquired a 70 % shareholding in the two pol-
ish projects. reference is made to the following page for a
further description of the agreement.
gross margin
the gross margin for the 2012/13 financial year amounted to
Dkk -139.5 million against Dkk 195.8 million in 2011/12. the
gross margin derives from the operation of the Group’s com-
pleted projects, the operation and value adjustment of the
Group’s investment properties, profits on handed-over projects
and impairment of the project portfolio.
the gross margin was negatively affected by value adjust-
ments of investment properties and writedowns for the impair-
ment of projects totalling Dkk 341.3 million, of which Dkk 16.6
million relates to Q4 2012/13.
At the end of December 2012, as announced in tk Develop-
ment’s Interim report for Q1-Q3 2012/13, management decid-
ed to revise the Group’s sales strategy with a view to realizing
faster sales. the Group had long experienced an unsatisfactory
market response to its efforts to sell completed projects and
investment properties due to sluggish demand.
the lack of completed project sales means a substantial por-
tion of the Group’s financial resources is tied up in completed
projects. this in turn causes difficulties in allocating the capital
necessary for securing progress in new projects to be execut-
ed on the land in the Group’s portfolio. In order to harness the
long-term, substantial development potential believed by man-
agement to be inherent in several of the Group’s projects, it was
decided in December 2012 to revise the sales strategy with a
view to realizing faster sales. the changed sales strategy con-
sists of the following elements:
Completing the sale of selected, completed projects and in-
vestment properties, even at reduced prices.
Downsizing the portfolio of land by selling selected plots
that are not essential to tk Development’s future strategy.
making several writedowns for impairment of the Group’s pro-
jects, distributed as shown below, which led to substantially
negative results in the 2012/13 financial year.
Freeing up cash resources through sales, enabling the Group
to strengthen its financial platform.
procuring financial resources through sales to regenerate
momentum and to realize the substantial development po-
tential inherent in several of the Group’s projects.
the changed sales strategy involves writedowns for the impair-
ment of projects, investment properties and plots of land to-
talling Dkk 341.3 million, distributed among the following main
groups:
Impairment of the project portfolio as a consequence of the
decision to realize project sales as described above, a total
of Dkk 123.0 million, of which Dkk 37.8 million is attributa-
ble to investment properties.
Impairment of the project portfolio, including the decision to
sell land, due in part to the difficult market conditions in the
residential segment in poland, a total of Dkk 151.3 million.
other impairment based on market conditions and a longer
time horizon for developing and maturing individual projects
than previously anticipated, a total of Dkk 67.0 million.
Impairment in Q4 2012/13 relates mainly to discontinuing activi-
ties, including the Group’s German investment properties.
Impairment of the project portfolio as a consequence of the deci-
R E S U LT S f O R 2 0 1 2 / 1 3 A N D O U T L O O K f O R 2 0 1 3 / 1 4
1 2 / 1 2 7 | t k D e v e lo pm e n t A / S | A n n uA l r e p o rt 2 0 1 2 / 1 3 | m a n ag e m e n T com m e n Ta ry
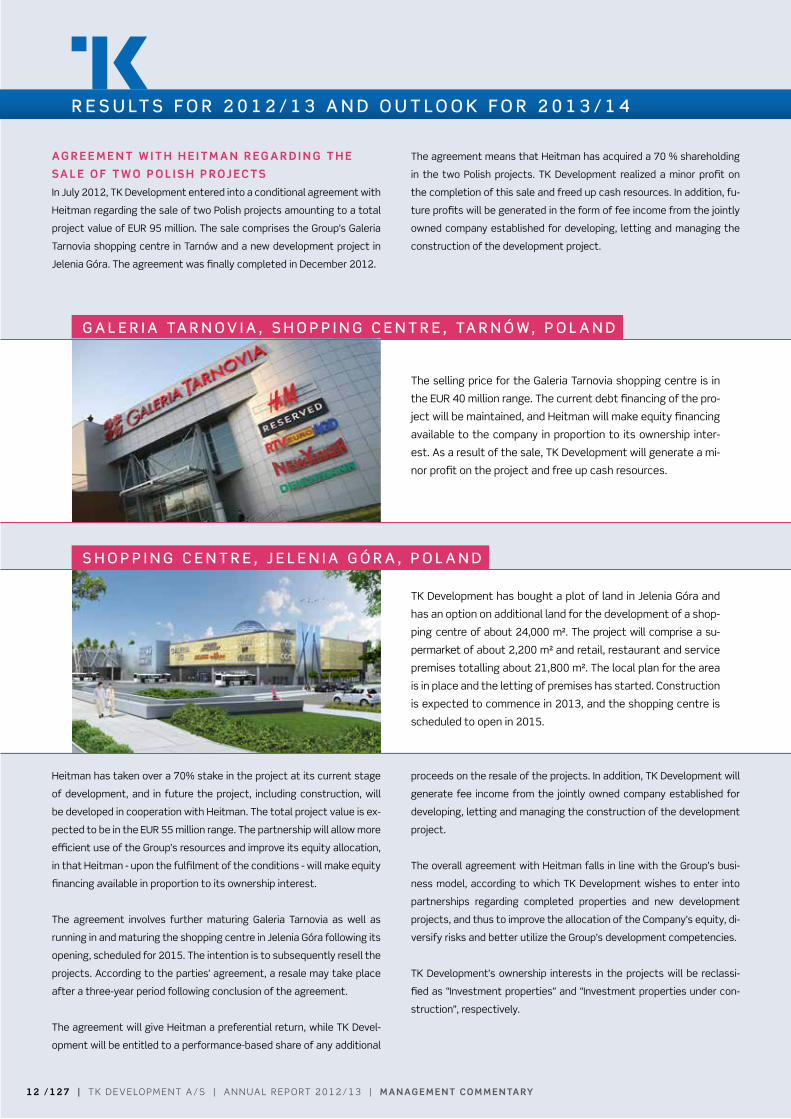
ag r e e m e n T w i T h h e i Tm a n r eg a r d i n g T h e
sa l e o f T w o P o l i s h P r oj ec T s
In July 2012, tk Development entered into a conditional agreement with
Heitman regarding the sale of two polish projects amounting to a total
project value of eur 95 million. the sale comprises the Group’s Galeria
tarnovia shopping centre in tarnów and a new development project in
Jelenia Góra. the agreement was finally completed in December 2012.
the agreement means that Heitman has acquired a 70 % shareholding
in the two polish projects. tk Development realized a minor profit on
the completion of this sale and freed up cash resources. In addition, fu-
ture profits will be generated in the form of fee income from the jointly
owned company established for developing, letting and managing the
construction of the development project.
the selling price for the Galeria tarnovia shopping centre is in
the eur 40 million range. the current debt financing of the pro-
ject will be maintained, and Heitman will make equity financing
available to the company in proportion to its ownership inter-
est. As a result of the sale, tk Development will generate a mi-
nor profit on the project and free up cash resources.
tk Development has bought a plot of land in Jelenia Góra and
has an option on additional land for the development of a shop-
ping centre of about 24,000 m². the project will comprise a su-
permarket of about 2,200 m² and retail, restaurant and service
premises totalling about 21,800 m². the local plan for the area
is in place and the letting of premises has started. Construction
is expected to commence in 2013, and the shopping centre is
scheduled to open in 2015.
Heitman has taken over a 70% stake in the project at its current stage
of development, and in future the project, including construction, will
be developed in cooperation with Heitman. the total project value is ex-
pected to be in the eur 55 million range. the partnership will allow more
efficient use of the Group’s resources and improve its equity allocation,
in that Heitman - upon the fulfilment of the conditions - will make equity
financing available in proportion to its ownership interest.
the agreement involves further maturing Galeria tarnovia as well as
running in and maturing the shopping centre in Jelenia Góra following its
opening, scheduled for 2015. the intention is to subsequently resell the
projects. According to the parties’ agreement, a resale may take place
after a three-year period following conclusion of the agreement.
the agreement will give Heitman a preferential return, while tk Devel-
opment will be entitled to a performance-based share of any additional
proceeds on the resale of the projects. In addition, tk Development will
generate fee income from the jointly owned company established for
developing, letting and managing the construction of the development
project.
the overall agreement with Heitman falls in line with the Group’s busi-
ness model, according to which tk Development wishes to enter into
partnerships regarding completed properties and new development
projects, and thus to improve the allocation of the Company’s equity, di-
versify risks and better utilize the Group’s development competencies.
tk Development’s ownership interests in the projects will be reclassi-
fied as “Investment properties” and “Investment properties under con-
struction”, respectively.
R E S U LT S f O R 2 0 1 2 / 1 3 A N D O U T L O O K f O R 2 0 1 3 / 1 4
g A L E R I A TA R N O v I A , S h O P P I N g C E N T R E , TA R N ó w , P O L A N D
S h O P P I N g C E N T R E , j E L E N I A g ó R A , P O L A N D
m a n ag e m e n T com m e n Ta ry | A n n uA l r e p o rt 2 0 1 2 / 1 3 | t k D e v e lo pm e n t A / S | 1 3 / 1 2 7
sion on project sales amounts to Dkk 123.0 million, of which Dkk
37.8 million is attributable to investment properties; see below.
the remaining portion of writedowns for impairment relates in
part to the Group’s Czech Fashion Arena outlet Center project
in prague. In order to secure future operations, project flow and
earnings, management has attached great importance to real-
izing projects and simultaneously freeing up cash resources to
strengthen the Group’s financial platform. management has
therefore revised the Group’s sales strategy with a view to re-
alizing faster sales and consequently accepting project sales at
reduced prices. the writedowns for impairment have been made
on this basis.
Impairment of the project portfolio, including the decision to sell
land, due in part to the difficult market conditions in the residen-
tial segment in poland, amounts to Dkk 151.3 million. this im-
pairment is primarily a consequence of management’s decision
to attempt reducing the portfolio of land by means of selling se-
lected plots. management wishes to reduce the Group’s risk at-
taching to the polish residential project in Bielany, Warsaw, which
is expected to have an unsatisfactorily long time horizon in the
current challenging market. thus, management has decided to
attempt selling some of this land. It is assessed that the sale of
land without project execution will entail a loss relative to the
carrying amount, and this loss has been included in the valua-
tion of the impairment made. A minor part of the writedowns for
impairment relates to the lower selling prices of residential units
than anticipated in the first phase of the project and is a conse-
quence of the sluggish market as well as the price adjustments
resulting from the large supply of new housing for sale, among
other factors.
the scope of housing projects launched in Warsaw is now di-
minishing, and over time the supply of housing is expected to
stabilize. It remains difficult for individual buyers to obtain sat-
isfactory home purchase loans because the banks require high
borrower equity. therefore, buyers are showing a preference for
lower-priced areas to obtain more floor space. For this reason,
management has chosen to prioritize another of the Group’s res-
idential projects in a lower-priced area of Warsaw. the startup of
the remaining part of the Bielany project will be postponed until
market conditions have improved.
other impairment based on market conditions and a longer de-
velopment and maturing horizon for individual projects than pre-
viously anticipated amounts to Dkk 67 million and is partly attrib-
utable to the Group’s stake in ringsted outlet. Despite steadily
increasing revenue and footfall at ringsted outlet, management
has had to acknowledge that the continued difficult market
conditions – partly due to consistently long decision-making pro-
cesses among tenants – have delayed the running-in and matur-
ing of the outlet centre.
regardless of the difficult market conditions, management finds
it highly unsatisfactory having to make the writedowns for im-
pairment described above.
Concurrently with the decision to change the sales strategy,
management initiated a review of the Group’s business areas for
the purpose of assessing its future market platform, including
the countries in which the Group will continue to operate, and
the possibility of trimming costs further. management has now
completed this review, and at a board meeting on 11 march 2013,
i.e. after the reporting date, the Supervisory Board adopted a re-
vised strategy and business model, which is outlined above.
It is management’s belief that once implemented, these meas-
ures will enable the Group to generate satisfactory returns for
its shareholders in future.
the value adjustment of the Group’s investment properties
amounted to Dkk -37.8 million against Dkk 36.7 million in
2011/12. Dkk -24.3 million of this value adjustment relates
to the Czech investment property Futurum Hradec králové, in-
cluding the extension of the same property completed in may
2012. Futurum Hradec králové is owned in a joint venture with Ge
Capital and Heitman. the joint venture has decided to attempt
selling the property. Based on the ongoing sales process, man-
agement has chosen to change the valuation of the property,
recognizing the negative value adjustment in the second quarter
of 2012/13.
the value adjustment of the German investment properties
amounts to Dkk -13.5 million, which relates mainly to ongoing
sales negotiations, as management considers it essential to
downscale the German activities with particular reference to the
adjusted strategy and market focus.
staff costs and other external expenses
Staff costs and other external expenses amounted to Dkk 99.4
million for the year under review against Dkk 127.5 million in
2011/12, a reduction of about 22 %.
Staff costs amounted to Dkk 69.2 million against Dkk 92.9 mil-
lion the year before, a decline of about 25 %. the number of em-
ployees totalled 112 at 31 January 2013, including employees
working at operational shopping centres.
other external expenses amounted to Dkk 30.2 million, a 13 %
reduction compared to 2011/12.
R E S U LT S f O R 2 0 1 2 / 1 3 A N D O U T L O O K f O R 2 0 1 3 / 1 4

1 4 / 1 2 7 | t k D e v e lo pm e n t A / S | A n n uA l r e p o rt 2 0 1 2 / 1 3 | m a n ag e m e n T com m e n Ta ry
In connection with the adjustment of the Group’s strategy and
market focus, see above, management has trimmed costs so
as to reduce overheads by a further 20%, half of which will de-
rive from the discontinuation of the Group’s activities in Germa-
ny, Finland and the Baltic States.
Development in costs:
Costs, DKKm Costs (2008/09 = Index 100)
0
30
60
90
120
150
180
2014/15(E)
2013/14(E)
2012/132011/122010/112009/102008/09
50
100
financing
tk Development realized net financing expenses of Dkk 87.4
million against Dkk 83.6 million in 2011/12.
Tax on profit/loss for the year
tax on the results for the year amounts to Dkk 167.3 million,
which includes impairment of the Group’s deferred tax assets
totalling Dkk 200.5 million. A substantial portion of this impair-
ment is attributable to the Group’s Danish tax asset as a result
of changed tax rules; see under ”Deferred tax assets” below.
development in results
Revevue, DKKm Operating profit/loss, DKKm
-500
0
500
1,000
1,500
2012/132011/122010/112009/102008/09
b a l a n c e s h e e T
the Group’s balance sheet total amounts to Dkk 4,009.3 mil-
lion, which is a decline of Dkk 630.2 million compared to 31 Jan-
uary 2012, equal to 13.6 %.
goodwill
Goodwill is unchanged compared to 31 January 2012, amount-
ing to Dkk 33.3 million at the reporting date. the goodwill re-
lates to the Group’s activities in poland and the Czech republic
in euro mall Holding A/S, a subgroup of tk Development. Based
on the impairment test made, management has found no indi-
cations of impairment of goodwill.
investment properties and investment properties under
construction
TK Development’s investment properties consist of:
• Futurum Hradec králové, shopping centre, the Czech
republic (a 20 % interest).
• Galeria tarnovia, shopping centre, tarnów, poland (a 30 %
interest).
• German investment properties.
the total value of the Group’s investment properties amounted
to Dkk 479.4 million against Dkk 366.9 million at 31 January
2012. Dkk 167.3 million of the value at 31 January 2013 is at-
tributable to the Group’s German investment properties, which
are described in more detail in the section “Discontinuing activ-
ities” below. the two remaining investment properties belong
to the asset management segment and are described in more
detail under that heading.
the Czech investment property, the Futurum Hradec králové
shopping centre, is owned in a joint venture with Ge Capital and
Heitman. tk Development has access to a performance-based
share of the value adjustments on the property, which has been
included in the carrying amount. the joint venture has decided
to attempt selling the property and has initiated the sales pro-
cess. As in the previous quarters, the valuation as at 31 January
2013 has been made on the basis of the ongoing sales process.
the valuation at 31 January 2013 resulted in a negative value
adjustment of Dkk 24.3 million, which was recognized in the
second quarter of 2012/13.
An extension of the Futurum Hradec králové shopping centre,
comprising about 9,950 m², has been built. Construction pro-
gressed according to plan, and the extension opened as sched-
uled on 10 may 2012. At the beginning of the financial year, the
extension was classified under “Investment properties under
construction”, but was transferred to “Investment properties”
in the second quarter of 2012/13 following the completion of
construction and the opening of the extension. thus, the ex-
tension is included in the above-mentioned carrying amount.
tk Development’s 30 % ownership interest in Galeria tarnovia
has been valued at fair value based on completion of the sale to
Heitman of 70 % of the property in December 2012; see above.
tk Development’s investment properties under construction
consist of the Group’s ownership interest in the Jelenia Góra
R E S U LT S f O R 2 0 1 2 / 1 3 A N D O U T L O O K f O R 2 0 1 3 / 1 4
m a n ag e m e n T com m e n Ta ry | A n n uA l r e p o rt 2 0 1 2 / 1 3 | t k D e v e lo pm e n t A / S | 1 5 / 1 2 7
development project in poland.
tk Development has bought a plot of land in Jelenia Góra and
has an option on additional land for the development of a shop-
ping centre of about 24,000 m². the project will comprise a su-
permarket of about 2,200 m² and retail, restaurant and service
premises totalling about 21,800 m². the local plan for the area
is in place and the letting of premises has started. Construc-
tion is expected to commence in 2013, and the shopping cen-
tre is scheduled to open in 2015. In December 2012, 70 % of
the project was handed over to Heitman, see above, and in this
connection the Group’s 30 % ownership interest was classified
as an “Investment property under construction”. no value ad-
justment of the investment property was made at 31 January
2013, as the parties are awaiting final permits for the project
and further clarification of the building phase, including the tim-
ing of construction startup, construction period, etc.
deferred tax assets
Deferred tax assets were recorded at Dkk 127.0 million in the
balance sheet against Dkk 291.7 million at 31 January 2012. In
the 2012/13 financial year, deferred tax assets were written
down by Dkk 200.5 million. A substantial portion of this amount
is attributable to the reduction of the Group’s Danish tax asset
resulting from changed rules for tax loss carryforwards.
In June 2012, a Danish Bill proposing changes to the rules for
tax loss carryforwards was passed. this means that only 60 %
of losses from previous income tax years in excess of Dkk 7.5
million are deductible from the year’s taxable income. For tk
Development, this has considerably lengthened the time hori-
zon for utilizing tax losses and significantly increased the un-
certainty relating to utilization of the tax asset. on the basis of
the changed rules, tk Development identified a need to impair
the Group’s Danish tax asset by Dkk 150.0 million, which was
already recognized in Q1 2012/13 and thus forms part of the
total impairment of the Group’s deferred tax assets.
the valuation of the tax assets is based on existing budgets
and profit forecasts for a five-year period. For the first three
years, budgets are based on an evaluation of specific projects
in the Group’s project portfolio. the valuation for the next two
years is based on specific projects in the project portfolio with
a longer time horizon than three years as well as various project
opportunities.
Due to the substantial uncertainties attaching to these val-
uations, provisions have been made for the risk that projects
are postponed or not implemented and the risk that project
profits fall below expectations. A change in the conditions and
assumptions for budgets and profit forecasts, including time
estimates, could result in the value of the tax assets being low-
er than that computed at 31 January 2013, which could have
an adverse effect on the Group’s results of operations and fi-
nancial position.
Project portfolio
the total project portfolio came to Dkk 3,030.9 million against
Dkk 3,498.1 million at 31 January 2012. the decline amounts
to Dkk 467.2 million and derives from an increase in the project
portfolio related to the Group’s projects in progress and com-
pleted during the period coupled with a decline resulting from
the sale of projects and writedowns for impairment made; see
above.
total prepayments based on forward-funding agreements were
Dkk 369.6 million at 31 January 2013, compared to Dkk 293.3
million at 31 January 2012. Forward funding increased mainly
due to the accumulated forward funding and prepayments on
projects in progress. At 31 January 2013, forward funding re-
presented 91.1 % of the gross carrying amount of sold projects.
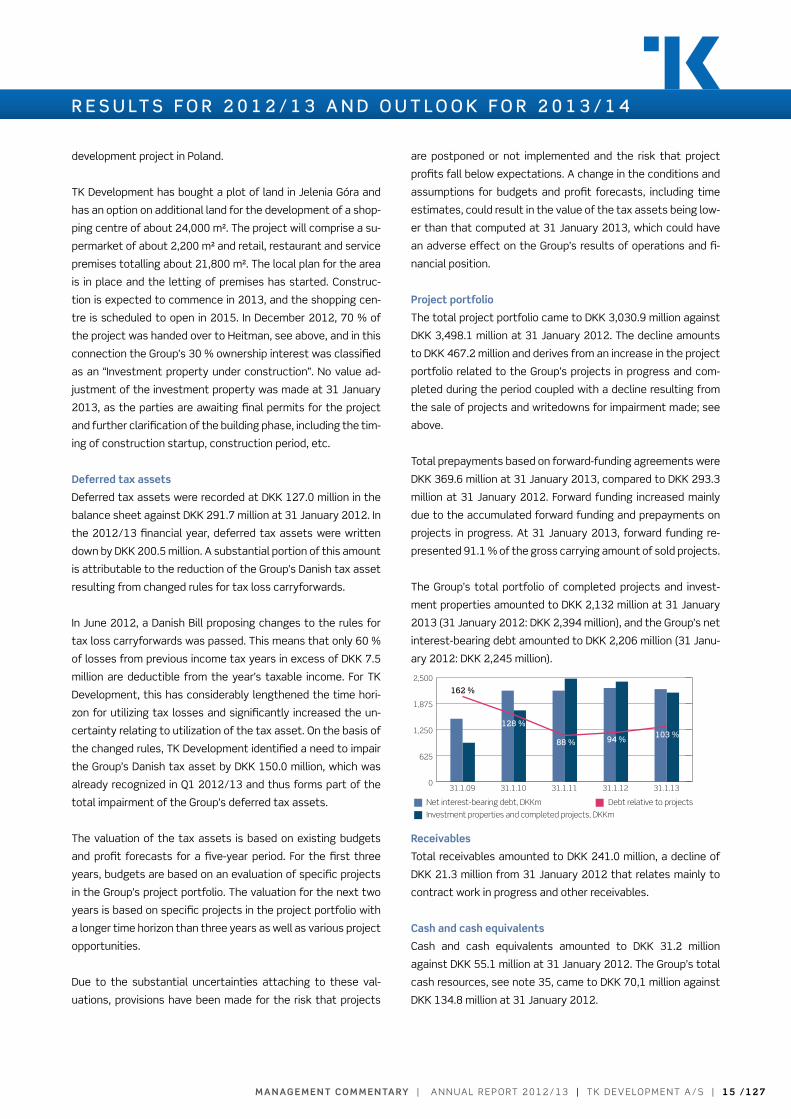
the Group’s total portfolio of completed projects and invest-
ment properties amounted to Dkk 2,132 million at 31 January
2013 (31 January 2012: Dkk 2,394 million), and the Group’s net
interest-bearing debt amounted to Dkk 2,206 million (31 Janu-
ary 2012: Dkk 2,245 million).
Net interest-bearing debt, DKKm Debt relative to projects
0
625
1,250
1,875
2,500
31.1.1331.1.1231.1.1131.1.1031.1.09
Investment properties and completed projects, DKKm
162 %
128 %
88 % 94 % 103 %
receivables
total receivables amounted to Dkk 241.0 million, a decline of
Dkk 21.3 million from 31 January 2012 that relates mainly to
contract work in progress and other receivables.
cash and cash equivalents
Cash and cash equivalents amounted to Dkk 31.2 million
against Dkk 55.1 million at 31 January 2012. the Group’s total
cash resources, see note 35, came to Dkk 70,1 million against
Dkk 134.8 million at 31 January 2012.
R E S U LT S f O R 2 0 1 2 / 1 3 A N D O U T L O O K f O R 2 0 1 3 / 1 4

1 6 / 1 2 7 | t k D e v e lo pm e n t A / S | A n n uA l r e p o rt 2 0 1 2 / 1 3 | m a n ag e m e n T com m e n Ta ry
equity
the Group’s equity came to Dkk 1,389.7 million against Dkk
1,876.4 million at 31 January 2012.
Since 31 January 2012, equity has partly been affected by the
results for the period and positive market-value adjustments
after tax of Dkk 5.7 million related to foreign subsidiaries and
hedging instruments.
the solvency ratio amounts to 34.7 %.
Equity and solvency ratio
Equity, DKKm Solvency ratio
0
500
1,000
1,500
2,000
31 Jan 1331 Jan 1231 Jan 1131 Jan 1031 Jan 09
59 %
39.5
%
36.4
% 40.4
%
40.4
%
34.7
%
non-current liabilities
the Group’s non-current liabilities represented Dkk 141.0 mil-
lion against Dkk 195.7 million at 31 January 2012. the decline
is primarily attributable to debt owing to credit institutions.
current liabilities
the Group’s current liabilities represented Dkk 2,478.6 million
against Dkk 2,567.4 million at 31 January 2012. the decline
is primarily attributable to payables to credit institutions and
trade payables.
ca s h f lo w s TaT e m e n T
the Group’s cash flows from operating activities were positive
in the amount of Dkk 45.6 million (2011/12: Dkk -78.8 million).
this amount is a combined result of a reduction of funds tied
up in projects due to project sales, new project investments,
interest and tax paid, as well as other operating items.
the Group’s cash flows from investing activities were positive in
the amount of Dkk 6.4 million (2011/12: Dkk 9.8 million), which
is primarily a combined result of additional investments in the
extension of the Group’s Czech investment property complet-
ed in may 2012 and the sale of a minor investment property in
Germany.
the cash flows from financing activities for the year were neg-
ative in the amount of Dkk 76.2 million (2011/12: Dkk 32.3
million). the negative cash flows result from a reduction of pay-
ables to credit institutions coupled with the financing raised for
project investments.
f i n a n c i a l i s s u e s
At the forthcoming Annual General meeting, the Supervisory
Board will request authorization to carry out a capital increase
with gross proceeds of about Dkk 210-231 million. the capital
increase will help generate the cash resources required to un-
derpin future operations and project flow, and thus long-term
earnings. the capital increase has been discussed with the
Group’s major shareholders, who, together with a few major
private and institutional investors, have given conditional sub-
scription and underwriting commitments for the total capital
increase. the more specific terms and conditions governing the
capital increase have not yet been determined. the terms and
conditions will be described in detail in the prospectus to be
published in connection with the capital increase.
the Group’s short-term debt to credit institutions consists of
operating and project credits. tk Development has entered into
a general agreement with the Group’s main banker about both
types of credit. the agreement and the associated conditions
are renegotiated once a year, and management expects the
agreement to continue; see below.
the Group’s main banker has indicated its preparedness to
prolong tk Development’s credit facilities subject to specific
conditions being met, which includes reducing the operating
credit limit by Dkk 50 million. the prolongation is expected to
be formally accepted immediately after publication of tk De-
velopment’s Annual report 2012/13.
In addition, the Group has entered into project-financing agree-
ments with various banks in Denmark and abroad. project cred-
its are usually granted with different terms to maturity, de-
pending on the specific project.
During the year under review, the Group was in continuous di-
alogue with a few credit institutions regarding the postpone-
ment of repayment obligations on project credits until one or
more of the major completed projects have been sold, and
agreements regarding the postponement of such repayments
have now fallen into place.
of the total project credits outstanding at 31 January 2013,
credits worth Dkk 1.5 billion are due to mature in the 2013/14
financial year, including continuing repayment obligations on
individual project credits of about Dkk 80 million. After the re-
R E S U LT S f O R 2 0 1 2 / 1 3 A N D O U T L O O K f O R 2 0 1 3 / 1 4
m a n ag e m e n T com m e n Ta ry | A n n uA l r e p o rt 2 0 1 2 / 1 3 | t k D e v e lo pm e n t A / S | 1 7 / 1 2 7
porting date, agreements regarding the refinancing of Dkk 0.2
billion have been made. moreover, the Group’s main banker and
other credit institutions have indicated their preparedness to
prolong existing credit facilities. When final commitments in this
respect have been received, credit facilities of Dkk 1.1 billion
will have been prolonged, and credit facilities of Dkk 0.3 billion
will be due to mature in 2013/14. the Group depends on being
able to continue obtaining either a prolongation or alternative
financing of the project credits not expected to be repaid upon
project sales. the Group is in ongoing dialogue with the relevant
credit institutions, and management anticipates being able to
either prolong or refinance these project credits. Some of the
proceeds from the capital increase or the cash freed up on the
sale of major completed projects will help reduce the debt to
credit institutions, including project finance loans of Dkk 68.5
million granted by a number of the Company’s major sharehold-
ers and members of management.
T r a n s ac T i o n s w i T h r e l aT e d Pa rT i e s
no major or unusual transactions were made with related par-
ties in the first six months of the 2012/13 financial year. In the
third quarter of 2012/13 related parties granted the Group a
loan of Dkk 10 million for project financing.
In the fourth quarter of 2012/13, tk Development entered into
an agreement regarding partial financing of the Group’s shop-
ping centre project in esbjerg, Broen, via an overall financing
package to be provided by a number of major shareholders in
the Company, including members of management and other re-
lated parties; see nASDAQ omX Copenhagen A/S’ definition of
this term. For disclosures about transactions with related par-
ties according to IFrS, please see note 36.
Pa r e n T c o m Pa n y, T k d e v e lo Pm e n T a / s
In 2012/13, tk Development A/S, the parent Company, realized
results before tax of Dkk -285.6 million against Dkk 114.1 mil-
lion in 2011/12. the results after tax amounted to Dkk -333.8
million against Dkk 105.4 million the year before. tax on the
results for 2012/13 was materially affected by the impairment
of the Company’s deferred tax assets due to the changed rules
for tax loss carryforwards adopted in June 2012.
the results include income from investments in group enter-
prises in the amount of Dkk -336.1 million against Dkk 73.9
million the year before. In addition, earnings consist mainly of
net financing income from loans to subsidiaries. In 2012/13,
tk Development made writedowns for impairment of invest-
ments in group enterprises in the amount of Dkk 410.0 million
(2011/12: Dkk 0.0 million). Accumulated impairment relating to
investments in group enterprises amounted to Dkk 870.2 mil-
lion at 31 January 2013 (31 January 2012: Dkk 460.2 million).
At 31 January 2013, the balance sheet total amounted to Dkk
2,058.6 million, a decline of Dkk 332.6 million over the year be-
fore. equity totalled Dkk 1,868.6 million at 31 January 2013, a
decline of Dkk 332.9 million relative to 31 January 2012. this
decline is mainly attributable to the profit recorded for the year.
o u T lo o k fo r 2 0 1 3 / 1 4
management anticipates positive results before tax for the
continuing activities for the 2013/14 financial year. the timing
and progress of the discontinuation of activities are subject to
major uncertainty, and the results of the discontinuation are
therefore not included in the outlook for next year.
As mentioned above, management has revised the sales strat-
egy for the Group’s projects and chosen to accept reduced pric-
es for selected project sales. thus, management considers it
important for the Group to sell some of its completed projects
and plots of land in the 2013/14 financial year.
The expectations mentioned in this annual report, including
earnings expectations, are naturally subject to risks and uncer-
tainties, which may result in deviations from the expected re-
sults. various factors may impact on expectations, as outlined
in the section “Risk issues”, particularly the valuation of the
group’s project portfolio.
s u b s eq u e n T e v e n T s
After the reporting date, tk Development has sold one of the
Group’s minor German investment properties to a German in-
vestor. other than those mentioned in the management com-
mentary, no major events of relevance to the Company have
occurred after the reporting date.
T h e s u P e rv i s o ry b oa r d
the Supervisory Board is currently composed of six members.
the Supervisory Board members have elected niels roth as
Chairman and torsten erik rasmussen as Deputy Chairman. At
the Annual General meeting, the Supervisory Board will propose
that the Supervisory Board should remain composed of six
members. torsten erik rasmussen, Jens erik Christensen and
Jesper Jarlbæk will not stand for re-election at the forthcom-
ing Annual General meeting. the remaining Supervisory Board
members are prepared to stand for re-election, and moreover
the Supervisory Board proposes that Arne Gerlyng-Hansen,
Ceo of Harald nyborg A/S, morten Astrup, founding partner
and CIo of Storm Capital management ltd., london, and kim
R E S U LT S f O R 2 0 1 2 / 1 3 A N D O U T L O O K f O R 2 0 1 3 / 1 4
1 8 / 1 2 7 | t k D e v e lo pm e n t A / S | A n n uA l r e p o rt 2 0 1 2 / 1 3 | m a n ag e m e n T com m e n Ta ry
mikkelsen, Ceo of Strategic Capital ApS, be elected to take the
vacant seats on the Supervisory Board. the new members rec-
ommended for approval at the Annual General meeting repre-
sent major shareholders of tk Development.
Arne Gerlyng-Hansen is a member of the legal profession and
has been the Ceo of Harald nyborg A/S since 2004. He is also
on the supervisory board of Dava 1 ApS, a major shareholder of
tk Development. Arne Gerlyng-Hansen has core competencies
in retail trade, legal affairs, management and business devel-
opment, qualifications considered particularly important by the
Supervisory Board when nominating him as a candidate. Arne
Gerlyng-Hansen will be considered an independent member of
the Supervisory Board.
morten Astrup is the founding partner and CIo of Storm Cap-
ital management ltd. and deputy chairman of the superviso-
ry board of Storm real estate ASA, a major shareholder of tk
Development. morten Astrup has core competencies in real
estate investment, financing and business development, qual-
ifications considered particularly important by the Superviso-
ry Board when nominating him as a candidate. morten Astrup
will be considered an independent member of the Supervisory
Board.
kim mikkelsen has a financial background and is the Ceo of
Strategic Capital ApS, a major shareholder of tk Development.
kim mikkelsen has core competencies in financial affairs, in-
vestment and management, qualifications considered particu-
larly important by the Supervisory Board when nominating him
as a candidate. kim mikkelsen will be considered an independ-
ent member of the Supervisory Board.
d i v i d e n d s
the Supervisory Board recommends to the Annual General
meeting that no dividends be distributed for the 2012/13 fi-
nancial year.
R E S U LT S f O R 2 0 1 2 / 1 3 A N D O U T L O O K f O R 2 0 1 3 / 1 4
m a n ag e m e n T com m e n Ta ry | A n n uA l r e p o rt 2 0 1 2 / 1 3 | t k D e v e lo pm e n t A / S | 1 9 / 1 2 7
the Group has operated under difficult market conditions in re-
cent years, resulting in protracted decision-making processes
among financing sources, tenants and investors alike. the Dan-
ish market in particular has been affected by prolonged uncer-
tainty, and continues to be so, partly because of a weakened
financial sector. In management’s opinion, there are no indica-
tions of a significant improvement during the period to come.
the market conditions in tk Development’s markets and the
impact of the financial crisis on land prices, construction costs,
rental levels, prices for completed properties and access to fi-
nancing, have not changed significantly during the past months.
the above-mentioned variables have stabilized at a new price
level, and new projects are expected to be sold at the profits
realized before the crisis, thus generating a gross margin of 15-
20 % measured on the basis of project cost. However, a low
profit is expected to be realized on projects already completed.
the access to project financing remains difficult and is currently
the greatest challenge facing the property sector. the financial
sector is weakened and has sharpened its focus on credit risks,
and at the same time new rules have imposed stricter capital
requirements on banks. this means that credit institutions re-
main reluctant to provide loans to finance real property, with a
resulting negative effect for the property sector, and thus tk
Development as well. tk Development is dependent on its abil-
ity to continue obtaining either full or partial project financing,
either from credit institutions or from investors in the form of
forward funding, and on freeing up substantial cash resources
from the sale of several major completed projects.
the management of tk Development has long experienced an
unsatisfactory market response to the Group’s efforts to sell
completed projects and investment properties due to sluggish
demand. Despite this trend, 2012 saw cautious investor opti-
mism and increased interest in investing in selected segments
of retail projects, with quality and location being key factors
in the investment decision. However, the decision-making pro-
cesses continue to be lengthy, in part because of the inves-
tors’ requirement for lower project risk. Institutional investors
need options for placing their funds, and this paves the way
for setting up partnerships with such investors for the purpose
of cooperating on the execution of new projects. these oppor-
tunities fall in line with the Group’s business model, according
to which tk Development wishes to enter into partnerships re-
garding completed properties and new development projects,
and thus to improve the allocation of the Company’s equity,
diversify risks and better utilize the Group’s development com-
petencies.
In the letting market for retail property, tenants continue to fo-
cus on location. tk Development is experiencing a good amount
of interest in prime-location projects, and several strong na-
tional and international retail chains are expanding, although
decision-making processes are protracted in light of the unrest
on international financial markets.
the rental level is expected to remain fairly stable in the period
ahead. However, the rental level for secondary locations is ex-
pected to be under pressure.
In the residential segment in Warsaw, poland, demand is slug-
gish and prices have realigned due to the large supply of new
housing for sale, among other factors. the scope of housing
projects launched in Warsaw is now diminishing, and over time
the supply of housing is expected to stabilize. therefore, in the
opinion of management, housing development in poland will be-
come attractive again, particularly in the Warsaw area.
the macroeconomic indicators in the form of GDp, private con-
sumption and unemployment are showing moderate growth
expectations in all the Group’s markets.
the Group has a strong platform in its continuing markets and
focuses on exploiting the unrealized potential on all markets
through existing retailer and investor networks. With special
emphasis on the retail segment, the Group consistently strives
to strengthen the project portfolio in each of its markets and
to ensure satisfactory progress of its existing projects and new
project opportunities.
d e n m a r k
economic growth in Denmark remains low, and a high growth
rate is not foreseen in the near future. In recent years, the
unemployment rate has been fairly stable and is expected to
remain at an unchanged level in the years to come. the Dan-
ish market has been affected by prolonged uncertainty, and
continues to be so, partly because of the weakened financial
sector. thus, access to project financing remains difficult and is
the greatest challenge facing the property sector.
In Denmark, tk Development focuses on the retail segment,
which is also expected to remain the primary segment in the
years ahead. the main emphasis will be on establishing district
and shopping centres in cities and medium-sized towns, and tk
Development is working on several project opportunities within
this area. Another interest area will be the office market in ma-
jor towns and cities.
m A R K E T C O N D I T I O N S

2 0 / 1 2 7 | t k D e v e lo pm e n t A / S | A n n uA l r e p o rt 2 0 1 2 / 1 3 | m a n ag e m e n T com m e n Ta ry
Investors continue to show reasonable interest in the Group’s
retail, office and residential projects at attractive locations in
major towns and cities. At the same time, investor interest in
secondary towns is waning. location and quality are the two
key determinants of investment decisions. the Group can ob-
tain satisfactory selling prices for prime-location properties
where the risk of vacancies is relatively limited, while selling
prices for properties in secondary locations are under pressure.
Institutional investors and other professional investors need
options for placing their funds. this paves the way for setting
up new project partnerships with these investors with a view to
cooperation on project execution.
In the retail letting market, tenants also focus on the right loca-
tion. Both supermarket chains and retail chains are still willing
to expand if the location is right, although their decision-mak-
ing processes are protracted. the rental level for primary loca-
tions is expected to be fairly stable, whereas the rental level for
secondary locations is under pressure.
denmark
– startup in 1989 2011 2012 2013e 2014e
GDp (% yr./yr.) 1.1 -0.6 0.5 1.5
private consumption (% yr./yr.) -0.5 0.5 0.4 1.8
unemployment (%) 6.1 6.2 6.2 6.1
(Source: nordea, march 2013)
After a period of low activity, the office market is picking up,
with projects in major towns and cities attracting greater in-
terest. projects in prime locations, such as those in the Group’s
waterfront areas, appeal to tenants and investors alike, and
the Group expects to create interesting projects in the years to
come. examples of such projects include the Group’s locations
at Amerika plads in Copenhagen and Stuhrs Brygge in Aalborg.
s w e d e n
the Swedish market is characterized by the strong Swedish
economy and high purchasing power, although the growth rate
in 2012 was lower than the year before. real earnings have
risen sharply in the past few years, and increased growth and
higher private consumption are forecast for the years ahead.
As in previous years, tk Development will focus on the retail
segment in Sweden. retail chains are interested in attractive
rental premises, although tenants’ decision-making processes
are also protracted in the Swedish market. new foreign retail
chains continue to expand. project location continues to be the
paramount consideration for tenants, and the trend is clearly
for retail chains to expand in cities, particularly Stockholm and
Gothenburg, but also in other major towns in Sweden. Stock-
holm continues to record high annual population growth. this
results in a demand for new retail establishments and retail
store extensions, as concerns both retail parks and shopping
centres.
Both local and international investors are showing mounting in-
terest, particularly in prime locations, and the selling prices for
such projects are on the rise.
Sweden is considered to be the most transparent and inter-
esting market in the nordic region, and given the continued
retail expansion, the Swedish market is highly interesting for
tk Development. tk Development intends to focus on develop-
ing prime-location superstores and shopping centres in major
towns and cities, with Stockholm and Gothenburg being the
primary areas of interest.
sweden
– startup in 1997 2011 2012 2013e 2014e
GDp (% yr./yr.) 3.7 0.8 1.3 2.6
private consumption (% yr./yr.) 2.1 1.5 2.2 2.4
unemployment (%) 7.8 8.0 8.3 8.2
(Source: nordea, march 2013)
P o l a n d
the Group has a well-developed network of contacts with many
local and international retail chains looking to expand into Cen-
tral europe. In addition, the Group works closely with investors,
including international investment funds, looking to invest in
Central european property projects.
the outlook for the polish market remains positive, even though
the macroeconomic indicators show a weaker growth trend
than in previous years. Strong national and international retail
chains still wish to expand, with location being the key focus
as in the Group’s other markets. Generally, prime-location retail
premises in major towns and cities are in high demand, while
tenants want to vacate their secondary-location premises. Al-
though it is still possible to pre-let planned shopping centres
in attractive locations, the letting process is longer due to ten-
ants’ protracted decision-making. As the market for shopping
centres matures, new development options are expected to
arise, also making projects to extend and/or revitalize existing
centres attractive.
m A R K E T C O N D I T I O N S
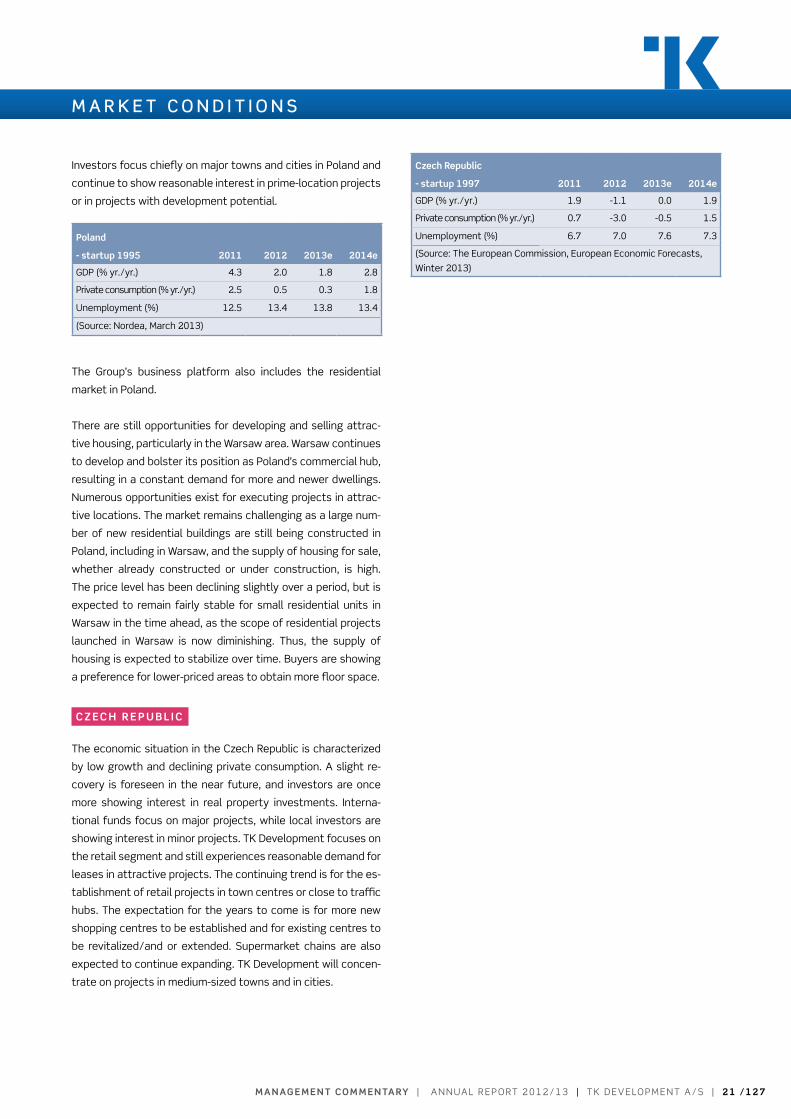
m a n ag e m e n T com m e n Ta ry | A n n uA l r e p o rt 2 0 1 2 / 1 3 | t k D e v e lo pm e n t A / S | 2 1 / 1 2 7
Investors focus chiefly on major towns and cities in poland and
continue to show reasonable interest in prime-location projects
or in projects with development potential.
Poland
- startup 1995 2011 2012 2013e 2014e
GDp (% yr./yr.) 4.3 2.0 1.8 2.8
private consumption (% yr./yr.) 2.5 0.5 0.3 1.8
unemployment (%) 12.5 13.4 13.8 13.4
(Source: nordea, march 2013)
the Group’s business platform also includes the residential
market in poland.
there are still opportunities for developing and selling attrac-
tive housing, particularly in the Warsaw area. Warsaw continues
to develop and bolster its position as poland’s commercial hub,
resulting in a constant demand for more and newer dwellings.
numerous opportunities exist for executing projects in attrac-
tive locations. the market remains challenging as a large num-
ber of new residential buildings are still being constructed in
poland, including in Warsaw, and the supply of housing for sale,
whether already constructed or under construction, is high.
the price level has been declining slightly over a period, but is
expected to remain fairly stable for small residential units in
Warsaw in the time ahead, as the scope of residential projects
launched in Warsaw is now diminishing. thus, the supply of
housing is expected to stabilize over time. Buyers are showing
a preference for lower-priced areas to obtain more floor space.
c z e c h r e P u b l i c
the economic situation in the Czech republic is characterized
by low growth and declining private consumption. A slight re-
covery is foreseen in the near future, and investors are once
more showing interest in real property investments. Interna-
tional funds focus on major projects, while local investors are
showing interest in minor projects. tk Development focuses on
the retail segment and still experiences reasonable demand for
leases in attractive projects. the continuing trend is for the es-
tablishment of retail projects in town centres or close to traffic
hubs. the expectation for the years to come is for more new
shopping centres to be established and for existing centres to
be revitalized/and or extended. Supermarket chains are also
expected to continue expanding. tk Development will concen-
trate on projects in medium-sized towns and in cities.
czech republic
- startup 1997 2011 2012 2013e 2014e
GDp (% yr./yr.) 1.9 -1.1 0.0 1.9
private consumption (% yr./yr.) 0.7 -3.0 -0.5 1.5
unemployment (%) 6.7 7.0 7.6 7.3
(Source: the european Commission, european economic Forecasts,
Winter 2013)
m A R K E T C O N D I T I O N S

2 2 / 1 2 7 | t k D e v e lo pm e n t A / S | A n n uA l r e p o rt 2 0 1 2 / 1 3 | m a n ag e m e n T com m e n Ta ry
B U S I N E S S C O N C E P T A N D K N O w L E D g E R E S O U R C E S
b u s i n e s s c o n c e PT
the Group’s primary business area is the development of real
property, termed property development, and the Group’s sec-
ondary business area is asset management.
P r o P e rT y d e v e lo Pm e n T
the Group has strong networks forged on the basis of
long-standing, close business relationships with tenants and
investors, and regularly enters into contracts with these busi-
ness partners. the Group is predominantly a knowledge-based
service provider and has specialized in being the productive and
creative liaison between tenants, investors, architects, con-
struction companies and other business partners.
tk Development wants to be the preferred property develop-
ment partner in the retail segment, with the interaction with
customers, tenants and investors being based on know-how
and mutual confidence.
In collaboration with tenants and investors, tk Development
plans and arranges the construction of new buildings, and the
expansion and conversion of real property based on tenant
needs and investor requirements. the Group develops the pro-
jects, which involves letting the premises, managing construc-
tion and concluding contracts with construction companies and
subcontractors for the execution of the building works.
In terms of segments, the Group focuses on the development of
shopping centres, superstores and corporate headquarters and
related mixed and multifunctional projects as well as housing
in poland.
the retail segment will continue to be the Group’s most impor-
tant segment in the years ahead based on continued expansion
of its already extensive network of contacts.
DK SE PL CZ
Shopping centres
Stores/superstores
High-street properties
Offices
Mixed
Residential
Owning, operating, maturing and optimizing completed pro-jects for a medium-long operating period that matches the potential for adding value both for the group and for third parties.
strategy for business unit - asset management
Developing projects from the conceptual phase through to project completion, based on one of several models: • Sold projects (forward funding / forward purchase)• projects with partners• on tk Development’s own books based on a high degree
of confidence in the letting and sales potential• Services for third parties.
strategy for business unit – Property development
The overall mission of TK Development is to create added value by developing real property. The group operates in the property development and services environments, and specializes in being the creative and result-oriented link be-tween tenants and investors.
The group’s mission
TK Development bases its operations on a number of funda-mental values that are the group’s hallmarks. They define the framework for the actions of TK Development’s employees and the values that TK Development wants to signal.• Good business sense• Being result-oriented• Innovation and creativity• Being trustworthy• keeping it simple• Commitment
fundamental values
Finished project
Subcontractors
InvestorsOption/purchase of site
Tenant requirements
Investor requirements
Public authorities
Contractors
Tenants
EngineersArchitects
Project managementLettingSales
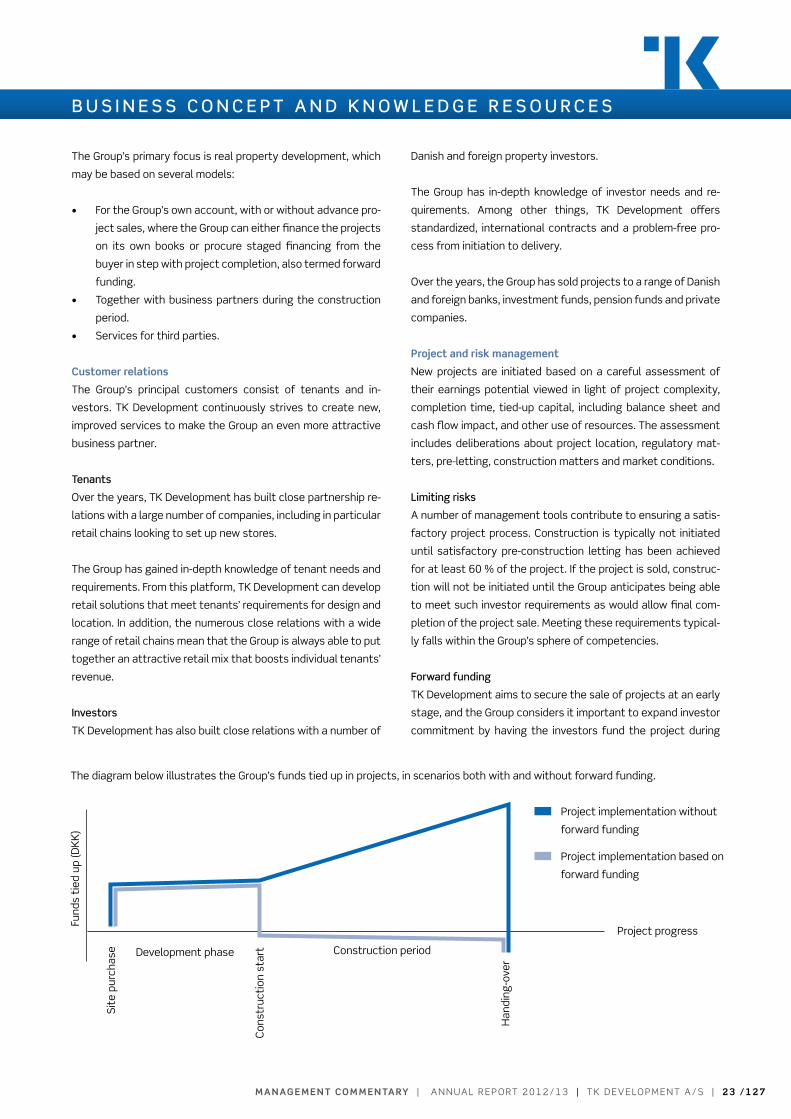
m a n ag e m e n T com m e n Ta ry | A n n uA l r e p o rt 2 0 1 2 / 1 3 | t k D e v e lo pm e n t A / S | 2 3 / 1 2 7
the Group’s primary focus is real property development, which
may be based on several models:
• For the Group’s own account, with or without advance pro-
ject sales, where the Group can either finance the projects
on its own books or procure staged financing from the
buyer in step with project completion, also termed forward
funding.
• together with business partners during the construction
period.
• Services for third parties.
customer relations
the Group’s principal customers consist of tenants and in-
vestors. tk Development continuously strives to create new,
improved services to make the Group an even more attractive
business partner.
Tenants
over the years, tk Development has built close partnership re-
lations with a large number of companies, including in particular
retail chains looking to set up new stores.
the Group has gained in-depth knowledge of tenant needs and
requirements. From this platform, tk Development can develop
retail solutions that meet tenants’ requirements for design and
location. In addition, the numerous close relations with a wide
range of retail chains mean that the Group is always able to put
together an attractive retail mix that boosts individual tenants’
revenue.
Investors
tk Development has also built close relations with a number of
Danish and foreign property investors.
the Group has in-depth knowledge of investor needs and re-
quirements. Among other things, tk Development offers
standardized, international contracts and a problem-free pro-
cess from initiation to delivery.
over the years, the Group has sold projects to a range of Danish
and foreign banks, investment funds, pension funds and private
companies.
Project and risk management
new projects are initiated based on a careful assessment of
their earnings potential viewed in light of project complexity,
completion time, tied-up capital, including balance sheet and
cash flow impact, and other use of resources. the assessment
includes deliberations about project location, regulatory mat-
ters, pre-letting, construction matters and market conditions.
Limiting risks
A number of management tools contribute to ensuring a satis-
factory project process. Construction is typically not initiated
until satisfactory pre-construction letting has been achieved
for at least 60 % of the project. If the project is sold, construc-
tion will not be initiated until the Group anticipates being able
to meet such investor requirements as would allow final com-
pletion of the project sale. meeting these requirements typical-
ly falls within the Group’s sphere of competencies.
forward funding
tk Development aims to secure the sale of projects at an early
stage, and the Group considers it important to expand investor
commitment by having the investors fund the project during
B U S I N E S S C O N C E P T A N D K N O w L E D g E R E S O U R C E S
Fund
s ti
ed u
p (D
kk
)
Con
stru
ctio
n st
art
Han
ding
-ove
r
Site
pur
chas
e
project progress
Development phase Construction period
project implementation without
forward funding
project implementation based on
forward funding
the diagram below illustrates the Group’s funds tied up in projects, in scenarios both with and without forward funding.
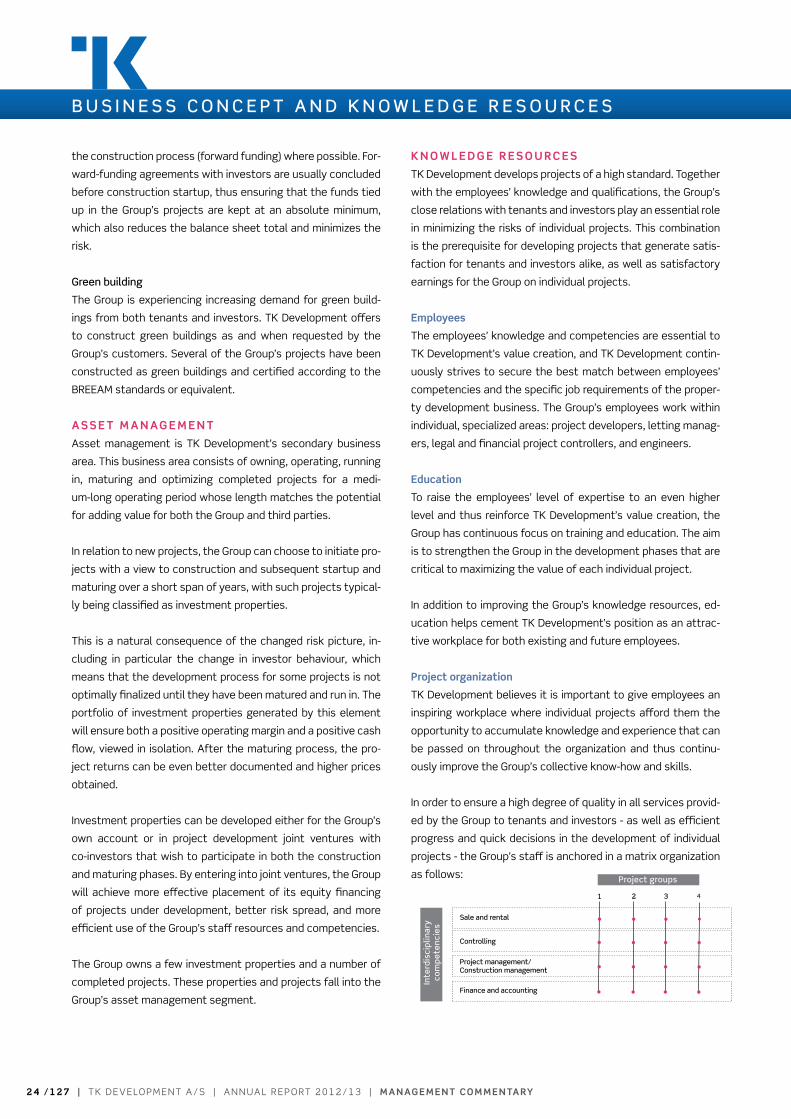
2 4 / 1 2 7 | t k D e v e lo pm e n t A / S | A n n uA l r e p o rt 2 0 1 2 / 1 3 | m a n ag e m e n T com m e n Ta ry
the construction process (forward funding) where possible. For-
ward-funding agreements with investors are usually concluded
before construction startup, thus ensuring that the funds tied
up in the Group’s projects are kept at an absolute minimum,
which also reduces the balance sheet total and minimizes the
risk.
green building
the Group is experiencing increasing demand for green build-
ings from both tenants and investors. tk Development offers
to construct green buildings as and when requested by the
Group’s customers. Several of the Group’s projects have been
constructed as green buildings and certified according to the
BreeAm standards or equivalent.
a s s e T m a n ag e m e n T
Asset management is tk Development’s secondary business
area. this business area consists of owning, operating, running
in, maturing and optimizing completed projects for a medi-
um-long operating period whose length matches the potential
for adding value for both the Group and third parties.
In relation to new projects, the Group can choose to initiate pro-
jects with a view to construction and subsequent startup and
maturing over a short span of years, with such projects typical-
ly being classified as investment properties.
this is a natural consequence of the changed risk picture, in-
cluding in particular the change in investor behaviour, which
means that the development process for some projects is not
optimally finalized until they have been matured and run in. the
portfolio of investment properties generated by this element
will ensure both a positive operating margin and a positive cash
flow, viewed in isolation. After the maturing process, the pro-
ject returns can be even better documented and higher prices
obtained.
Investment properties can be developed either for the Group’s
own account or in project development joint ventures with
co-investors that wish to participate in both the construction
and maturing phases. By entering into joint ventures, the Group
will achieve more effective placement of its equity financing
of projects under development, better risk spread, and more
efficient use of the Group’s staff resources and competencies.
the Group owns a few investment properties and a number of
completed projects. these properties and projects fall into the
Group’s asset management segment.
k n o w l e d g e r e s o u r c e s
tk Development develops projects of a high standard. together
with the employees’ knowledge and qualifications, the Group’s
close relations with tenants and investors play an essential role
in minimizing the risks of individual projects. this combination
is the prerequisite for developing projects that generate satis-
faction for tenants and investors alike, as well as satisfactory
earnings for the Group on individual projects.
employees
the employees’ knowledge and competencies are essential to
tk Development’s value creation, and tk Development contin-
uously strives to secure the best match between employees’
competencies and the specific job requirements of the proper-
ty development business. the Group’s employees work within
individual, specialized areas: project developers, letting manag-
ers, legal and financial project controllers, and engineers.
education
to raise the employees’ level of expertise to an even higher
level and thus reinforce tk Development’s value creation, the
Group has continuous focus on training and education. the aim
is to strengthen the Group in the development phases that are
critical to maximizing the value of each individual project.
In addition to improving the Group’s knowledge resources, ed-
ucation helps cement tk Development’s position as an attrac-
tive workplace for both existing and future employees.
Project organization
tk Development believes it is important to give employees an
inspiring workplace where individual projects afford them the
opportunity to accumulate knowledge and experience that can
be passed on throughout the organization and thus continu-
ously improve the Group’s collective know-how and skills.
In order to ensure a high degree of quality in all services provid-
ed by the Group to tenants and investors - as well as efficient
progress and quick decisions in the development of individual
projects - the Group’s staff is anchored in a matrix organization
as follows:
2
Project management/Construction management
Project groups
Finance and accounting
Controlling
Sale and rental
41 3
Inte
rdis
cip
linar
yco
mp
eten
cies
f O R R E T N I N g S -K O N C E P T
B U S I N E S S C O N C E P T A N D K N O w L E D g E R E S O U R C E S

m a n ag e m e n T com m e n Ta ry | A n n uA l r e p o rt 2 0 1 2 / 1 3 | t k D e v e lo pm e n t A / S | 2 5 / 1 2 7
B U S I N E S S C O N C E P T A N D K N O w L E D g E R E S O U R C E S
frede Clausenpresident and Ceo
Robert Andersenexecutive vice president
Accounting, finances and Controlling
denmark
erik Godtfredsen
sweden
Dan Fæster
Poland
ZygmuntChyla
czech republic
rostislav novák
the matrix organization means that all the Group’s peak com-
petencies, covering the progress of a project from blueprint to
completion, exist in the project group that carries through the
individual project from A to Z.
organization, management and employees
tk Development’s organization and management structure are
based on branch offices managed by divisional managers (sen-
ior vice presidents).
the Group’s international management team consists of the
above-mentioned group of persons, as well as functional man-
agers in the individual countries.
The group’s management structure (excluding discontinuing
activities) is shown below:
organizational focus on segments
to underpin the segmentation chosen, it has been decided to
organize the business activities so as to best ensure manage-
ment focus on both property development and asset manage-
ment activities. the members of the executive Board attempt
as far as possible to focus primarily on their own individual
business areas, while taking into account that the executive
Board members are jointly responsible for the day-to-day man-
agement of the overall business activities. tk Development has
several years’ experience in asset management and performs
asset management services for third parties. the Company will
increase its focus on asset management, including utilization
of the Group’s competencies and employee know-how to en-
sure continued progress in maturing the completed projects.
breakdown of the group’s employees
At 31 january 2013, the group employed a total of 112 per-
sons, broken down as follows:
Denmark 21
Poland 25
Shopping centremanagement 16
Group/services 10 Other countries 11
Czech Republic 14
Sweden 15
Group functions and related services include management, ac-
counting and finances, and other staff functions.
8,300 m2 retail park, gävle, swedenthe retail park was completed in october 2012 and was handed over to nordika Fastigheter AB in november 2012. the selling price amounted to Sek 110 million.
m a n ag e m e n T com m e n Ta ry | A n n uA l r e p o rt 2 0 1 2 / 1 3 | t k D e v e lo pm e n t A / S | 2 5 / 1 2 7

2 6 / 1 2 7 | t k D e v e lo pm e n t A / S | A n n uA l r e p o rt 2 0 1 2 / 1 3 | m a n ag e m e n T com m e n Ta ry
the Group’s primary business area is the development of real
property, termed property development.
In its property development segment, tk Development focuses
on executing existing projects in the portfolio, as well as on se-
curing satisfactory pre-construction letting or sales. In addition,
the Group is continuing its work on new project opportunities.
the Group will make the startup of major new projects contingent
on obtaining either full or partial financing for them and on free-
ing up cash resources from the sale of one or more major complet-
ed projects.
In 2012/13, the gross margin for property development
amounted to Dkk -81.8 million, of which Dkk 127.1 million rep-
resents impairment losses on projects; see the description un-
der “results for 2012/13 and outlook for 2013/14” above.
the Group’s retail projects on which construction is already on-
going or about to start are still attracting a good amount of in-
terest from tenants. During the period under review, the Group
also concluded lease agreements for several of these projects.
uncertainty on the international financial markets continues to
affect the property sector negatively, leading to consistently
long decision-making processes among financing sources, ten-
ants and investors alike; see under “market conditions”. Against
this background, the Group has postponed the expected con-
struction start dates for several projects relative to the most
recent estimates in the Interim report for Q1-Q3 2012/13, and
has decided against initiating certain projects.
the development potential of the project portfolio represented
452,000 m² at 31 January 2013, of which sold projects account-
ed for 7,000 m² and remaining projects for 445,000 m². the pro-
ject portfolio had a total development potential of 635,000 m²
at 31 January 2012.
The development in the group’s project portfolio is outlined
below:
(dkkm) 31 jan 2011 31 jan 2012 31 jan 2013
Sold
Completed 0 0 15
In progress 12 17 17
not initiated 14 10 6
Total 26 27 38
Remaining
Completed 0 0 38
In progress 149 286 198
not initiated 915 938 901
Total 1,064 1,224 1,137
Net project portfolio 1,090 1,251 1,175
Forward funding 284 293 370
Gross project portfolio 1,374 1,544 1,545
Forward funding in % of gross carrying amount of sold projects 91.6 % 91.6 % 91.1 %
table 1
the Group uses forward funding to reduce the funds tied up in
the portfolio of sold projects. the rise in forward funding since
31 January 2012 results mainly from an accumulation of for-
ward funding and prepayments relating to projects in progress.
the decline in the carrying amount of remaining projects is pri-
marily attributable to the writedowns for impairment of the
Group’s project portfolio made during the period under review;
see above.
P R O P E R T y D E v E L O P m E N T
Developing projects from the conceptual phase through to project
completion, based on one of several models:
• Sold projects (forward funding / forward purchase)
• projects with partners
• on tk Development’s own books based on a high degree of confi-
dence in the letting and sales potential
• Services for third parties.
strategy for business unit – Property development
• Countries: Dk, Se, pl, CZ
• revenue 2012/13: Dkk 183.4 million
• Gross profit/loss 2012/13: Dkk -81.8 million
• profit/loss before tax and impairment, etc.: Dkk 44.1 million
• Balance sheet total, 31 Jan 2013: Dkk 1,284.5 million
Property development

m a n ag e m e n T com m e n Ta ry | A n n uA l r e p o rt 2 0 1 2 / 1 3 | t k D e v e lo pm e n t A / S | 2 7 / 1 2 7
The development potential is shown below in square metres:
m² (’000) 31 jan 2011 31 jan 2012 31 jan 2013
Sold
Completed 0 0 4
In progress 4 7 3
not initiated 79 29 0
Total 83 36 7
Remaining
Completed 0 0 3
In progress 22 39 20
not initiated 543 560 422
Total 565 599 445
Total project portfolio 648 635 452
Number of projects 53 50 37
table 2
As appears from above, the development potential of the
Group’s project portfolio in square metres has declined
substantially since 31 January 2012. this decline should
be viewed in light of the Group’s market focus, including the
high priority attached to projects on the continuing markets.
In the 2012/13 financial year, management chose not to
launch a number of projects that it did not expect to generate
satisfactory earnings in relation to use of resources, capital
tied up, etc. moreover, as mentioned above, management
aims to reduce the portfolio of projects not initiated (plots of
land) over a two-year period. Several of these projects will be
discontinued through land sales and will therefore no longer
be included in the development potential in terms of square
metres.
geographical segmentation of the development potential in
square metres:
Sweden
Denmark
Czech Republic
Poland
c o m P l e T e d P r oj ec T s
residential park, bielany, warsaw, Poland
tk Development owns a tract of land in Warsaw allowing for
the construction of about 56,200 m², distributed on 900-1,000
residential units. the plan is to build the project in four phases.
Construction of the first phase, consisting of 136 units, started
in mid-2011 and was completed in January 2013. the pre-com-
pletion sale of the units started in spring 2011, but sluggish
demand in the polish residential market has affected the sales
process. So far, sales agreements for about 69 % of the units in
the first phase have been signed (Q1-Q3 2012/13: 52 %). the
residential units are being sold as owner-occupied apartments
to private users, and management expects the remaining units
to be sold in the course of the 2013/14 financial year. the mar-
ket remains challenging as a large number of new residential
buildings are still being constructed in poland, including in War-
saw, and the supply of housing for sale, whether already con-
structed or under construction, is high. the price level has been
declining slightly over a period, but is expected to remain fairly
stable for small residential units in Warsaw in the time ahead,
as the scope of residential projects launched in Warsaw is now
diminishing. thus, the supply of housing is expected to stabi-
lize over time. Buyers are showing a preference for lower-priced
areas to obtain more floor space. management has therefore
chosen to prioritize another of the Group’s residential projects
in a lower-priced area of Warsaw. management has decided to
attempt selling some of the land for the Bielany residential pro-
ject, and the startup of the remaining part of the project will be
postponed until market conditions have improved.
P r oj ec T s i n P r o g r e s s
amerika Plads, underground car park, copenhagen, denmark
kommanditaktieselskabet Danlink udvikling (Dlu), which is
owned 50/50 by udviklingsselskabet By og Havn I/S and tk
Development, owns three projects at Amerika plads: lot A, lot C
and an underground car park. part of the underground car park
in the Amerika plads area has been built. the Group expects to
sell the total parking facility upon final completion.
vasevej, birkerød, denmark
tk Development owns a property of about 3,000 m² at vasevej
in Birkerød, rented by SuperBest. the project consists of a re-
furbishment of the existing property and a minor extension
comprising a few stores and dwellings. the combined project is
expected to comprise about 3,400 m².
retail park, enebyängen, danderyd, sweden
In the municipality of Danderyd near Stockholm, tk Develop-
P R O P E R T y D E v E L O P m E N T

2 8 / 1 2 7 | t k D e v e lo pm e n t A / S | A n n uA l r e p o rt 2 0 1 2 / 1 3 | m a n ag e m e n T com m e n Ta ry
P R O P E R T y D E v E L O P m E N T
Project city/town country segment
Tkd’s share
of area (m2)
Tkd’s
ownership
interest
construction
start/expected
construction start
opening/
expected
opening
Completed
residential park, Bielany, phase I Warsaw pl residential/services 7,850 100 % mid-2011 early 2013
In progress
Amerika plads, underground car park Copenhagen Dk Car park 16,000 50 % 2004 Continuously
vasevej Birkerød Dk mixed 3,400 100 % - -
retail park, enebyängen, phase II Danderyd Se retail 1,800 100 % Autumn 2012 march 2013
Not initiated
Broen, shopping centre esbjerg Dk retail 29,800 100 % mid-2013 2015
Østre teglgade Copenhagen Dk office/residential 32,700 1) 100 % Continuously Continuously
Amerika plads, lot C Copenhagen Dk mixed 6,500 50 % 2014 2016
Amerika plads, lot A Copenhagen Dk office 5,900 50 % 2014 2016
Aarhus South, phase II Aarhus Dk retail 2,800 100 % 2013 2014
ejby Industrivej Copenhagen Dk office 12,900 100 % - -
Østre Havn/Stuhrs Brygge Aalborg Dk mixed 36,000 1) 50 % Continuously Continuously
retail park, marsvej randers Dk retail 10,000 100 % 2013 2014
Development of town centre køge Dk mixed 27,500 100 % 2013 Continuously
Farum Bytorv, extension Farum Dk retail 8,000 100 % 2013 2015
the kulan commercial district Gothenburg Se mixed 45,000 100 % 2013 2015
retail park, Barkarby Gate Stockholm Se retail 20,000 100 % end-2013 end-2014
retail park, Söderhamn Söderhamn Se retail 10,000 100 % 2013 2014
retail park, Gävle, phase II Gävle Se retail 15,800 100 % Continuously Continuously
Shopping centre, Jelenia Góra Jelenia Góra pl retail 7,200 30 % 2013 2015
residential park, Bielany,
remaining phases Warsaw pl residential/services 31,000 100 % Continuously Continuously
Bytom retail park Bytom pl retail 25,800 100 % Continuously Continuously
Shopping centre, Frýdek místek Frýdek místek CZ retail 14,800 100 % 2013 2014
most retail park, phase II most CZ retail 2,000 100 % - -
Property development,
total floor space approx. 373,000 1) Share of profit on development amounts to 70 %.
Project outline
the outline below lists the key projects in the portfolio in the property development segment.

m a n ag e m e n T com m e n Ta ry | A n n uA l r e p o rt 2 0 1 2 / 1 3 | t k D e v e lo pm e n t A / S | 2 9 / 1 2 7
ment handed over the first 13,000 m² phase of the retail park
to an investor in 2010/11. Construction of the second phase of
about 1,800 m², which is fully let (Q1-Q3 2012/13: 100 %) and
tenanted by plantagen, was completed in march 2013, and the
retail park was handed over to the investor after the reporting
date. the total project has been sold to the German investment
fund Commerz real on the basis of forward funding.
P r o j e c T s n oT i n i T i aT e d
broen, shopping centre, esbjerg, denmark
In esbjerg, Denmark, tk Development has bought a plot ear-
marked for a shopping centre project, Broen, of about 29,800
m², to be built on the railway land at esbjerg station. the
shopping centre is expected to comprise about 70 stores.
the current occupancy rate is 75 % (Q1-Q3 2012/13: 75 %),
with tenants including H&m, kvickly, Aldi, Imerco, Skoringen,
Sport-master, Bahne, panduro Hobby, kong kaffe and Gina tri-
cot. the fitness facilities have been let to Fitness World. the
startup of construction has been postponed and is now sched-
uled for mid-2013, rather than early 2013 as most recently an-
nounced. the opening is scheduled for 2015. tk Development
is currently working on the planning, design, startup and sale
of the project.
Østre Teglgade, copenhagen, denmark
tk Development owns an attractively located project area at
teglholmen of about 32,700 m². Current plans involve estab-
lishing a church and possibly a residential care facility. Discus-
sions are also being held with several interested parties regard-
ing the construction of residential property in the project area.
amerika Plads, lots a and c, copenhagen, denmark
kommanditaktieselskabet Danlink udvikling (Dlu), which is
owned 50/50 by udviklingsselskabet By og Havn I/S and tk
Development, owns three projects at Amerika plads: lot A, lot
C and an underground car park. A building complex with about
11,800 m² of office space is to be built on lot A, and a building
complex with about 13,000 m² of commercial and residential
space on lot C. Construction will take place as the space is let.
Østre havn/stuhrs brygge, aalborg, denmark
In the area previously occupied by Aalborg Shipyard at Stuhrs
Brygge, tk Development is developing a business and residen-
tial park of about 72,000 m² through a company jointly owned
with Frederikshavn maritime erhvervspark on a 50/50 basis.
the area was acquired by the jointly owned company, with pay-
ment being effected for the development rights acquired in
step with the development and execution of specific projects.
A new local plan comprising 31,000 m² of housing, offices and
parking facilities has been launched.
retail park, marsvej, randers, denmark
In october 2010, the Group took over a plot of land on marsvej
in randers, intended for a retail development project of 10,000
m². letting has been initiated, and there is a satisfactory level
of interest among potential tenants.
development of town centre, køge, denmark
tk Development is working on a potential project in køge. In
February 2012, køge kyst and tk Development entered into a
conditional agreement under which tk Development is to buy
land for constructing a project of about 27,500 m². the project,
to be built immediately next to køge Station and the town cen-
tre shopping area, comprises retail stores of about 12,000 m2,
public service facilities of about 8,500 m2 including a town hall
and rehabilitation centre, residential premises of about 3,600
m² and office/fitness facilities of about 3,400 m² as well as a
14,000 m² underground car park. the local plan for the area is
to be changed, and a new one expected to be finally adopted in
mid-2013. tk Development expects to enter into an agreement
with køge municipality regarding its takeover of both town hall
and rehabilitation centre. letting of the retail premises has
started, and potential tenants are showing a good amount of
interest in the project.
farum bytorv, extension, farum, denmark
In Farum, tk Development has made a winning bid for an exten-
sion of Farum Bytorv by about 20-30 stores, a total of about
8,000 m². Furesø municipality and tk Development have en-
tered into a conditional purchase agreement about this exten-
sion. A new local plan for the area is to be drawn up. this pro-
cess is under way, and the local plan is expected to be adopted
in mid-2013.
The kulan commercial district, shopping centre and service/
commercial space, gothenburg, sweden
tk Development and the Swedish housing developer Jm AB
have entered into a cooperation agreement with SkF Sverige
AB to develop SkF’s former factory area in the old part of Goth-
enburg. the contemplated project comprises a total floor space
of about 75,000 m²: 30,000 m² for a shopping centre, 15,000
m² for services/commercial use and 30,000 m² for housing. tk
Development will be in charge of developing the 45,000 m² for
a shopping centre, services and commercial facilities, while Jm
AB will have responsibility for the 30,000 m² of housing. the
local plan is being drawn up and is expected to be approved
P R O P E R T y D E v E L O P m E N T
3 0 / 1 2 7 | t k D e v e lo pm e n t A / S | A n n uA l r e p o rt 2 0 1 2 / 1 3 | m a n ag e m e n T com m e n Ta ry
in 2013. the project is being discussed with potential tenants,
and several lease agreements have been concluded.
retail park, barkarby gate, stockholm, sweden
In Barkarby in the northwestern part of Stockholm, tk Develop-
ment has an option on an area for the development of a 20,000
m² retail park. the retail park is expected to consist of 12-14
units, of which 9-10 units will be retail stores. the current occu-
pancy rate is 70 %, and lease agreements have been concluded
with major tenants such as XXl, Clas ohlson, Blomsterlandet
and a fitness chain. the local plan is in place, and the project is
currently being discussed with potential investors. Construction
is expected to start in late 2013, with the opening scheduled for
late 2014.
retail park, phase ii, gävle, sweden
In 2012/13, tk Development sold and handed over an 8,300 m²
retail park in the Swedish town of Gävle to the Swedish proper-
ty company nordika Fastigheter AB. moreover, tk Development
has an option to buy a plot of land for developing additional
retail park premises of about 15,800 m².
shopping centre, jelenia góra, Poland
tk Development has bought a plot of land in Jelenia Góra and
has an option on additional land for the development of a shop-
ping centre of about 24,000 m². the project comprises a su-
permarket of about 2,200 m² and retail, restaurant and service
premises totalling about 21,800 m². the local plan for the area
is in place and the letting of premises has started. Construction
is expected to commence in 2013, and the shopping centre is
scheduled to open in 2015. As mentioned above, an agreement
has been made with Heitman regarding its takeover of 70 % of
the project. the sale was finally completed in December 2012.
tk Development will receive fee income from the jointly owned
company established for developing, letting and managing the
construction of the project.
residential park, bielany, warsaw, Poland
reference is made to “Completed projects” above.
bytom retail Park, bytom, Poland
tk Development intends to develop a retail park with total leas-
able space of about 25,800 m² on its site at the plejada shop-
ping centre in Bytom, which is centrally located in the katowice
region. Construction of the project will be phased in step with
letting. letting efforts are ongoing, and construction will be
started as space is let.
shopping centre, frýdek místek, czech republic
In the Czech town of Frýdek místek, tk Development has an
option to buy a plot of land for building a 14,800 m² shopping
centre, consisting of about 60 stores. the current occupancy
rate is 75 % (Q1-Q3 2012/13: 68 %). lease agreements have
been concluded with such tenants as Billa, Intersport, H&m,
newYorker and euronics. Construction is expected to start in
the course of 2013, with the opening scheduled for 2014.
P R O P E R T y D E v E L O P m E N T

m a n ag e m e n T com m e n Ta ry | A n n uA l r e p o rt 2 0 1 2 / 1 3 | t k D e v e lo pm e n t A / S | 3 1 / 1 2 7
the Group’s secondary business area is asset management,
which consists of owning, operating, running in, maturing and
optimizing completed projects for a medium-long operating pe-
riod whose length matches the potential for adding value both
for the Group and for third parties.
A S S E T m A N A g E m E N T
Owning, operating, maturing and optimizing completed projects for a medium-long operating period that matches the poten-tial for adding value both for the group and for third parties.
strategy for business unit - asset management
• Countries: Dk, Se, pl, CZ• revenue 2012/13: Dkk 434.5 million • Gross profit/loss 2012/13: Dkk -21.0 million• profit/loss before tax and impairment, etc.: Dkk 70.0 million• number of employees at centres, 31 Jan 2013: 12• Balance sheet total, 31 Jan 2013: Dkk 2,100.7 million
asset management
country Type
ownership
interest floor space m2
Investment properties
Futurum Hradec králové CZ Shopping centre 20 % 28,250
Galeria tarnovia, tarnów pl Shopping centre 30 % 16,500
Other completed projects
Sillebroen, Frederikssund Dk Shopping centre 100 % 25,000
Fashion Arena outlet Center, prague CZ outlet centre 75 % 25,000
Galeria Sandecja, nowy Sącz pl Shopping centre 100 % 17,300
ringsted outlet Dk outlet centre 50 % 13,200
most retail park CZ retail park 100 % 6,400
Aabenraa Dk retail park 100 % 4,200
Brønderslev Dk Shopping-street property 100 % 2,400
Total 138,250
The group’s own properties under asset management comprise the following nine properties:
In 2012/13, the gross margin for asset management amounted
to Dkk -21.0 million, of which Dkk 154.4 million represents im-
pairment losses on projects; see the description under “results
for 2012/13 and outlook for 2013/14” above.
Although these properties have been classified under asset
management, tk Development will focus on selling them in
whole or in part, as their sale will substantially strengthen the
Group’s financial platform. therefore, the process of selling a
number of the Group’s completed projects continues. manage-
ment anticipates being able to conclude final sales agreements
for one or more of these properties within a short period of time.
the total portfolio of properties under asset management
amounted to Dkk 1,932.1 million at 31 January 2013, of which
investment properties accounted for Dkk 312.1 million. the op-
eration of these properties, which largely consist of shopping
centres, is generally proceeding satisfactorily. the annual net
rent from the current leases corresponds to a return on the car-
rying amount of 6.7 %. Based on full occupancy, the return on
the carrying amount is expected to reach 7.9 %.
Breakdown of own properties under asset management by
country (carrying amount):
Czech Republic
Denmark
Poland
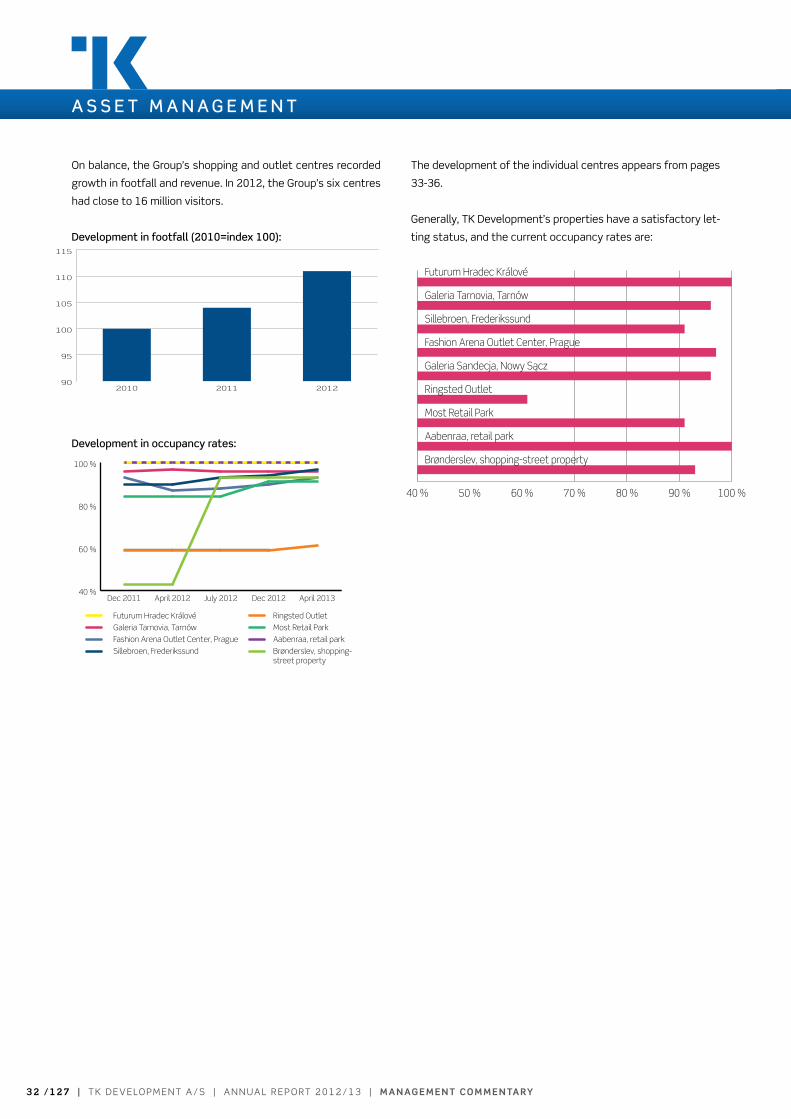
3 2 / 1 2 7 | t k D e v e lo pm e n t A / S | A n n uA l r e p o rt 2 0 1 2 / 1 3 | m a n ag e m e n T com m e n Ta ry
A S S E T m A N A g E m E N T
40 % 50 % 60 % 70 % 80 % 90 % 100 %
Brønderslev, shopping-street property
Aabenraa, retail park
Most Retail Park
Ringsted Outlet
Galeria Sandecja, Nowy Sącz
Fashion Arena Outlet Center, Prague
Sillebroen, Frederikssund
Galeria Tarnovia, Tarnów
Futurum Hradec Králové
on balance, the Group’s shopping and outlet centres recorded
growth in footfall and revenue. In 2012, the Group’s six centres
had close to 16 million visitors.
the development of the individual centres appears from pages
33-36.
Generally, tk Development’s properties have a satisfactory let-
ting status, and the current occupancy rates are:
Fashion Arena Outlet Center, PragueSillebroen, Frederikssund
Galeria Tarnovia, TarnówFuturum Hradec Králové
40 %
60 %
80 %
100 %
Brønderslev, shopping- street property
Aabenraa, retail parkMost Retail ParkRingsted Outlet
April 2013Dec 2012July 2012April 2012Dec 2011
Development in occupancy rates:
90
95
100
105
110
115
201220112010
Development in footfall (2010=index 100):
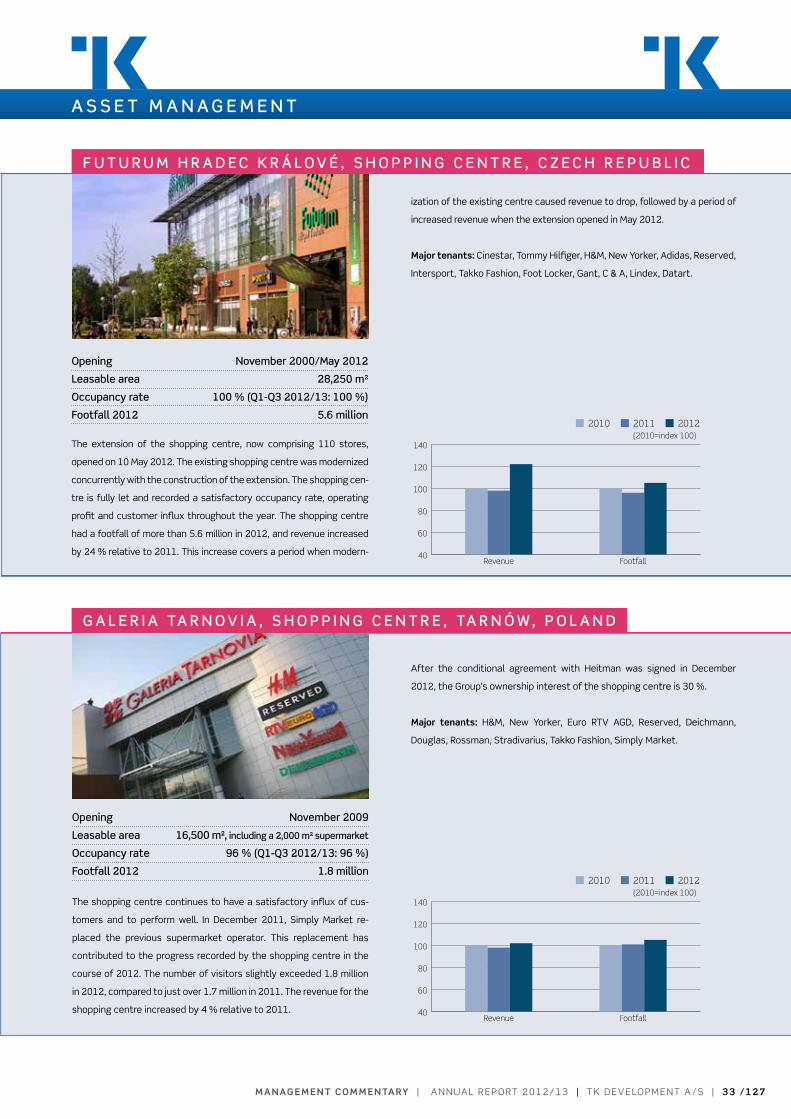
m a n ag e m e n T com m e n Ta ry | A n n uA l r e p o rt 2 0 1 2 / 1 3 | t k D e v e lo pm e n t A / S | 3 3 / 1 2 7
the extension of the shopping centre, now comprising 110 stores,
opened on 10 may 2012. the existing shopping centre was modernized
concurrently with the construction of the extension. the shopping cen-
tre is fully let and recorded a satisfactory occupancy rate, operating
profit and customer influx throughout the year. the shopping centre
had a footfall of more than 5.6 million in 2012, and revenue increased
by 24 % relative to 2011. this increase covers a period when modern-
A S S E T m A N A g E m E N T
f U T U R U m h R A D E C K R á L O v é , S h O P P I N g C E N T R E , C Z E C h R E P U B L I C
g A L E R I A TA R N O v I A , S h O P P I N g C E N T R E , TA R N ó w , P O L A N D
Opening November 2000/may 2012
Leasable area 28,250 m²
Occupancy rate 100 % (Q1-Q3 2012/13: 100 %)
footfall 2012 5.6 million
Opening November 2009
Leasable area 16,500 m², including a 2,000 m² supermarket
Occupancy rate 96 % (Q1-Q3 2012/13: 96 %)
footfall 2012 1.8 million
ization of the existing centre caused revenue to drop, followed by a period of
increased revenue when the extension opened in may 2012.
major tenants: Cinestar, tommy Hilfiger, H&m, new Yorker, Adidas, reserved,
Intersport, takko Fashion, Foot locker, Gant, C & A, lindex, Datart.
the shopping centre continues to have a satisfactory influx of cus-
tomers and to perform well. In December 2011, Simply market re-
placed the previous supermarket operator. this replacement has
contributed to the progress recorded by the shopping centre in the
course of 2012. the number of visitors slightly exceeded 1.8 million
in 2012, compared to just over 1.7 million in 2011. the revenue for the
shopping centre increased by 4 % relative to 2011.
After the conditional agreement with Heitman was signed in December
2012, the Group’s ownership interest of the shopping centre is 30 %.
major tenants: H&m, new Yorker, euro rtv AGD, reserved, Deichmann,
Douglas, rossman, Stradivarius, takko Fashion, Simply market.
40
60
80
100
120
140
FootfallRevenue
2010 20122011(2010=index 100)
40
60
80
100
120
140
FootfallRevenue
2010 20122011(2010=index 100)
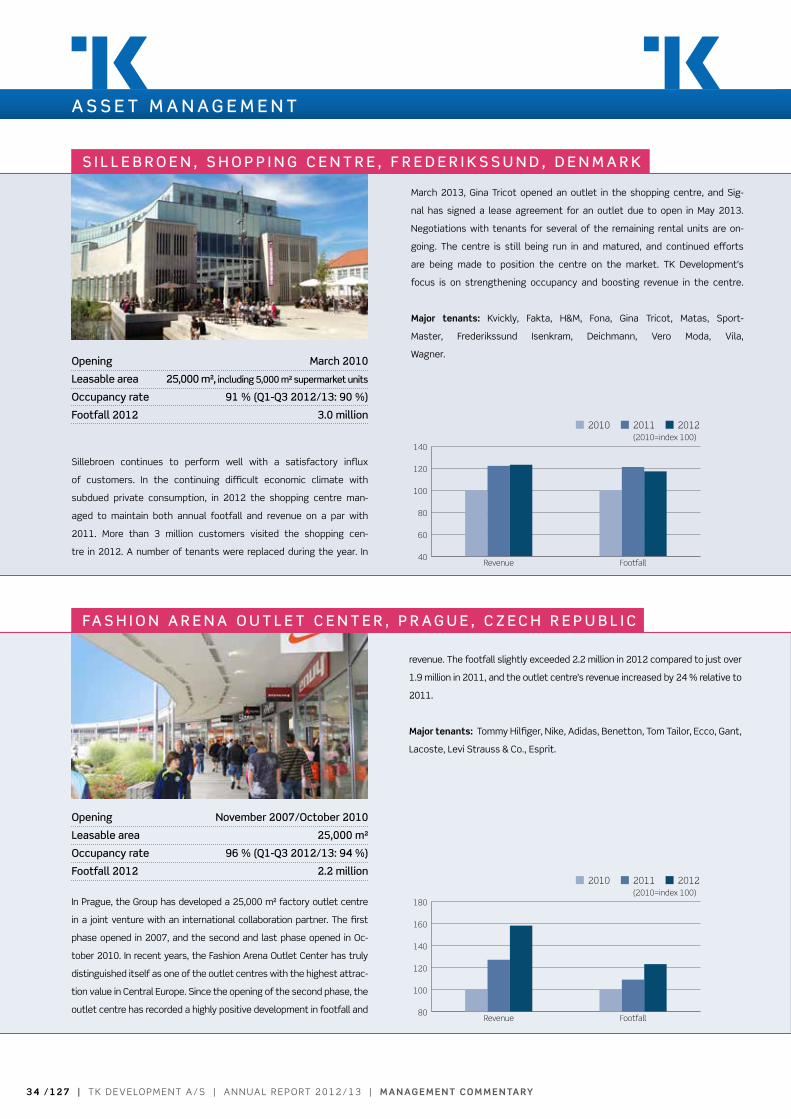
3 4 / 1 2 7 | t k D e v e lo pm e n t A / S | A n n uA l r e p o rt 2 0 1 2 / 1 3 | m a n ag e m e n T com m e n Ta ry
In prague, the Group has developed a 25,000 m² factory outlet centre
in a joint venture with an international collaboration partner. the first
phase opened in 2007, and the second and last phase opened in oc-
tober 2010. In recent years, the Fashion Arena outlet Center has truly
distinguished itself as one of the outlet centres with the highest attrac-
tion value in Central europe. Since the opening of the second phase, the
outlet centre has recorded a highly positive development in footfall and
A S S E T m A N A g E m E N T
S I L L E B R O E N , S h O P P I N g C E N T R E , f R E D E R I K S S U N D , D E N m A R K
fA S h I O N A R E N A O U T L E T C E N T E R , P R A g U E , C Z E C h R E P U B L I C
Opening march 2010
Leasable area 25,000 m², including 5,000 m² supermarket units
Occupancy rate 91 % (Q1-Q3 2012/13: 90 %)
footfall 2012 3.0 million
Opening November 2007/October 2010
Leasable area 25,000 m²
Occupancy rate 96 % (Q1-Q3 2012/13: 94 %)
footfall 2012 2.2 million
Sillebroen continues to perform well with a satisfactory influx
of customers. In the continuing difficult economic climate with
subdued private consumption, in 2012 the shopping centre man-
aged to maintain both annual footfall and revenue on a par with
2011. more than 3 million customers visited the shopping cen-
tre in 2012. A number of tenants were replaced during the year. In
march 2013, Gina tricot opened an outlet in the shopping centre, and Sig-
nal has signed a lease agreement for an outlet due to open in may 2013.
negotiations with tenants for several of the remaining rental units are on-
going. the centre is still being run in and matured, and continued efforts
are being made to position the centre on the market. tk Development’s
focus is on strengthening occupancy and boosting revenue in the centre.
major tenants: kvickly, Fakta, H&m, Fona, Gina tricot, matas, Sport-
master, Frederikssund Isenkram, Deichmann, vero moda, vila,
Wagner.
revenue. the footfall slightly exceeded 2.2 million in 2012 compared to just over
1.9 million in 2011, and the outlet centre’s revenue increased by 24 % relative to
2011.
major tenants: tommy Hilfiger, nike, Adidas, Benetton, tom tailor, ecco, Gant,
lacoste, levi Strauss & Co., esprit.
40
60
80
100
120
140
FootfallRevenue
2010 20122011(2010=index 100)
80
100
120
140
160
180
FootfallRevenue
2010 20122011(2010=index 100)

m a n ag e m e n T com m e n Ta ry | A n n uA l r e p o rt 2 0 1 2 / 1 3 | t k D e v e lo pm e n t A / S | 3 5 / 1 2 7
the operation of Galeria Sandecja is still proceeding satisfactorily. the
shopping centre had a footfall of almost 2.4 million in 2012, slightly
below last year’s figure. nevertheless, the shopping centre’s revenue
rose by about 14 % in 2012 compared to 2011. Generally, revenue has
improved month by month over the year compared to the year before.
the revenue generated by electronics and footwear has shown a par-
ticularly positive trend. moreover, the focus on marketing activities, in-
ringsted outlet has been developed in a 50/50 joint venture with mill-
er Developments, a Scottish factory outlet developer, and consists of
a factory outlet centre and restaurant facilities, with a total floor space
of 13,200 m² and about 1,000 parking spaces. ringsted outlet is Den-
mark’s only genuine outlet village, true to the original outlet concept.
After a long running-in period, ringsted outlet is now beginning to show
its real potential. Despite the difficult letting situation and intensified
competition in the Danish retail trade sector, in 2012 ringsted outlet
A S S E T m A N A g E m E N T
g A L E R I A S A N D E C j A , S h O P P I N g C E N T R E , N O w y S ą C Z , P O L A N D
R I N g S T E D O U T L E T, R I N g S T E D , D E N m A R K
Opening October 2009
Leasable area 17,300 m², including a 5,000 m² hypermarket
Occupancy rate 96 % (Q1-Q3 2012/13: 96 %)
footfall 2012 2.4 million
Opening march 2008
Leasable area 13,200 m²
Occupancy rate 61 % (Q1-Q3 2012/13: 59 %)
footfall 2012 1.1 million
recorded the highest number of visitors and the highest revenue since its open-
ing – more than 1.1 million visitors and a 25 % growth in revenue. However, this
should be viewed in light of the centre’s relatively low revenue the year before.
Several tenants were replaced during the year under review. mango and reebok
made a strategic decision to discontinue their Scandinavian outlet activities
and thus moved out of ringsted outlet. At the same time, agreements have
been made with new tenants, and with four new retail stores opening in spring
2013 – Sparkz, Jackpot, Saint tropez and Superdry – the shopping centre is
anticipated to continue its progress in 2013.
major tenants: Hugo Boss, nike, puma, Diesel, G-Star raw, redgreen, ticket to
Heaven, mcDonald’s, Superdry, le Creuset, levi’s, Sparkz, Jackpot.
cluding attractive bargains for customers, has also contributed to the increased
revenue.
tk Development continues its efforts to optimize the centre and is exploring
various initiatives to help improve operations, footfall and occupancy.
major tenants: Carrefour, H&m, new Yorker, reserved, Deichmann, Douglas,
Camaieu, Carry, euro rtv AGD.
40
60
80
100
120
140
FootfallRevenue
2010 20122011(2010=index 100)
80
100
120
140
160
180
FootfallRevenue
2010 20122011(2010=index 100)
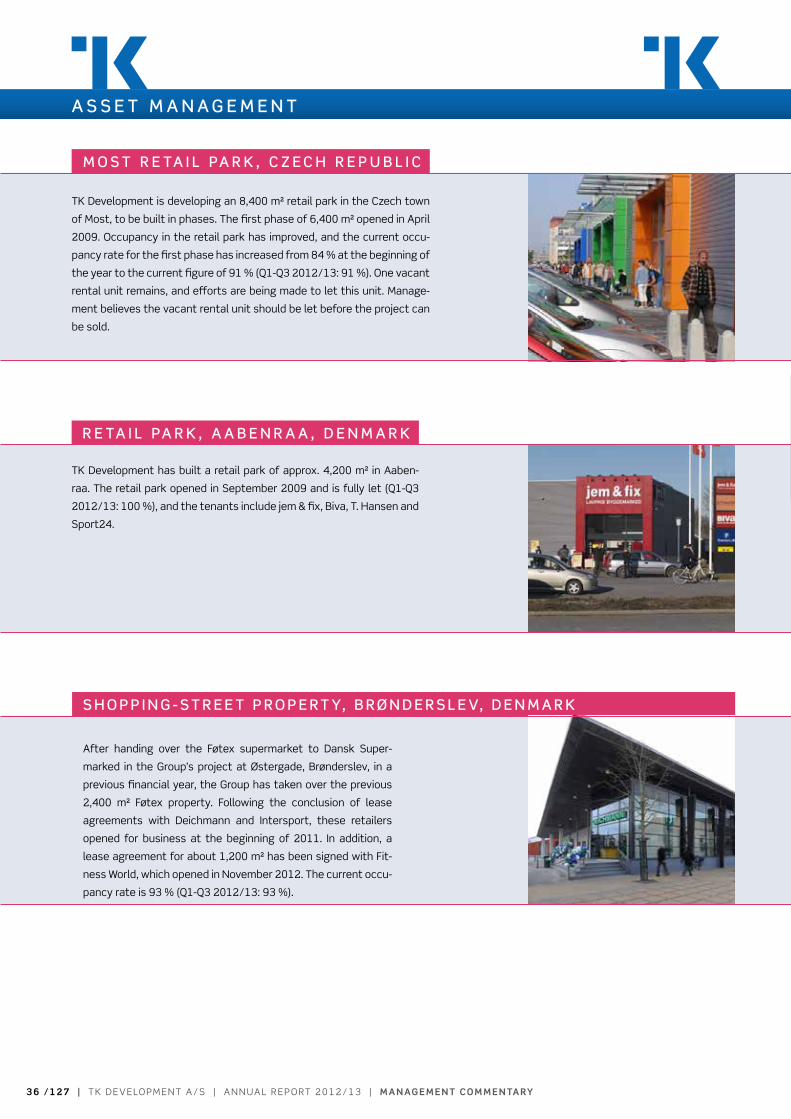
3 6 / 1 2 7 | t k D e v e lo pm e n t A / S | A n n uA l r e p o rt 2 0 1 2 / 1 3 | m a n ag e m e n T com m e n Ta ry
tk Development is developing an 8,400 m² retail park in the Czech town
of most, to be built in phases. the first phase of 6,400 m² opened in April
2009. occupancy in the retail park has improved, and the current occu-
pancy rate for the first phase has increased from 84 % at the beginning of
the year to the current figure of 91 % (Q1-Q3 2012/13: 91 %). one vacant
rental unit remains, and efforts are being made to let this unit. manage-
ment believes the vacant rental unit should be let before the project can
be sold.
tk Development has built a retail park of approx. 4,200 m² in Aaben-
raa. the retail park opened in September 2009 and is fully let (Q1-Q3
2012/13: 100 %), and the tenants include jem & fix, Biva, t. Hansen and
Sport24.
After handing over the Føtex supermarket to Dansk Super-
marked in the Group’s project at Østergade, Brønderslev, in a
previous financial year, the Group has taken over the previous
2,400 m² Føtex property. Following the conclusion of lease
agreements with Deichmann and Intersport, these retailers
opened for business at the beginning of 2011. In addition, a
lease agreement for about 1,200 m² has been signed with Fit-
ness World, which opened in november 2012. the current occu-
pancy rate is 93 % (Q1-Q3 2012/13: 93 %).
A S S E T m A N A g E m E N T
m O S T R E TA I L PA R K , C Z E C h R E P U B L I C
R E TA I L PA R K , A A B E N R A A , D E N m A R K
S h O P P I N g - S T R E E T P R O P E R T y, B R ø N D E R S L E v, D E N m A R K

m a n ag e m e n T com m e n Ta ry | A n n uA l r e p o rt 2 0 1 2 / 1 3 | t k D e v e lo pm e n t A / S | 3 7 / 1 2 7
As described above, management has chosen a market focus
that targets the countries expected to contribute with long-
term, profitable operations in future: Denmark, Sweden, poland
and the Czech republic.
Consequently, management has also decided to phase out the
Group’s activities in Finland, Germany, the Baltic States and
russia. the phase-out, which will result in office closures and
employee dismissals, will be carried out as soon as possible,
while taking into account that all the countries in question have
projects that need to be handled so as to retain as much of the
value of the existing portfolio as possible.
the results of the discontinuing activities before tax amounted
to Dkk -53.7 million in 2012/13 and have been impacted by val-
ue adjustments of Dkk -13.5 million on the German investment
properties, primarily related to ongoing sales negotiations
where management considers it essential to downscale the
German activities. moreover, the results have been affected by
the impairment of a few projects.
g e r m a n y
Following the sale of an investment property in December
2012, the Group now has four investment properties left in Ger-
many, a combined commercial and residential rental property
in lüdenscheid in western Germany and three residential rental
properties on the outskirts of Berlin. After the reporting date,
yet another residential rental property has been sold, and the
Group is negotiating with investors about the sale of one of the
remaining properties.
the Group has generally recorded higher rent levels for the
German residential rental properties as tenants have been re-
placed.
the value of these properties totalled Dkk 167.3 million at 31
January 2013. the valuation of the properties is based on (i) a
return requirement of 6.5 % p.a. calculated on the basis of a
discounted cash-flow model over a ten-year period and (ii) rec-
ognition of the terminal value in year ten. In the cases where
sales negotiations are ongoing with potential investors, these
negotiations form the basis for the valuation.
In addition to these investment properties, the Group owns a
share of a minor shopping centre and a few plots of land.
f i n l a n d
the Group’s activities in Finland are fairly limited and, apart from
a few project opportunities, comprise the projects listed below.
Project
city/
town segment area (m²)
pirkkala retail park, phase II tammerfors retail 5,400
kaarina retail park turku retail 6,600
efforts will be made to phase out the activities in the course of
the current financial year, and the branch office is expected to
close in 2013/14.
b a lT i c s TaT e s
the Group’s Baltic activities comprise the following projects:
Project
city/
country segment area (m²)
Domuspro retail park vilnius (lt) retail 11,300
milgravja Street riga (lv) residential 10,400
ulmana retail park riga (lv) retail 12,500
domusPro retail Park, vilnius, lithuania
tk Development owns a plot of land in vilnius reserved for
building an 11,300 m² retail park. Constructive dialogue has
been established with potential tenants, and binding lease
agreements have been signed for about 53 % of the premises
(Q1-Q3 2012/13: about 50 %). tk Development intends to ex-
ecute this project to best harness its inherent values. Startup
of the construction project, possibly in phases, is scheduled for
spring 2013. negotiations with potential investors for the pro-
ject are ongoing.
efforts will be made to phase out the remaining activities in the
course of the current financial year.
r u s s i a
the Group owns a minor project in moscow, consisting of Scan-
dinavian-style dwellings that are used for rental, mainly to in-
ternational company employees stationed in moscow. efforts
will be made to sell the project as soon as possible.
D I S C O N T I N U I N g A C T I v I T I E S
• Countries: De, FI, lt, lv, ruS
• revenue 2012/13: Dkk 14.4 million
• Gross profit/loss 2012/13: Dkk -36.7 million
• profit/loss before tax and impairment, etc.: Dkk -9.5 million
• no. of employees, 31 Jan 2013: 11
• Balance sheet total, 31 Jan 2013: Dkk 425.4 million
discontinuing activities
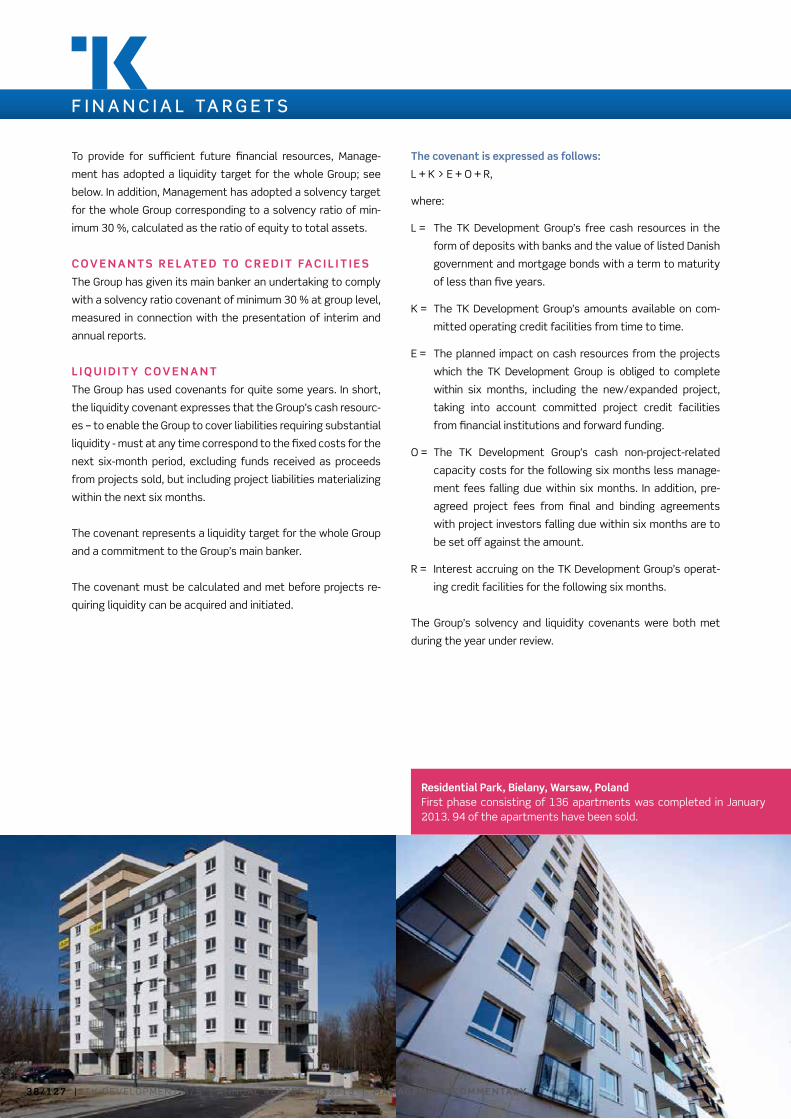
3 8 / 1 2 7 | t k D e v e lo pm e n t A / S | A n n uA l r e p o rt 2 0 1 2 / 1 3 | m a n ag e m e n T com m e n Ta ry
f I N A N C I A L TA R g E T S
to provide for sufficient future financial resources, manage-
ment has adopted a liquidity target for the whole Group; see
below. In addition, management has adopted a solvency target
for the whole Group corresponding to a solvency ratio of min-
imum 30 %, calculated as the ratio of equity to total assets.
c o v e n a n T s r e l aT e d To c r e d i T fac i l i T i e s
the Group has given its main banker an undertaking to comply
with a solvency ratio covenant of minimum 30 % at group level,
measured in connection with the presentation of interim and
annual reports.
l i q u i d i T y c o v e n a n T
the Group has used covenants for quite some years. In short,
the liquidity covenant expresses that the Group’s cash resourc-
es – to enable the Group to cover liabilities requiring substantial
liquidity - must at any time correspond to the fixed costs for the
next six-month period, excluding funds received as proceeds
from projects sold, but including project liabilities materializing
within the next six months.
the covenant represents a liquidity target for the whole Group
and a commitment to the Group’s main banker.
the covenant must be calculated and met before projects re-
quiring liquidity can be acquired and initiated.
The covenant is expressed as follows:
l + k > e + o + r,
where:
l = the tk Development Group’s free cash resources in the
form of deposits with banks and the value of listed Danish
government and mortgage bonds with a term to maturity
of less than five years.
k = the tk Development Group’s amounts available on com-
mitted operating credit facilities from time to time.
e = the planned impact on cash resources from the projects
which the tk Development Group is obliged to complete
within six months, including the new/expanded project,
taking into account committed project credit facilities
from financial institutions and forward funding.
o = the tk Development Group’s cash non-project-related
capacity costs for the following six months less manage-
ment fees falling due within six months. In addition, pre-
agreed project fees from final and binding agreements
with project investors falling due within six months are to
be set off against the amount.
r = Interest accruing on the tk Development Group’s operat-
ing credit facilities for the following six months.
the Group’s solvency and liquidity covenants were both met
during the year under review.
residential Park, bielany, warsaw, PolandFirst phase consisting of 136 apartments was completed in January 2013. 94 of the apartments have been sold.
3 8 / 1 2 7 | t k D e v e lo pm e n t A / S | A n n uA l r e p o rt 2 0 1 2 / 1 3 | m a n ag e m e n T com m e n Ta ry
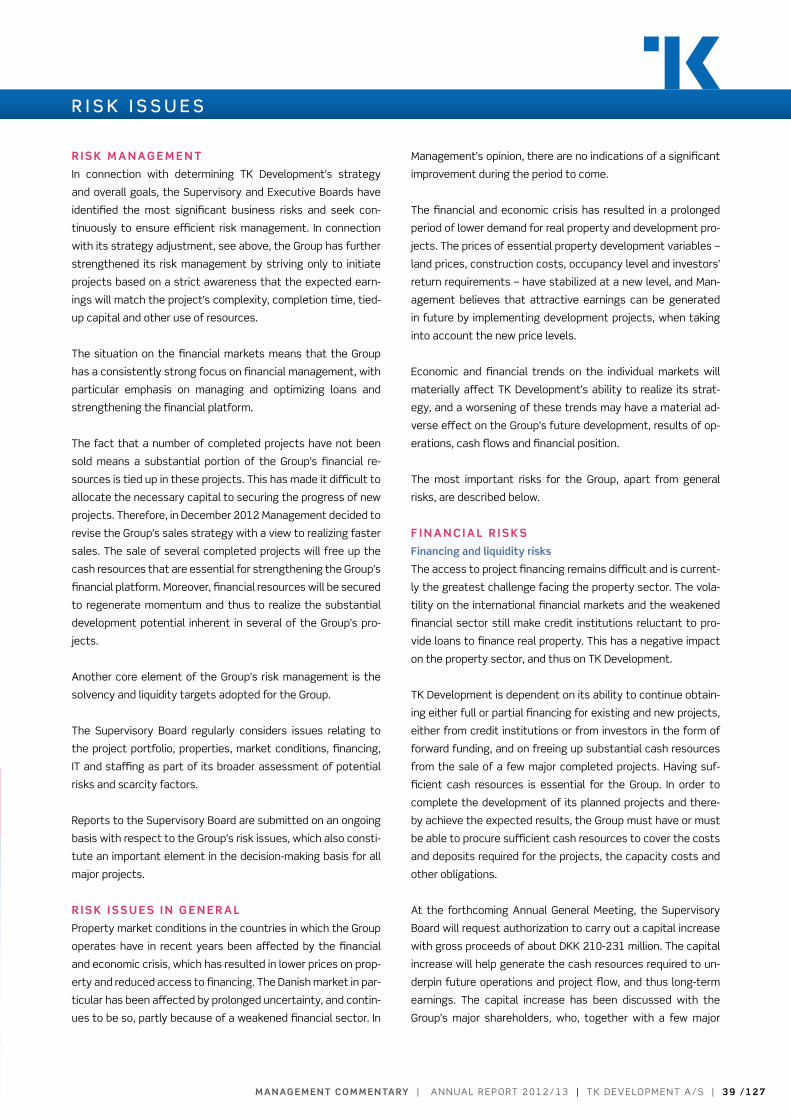
m a n ag e m e n T com m e n Ta ry | A n n uA l r e p o rt 2 0 1 2 / 1 3 | t k D e v e lo pm e n t A / S | 3 9 / 1 2 7
r i s k m a n ag e m e n T
In connection with determining tk Development’s strategy
and overall goals, the Supervisory and executive Boards have
identified the most significant business risks and seek con-
tinuously to ensure efficient risk management. In connection
with its strategy adjustment, see above, the Group has further
strengthened its risk management by striving only to initiate
projects based on a strict awareness that the expected earn-
ings will match the project’s complexity, completion time, tied-
up capital and other use of resources.
the situation on the financial markets means that the Group
has a consistently strong focus on financial management, with
particular emphasis on managing and optimizing loans and
strengthening the financial platform.
the fact that a number of completed projects have not been
sold means a substantial portion of the Group’s financial re-
sources is tied up in these projects. this has made it difficult to
allocate the necessary capital to securing the progress of new
projects. therefore, in December 2012 management decided to
revise the Group’s sales strategy with a view to realizing faster
sales. the sale of several completed projects will free up the
cash resources that are essential for strengthening the Group’s
financial platform. moreover, financial resources will be secured
to regenerate momentum and thus to realize the substantial
development potential inherent in several of the Group’s pro-
jects.
Another core element of the Group’s risk management is the
solvency and liquidity targets adopted for the Group.
the Supervisory Board regularly considers issues relating to
the project portfolio, properties, market conditions, financing,
It and staffing as part of its broader assessment of potential
risks and scarcity factors.
reports to the Supervisory Board are submitted on an ongoing
basis with respect to the Group’s risk issues, which also consti-
tute an important element in the decision-making basis for all
major projects.
r i s k i s s u e s i n g e n e r a l
property market conditions in the countries in which the Group
operates have in recent years been affected by the financial
and economic crisis, which has resulted in lower prices on prop-
erty and reduced access to financing. the Danish market in par-
ticular has been affected by prolonged uncertainty, and contin-
ues to be so, partly because of a weakened financial sector. In
management’s opinion, there are no indications of a significant
improvement during the period to come.
the financial and economic crisis has resulted in a prolonged
period of lower demand for real property and development pro-
jects. the prices of essential property development variables –
land prices, construction costs, occupancy level and investors’
return requirements – have stabilized at a new level, and man-
agement believes that attractive earnings can be generated
in future by implementing development projects, when taking
into account the new price levels.
economic and financial trends on the individual markets will
materially affect tk Development’s ability to realize its strat-
egy, and a worsening of these trends may have a material ad-
verse effect on the Group’s future development, results of op-
erations, cash flows and financial position.
the most important risks for the Group, apart from general
risks, are described below.
f i n a n c i a l r i s k s
financing and liquidity risks
the access to project financing remains difficult and is current-
ly the greatest challenge facing the property sector. the vola-
tility on the international financial markets and the weakened
financial sector still make credit institutions reluctant to pro-
vide loans to finance real property. this has a negative impact
on the property sector, and thus on tk Development.
tk Development is dependent on its ability to continue obtain-
ing either full or partial financing for existing and new projects,
either from credit institutions or from investors in the form of
forward funding, and on freeing up substantial cash resources
from the sale of a few major completed projects. Having suf-
ficient cash resources is essential for the Group. In order to
complete the development of its planned projects and there-
by achieve the expected results, the Group must have or must
be able to procure sufficient cash resources to cover the costs
and deposits required for the projects, the capacity costs and
other obligations.
At the forthcoming Annual General meeting, the Supervisory
Board will request authorization to carry out a capital increase
with gross proceeds of about Dkk 210-231 million. the capital
increase will help generate the cash resources required to un-
derpin future operations and project flow, and thus long-term
earnings. the capital increase has been discussed with the
Group’s major shareholders, who, together with a few major
R I S K I S S U E S
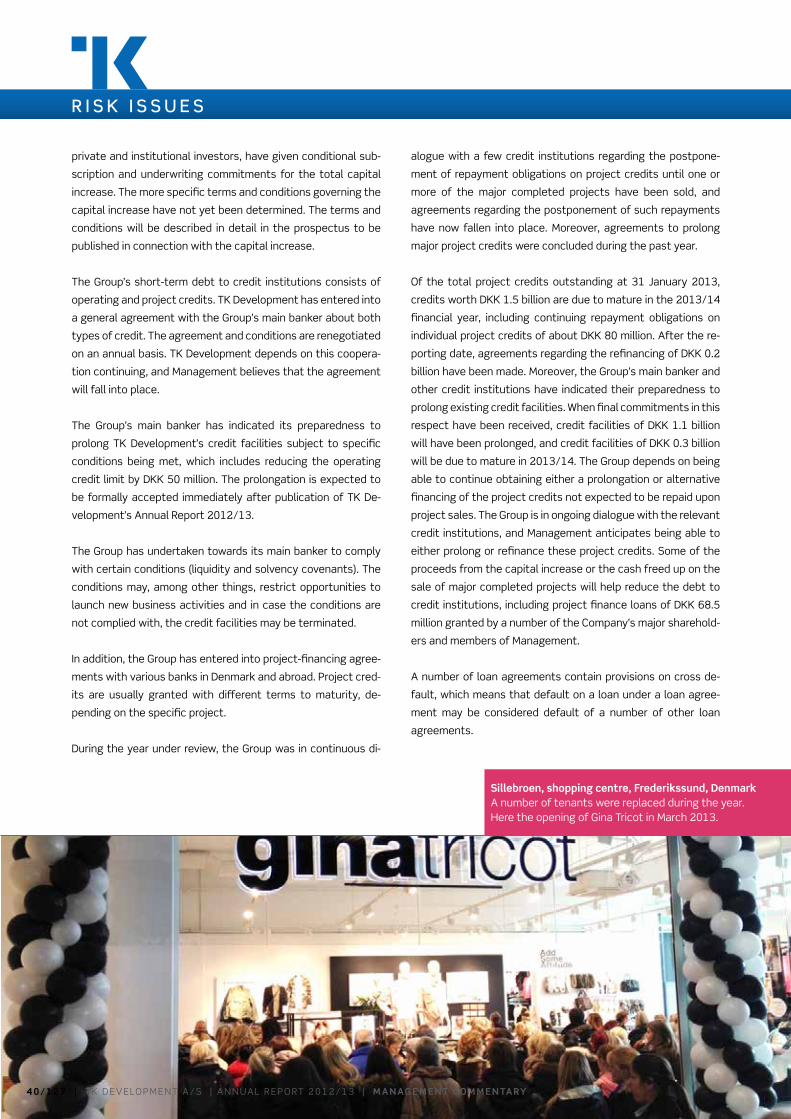
4 0 / 1 2 7 | t k D e v e lo pm e n t A / S | A n n uA l r e p o rt 2 0 1 2 / 1 3 | m a n ag e m e n T com m e n Ta ry
R I S K I S S U E S
private and institutional investors, have given conditional sub-
scription and underwriting commitments for the total capital
increase. the more specific terms and conditions governing the
capital increase have not yet been determined. the terms and
conditions will be described in detail in the prospectus to be
published in connection with the capital increase.
the Group’s short-term debt to credit institutions consists of
operating and project credits. tk Development has entered into
a general agreement with the Group’s main banker about both
types of credit. the agreement and conditions are renegotiated
on an annual basis. tk Development depends on this coopera-
tion continuing, and management believes that the agreement
will fall into place.
the Group’s main banker has indicated its preparedness to
prolong tk Development’s credit facilities subject to specific
conditions being met, which includes reducing the operating
credit limit by Dkk 50 million. the prolongation is expected to
be formally accepted immediately after publication of tk De-
velopment’s Annual report 2012/13.
the Group has undertaken towards its main banker to comply
with certain conditions (liquidity and solvency covenants). the
conditions may, among other things, restrict opportunities to
launch new business activities and in case the conditions are
not complied with, the credit facilities may be terminated.
In addition, the Group has entered into project-financing agree-
ments with various banks in Denmark and abroad. project cred-
its are usually granted with different terms to maturity, de-
pending on the specific project.
During the year under review, the Group was in continuous di-
alogue with a few credit institutions regarding the postpone-
ment of repayment obligations on project credits until one or
more of the major completed projects have been sold, and
agreements regarding the postponement of such repayments
have now fallen into place. moreover, agreements to prolong
major project credits were concluded during the past year.
of the total project credits outstanding at 31 January 2013,
credits worth Dkk 1.5 billion are due to mature in the 2013/14
financial year, including continuing repayment obligations on
individual project credits of about Dkk 80 million. After the re-
porting date, agreements regarding the refinancing of Dkk 0.2
billion have been made. moreover, the Group’s main banker and
other credit institutions have indicated their preparedness to
prolong existing credit facilities. When final commitments in this
respect have been received, credit facilities of Dkk 1.1 billion
will have been prolonged, and credit facilities of Dkk 0.3 billion
will be due to mature in 2013/14. the Group depends on being
able to continue obtaining either a prolongation or alternative
financing of the project credits not expected to be repaid upon
project sales. the Group is in ongoing dialogue with the relevant
credit institutions, and management anticipates being able to
either prolong or refinance these project credits. Some of the
proceeds from the capital increase or the cash freed up on the
sale of major completed projects will help reduce the debt to
credit institutions, including project finance loans of Dkk 68.5
million granted by a number of the Company’s major sharehold-
ers and members of management.
A number of loan agreements contain provisions on cross de-
fault, which means that default on a loan under a loan agree-
ment may be considered default of a number of other loan
agreements.
Ihitatatem fugit mo to ea nisquissero corem volupta
conest, aut qui audanda am eum ellab id.
sillebroen, shopping centre, frederikssund, denmarkA number of tenants were replaced during the year. Here the opening of Gina tricot in march 2013.
4 0 / 1 2 7 | t k D e v e lo pm e n t A / S | A n n uA l r e p o rt 2 0 1 2 / 1 3 | m a n ag e m e n T com m e n Ta ry
m a n ag e m e n T com m e n Ta ry | A n n uA l r e p o rt 2 0 1 2 / 1 3 | t k D e v e lo pm e n t A / S | 4 1 / 1 2 7
many of the Group’s loan agreements contain provisions giving
the banks a discretionary option to terminate the agreement. In
such cases, maintaining financing depends on the bank’s sub-
jective assessment of the quality and profitability of the facility
in question, as well as the value of the security provided by the
Group. If the Group fails to meet its commitments under such
agreements with its banks, the agreements risk being termi-
nated. In all probability, tk Development will not have adequate
capital resources to meet substantial repayment demands.
If the Group is unable to obtain sufficient funding in future, or if
such funding cannot be obtained on viable terms, it could have
a material adverse effect on the Group’s future performance,
results of operations, cash flows and financial position.
interest-rate risks
the main part of the Group’s interest-bearing debt consists of
floating-rate loans. Accordingly, increasing interest rates will
push up the Group’s interest expenses. An interest-rate fluc-
tuation of 1 % will have a direct impact of about Dkk 15 million
on tk Development. In addition, rising interest rates would, all
other things being equal, affect investor return requirements
and by extension real property prices.
currency risks
tk Development’s Danish subsidiaries operate almost exclu-
sively in Dkk, while the foreign subsidiaries generally operate
in their local currency or alternatively eur. As far as possible,
the Group attempts to minimize the currency risk by conclud-
ing related agreements in the same currency. For instance, it
aims to conclude purchase and sales agreements, construction
contracts and financing agreements regarding a single project
in the same currency. Currency fluctuations may materially
affect the Group’s future development, results of operations,
cash flows and financial position. the most important currency
risks are assessed to relate mainly to foreign subsidiaries’ net
results, intercompany balances and foreign-exchange adjust-
ments of the Group’s investments in foreign subsidiaries.
credit risks
tk Development is primarily exposed to credit risks in relation
to the risk of losses on receivables from customers. tk De-
velopment aims to reduce credit risks as much as possible, in
part by obtaining security, primarily from tenants, and in part
by postponing the handover of projects to investors until they
have paid the purchase price. Generally, tk Development does
not experience losses on receivables related to the sale of pro-
jects.
b u s i n e s s r i s k s
Property prices and rental income
the Group is affected by price fluctuations in the various prop-
erty markets in which it operates, as well as by general eco-
nomic trends. part of the Group’s project portfolio and some
of its investment properties have thus been under earnings
pressure during the financial and economic crisis. rent levels
for part of the project portfolio have also been under pressure.
Such fluctuations particularly affect the value of the Group’s
portfolio of land, ongoing and completed projects, investment
properties, and the potential for developing new projects. Fall-
ing prices on land and property and falling rent levels may have
an adverse effect on the Group.
investment properties and completed projects
the Group’s investment properties and completed projects are
essentially subject to the same risks, primarily risks related to
rental conditions and property prices, and their value may de-
cline substantially relative to the carrying amount in the bal-
ance sheet.
Portfolio of land
After the reporting date, the Group adopted a strategy aimed
at reducing the portfolio of projects not initiated (plots of land)
over a two-year period from the current level of Dkk 1.1 billion
to a level of Dkk 0.5 billion. the portfolio can be reduced by
initiating development projects or selling plots of land. the risk
exists that land will be sold at a value lower than its carrying
amount. If planned projects cannot be executed on acquired
sites, it may be necessary to make writedowns for impairment,
which could have a material adverse effect on the Group.
discontinuing activities
After the reporting date, the Group has decided to phase out
its activities in Finland, Germany, the Baltic States and russia.
the phase-out, with resulting office closures and employee dis-
missals, will be carried out as soon as possible and will take into
account that all the countries in question have projects that
need to be handled so as to retain as much of the value of the
existing portfolio as possible. the risk exists that these activ-
ities may be phased out at a value lower than their carrying
amount.
agreements with tenants
moreover, there is a letting risk attaching to those of the
Group’s leases that expire while the Group owns the underlying
investment properties/completed projects. If the Group fails
to renew these agreements, fails to enter into new leases, or
if the agreements can be entered into only on less favourable
R I S K I S S U E S
4 2 / 1 2 7 | t k D e v e lo pm e n t A / S | A n n uA l r e p o rt 2 0 1 2 / 1 3 | m a n ag e m e n T com m e n Ta ry
R I S K I S S U E S
terms and conditions, it could have a material adverse effect
on the Group.
part of the Group’s rental income from tenants includes a reve-
nue-based share. the Group’s total rental income under these
lease agreements depends partly on the tenant’s ability to
maintain a certain amount of revenue in the relevant premis-
es. the share of such revenue-based rent may vary consider-
ably depending on the nature of the brand, the store and the
products. Failure by the tenant to generate sufficient revenue
to trigger the revenue-based share of the overall rental income
could have a material adverse effect on the Group.
development activities
tk Development’s primary business area is property develop-
ment, and the Group functions as the creative liaison between
tenants, investors, architects, construction companies and
other business partners in connection with development of
property projects.
projects are only initiated after a careful assessment of their
earnings potential viewed in light of project complexity, com-
pletion time, tied-up capital, and other use of resources.
Where agreements with investors and contractors, for exam-
ple, have not been brought into alignment, the Group assumes
an extra project development risk in that that it may have to
rectify defects or other matters that the contractor is either
not obliged or not able to address.
Several years back, tk Development adopted a strategy of ex-
ecuting a number of projects for its own account with a view to
changing the Group’s project portfolio from projects requiring
cash flow to projects generating cash flow. not all of these pro-
jects, now completed, have been sold. this means the Group
has a substantial portion of its financial resources tied up in
completed projects. the Group depends on selling several of
its major completed projects to free up the capital required to
secure progress in its new projects.
agreements with investors
the Group’s customers on the investment side are private indi-
viduals, property companies and institutional investors. to the
extent possible, the Group seeks to reduce its working capital
and risks relating to ongoing projects by applying forward fund-
ing from investors, which means that one or more investors un-
dertake to provide funding as project construction progresses.
Before construction starts, the investor and the Group come
to an agreement on a well-defined project. the investor has a
liquidity commitment throughout the construction period and
is consulted on major decisions. these principles ensure that
the Group’s risks from construction startup are largely limited
to the letting risk attaching to any remaining unlet premises
and the risk of construction budget overruns.
In agreements with institutional investors, the overriding risk re-
lates to the Group’s ability to deliver on time and in accordance
with specifications. even though a sales agreement regarding a
project has been concluded, a number of major risks may still
be attached to the project, which could lead to termination of
a sales agreement on account of breach by one of the parties.
In cases where a sales agreement is concluded before all lease
agreements in the project have been finalized, the Group under-
takes a calculated risk that the remaining premises cannot be
let on terms and conditions that ensure a satisfactory return.
the Group also assumes a counterparty risk, including with re-
spect to, but not limited to, tenants and investors.
For such sold projects, construction will not be initiated until
the Group expects to be able to meet the requirements from
the investor which finalize the project sale. meeting these re-
quirements typically falls within the Group’s sphere of compe-
tencies. If the sale nevertheless cannot be completed, it could
have a material adverse effect on the Group’s future perfor-
mance, results of operations, cash flows and financial position.
regulatory approvals
the Group’s future earnings depend on the inflow of new pro-
jects and consequently on the future availability of new build-
ing sites and authority approvals (planning legislation, local
development plans, planning permission, etc.) concerning the
location, size and use of a property. Changes in local plans or
other factors that make obtaining planning permission difficult
or restrict the supply of building sites may have a material ad-
verse effect on the Group.
compliance with time schedules
the Group bases its individual projects on overall and detailed
time schedules. time is a crucial factor in complying with agree-
ments concluded with tenants and investors and a significant
factor in ensuring that the individual projects progress accord-
ing to plan and, accordingly, that the Group generates the
earnings expected. postponing an individual project may, for
instance, mean that lease agreements lapse, tenants become
entitled to compensation and, ultimately, that an investor is no
longer under an obligation to buy the project.

m a n ag e m e n T com m e n Ta ry | A n n uA l r e p o rt 2 0 1 2 / 1 3 | t k D e v e lo pm e n t A / S | 4 3 / 1 2 7
staff matters
the knowledge, experience and network of key employees
constitute some of the Group’s greatest competencies, and
are thus key prerequisites for the Group’s ability to carry on
a profitable business. Accordingly, ensuring these employees’
long-term commitment is a vital parameter for the Group. tk
Development constantly aims to ensure the satisfaction of its
employees and wants to be an appealing employer that can re-
tain and attract new well-qualified staff.
environmental conditions
tk Development is keenly aware that the public eye is sharply
focused on environmental optimization throughout the con-
struction process. public concerns include the reduction of Co2
emissions and the sustainability of building projects.
When the Group acquires sites for its projects, the land is ex-
amined to determine any contamination. If a plot of land is con-
taminated, the Group will clean up the land for its intended use
before starting construction or refrain from buying the relevant
plot.
When developing projects, the Group strives to achieve an op-
timum balance between environmental and social concerns
while also generating revenue for the Group. the choice of ma-
terials, design, energy consumption and environmental impact
all form part of such considerations.
the Group aims to complete projects without causing unneces-
sary environmental impact. tk Development cooperates with
tenants and investors to establish appropriate environmental
solutions when developing and implementing new projects. For
instance, the Group seeks to create finished projects with low
energy consumption and a good indoor climate that will provide
a comfortable working environment for future employees.
Third-party agreements
A major portion of the Group’s business consists of conclud-
ing agreements with development partners, investors, tenants
and contractors for property development projects.
In addition, several cooperation agreements with business
partners contain provisions stipulating that the Group has an
obligation to inject capital into jointly owned companies or oth-
erwise contribute to their financing. If the Group fails to meet
such obligations, including due to a lack of liquidity, the Group
may be bought out by the relevant company at a reduced price
or the Group’s ownership interest may be diluted.
insurance risks
the Group reviews its overall insurance plan at least once a
year, and management believes the Group has necessary and
adequate insurance against all relevant and usual risks. the
Group is not insured against loss, damage or injury caused by
natural disasters (including floods, earthquakes, etc.), wars,
terrorist attacks, etc.
Ta x m aT T e r s fo r T h e g r o u P
deferred tax assets
A deferred tax asset of Dkk 127.0 million is recognized in the
balance sheet at 31 January 2013. the tax asset relates mainly
to tax loss carryforwards in the various subsidiaries. valuation
is based on the existing rules for carrying forward losses and
joint taxation or group contributions and the assumption that
each subsidiary is a going concern. A change in the conditions
and assumptions for carrying forward losses and joint taxation/
group contributions could result in the value of the tax assets
being lower than that computed at 31 January 2013.
management has performed the valuation of the tax asset on
the basis of available budgets and profit forecasts for a five-
year period. For the first three years, budgets are based on an
evaluation of specific projects in the Group’s project portfolio.
For the following two years, the profit forecasts are based on
specific projects in the project portfolio with a longer time ho-
rizon than three years as well as various project opportunities.
this includes making provision for the risk that projects are not
implemented and the risk that project profits fall below expec-
tations.
A change in the conditions and assumptions for budgets and
profit forecasts, including time estimates, could result in the
value of the tax assets being lower than that computed at 31
January 2013, which could have a material adverse effect on
the Group’s results of operations and financial position.
joint taxation
the Group has been jointly taxed with its German subsidiaries
for a number of years. the retaxation balance in respect of the
jointly taxed German companies amounted to Dkk 389.4 million
at 31 January 2013. Full retaxation would trigger a tax charge
of Dkk 97.4 million at 31 January 2013. tax has not been pro-
vided on the retaxation balance, because management does
not plan to make changes in the Group that would result in full
or partial retaxation. If management takes a different view, this
could have a significant adverse effect on the Group’s future
performance, results of operations, cash flows and financial
position.
R I S K I S S U E S
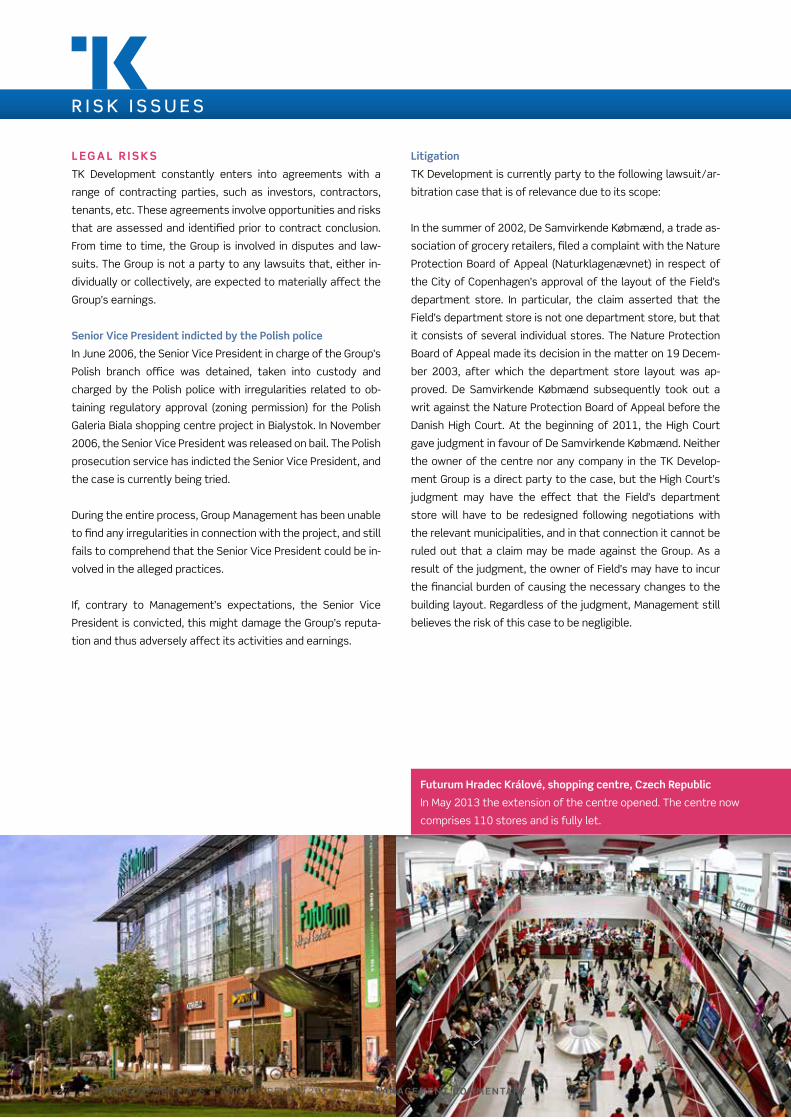
4 4 / 1 2 7 | t k D e v e lo pm e n t A / S | A n n uA l r e p o rt 2 0 1 2 / 1 3 | m a n ag e m e n T com m e n Ta ry
l e g a l r i s k s
tk Development constantly enters into agreements with a
range of contracting parties, such as investors, contractors,
tenants, etc. these agreements involve opportunities and risks
that are assessed and identified prior to contract conclusion.
From time to time, the Group is involved in disputes and law-
suits. the Group is not a party to any lawsuits that, either in-
dividually or collectively, are expected to materially affect the
Group’s earnings.
senior vice President indicted by the Polish police
In June 2006, the Senior vice president in charge of the Group’s
polish branch office was detained, taken into custody and
charged by the polish police with irregularities related to ob-
taining regulatory approval (zoning permission) for the polish
Galeria Biala shopping centre project in Bialystok. In november
2006, the Senior vice president was released on bail. the polish
prosecution service has indicted the Senior vice president, and
the case is currently being tried.
During the entire process, Group management has been unable
to find any irregularities in connection with the project, and still
fails to comprehend that the Senior vice president could be in-
volved in the alleged practices.
If, contrary to management’s expectations, the Senior vice
president is convicted, this might damage the Group’s reputa-
tion and thus adversely affect its activities and earnings.
litigation
tk Development is currently party to the following lawsuit/ar-
bitration case that is of relevance due to its scope:
In the summer of 2002, De Samvirkende købmænd, a trade as-
sociation of grocery retailers, filed a complaint with the nature
protection Board of Appeal (naturklagenævnet) in respect of
the City of Copenhagen’s approval of the layout of the Field’s
department store. In particular, the claim asserted that the
Field’s department store is not one department store, but that
it consists of several individual stores. the nature protection
Board of Appeal made its decision in the matter on 19 Decem-
ber 2003, after which the department store layout was ap-
proved. De Samvirkende købmænd subsequently took out a
writ against the nature protection Board of Appeal before the
Danish High Court. At the beginning of 2011, the High Court
gave judgment in favour of De Samvirkende købmænd. neither
the owner of the centre nor any company in the tk Develop-
ment Group is a direct party to the case, but the High Court’s
judgment may have the effect that the Field’s department
store will have to be redesigned following negotiations with
the relevant municipalities, and in that connection it cannot be
ruled out that a claim may be made against the Group. As a
result of the judgment, the owner of Field’s may have to incur
the financial burden of causing the necessary changes to the
building layout. regardless of the judgment, management still
believes the risk of this case to be negligible.
R I S K I S S U E S
futurum hradec králové, shopping centre, czech republic
In may 2013 the extension of the centre opened. the centre now
comprises 110 stores and is fully let.
4 4 / 1 2 7 | t k D e v e lo pm e n t A / S | A n n uA l r e p o rt 2 0 1 2 / 1 3 | m a n ag e m e n T com m e n Ta ry

m a n ag e m e n T com m e n Ta ry | A n n uA l r e p o rt 2 0 1 2 / 1 3 | t k D e v e lo pm e n t A / S | 4 5 / 1 2 7
s h a r e i n fo r m aT i o n
Stock exchange nASDAQ omX Copenhagen
Index SmallCap
Share capital Dkk 630,985,725
Share denomination Dkk 15
number of shares 42,065,715
Share classes one
number of votes per share one
Bearer security Yes
voting right restrictions no
Share transfer restrictions no
ISIn code Dk0010258995
shareholders and their holdings
the number of registered shareholders decreased from 7,928
at the beginning of the year to 7,396 at the end of the year.
the registered shareholders represented 91.62 % of the share
capital at 31 January 2013 (31 January 2012: 92.36 %).
shareholder composition at 31 january 2013:
Other majorshareholders 26.68 %
Foreignshareholders 9.29 %
Other registeredshareholders 34.87 %
Supervisory and Executive Boards 4.61 %
Non-registered shareholders 8.38 %
Banks, insurance companies and unit trusts 7.17 %
Pension funds 9.00 %
the table below shows the ownership structure of tk Develop-
ment A/S as of today, as reported to nASDAQ omX Copenha-
gen A/S pursuant to section 29 of the Danish Securities trading
Act.
shareholders holding more than 5 %
of the total share capital
ownership
and voting
interest in %
Storm real estate ASA, 100 new Bond Street,
london W1S 1Sp, united kingdom 10.47 %
Dava 1 ApS, c/o kurt Daell, lysagervej 25,
2920 Charlottenlund, Denmark 10.01 %
Strategic Capital ApS, Islands Brygge 79 C,
2300 Copenhagen S, Denmark 9.52 %
S h A R E h O L D E R S
the table below shows a breakdown of shares held by the Su-
pervisory Board and executive Board.
direct and indirect ownership
number of
shares *)
ownership
and voting
interest in %
change for
the year in
number of
shares
Supervisory Board:
niels roth 703,626 1.67 % 0
torsten erik rasmussen 89,140 0.21 % 0
per Søndergaard pedersen 279,508 0.66 % 0
Jesper Jarlbæk 56,900 0.14 % 0
Jens erik Christensen 37,448 0.09 % 0
peter thorsen 415,190 0.99 % 415,190
Executive Board:
Frede Clausen 243,439 0.58 % 0
robert Andersen 115,000 0.27 % 0
Total 1,940,251 4.61 % 415,190
*) the holdings include all shares held by all members of the entire
household as well as companies controlled by the above-named persons.
share price development
on 31 January 2013, tk Development A/S’ shares were listed
at a price of Dkk 12.5 per share with a nominal value of Dkk 15,
equal to a market value of Dkk 526 million.
the price of tk Development A/S shares developed as follows
during the year under review:
140120100
80604020
0
40353025201510
50
Febr
uary
201
2
Mar
ch
Apr
il
May
June July
Aug
ust
Sept
embe
r
Oct
ober
Nov
embe
r
Dec
embe
r
Janu
ary
2013
Share price development (1.2.2012 = Index 100)
Volume of trading, DKKm
volume of trading
During the year under review, the share was traded on 249
days, with a total trading volume of Dkk 154 million against
Dkk 181 million the year before. 4,628 trades were completed
(2011/12: 7,660 trades), covering a total of 11,382,365 shares
(2011/12: 10,343,972 shares).
4 6 / 1 2 7 | t k D e v e lo pm e n t A / S | A n n uA l r e p o rt 2 0 1 2 / 1 3 | m a n ag e m e n T com m e n Ta ry
ca P i Ta l a n d s h a r e s T r u c T u r e
tk Development A/S’ shares are not divided into several share
classes, and no shares are subject to special rights or restric-
tions. each share confers one vote on the holder. tk Develop-
ment’s Articles of Association contain no restrictions govern-
ing share ownership, the number of shares that a shareholder
may hold or share transferability. As all shareholders thus have
equal rights, the Supervisory Board believes that the share
structure chosen is the most appropriate one.
the Company’s management reviews the Group’s capital struc-
ture on a regular basis, as well as the need for any adjustments.
management’s overall aim is to provide a capital structure that
supports the Group’s earnings potential, while at the same
time ensuring the best possible relation between equity and
loan capital and thus maximizing the return for the Company’s
shareholders. In order to strengthen the Group’s financial plat-
form, the Supervisory Board will request authorization at the
forthcoming Annual General meeting to carry out a capital in-
crease with gross proceeds of about Dkk 210-231 million.
s h a r e h o l d e r s ’ ag r e e m e n T s
management is not aware of any shareholders’ agreements
that have been concluded between tk Development A/S’
shareholders.
r u l e s r e g a r d i n g a lT e r aT i o n s To T h e
c o m Pa n y ’ s a rT i c l e s o f a s s o c i aT i o n
the Articles of Association of tk Development A/S can only be
altered following a resolution adopted at a General meeting in
compliance with the Danish Companies Act. requests for the
inclusion of a specific proposal in the agenda of the Annual
General meeting shall be submitted in writing by shareholders
to the Supervisory Board. If the request is submitted no later
than six weeks before the date of the General meeting, the
shareholder is entitled to have the proposal included in the
agenda. If the Supervisory Board receives the request later
than six weeks before the Annual General meeting, the Supervi-
sory Board will determine whether the request has been made
sufficiently early to permit its inclusion in the agenda.
At a General meeting, resolutions can only be adopted in re-
spect of business included in the agenda and any proposed
amendments. If proposals to alter the Articles of Association
are to be considered at a General meeting, the essentials of
such proposals must be stated in the convening notice. A res-
olution to alter the Company’s Articles of Association is sub-
ject to the proposal being adopted by at least two-thirds of the
votes cast as well as of the voting stock represented at the
General meeting.
s h a r e - b a s e d i n c e n T i v e s c h e m e s
2010 scheme
In June 2010, the Supervisory Board granted 100,000 warrants
to the executive Board and 294,000 warrants to other exec-
utive staff members, a total of 394,000 warrants. As a con-
sequence of the capital reduction and capital increase imple-
mented in August 2010, where the subscription price for the
newly issued shares was lower than the market value of the
shares, the Supervisory Board resolved to adjust the number
of warrants allocated and the subscription price for exercising
the warrants. there was a total of 446,315 active warrants at
the reporting date.
under the three-year warrant scheme, warrants can be exer-
cised at the earliest two years after the grant date, and any
shares subscribed for are subject to an additional lock-up pe-
riod of up to two years. Warrants comprised by the incentive
scheme may be exercised within three six-week windows, of
which only one window remains, viz. the six weeks following
publication of the preliminary announcement of financial state-
ments for the 2012/13 financial year.
the subscription price per share of nominally Dkk 15, before
any deduction for dividends, has been fixed at Dkk 26.3 in the
last exercise window.
the Group’s total expenses for the incentive scheme amount to
Dkk 1.9 million, being charged to the income statement over a
period of 22 months.
2011 scheme
In June 2011, the Supervisory Board granted 125,000 warrants
to the executive Board and 375,000 warrants to other execu-
tive staff members, a total of 500,000 warrants. there was a
total of 484,000 active warrants at the reporting date.
under the four-year warrant scheme, warrants can be exercised
at the earliest three years after the grant date, and any shares
subscribed for are subject to an additional lock-up period of up
to two years. Warrants comprised by the incentive scheme may
be exercised during three six-week windows. these six-week
windows are placed thus:
• following publication of the preliminary announcement of
financial statements for the 2013/14 financial year (from
S h A R E h O L D E R S

m a n ag e m e n T com m e n Ta ry | A n n uA l r e p o rt 2 0 1 2 / 1 3 | t k D e v e lo pm e n t A / S | 4 7 / 1 2 7
around 30 April 2014);
• following publication of the interim report for the six-
month period ending 31 July 2014 (from around 30 Sep-
tember 2014); and
• following publication of the preliminary announcement of
financial statements for the 2014/15 financial year (from
around 30 April 2015).
the subscription price per share of nominally Dkk 15, before
any deduction for dividends, has been fixed at Dkk 28.0 in the
first exercise window, Dkk 28.9 in the second window and Dkk
30.2 in the third window.
the Group’s total expenses for the incentive scheme amount to
Dkk 2.0 million, being charged to the income statement over a
period of 35 months.
number of
warrants
2010 scheme
number of
warrants
2011 scheme
Supervisory Board 0 0
Executive Board:
Frede Clausen 57,515 62,500
robert Andersen 57,515 62,500
other executive staff 331,285 359,000
Total 446,315 484,000
d i v i d e n d s a n d d i v i d e n d P o l i cy
tk’ Development’s long-term policy is to distribute a portion
of the year’s profit as dividends or alternatively via a share re-
purchase programme. this will always be done with due regard
for the Group’s capital structure, solvency, cash resources and
investment plans.
a n n u a l g e n e r a l m e e T i n g
the General meeting of shareholders is the supreme authority
in all corporate matters of tk Development A/S, subject to the
limitations provided by Danish law and tk Development A/S’
Articles of Association. the Annual General meeting must be
held in the municipality where tk Development A/S’ registered
office is located sufficiently early to permit compliance with
the Company’s applicable time limits for the holding of General
meetings and the filing of Annual reports. General meetings are
convened by the Supervisory Board. the Annual General meet-
ing will be held at 3 p.m. on 22 may 2013 at Aalborg kongres &
kultur Center, radiosalen, Aalborg.
extraordinary General meetings are held following a resolution
by the shareholders in General meeting or the Supervisory
Board or at the request of the auditors of tk Development A/S
or at the written request of shareholders holding not less than
5 % of the total share capital.
All business transacted at General meetings, with the excep-
tion of alterations to the Articles of Association or a resolu-
tion to dissolve the Company, is decided by a simple majority
of votes unless otherwise provided by current legislation; see
Article 6 of the Company’s Articles of Association.
r eg i s T e r e d s h a r e s
All shares are registered in book-entry form in accounts main-
tained in the computer system of vp Securities A/S, Weideka-
mpsgade 14, po Box 4040, 2300 Copenhagen S, Denmark, and
must be held and managed through a Danish bank or other in-
stitution authorized to be registered as the custodian of the
shares. the shares must be issued to named holders and may
not be transferred to bearer.
T h e s u P e rv i s o ry b oa r d ’ s P o w e r s
Powers to issue new shares
the Supervisory Board is authorized to increase the Company’s
share capital by one or more issues during the period ending on
30 June 2014 by up to nominally Dkk 8,000,000, without any
pre-emptive rights for the Company’s existing shareholders.
moreover, the Supervisory Board is authorized to increase the
Company’s share capital by one or more issues during the peri-
od ending on 30 June 2015 by up to nominally Dkk 7,500,000,
without any pre-emptive rights for the Company’s existing
shareholders. this authorization is to be used for implementing
the capital increases resulting from the exercise of warrants
under the existing incentive schemes. Accordingly, the overall
authorization for the Supervisory Board to subscribe for capital
will amount to 2.4 % of the Company’s share capital. the out-
standing warrants following the adjustment as a result of the
capital reduction and capital increase implemented in August
2010 amount to nominally Dkk 6,694,725 and nominally Dkk
7,260,000, respectively.
Treasury shares
At the Annual General meeting on 25 may 2010, the Superviso-
ry Board was authorized, on behalf of the Company, to acquire
treasury shares having a nominal value of not more than 10
% of the share capital in order to optimize the Group’s capital
structure. the authorization is valid for a period of five years
from the adoption of the resolution at the Annual General
meeting.
S h A R E h O L D E R S
4 8 / 1 2 7 | t k D e v e lo pm e n t A / S | A n n uA l r e p o rt 2 0 1 2 / 1 3 | m a n ag e m e n T com m e n Ta ry
r u l e s o n i n s i d e r T r a d i n g
tk Development’s management and employees are only al-
lowed to trade in the Company’s shares during the six-week
period after the publication of annual and quarterly reports
and any other comprehensive announcements of financial re-
sults. If management or employees are in possession of inside
information that may influence the pricing of tk Development’s
shares, they may not trade in the shares even during the six-
week period. the Company keeps a register of the shares held
by insiders, including any changes in their portfolios, and dis-
closes this information in accordance with existing legislation.
i n v e s To r r e l aT i o n s
tk Development aims to keep its shareholders and investors
up-to-date on all relevant matters.
the Company’s website, www.tk-development.com, includes
all company announcements issued for the past five years,
updated share prices and information about the Group’s pro-
jects in progress. When investor presentations are published
in connection with the announcement of annual and half-year
financial results, they are also made available at the Company’s
website.
moreover, there is a direct link from tk Development A/S’ web-
site to the nASDAQ omX Copenhagen A/S website (www.nas-
daqomxnordic.com), which contains further information about
the tk Development A/S share. reference is also made to the
description of “Corporate Governance” at the Company’s web-
site, www.tk-development.com
f i n a n c i a l c a l e n d a r
Annual report 2012/13 30 April 2013
Annual General meeting 22 may 2013
Interim report Q1 2013/14 25 June 2013
Interim report Q1-Q2 2013/14 26 September 2013
Interim report Q1-Q3 2013/14 18 December 2013
preliminary announcement of financial statements 2013/14 24 April 2014
Annual report 2013/14 1 may 2014
Annual General meeting 26 may 2014
no. date
3 2 Feb 2012 Information about the leading employees’ and their closely related parties’ transactions with tk Development A/S shares and related securities
4 26 Apr 2012 preliminary announcement of financial statements 2011/12
5 1 may 2012 notice convening the Annual General meeting of tk Development A/S
6 23 may 2012 proposal for tk Development’s Supervisory Board to have seven members in future
7 24 may 2012 Annual General meeting of tk Development A/S on 24 may 2012
8 1 Jun 2012 Information about the leading employees’ and their closely related parties’ transactions with tk Development A/S shares and related securities
9 6 Jun 2012 Information about the leading employees’ and their closely related parties’ transactions with tk Development A/S shares and related securities
10 6 Jun 2012 Information about the leading employees’ and their closely related parties’ transactions with tk Development A/S shares and related securities
11 25 Jun 2012 Interim report Q1 2012/13
12 17 Jul 2012 tk development concludes a conditional agreement with Heitman concerning the sale of two polish projects at a total project value of eur 95 million.
13 18 Jul 2012 Information about the leading employees’ and their closely related parties’ transactions with tk Development A/S shares and related securities
14 23 Jul 2012 major shareholder announcement
15 25 Sep 2012 Interim report Q1-Q2 2012/13
16 30 oct 2012 tk Development sells retail park in Gävle, Sweden
17 19 Dec 2012 Interim report Q1-Q3 2012/13
1 8 Jan 2013 Information about the leading employees’ and their closely related parties’ transactions with tk Development A/S shares and related securities
2 9 Jan 2013 Information about the leading employees’ and their closely related parties’ transactions with tk Development A/S shares and related securities
3 21 Jan 2013 Information about the leading employees’ and their closely related parties’ transactions with tk Development A/S shares and related securities
4 24 Jan 2013 Financial calendar
S h A R E h O L D E R S
company announcements
m a n ag e m e n T com m e n Ta ry | A n n uA l r e p o rt 2 0 1 2 / 1 3 | t k D e v e lo pm e n t A / S | 4 9 / 1 2 7
C O R P O R AT E g O v E R N A N C E
tk Development’s Supervisory and executive Boards continue
to focus on the recommendations for corporate governance,
and the Supervisory Board reassesses its policies for compli-
ance with the recommendations at least once a year. In a few
areas, the Company does not comply with the recommenda-
tions, but instead provides an explanation of its reasons for not
complying with a specific recommendation. the Supervisory
Board is of the opinion that tk Development A/S lives up to the
existing recommendations on Corporate Governance.
A detailed review of the Supervisory Board’s policies for com-
pliance with the recommendations issued by the Committee
on Corporate Governance is available at www.tk-development.
com/cg_2012_13
the Committee recommendations not followed are listed be-
low:
corporate social responsibility
In light of the Company’s size and activities and the Group’s
operating markets, the Supervisory Board has decided not to
adopt policies for corporate social responsibility. the Board will
regularly assess the need for policies in this area.
diversity
the limited size of the organization and its division into units
operating in different countries with relatively few employees
in each country mean that the Group is largely compelled to
focus on knowledge, competencies and experience when re-
cruiting and promoting employees. the Supervisory Board ac-
knowledges the importance of the diversity of the Company’s
management and staff and is naturally alert to providing equal
opportunities to both genders. For the reasons set out above,
tk Development has so far chosen not to establish specific
guidelines and objectives for diversity, but after the reporting
date the Company has adopted a policy to ensure the diversity
of its management and staff, including a policy to increase the
share of women at other managerial levels in the Group.
age limit
Setting an age limit for the members of the Supervisory Board
has so far not been considered appropriate by tk Development,
as talents, expertise and experience are weighted higher than
an age criterion. However, to comply with the existing recom-
mendations, management has decided to recommend for adop-
tion at the Annual General meeting on 22 may 2013 that the
Company’s Articles of Association should introduce an age limit
of 70 for Supervisory Board members.
audit committee
the Supervisory Board believes that auditing is an issue that
concerns all board members. For this reason, and given the
complexity of the accounting procedures and the size of the
Supervisory Board, it has been considered appropriate not to
set up an actual audit committee, but to let all board members
function jointly as the audit committee.
nomination committee
the Supervisory Board has decided not to establish a nomina-
tion committee because, given its size, the Supervisory Board
finds that these tasks are best handled by the Board as a whole.
content of remuneration policy
So far, the Supervisory Board has decided not to set limits for
how high a portion of the total remuneration may be constitut-
ed of variable components, as the amount of bonus will only be
paid if a minimum 8 % return on equity is achieved. until further
notice, the amount of bonus is expected to account for a minor
portion only relative to the fixed pay elements.
As bonus is only paid if a minimum 8 % return on equity is
achieved for an individual financial year, the Supervisory board
assesses that the remuneration policy ensures constant align-
ment between the interests of the executive Board and the
shareholders. It has therefore been found unnecessary to es-
tablish criteria ensuring that the vesting period for variable pay
elements, wholly or in part, is longer than one financial year.
T h e s u P e rv i s o ry b oa r d
composition and rules regarding appointments and replace-
ments
According to the Articles of Association, the Supervisory Board
must be composed of not less than four nor more than seven
members. the Supervisory Board is currently composed of six
members elected by the General meeting. management consid-
ers the composition of the Supervisory Board to be appropriate
relative to the Company’s current activities and requirements.
In management’s opinion, the current Supervisory Board mem-
bers have the financial, strategic and commercial expertise re-
quired by an international business such as tk Development.
the members of the Supervisory Board are elected at the Gen-
eral meeting of shareholders to serve for a term of one year
at a time. retiring Supervisory Board members are eligible for
re-election.
the Supervisory Board’s competencies cover a wide spectrum,
including strategic management, international relations, capi-
tal structure, the property sector, the retail trade, risk assess-
5 0 / 1 2 7 | t k D e v e lo pm e n t A / S | A n n uA l r e p o rt 2 0 1 2 / 1 3 | m a n ag e m e n T com m e n Ta ry
ment and control, investor relations, business development as
well as accounting and financial expertise.
the professional qualifications of the Supervisory Board mem-
bers are listed individually under the heading “the Supervisory
Board”.
the Supervisory Board considers all its members, with two ex-
ceptions, to be independent of the Company. torsten erik ras-
mussen is not considered independent as he has held a seat on
the Supervisory Board for more than 12 years, and per Sønder-
gaard pedersen is not considered independent because he was
previously a member of the Company’s executive Board.
self-evaluation
once a year the Supervisory Board systematically evaluates its
work and competencies with a view to continuously improving
and streamlining its work.
the Chairman is in charge of this internal evaluation of the Su-
pervisory Board. to date, the Supervisory Board has chosen to
conduct a qualitative evaluation in the form of interviews and
open, constructive dialogue with all members present at the
same time. the evaluation is based on a predetermined list of
subjects, including communication and collaboration, results
achieved compared to targets set, short- and long-term com-
position of the Supervisory Board, and the competencies of its
members as well as any need for knowledge and skills develop-
ment. other relevant issues are considered on an ad-hoc basis.
the mutual confidence of the members in each other automat-
ically leads to a free exchange of opinions, and each member is
encouraged to take an active part in discussions. If desired by
any member or the Chairman, the members can be interviewed
individually on any specific subject.
the self-evaluation has promoted the further development of
the Group’s strategy, including sharper focus on risk manage-
ment and on improving communication with the market. After
the reporting date, this has for instance translated into a deci-
sion to change the Group’s internal and external reporting.
number of supervisory board meetings
the Supervisory Board held seven board meetings in the
2012/13 financial year.
r e m u n e r aT i o n o f T h e s u P e rv i s o ry b o a r d
the members of the Supervisory Board are paid a fixed fee
and are not covered by the Company’s bonus and incentive
schemes. no separate fee is paid for audit committee work
as all Supervisory Board members sit on this committee. the
remuneration payable to Supervisory Board members consists
of a basic fee. the Chairman is paid three times the basic fee,
while the Deputy Chairman is paid twice the basic fee. As part
of the cost cuts implemented by the Group in January 2012,
the Supervisory Board accepted a 20 % fee reduction, with the
basic fee amounting to Dkk 200,000 in 2012/13. together with
its proposal for adoption of the Annual report for 2012/13, the
Supervisory Board will recommend that the Annual General
meeting adopt a further extraordinary 20 % reduction of the
basic fee, which will thus be fixed at Dkk 160,000 for 2013/14.
r e m u n e r aT i o n o f T h e e x ec u T i v e b oa r d
remuneration policy
every year the Supervisory Board assesses and determines the
remuneration payable to the executive Board members, based
on the recommendation of the Chairman and Deputy Chairman.
the overall pay package and its composition are determined by
the results achieved, the executive Board’s competencies and
the Supervisory Board’s wish to ensure that the Company can
continue to attract, retain and motivate qualified executives.
In this connection, the Supervisory Board takes the Company’s
situation and general development into account. every year,
the Supervisory Board reviews the remuneration payable to the
executive Board by comparing it to that payable to executive
boards of other comparable companies with international ac-
tivities.
the executive Board’s remuneration consists of a fixed and a
variable portion. the variable remuneration consists of a short-
term and a long-term incentive scheme. the overall pay pack-
age consists of a fixed salary, bonus, defined-contribution pen-
sion of 2 % of the basic salary and other benefits, including a
company-provided car, telephone, It solution and newspaper,
as well as health insurance and warrants.
the remuneration policy appears from the Company’s website,
www.tk-development.com
remuneration
the remuneration of the executive Board in 2012/13 was based
on the guidelines adopted at the General meeting in 2011. As
part of the cost cuts implemented by the Group in January
2012, the remuneration of the executive Board was reduced
by 20 % for a 24-month period starting on 1 February 2012.
Warrants were not granted to the executive Board in 2012.
the remuneration of each individual member of the executive
Board appears from the Group’s Annual report. the remunera-
tion for 2013/14 will also be based on the guidelines adopted
C O R P O R AT E g O v E R N A N C E

m a n ag e m e n T com m e n Ta ry | A n n uA l r e p o rt 2 0 1 2 / 1 3 | t k D e v e lo pm e n t A / S | 5 1 / 1 2 7
at the General meeting in 2011, as no changes have been made
to these guidelines. However, a new two-year agreement has
been made with the executive Board, according to which a fur-
ther 20 % of the executive Board’s fixed annual remuneration
will not be paid on an ongoing basis, which will equal a 36 %
reduction compared to the remuneration paid in the 2011/12
financial year, which will apply to the period from 1 may 2013
to 30 April 2015. During that period, the reduced fixed annual
salary will amount to Dkk 2.7 million for Frede Clausen and Dkk
2.1 million for robert Andersen. up to two-thirds of the remu-
neration withheld during the two-year period will nevertheless
be paid when the Group meets specific operational targets,
fixed as part of the previously described two-year transforma-
tion process that consists of realizing the initiatives adopted
under the revised strategy. Warrants will not be granted to the
executive Board in 2013 either.
retention and severance programmes
under the executive Board’s service agreements, the individual
executive Board member may give notice of termination no lat-
er than three months after the occurrence of an extraordinary
event (change of control), such termination to take effect 12
months after notice has been given. the executive Board mem-
ber may demand to be released from his or her duties during
the period of notice, with the usual remuneration being payable
during such period.
the executive Board members are not subject to any other spe-
cial severance terms. the term of notice for executive Board
members is 12 months on the part of the Company and six
months on the part of the member.
It is company policy to ensure that executive Board members
have an incentive to work dedicatedly in the interests of the
Company and its shareholders in the event of a merger, take-
over bid or other extraordinary situations. Against this back-
ground, the Supervisory Board may decide, on the basis of a
specific assessment, to pay a retention bonus whereby exec-
utive Board members receive a special consideration, however,
not exceeding 12 months’ fixed salary, for example in the event
that the Company merges with another company or if another
company takes over all the Company’s activities, subject to the
General meeting’s approval.
i n T e r n a l a u d i T
At least once a year, the Supervisory Board takes a position
on the adequacy of internal control and risk management sys-
tems. Based on the company’s size, complexity and accounting
department organization, the Supervisory Board has so far as-
sessed that internal audits have been unnecessary.
a u d i T c o m m i T T e e
the Supervisory Board believes that auditing is an issue that
concerns all board members. For this reason, and given the
complexity of the accounting procedures, it has been consid-
ered appropriate not to set up an actual audit committee, but
to let all board members function jointly as the audit commit-
tee. the terms of reference of the audit committee have been
laid down, and, basically, four meetings are held each year.
the Company website contains information about the most
important activities during the year, the number of audit com-
mittee meetings held and the terms of reference of the audit
committee.
s TaT u To ry a n n u a l c o r P o r aT e g ov e r n a n -
c e s TaT e m e n T
tk Development has chosen to present its Statutory Annual
Corporate Governance Statement on its website instead of in
the management commentary.
the Corporate Governance Statement is available at www.
tk-development.com/cgs_12_13
C O R P O R AT E g O v E R N A N C E

5 2 / 1 2 7 | t k D e v e lo pm e n t A / S | A n n uA l r e p o rt 2 0 1 2 / 1 3 | m a n ag e m e n T com m e n Ta ry
In addition to carrying on profitable business activities, tk De-
velopment intends to adhere to and expand the Group’s ethical,
social and environmental responsibilities as a business corpo-
ration.
tk Development fundamentally endorses the un’s ten social
responsibility principles, but has not acceded to the un Global
Compact. the Group only carries on activities in countries that
have already incorporated human rights, labour standards and
anti-corruption principles into their national legislation.
the Supervisory Board has not introduced any policies that
integrate corporate social responsibility into the Company’s
strategy and activities.
reference is also made to www.tk-development.com/
CSr_2012_13
S TAT U T O R y A N N U A L C O R P O R AT E S O C I A L R E S P O N S I B I L I T y S TAT E m E N T
barkarby gate, stockholm, swedenDevelopment of a 20,000 m2 retail park. the current occupancy rate is 70 %. opening is scheduled for late 2014.
5 2 / 1 2 7 | t k D e v e lo pm e n t A / S | A n n uA l r e p o rt 2 0 1 2 / 1 3 | m a n ag e m e n T com m e n Ta ry

m a n ag e m e n T com m e n Ta ry | A n n uA l r e p o rt 2 0 1 2 / 1 3 | t k D e v e lo pm e n t A / S | 5 3 / 1 2 7
S TAT U T O R y A N N U A L C O R P O R AT E S O C I A L R E S P O N S I B I L I T y S TAT E m E N T
n a m eTo o k o f f i c e
e n d o f T e r m b i rT h day i n d e P e n d e n c e 1 )
Niels Roth (Chairman) 2007 may 2013 July 1957 Independent
Torsten Erik Rasmussen (Deputy Chairman) 1998 may 2013 June 1944 not independent 2)
Per Søndergaard Pedersen 2002 may 2013 march 1954 not independent 3)
jesper jarlbæk 2006 may 2013 march 1956 Independent
jens Erik Christensen 2010 may 2013 February 1950 Independent
Peter Thorsen 2012 may 2013 march 1966 Independent
1) See section 5.4.1 in the ”recommendations on Corporate Governance” prepared by nASDAQ omX Copenhagen A/S.2) Has held a seat on the Supervisory Board for more than 12 years.3) Was previously a member of the Company’s executive Board.
T h E S U P E R v I S O R y B O A R D

5 4 / 1 2 7 | t k D e v e lo pm e n t A / S | A n n uA l r e p o rt 2 0 1 2 / 1 3 | m a n ag e m e n T com m e n Ta ry
Born July 1957Joined the supervisory board 2007End of term May 2013
education1983 MSc (Economics).
employment1989-2004 CEO of Carnegie Bank, and Group Head of Investment
Banking in the Carnegie Group (2001-2002).1997-2004 Member of the Danish Securities Council.2001-2004 Chairman of the Danish Securities Dealers’ Associati-
on.
special competenciesFinancial markets, capital structure, investment, accounting, inve-stor relations.
executive board memberZira Invest II ApS; Zira Invest III ApS.
supervisory board chairmanFast Ejendom Holding A/S; Foreningen Fast Ejendom Dansk Ejen-domsportefølje f.m.b.a.; Friheden Invest A/S; NPC A/S.
supervisory board memberA/S Rådhusparken; A/S Sadolinparken; Arvid Nilssons Fond; FFH Invest A/S; Investeringsforeningen SmallCap Danmark (Deputy Chairman); Porteføljeselskab A/S (Deputy Chairman); Realdania;SmallCap Danmark A/S (Deputy Chairman).
board committees and other postsNone.
Born June 1944Joined the supervisory board 1998End of term May 2013
education1961-1964 Commercial education, Dalhoff Larsen & Horneman
A/S, Denmark.1964-1966 National service with the Royal Life Guards, dischar-
ged from military service as first lieutenant (R) in 1967.
1972 MBA, IMEDE, Lausanne, Switzerland.1985 International Senior Managers’ Program, Harvard Busi-
ness School, USA.
employment 1967-1971 Head of department and later director of Northern
Soft- & Hardwood Co. Ltd., Congo.1973 Executive secretary, LEGO System A/S, Denmark.1973-1975 Finance manager, LEGOLAND A/S, Denmark.1975-1977 Logistics manager, LEGO System A/S, Denmark.1977-1978 Assistant manager (logistics), LEGO System A/S, Den-
mark.1978-1980 President and CEO, LEGO Overseas A/S, Denmark.1981-1997 Manager and member of Group Management, LEGO
A/S, Denmark.
special competenciesStrategic management, international relations, accounting and finances.
executive board memberMorgan Management ApS.
supervisory board chairmanAcadia Pharmaceuticals A/S; Ball ApS; Ball Holding ApS; Ball Invest ApS; CPD Invest ApS; Oase Outdoors ApS.
supervisory board memberAcadia Pharmaceuticals Inc., USA; Morgan Invest ApS; Schur Inter-national Holding A/S; Vola A/S; Vola Ejendomme ApS; Vola Holding A/S.
board committees and other postsChairman of the Acadia Pharmaceuticals Inc.’s Corporate Gover-nance Committee, USA; Member of the Acadia Pharmaceuticals Inc.’s Compensation Committee, USA.
n i e l s r oT h
Chairman of the Supervisory Board
T o r s T e n e r i k r a s m u s s e n
Deputy Chairman
T h E S U P E R v I S O R y B O A R D
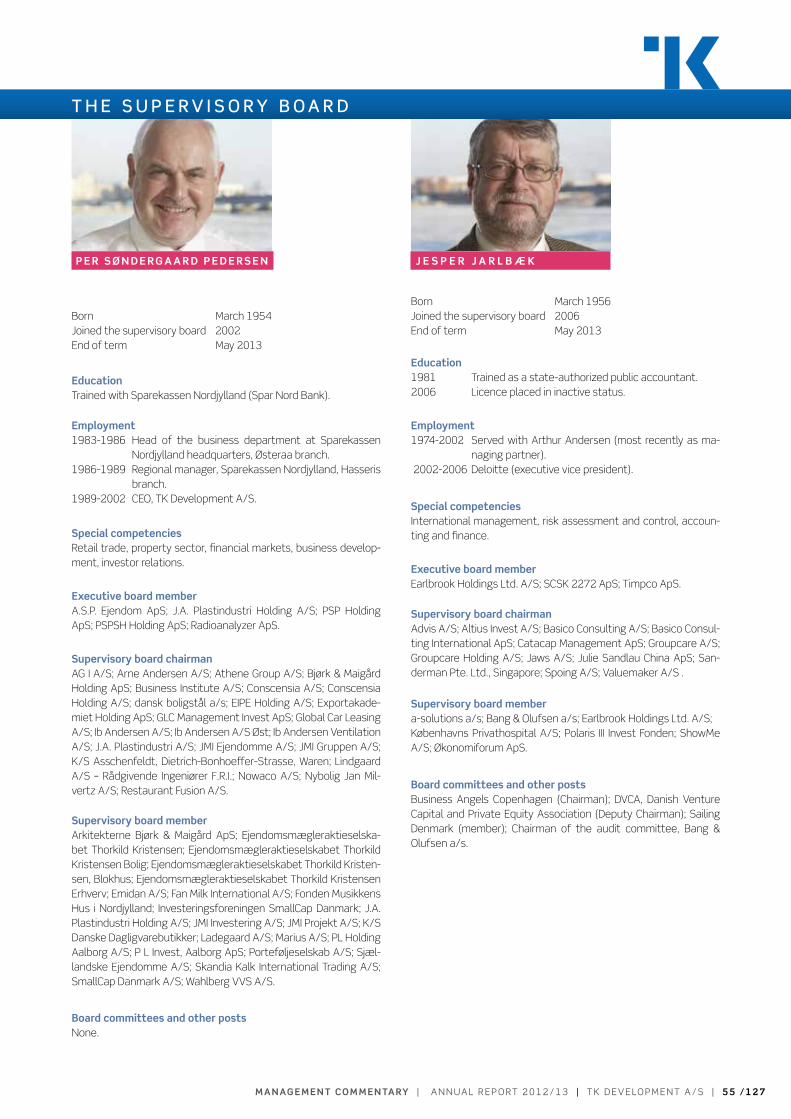
m a n ag e m e n T com m e n Ta ry | A n n uA l r e p o rt 2 0 1 2 / 1 3 | t k D e v e lo pm e n t A / S | 5 5 / 1 2 7
Born March 1954Joined the supervisory board 2002End of term May 2013
educationTrained with Sparekassen Nordjylland (Spar Nord Bank).
employment1983-1986 Head of the business department at Sparekassen
Nordjylland headquarters, Østeraa branch.1986-1989 Regional manager, Sparekassen Nordjylland, Hasseris
branch.1989-2002 CEO, TK Development A/S.
special competenciesRetail trade, property sector, financial markets, business develop-ment, investor relations.
executive board memberA.S.P. Ejendom ApS; J.A. Plastindustri Holding A/S; PSP Holding ApS; PSPSH Holding ApS; Radioanalyzer ApS.
supervisory board chairmanAG I A/S; Arne Andersen A/S; Athene Group A/S; Bjørk & Maigård Holding ApS; Business Institute A/S; Conscensia A/S; Conscensia Holding A/S; dansk boligstål a/s; EIPE Holding A/S; Exportakade-miet Holding ApS; GLC Management Invest ApS; Global Car Leasing A/S; Ib Andersen A/S; Ib Andersen A/S Øst; Ib Andersen Ventilation A/S; J.A. Plastindustri A/S; JMI Ejendomme A/S; JMI Gruppen A/S; K/S Asschenfeldt, Dietrich-Bonhoeffer-Strasse, Waren; Lindgaard A/S – Rådgivende Ingeniører F.R.I.; Nowaco A/S; Nybolig Jan Mil-vertz A/S; Restaurant Fusion A/S.
supervisory board memberArkitekterne Bjørk & Maigård ApS; Ejendomsmægleraktieselska-bet Thorkild Kristensen; Ejendomsmægleraktieselskabet Thorkild Kristensen Bolig; Ejendomsmægleraktieselskabet Thorkild Kristen-sen, Blokhus; Ejendomsmægleraktieselskabet Thorkild Kristensen Erhverv; Emidan A/S; Fan Milk International A/S; Fonden Musikkens Hus i Nordjylland; Investeringsforeningen SmallCap Danmark; J.A. Plastindustri Holding A/S; JMI Investering A/S; JMI Projekt A/S; K/S Danske Dagligvarebutikker; Ladegaard A/S; Marius A/S; PL Holding Aalborg A/S; P L Invest, Aalborg ApS; Porteføljeselskab A/S; Sjæl-landske Ejendomme A/S; Skandia Kalk International Trading A/S; SmallCap Danmark A/S; Wahlberg VVS A/S.
board committees and other postsNone.
Born March 1956Joined the supervisory board 2006End of term May 2013
education1981 Trained as a state-authorized public accountant.2006 Licence placed in inactive status.
employment 1974-2002 Served with Arthur Andersen (most recently as ma-
naging partner). 2002-2006 Deloitte (executive vice president).
special competenciesInternational management, risk assessment and control, accoun-ting and finance.
executive board memberEarlbrook Holdings Ltd. A/S; SCSK 2272 ApS; Timpco ApS.
supervisory board chairmanAdvis A/S; Altius Invest A/S; Basico Consulting A/S; Basico Consul-ting International ApS; Catacap Management ApS; Groupcare A/S; Groupcare Holding A/S; Jaws A/S; Julie Sandlau China ApS; San-derman Pte. Ltd., Singapore; Spoing A/S; Valuemaker A/S .
supervisory board membera-solutions a/s; Bang & Olufsen a/s; Earlbrook Holdings Ltd. A/S;Københavns Privathospital A/S; Polaris III Invest Fonden; ShowMe A/S; Økonomiforum ApS.
board committees and other postsBusiness Angels Copenhagen (Chairman); DVCA, Danish Venture Capital and Private Equity Association (Deputy Chairman); Sailing Denmark (member); Chairman of the audit committee, Bang & Olufsen a/s.
P e r s Ø n d e r g a a r d P e d e r s e n j e s P e r j a r l b æ k
T h E S U P E R v I S O R y B O A R D
5 6 / 1 2 7 | t k D e v e lo pm e n t A / S | A n n uA l r e p o rt 2 0 1 2 / 1 3 | m a n ag e m e n T com m e n Ta ry
Born Febuary 1950Joined the supervisory board 2010End of term May 2013
education1975 MSc (Actuarial Science).
employment1978-1989 Baltica Forsikring.1990-1993 Chief Operating Officer of Danica Liv & Pension.1992-1998 CEO of Codan Forsikring A/S.1998-2003 Managing Director of EMEA, the RS&A Group.1999-2006 CEO of Codan.
special competenciesProperty sector, financial markets, international relations, business development.
executive board memberSapere Aude ApS.
supervisory board chairmanAlpha Holding A/S; ApS Harbro Komplementar-48; Behandlings-vejviseren A/S; Core Strategy Consultants A/S; Dansk Merchant Capital A/S; Ecsact A/S; K/S Habro-Reading, Travelodge; Mediaxes A/S; Scandinavian Private Equity A/S; Skandia A/S; Skandia Link Livsforsikring A/S; Skandia Liv A/S; Skandia Liv A A/S; TA Manage-ment A/S; Vördur tryggingar hf.
supervisory board memberAlpha Insurance A/S; Andersen & Martini A/S; BankNordik A/S (De-puty Chairman); Hugin Expert A/S (Deputy Chairman); Mbox A/S; Nemi Forsikring AS; Nordic Corporate Investments A/S; P/F Trygd; Skandia Asset Management Fondsmæglerselskab A/S; Your Pensi-on Management A/S.
board committees and other postsChairman of Dansk Vejforening (Danish Road Association); Chair-man of the audit committee, Andersen & Martini A/S; Member of the audit committee, Skandia Liv A/S; Member of the Danish Government’s infrastructure commission.
Born March 1966Joined the supervisory board 2012End of term May 2013
education1992 MSc (Business Administration and Auditing).
employment1992-1994 Accountant, More Stevens.1994-1997 Marketing Manager, Group CFO & International Con-
troller, KEW Industri A/S.1997-1997 Finance Manager, Electrolux Hvidevarer A/S.1997-1998 Finance Manager, Marwi International A/S (Incentive
A/S).1998-2000 CEO, Basta Group A/S.2001-2005 CEO, Bison A/S.2005-2008 CEO, Louis Poulsen Lighting A/S.2007-2008 Group Chief Executive, Targetti Poulsen.2008- CEO, EBP Ejendomme A/S, EBP Holding A/S, Kirk &
Thorsen A/S, Kirk & Thorsen Invest A/S and Modulex Holding ApS.
special competenciesStrategic management, accounting and finances, business devel-opment.
executive board memberEBP Holding A/S; EBP Ejendomme A/S; Kirk & Thorsen A/S; Kirk & Thorsen Invest A/S; Modulex Holding ApS.
supervisory board chairmanBiblioteksmedier A/S; Ejendomsselskabet Smedetoften 12 A/S;Invest Marts A/S; Megatherm Energi Invest A/S; Modulex A/S;PFP A/S; Procom A/S; Ravn Arkitektur A/S; Scan Auto & Dybbroe Group A/S; SD Group A/S; VT1 Holding A/S.
supervisory board memberCareitec A/S; Careitec Holding A/S; Claus Heede Holding A/S; EBP Holding A/S; Kirk & Thorsen A/S; Kirk & Thorsen Invest A/S; Ny Droob ApS; Rotation A/S; Starco Europe A/S; Viborg Storcenter A/S.
board committees and other postsMember of the Executive Committee, Sct. Maria Hospice.
j e n s e r i k c h r i s T e n s e n P e T e r T h o r s e n
T h E S U P E R v I S O R y B O A R D

m a n ag e m e n T com m e n Ta ry | A n n uA l r e p o rt 2 0 1 2 / 1 3 | t k D e v e lo pm e n t A / S | 5 7 / 1 2 7
T h E E x E C U T I v E B O A R D
*) the companies form part of the tk Development Group and are partly owned, directly or indirectly, by tk Development A/S.
f r e d e c l a u s e n
President and CEO
r o b e rT a n d e r s e n
Executive vice President
Born July 1959Member of the Executive Board since 1992
executive board memberFrede Clausen Holding ApS.
supervisory board chairmanAhlgade 34-36 A/S*; Ringsted Outlet Center P/S*; SPV Ringsted ApS*; Udviklingsselskabet Nordkranen A/S*
supervisory board memberEuro Mall Luxembourg JV s.à.r.l.*; Euro Mall Ventures s.à r.l.*; Kom-manditaktieselskabet Danlink-Udvikling*; Komplementarselskabet DLU ApS*; K/S Købmagergade 59, st.; Palma Ejendomme A/S; Ho-tel den Gamle Skibssmedie ApS.
board committees and other postsNone.
Born April 1965Member of the Executive Board since 2002
executive board memberRingsted Outlet Center P/S*; Palma Ejendomme A/S; Hotel den Gamle Skibssmedie ApS.
supervisory board chairmanNone.
supervisory board memberAhlgade 34-36 A/S*; Kommanditaktieselskabet Danlink-Udvik-ling*; Kommanditaktieselskabet Østre Havn*; Komplementarsel-skabet DLU ApS*; Ringsted Outlet Center P/S*; SPV Ringsted ApS*; Udviklingsselskabet Nordkranen A/S*; Østre Havn Aalborg ApS*; Palma Ejendomme A/S; Hotel den Gamle Skibssmedie ApS.
board committees and other postsNone.
5 8 / 1 2 7 | t k D e v e lo pm e n t A / S | A n n uA l r e p o rt 2 0 1 2 / 1 3 | sTaT e m e n T by T h e s u P e rv i s o ry a n d e x ec u T i v e b oa r d s
S TAT E m E N T B y T h E S U P E R v I S O R y A N D E x E C U T I v E B O A R D S O N T h E A N N U A L R E P O R T
the Supervisory and executive Boards have today considered
and adopted the 2012/13 Annual report of tk Development
A/S.
the Annual report is presented in accordance with the Interna-
tional Financial reporting Standards (IFrS), as adopted by the
eu, and in accordance with Danish disclosure requirements for
annual reports prepared by listed companies.
In our opinion, the consolidated financial statements and
parent Financial Statements give a true and fair view of the
Group’s and Company’s financial position at 31 January 2013
and of the results of the Group’s and Company’s operations and
cash flows for the financial year from 1 February 2012 to 31
January 2013.
moreover, we consider the management Commentary to give a
fair presentation of the development in the Group’s and Compa-
ny’s activities and financial affairs, the results for the year and
the Group’s and Company’s financial position, as well as a true
and fair description of the most significant risks and elements
of uncertainty faced by the Group and the Company.
We recommend that the 2012/13 Annual report be adopted by
the Annual General meeting of shareholders.
Aalborg, 25 April 2013
e x ec u T i v e b o a r d
s u P e rv i s o ry b o a r d
frede Clausen
president and Ceo
Robert Andersen
excecutive vice president
Torsten Erik Rasmussen
Deputy Chairman
Per Søndergaard Pedersen jesper jarlbæk
Niels Roth
Chairman
jens Erik Christensen Peter Thorsen
i n d e P e n d e n T au d i To r ’ s r e P o rT | A n n uA l r e p o rt 2 0 1 2 / 1 3 | t k D e v e lo pm e n t A / S | 5 9 / 1 2 7
I N D E P E N D E N T A U D I T O R ’ S R E P O R T
To the shareholders of TK Development A/SReport on the consolidated financial statements and parent financial statementsWe have audited the consolidated financial statements and parent finan-
cial statements of tk Development A/S for the financial year 1 February
2012 - 31 January 2013, which comprise the income statement, state-
ment of comprehensive income, balance sheet, statement of changes
in equity, cash flow statement and notes, including the accounting pol-
icies, for the Group as well as for the parent. the consolidated financial
statements and parent financial statements are prepared in accordance
with International Financial reporting Standards as adopted by the eu
and Danish disclosure requirements for listed companies.
management’s responsibility for the consolidated financial statements
and parent financial statements
management is responsible for the preparation of consolidated financial
statements and parent financial statements that give a true and fair
view in accordance with International Financial reporting Standards as
adopted by the eu and Danish disclosure requirements for listed com-
panies and for such internal control as management determines is nec-
essary to enable the preparation and fair presentation of consolidated
financial statements and parent financial statements that are free from
material misstatement, whether due to fraud or error.
Auditor’s responsibility
our responsibility is to express an opinion on the consolidated financial
statements and parent financial statements based on our audit. We
conducted our audit in accordance with International Standards on Au-
diting and additional requirements under Danish audit regulation. this
requires that we comply with ethical requirements and plan and perform
the audit to obtain reasonable assurance about whether the consolidat-
ed financial statements and parent financial statements are free from
material misstatement.
An audit involves performing procedures to obtain audit evidence about
the amounts and disclosures in the consolidated financial statements
and parent financial statements. the procedures selected depend on
the auditor’s judgement, including the assessment of the risks of ma-
terial misstatements of the consolidated financial statements and par-
ent financial statements, whether due to fraud or error. In making those
risk assessments, the auditor considers internal control relevant to the
entity’s preparation of consolidated financial statements and parent fi-
nancial statements that give a true and fair view in order to design audit
procedures that are appropriate in the circumstances, but not for the
purpose of expressing an opinion on the effectiveness of the entity’s
internal control. An audit also includes evaluating the appropriateness
of accounting policies used and the reasonableness of accounting esti-
mates made by management, as well as the overall presentation of the
consolidated financial statements and parent financial statements.
We believe that the audit evidence we have obtained is sufficient and
appropriate to provide a basis for our audit opinion.
our audit has not resulted in any qualification.
OpinionIn our opinion, the consolidated financial statements and parent finan-
cial statements give a true and fair view of the Group’s and the parent’s
financial position at 31 January 2013, and of the results of their opera-
tions and cash flows for the financial year 1 February 2012 - 31 January
2013 in accordance with International Financial reporting Standards as
adopted by the eu and Danish disclosure requirements for listed com-
panies.
Statement on the management commentarypursuant to the Danish Financial Statements Act, we have read the man-
agement commentary. We have not performed any further procedures in
addition to the audit of the consolidated financial statements and par-
ent financial statements.
on this basis, it is our opinion that the information provided in the man-
agement commentary is consistent with the consolidated financial
statements and parent financial statements.
Aalborg, 25 April 2013
NIELSEN & ChRISTENSEN
Statsautoriseret revisionspartnerselskab
johny jensen
State-authorized
public accountant
Jørgen Jensen
State-authorized
public accountant
Copenhagen, 25 April 2013
DELOITTE
Statsautoriseret revisionspartnerselskab
Lars Andersen
State-authorized
public accountant
jan Bo hansen
State-authorized
public accountant
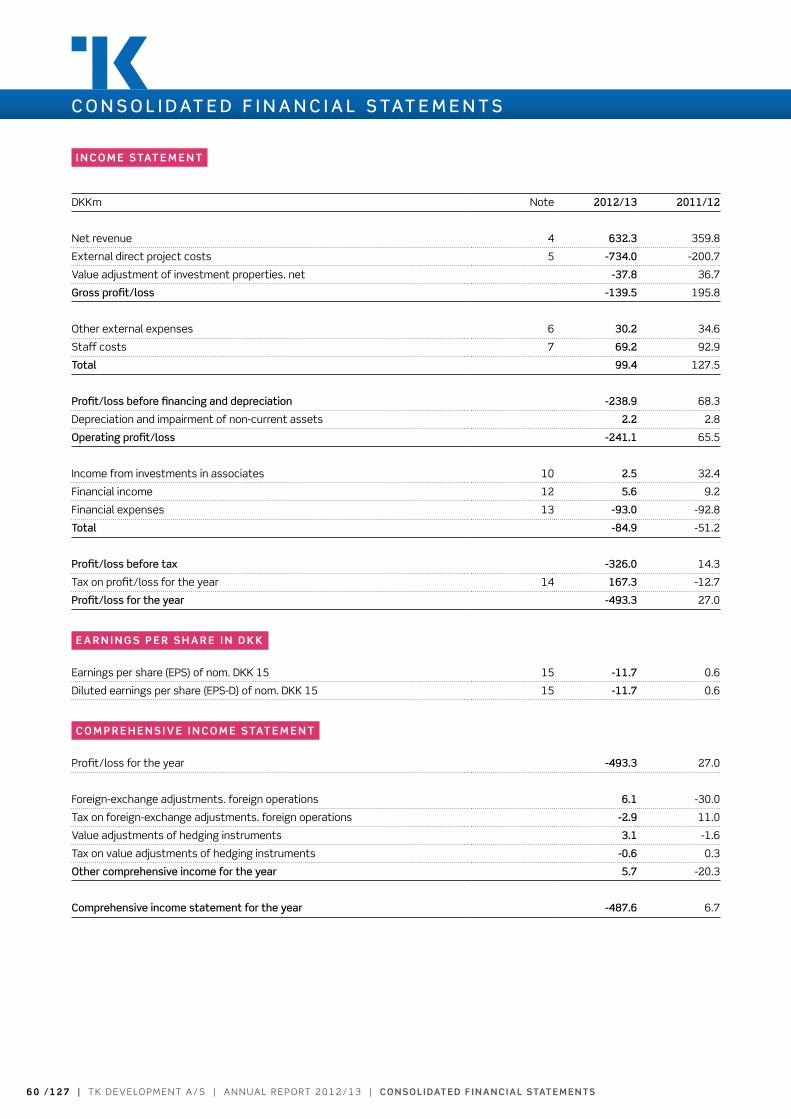
6 0 / 1 2 7 | t k D e v e lo pm e n t A / S | A n n uA l r e p o rt 2 0 1 2 / 1 3 | co n s o l i daT e d f i n a n c i a l sTaT e m e n Ts
i n c o m e s TaT e m e n T
Dkkm note 2012/13 2011/12
net revenue 4 632.3 359.8
external direct project costs 5 -734.0 -200.7
value adjustment of investment properties. net -37.8 36.7
gross profit/loss -139.5 195.8
other external expenses 6 30.2 34.6
Staff costs 7 69.2 92.9
Total 99.4 127.5
Profit/loss before financing and depreciation -238.9 68.3
Depreciation and impairment of non-current assets 2.2 2.8
Operating profit/loss -241.1 65.5
Income from investments in associates 10 2.5 32.4
Financial income 12 5.6 9.2
Financial expenses 13 -93.0 -92.8
Total -84.9 -51.2
Profit/loss before tax -326.0 14.3
tax on profit/loss for the year 14 167.3 -12.7
Profit/loss for the year -493.3 27.0
e a r n i n g s P e r s h a r e i n d k k
earnings per share (epS) of nom. Dkk 15 15 -11.7 0.6
Diluted earnings per share (epS-D) of nom. Dkk 15 15 -11.7 0.6
c o m P r e h e n s i v e i n c o m e s TaT e m e n T
profit/loss for the year -493.3 27.0
Foreign-exchange adjustments. foreign operations 6.1 -30.0
tax on foreign-exchange adjustments. foreign operations -2.9 11.0
value adjustments of hedging instruments 3.1 -1.6
tax on value adjustments of hedging instruments -0.6 0.3
Other comprehensive income for the year 5.7 -20.3
Comprehensive income statement for the year -487.6 6.7
C O N S O L I D AT E D f I N A N C I A L S TAT E m E N T S

co n s o l i daT e d f i n a n c i a l sTaT e m e n Ts | A n n uA l r e p o rt 2 0 1 2 / 1 3 | t k D e v e lo pm e n t A / S | 6 1 / 1 2 7
C O N S O L I D AT E D f I N A N C I A L S TAT E m E N T S
b a l a n c e s h e e T
Dkkm note 31 jan 2013 31 Jan 2012
ASSETS
non-current assets
Goodwill 17 33.3 33.3
Intangible assets 33.3 33.3
Investment properties 18 479.4 366.9
Investment properties under construction 18 16.9 73.6
other fixtures and fittings, tools and equipment 19 2.5 4.7
Property, plant and equipment 498.8 445.2
Investments in associates 10 1.7 0.2
receivables from associates 4.6 2.5
other securities and investments 20 0.8 1.9
Deferred tax assets 21 127.0 291.7
Other non-current assets 134.1 296.3
Total non-current assets 666.2 774.8
current assets
Projects in progress or completed 22 3,030.9 3.498.1
trade receivables 23 73.2 68.4
receivables from associates 19.0 17.9
Contract work in progress 24 0.0 18.2
Corporate income tax receivable 4.0 3.1
other receivables 122.4 131.4
prepayments 22.4 23.3
Total receivables 241.0 262.3
Securities 25 4.3 4.0
Deposits in blocked and escrow accounts 26 35.7 45.2
Cash and cash equivalents 31.2 55.1
Total current assets 3,343.1 3,864.7
ASSETS 4,009.3 4,639.5
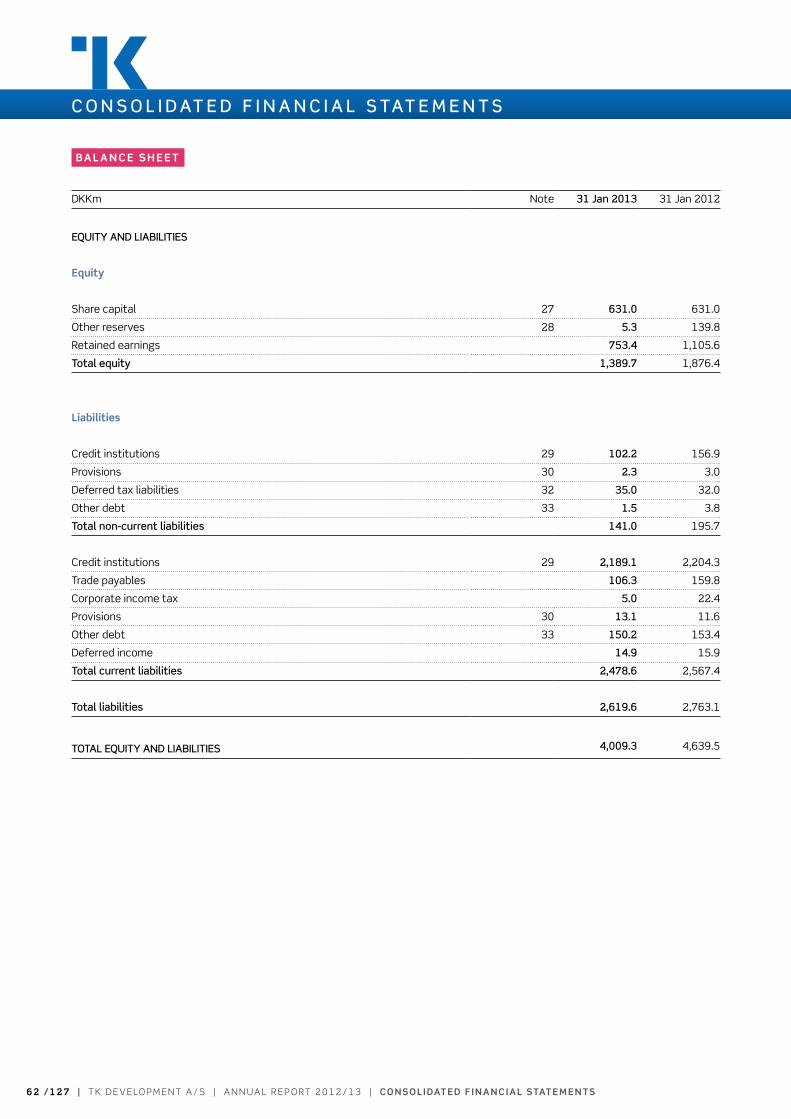
6 2 / 1 2 7 | t k D e v e lo pm e n t A / S | A n n uA l r e p o rt 2 0 1 2 / 1 3 | co n s o l i daT e d f i n a n c i a l sTaT e m e n Ts
C O N S O L I D AT E D f I N A N C I A L S TAT E m E N T S
b a l a n c e s h e e T
Dkkm note 31 jan 2013 31 Jan 2012
EQUITy AND LIABILITIES
equity
Share capital 27 631.0 631.0
other reserves 28 5.3 139.8
retained earnings 753.4 1,105.6
Total equity 1,389.7 1,876.4
liabilities
Credit institutions 29 102.2 156.9
provisions 30 2.3 3.0
Deferred tax liabilities 32 35.0 32.0
other debt 33 1.5 3.8
Total non-current liabilities 141.0 195.7
Credit institutions 29 2,189.1 2,204.3
trade payables 106.3 159.8
Corporate income tax 5.0 22.4
provisions 30 13.1 11.6
other debt 33 150.2 153.4
Deferred income 14.9 15.9
Total current liabilities 2,478.6 2,567.4
Total liabilities 2,619.6 2,763.1
TOTAL EQUITy AND LIABILITIES 4,009.3 4,639.5
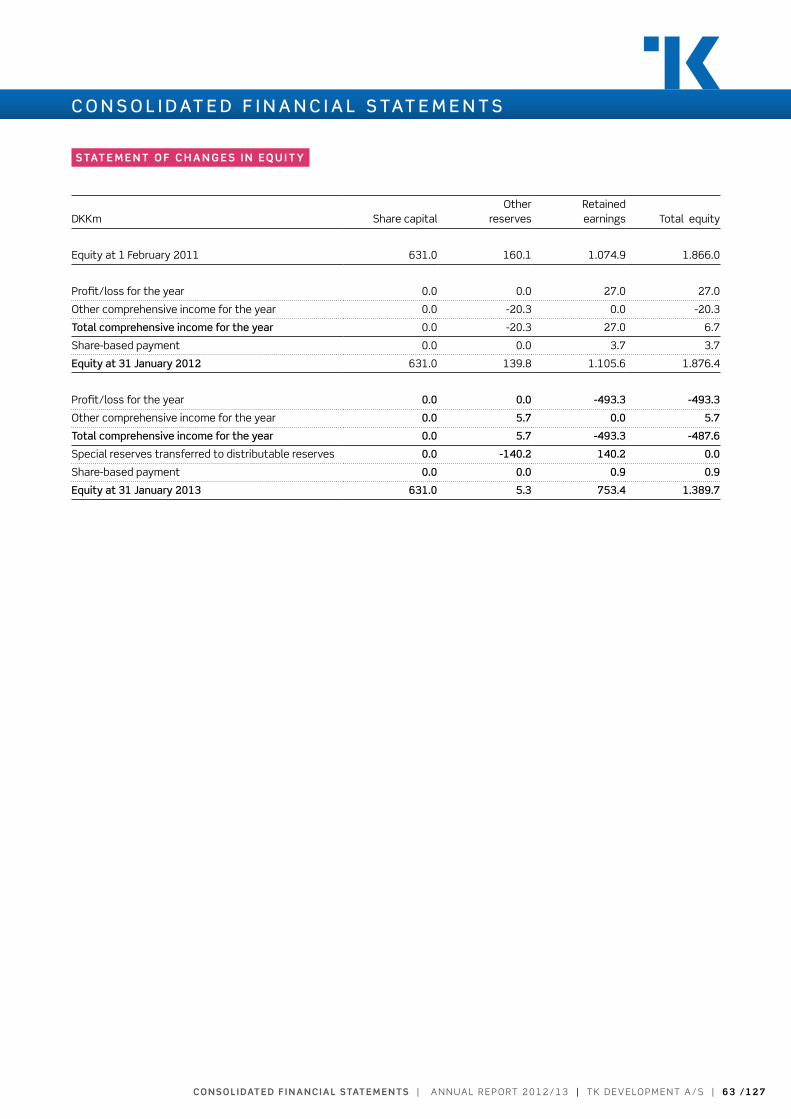
co n s o l i daT e d f i n a n c i a l sTaT e m e n Ts | A n n uA l r e p o rt 2 0 1 2 / 1 3 | t k D e v e lo pm e n t A / S | 6 3 / 1 2 7
C O N S O L I D AT E D f I N A N C I A L S TAT E m E N T S
s TaT e m e n T o f c h a n g e s i n eq u i T y
Dkkm Share capitalother
reservesretained earnings total equity
equity at 1 February 2011 631.0 160.1 1.074.9 1.866.0
profit/loss for the year 0.0 0.0 27.0 27.0
other comprehensive income for the year 0.0 -20.3 0.0 -20.3
Total comprehensive income for the year 0.0 -20.3 27.0 6.7
Share-based payment 0.0 0.0 3.7 3.7
Equity at 31 january 2012 631.0 139.8 1.105.6 1.876.4
profit/loss for the year 0.0 0.0 -493.3 -493.3
other comprehensive income for the year 0.0 5.7 0.0 5.7
Total comprehensive income for the year 0.0 5.7 -493.3 -487.6
Special reserves transferred to distributable reserves 0.0 -140.2 140.2 0.0
Share-based payment 0.0 0.0 0.9 0.9
Equity at 31 january 2013 631.0 5.3 753.4 1.389.7

6 4 / 1 2 7 | t k D e v e lo pm e n t A / S | A n n uA l r e p o rt 2 0 1 2 / 1 3 | co n s o l i daT e d f i n a n c i a l sTaT e m e n Ts
C O N S O L I D AT E D f I N A N C I A L S TAT E m E N T S
ca s h f lo w s TaT e m e n T
Dkkm 2012/13 2011/12
operating profit/loss -241.1 65.5
Adjustments for non-cash items:
value adjustment of investment properties, net 37.8 -36.7
Depreciation and impairment 290.1 2.6
Share-based payment 0.9 3.7
provisions 0.4 -2.5
Foreign-exchange adjustment 7.5 1.9
Increase/decrease in investments in projects, etc. 139.9 -70.9
Increase/decrease in receivables 22.4 57.2
Changes in deposits on blocked and escrow accounts 9.5 18.5
Increase/decrease in payables and other debt -61.1 21.0
Cash flows from operating activities before net financials and tax 206.3 60.3
Interest paid, etc. -142.9 -139.1
Interest received, etc. 4.3 6.4
Corporate income tax paid -22.1 -6.4
Cash flows from operating activities 45.6 -78.8
Investments in equipment, fixtures and fittings -0.2 -0.6
Sale of equipment, fixtures and fittings 0.4 0.1
Investments in investment properties -11.3 -17.4
Sale of investment properties 17.3 0.0
purchase of securities and investments -0.7 0.0
Sale of securities and investments 0.9 27.7
Cash flows from investing activities 6.4 9.8
repayment, long-term financing -0.7 -24.8
raising of long-term financing 13.0 35.7
raising of project financing 149.5 76.4
reduction of project financing/repayments, credit institutions -238.0 -55.0
Cash flows from financing activities -76.2 32.3
Cash flows for the year -24.2 -36.7
Cash and cash equivalents, beginning of year 55.1 96.3
Foreign-exchange adjustment of cash and cash equivalents 0.3 -4.5
Cash and cash equivalents at year-end 31.2 55.1
the figures in the cash flow statement cannot be inferred from the consolidated financial statements alone.
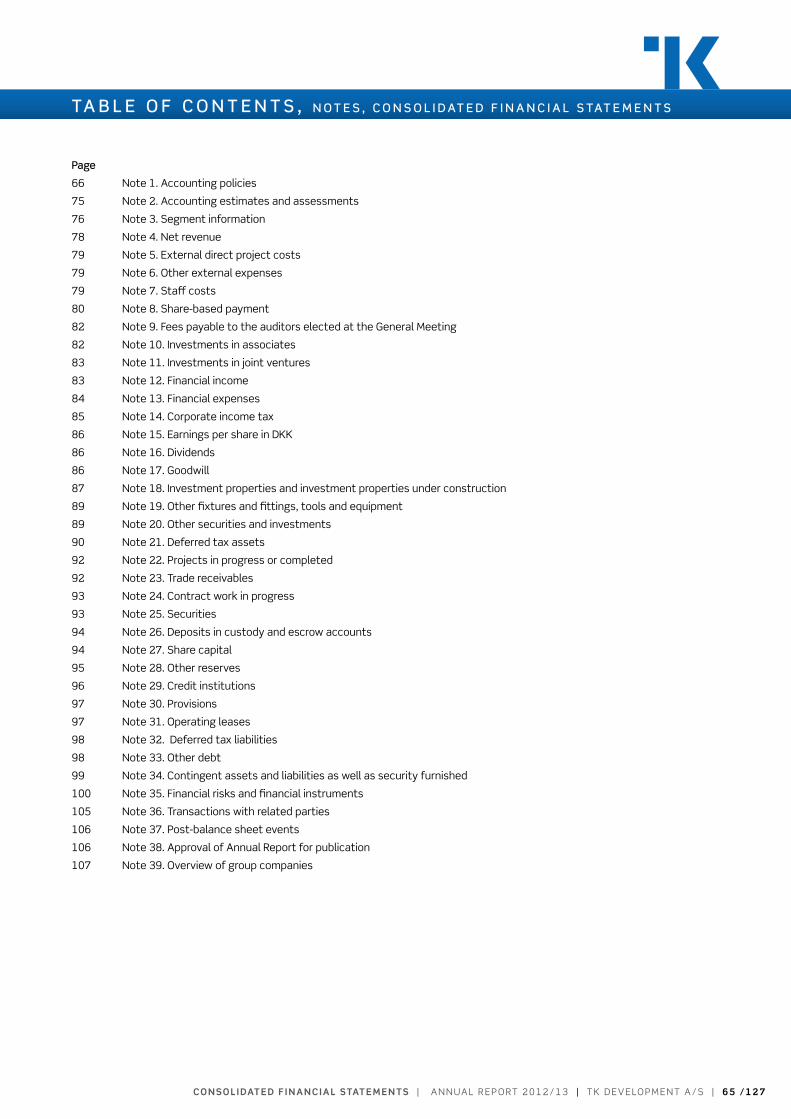
co n s o l i daT e d f i n a n c i a l sTaT e m e n Ts | A n n uA l r e p o rt 2 0 1 2 / 1 3 | t k D e v e lo pm e n t A / S | 6 5 / 1 2 7
TA B L E O f C O N T E N T S , N O T E S , C O N S O L I D AT E D f I N A N C I A L S TAT E m E N T S
Page
66 note 1. Accounting policies
75 note 2. Accounting estimates and assessments
76 note 3. Segment information
78 note 4. net revenue
79 note 5. external direct project costs
79 note 6. other external expenses
79 note 7. Staff costs
80 note 8. Share-based payment
82 note 9. Fees payable to the auditors elected at the General meeting
82 note 10. Investments in associates
83 note 11. Investments in joint ventures
83 note 12. Financial income 84 note 13. Financial expenses
85 note 14. Corporate income tax
86 note 15. earnings per share in Dkk
86 note 16. Dividends
86 note 17. Goodwill
87 note 18. Investment properties and investment properties under construction
89 note 19. other fixtures and fittings, tools and equipment
89 note 20. other securities and investments
90 note 21. Deferred tax assets
92 note 22. projects in progress or completed
92 note 23. trade receivables
93 note 24. Contract work in progress
93 note 25. Securities 94 note 26. Deposits in custody and escrow accounts
94 note 27. Share capital
95 note 28. other reserves
96 note 29. Credit institutions
97 note 30. provisions
97 note 31. operating leases
98 note 32. Deferred tax liabilities
98 note 33. other debt
99 note 34. Contingent assets and liabilities as well as security furnished
100 note 35. Financial risks and financial instruments
105 note 36. transactions with related parties
106 note 37. post-balance sheet events
106 note 38. Approval of Annual report for publication
107 note 39. overview of group companies

6 6 / 1 2 7 | t k D e v e lo pm e n t A / S | A n n uA l r e p o rt 2 0 1 2 / 1 3 | co n s o l i daT e d f i n a n c i a l sTaT e m e n Ts
N O T E S
n oT e 1 . ac c o u n T i n g P o l i c i e s
the consolidated financial statements for 2012/13 for tk De-
velopment A/S are presented in compliance with the Interna-
tional Financial reporting Standards, as adopted by the eu, and
in accordance with Danish disclosure requirements for annual
reports of listed companies; see the executive order on IFrS
issued in pursuance of the Danish Financial Statements Act.
tk Development A/S is a public limited company with its regis-
tered office in Denmark.
the consolidated financial statements also comply with the In-
ternational Financial reporting Standards (IFrS) issued by the
International Accounting Standards Board (IASB).
All figures in the consolidated financial statements are pre-
sented in Dkk million, unless otherwise stated. Dkk is the pres-
entation currency for the Group’s activities and the functional
currency of the parent Company.
the consolidated financial statements are presented on the
basis of historical cost, with the exception of investment prop-
erties, derivative financial instruments and financial assets
classified as available for sale, which are measured at fair value.
i m P l e m e n TaT i o n o f n e w a n d a m e n d e d
f i n a n c i a l r e P o rT i n g s Ta n da r d s a n d i n -
T e r P r e TaT i o n s i s s u e d by i f r i c
the consolidated financial statements for 2012/13 have been
presented in accordance with the financial reporting stand-
ards (IFrS/IAS) and IFrIC interpretations applicable for financial
years beginning at 1 February 2012.
the implementation of new or amended financial reporting
standards and interpretations that entered into force in the
2012/13 financial year has not resulted in any changes to the
accounting policies.
the accounting policies have been consistently applied com-
pared to last year and are set out below.
f i n a n c i a l r e P o rT i n g s Ta n da r d s a n d
i f r i c i n T e r P r e TaT i o n s n oT y e T i n fo r c e
At the date of publication of this Annual report, a number of
new or amended financial reporting standards and IFrIC inter-
pretations had not yet entered into force or been adopted by
the eu. thus, they have not been incorporated into the Annual
report. other than those stated below, none of these stand-
ards and interpretations are expected to materially affect the
annual reports for the next financial years, with the exception
of the additional disclosure requirements following from the rel-
evant standards and interpretations.
IFrS 10, Consolidated Financial Statements (may 2011), replac-
es the section about consolidation and consolidated financial
statements in the present IAS 27, Consolidated and Separate
Financial Statements, and SIC 12, Consolidation – Special pur-
pose entities. In some respects, IFrS 10 contains considerably
more guidance for determining whether control over another
enterprise exists. the standard will become effective for tk De-
velopment A/S for financial years beginning at 1 February 2014
or later. For tk Development A/S, the amendment will mean
that a few enterprises previously consolidated on a pro-rata
basis are to be fully consolidated. the amendment will have ef-
fect on several items in the income statement, assets, equity
and liabilities, and will overall result in an increase of the consol-
idated balance sheet total and of the minority interests’ shares
of consolidated results and equity. the effect has not yet been
finally calculated, as this would require further analysis.
IFrS 11, Joint Arrangements (may 2011), supersedes IAS 31,
Joint ventures. Following the withdrawal of IAS 31, the option of
consolidating joint ventures on a pro-rata basis no longer exists,
and they will subsequently have to be recognized according to
the equity method in compliance with IAS 28, Investments in
Associates and Joint ventures. the standard will become ef-
fective for tk Development A/S for financial years beginning
at 1 February 2014 or later. For tk Development A/S, IFrS 11
means that a number of the Company’s partly-owned enterpris-
es jointly controlled with other parties can no longer be consol-
idated on a pro-rata basis, but must be recognized according to
the equity method instead. the amendment will affect a great
number of items in the income statement, assets, equity and
liabilities, and will overall result in a reduction of the Group’s bal-
ance sheet total. the amendment will not impact consolidated
results or equity. the effect has not yet been finally calculated,
as this would require further analysis.
c o n s o l i daT e d f i n a n c i a l s TaT e m e n T s
the consolidated financial statements comprise the parent
Company, tk Development A/S, and the enterprises controlled
by the parent Company. the parent Company is considered to
exercise control when it holds more than 50 % of the voting
rights, whether directly or indirectly, or otherwise may exercise
or actually exercises control.
enterprises in which the Group holds between 20 % and 50 %
of the voting rights, whether directly or indirectly, and thus has
significant influence, but not a controlling interest, are consid-
ered associates. enterprises jointly controlled with other inves-
co n s o l i daT e d f i n a n c i a l sTaT e m e n Ts | A n n uA l r e p o rt 2 0 1 2 / 1 3 | t k D e v e lo pm e n t A / S | 6 7 / 1 2 7
N O T E S
tors are considered joint ventures.
Consolidated financial statements are prepared on the basis
of the financial statements of the parent Company and its
subsidiaries by adding together items of a uniform nature. the
financial statements on which the consolidated financial state-
ments are based are prepared in accordance with the account-
ing policies applied by the Group. the items in the subsidiaries’
financial statements are fully recognized in the consolidated
financial statements.
on consolidation, intercompany income and expenses, share-
holdings, balances and dividends as well as gains on transac-
tions between consolidated enterprises are eliminated. losses
are eliminated to the extent that no impairment has occurred.
the consolidated financial statements include subsidiaries and
associates throughout the period of ownership.
b u s i n e s s c o m b i n aT i o n s
newly acquired or newly established enterprises are recognized
in the consolidated financial statements as from the date of
acquisition or establishment. the date of acquisition is the date
on which control of the enterprise is effectively transferred to
the acquirer. Sold or wound-up enterprises are recognized in
the consolidated income statement until the date of sale or
winding-up. Comparative figures are not adjusted for newly ac-
quired, sold or wound-up enterprises.
upon the acquisition of new enterprises in which the Group
gains a controlling interest in the acquired enterprise, the pur-
chase method is used, which means that the identifiable as-
sets, liabilities and contingent liabilities of the newly acquired
enterprises are measured at fair value at the acquisition date.
restructuring provisions are only recognized in the transfer
balance sheet if they constitute a liability for the enterprise
acquired. the tax effect of revaluations made is taken into ac-
count.
the purchase consideration for an enterprise consists of the
fair value of the consideration paid for the enterprise acquired.
If the final determination of the consideration depends on one
or more future events, the effect of such events is recognized
at fair value at the acquisition date. Costs directly attributable
to the acquisition are recognized directly in the income state-
ment upon being incurred.
positive balances between (i) the purchase consideration, the
value of any minority interests in the acquired enterprise plus
the fair value of previously acquired equity investments, and (ii)
the fair value of the assets, liabilities and contingent liabilities
acquired are recognized as goodwill in the balance sheet under
intangible assets, and the goodwill amount is subjected to im-
pairment tests at least once a year. If the carrying amount of
the asset exceeds the recoverable amount, it is written down
to the recoverable amount. Any negative balances are recog-
nized as income in the income statement.
For business combinations effected before 1 February 2004,
the accounting classification according to the previous ac-
counting policies has been retained. thus, goodwill from such
business combinations is recognized on the basis of the cost
recognized according to the previous accounting policies, net
of amortization and impairment until 31 January 2004. As of 31
January 2013, the carrying amount of goodwill relating to busi-
ness combinations effected before 1 February 2004 totalled
Dkk 29.1 million.
Gains or losses on the sale or winding-up of subsidiaries and as-
sociates that result in the cessation of control and significant
influence, respectively, are determined as the difference be-
tween (i) the fair value of the sales proceeds or winding-up pro-
ceeds plus the fair value of any remaining equity investments
and (ii) the carrying amount of net assets at the date of sale or
winding-up, including goodwill, less any minority interests. the
gain or loss thus calculated is recognized in the income state-
ment together with accumulated foreign-exchange adjust-
ments previously recognized in other comprehensive income.
a s s o c i aT e s / j o i n T v e n T u r e s i n T h e c o n -
s o l i daT e d f i n a n c i a l s TaT e m e n T s
In the consolidated financial statements, investments in asso-
ciates are recognized and measured according to the equity
method, which means that investments are measured at the
proportionate share of the associates’ carrying amount, deter-
mined according to the Group’s accounting policies, with the
addition of goodwill and plus or less any proportionate inter-
company profits or losses.
the proportionate share of the associate’s results after tax
and the proportionate elimination of unrealized intercompany
profits and losses are recognized in the income statement,
less any impairment of goodwill. the proportionate share of
all transactions and events recognized in the associate’s oth-
er comprehensive income is recognized in consolidated other
comprehensive income.
Investments in associates with a negative equity value are
measured at Dkk 0. receivables and other non-current finan-
cial assets considered to be part of the overall investment in

6 8 / 1 2 7 | t k D e v e lo pm e n t A / S | A n n uA l r e p o rt 2 0 1 2 / 1 3 | co n s o l i daT e d f i n a n c i a l sTaT e m e n Ts
N O T E S
the associate are written down by any remaining negative eq-
uity value. trade receivables and other receivables are written
down to the extent that they are considered uncollectible. A
provision for the remaining negative equity value is only recog-
nized if the Group has a legal or constructive obligation to meet
the relevant associate’s liabilities.
Associates whose activities comprise projects within the
Group’s primary sphere of activity (development and contract
work), and which are managed together with other investors in
accordance with shareholders’ or similar agreements (joint ven-
tures), are included in the consolidated financial statements
by pro-rata consolidation of the associates’ accounting items,
so that a proportionate share, equal to the participation in the
associates, is included in the corresponding items in the consol-
idated financial statements.
T r a n s l aT i o n o f fo r e i g n - c u r r e n cy i T e m s
A functional currency is determined for each of the reporting
enterprises in the Group. the functional currency is the curren-
cy used in the primary economic environment in which the indi-
vidual reporting enterprise operates. transactions in currencies
other than the individual enterprise’s functional currency are
considered foreign-currency transactions and are translated
into the functional currency on initial recognition, based on
the exchange rates ruling at the dates of the transactions. ex-
change differences arising between the exchange rate on the
transaction date and the exchange rate on the payment date
are recognized in the income statement under financial items.
receivables, payables and other monetary items in foreign
currencies that have not been settled by the reporting date
are translated into the functional currency according to the
exchange rates ruling at the reporting date. realized and un-
realized exchange gains and losses are recognized as financial
items in the income statement. property, plant and equipment,
intangible assets, projects in progress or completed and oth-
er non-monetary assets that have been bought in foreign cur-
rencies and are measured on the basis of historical cost are
translated at the exchange rate ruling on the transaction date.
non-monetary items that are revalued at fair value are translat-
ed at the exchange rate ruling on the date of revaluation.
When enterprises that present financial statements in a func-
tional currency other than Danish kroner (Dkk) are recognized
in the consolidated financial statements, items in the income
statement are translated on the basis of the average exchange
rates for the period under review, and items in the balance
sheet (including goodwill) are translated on the basis of the
exchange rates ruling at the reporting date. If the average ex-
change rates for the period under review deviate significantly
from the actual exchange rates at the transaction dates, the
actual exchange rates are used instead.
exchange differences arising on translating foreign enterpris-
es’ beginning-of-year balance sheet items at the exchange
rate ruling at the reporting date and on translating the income
statement items from the average exchange rate for the period
under review to the exchange rate at the reporting date are
recognized in other comprehensive income. exchange differ-
ences arising as a result of changes recognized directly in the
equity of the foreign reporting enterprise are also recognized in
other comprehensive income.
Foreign-exchange adjustments of intercompany accounts
with foreign subsidiaries that are considered part of the par-
ent Company’s total investment in the relevant subsidiary are
recognized in other comprehensive income in the consolidated
financial statements.
When associates/joint ventures that present financial state-
ments in a functional currency other than Dkk are recognized
in the consolidated financial statements, income statement
items are translated on the basis of the average exchange
rates for the period under review, and balance sheet items
are translated on the basis of the exchange rates ruling at the
reporting date. exchange differences arising on translating
foreign enterprises’ beginning-of-year balance sheet items at
the exchange rate ruling at the reporting date and on trans-
lating the income statement items from the average exchange
rate for the period under review to the exchange rate at the
reporting date are recognized in other comprehensive income.
exchange differences arising as a result of changes recognized
directly in the equity of the foreign reporting enterprise are also
recognized in other comprehensive income.
d e r i vaT i v e f i n a n c i a l i n s T r u m e n T s
on initial recognition, derivative financial instruments are meas-
ured at fair value at the settlement date. Costs that are directly
attributable to the purchase or issuance of the individual finan-
cial instrument (transaction costs) are added to the fair value
on initial recognition, unless the financial asset or liability is
measured at fair value with fair-value adjustments recognized
in the income statement.
After initial recognition, the derivative financial instruments are
measured at fair value at the reporting date. positive and neg-
ative fair values of derivative financial instruments are recog-
co n s o l i daT e d f i n a n c i a l sTaT e m e n Ts | A n n uA l r e p o rt 2 0 1 2 / 1 3 | t k D e v e lo pm e n t A / S | 6 9 / 1 2 7
N O T E S
nized under other receivables and other debt.
Changes in the fair value of derivative financial instruments
that are classified as and meet the conditions for the fair-value
hedging of a recognized asset or liability are recognized in the
income statement together with changes in the value of the
hedged asset or liability.
Changes in the fair value of derivative financial instruments
that are classified as and meet the conditions for effective
hedging of future transactions are recognized in other compre-
hensive income. Any ineffective portion is recognized immedi-
ately in the income statement. When the hedged transactions
are realized, the accumulated changes are recognized as part
of the cost of the relevant transactions.
Changes in the fair value of derivative financial instruments
that are used to hedge net investments in foreign subsidiaries
are recognized in the consolidated financial statements under
other comprehensive income in the event of hedge effective-
ness. Any ineffective portion is recognized immediately in the
income statement. When the relevant foreign enterprise is
sold, the accumulated changes in value are transferred to the
income statement.
Derivative financial instruments that do not meet the condi-
tions for treatment as hedging instruments are considered
trading portfolios and are measured at fair value, with fair-val-
ue adjustments being recognized under financial items in the
income statement on a continuing basis.
s h a r e - b a s e d i n c e n T i v e s c h e m e s
the Group’s incentive schemes are equity-based warrant
schemes. the equity-based incentive schemes are measured
at the fair value of the options at the time of allocation and
are recognized in the income statement under staff costs over
the vesting period. the offsetting amount is taken directly to
equity.
In connection with initial recognition of the share options, an
estimate is made of the number of options to which the em-
ployees are expected to become entitled. Subsequently, ad-
justments are made to reflect changes in the estimated num-
ber of vested options, such that the overall recognition is based
on the actual number of vested options.
the fair value of the options allocated is estimated by using
the Black-Scholes formula, based on the parameters indicated
in note 8.
i n c o m e s TaT e m e n T
net revenue
the sales method is used to recognize income on projects sold;
see IAS 18, revenue. thus, profits are recognized once the pro-
ject has been sold, construction completed and all essential el-
ements of the sales agreement fulfilled, including delivery and
transfer of risk to the buyer.
the percentage of completion method is used for projects
meeting the definition of a construction contract; see IAS 11.
thus, the revenue for the year on these projects corresponds
to the selling price of the work performed during the year. the
recognized profit is the estimated profit on the project, calcu-
lated on the basis of its stage of completion. reference is made
to the section “Construction contracts” below.
Where the Group is in charge of development, letting and con-
struction management, etc. on behalf of investors and receives
fee income for such services, the fee income is recognized as
income on a continuous basis in step with the provision of ser-
vices.
Where a sold project consists of several instalment deliveries
that can be segregated and the financial effect can be as-
sessed separately and measured reliably for each delivery, the
profit on the individual instalment delivery is recognized when
all essential elements of the agreement have been fulfilled.
rental income on completed projects and investment proper-
ties is accrued and recognized in accordance with the lease
agreements concluded.
For other income, the sales method is used.
net revenue is measured at the fair value of the consideration
received or receivable. If a sale is based on interest-free credit
with a term extending beyond the usual credit period, the fair
value of the consideration receivable is calculated by discount-
ing future payments. the difference between the fair value and
nominal value of the consideration is recognized as financial in-
come in the income statement over the extended credit period
by using the effective interest method.
construction contracts
When the outcome of a construction contract can be estimat-
ed reliably, net revenue and construction costs are recognized
in the income statement by reference to the stage of comple-
tion of the project at the reporting date (the percentage of
completion method).

7 0 / 1 2 7 | t k D e v e lo pm e n t A / S | A n n uA l r e p o rt 2 0 1 2 / 1 3 | co n s o l i daT e d f i n a n c i a l sTaT e m e n Ts
N O T E S
When the outcome of the construction contract cannot be
measured with a sufficient degree of reliability, the net reve-
nue corresponding to the construction costs incurred during
the period is recognized if it is probable that such costs will be
recoverable.
external direct project costs
this item consists of all costs relating to projects incurred to
generate the year’s revenue and includes direct project costs,
as well as interest during the construction period, plus a share
of the relevant indirect project costs, determined as a per-
centage of staff costs, project materials, cost of premises and
maintenance and depreciation resulting from the project devel-
opment activity and proportionately attributable to the project
development capacity utilized.
moreover, this item includes any impairment losses on projects
in progress or completed and the expensing of project devel-
opment costs to the extent that the relevant projects are not
expected to be realized.
value adjustment of investment properties, etc.
Changes in the fair values of investment properties are recog-
nized in the income statement under the item “value adjust-
ment of investment properties, net”.
realized gains and losses on the sale of investment properties
are determined as the difference between the carrying amount
and the selling price and are also recognized in the income
statement under the item ”value adjustment of investment
properties, net”.
other external expenses
the item “other external expenses” includes costs for adminis-
tration, cost of premises and operating expenses for cars.
income from investments in associates in the consolidated
financial statements
the proportionate share of the associates’ results after tax
and the proportionate elimination of unrealized intercompany
profits and losses, less any impairment of goodwill, are recog-
nized in consolidated profit or loss. the proportionate share of
all transactions recognized in the associate’s other comprehen-
sive income is recognized in the Group’s other comprehensive
income.
financial income and expenses
Financial income and expenses include interest income and ex-
penses, realized and unrealized gains and losses on foreign-cur-
rency transactions, debt and securities as well as the amortiza-
tion of financial liabilities.
Interest income and interest expenses are accrued, based on
the principal and the effective interest rate. the effective in-
terest rate is the discount rate used to discount the expected
future payments associated with the financial asset or finan-
cial liability to ensure that the present value of such asset or
liability is equal to its carrying amount.
Borrowing costs that are directly associated with the acqui-
sition, construction or production of assets are capitalized as
part of the cost of the relevant asset. other borrowing costs
are recognized in the income statement.
Tax on profit/loss for the year
the tax for the year, which consists of the year’s current tax
and changes in deferred tax, is recognized in the income state-
ment as follows: the portion attributable to the profit or loss for
the year is recognized in profit or loss, and the portion attribut-
able to items under equity or other comprehensive income is
posted directly to equity or other comprehensive income.
Current tax payable and receivable is recognized in the balance
sheet as tax computed on the taxable income for the year,
adjusted for tax paid on account. the calculation of the year’s
current tax is based on the tax rates and tax rules applicable at
the reporting date.
Deferred tax is recognized according to the balance-sheet lia-
bility method on the basis of all temporary differences between
the carrying amount and the tax base of assets and liabilities,
except deferred tax on temporary differences arising on the in-
itial recognition of either goodwill or a transaction that is not
a business combination and that does not affect the profit or
loss or taxable income upon initial recognition.
Deferred tax is calculated on the basis of the planned use of
the individual asset and settlement of the individual liability.
Deferred tax assets, including the tax base of tax losses al-
lowed for carryforward, are recognized in the balance sheet at
the value at which the asset is expected to be realized, either
by setoff against deferred tax liabilities or as net tax assets for
setoff against future positive taxable income within the same
entity subject to joint taxation. At each reporting date, it is re-
considered whether it is likely that sufficient future taxable in-
come will be generated to utilize the deferred tax asset, based
on an individual and specific assessment. If it is considered that
an individual tax asset cannot be utilized, it is written down in

co n s o l i daT e d f i n a n c i a l sTaT e m e n Ts | A n n uA l r e p o rt 2 0 1 2 / 1 3 | t k D e v e lo pm e n t A / S | 7 1 / 1 2 7
N O T E S
the income statement.
Deferred tax on temporary differences related to equity invest-
ments in subsidiaries and associates is recognized, unless the
parent Company is able to control when the deferred tax will
crystallize and the deferred tax is not likely to crystallize as cur-
rent tax in the foreseeable future.
Deferred tax is measured by using the tax rules and rates that
will be applicable in the respective countries at the time when
the deferred tax is expected to crystallize as current tax, based
on the legislation in force at the reporting date. Any changes in
deferred tax resulting from changed tax rates and tax rules are
recognized in the income statement, unless the deferred tax
is attributable to items previously recognized directly in equity
or in other comprehensive income. In such cases, the change
in deferred tax is also recognized directly in equity or in other
comprehensive income.
the parent Company is jointly taxed with all Danish subsidiaries.
the parent Company administers the joint taxation. the total
income taxes payable by the jointly taxed companies are dis-
tributed between the Danish jointly taxed companies in propor-
tion to their taxable income.
Balances arising under the interest deduction limitation rules
laid down in the Danish Corporation tax Act have been distribut-
ed between the jointly taxed companies according to the joint
taxation agreement concluded.
b a l a n c e s h e e T
goodwill
on initial recognition, goodwill is recognized and measured as
the difference between (i) the purchase consideration for the
acquired enterprise, the value of any minority interests in the
acquired enterprise plus the fair value of previously acquired
equity investments, and (ii) the fair value of the assets, liabili-
ties and contingent liabilities acquired; see the description un-
der “Consolidated financial statements”.
the carrying amount of goodwill is allocated to the Group’s
cash-flow-generating units at the date of acquisition.
Cash-flow-generating units are defined on the basis of the
management structure and internal financial control and re-
porting in the Group.
Goodwill is not amortized. the amount of goodwill is subject-
ed to impairment tests at least once a year to ensure that the
asset is written down to the extent that the carrying amount
exceeds the recoverable amount. the recoverable amount is
determined as the higher of the fair value less selling costs and
the present value of estimated future net cash flows from the
cash-flow-generating unit to which the goodwill relates. Impair-
ment of goodwill is recognized in a separate line in the income
statement. Impairment of goodwill is not reversed.
investment properties and investment properties under
construction
properties are classified as investment properties when they
are held to obtain rental income and/or capital gains. on ini-
tial recognition, investment properties are measured at cost,
consisting of the acquisition cost of the property and directly
associated costs. the costs incurred in connection with the
construction of investment properties are added to the value
of the property.
Subsequently, investment properties are measured at fair val-
ue. Generally, the valuation is made on the basis of a discount-
ed cash-flow model, where future cash flows are discounted
to net present value on the basis of a given rate of return. the
rate of return is fixed for each individual property. Where a sales
process has been started, the valuation will be based on the
selling price discussed if it is found to correctly reflect the fair
value.
the valuation of the Group’s investment properties under con-
struction is also based on a specific assessment of project
progress at the reporting date, including the risks attaching to
project completion.
Changes in the fair value are recognized in the income state-
ment under “value adjustment of investment properties, net” in
the financial year in which the change occurs.
other fixtures and fittings, tools and equipment
other fixtures and fittings, tools and equipment are measured
at cost less accumulated depreciation and impairment. the
cost consists of the acquisition cost and costs directly asso-
ciated with the acquisition until the date when the asset is
ready for use. the carrying amounts of other fixtures and fit-
tings, tools and equipment are reviewed at the reporting date
to identify any indications of impairment. If such indications are
identified, the recoverable amount of the asset is calculated
to assess the need for any impairment and the extent of such
impairment.
the cost of these assets is depreciated according to the
straight-line method over their expected useful lives, viz. a peri-

7 2 / 1 2 7 | t k D e v e lo pm e n t A / S | A n n uA l r e p o rt 2 0 1 2 / 1 3 | co n s o l i daT e d f i n a n c i a l sTaT e m e n Ts
N O T E S
od of 5-10 years. leasehold improvements are depreciated ac-
cording to the straight-line method over the term of the lease.
other non-current assets
other securities and investments consist of mortgage deeds
and instruments of indebtedness created in connection with
project sales, which are measured at amortized cost, as well as
unlisted shares, which are measured at fair value.
Projects in progress or completed
projects in progress or completed consist of real property pro-
jects.
the project portfolio is recognized on the basis of the direct
costs attributable to the projects, including interest during
the project period, plus a share of the relevant indirect project
costs. Where considered necessary, the projects have been
written down to a lower value, and the capitalized amounts are
subjected to impairment tests on a continuous basis to ensure
that the assets are written down to the extent that the carry-
ing amount exceeds the recoverable amount.
Additions for indirect project costs are calculated as a percent-
age of staff costs, project materials, the cost and maintenance
of premises and depreciation resulting from project develop-
ment and proportionately attributable to the project develop-
ment capacity utilized.
prepayments from customers on sold projects in progress (for-
ward funding) are deducted from the carrying amount of the
project portfolio, and any negative net amount, determined for
each individual project, is included in the item “prepayments re-
ceived from customers”.
receivables
receivables consist of trade receivables, receivables from con-
tract work in progress, receivables from associates and other
receivables. receivables are classified as loans and receivables,
which are financial assets with fixed or determinable payments
that are not quoted in an active market and are not derivative
financial instruments.
receivables are measured at fair value on initial recognition and
subsequently at amortized cost, which usually corresponds to
nominal value less impairment provisions to meet estimated
losses. Impairment losses on receivables are calculated on the
basis of an assessment of the individual receivables.
Financial assets and liabilities are charged against the balance
sheet if the Company has a right of setoff and at the same time
intends or is under a contractual obligation to realize assets
and liabilities simultaneously.
prepayments, recognized under assets, consist of paid expens-
es relating to subsequent financial years. prepayments are
measured at cost in the balance sheet.
construction contracts
When the outcome of a construction contract can be estimat-
ed reliably, the construction contract is measured at the sell-
ing price of the work performed as of the reporting date (the
percentage of completion method) less any amounts invoiced
on account and writedowns for impairment. the selling price is
measured on the basis of the stage of completion as of the re-
porting date and the total revenue expected from the individual
construction contract.
the stage of completion of each individual project is normally
calculated as the proportion between the resources used by
the Group and the total budgeted use of resources.
When the outcome of the construction contract cannot be
measured reliably, the construction contract is measured at
the construction costs incurred if it is probable that they will be
recoverable. If it is probable that the total construction costs
will exceed total contract revenue, the estimated loss is recog-
nized as a cost immediately.
the individual construction contract in progress is recognized in
the balance sheet under receivables or liabilities, depending on
whether its net value is a receivable or a liability.
securities
Securities under current assets consist of listed and unlisted
equity investments.
Securities are classified either as financial assets available for
sale or as held-to-maturity financial assets.
Available-for-sale securities are measured at fair value on the
reporting date. Fair-value adjustments are recognized in other
comprehensive income and are recognized in profit or loss on
the sale or settlement of the securities.
listed securities are measured at their official listed price, and
unlisted securities are measured at their fair value, based on
the calculated value in use.
co n s o l i daT e d f i n a n c i a l sTaT e m e n Ts | A n n uA l r e p o rt 2 0 1 2 / 1 3 | t k D e v e lo pm e n t A / S | 7 3 / 1 2 7
N O T E S
equity interests that are not traded in an active market, and
where the fair value cannot be determined with a sufficient de-
gree of reliability, are measured at cost.
equity
Dividend is recognized as a liability at the time of its adoption at
the Annual General meeting.
the consideration paid and received on the purchase and sale
of treasury shares and dividends on such shares is recognized
directly in equity under retained earnings.
Pension obligations and the like
the Group’s pension obligations consist of defined contribution
plans on which fixed contributions are paid regularly to inde-
pendent pension companies and the like. the contributions
are recognized in the income statement over the period during
which the employees have performed the work entitling them
to the pension contribution. Contributions payable are recog-
nized as a liability in the balance sheet.
Provisions
provisions are recognized when a legal or constructive obliga-
tion is incurred due to events before or at the reporting date,
and meeting the obligation is likely to result in an outflow of
resources from the Group.
this item includes provisions for rent guarantees, with the pro-
vision being based on experience with rent guarantees and on
an individual assessment of the individual leases.
provisions are measured as the best estimate of the costs re-
quired to settle the relevant liabilities at the reporting date.
provisions for liabilities with an expected maturity of more than
one year are classified as non-current liabilities and measured
at present value.
liabilities other than provisions
non-current financial liabilities are measured at cost at the
time the relevant loans are raised, equivalent to the proceeds
received after transaction costs. Subsequently, financial liabil-
ities are measured at amortized cost, such that the difference
between the proceeds and nominal value is recognized in the
income statement as a financial expense over the term of the
loan.
other financial liabilities are recognized at amortized cost,
which usually corresponds to the nominal value.
lease payments relating to operational leases are recognized
in the income statement according to the straight-line method,
over the term of the lease.
Financial liabilities, which comprise payables to credit institu-
tions, trade payables and other debt, are classified as “Financial
liabilities measured at amortized cost”.
Deferred income, recognized under liabilities, consists of in-
come received that relates to subsequent financial years. De-
ferred income is measured at cost in the balance sheet.
ca s h f lo w s TaT e m e n T
the cash flow statement is presented according to the indirect
method, based on the operating profit or loss, and shows cash
flows generated from operating, investing and financing activi-
ties, as well as cash and cash equivalents at the beginning and
end of the financial year.
Cash flows relating to operating activities are calculated as the
operating profit or loss, adjusted for non-cash operating items,
changes in working capital and paid financial income, financial
expenses and corporate income tax.
Cash flows relating to investing activities comprise payments
made in connection with the purchase and sale of enterprises,
property, plant and equipment and other non-current assets.
Cash flows relating to financing activities consist of changes
in the parent Company’s share capital and associated costs,
the raising and repayment of loans, other repayments on inter-
est-bearing debt as well as the payment of dividend.
Cash flows in currencies other than the functional currency are
recognized in the cash flow statement by using average ex-
change rates for the period under review, unless they deviate
significantly from the actual exchange rates at the transaction
dates.
In preparing the consolidated cash flow statement, opening
balance sheets and cash flows in foreign currencies are trans-
lated on the basis of the foreign-exchange rates prevailing at
the reporting date. this eliminates the effect of exchange dif-
ferences on the period’s movements and cash flows. Interest
paid is shown separately. Consequently, project interest for the
period is not included in liquidity movements resulting from the
project portfolio. thus, the figures in the cash flow statement
cannot be inferred directly from the financial statements.
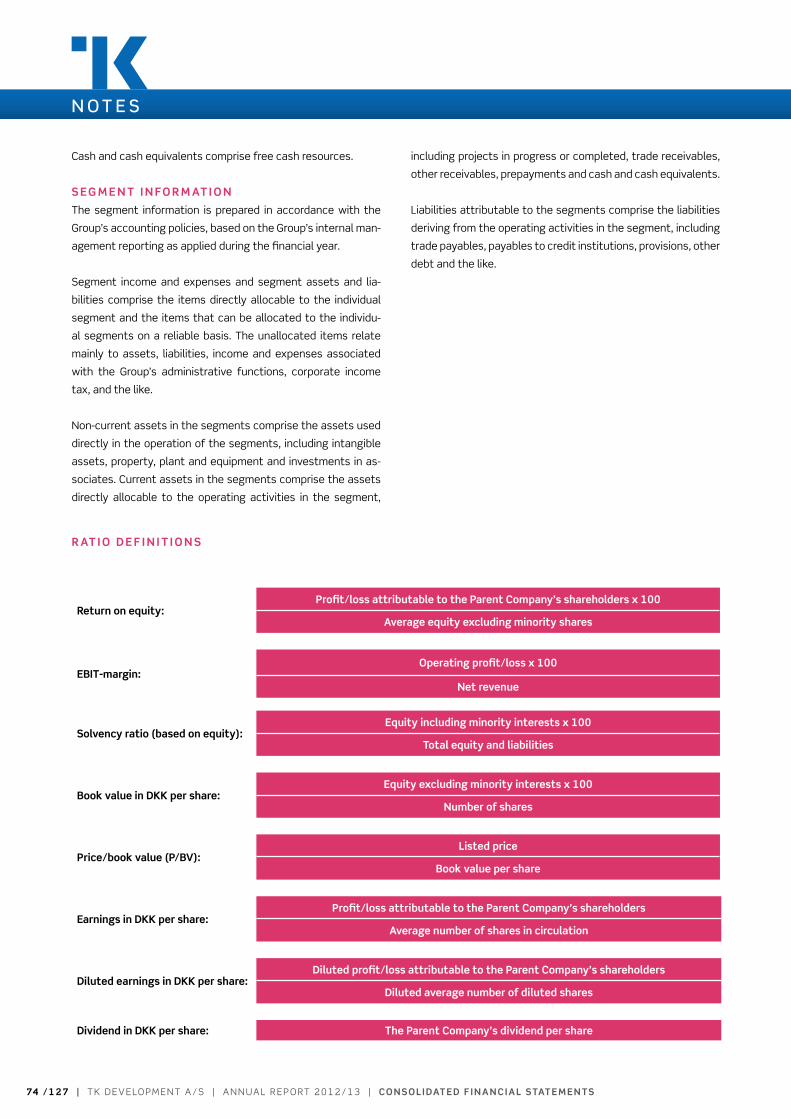
74 / 1 2 7 | t k D e v e lo pm e n t A / S | A n n uA l r e p o rt 2 0 1 2 / 1 3 | co n s o l i daT e d f i n a n c i a l sTaT e m e n Ts
N O T E S
Cash and cash equivalents comprise free cash resources.
s e g m e n T i n fo r m aT i o n
the segment information is prepared in accordance with the
Group’s accounting policies, based on the Group’s internal man-
agement reporting as applied during the financial year.
Segment income and expenses and segment assets and lia-
bilities comprise the items directly allocable to the individual
segment and the items that can be allocated to the individu-
al segments on a reliable basis. the unallocated items relate
mainly to assets, liabilities, income and expenses associated
with the Group’s administrative functions, corporate income
tax, and the like.
non-current assets in the segments comprise the assets used
directly in the operation of the segments, including intangible
assets, property, plant and equipment and investments in as-
sociates. Current assets in the segments comprise the assets
directly allocable to the operating activities in the segment,
including projects in progress or completed, trade receivables,
other receivables, prepayments and cash and cash equivalents.
liabilities attributable to the segments comprise the liabilities
deriving from the operating activities in the segment, including
trade payables, payables to credit institutions, provisions, other
debt and the like.
return on equity:Profit/loss attributable to the Parent company’s shareholders x 100
average equity excluding minority shares
ebiT-margin: operating profit/loss x 100
net revenue
solvency ratio (based on equity):equity including minority interests x 100
Total equity and liabilities
book value in dkk per share:equity excluding minority interests x 100
number of shares
Price/book value (P/bv):listed price
book value per share
earnings in dkk per share:Profit/loss attributable to the Parent company’s shareholders
average number of shares in circulation
diluted earnings in dkk per share:diluted profit/loss attributable to the Parent company’s shareholders
diluted average number of diluted shares
dividend in dkk per share: The Parent company’s dividend per share
r aT i o d e f i n i T i o n s

co n s o l i daT e d f i n a n c i a l sTaT e m e n Ts | A n n uA l r e p o rt 2 0 1 2 / 1 3 | t k D e v e lo pm e n t A / S | 7 5 / 1 2 7
N O T E S
n oT e 2 . ac c o u n T i n g e s T i m aT e s a n d a s s e s s -
m e n T s
many account items cannot be measured with certainty, but
only estimated. Such estimates consist of assessments based
on the most recent information available at the time of present-
ing the financial statements. It may be necessary to change
previous estimates based on changes in the assumptions un-
derlying the estimate or based on supplementary information,
additional experience or subsequent events.
In connection with the practical application of the accounting
policies described, management has made a number of signifi-
cant accounting estimates and judgments that have materially
affected this Annual report.
financial issues
At the forthcoming Annual General meeting, the Supervisory
Board will request authorization to carry out a capital increase
with gross proceeds of about Dkk 210-231 million. the capital
increase will help generate the cash resources required to un-
derpin future operations and project flow, and thus long-term
earnings. the capital increase has been discussed with the
Group’s major shareholders, who, together with a few major
private and institutional investors, have given conditional sub-
scription and underwriting commitments for the total capital
increase.
the Group’s main banker has indicated its preparedness to
prolong tk Development’s credit facilities subject to specific
conditions being met, which includes reducing the operating
credit limit by Dkk 50 million. the prolongation is expected to
be formally accepted after the publication of tk Development’s
Annual report for 2012/13.
of the total project credits outstanding at 31 January 2013,
credits worth Dkk 1.5 billion are due to mature in the 2013/14
financial year, including continuing repayment obligations on
individual project credits of about Dkk 80 million. After the re-
porting date, agreements regarding the refinancing of Dkk 0.2
billion have been made. moreover, the Group’s main banker and
other credit institutions have indicated their preparedness to
prolong existing credit facilities. When final commitments in this
respect have been received, credit facilities of Dkk 1.1 billion
will have been prolonged, and credit facilities of Dkk 0.3 billion
will be due to mature in 2013/14. the Group depends on being
able to continue obtaining either a prolongation or alternative
financing of the project credits not expected to be repaid upon
project sales. the Group is in ongoing dialogue with the relevant
credit institutions, and management anticipates being able to
either prolong or refinance these project credits. Some of the
proceeds from the capital increase or the cash freed up on the
sale of major completed projects will help reduce the debt to
credit institutions, including project finance loans of Dkk 68.5
million granted by a number of the Company’s major sharehold-
ers and members of management.
management believes that the above issues will be resolved
and that the Group will consequently have secured the cash
resources for its future operations and project flow, and thus
long-term earnings.
recognition of revenue
revenue on projects that can be classified as construction con-
tracts is recognized according to IAS 11. For sold projects con-
sisting of several instalment deliveries that can be segregated,
where the financial effect can be assessed separately, the prof-
it on the individual instalment delivery is recognized when all
essential elements of the agreement have been fulfilled, thus
meeting the recognition criteria of IAS 18. thus, management
specifically assesses each individual project for the purpose of
determining recognition principle and method.
deferred tax assets
A deferred tax asset of Dkk 127.0 million has been recognized
in the balance sheet at 31 January 2013. the tax asset relates
mainly to tax loss carryforwards in the various subsidiaries. val-
uation is based on the existing rules for carrying forward losses
and joint taxation or group contributions and the assumption
that each subsidiary is a going concern. A change in the condi-
tions and assumptions for carrying forward losses and joint tax-
ation/ group contributions could result in the value of the tax
assets being lower than that computed at 31 January 2013. In
the 2012/13 financial year, deferred tax assets were written
down by Dkk 200.5 million. A substantial portion of this amount
is attributable to the reduction of the Group’s Danish tax asset
resulting from changed rules for tax loss carryforwards.
the valuation of the tax assets is based on existing budgets
and profit forecasts for a five-year period. For the first three
years, budgets are based on an evaluation of specific projects
in the Group’s project portfolio. the valuation for the next two
years is based on specific projects in the project portfolio with
a longer time horizon than three years as well as various project
opportunities.
Due to the substantial uncertainties attaching to these valua-
tions, provisions have been made for the risk that projects are
postponed or not implemented and the risk that project profits
fall below expectations. If the conditions and assumptions for

7 6 / 1 2 7 | t k D e v e lo pm e n t A / S | A n n uA l r e p o rt 2 0 1 2 / 1 3 | co n s o l i daT e d f i n a n c i a l sTaT e m e n Ts
N O T E S
budgets and profit forecasts change, including time estimates,
or if the expectations do not materialize, this could result in the
value of the tax assets being significantly lower than that com-
puted at 31 January 2013, which would have an adverse effect
on the Group’s results of operations and financial position.
joint taxation
the Group has been jointly taxed with its German subsidiaries
for a number of years. the retaxation balance in respect of the
jointly taxed German companies amounted to Dkk 389.4 million
at 31 January 2013. Full retaxation would trigger a tax charge
of Dkk 97.4 million at 31 January 2013. tax has not been pro-
vided on the retaxation balance, because management does
not plan to make changes in the Group that would result in full
or partial retaxation. If management takes a different view, this
could have a significant adverse effect on the Group’s future
performance, results of operations, cash flows and financial
position.
investment properties and investment properties under
construction
the Group’s investment properties and investment properties
under construction are measured at fair value in the balance
sheet. the valuation is made on the basis of a discounted cash-
flow model, where expected future cash flows are discounted
to net present value on the basis of a given rate of return, or
on the basis of an ongoing sales process where applicable.
the valuation of the Group’s investment properties under con-
struction is also based on a specific assessment of project
progress at the reporting date, including the risks attaching to
project completion. If any changes occur in the assumptions
used, the value may deviate from the value determined at 31
January 2013. In the 2012/13 financial year, a negative value
adjustment of the Group’s investment properties was made,
amounting to Dkk 37.8 million. the carrying amount of invest-
ment properties and investment properties under construction
amounted to Dkk 496.3 million at 31 January 2013.
Projects in progress or completed
Indications of impairment of projects in progress and complet-
ed projects are determined based on a specific assessment
of each individual project, including existing project budgets
and the expected future development potential. If the actual
course of a project deviates from the expected development,
this may necessitate adjustments to the impairment recog-
nized. the changed indication of impairment of projects in
progress and completed projects has had a negative impact
of Dkk 287.9 million on the results for the year. Accumulated
impairment amounted to Dkk 489.9 million at 31 January 2013.
the carrying amount of projects in progress or completed to-
talled Dkk 3,030.9 million at 31 January 2013.
receivables
Indications of impairment of receivables are determined based
on a specific assessment of each individual receivable. If any
changes occur in the assumptions used, the value may deviate
from the value determined at 31 January 2013. the carrying
amount of receivables totalled Dkk 241.0 million at 31 January
2013.
goodwill
to identify any indication of impairment of the goodwill amounts
recognized, the values in use of the cash-flow-generating units
to which the goodwill amount is attributable must be calculat-
ed. Calculating the value in use assumes that an estimate of
future expected cash flows in the individual cash-flow-gener-
ating unit has been made and that a reasonable discount rate
has been determined. the goodwill amount recognized in the
balance sheet has not been written down for impairment. the
carrying amount of goodwill totalled Dkk 33.3 million at 31 Jan-
uary 2013.
n oT e 3 . s eg m e n T i n fo r m aT i o n
the Group’s internal reporting to the parent Company’s Super-
visory Board in 2012/13 is split into two business units, viz. tkD
nordeuropa and euro mall Holding, and the remaining business
activities, referred to as tkD.
tkD nordeuropa operates on the Group’s markets in Denmark,
Sweden, Finland, latvia and lithuania, and primarily in the retail
property segment (shopping centres and retail parks), the of-
fice segment and the mixed segment.
euro mall Holding operates on the Group’s Central european
markets in poland, the Czech republic and Slovakia, and primar-
ily in the retail property segment (shopping centres and retail
parks) and the mixed segment, and in poland also in the resi-
dential segment.
the remaining activities, referred to as tkD, make up the rest
of the Group. In addition to the holding function for tkD nor-
deuropa and euro mall Holding, tkD comprises the group’s Ger-
man investment properties, the remaining projects in Germany
and a minor project in russia.

co n s o l i daT e d f i n a n c i a l sTaT e m e n Ts | A n n uA l r e p o rt 2 0 1 2 / 1 3 | t k D e v e lo pm e n t A / S | 7 7 / 1 2 7
N O T E S
n oT e 3 . s e g m e n T i n fo r m aT i o n , c o n T i n u e d
the segment information has been disclosed accordingly.
the accounting policies used in compiling the segment infor-
mation are the same as those used by the Group; see the de-
scription above.
management has decided to change the Group’s internal and
external reporting to create a better overview and highlight val-
ues and value generation in the Group’s business areas.
the business areas will be structured as follows:
• property development activities
• Asset management activities
• Discontinuing activities.
As of 1 February 2013 the segment information will follow this
segmentation.
31.1.2013tkD
nordeuropaeuro mall
Holding tkD elimination total
net revenue, external customers 214.8 404.4 13.1 0.0 632.3
Impairment losses on projects in progress or completed 74.2 203.4 25.9 0.0 303.5
value adjustment of investment properties, net 0.0 -24.3 -13.5 0.0 -37.8
Financial income 3.5 6.0 22.8 -26.7 5.6
Financial expenses -71.8 -38.4 -9.5 26.7 -93.0
Depreciation and impairment 0.2 0.5 1.5 0.0 2.2
Shares of profit or loss in associates 0.5 1.1 0.9 0.0 2.5
tax on profit/loss for the year -6.4 23.0 150.7 0.0 167.3
profit/loss after tax -124.0 -195.4 -173.9 0.0 -493.3
Segment assets 1,763.5 1,839.5 1,562.9 -1,156.6 4,009.3
Investments in associates 0.7 1.0 0.0 0.0 1.7
Capital expenditure *) 0.0 11.3 0.2 0.0 11.5
Segment liabilities 1,539.0 1,210.4 173.2 -303.0 2,619.6
31.1.2012tkD
nordeuropaeuro mall
Holding tkD elimination total
net revenue, external customers 144.4 202.1 13.3 0.0 359.8
Impairment losses on projects in progress or completed 4.5 10.0 6.7 0.0 21.2
value adjustment of investment properties, net 0.0 36.2 0.5 0.0 36.7
Financial income 3.4 5.2 19.5 -18.9 9.2
Financial expenses -59.6 -39.3 -12.8 18.9 -92.8
Depreciation and impairment 0.2 0.8 1.8 0.0 2.8
Shares of profit or loss in associates 0.1 30.9 1.4 0.0 32.4
tax on profit/loss for the year 15.9 -7.4 4.2 0.0 12.7
profit/loss after tax -73.5 99.7 0.8 0.0 27.0
Segment assets 1,881.9 2,144.4 2,066.6 -1,453.4 4,639.5
Investments in associates 0.2 0.0 0.0 0.0 0.2
Capital expenditure *) 0.1 17.4 0.5 0.0 18.0
Segment liabilities 1,673.5 1,235.4 190.2 -336.0 2,763.1*) Capital expenditure comprises additions to intangible assets and property, plant and equipment.
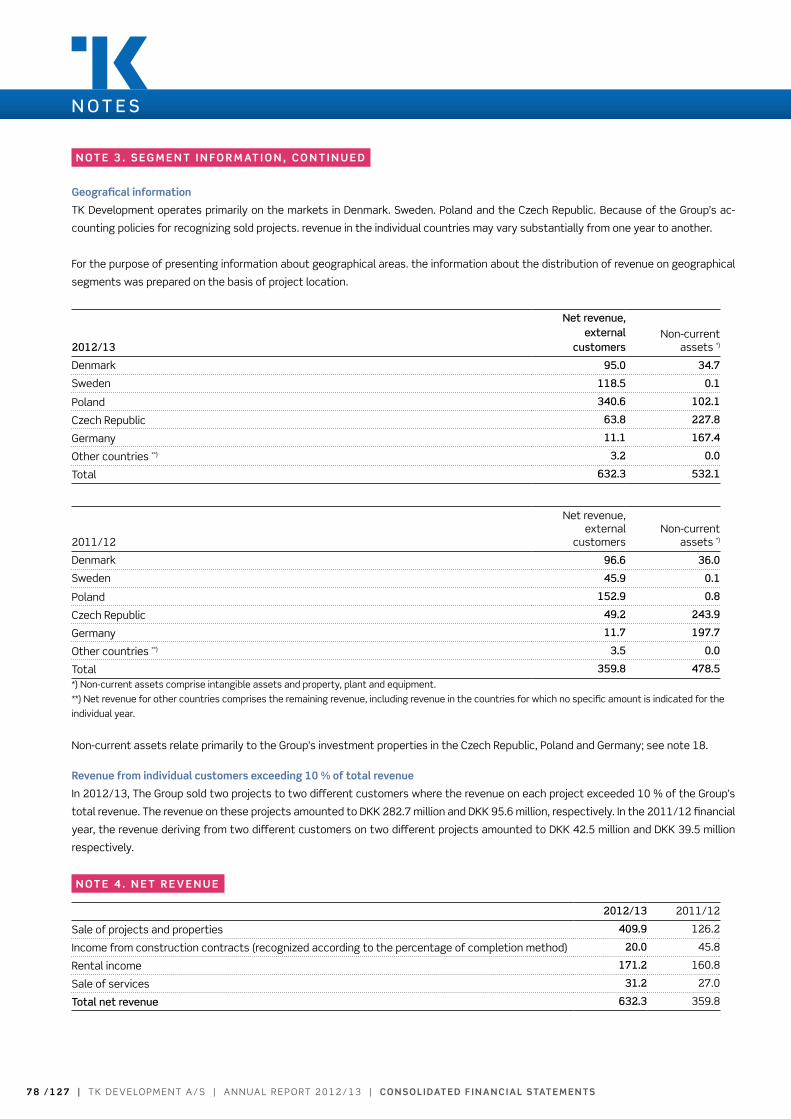
7 8 / 1 2 7 | t k D e v e lo pm e n t A / S | A n n uA l r e p o rt 2 0 1 2 / 1 3 | co n s o l i daT e d f i n a n c i a l sTaT e m e n Ts
N O T E S
n oT e 3 . s e g m e n T i n fo r m aT i o n , c o n T i n u e d
geografical information
tk Development operates primarily on the markets in Denmark. Sweden. poland and the Czech republic. Because of the Group’s ac-
counting policies for recognizing sold projects. revenue in the individual countries may vary substantially from one year to another.
For the purpose of presenting information about geographical areas. the information about the distribution of revenue on geographical
segments was prepared on the basis of project location.
2012/13
Net revenue, external
customersnon-current
assets *)
Denmark 95.0 34.7
Sweden 118.5 0.1
poland 340.6 102.1
Czech republic 63.8 227.8
Germany 11.1 167.4
other countries **) 3.2 0.0
total 632.3 532.1
2011/12
net revenue, external
customersnon-current
assets *)
Denmark 96.6 36.0
Sweden 45.9 0.1
poland 152.9 0.8
Czech republic 49.2 243.9
Germany 11.7 197.7
other countries **) 3.5 0.0
total 359.8 478.5*) non-current assets comprise intangible assets and property, plant and equipment.
**) net revenue for other countries comprises the remaining revenue, including revenue in the countries for which no specific amount is indicated for the
individual year.
non-current assets relate primarily to the Group’s investment properties in the Czech republic, poland and Germany; see note 18.
revenue from individual customers exceeding 10 % of total revenue
In 2012/13, the Group sold two projects to two different customers where the revenue on each project exceeded 10 % of the Group’s
total revenue. the revenue on these projects amounted to Dkk 282.7 million and Dkk 95.6 million, respectively. In the 2011/12 financial
year, the revenue deriving from two different customers on two different projects amounted to Dkk 42.5 million and Dkk 39.5 million
respectively.
n oT e 4 . n e T r e v e n u e
2012/13 2011/12
Sale of projects and properties 409.9 126.2
Income from construction contracts (recognized according to the percentage of completion method) 20.0 45.8
rental income 171.2 160.8
Sale of services 31.2 27.0
Total net revenue 632.3 359.8
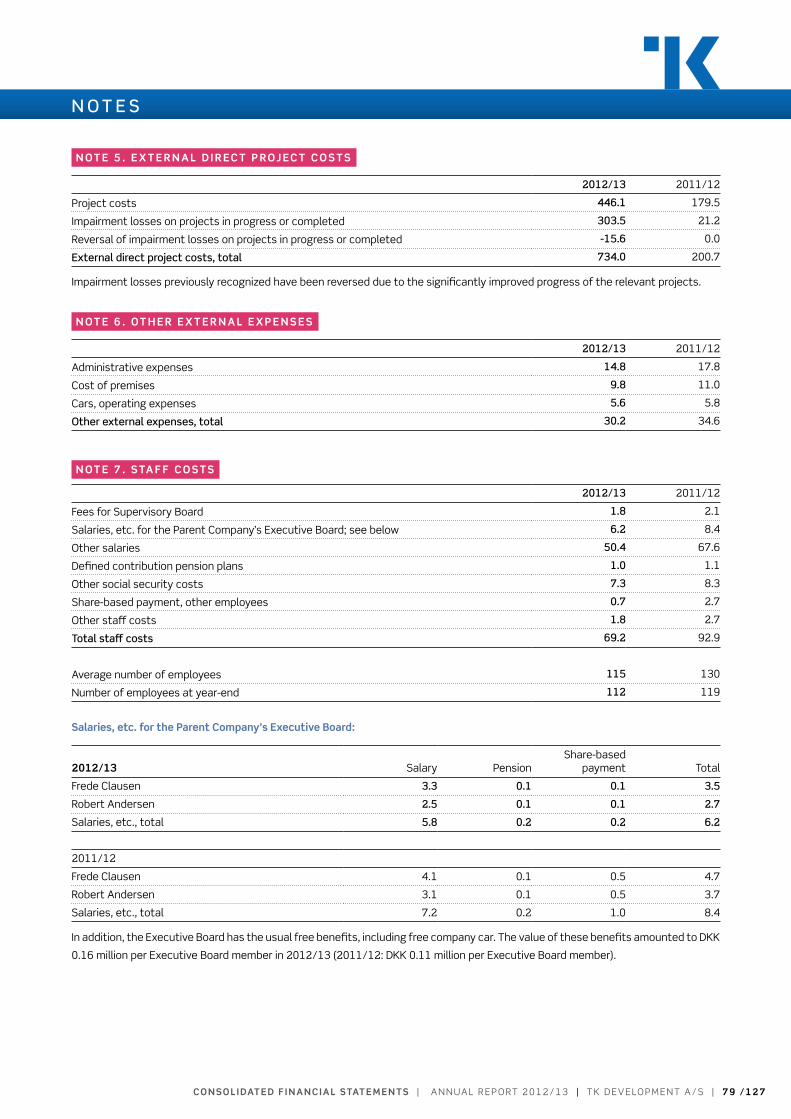
co n s o l i daT e d f i n a n c i a l sTaT e m e n Ts | A n n uA l r e p o rt 2 0 1 2 / 1 3 | t k D e v e lo pm e n t A / S | 7 9 / 1 2 7
n oT e 5 . e x T e r n a l d i r ec T P r oj ec T c o s T s
2012/13 2011/12
project costs 446.1 179.5
Impairment losses on projects in progress or completed 303.5 21.2
reversal of impairment losses on projects in progress or completed -15.6 0.0
External direct project costs, total 734.0 200.7
Impairment losses previously recognized have been reversed due to the significantly improved progress of the relevant projects.
n oT e 6 . oT h e r e x T e r n a l e x P e n s e s
2012/13 2011/12
Administrative expenses 14.8 17.8
Cost of premises 9.8 11.0
Cars, operating expenses 5.6 5.8
Other external expenses, total 30.2 34.6
n oT e 7 . s Ta f f c o s T s
2012/13 2011/12
Fees for Supervisory Board 1.8 2.1
Salaries, etc. for the parent Company’s executive Board; see below 6.2 8.4
other salaries 50.4 67.6
Defined contribution pension plans 1.0 1.1
other social security costs 7.3 8.3
Share-based payment, other employees 0.7 2.7
other staff costs 1.8 2.7
Total staff costs 69.2 92.9
Average number of employees 115 130
number of employees at year-end 112 119
salaries, etc. for the Parent company’s executive board:
2012/13 Salary pensionShare-based
payment total
Frede Clausen 3.3 0.1 0.1 3.5
robert Andersen 2.5 0.1 0.1 2.7
Salaries, etc., total 5.8 0.2 0.2 6.2
2011/12
Frede Clausen 4.1 0.1 0.5 4.7
robert Andersen 3.1 0.1 0.5 3.7
Salaries, etc., total 7.2 0.2 1.0 8.4
In addition, the executive Board has the usual free benefits, including free company car. the value of these benefits amounted to Dkk
0.16 million per executive Board member in 2012/13 (2011/12: Dkk 0.11 million per executive Board member).
N O T E S
8 0 / 1 2 7 | t k D e v e lo pm e n t A / S | A n n uA l r e p o rt 2 0 1 2 / 1 3 | co n s o l i daT e d f i n a n c i a l sTaT e m e n Ts
N O T E S
n oT e 7 . s Ta f f c o s T s , c o n T i n u e d
the Supervisory Board is composed of the Chairman, Deputy Chairman and four other members. In 2012/13, the Supervisory Board
members were paid a basic fee of Dkk 200,000. the Chairman is paid three times the basic fee and the Deputy Chairman twice the
basic fee, while the remaining members are paid the basic fee.
As part of the cost cuts implemented by the Group, a further extraordinary 20 % reduction of the Supervisory Board’s basic fee for
2013/14 is planned, after which the basic fee will be fixed at Dkk 160,000 for 2013/14.
the remuneration of the executive Board will also be reduced in 2013/14. A new two-year agreement has been made with the execu-
tive Board, according to which a further 20 % of the executive Board’s fixed annual remuneration will not be paid on an ongoing basis,
which will equal a 36 % reduction compared to the remuneration paid in the 2011/12 financial year, which will apply to the period
from 1 may to 30 April 2015. up to two-thirds of the remuneration withheld during the two-year period will nevertheless be paid when
the Group meets specific operational targets.
defined contribution plans
the Group has entered into defined contribution plans with the majority of the employees in Danish group companies. According to
these plans, the group companies pay a monthly amount of 2 % of the relevant employees’ basic salaries to independent pension
companies.
An amount of Dkk 1.2 million was expensed for defined contribution plans in the 2012/13 financial year (2011/12: Dkk 1.3 million).
no employees in the Group are comprised by defined benefit plans.
n oT e 8 . s h a r e - b a s e d Paym e n T
For several years, tk Development has used incentive schemes for the executive Board and other executive staff members. the aim
of using incentive schemes is to forge a link between the individual staff member’s efforts and long-term value creation in the Group.
2010 scheme
In 2010, tk Development allocated warrants to the executive Board and other excecutive staff members. 394,000 warrants were
allocated, broken down by 50,000 warrants to each executive Board member and a total of 294,000 warrants to other executive staff
members. As a consequence of the capital reduction and capital increase implemented in August 2010, where the subscription price
for the newly issued shares was lower than the market value of the shares, the Supervisory Board resolved to adjust the number of
warrants allocated and the subscription price for exercising the warrants. there was a total of 446,315 outstanding warrants at the
reporting date. the above-mentioned warrants may be exercised within three six-week windows, of which only one remains, viz. the
six weeks following publication of the preliminary announcement of financial statements for the 2012/13 financial year.
2011 scheme
In June 2011, the Supervisory Board allocated another 500,000 warrants to the executive Board and other executive staff members,
broken down by 62,500 warrants to each executive Board member and a total of 375,000 warrants to other executive staff members.
the above-mentioned 500,000 warrants correspond to 1.2 % of the share capital and can be exercised in three six-week windows, as
follows:
following publication of the preliminary announcement of financial statements for 2013/14 (from around 30 April 2014);
following publication of the interim report for the six-month period ending 31 July 2014 (from around 30 September 2014); and
following publication of the preliminary announcement of financial statements for 2014/15 (from around 30 April 2015).

co n s o l i daT e d f i n a n c i a l sTaT e m e n Ts | A n n uA l r e p o rt 2 0 1 2 / 1 3 | t k D e v e lo pm e n t A / S | 8 1 / 1 2 7
N O T E S
n oT e 8 . s h a r e - b a s e d Paym e n T. c o n T i n u e d
the fair value of the warrants allocated has been calculated using the Black-Scholes pricing formula and amounts to Dkk 2.1 million,
which will be expensed over the term of the incentive scheme. the valuation is based on the following assumptions:
2012/13 2011/12 *)
Weighted average share price (Dkk per share) - 28,9
expected volatility (%) - 35 %
risk-free interest rate (%) - 2,5 %
expected dividend rate (%) - 0 %
term to expiry (months) - 40
*) the comparative figures for 2011/12 concern the warrants allocated in June 2011.
volatility has been determined on the basis of historical volatility of the price of the parent Company’s shares over the past 12
months and the expected future volatility. the term to expiry has been determined on the assumption that the warrants are exer-
cised in the intermediate exercise period.
the main condition for exercising these warrants in both schemes is that the employee has not given notice to terminate his or her
employment before having exercised the warrants allocated.
The development in outstanding warrants is shown below:
number of warrants
Weighted average
exercise prices
31 jan 2013 31 Jan 2012 31 jan 2013 31 Jan 2012
outstanding warrants, beginning of year 1,707,812 1,207,812 41.54 56.53
Allocated during the financial year 0 500,000 - 28.90
lapsed due to termination of employment -16,000 0 28.90 -
expired in the financial year -761,497 0 78.40 -
outstanding warrants, end of year 930,315 1,707,812 27.65 41.54
number of warrants exercisable at the reporting date 446,315 761,497 - -
Share-based payment recognized in the profit or loss (Dkk million) 0.9 3.7 - -
For the outstanding warrants at 31 January 2013. the exercise prices range from Dkk 26.3 to Dkk 30.2 per warrant (2011/12: Dkk24.3 to Dkk 78.4 per warrant). the weighted average term to expiry has been calculated at 15 months (2011/12: 17 months).
outstanding warrants is specified as below:
number ofwarrants expiry date
exercise price(last period)
Fair value at thetime of allocation
(Dkkm)
Allocated may 2010 446,315 June 2013 26.3 1.9
Allocated June 2011 484,000 June 2015 30.3 2.1
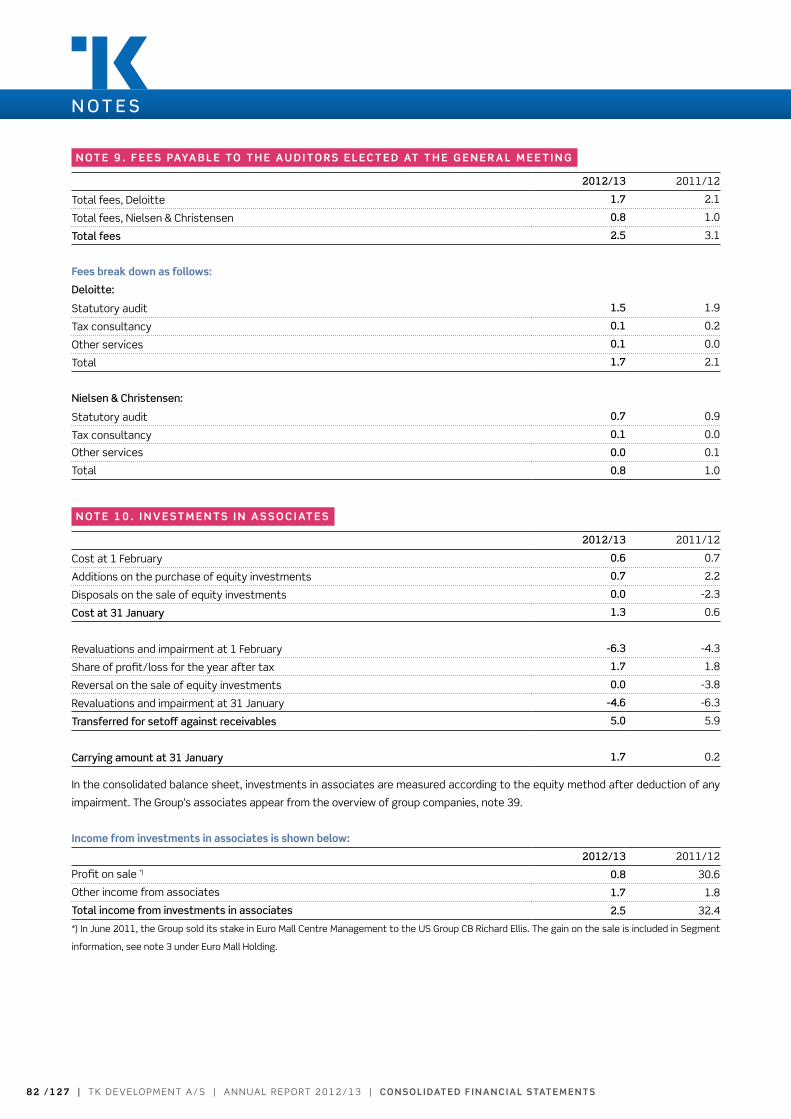
8 2 / 1 2 7 | t k D e v e lo pm e n t A / S | A n n uA l r e p o rt 2 0 1 2 / 1 3 | co n s o l i daT e d f i n a n c i a l sTaT e m e n Ts
N O T E S
n oT e 9 . f e e s Paya b l e To T h e a u d i To r s e l ec T e d aT T h e g e n e r a l m e e T i n g
2012/13 2011/12
total fees, Deloitte 1.7 2.1
total fees, nielsen & Christensen 0.8 1.0
Total fees 2.5 3.1
fees break down as follows:
Deloitte:
Statutory audit 1.5 1.9
tax consultancy 0.1 0.2
other services 0.1 0.0
total 1.7 2.1
Nielsen & Christensen:
Statutory audit 0.7 0.9
tax consultancy 0.1 0.0
other services 0.0 0.1
total 0.8 1.0
n oT e 1 0 . i n v e s Tm e n T s i n a s s o c i aT e s
2012/13 2011/12
Cost at 1 February 0.6 0.7
Additions on the purchase of equity investments 0.7 2.2
Disposals on the sale of equity investments 0.0 -2.3
Cost at 31 january 1.3 0.6
revaluations and impairment at 1 February -6.3 -4.3
Share of profit/loss for the year after tax 1.7 1.8
reversal on the sale of equity investments 0.0 -3.8
revaluations and impairment at 31 January -4.6 -6.3
Transferred for setoff against receivables 5.0 5.9
Carrying amount at 31 january 1.7 0.2
In the consolidated balance sheet, investments in associates are measured according to the equity method after deduction of any
impairment. the Group’s associates appear from the overview of group companies, note 39.
income from investments in associates is shown below:
2012/13 2011/12
profit on sale *) 0.8 30.6
other income from associates 1.7 1.8
Total income from investments in associates 2.5 32.4
*) In June 2011, the Group sold its stake in euro mall Centre management to the uS Group CB richard ellis. the gain on the sale is included in Segment
information, see note 3 under euro mall Holding.

co n s o l i daT e d f i n a n c i a l sTaT e m e n Ts | A n n uA l r e p o rt 2 0 1 2 / 1 3 | t k D e v e lo pm e n t A / S | 8 3 / 1 2 7
N O T E S
n oT e 1 0 . i n v e s Tm e n T s i n a s s o c i aT e s , c o n T i n u e d
financial disclosures for associates:
2012/13 2011/12
Income 4.8 34.8
profit/loss for the year 5.5 5.5
Assets 301.3 291.4
liabilities 309.9 307.1
the Group’s share of profit/loss for the year 1.7 1.8
the Group’s share of equity -3.3 -5.7
n oT e 1 1 . i n v e s Tm e n T s i n j o i n T v e n T u r e s
For an overview of the Group’s investments in joint ventures. please see the overview of group companies in note 39, which also
shows the accounting treatment of each individual company in the consolidated financial statements. the figures below represent
the Group’s share.
2012/13 2011/12
Income 66.4 85.9
expenses 123.2 30.7
Current assets 723.9 745.4
non-current assets 330.4 243.0
Current liabilities 561.2 588.0
non-current liabilities 115.0 35.0
n oT e 1 2 . f i n a n c i a l i n c o m e 2012/13 2011/12
Interest, cash and cash equivalents, etc. 0.9 1.5
Interest income from joint ventures 2.5 2.7
Interest income from associates 0.4 0.3
other interest income 0.7 1.8
financial income from loans and receivables 4.5 6.3
Interest from securities (held-to-maturity) 0.1 0.1
Foreign-exchange gains from other comprehensive income 1.0 2.8
Total financial income 5.6 9.2
which breaks down as follows:
Interest income from financial assets not measured at fair value through profit and loss 4.6 6.4
other financial income 1.0 2.8
Total financial income 5.6 9.2
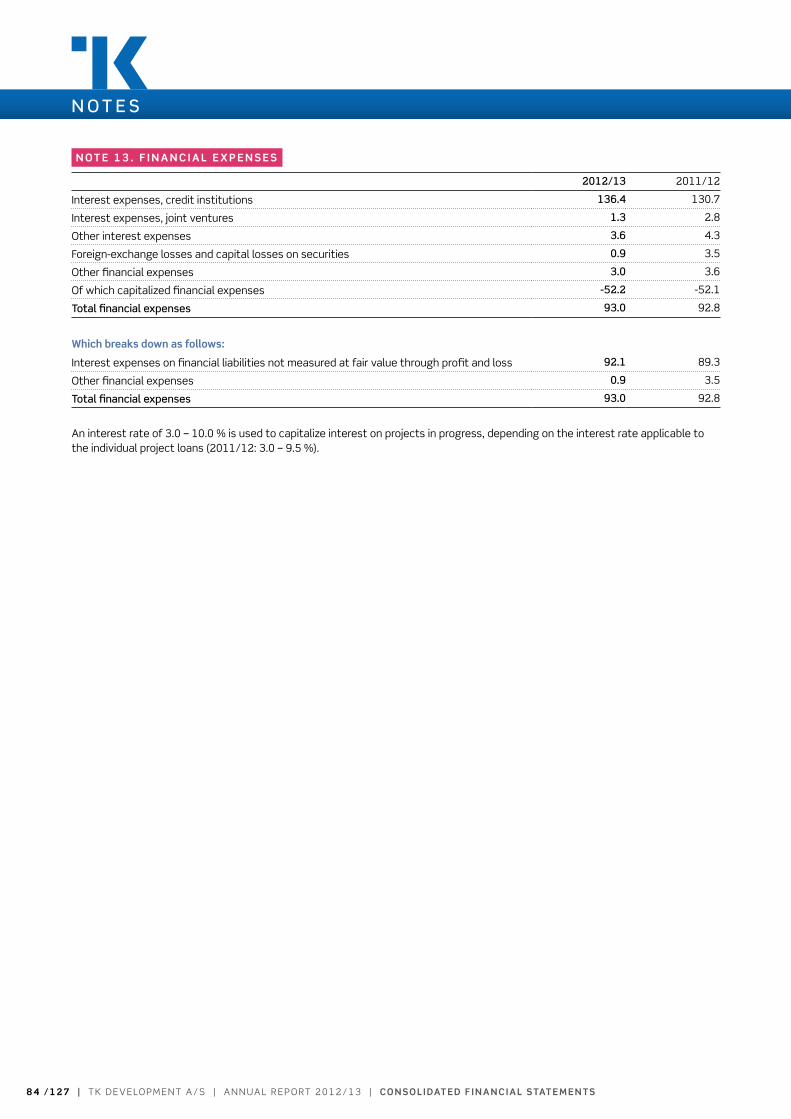
8 4 / 1 2 7 | t k D e v e lo pm e n t A / S | A n n uA l r e p o rt 2 0 1 2 / 1 3 | co n s o l i daT e d f i n a n c i a l sTaT e m e n Ts
N O T E S
n oT e 1 3 . f i n a n c i a l e x P e n s e s
2012/13 2011/12
Interest expenses, credit institutions 136.4 130.7
Interest expenses, joint ventures 1.3 2.8
other interest expenses 3.6 4.3
Foreign-exchange losses and capital losses on securities 0.9 3.5
other financial expenses 3.0 3.6
of which capitalized financial expenses -52.2 -52.1
Total financial expenses 93.0 92.8
which breaks down as follows:
Interest expenses on financial liabilities not measured at fair value through profit and loss 92.1 89.3
other financial expenses 0.9 3.5
Total financial expenses 93.0 92.8
An interest rate of 3.0 – 10.0 % is used to capitalize interest on projects in progress, depending on the interest rate applicable to the individual project loans (2011/12: 3.0 – 9.5 %).

co n s o l i daT e d f i n a n c i a l sTaT e m e n Ts | A n n uA l r e p o rt 2 0 1 2 / 1 3 | t k D e v e lo pm e n t A / S | 8 5 / 1 2 7
N O T E S
n oT e 1 4 . c o r P o r aT e i n c o m e Ta x
2012/13 2011/12
Current corporate income tax 4.9 1.8
Adjustment regarding tax relating to prior year(s) -2.7 1.3
Change in deferred tax 165.8 -16.3
Deferred tax transferred from other comprehensive income -0.7 0.5
Tax on profit/loss for the year 167.3 -12.7
The tax on the profit/loss for the year results as follows:
tax calculated based on the Danish tax rate -81.5 3.6
Difference in tax rate, foreign subsidiaries 5.5 4.9
Adjustment relating to prior year(s) -2.7 1.3
tax effect of:
non-taxable income/expenses 39.5 -38.3
Forfeiture of losses written down in prior years 0.3 5.1
Change in impairment of tax assets, incl. reversal of prior years’ impairment regarding the forfeiture of this year’s losses 200.5 19.2
Change of tax rate -1.1 1.7
Difference, tax on foreign-exchange adjustments transferred from other comprehensive income -0.5 0.7
other 7.3 -10.9
Tax on profit/loss for the year 167.3 -12.7
Effective tax rate -51.3 % -88.4 %
Deferred tax asset at 1 February 291.7 287.2
Deferred tax liabilities at 1 February -32.0 -55.1
Deferred tax asset/tax liability at 1 february, net 259.7 232.1
Foreign-exchange adjustment, beginning of year -0.3 -0.3
Deferred tax for the year recognized in profit or loss for the year -165.8 16.3
Adjustment relating to prior year(s) recognized in profit or loss for the year 0.4 0.0
Deferred tax for the year recognized in other comprehensive income -2.8 10.8
other additions, net 0.8 0.8
Deferred tax asset/tax liability at 31 january, net 92.0 259.7
recognized in the balance sheet as follows:
Deferred tax asset at 31 January; see note 21 127.0 291.7
Deferred tax liabilities at 31 January; see note 32 -35.0 -32.0
Deferred tax asset/tax liability at 31 january, net 92.0 259.7

8 6 / 1 2 7 | t k D e v e lo pm e n t A / S | A n n uA l r e p o rt 2 0 1 2 / 1 3 | co n s o l i daT e d f i n a n c i a l sTaT e m e n Ts
N O T E S
n oT e 1 5 . e a r n i n g s P e r s h a r e i n d k k
2012/13 2011/12
earnings in Dkk per share (epS) -11.7 0.6
Diluted earnings in Dkk per share (epS-D) -11.7 0.6
Profit/loss for the year -493.3 27.0
Shareholders’ share of profit/loss for the year -493.3 27.0
Average number of shares of nom. Dkk 15 42,065,715 42,065,715
Average number of shares in circulation of nom. Dkk 15 42,065,715 42,065,715
the outstanding warrants do not have a dilutive effect, as the average market price of ordinary shares in the financial year or the
comparative year did not exceed the subscription price in the first window. this means that the outstanding warrants are ”out-of-
the-money” and therefore not included in the diluted average number of shares in circulation. In the longer term, the outstanding
warrants may have an effect on earnings per share.
n oT e 1 6 . d i v i d e n d s
In the 2012/13 financial year, no dividends were distributed to the Company’s shareholders for the 2011/12 financial year. At the
Annual General meeting on 22 may 2013, the Supervisory Board will propose that no dividends be distributed to the Company’s
shareholders for the 2012/13 financial year.
n oT e 1 7 . g o o d w i l l
31 jan 2013 31 Jan 2012
Cost at 1 February 47.8 47.8
Additions 0.0 0.0
Cost at 31 january 47.8 47.8
Amortization and impairment at 1 February 14.5 14.5
Impairment for the year 0.0 0.0
Amortization and impairment at 31 january 14.5 14.5
Carrying amount at 31 january 33.3 33.3
the total goodwill relates to the cash-flow-generating unit, euro mall Holding A/S; see note 3.
At 31 January 2013, management performed an impairment test of the carrying amount of goodwill. the recoverable amount is
based on the value in use, which has been determined using the expected cash flows on the basis of budgets for the next three
financial years and forecasts for another two financial years approved by the Supervisory Board and recognition of the terminal value
in year five. the calculation of the recoverable amount included a discount rate of 15 % before tax. the impairment test did not give
rise to any recognition of impairment.
management assesses that significant changes to the basic assumptions would not result in the carrying amount of goodwill ex-
ceeding the recoverable amount.

co n s o l i daT e d f i n a n c i a l sTaT e m e n Ts | A n n uA l r e p o rt 2 0 1 2 / 1 3 | t k D e v e lo pm e n t A / S | 8 7 / 1 2 7
N O T E S
n oT e 1 8 . i n v e s Tm e n T P r o P e rT i e s a n d i n v e s Tm e n T P r o P e rT i e s u n d e r c o n s T r u c T i o n
Completed investment properties and invest-ment properties under construction: Location
Ownership in %
yearacquired m²
Futurm Hradec kralové Czech republic 20 % 2000/2012 28,250
Galeria tarnovia poland 30 % 2009 16,500
lüdenscheid/Berlin Germany 100 % 1994-1998 23,800
Jelenia Góra poland 30 % under construction 24,000
31 jan 2013 31 Jan 2012
Completedinvestmentproperties
Investmentproperties
underconstruction
Completedinvestmentproperties
Investmentproperties
underconstruction
Cost at 1 February 333.5 18.9 334.2 1.7
Foreign-exchange adjustments, beginning of year 1.6 0.0 -0.9 0.0
Costs of improvements 1.2 0.0 0.2 0.0
transfered from investment properties under construction 25.9 -25.9 0.0 0.0
other additions 84.4 23.9 0.0 17.2
Disposals for the year -33.1 0.0 0.0 0.0
Cost at 31 january 413.5 16.9 333.5 18.9
revaluations at 1 February 130.0 54.7 121.8 27.1
Foreign-exchange adjustments, beginning of year 0.2 0.1 -0.3 -0.1
revaluations for the year 0.0 0.0 8.5 27.7
revaluations reversed -23.3 -1.0 0.0 0.0
transfered from investment properties under construction 53.8 -53.8 0.0 0.0
Revaluations at 31 january 160.7 0.0 130.0 54.7
Impairment at 1 February 96.6 0.0 97.4 0.0
Foreign-exchange adjustments, beginning of year 0.5 0.0 -0.3 0.0
Impairment for the year 14.2 0.0 2.5 0.0
Impairment reversed -16.5 0.0 -3.0 0.0
Impairment at 31 january 94.8 0.0 96.6 0.0
Revaluations and impairment at 31 january 65.9 0.0 33.4 54.7
Carrying amount at 31 january 479.4 16.9 366.9 73.6
which breaks down as follows:
Central european investment properties 312.1 16.9 169.3 73.6
German investment properties 167.3 0.0 197.6 0.0
Total 479.4 16.9 366.9 73.6
rental income, investment properties 32.2 - 25.6 -
Direct operating expenses, premises let -2.3 - -2.6 -
Direct operating expenses, unlet premises -1.1 - -0.9 -
Net income from investment properties 28.8 - 22.1 -
A large number of lease agreements concluded for completed investment properties stipulate a period during which the agreement
is non-terminable by the tenant. Generally, the term of the lease agreements can be extended.

8 8 / 1 2 7 | t k D e v e lo pm e n t A / S | A n n uA l r e p o rt 2 0 1 2 / 1 3 | co n s o l i daT e d f i n a n c i a l sTaT e m e n Ts
N O T E S
n oT e 1 8 . i n v e s Tm e n T P r o P e rT i e s a n d i n v e s Tm e n T P r o P e rT i e s u n d e r c o n s T r u c T i o n ,
c o n T i n u e d
future minimum rent on irrevocable lease contracts (Total for the properties, not taking ownership share into consideration):
31 jan 2013 31 Jan 2012
Completedinvestmentproperties
Investmentproperties
underconstruction
Completedinvestmentproperties
Investmentproperties
underconstruction
Within 1 year from reporting date 67.7 - 3.1 -
Within 1 - 5 years from reporting date 171.0 - 77.9 -
After 5 years from reporting date 50.4 - 50.3 -
Total 289.1 - 131.3 -
the Czech investment property, the Futurum Hradec králové shopping centre, is owned in a joint venture with Ge Capital and Heitman.
tk Development has access to a performance-based share of the value adjustments on the property, which has been included in the
carrying amount. the joint venture has decided to attempt selling the property and has initiated the sales process. As in the previous
quarters, the valuation as at 31 January 2013 has been made on the basis of the ongoing sales process. the valuation at 31 January
2013 resulted in a negative value adjustment of Dkk 24.3 million, recognizing the negative value adjustment in the second quarter of
2012/13.
An extension of the Futurum Hradec králové shopping centre, comprising about 9,950 m², has been built. Construction progressed
according to plan, and the extension opened as scheduled on 10 may 2012. At the beginning of the financial year, the extension
was classified under “Investment properties under construction”, but was transferred to “Investment properties” in the second quar-
ter of 2012/13 following the completion of construction and the opening of the extension. thus, the extension is included in the
above-mentioned carrying amount.
tk Development’s 30 % ownership interest in Galeria tarnovia in poland has been valued at fair value based on completion of the sale
to Heitman of 70 % of the property in December 2012.
Following the sale of one investment property in December 2012, the Group now has four investment properties left in Germany. the
value of these properties totalled Dkk 167.3 million at 31 January 2013. the valuation of the properties is based on a return require-
ment of 6.5 % p.a. calculated on the basis of a discounted cash-flow model over a ten-year period and recognition of the terminal val-
ue in year ten. In the cases where sales negotiations are ongoing with potential investors, these negotiations form the basis for the
valuation. After the reporting date, yet another residential rental property has been sold, and the Group is negotiating with investors
about the sale of one of the remaining properties.
tk Development’s investment properties under construction consist of the Group’s ownership interest in the Jelenia Góra develop-
ment project in poland. tk Development has bought a plot of land in Jelenia Góra and has an option on additional land for the develop-
ment of a shopping centre of about 24,000 m². the project will comprise a supermarket of about 2,200 m² and retail, restaurant and
service premises totalling about 21,800 m². the local plan for the area is in place and the letting of premises has started. Construction
is expected to commence in 2013, and the shopping centre is scheduled to open in 2015. In December 2012, 70 % of the project was
handed over to Heitman, and in this connection the Group’s 30 % ownership interest was classified as an investment property under
construction. no value adjustment of the investment property was made at 31 January 2013, as the parties are awaiting final permits
for the project and further clarification of the building phase, including the timing of construction startup, construction period, etc.
the services of an external valuer have not been used to value the Group’s investment properties.

co n s o l i daT e d f i n a n c i a l sTaT e m e n Ts | A n n uA l r e p o rt 2 0 1 2 / 1 3 | t k D e v e lo pm e n t A / S | 8 9 / 1 2 7
N O T E S
n oT e 1 9 . oT h e r f i x T u r e s a n d f i T T i n g s , To o l s a n d eq u i Pm e n T
31 jan 2013 31 Jan 2012
Cost at 1 February 51.0 53.7
Foreign-exchange adjustments, beginning of year 0.1 -0.4
Additions 0.2 0.6
Disposals -3.7 -2.9
Cost at 31 january 47.6 51.0
Depreciation and impairment at 1 February 46.3 46.9
Foreign-exchange adjustments, beginning of year -0.1 -0.4
Depreciation for the year 2.3 2.6
Depreciation and impairment, assets disposed of -3.4 -2.8
Depreciation and impairment at 31 january 45.1 46.3
Carrying amount at 31 january 2.5 4.7
other fixtures and fittings, tools and equipment are depreciated over a term of five years. leasehold improvements included in the
above amounts are depreciated according to the straight-line method over the term of the lease. the carrying amount of leasehold
improvements is considered insignificant, for which reason other fixtures and fittings, tools and equipment are not divided into dif-
ferent classifications.
n oT e 2 0 . oT h e r s ec u r i T i e s a n d i n v e s Tm e n T s
31 jan 2013 31 Jan 2012
Cost at 1 February 16.9 16.9
Additions for the year 0.0 0.0
Disposals for the year -1.1 0.0
Cost at 31 january 15.8 16.9
revaluations and impairment at 1 February -15.0 -15.0
revaluations and impairment for the year 0.0 0.0
Revaluations and impairment at 31 january -15.0 -15.0
Carrying amount at 31 january 0.8 1.9
other securities and investments consist mainly of mortgage deeds on real property and unlisted shares. Instruments of indebted-
ness are measured at amortized cost. unlisted shares are measured at fair value (Fair value hierarchy: level 3).
the carrying amount of instruments of indebtedness corresponds to fair value. the fair value has been determined at the present
value of future principal repayments and interest payments by using the effective interest method.
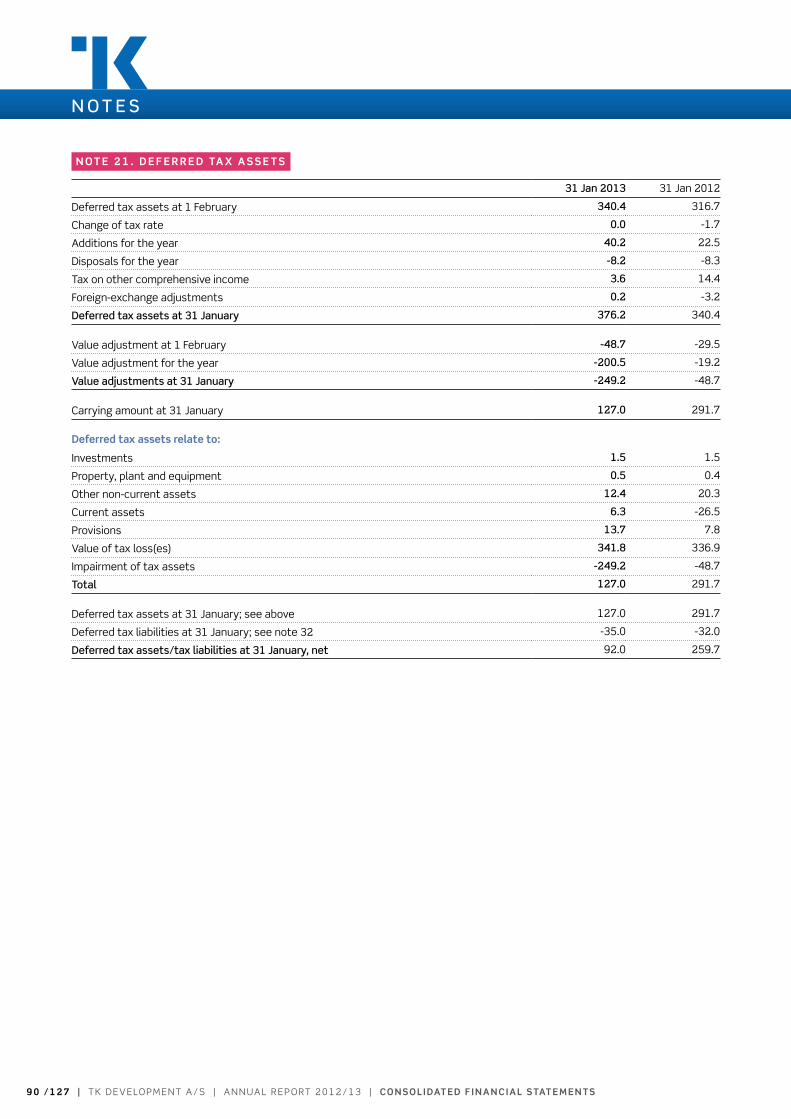
9 0 / 1 2 7 | t k D e v e lo pm e n t A / S | A n n uA l r e p o rt 2 0 1 2 / 1 3 | co n s o l i daT e d f i n a n c i a l sTaT e m e n Ts
n oT e 2 1 . d e f e r r e d Ta x a s s e T s
31 jan 2013 31 Jan 2012
Deferred tax assets at 1 February 340.4 316.7
Change of tax rate 0.0 -1.7
Additions for the year 40.2 22.5
Disposals for the year -8.2 -8.3
tax on other comprehensive income 3.6 14.4
Foreign-exchange adjustments 0.2 -3.2
Deferred tax assets at 31 january 376.2 340.4
value adjustment at 1 February -48.7 -29.5
value adjustment for the year -200.5 -19.2
value adjustments at 31 january -249.2 -48.7
Carrying amount at 31 January 127.0 291.7
deferred tax assets relate to:
Investments 1.5 1.5
property, plant and equipment 0.5 0.4
other non-current assets 12.4 20.3
Current assets 6.3 -26.5
provisions 13.7 7.8
value of tax loss(es) 341.8 336.9
Impairment of tax assets -249.2 -48.7
Total 127.0 291.7
Deferred tax assets at 31 January; see above 127.0 291.7
Deferred tax liabilities at 31 January; see note 32 -35.0 -32.0
Deferred tax assets/tax liabilities at 31 january, net 92.0 259.7
N O T E S

co n s o l i daT e d f i n a n c i a l sTaT e m e n Ts | A n n uA l r e p o rt 2 0 1 2 / 1 3 | t k D e v e lo pm e n t A / S | 9 1 / 1 2 7
N O T E S
n oT e 2 1 . d e f e r r e d Ta x a s s e T s , c o n T i n u e d
31 jan 2013
Deferred tax assets/
tax liabilitiesat
1 February, net
recognizedin profit/
loss
recognizedin other
comprehensiveincome
Foreignexchange
adjustments,beginning of
year
Deferred taxassets/
tax liabilities at
31 January, net
Investments 1.5 0.0 0.0 0.0 1.5
property, plant and equipment 0.4 0.0 0.0 0.0 0.4
other non-current assets 20.3 -7.9 0.0 0.0 12.4
Current assets -47.1 26.2 -1.6 0.4 -22.1
untaxed reserve relating to Sweden -16.1 7.0 0.0 -0.4 -9.5
provisions 7.8 5.9 0.0 0.0 13.7
value of tax losses 341.6 3.3 0.0 -0.1 344.8
Impairment of tax assets -48.7 -200.3 0.0 -0.2 -249.2
Total 259.7 -165.8 -1.6 -0.3 92.0
31 Jan 2012
Deferred tax assets/
tax liabilities at
1 February, net
recognizedin profit/
loss
recognizedin other
comprehensiveincome
Foreignexchange
adjustments,beginning of
year
Deferred taxassets/
tax liabilities at
31 January, net
Investments 1.5 0.0 0.0 0.0 1.5
property, plant and equipment 0.4 0.0 0.0 0.0 0.4
other non-current assets 18.4 1.9 0.0 0.0 20.3
Current assets -68.7 9.9 11.6 0.1 -47.1
untaxed reserve relating to Sweden -21.6 5.5 0.0 0.0 -16.1
provisions 3.4 4.5 0.0 -0.1 7.8
value of tax losses 328.2 14.2 0.0 -0.8 341.6
Impairment of tax assets -29.5 -19.7 0.0 0.5 -48.7
Total 232.1 16.3 11.6 -0.3 259.7
A significant share of the total tax asset relates to the Danish share of joint taxation, as the tax loss carryforwards have no expiry
date.
the valuation of the tax asset is based on existing budgets and profit forecasts for a five-year period. For the first three years, budg-
ets are based on an evaluation of specific projects in the Group’s project portfolio. the valuation for the next two years has been
based on specific projects in the project portfolio with a longer time horizon than three years as well as various project opportunities.
these valuations are subject to substantial uncertainty, for which reason a provision has been made for the risk that projects are
postponed or not implemented and the risk that project profits fall below expectations. on this basis, management assessed the
total impairment loss on the tax asset to be Dkk 249.2 million at 31 January 2013. At 31 January 2012, total impairment of the tax
asset amounted to Dkk 48.7 million.
the impairment of the tax asset relates mainly to Danish tax losses that can be carried forward perpetually, as well as polish and
Czech losses that expire within one to five years.
reference is made to note 2, accounting estimates and assessments.

9 2 / 1 2 7 | t k D e v e lo pm e n t A / S | A n n uA l r e p o rt 2 0 1 2 / 1 3 | co n s o l i daT e d f i n a n c i a l sTaT e m e n Ts
N O T E S
n oT e 2 2 . P r oj ec T s i n P r o g r e s s o r c o m P l e T e d
31 jan 2013 31 Jan 2012
projects in progress or completed excl. interest, etc. 3,300.5 3,464.9
Capitalized interest, etc. 589.9 529.8
payments received on account -369.6 -293.3
Impairment -489.9 -203.3
total projects in progress or completed 3,030.9 3,498.1
the carrying amount of the portion of the project portfolio on which impairment losses have been recognized is Dkk 1,531.7 million
(2011/12: Dkk 838.5 million).
n oT e 2 3 . T r a d e r ec e i va b l e s
31 jan 2013 31 Jan 2012
receivables from tenants 21.6 20.0
other trade receivables 69.1 48.4
Setoff in credit institutions -17.5 0.0
Total trade receivables 73.2 68.4
Impairment for the year recognized in the income statement -4.9 -5.2
31 jan 2013 31 Jan 2012
Impairment at 1 February 19.2 16.7
Correction of opening balance 0.2 2.3
Disposals on sale (provisions at beginning of year) -2.6 0.0
Foreign-exchange adjustments, beginning of year 0.1 -0.8
Applied for the year -7.6 -4.2
provisions for the year 8.7 7.0
Disposals on sale (provisions for the year) -3.7 0.0
reversed provisions 0.2 -1.8
Impairment at 31 january 14.1 19.2
Any impairment is made to the net realizable value, equal to the sum total of future net cash flows that the receivables are expected
to generate. Impairment losses on receivables are calculated on the basis of an assessment of the individual receivables. the car-
rying amount of receivables written down to net realizable value based on an individual assessment is Dkk 14.6 million. the corre-
sponding amount at 31 January 2012 was Dkk 16.1 million. the majority of the written-down receivables are past due. there are no
major overdue receivables that have not been written down for impairment.
In by far the most cases, receivables from tenants are secured by deposits or other guarantees, which are included in the basis for
any impairments.
the carrying amount of the receivables corresponds to the fair value. no interest income on impaired receivables was recognized as
revenue in the 2012/13 financial year or in the comparative year.
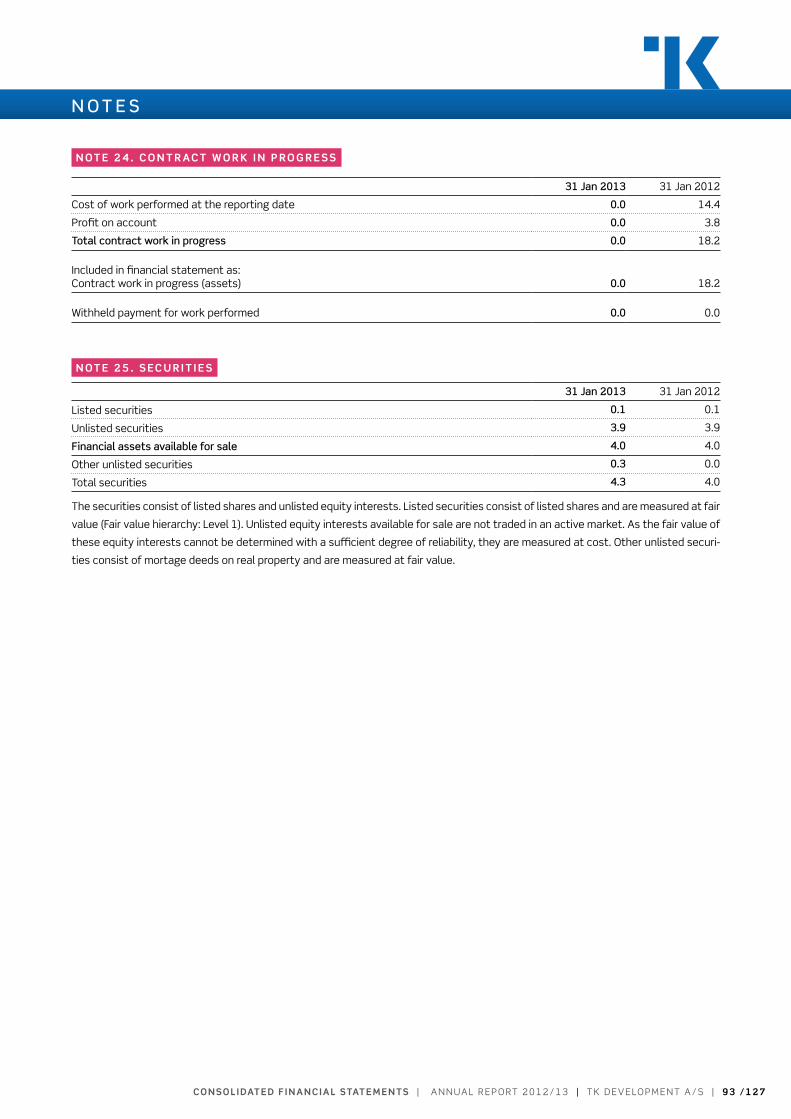
co n s o l i daT e d f i n a n c i a l sTaT e m e n Ts | A n n uA l r e p o rt 2 0 1 2 / 1 3 | t k D e v e lo pm e n t A / S | 9 3 / 1 2 7
N O T E S
n oT e 2 4 . c o n T r ac T w o r k i n P r o g r e s s
31 jan 2013 31 Jan 2012
Cost of work performed at the reporting date 0.0 14.4
profit on account 0.0 3.8
Total contract work in progress 0.0 18.2
Included in financial statement as:Contract work in progress (assets) 0.0 18.2
Withheld payment for work performed 0.0 0.0
n oT e 2 5 . s e c u r i T i e s 31 jan 2013 31 Jan 2012
listed securities 0.1 0.1
unlisted securities 3.9 3.9
financial assets available for sale 4.0 4.0
other unlisted securities 0.3 0.0
total securities 4.3 4.0
the securities consist of listed shares and unlisted equity interests. listed securities consist of listed shares and are measured at fair
value (Fair value hierarchy: level 1). unlisted equity interests available for sale are not traded in an active market. As the fair value of
these equity interests cannot be determined with a sufficient degree of reliability, they are measured at cost. other unlisted securi-
ties consist of mortage deeds on real property and are measured at fair value.

9 4 / 1 2 7 | t k D e v e lo pm e n t A / S | A n n uA l r e p o rt 2 0 1 2 / 1 3 | co n s o l i daT e d f i n a n c i a l sTaT e m e n Ts
n oT e 2 6 . d e P o s i T s i n c u s To dy a n d e s c r o w a c c o u n T s
31 jan 2013 31 Jan 2012
Custody accounts and other accounts that the Group cannot fully dispose of 35.7 48.0
Setoff of financial liabilities 0.0 -2.8
Total deposits in custody and escrow accounts 35.7 45.2
n oT e 2 7 . s h a r e ca P i Ta l
the share capital consists of 42,065,715 shares of Dkk 15 each (nom. Dkk 630,985,725). the share capital has been paid up in full.
the shares are not divided into several share classes, and no shares are subject to special rights or restrictions, including restrictions
with regard to the payment of dividend and repayment of capital.
changes in the share capital over the past five years:
number in thousands nominel value
Changes Year-end Changes Year-end
2008/09 0.0 28,043.8 0.0 560.9
2009/10 0.0 28,043.8 0.0 560.9
2010/11:
Capital reduction on change of share denomination from nom. 20 to nom. 15 - 28,043.8 -140.2 420.7
Capital increase against cash payment 14,021.9 42,065.7 210.3 631.0
2011/12 0.0 42,065.7 0.0 631.0
2012/13 0.0 42,065.7 0.0 631.0
the Group did not hold treasury shares in the 2012/13 financial year or in the comparative year.
N O T E S
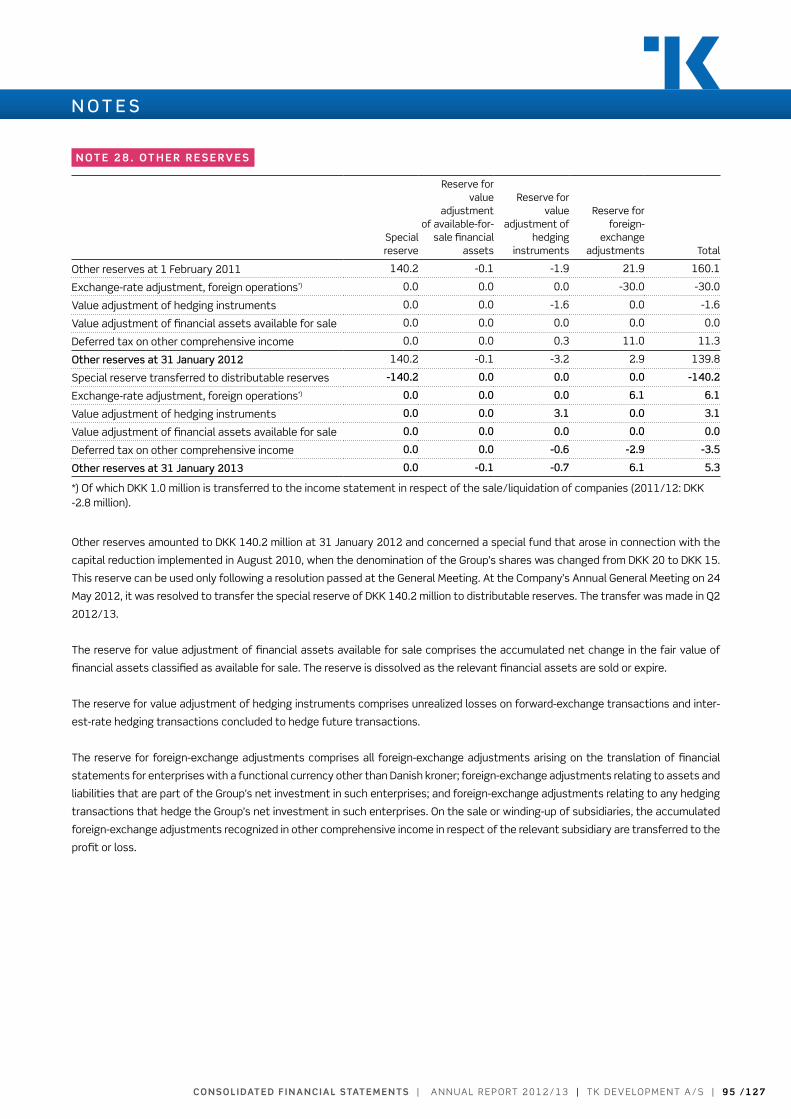
co n s o l i daT e d f i n a n c i a l sTaT e m e n Ts | A n n uA l r e p o rt 2 0 1 2 / 1 3 | t k D e v e lo pm e n t A / S | 9 5 / 1 2 7
N O T E S
n oT e 2 8 . oT h e r r e s e rv e s
Specialreserve
reserve for value
adjustmentof available-for-
sale financialassets
reserve forvalue
adjustment ofhedging
instruments
reserve forforeign-
exchangeadjustments total
other reserves at 1 February 2011 140.2 -0.1 -1.9 21.9 160.1
exchange-rate adjustment, foreign operations*) 0.0 0.0 0.0 -30.0 -30.0
value adjustment of hedging instruments 0.0 0.0 -1.6 0.0 -1.6
value adjustment of financial assets available for sale 0.0 0.0 0.0 0.0 0.0
Deferred tax on other comprehensive income 0.0 0.0 0.3 11.0 11.3
Other reserves at 31 january 2012 140.2 -0.1 -3.2 2.9 139.8
Special reserve transferred to distributable reserves -140.2 0.0 0.0 0.0 -140.2
exchange-rate adjustment, foreign operations*) 0.0 0.0 0.0 6.1 6.1
value adjustment of hedging instruments 0.0 0.0 3.1 0.0 3.1
value adjustment of financial assets available for sale 0.0 0.0 0.0 0.0 0.0
Deferred tax on other comprehensive income 0.0 0.0 -0.6 -2.9 -3.5
Other reserves at 31 january 2013 0.0 -0.1 -0.7 6.1 5.3
*) of which Dkk 1.0 million is transferred to the income statement in respect of the sale/liquidation of companies (2011/12: Dkk -2.8 million).
other reserves amounted to Dkk 140.2 million at 31 January 2012 and concerned a special fund that arose in connection with the
capital reduction implemented in August 2010, when the denomination of the Group’s shares was changed from Dkk 20 to Dkk 15.
this reserve can be used only following a resolution passed at the General meeting. At the Company’s Annual General meeting on 24
may 2012, it was resolved to transfer the special reserve of Dkk 140.2 million to distributable reserves. the transfer was made in Q2
2012/13.
the reserve for value adjustment of financial assets available for sale comprises the accumulated net change in the fair value of
financial assets classified as available for sale. the reserve is dissolved as the relevant financial assets are sold or expire.
the reserve for value adjustment of hedging instruments comprises unrealized losses on forward-exchange transactions and inter-
est-rate hedging transactions concluded to hedge future transactions.
the reserve for foreign-exchange adjustments comprises all foreign-exchange adjustments arising on the translation of financial
statements for enterprises with a functional currency other than Danish kroner; foreign-exchange adjustments relating to assets and
liabilities that are part of the Group’s net investment in such enterprises; and foreign-exchange adjustments relating to any hedging
transactions that hedge the Group’s net investment in such enterprises. on the sale or winding-up of subsidiaries, the accumulated
foreign-exchange adjustments recognized in other comprehensive income in respect of the relevant subsidiary are transferred to the
profit or loss.
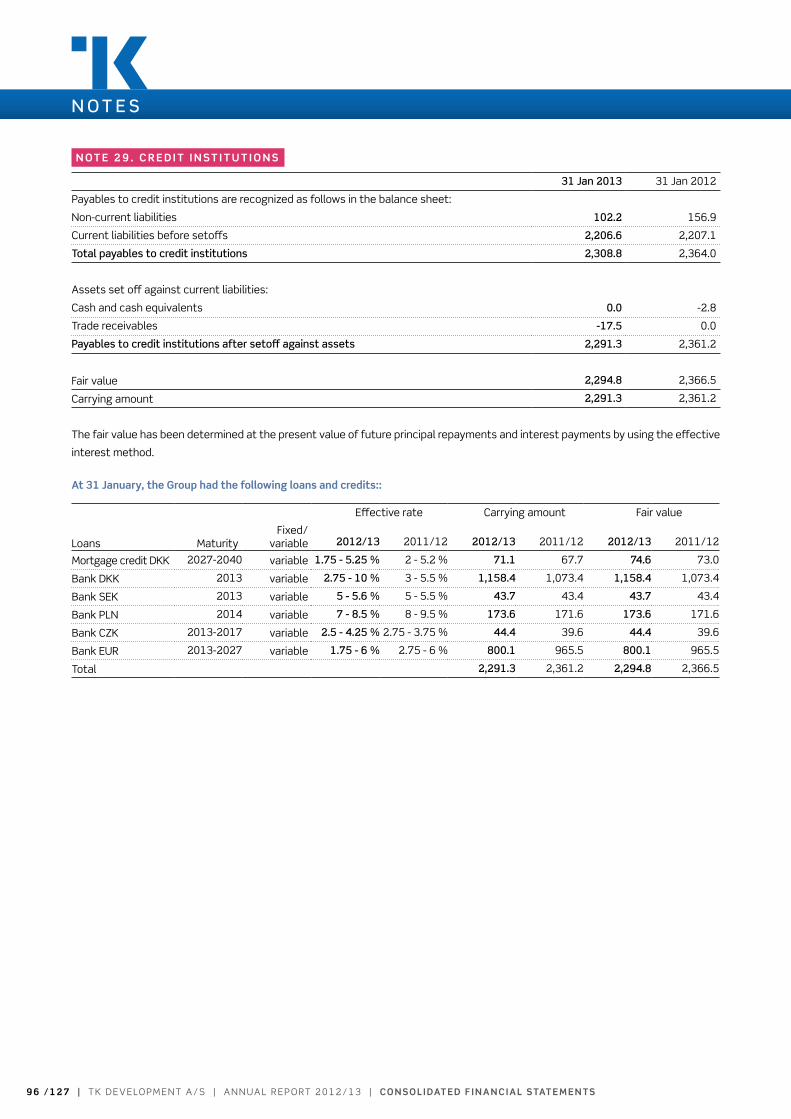
9 6 / 1 2 7 | t k D e v e lo pm e n t A / S | A n n uA l r e p o rt 2 0 1 2 / 1 3 | co n s o l i daT e d f i n a n c i a l sTaT e m e n Ts
N O T E S
n oT e 2 9 . c r e d i T i n s T i T u T i o n s
31 jan 2013 31 Jan 2012
payables to credit institutions are recognized as follows in the balance sheet:
non-current liabilities 102.2 156.9
Current liabilities before setoffs 2,206.6 2,207.1
Total payables to credit institutions 2,308.8 2,364.0
Assets set off against current liabilities:
Cash and cash equivalents 0.0 -2.8
trade receivables -17.5 0.0
Payables to credit institutions after setoff against assets 2,291.3 2,361.2
Fair value 2,294.8 2,366.5
Carrying amount 2,291.3 2,361.2
the fair value has been determined at the present value of future principal repayments and interest payments by using the effective
interest method.
at 31 january, the group had the following loans and credits::
effective rate Carrying amount Fair value
loans maturityFixed/
va riable 2012/13 2011/12 2012/13 2011/12 2012/13 2011/12
mortgage credit Dkk 2027-2040 variable 1.75 - 5.25 % 2 - 5.2 % 71.1 67.7 74.6 73.0
Bank Dkk 2013 variable 2.75 - 10 % 3 - 5.5 % 1,158.4 1,073.4 1,158.4 1,073.4
Bank Sek 2013 variable 5 - 5.6 % 5 - 5.5 % 43.7 43.4 43.7 43.4
Bank pln 2014 variable 7 - 8.5 % 8 - 9.5 % 173.6 171.6 173.6 171.6
Bank CZk 2013-2017 variable 2.5 - 4.25 % 2.75 - 3.75 % 44.4 39.6 44.4 39.6
Bank eur 2013-2027 variable 1.75 - 6 % 2.75 - 6 % 800.1 965.5 800.1 965.5
total 2,291.3 2,361.2 2,294.8 2,366.5

co n s o l i daT e d f i n a n c i a l sTaT e m e n Ts | A n n uA l r e p o rt 2 0 1 2 / 1 3 | t k D e v e lo pm e n t A / S | 9 7 / 1 2 7
N O T E S
n oT e 3 0 . P r ov i s i o n s
31 jan 2013 31 Jan 2012
rent guarantees for properties sold at 1 February 14.6 17.3
Foreign-exchange adjustments, beginning of year 0.4 -0.1
Applied during the year -11.3 -11.4
reversed rent guarantees -0.1 -0.2
provisions for the year 11.8 9.0
rent guarantees for properties sold at 31 January 15.4 14.6
provisions at 31 January 15.4 14.6
31 jan 2013 31 Jan 2012
expected maturity dates of the liabilities provided for:
0-1 year 13.1 11.6
1-5 years 2.2 3.0
> 5 years 0.1 0.0
provisions at 31 January 15.4 14.6
rent guarantee liabilities for sold properties relate to guarantees issued by the Group in a few cases towards the buyers of the
properties. rent guarantee liabilities have been calculated based on experience with rent guarantees and an individual assessment
of each lease.
n oT e 3 1 . o P e r aT i n g l e a s e s
For the years 2013-2018, operating leases for the rental of office premises, office machines and operating equipment have been
concluded. the leases have been concluded for a one to five-year period with fixed lease payments that are index-adjusted annually.
the leases are non-terminable for the period mentioned, after which it is expected that the majority can be renewed for one to three-
year periods.
future minimum lease payments according to non-terminable lease contracts break down as follows:
2012/13 2011/12
Within 1 year 10.3 9.7
Within 1-5 years 18.6 10.2
After 5 years 0.9 0.1
total 29.8 20.0
minimum lease payments for the year recognized in the income statement 11.4 12.2

9 8 / 1 2 7 | t k D e v e lo pm e n t A / S | A n n uA l r e p o rt 2 0 1 2 / 1 3 | co n s o l i daT e d f i n a n c i a l sTaT e m e n Ts
N O T E S
n oT e 3 2 . d e f e r r e d Ta x l i a b i l i T i e s
31 jan 2013 31 Jan 2012
Deferred tax liability at 1 February 32.0 55.1
Change of tax rate -1.1 0.0
Additions for the year 5.6 3.8
Disposals for the year -2.9 -27.6
tax on other comprehensive income 0.9 3.6
Foreign-exchange adjustments 0.5 -2.9
Deferred tax liabilities at 31 January 35.0 32.0
deferred tax liabilities relate to:
Current assets 28.5 20.6
untaxed reserve relating to Sweden 9.5 16.1
provisions 0.0 0.0
value of tax losses -3.0 -4.7
total 35.0 32.0
the Group has no deferred tax liabilities relating to investments in subsidiaries, associates or joint ventures that have not been rec-
ognized in the balance sheet. the contingent retaxation liability attaching to German subsidiaries regarding which no provisions for
deferred tax have been made amounted to Dkk 97.4 million (2011/12: Dkk 97.4 million). the Company controls whether such tax
liability will be triggered, which is considered unlikely.
n oT e 3 3 . oT h e r d e bT
31 jan 2013 31 Jan 2012
employee-related payables 6.8 10.3
Holiday pay obligations 7.7 8.1
Derivative financial instruments 0.9 4.0
other debt 136.3 134.8
other debt, total 151.7 157.2
broken down as follows under liabilities:
non-current liabilities (employee bonds) 1.5 3.8
Current liabilities 150.2 153.4
other debt, total 151.7 157.2
the carrying amount of employee-related payables consisting of salaries, A-tax, social security contributions, holiday pay, etc., pro-
ject-related costs and other costs payable is equal to the fair value of these payables.
Holiday pay obligations represent the Group’s liability to pay salary during holiday periods to which the employees had earned entitle-
ment by the reporting date and which are to be taken in the following financial year(s).
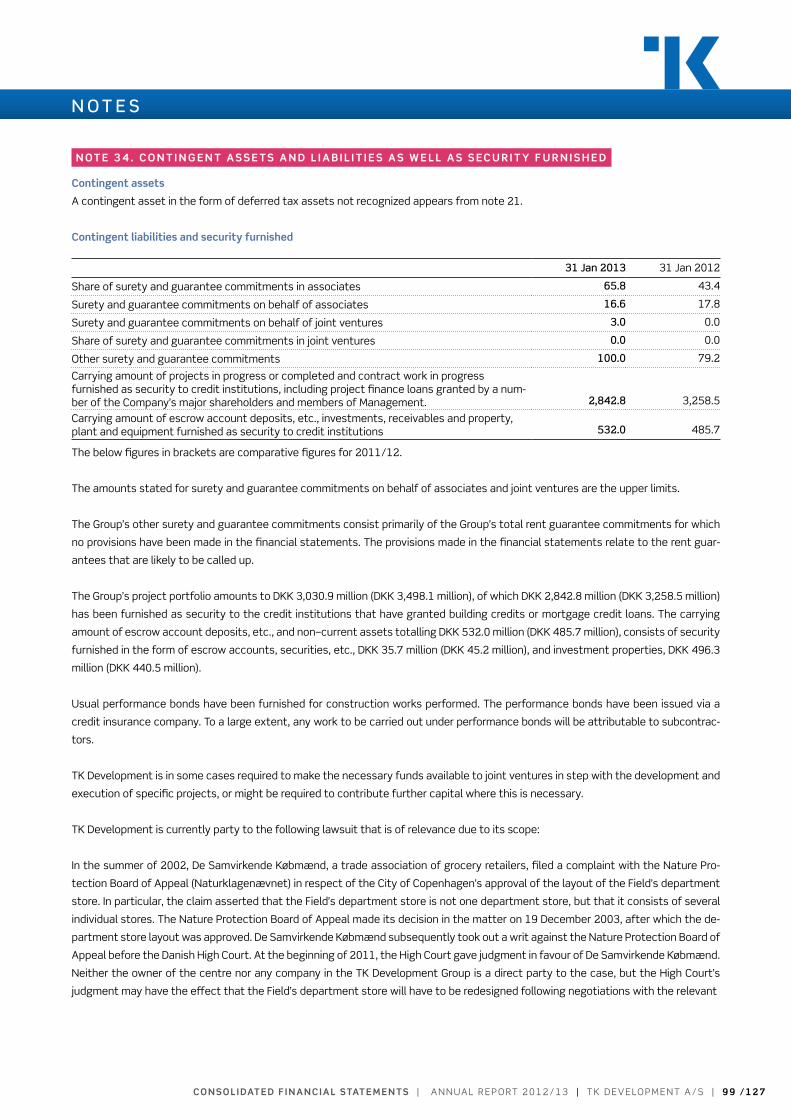
co n s o l i daT e d f i n a n c i a l sTaT e m e n Ts | A n n uA l r e p o rt 2 0 1 2 / 1 3 | t k D e v e lo pm e n t A / S | 9 9 / 1 2 7
N O T E S
n oT e 3 4 . c o n T i n g e n T a s s e T s a n d l i a b i l i T i e s a s w e l l a s s ec u r i T y f u r n i s h e d
contingent assets
A contingent asset in the form of deferred tax assets not recognized appears from note 21.
contingent liabilities and security furnished
31 jan 2013 31 Jan 2012
Share of surety and guarantee commitments in associates 65.8 43.4
Surety and guarantee commitments on behalf of associates 16.6 17.8
Surety and guarantee commitments on behalf of joint ventures 3.0 0.0
Share of surety and guarantee commitments in joint ventures 0.0 0.0
other surety and guarantee commitments 100.0 79.2
Carrying amount of projects in progress or completed and contract work in progress furnished as security to credit institutions, including project finance loans granted by a num-ber of the Company’s major shareholders and members of management. 2,842.8 3,258.5
Carrying amount of escrow account deposits, etc., investments, receivables and property, plant and equipment furnished as security to credit institutions 532.0 485.7
the below figures in brackets are comparative figures for 2011/12.
the amounts stated for surety and guarantee commitments on behalf of associates and joint ventures are the upper limits.
the Group’s other surety and guarantee commitments consist primarily of the Group’s total rent guarantee commitments for which
no provisions have been made in the financial statements. the provisions made in the financial statements relate to the rent guar-
antees that are likely to be called up.
the Group’s project portfolio amounts to Dkk 3,030.9 million (Dkk 3,498.1 million), of which Dkk 2,842.8 million (Dkk 3,258.5 million)
has been furnished as security to the credit institutions that have granted building credits or mortgage credit loans. the carrying
amount of escrow account deposits, etc., and non–current assets totalling Dkk 532.0 million (Dkk 485.7 million), consists of security
furnished in the form of escrow accounts, securities, etc., Dkk 35.7 million (Dkk 45.2 million), and investment properties, Dkk 496.3
million (Dkk 440.5 million).
usual performance bonds have been furnished for construction works performed. the performance bonds have been issued via a
credit insurance company. to a large extent, any work to be carried out under performance bonds will be attributable to subcontrac-
tors.
tk Development is in some cases required to make the necessary funds available to joint ventures in step with the development and
execution of specific projects, or might be required to contribute further capital where this is necessary.
tk Development is currently party to the following lawsuit that is of relevance due to its scope:
In the summer of 2002, De Samvirkende købmænd, a trade association of grocery retailers, filed a complaint with the nature pro-
tection Board of Appeal (naturklagenævnet) in respect of the City of Copenhagen’s approval of the layout of the Field’s department
store. In particular, the claim asserted that the Field’s department store is not one department store, but that it consists of several
individual stores. the nature protection Board of Appeal made its decision in the matter on 19 December 2003, after which the de-
partment store layout was approved. De Samvirkende købmænd subsequently took out a writ against the nature protection Board of
Appeal before the Danish High Court. At the beginning of 2011, the High Court gave judgment in favour of De Samvirkende købmænd.
neither the owner of the centre nor any company in the tk Development Group is a direct party to the case, but the High Court’s
judgment may have the effect that the Field’s department store will have to be redesigned following negotiations with the relevant

1 0 0 / 1 2 7 | t k D e v e lo pm e n t A / S | A n n uA l r e p o rt 2 0 1 2 / 1 3 | co n s o l i daT e d f i n a n c i a l sTaT e m e n Ts
N O T E S
n oT e 3 4 . c o n T i n g e n T a s s e T s a n d l i a b i l i T i e s a s w e l l a s s ec u r i T y f u r n i s h e d , c o n T i n u e d
local authorities. As a result of the judgment, the owner of Field’s may have to incur the financial burden of causing the necessary
changes to the building layout, and in that connection it cannot be ruled out that a claim may be made against the Group. regardless
of the judgment, management still believes the risk of this case to be negligible.
In addition, the Group is involved in a few disputes, none of which is deemed to have a scope that, either individually or collectively,
may affect the Group’s performance to any appreciable extent.
the contingent retaxation liability attaching to German subsidiaries regarding which no provisions for deferred tax have been made
amounts to Dkk 97.4 million (Dkk 97.4 million). the Company controls whether such tax liability will be triggered, which is con-
sidered unlikely.
n oT e 3 5 . f i n a n c i a l r i s k s a n d f i n a n c i a l i n s T r u m e n T s
capital management
the Group’s capital structure consists of equity, cash and cash equivalents and payables to credit institutions.
the Company’s management reviews the Group’s capital structure on a regular basis, as well as the need for any adjustments. man-
agement’s overall aim is to provide a capital structure that supports the Group’s earnings potential, while at the same time ensuring
the best possible relation between equity and loan capital and thus maximizing the return for the Company’s shareholders. In order
to strengthen the Group’s financial platform, the Supervisory Board will request authorization at the forthcoming Annual General
meeting to carry out a capital increase with gross proceeds of about Dkk 210-231 million.
financial targets
the Group has adopted a solvency target corresponding to a solvency ratio of around 30 %, and compliance with this target also rep-
resents a covenant that commits the Group vis-à-vis its main banker. this target was met throughout the financial year. the solvency
ratio was 34.7 % at 31 January 2013 (31 January 2012: 40.4 %).
liquidity covenant
the Group has used liquidity covenants for quite some years. In short, the liquidity covenant expresses that the Group’s cash resourc-
es – to enable the Group to cover liabilities requiring substantial liquidity - must at any time correspond to the fixed costs for the
next six-month period, excluding funds received as proceeds from projects sold, but including project liabilities materializing within
the next six months.
the covenant represents a liquidity target for the whole Group and a commitment to the Group’s main banker. the covenant must be
calculated and met before projects requiring liquidity can be acquired and initiated.
the covenant is expressed as follows: l + k > e + o + r, where:
l = the tk Development Group’s free cash resources in the form of deposits with banks and the value of listed Danish government and mort-
gage bonds with a term to maturity of less than five years.
k = the tk Development Group’s amounts available on committed operating credit facilities from time to time.
e = the planned impact on cash resources from the projects which the tk Development Group is obliged to complete within
six months, including the new/expanded project, taking into account committed project credit facilities from financial
institutions and forward funding.
o = the tk Development Group’s cash non-project-related capacity costs for the following six months less management
fees falling due within six months. In addition, pre-agreed project fees from final and binding agreements with project
investors falling due within six months are to be set off against the amount.
r = Interest accruing on the tk Development Group’s operating credit facilities for the following six months.

co n s o l i daT e d f i n a n c i a l sTaT e m e n Ts | A n n uA l r e p o rt 2 0 1 2 / 1 3 | t k D e v e lo pm e n t A / S | 1 0 1 / 1 2 7
N O T E S
n oT e 3 5 . f i n a n c i a l r i s k s a n d f i n a n c i a l i n s T r u m e n T s , c o n T i n u e d
the Group’s solvency and liquidity covenant were both met during the year under review.
dividend policy
tk’ Development’s long-term policy is to distribute a portion of the year’s profit as dividends or alternatively via a share repurchase pro-
gramme. this will always be done with due regard for the Group’s capital structure, solvency, cash resources and investment plans.
breach of loan agreements
During the year under review, the Group was in continuous dialogue with a few credit institutions regarding the postponement of re-
payment obligations on project credits until one or more of the major completed projects have been sold, and agreements regarding
the postponement of such repayments have now fallen into place.
The group’s risk management policy
As a consequence of its activities, tk Development is exposed to fluctuations in foreign-exchange and interest rates. the overall
objective of the Group’s risk policy is to manage risks and exposures and thus minimize the negative effects on earnings and cash
flows. to the extent possible, the parent Company manages the Group’s financial risks centrally and coordinates the Group’s liquidity
management, including the raising of funds and the investment of surplus funds.
foreign-exchange risks
the Group primarily hedges its foreign-exchange risks by matching the currency of payments received with the currency of payments
made. As a main rule, the financing of the individual projects, whether raised with credit institutions or by forward funding, is raised in
the same currency as the currency agreed upon or expected to be used for the project sale. likewise, the main rule is for construction
contracts to be concluded in the project invoicing currency. In the cases where the Company concludes the construction contract
in a different currency than the relevant project’s invoicing currency, it will be assessed in each case whether the foreign-exchange
risk is to be hedged through a forward agreement or other derivative financial instruments. In the 2012/13 financial year, the group
did not enter into any forward agreements or other financial instruments. In the 2011/12 financial year, the Group entered into a few
forward agreements that had all been settled by the end of the 2011/12 financial year.
Categories of financial instruments 31 jan 2013 31 Jan 2012
other securities and investments, non-current 0.8 1.9
Securities, current 0.3 0.0
financial assets held to maturity 1.1 1.9
trade receivables 73.2 68.4
receivables from associates 23.6 20.4
other receivables 122.4 131.4
Cash, cash equivalents, including custody and escrow accounts 66.9 100.3
Loans and receivables 286.1 320.5
Securities 4.0 4.0
financial assets available for sale 4.0 4.0
Credit institutions 2,291.3 2,361.2
trade payables 106.3 159.8
other debt 150.8 153.2
financial liabilities measured at amortized cost 2,548.4 2,674.2
Derivative financial instruments entered into to hedge interest rates 0.9 4.0
hedging instruments 0.9 4.0
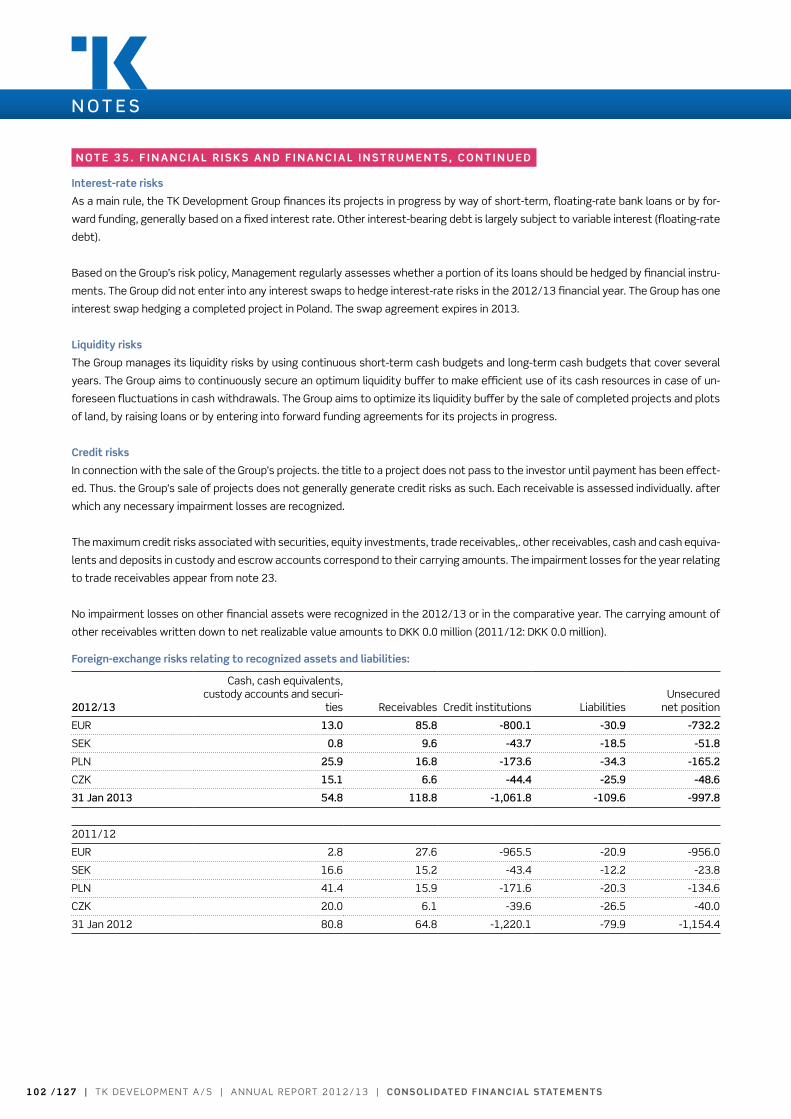
1 0 2 / 1 2 7 | t k D e v e lo pm e n t A / S | A n n uA l r e p o rt 2 0 1 2 / 1 3 | co n s o l i daT e d f i n a n c i a l sTaT e m e n Ts
N O T E S
n oT e 3 5 . f i n a n c i a l r i s k s a n d f i n a n c i a l i n s T r u m e n T s , c o n T i n u e d
interest-rate risks
As a main rule, the tk Development Group finances its projects in progress by way of short-term, floating-rate bank loans or by for-
ward funding, generally based on a fixed interest rate. other interest-bearing debt is largely subject to variable interest (floating-rate
debt).
Based on the Group’s risk policy, management regularly assesses whether a portion of its loans should be hedged by financial instru-
ments. the Group did not enter into any interest swaps to hedge interest-rate risks in the 2012/13 financial year. the Group has one
interest swap hedging a completed project in poland. the swap agreement expires in 2013.
liquidity risks
the Group manages its liquidity risks by using continuous short-term cash budgets and long-term cash budgets that cover several
years. the Group aims to continuously secure an optimum liquidity buffer to make efficient use of its cash resources in case of un-
foreseen fluctuations in cash withdrawals. the Group aims to optimize its liquidity buffer by the sale of completed projects and plots
of land, by raising loans or by entering into forward funding agreements for its projects in progress.
credit risks
In connection with the sale of the Group’s projects. the title to a project does not pass to the investor until payment has been effect-
ed. thus. the Group’s sale of projects does not generally generate credit risks as such. each receivable is assessed individually. after
which any necessary impairment losses are recognized.
the maximum credit risks associated with securities, equity investments, trade receivables,. other receivables, cash and cash equiva-
lents and deposits in custody and escrow accounts correspond to their carrying amounts. the impairment losses for the year relating
to trade receivables appear from note 23.
no impairment losses on other financial assets were recognized in the 2012/13 or in the comparative year. the carrying amount of
other receivables written down to net realizable value amounts to Dkk 0.0 million (2011/12: Dkk 0.0 million).
foreign-exchange risks relating to recognized assets and liabilities:
2012/13
Cash, cash equivalents,custody accounts and securi-
ties receivables Credit institutions liabilitiesunsecured
net position
eur 13.0 85.8 -800.1 -30.9 -732.2
Sek 0.8 9.6 -43.7 -18.5 -51.8
pln 25.9 16.8 -173.6 -34.3 -165.2
CZk 15.1 6.6 -44.4 -25.9 -48.6
31 jan 2013 54.8 118.8 -1,061.8 -109.6 -997.8
2011/12
eur 2.8 27.6 -965.5 -20.9 -956.0
Sek 16.6 15.2 -43.4 -12.2 -23.8
pln 41.4 15.9 -171.6 -20.3 -134.6
CZk 20.0 6.1 -39.6 -26.5 -40.0
31 Jan 2012 80.8 64.8 -1,220.1 -79.9 -1,154.4
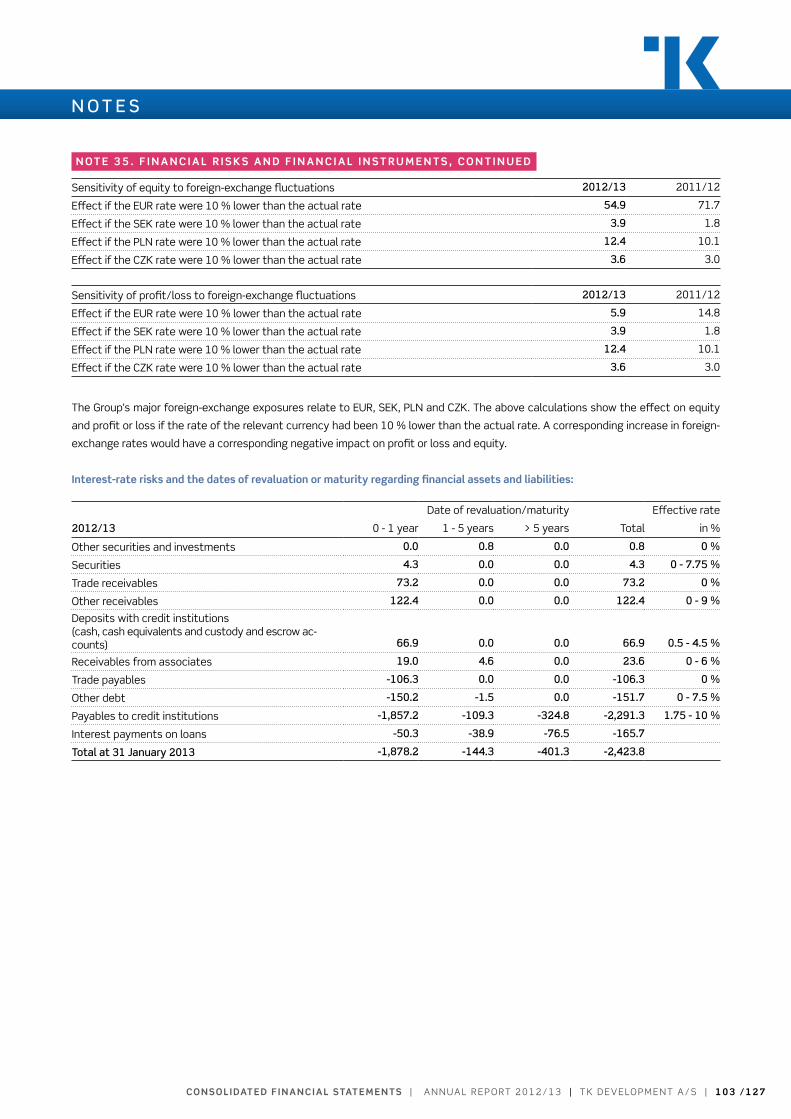
co n s o l i daT e d f i n a n c i a l sTaT e m e n Ts | A n n uA l r e p o rt 2 0 1 2 / 1 3 | t k D e v e lo pm e n t A / S | 1 0 3 / 1 2 7
n oT e 3 5 . f i n a n c i a l r i s k s a n d f i n a n c i a l i n s T r u m e n T s , c o n T i n u e d
Sensitivity of equity to foreign-exchange fluctuations 2012/13 2011/12
effect if the eur rate were 10 % lower than the actual rate 54.9 71.7
effect if the Sek rate were 10 % lower than the actual rate 3.9 1.8
effect if the pln rate were 10 % lower than the actual rate 12.4 10.1
effect if the CZk rate were 10 % lower than the actual rate 3.6 3.0
Sensitivity of profit/loss to foreign-exchange fluctuations 2012/13 2011/12
effect if the eur rate were 10 % lower than the actual rate 5.9 14.8
effect if the Sek rate were 10 % lower than the actual rate 3.9 1.8
effect if the pln rate were 10 % lower than the actual rate 12.4 10.1
effect if the CZk rate were 10 % lower than the actual rate 3.6 3.0
the Group’s major foreign-exchange exposures relate to eur, Sek, pln and CZk. the above calculations show the effect on equity
and profit or loss if the rate of the relevant currency had been 10 % lower than the actual rate. A corresponding increase in foreign-
exchange rates would have a corresponding negative impact on profit or loss and equity.
interest-rate risks and the dates of revaluation or maturity regarding financial assets and liabilities:
Date of revaluation/maturity effective rate
2012/13 0 - 1 year 1 - 5 years > 5 years total in %
other securities and investments 0.0 0.8 0.0 0.8 0 %
Securities 4.3 0.0 0.0 4.3 0 - 7.75 %
trade receivables 73.2 0.0 0.0 73.2 0 %
other receivables 122.4 0.0 0.0 122.4 0 - 9 %
Deposits with credit institutions(cash, cash equivalents and custody and escrow ac-counts) 66.9 0.0 0.0 66.9 0.5 - 4.5 %
receivables from associates 19.0 4.6 0.0 23.6 0 - 6 %
trade payables -106.3 0.0 0.0 -106.3 0 %
other debt -150.2 -1.5 0.0 -151.7 0 - 7.5 %
payables to credit institutions -1,857.2 -109.3 -324.8 -2,291.3 1.75 - 10 %
Interest payments on loans -50.3 -38.9 -76.5 -165.7
Total at 31 january 2013 -1,878.2 -144.3 -401.3 -2,423.8
N O T E S
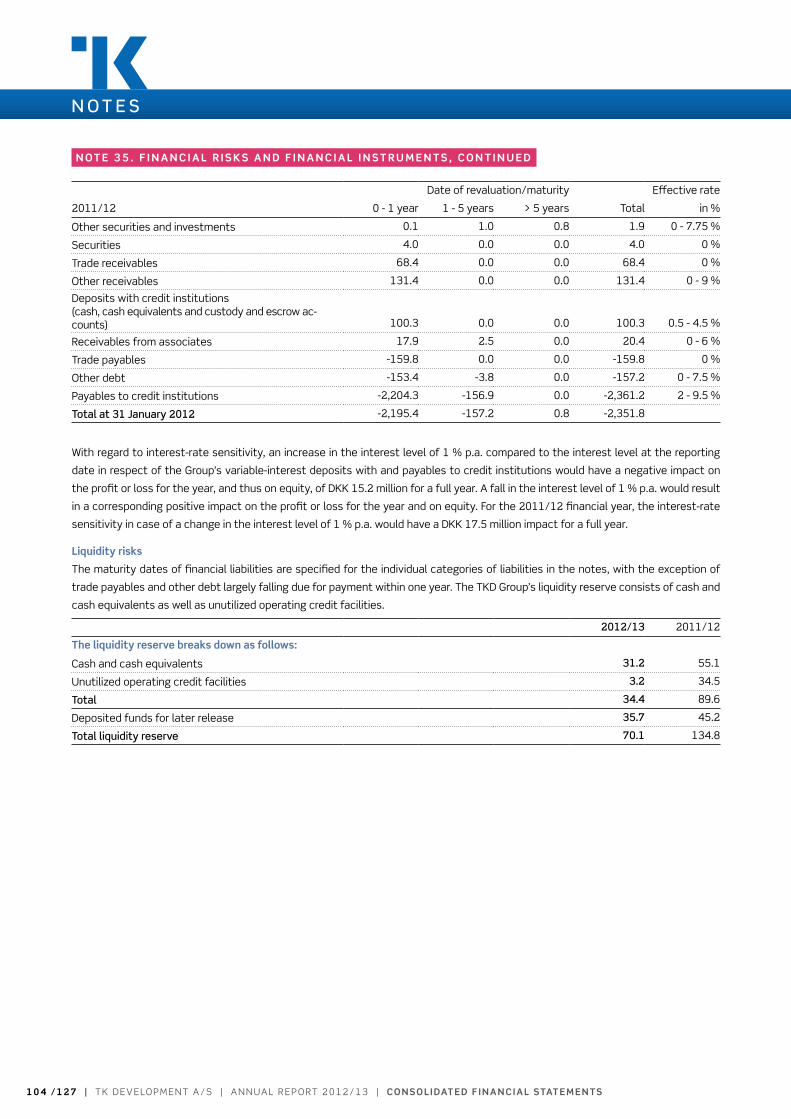
1 0 4 / 1 2 7 | t k D e v e lo pm e n t A / S | A n n uA l r e p o rt 2 0 1 2 / 1 3 | co n s o l i daT e d f i n a n c i a l sTaT e m e n Ts
N O T E S
n oT e 3 5 . f i n a n c i a l r i s k s a n d f i n a n c i a l i n s T r u m e n T s , c o n T i n u e d
Date of revaluation/maturity effective rate
2011/12 0 - 1 year 1 - 5 years > 5 years total in %
other securities and investments 0.1 1.0 0.8 1.9 0 - 7.75 %
Securities 4.0 0.0 0.0 4.0 0 %
trade receivables 68.4 0.0 0.0 68.4 0 %
other receivables 131.4 0.0 0.0 131.4 0 - 9 %
Deposits with credit institutions(cash, cash equivalents and custody and escrow ac-counts) 100.3 0.0 0.0 100.3 0.5 - 4.5 %
receivables from associates 17.9 2.5 0.0 20.4 0 - 6 %
trade payables -159.8 0.0 0.0 -159.8 0 %
other debt -153.4 -3.8 0.0 -157.2 0 - 7.5 %
payables to credit institutions -2,204.3 -156.9 0.0 -2,361.2 2 - 9.5 %
Total at 31 january 2012 -2,195.4 -157.2 0.8 -2,351.8
With regard to interest-rate sensitivity, an increase in the interest level of 1 % p.a. compared to the interest level at the reporting
date in respect of the Group’s variable-interest deposits with and payables to credit institutions would have a negative impact on
the profit or loss for the year, and thus on equity, of Dkk 15.2 million for a full year. A fall in the interest level of 1 % p.a. would result
in a corresponding positive impact on the profit or loss for the year and on equity. For the 2011/12 financial year, the interest-rate
sensitivity in case of a change in the interest level of 1 % p.a. would have a Dkk 17.5 million impact for a full year.
liquidity risks
the maturity dates of financial liabilities are specified for the individual categories of liabilities in the notes, with the exception of
trade payables and other debt largely falling due for payment within one year. the tkD Group’s liquidity reserve consists of cash and
cash equivalents as well as unutilized operating credit facilities.
2012/13 2011/12
The liquidity reserve breaks down as follows:
Cash and cash equivalents 31.2 55.1
unutilized operating credit facilities 3.2 34.5
Total 34.4 89.6
Deposited funds for later release 35.7 45.2
Total liquidity reserve 70.1 134.8

co n s o l i daT e d f i n a n c i a l sTaT e m e n Ts | A n n uA l r e p o rt 2 0 1 2 / 1 3 | t k D e v e lo pm e n t A / S | 1 0 5 / 1 2 7
N O T E S
n oT e 3 6 . T r a n sac T i o n s w i T h r e l aT e d Pa rT i e s
the Company has no related parties with a controlling interest.
the Company has the following related parties:
Supervisory Board and executive Board (and their related parties)
Joint ventures and associates; see the overview of group companies, note 39.
2012/13 2011/12
supervisory board and executive board (and their related parties)
Holding of shares, in terms of number 1,940.251 1,355.435
obligation towards executive Board, employee bonds 1.5 1.5
remuneration, Supervisory Board 1.8 2.1
remuneration, executive Board, see note 7 6.2 8.4
Interest expenses, project financing from Supervisory and executive Board 0.4 0.0
project financing from Supervisory and executive Board 21.7 0.0
Accrued interests, project financing from Supervisory and executive Board 0.3 0.0
joint ventures
Fees from joint ventures 1.5 1.7
Interest income from joint ventures 2.5 2.7
Interest expenses, joint ventures -1.3 -2.8
receivables from joint ventures 46.2 74.5
payables to joint ventures 88.4 88.2
associates
Interest income from associates 0.4 0.3
receivables from associates 23.6 20.4
Suretyships and guarantees have been issued on behalf of joint ventures and associates; see note 34.
Apart from the above, there were no transactions with related parties in the year under review. In accordance with the accounting
policies, transactions with subsidiaries are eliminated in the consolidated financial statements.
the Group has taken out second mortgages on two projects of Dkk 5 million each as security for project finance loans granted by
the Supervisory Board and the executive Board. moreover, as security for the total project finance loans granted by a group of the
Company’s major shareholders, of which the share granted by the Supervisory Board and the executive Board amounts to Dkk 21.7
million, the Group has granted a mortgage of Dkk 70 million on the land for the project to be financed by the loans.
receivables and payables are settled by payment in cash. no losses were realized on receivables from related parties. In 2012/13 no
impairment was made to provide for any probable losses (2011/12: Dkk 0.0 million).
1 0 6 / 1 2 7 | t k D e v e lo pm e n t A / S | A n n uA l r e p o rt 2 0 1 2 / 1 3 | co n s o l i daT e d f i n a n c i a l sTaT e m e n Ts
n oT e 3 7 . P o s T - b a l a n c e s h e e T e v e n T s
After the reporting date, agreements regarding the prolongation of project credits of about Dkk 0.2 billion have been made. the Su-
pervisory Board has decided to request authorization at the forthcoming Annual General meeting to carry out a capital increase with
gross proceeds of about Dkk 210-231 million. the capital increase has been discussed with the Group’s major shareholders, who,
together with a few major private and institutional investors, have given conditional subscription and underwriting commitments for
the total capital increase. For more details, see note 2, “Accounting estimates and assessments”. moreover, after the reporting date,
tk Development has sold one of the Group’s minor German investment properties to a German investor. Apart from this, no major
events affecting the Company other than those mentioned in the management commentary have occurred after the reporting date.
n oT e 3 8 . a P P r ova l o f a n n u a l r e P o rT fo r P u b l i c aT i o n
At the board meeting on 25 April 2013, the Supervisory Board approved the Annual report for publication. the Annual report will be
submitted to the Company’s shareholders for adoption at the Annual General meeting on 22 may 2013.
N O T E S
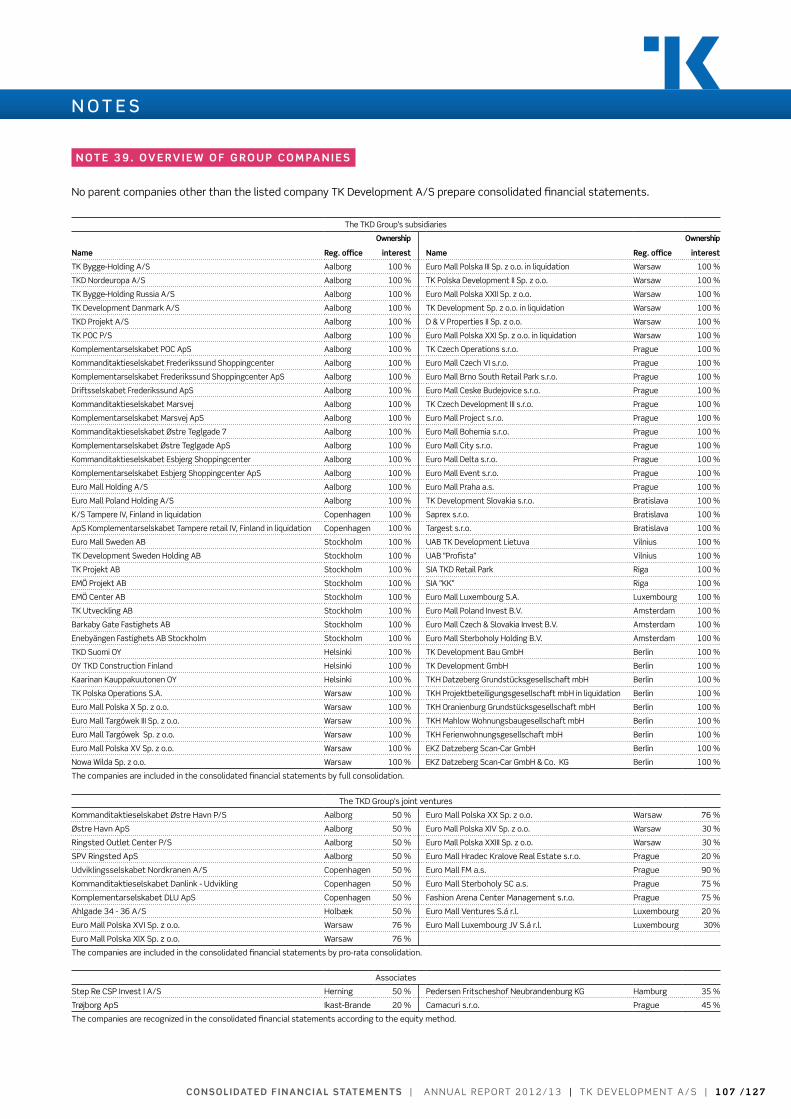
co n s o l i daT e d f i n a n c i a l sTaT e m e n Ts | A n n uA l r e p o rt 2 0 1 2 / 1 3 | t k D e v e lo pm e n t A / S | 1 0 7 / 1 2 7
N O T E S
n oT e 3 9 . ov e rv i e w o f g r o u P c o m Pa n i e s
no parent companies other than the listed company tk Development A/S prepare consolidated financial statements.
the tkD Group’s subsidiaries
name reg. office
ownership
interest name reg. office
ownership
interest
tk Bygge-Holding A/S Aalborg 100 % euro mall polska III Sp. z o.o. in liquidation Warsaw 100 %
tkD nordeuropa A/S Aalborg 100 % tk polska Development II Sp. z o.o. Warsaw 100 %
tk Bygge-Holding russia A/S Aalborg 100 % euro mall polska XXII Sp. z o.o. Warsaw 100 %
tk Development Danmark A/S Aalborg 100 % tk Development Sp. z o.o. in liquidation Warsaw 100 %
tkD projekt A/S Aalborg 100 % D & v properties II Sp. z o.o. Warsaw 100 %
tk poC p/S Aalborg 100 % euro mall polska XXI Sp. z o.o. in liquidation Warsaw 100 %
komplementarselskabet poC ApS Aalborg 100 % tk Czech operations s.r.o. prague 100 %
kommanditaktieselskabet Frederikssund Shoppingcenter Aalborg 100 % euro mall Czech vI s.r.o. prague 100 %
komplementarselskabet Frederikssund Shoppingcenter ApS Aalborg 100 % euro mall Brno South retail park s.r.o. prague 100 %
Driftsselskabet Frederikssund ApS Aalborg 100 % euro mall Ceske Budejovice s.r.o. prague 100 %
kommanditaktieselskabet marsvej Aalborg 100 % tk Czech Development III s.r.o. prague 100 %
komplementarselskabet marsvej ApS Aalborg 100 % euro mall project s.r.o. prague 100 %
kommanditaktieselskabet Østre teglgade 7 Aalborg 100 % euro mall Bohemia s.r.o. prague 100 %
komplementarselskabet Østre teglgade ApS Aalborg 100 % euro mall City s.r.o. prague 100 %
kommanditaktieselskabet esbjerg Shoppingcenter Aalborg 100 % euro mall Delta s.r.o. prague 100 %
komplementarselskabet esbjerg Shoppingcenter ApS Aalborg 100 % euro mall event s.r.o. prague 100 %
euro mall Holding A/S Aalborg 100 % euro mall praha a.s. prague 100 %
euro mall poland Holding A/S Aalborg 100 % tk Development Slovakia s.r.o. Bratislava 100 %
k/S tampere Iv, Finland in liquidation Copenhagen 100 % Saprex s.r.o. Bratislava 100 %
ApS komplementarselskabet tampere retail Iv, Finland in liquidation Copenhagen 100 % targest s.r.o. Bratislava 100 %
euro mall Sweden AB Stockholm 100 % uAB tk Development lietuva vilnius 100 %
tk Development Sweden Holding AB Stockholm 100 % uAB ”profista” vilnius 100 %
tk projekt AB Stockholm 100 % SIA tkD retail park riga 100 %
emÖ projekt AB Stockholm 100 % SIA ”kk” riga 100 %
emÖ Center AB Stockholm 100 % euro mall luxembourg S.A. luxembourg 100 %
tk utveckling AB Stockholm 100 % euro mall poland Invest B.v. Amsterdam 100 %
Barkaby Gate Fastighets AB Stockholm 100 % euro mall Czech & Slovakia Invest B.v. Amsterdam 100 %
enebyängen Fastighets AB Stockholm Stockholm 100 % euro mall Sterboholy Holding B.v. Amsterdam 100 %
tkD Suomi oY Helsinki 100 % tk Development Bau GmbH Berlin 100 %
oY tkD Construction Finland Helsinki 100 % tk Development GmbH Berlin 100 %
kaarinan kauppakuutonen oY Helsinki 100 % tkH Datzeberg Grundstücksgesellschaft mbH Berlin 100 %
tk polska operations S.A. Warsaw 100 % tkH projektbeteiligungsgesellschaft mbH in liquidation Berlin 100 %
euro mall polska X Sp. z o.o. Warsaw 100 % tkH oranienburg Grundstücksgesellschaft mbH Berlin 100 %
euro mall targówek III Sp. z o.o. Warsaw 100 % tkH mahlow Wohnungsbaugesellschaft mbH Berlin 100 %
euro mall targówek Sp. z o.o. Warsaw 100 % tkH Ferienwohnungsgesellschaft mbH Berlin 100 %
euro mall polska Xv Sp. z o.o. Warsaw 100 % ekZ Datzeberg Scan-Car GmbH Berlin 100 %
nowa Wilda Sp. z o.o. Warsaw 100 % ekZ Datzeberg Scan-Car GmbH & Co. kG Berlin 100 %
the companies are included in the consolidated financial statements by full consolidation.
the tkD Group’s joint ventures
kommanditaktieselskabet Østre Havn p/S Aalborg 50 % euro mall polska XX Sp. z o.o. Warsaw 76 %
Østre Havn ApS Aalborg 50 % euro mall polska XIv Sp. z o.o. Warsaw 30 %
ringsted outlet Center p/S Aalborg 50 % euro mall polska XXIII Sp. z o.o. Warsaw 30 %
Spv ringsted ApS Aalborg 50 % euro mall Hradec kralove real estate s.r.o. prague 20 %
udviklingsselskabet nordkranen A/S Copenhagen 50 % euro mall Fm a.s. prague 90 %
kommanditaktieselskabet Danlink - udvikling Copenhagen 50 % euro mall Sterboholy SC a.s. prague 75 %
komplementarselskabet Dlu ApS Copenhagen 50 % Fashion Arena Center management s.r.o. prague 75 %
Ahlgade 34 - 36 A/S Holbæk 50 % euro mall ventures S.á r.l. luxembourg 20 %
euro mall polska XvI Sp. z o.o. Warsaw 76 % euro mall luxembourg Jv S.á r.l. luxembourg 30%
euro mall polska XIX Sp. z o.o. Warsaw 76 %
the companies are included in the consolidated financial statements by pro-rata consolidation.
Associates
Step re CSp Invest I A/S Herning 50 % pedersen Fritscheshof neubrandenburg kG Hamburg 35 %
trøjborg ApS Ikast-Brande 20 % Camacuri s.r.o. prague 45 %
the companies are recognized in the consolidated financial statements according to the equity method.
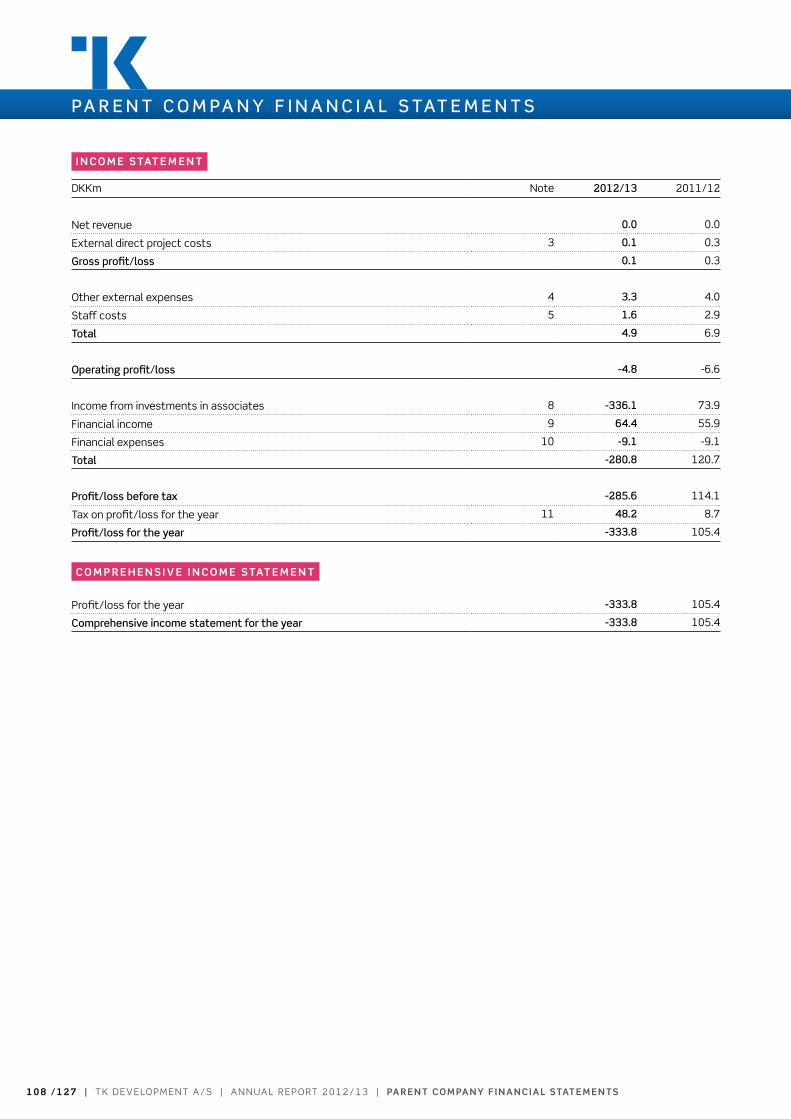
1 0 8 / 1 2 7 | t k D e v e lo pm e n t A / S | A n n uA l r e p o rt 2 0 1 2 / 1 3 | Pa r e n T com Pa n y f i n a n c i a l sTaT e m e n Ts
PA R E N T C O m PA N y f I N A N C I A L S TAT E m E N T S
i n c o m e s TaT e m e n T
Dkkm note 2012/13 2011/12
net revenue 0.0 0.0
external direct project costs 3 0.1 0.3
gross profit/loss 0.1 0.3
other external expenses 4 3.3 4.0
Staff costs 5 1.6 2.9
Total 4.9 6.9
Operating profit/loss -4.8 -6.6
Income from investments in associates 8 -336.1 73.9
Financial income 9 64.4 55.9
Financial expenses 10 -9.1 -9.1
Total -280.8 120.7
Profit/loss before tax -285.6 114.1
tax on profit/loss for the year 11 48.2 8.7
Profit/loss for the year -333.8 105.4
c o m P r e h e n s i v e i n c o m e s TaT e m e n T
profit/loss for the year -333.8 105.4
Comprehensive income statement for the year -333.8 105.4

Pa r e n T com Pa n y f i n a n c i a l sTaT e m e n Ts | A n n uA l r e p o rt 2 0 1 2 / 1 3 | t k D e v e lo pm e n t A / S | 1 0 9 / 1 2 7
PA R E N T C O m PA N y f I N A N C I A L S TAT E m E N T S
b a l a n c e s h e e T
Dkkm note 31 jan 2013 31 Jan 2012
ASSETS
non-current assets
Goodwill 12 5.1 5.1
Intangible assets 5.1 5.1
Investments in associates 8 867.6 1,171.0
receivables from associates 1,159.1 1,151.8
Deferred tax assets 13 21.3 57.2
Other non-current assets 2,048.0 2,380.0
Total non-current assets 2,053.1 2,385.1
current assets
prepayments 1.4 1.0
Total receivables 1.4 1.0
Securities 14 4.0 4.0
Deposits in blocked and escrow accounts 15 0.0 0.3
Cash and cash equivalents 0.1 0.8
Total current assets 5.5 6.1
ASSETS 2,058.6 2,391.2
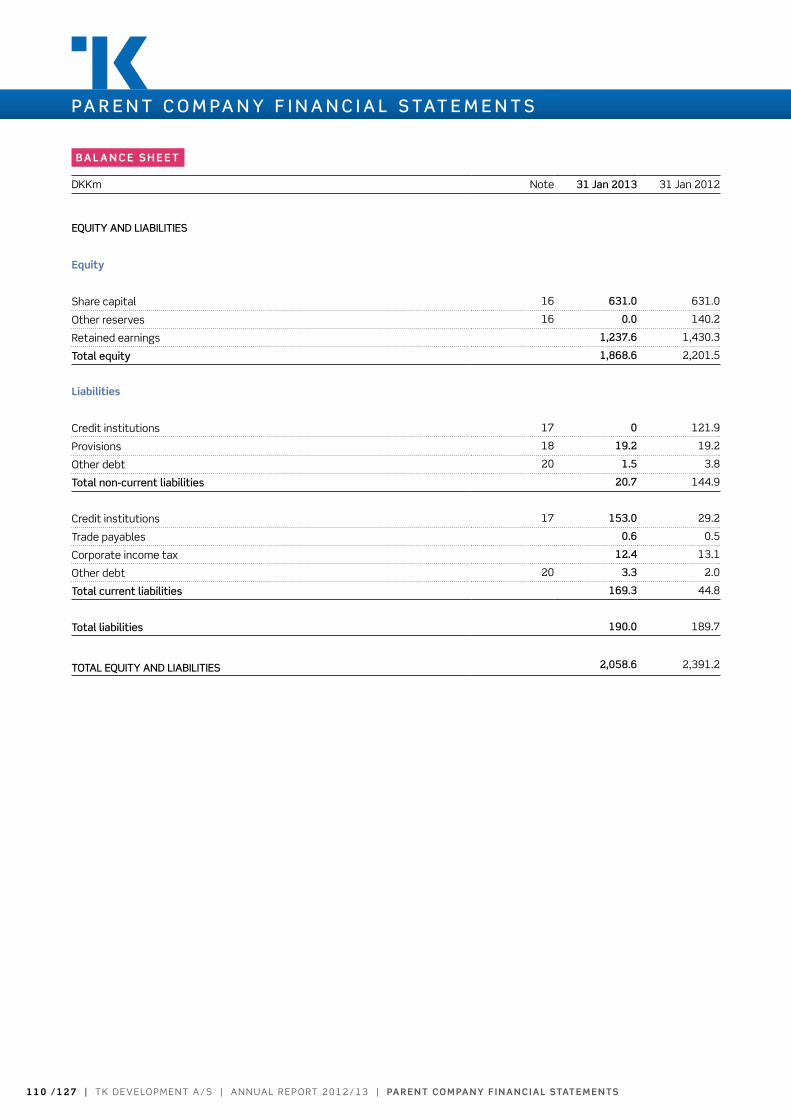
1 1 0 / 1 2 7 | t k D e v e lo pm e n t A / S | A n n uA l r e p o rt 2 0 1 2 / 1 3 | Pa r e n T com Pa n y f i n a n c i a l sTaT e m e n Ts
PA R E N T C O m PA N y f I N A N C I A L S TAT E m E N T S
b a l a n c e s h e e T
Dkkm note 31 jan 2013 31 Jan 2012
EQUITy AND LIABILITIES
equity
Share capital 16 631.0 631.0
other reserves 16 0.0 140.2
retained earnings 1,237.6 1,430.3
Total equity 1,868.6 2,201.5
liabilities
Credit institutions 17 0 121.9
provisions 18 19.2 19.2
other debt 20 1.5 3.8
Total non-current liabilities 20.7 144.9
Credit institutions 17 153.0 29.2
trade payables 0.6 0.5
Corporate income tax 12.4 13.1
other debt 20 3.3 2.0
Total current liabilities 169.3 44.8
Total liabilities 190.0 189.7
TOTAL EQUITy AND LIABILITIES 2,058.6 2,391.2

Pa r e n T com Pa n y f i n a n c i a l sTaT e m e n Ts | A n n uA l r e p o rt 2 0 1 2 / 1 3 | t k D e v e lo pm e n t A / S | 1 1 1 / 1 2 7
PA R E N T C O m PA N y f I N A N C I A L S TAT E m E N T S
s TaT e m e n T o f c h a n g e s i n eq u i T y
Dkkm Share capital other reserves retained earnings total equity
equity at 1 February 2011 631.0 140.2 1.321.2 2.092.4
profit for the year 0.0 0.0 105.4 105.4
other comprehensive income for the year 0.0 0.0 0.0 0.0
Total comprehensive income for the year 0.0 0.0 105.4 105.4
Share-based payment 0.0 0.0 3.7 3.7
Equity at 31 january 2012 631.0 140.2 1,430.3 2,201.5
profit for the year 0.0 0.0 -333.8 -333.8
other comprehensive income for the year 0.0 0.0 0.0 0.0
Total comprehensive income for the year 0.0 0.0 -333.8 -333.8
Special reserves transferred to distributable reserves 0.0 -140.2 140.2 0.0
Share-based payment 0.0 0.0 0.9 0.9
Equity at 31 january 2013 631.0 0.0 1,237.6 1,868.6

1 1 2 / 1 2 7 | t k D e v e lo pm e n t A / S | A n n uA l r e p o rt 2 0 1 2 / 1 3 | Pa r e n T com Pa n y f i n a n c i a l sTaT e m e n Ts
PA R E N T C O m PA N y f I N A N C I A L S TAT E m E N T S
ca s h f lo w s TaT e m e n T
Dkkm 2012/13 2011/12
operating profit/loss -4.8 -6.6
Adjustments for non-cash items:
Share-based payment 0.0 0.1
exchange-rate adjustments 0.7 -0.6
Increase/decrease in receivables -17.6 -107.2
Increase/decrease in payables and other debt -1.0 0.4
Changes in deposits on blocked and escrow accounts 0.3 -0.1
Cash flows from operating activities before net financials and tax -22.4 -114.0
Interest paid, etc. -8.5 -8.2
Interest received, etc. 64.1 55.9
Corporate income tax paid -13.0 -20.1
Cash flows from operating activities 20.2 -86.4
purchase of securities and investments -95.7 0.0
Dividend received 73.9 73.9
Cashflow from investment activities -21.8 73.9
raising of short-term financing 0.9 12.6
Cash flows from financing activities 0.9 12.6
Cash flows for the year -0.7 0.1
Cash and cash equivalents, beginning of year 0.8 0.7
Cash and cash equivalents at year-end 0.1 0.8
the figures in the cash flow statement cannot be inferred from the consolidated financial statements alone.
Pa r e n T com Pa n y f i n a n c i a l sTaT e m e n Ts | A n n uA l r e p o rt 2 0 1 2 / 1 3 | t k D e v e lo pm e n t A / S | 1 1 3 / 1 2 7
TA B L E O f C O N T E N T S , N O T E S , PA R E N T C O m PA N y f I N A N C I A L S TAT E m E N T S
Page
114 note 1. Accounting policies
115 note 2. Accounting estimates and assess ments
115 note 3. external direct project costs
115 note 4. other external expenses
116 note 5. Staff costs
117 note 6. Share-based payment
117 note 7. Fees payable to the auditors elected at the General meeting
118 note 8. Investments in group enterprises
119 note 9. Financial income
119 note 10. Financial expenses
119 note 11. Corporate income tax
120 note 12. Goodwill
120 note 13. Deferred tax assets
121 note 14. Securities
121 note 15. Deposits in custody and escrow accounts
121 note 16. Share capital and other reserves
121 note 17. Credit institutions
122 note 18. provisions
122 note 19. operating leases
123 note 20. other debt
123 note 21. Contingent assets and liabilities as well as security furnished
124 note 22. Financial risks and financial instruments
126 note 23. transactions with related parties
126 note 24. post-balance sheet events
126 note 25. Approval of Annual report for publication
1 1 4 / 1 2 7 | t k D e v e lo pm e n t A / S | A n n uA l r e p o rt 2 0 1 2 / 1 3 | Pa r e n T com Pa n y f i n a n c i a l sTaT e m e n Ts
N O T E S , PA R E N T C O m PA N y f I N A N C I A L S TAT E m E N T S
n oT e 1 . ac c o u n T i n g P o l i c i e s
the financial statements of the parent Company for 2012/13
are presented in compliance with the International Financial
reporting Standards, as adopted by the eu, and in accordance
with Danish disclosure requirements for annual reports pre-
pared by listed companies; see the executive order on IFrS is-
sued in pursuance of the Danish Financial Statements Act.
the parent financial statements also comply with the Interna-
tional Financial reporting Standards (IFrS) issued by the Inter-
national Accounting Standards Board (IASB).
the parent financial statements are presented in Dkk million,
which is the Company’s functional currency.
the parent financial statements are presented on the basis of
historical cost.
Generally, the parent Company applies the same accounting
policies regarding recognition and measurement as the Group.
the cases where the parent Company’s accounting policies de-
viate from those of the Group are described below. For a de-
tailed overall description of accounting policies, reference is
made to note 1 to the consolidated financial statements.
i m P l e m e n TaT i o n o f n e w a n d a m e n d e d
f i n a n c i a l r e P o rT i n g s Ta n da r d s a n d
i n T e r P r e TaT i o n s i s s u e d by i f r i c
the parent financial statements for 2012/13 have been pre-
sented in accordance with the financial reporting standards
(IFrS/IAS) and IFrIC interpretations applicable for financial
years beginning at 1 February 2012.
the implementation of new or amended financial reporting stand-
ards and interpretations that entered into force in the 2012/13
financial year has not resulted in any changes to the account-
ing policies. the accounting policies have been consistently ap-
plied with those of the previous financial year.
f i n a n c i a l r e P o rT i n g s Ta n da r d s a n d
i f r i c i n T e r P r e TaT i o n s n oT y e T i n fo r c e
At the date of publication of this Annual report, a number of
new or amended financial reporting standards and IFrIC inter-
pretations had not yet entered into force or been adopted by
the eu. thus, they have not been incorporated into the Annual
report. none of these standards and interpretations are ex-
pected to materially affect the parent financial statements for
the next financial years, with the exception of the additional
disclosure requirements following from the relevant standards
and interpretations.
ca s e s w h e r e T h e Pa r e n T c o m Pa n y ’ s
a c c o u n T i n g P o l i c i e s d e v i aT e f r o m T h o s e
o f T h e g r o u P
Translation of foreign-currency items
Foreign-exchange adjustments of receivables from or payables
to subsidiaries that are considered part of the parent Compa-
ny’s total investment in the relevant subsidiary are recognized
in the income statement under financial items. Such foreign-ex-
change adjustments are recognized in other comprehensive in-
come in the consolidated financial statements.
share-based incentive schemes
no intercompany settlement takes place between the parent
Company and subsidiaries in respect of the parent Company’s
share-based payments to employees in subsidiaries. In the par-
ent financial statements, the value of incentive schemes allo-
cated to subsidiaries’ employees is recognized under “Invest-
ments in subsidiaries”, with a corresponding amount recorded
directly in equity.
dividends on investments in subsidiaries and associates
Dividends on investments in subsidiaries and associates are
recognized in the parent Company’s income statement under
financial income in the financial year in which the right to divi-
dend vests. usually, this will be the date on which the General
meeting of shareholders adopts the distribution of dividend
from the relevant company.
investments in subsidiaries and associates
the parent Company’s investments in subsidiaries and asso-
ciates are measured at cost. the carrying amounts of invest-
ments in subsidiaries and associates are reviewed at the re-
porting date to identify any indications of impairment. If such
indications are identified, the recoverable amount of the asset
is calculated to assess the need for any impairment and the
extent of such impairment. If the cost exceeds the recoverable
amount, it is written down to the recoverable amount. If the div-
idend distributed exceeds the comprehensive income recorded
by the enterprise for the relevant year, this is considered an
indication of impairment.
Impairment losses are recognized in the income statement.
upon the sale of equity investments in subsidiaries and associ-
ates, gains or losses are determined as the difference between
(i) the carrying amount of the sold equity investments and (ii)
the fair value of the sales proceeds and the fair value of any
remaining equity investments.
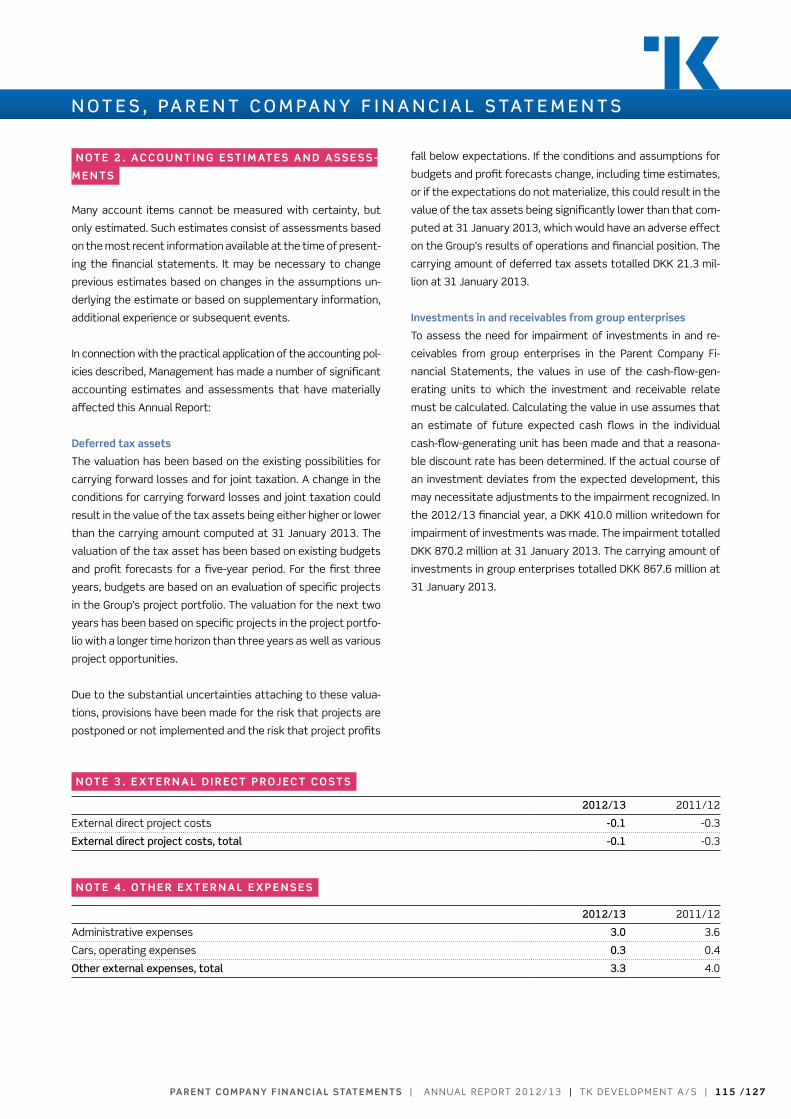
Pa r e n T com Pa n y f i n a n c i a l sTaT e m e n Ts | A n n uA l r e p o rt 2 0 1 2 / 1 3 | t k D e v e lo pm e n t A / S | 1 1 5 / 1 2 7
N O T E S , PA R E N T C O m PA N y f I N A N C I A L S TAT E m E N T S
n oT e 2 . ac c o u n T i n g e s T i m aT e s a n d a s s e s s -
m e n T s
many account items cannot be measured with certainty, but
only estimated. Such estimates consist of assessments based
on the most recent information available at the time of present-
ing the financial statements. It may be necessary to change
previous estimates based on changes in the assumptions un-
derlying the estimate or based on supplementary information,
additional experience or subsequent events.
In connection with the practical application of the accounting pol-
icies described, management has made a number of significant
accounting estimates and assessments that have materially
affected this Annual report:
deferred tax assets
the valuation has been based on the existing possibilities for
carrying forward losses and for joint taxation. A change in the
conditions for carrying forward losses and joint taxation could
result in the value of the tax assets being either higher or lower
than the carrying amount computed at 31 January 2013. the
valuation of the tax asset has been based on existing budgets
and profit forecasts for a five-year period. For the first three
years, budgets are based on an evaluation of specific projects
in the Group’s project portfolio. the valuation for the next two
years has been based on specific projects in the project portfo-
lio with a longer time horizon than three years as well as various
project opportunities.
Due to the substantial uncertainties attaching to these valua-
tions, provisions have been made for the risk that projects are
postponed or not implemented and the risk that project profits
fall below expectations. If the conditions and assumptions for
budgets and profit forecasts change, including time estimates,
or if the expectations do not materialize, this could result in the
value of the tax assets being significantly lower than that com-
puted at 31 January 2013, which would have an adverse effect
on the Group’s results of operations and financial position. the
carrying amount of deferred tax assets totalled Dkk 21.3 mil-
lion at 31 January 2013.
investments in and receivables from group enterprises
to assess the need for impairment of investments in and re-
ceivables from group enterprises in the parent Company Fi-
nancial Statements, the values in use of the cash-flow-gen-
erating units to which the investment and receivable relate
must be calculated. Calculating the value in use assumes that
an estimate of future expected cash flows in the individual
cash-flow-generating unit has been made and that a reasona-
ble discount rate has been determined. If the actual course of
an investment deviates from the expected development, this
may necessitate adjustments to the impairment recognized. In
the 2012/13 financial year, a Dkk 410.0 million writedown for
impairment of investments was made. the impairment totalled
Dkk 870.2 million at 31 January 2013. the carrying amount of
investments in group enterprises totalled Dkk 867.6 million at
31 January 2013.
n oT e 3 . e x T e r n a l d i r ec T P r oj ec T c o s T s
2012/13 2011/12
external direct project costs -0.1 -0.3
External direct project costs, total -0.1 -0.3
n oT e 4 . oT h e r e x T e r n a l e x P e n s e s
2012/13 2011/12
Administrative expenses 3.0 3.6
Cars, operating expenses 0.3 0.4
Other external expenses, total 3.3 4.0
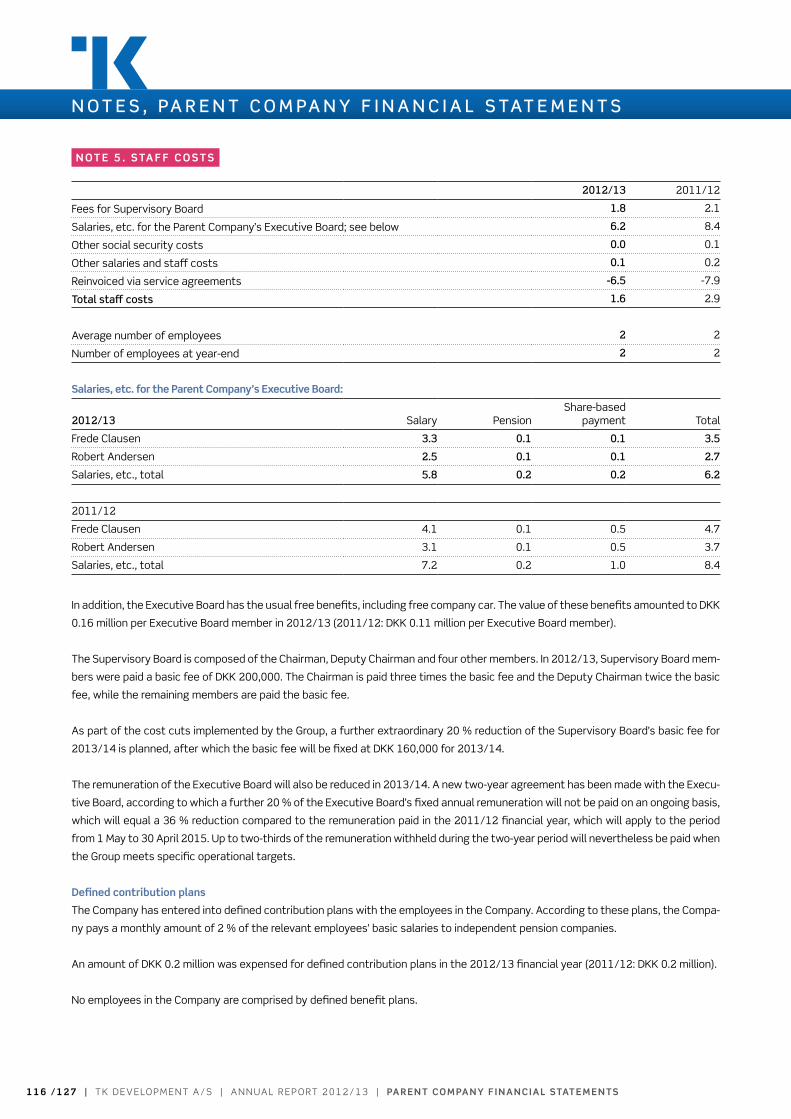
1 1 6 / 1 2 7 | t k D e v e lo pm e n t A / S | A n n uA l r e p o rt 2 0 1 2 / 1 3 | Pa r e n T com Pa n y f i n a n c i a l sTaT e m e n Ts
N O T E S , PA R E N T C O m PA N y f I N A N C I A L S TAT E m E N T S
n oT e 5 . s Ta f f c o s T s
2012/13 2011/12
Fees for Supervisory Board 1.8 2.1
Salaries, etc. for the parent Company’s executive Board; see below 6.2 8.4
other social security costs 0.0 0.1
other salaries and staff costs 0.1 0.2
reinvoiced via service agreements -6.5 -7.9
Total staff costs 1.6 2.9
Average number of employees 2 2
number of employees at year-end 2 2
salaries, etc. for the Parent company’s executive board:
2012/13 Salary pensionShare-based
payment total
Frede Clausen 3.3 0.1 0.1 3.5
robert Andersen 2.5 0.1 0.1 2.7
Salaries, etc., total 5.8 0.2 0.2 6.2
2011/12
Frede Clausen 4.1 0.1 0.5 4.7
robert Andersen 3.1 0.1 0.5 3.7
Salaries, etc., total 7.2 0.2 1.0 8.4
In addition, the executive Board has the usual free benefits, including free company car. the value of these benefits amounted to Dkk
0.16 million per executive Board member in 2012/13 (2011/12: Dkk 0.11 million per executive Board member).
the Supervisory Board is composed of the Chairman, Deputy Chairman and four other members. In 2012/13, Supervisory Board mem-
bers were paid a basic fee of Dkk 200,000. the Chairman is paid three times the basic fee and the Deputy Chairman twice the basic
fee, while the remaining members are paid the basic fee.
As part of the cost cuts implemented by the Group, a further extraordinary 20 % reduction of the Supervisory Board’s basic fee for
2013/14 is planned, after which the basic fee will be fixed at Dkk 160,000 for 2013/14.
the remuneration of the executive Board will also be reduced in 2013/14. A new two-year agreement has been made with the execu-
tive Board, according to which a further 20 % of the executive Board’s fixed annual remuneration will not be paid on an ongoing basis,
which will equal a 36 % reduction compared to the remuneration paid in the 2011/12 financial year, which will apply to the period
from 1 may to 30 April 2015. up to two-thirds of the remuneration withheld during the two-year period will nevertheless be paid when
the Group meets specific operational targets.
defined contribution plans
the Company has entered into defined contribution plans with the employees in the Company. According to these plans, the Compa-
ny pays a monthly amount of 2 % of the relevant employees’ basic salaries to independent pension companies.
An amount of Dkk 0.2 million was expensed for defined contribution plans in the 2012/13 financial year (2011/12: Dkk 0.2 million).
no employees in the Company are comprised by defined benefit plans.

n oT e 6 . s h a r e - b a s e d Paym e n T
For a more detailed description. please see note 8 in the consolidated financial statements.
2012/13 2011/12
Share-based payment recognized in the profit or loss 0.2 1.0
n oT e 7 . f e e s Paya b l e To T h e a u d i To r s e l ec T e d aT T h e g e n e r a l m e e T i n g
2012/13 2011/12
total fees, Deloitte 0.2 0.3
total fees, nielsen & Christensen 0.2 0.2
Total fees 0.4 0.5
Fees break down as follows:
deloitte:
Statutory audit 0.2 0.3
total 0.2 0.3
nielsen & christensen:
Statutory audit 0.2 0.1
other services 0.0 0.1
total 0.2 0.2
Pa r e n T com Pa n y f i n a n c i a l sTaT e m e n Ts | A n n uA l r e p o rt 2 0 1 2 / 1 3 | t k D e v e lo pm e n t A / S | 1 1 7 / 1 2 7
N O T E S , PA R E N T C O m PA N y f I N A N C I A L S TAT E m E N T S

1 1 8 / 1 2 7 | t k D e v e lo pm e n t A / S | A n n uA l r e p o rt 2 0 1 2 / 1 3 | Pa r e n T com Pa n y f i n a n c i a l sTaT e m e n Ts
N O T E S , PA R E N T C O m PA N y f I N A N C I A L S TAT E m E N T S
n oT e 8 . i n v e s Tm e n T s i n g r o u P e n T e r P r i s e s
2012/13 2011/12
Cost at 1 February 1,361.0 1,357.4
Additions for the year 96.6 3.6
Cost at 31 january 1,457.6 1,361.0
Impairment at 1 February -460.2 -460.2
Impairment for the year -410.0 0.0
Impairment at 31 january -870.2 -460.2
Setoffs at 1 February 270.2 270.2
Impairment set off against receivables/provisions 10.0 0.0
Setoffs at 31 january 280.2 270.2
Carrying amount at 31 january 867.6 1,171.0
Investments in group enterprises are recognized at cost. Investments and receivables were subjected to an impairment test at 31
January 2013. In the cases where the cost exceeds the recoverable amount, it is written down to such lower value.
the recoverable amount is based on the value in use, which has been determined using the expected cash flows on the basis of budg-
ets for the next three financial years and forecasts for another two financial years approved by the Supervisory Board and recognition
of the terminal value in year five. the calculation of the recoverable amount included a discount rate of 15 % before tax.
Impairment is recognized in the line ”Income from investments in group enterprises”.
2012/13 2011/12
Income from investments in group enterprises:
Impairment for the year; see above -410.0 0.0
Dividends 73.9 73.9
Total income from investments -336.1 73.9
overview of investments in group enterprises:
namereg. office
ownershipinterest
tk Bygge-Holding A/S Aalborg 100 %
tk Development Bau GmbH Berlin 100 %
tk Development GmbH Berlin 100 %
tkD nordeuropa A/S *) Aalborg 48 %
*) the company is considered a group enterprise as it is wholly owned, directly and indirectly, by tk Development A/S.
the ownership interests shown above are the Company’s direct holdings.
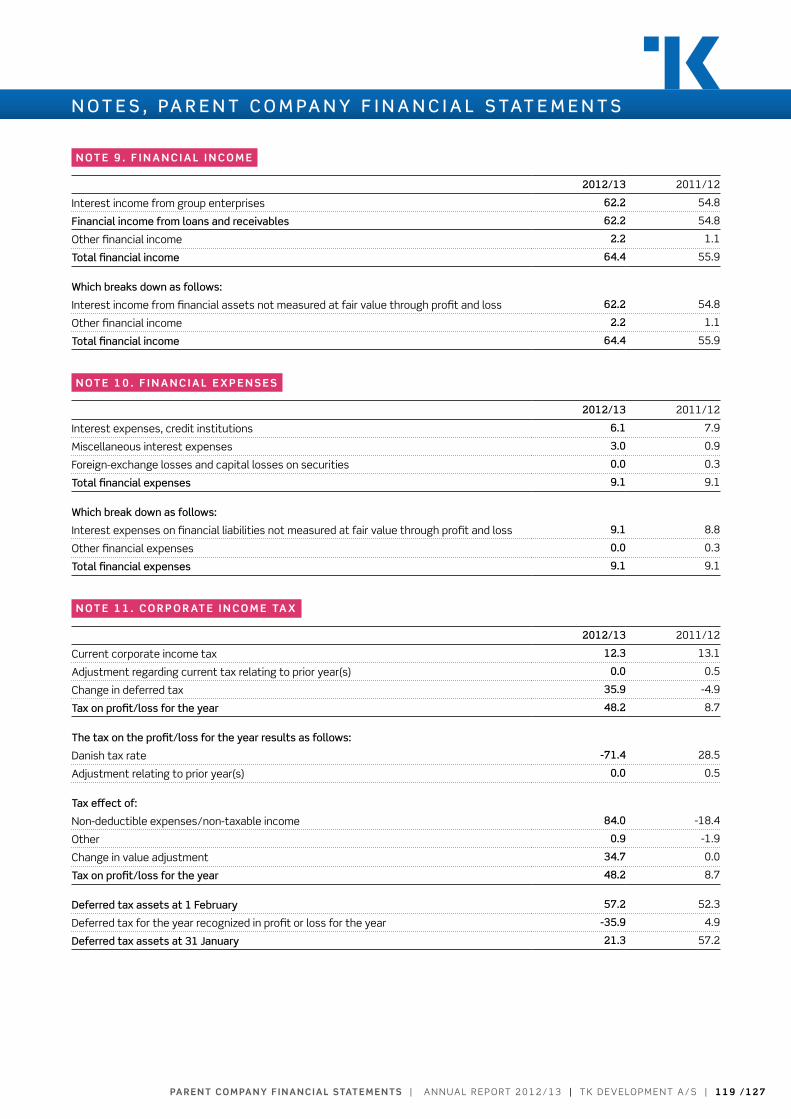
Pa r e n T com Pa n y f i n a n c i a l sTaT e m e n Ts | A n n uA l r e p o rt 2 0 1 2 / 1 3 | t k D e v e lo pm e n t A / S | 1 1 9 / 1 2 7
N O T E S , PA R E N T C O m PA N y f I N A N C I A L S TAT E m E N T S
n oT e 9 . f i n a n c i a l i n c o m e
2012/13 2011/12
Interest income from group enterprises 62.2 54.8
financial income from loans and receivables 62.2 54.8
other financial income 2.2 1.1
Total financial income 64.4 55.9
which breaks down as follows:
Interest income from financial assets not measured at fair value through profit and loss 62.2 54.8
other financial income 2.2 1.1
Total financial income 64.4 55.9
n oT e 1 0 . f i n a n c i a l e x P e n s e s
2012/13 2011/12
Interest expenses, credit institutions 6.1 7.9
miscellaneous interest expenses 3.0 0.9
Foreign-exchange losses and capital losses on securities 0.0 0.3
Total financial expenses 9.1 9.1
which break down as follows:
Interest expenses on financial liabilities not measured at fair value through profit and loss 9.1 8.8
other financial expenses 0.0 0.3
Total financial expenses 9.1 9.1
n oT e 1 1 . c o r P o r aT e i n c o m e Ta x
2012/13 2011/12
Current corporate income tax 12.3 13.1
Adjustment regarding current tax relating to prior year(s) 0.0 0.5
Change in deferred tax 35.9 -4.9
Tax on profit/loss for the year 48.2 8.7
The tax on the profit/loss for the year results as follows:
Danish tax rate -71.4 28.5
Adjustment relating to prior year(s) 0.0 0.5
Tax effect of:
non-deductible expenses/non-taxable income 84.0 -18.4
other 0.9 -1.9
Change in value adjustment 34.7 0.0
Tax on profit/loss for the year 48.2 8.7
Deferred tax assets at 1 february 57.2 52.3
Deferred tax for the year recognized in profit or loss for the year -35.9 4.9
Deferred tax assets at 31 january 21.3 57.2

1 2 0 / 1 2 7 | t k D e v e lo pm e n t A / S | A n n uA l r e p o rt 2 0 1 2 / 1 3 | Pa r e n T com Pa n y f i n a n c i a l sTaT e m e n Ts
N O T E S , PA R E N T C O m PA N y f I N A N C I A L S TAT E m E N T S
n oT e 1 2 . g o o d w i l l
31 jan 2013 31 Jan 2012
Cost at 1 February 7.7 7.7
Additions 0.0 0.0
Cost at 31 january 7.7 7.7
Amortization and impairment at 1 february 2.6 2.6
Impairment for the year 0.0 0.0
Amortization and impairment at 31 january 2.6 2.6
Carrying amount at 31 january 5.1 5.1
the total goodwill relates to the cash-flow-generating unit, euro mall Holding A/S; see note 3 in the consolidated financial state-
ments.
At 31 January 2013, management performed an impairment test of the carrying amount of goodwill. the recoverable amount is based on the
value in use, which has been determined using the expected cash flows on the basis of budgets for the next three financial years
and forecasts for another two financial years approved by the Supervisory Board and recognition of the terminal value in year five.
the calculation of the recoverable amount included a discount rate of 15 % before tax. the impairment test did not give rise to any
recognition of impairment.
management assesses that significant changes to the basic assumptions would not result in the carrying amount of goodwill ex-
ceeding the recoverable amount.
n oT e 1 3 . d e f e r r e d Ta x a s s e T s
31 jan 2013 31 Jan 2012
Deferred tax assets at 1 February 60.1 55.1
Correction of opening balance 0.0 0.1
Additions for the year 0.0 4.9
Disposals for the year -1.2 0.0
Deferred tax assets at 31 january 58.9 60.1
value adjustment at 1 February -2.9 -2.8
Correction of opening balance 0.0 -0.1
value adjustment for the year -34.7 0.0
value adjustments at 31 january -37.6 -2.9
Carrying amount at 31 january 21.3 57.2
Deferred tax assets relate to:
Investments 1.5 1.5
Current assets -1.7 -1.5
provisions 0.0 0.0
value of tax losses 59.1 60.1
Impairment of tax assets -37.6 -2.9
Total 21.3 57.2
the change in deferred tax assets for the year has been recognized in the income statement.
the contingent retaxation liability attaching to German subsidiaries regarding which no provisions for deferred tax have been made
amounted to Dkk 97.4 million (2011/12: Dkk 97.4 million). the Company controls whether such tax liability will be triggered, which is
considered unlikely.

Pa r e n T com Pa n y f i n a n c i a l sTaT e m e n Ts | A n n uA l r e p o rt 2 0 1 2 / 1 3 | t k D e v e lo pm e n t A / S | 1 2 1 / 1 2 7
N O T E S , PA R E N T C O m PA N y f I N A N C I A L S TAT E m E N T S
n oT e 1 4 . s e c u r i T i e s
31 jan 2013 31 Jan 2012
listed securities 0.1 0.1
unlisted securities 3.9 3.9
Total securities 4.0 4.0
the securities consist of listed shares and unlisted equity interests. listed securities consist of listed shares and are measured at
fair value (Fair value hierarchy: level 1). unlisted equity interests are not traded in an active market. As the fair value of these equity
interests cannot be determined with a sufficient degree of reliability, they are measured at cost. the securities are financial assets
available for sale.
n oT e 1 5 . d e P o s i T s i n c u s To dy a n d e s c r o w a c c o u n T s
31 jan 2013 31 Jan 2012
Custody accounts and other accounts that the Company cannot fully dispose of 0.0 0.3
Total deposits in custody and escrow accounts 0.0 0.3
n oT e 1 6 . s h a r e ca P i Ta l a n d oT h e r r e s e rv e s
share capital
reference is made to note 27 in the consolidated financial statement.
other reserves
other reserves amounted to Dkk 140.2 million at 31 January 2012 and concerned a special fund that arose in connection with the
capital reduction implemented in August 2010, when the denomination of the Group’s shares was changed from Dkk 20 to Dkk 15.
this reserve can be used only following a resolution passed at the General meeting. At the Company’s Annual General meeting on 24
may 2012, it was resolved to transfer the special reserve of Dkk 140.2 million to distributable reserves. the transfer was made in Q2
2012/13.
n oT e 1 7 . c r e d i T i n s T i T u T i o n s
31 jan 2013 31 Jan 2012
payables to credit institutions are recognized as follows in the balance sheet:
non-current liabilities 0.0 121.9
Current liabilities 153.0 29.2
Total payables to credit institutions 153.0 151.1
Fair value 153.0 151.1
Carrying amount 153.0 151.1
at 31 january, the Parent company had the following loans and credits:
effective rate Carrying amount Fair value
loans maturity Fixed/variable 2012/13 2011/12 2012/13 2011/12 2012/13 2011/12
Bank Dkk 2013 variabel 4 - 5 % 4 - 5 % 30.0 29.2 30.0 29.2
Bank eur 2013 variabel 3.30 - 4.10 % 4 - 5 % 123.0 121.9 123.0 121.9

1 2 2 / 1 2 7 | t k D e v e lo pm e n t A / S | A n n uA l r e p o rt 2 0 1 2 / 1 3 | Pa r e n T com Pa n y f i n a n c i a l sTaT e m e n Ts
N O T E S , PA R E N T C O m PA N y f I N A N C I A L S TAT E m E N T S
n oT e 1 8 . P r ov i s i o n s
31 jan 2013 31 Jan 2012
provisions at 1 February 19.2 19.2
provisions for the year 0.0 0.0
provisions at 31 January 19.2 19.2
Provisions at 31 january 19.2 19.2
expected maturity dates of the liabilities provided for:
0 - 1 year 0.0 0.0
1 - 5 year 19.2 19.2
Provisions at 31 january 19.2 19.2
provisions relate to provisions for negative equity in a subsidiary.
n oT e 1 9 . o P e r aT i n g l e a s e s
For the years 2013-2016, operating leases for the rental of operating equipment have been concluded. the leases have been con-
cluded for a five-year period with fixed lease payments. the leases are non-terminable for the period mentioned, after which it is
expected that the majority can be renewed for one year.
future minimum lease payments according to non-terminable lease contracts break down as follows:
31 jan 2013 31 Jan 2012
Within 1 year 0.3 0.3
Within 1-5 years 0.7 1.0
After 5 years 0.0 0.0
total 1.0 1.3
minimum lease payments for the year recognized in the income statement 0.3 0.2

Pa r e n T com Pa n y f i n a n c i a l sTaT e m e n Ts | A n n uA l r e p o rt 2 0 1 2 / 1 3 | t k D e v e lo pm e n t A / S | 1 2 3 / 1 2 7
N O T E S , PA R E N T C O m PA N y f I N A N C I A L S TAT E m E N T S
n oT e 2 0 . oT h e r d e bT
31 jan 2013 31 Jan 2012
employee-related payables 3.8 3.8
Holiday pay obligations 0.9 1.0
other debt 0.1 1.0
Other debt, total 4.8 5.8
Broken down as follows under liabilities:
non-current liabilities (employee bonds) 1.5 3.8
Current liabilities 3.3 2.0
Other debt, total 4.8 5.8
the carrying amount of employee-related payables consisting of salaries, A-tax, social security contributions, holiday pay, etc., pro-
ject-related costs and other costs payable is equal to the fair value of these payables. Holiday pay obligations represent the Compa-
ny’s liability to pay salary during holiday periods to which the employees had earned entitlement by the reporting date and which are
to be taken in the following financial year(s).
n oT e 2 1 . c o n T i n g e n T a s s e T s a n d l i a b i l i T i e s a s w e l l a s s ec u r i T y f u r n i s h e d
contingent assets
Contingent assets in the form of tax assets not recognized appear from note 13.
contingent liabilities and security furnished
31 jan 2013 31 Jan 2012
Surety and guarantee commitments on behalf of group enterprises 1,649.7 1,605.8
Surety and guarantee commitments on behalf of joint ventures 3.0 0.0
other surety and guarantee commitments 7.6 7.6
Carrying amount of equity investments furnished as security to credit institutions 251.4 155.2
the below figures in brackets are comparative figures for 2011/12.
the amounts stated for surety and guarantee commitments on behalf of group enterprises are the upper limits. At 31 January 2013,
the subsidiaries had drawn an amount of Dkk 1,646.1 million (Dkk 1,565.5 million) on their credit facilities.
In addition, the Company has guaranteed the liabilities of a few group enterprises in relation to construction contracts, and a few
other project related contracts.
the contingent retaxation liability attaching to German subsidiaries regarding which no provisions for deferred tax have been made
amounts to Dkk 97.4 million (Dkk 97.4 million). the Company controls whether such tax liability will be triggered, which is considered
unlikely.
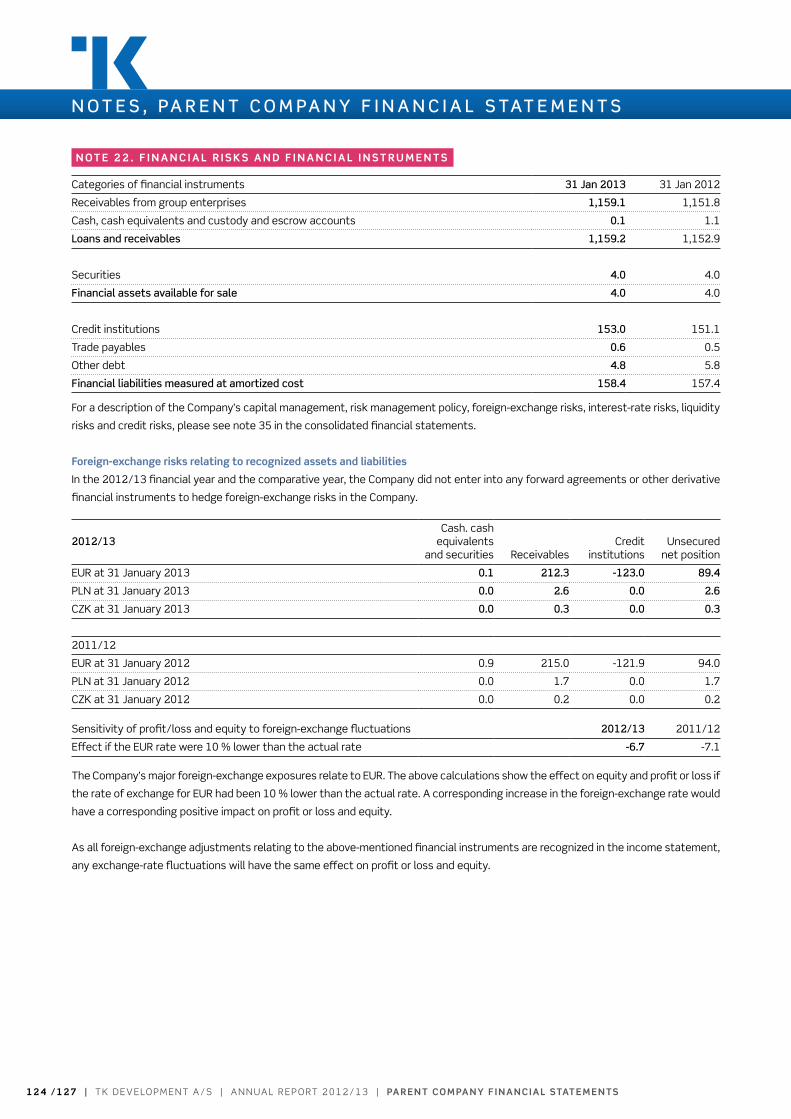
1 2 4 / 1 2 7 | t k D e v e lo pm e n t A / S | A n n uA l r e p o rt 2 0 1 2 / 1 3 | Pa r e n T com Pa n y f i n a n c i a l sTaT e m e n Ts
N O T E S , PA R E N T C O m PA N y f I N A N C I A L S TAT E m E N T S
n oT e 2 2 . f i n a n c i a l r i s k s a n d f i n a n c i a l i n s T r u m e n T s
Categories of financial instruments 31 jan 2013 31 Jan 2012
receivables from group enterprises 1,159.1 1,151.8
Cash, cash equivalents and custody and escrow accounts 0.1 1.1
Loans and receivables 1,159.2 1,152.9
Securities 4.0 4.0
financial assets available for sale 4.0 4.0
Credit institutions 153.0 151.1
trade payables 0.6 0.5
other debt 4.8 5.8
financial liabilities measured at amortized cost 158.4 157.4
For a description of the Company’s capital management, risk management policy, foreign-exchange risks, interest-rate risks, liquidity
risks and credit risks, please see note 35 in the consolidated financial statements.
foreign-exchange risks relating to recognized assets and liabilities
In the 2012/13 financial year and the comparative year, the Company did not enter into any forward agreements or other derivative
financial instruments to hedge foreign-exchange risks in the Company.
2012/13Cash. cash
equivalentsand securities receivables
Credit institutions
unsecurednet position
eur at 31 January 2013 0.1 212.3 -123.0 89.4
pln at 31 January 2013 0.0 2.6 0.0 2.6
CZk at 31 January 2013 0.0 0.3 0.0 0.3
2011/12
eur at 31 January 2012 0.9 215.0 -121.9 94.0
pln at 31 January 2012 0.0 1.7 0.0 1.7
CZk at 31 January 2012 0.0 0.2 0.0 0.2
Sensitivity of profit/loss and equity to foreign-exchange fluctuations 2012/13 2011/12
effect if the eur rate were 10 % lower than the actual rate -6.7 -7.1
the Company’s major foreign-exchange exposures relate to eur. the above calculations show the effect on equity and profit or loss if
the rate of exchange for eur had been 10 % lower than the actual rate. A corresponding increase in the foreign-exchange rate would
have a corresponding positive impact on profit or loss and equity.
As all foreign-exchange adjustments relating to the above-mentioned financial instruments are recognized in the income statement,
any exchange-rate fluctuations will have the same effect on profit or loss and equity.

Pa r e n T com Pa n y f i n a n c i a l sTaT e m e n Ts | A n n uA l r e p o rt 2 0 1 2 / 1 3 | t k D e v e lo pm e n t A / S | 1 2 5 / 1 2 7
N O T E S , PA R E N T C O m PA N y f I N A N C I A L S TAT E m E N T S
n oT e 2 2 . f i n a n c i a l r i s k s a n d f i n a n c i a l i n s T r u m e n T s , c o n T i n u e d
interest-rate risks and the dates of revaluation or maturity regarding financial assets and liabilities:
Date of revaluation/maturity effective rate
0 - 1 year 1 - 5 years > 5 years total in %
2012/13
Securities 4.0 0.0 0.0 4.0 0 %
receivables from group enterprises 0.0 1,159.1 0.0 1,159.1 0 - 8 %
Deposits with credit institutions 0.1 0.0 0.0 0.1 0.25 - 2 %
payables to credit institutions -153.0 0.0 0.0 -153.0 3 - 5 %
Interest payments on loans -1.1 0.0 0.0 -1.1
trade payables -0.6 0.0 0.0 -0.6 0 %
other debt -3.3 -1.5 0.0 -4.8 0 - 5%
Total at 31 january 2013 -153.9 1,157.6 0.0 1,003.7
2011/12
Securities 4.0 0.0 0.0 4.0 0 %
receivables from group enterprises 0.0 1,151.8 0.0 1,151.8 0 - 8 %
Deposits with credit institutions 1.1 0.0 0.0 1.1 0.25 - 2 %
payables to credit institutions -29.2 -121.9 0.0 -151.1 4 - 5 %
trade payables -0.5 0.0 0.0 -0.5 0 %
other debt -2.0 -3.8 0.0 -5.8 0 - 5 %
Total at 31 january 2012 -26.6 1,026.1 0.0 999.5
With regard to interest-rate sensitivity, an increase in the interest level of 1 % p.a. compared to the interest level at the reporting
date in respect of the Company’s variable-interest deposits with and payables to credit institutions would have a negative impact on
the profit or loss for the year, and thus on equity, of Dkk 1.1 million for a full year. A fall in the interest level of 1 % p.a. would result
in a corresponding positive impact on the profit or loss for the year and on equity. For the 2011/12 financial year, the interest-rate
sensitivity in case of a change in the interest level of 1 % p.a. would have a Dkk 1.1 million impact for a full year.
liquidity risks
the maturity dates of financial liabilities are specified for the individual categories of liabilities in the notes, with the exception of
trade payables and other debt largely falling due for payment within one year. the Company’s liquidity reserve consists of cash and
cash equivalents as well as unutilized credit facilities. reference is also made to note 35 in the consolidated financial statements.
breach of loan agreements
During the financial year and the previous year, the Company was not in breach of any loan agreements.

1 2 6 / 1 2 7 | t k D e v e lo pm e n t A / S | A n n uA l r e p o rt 2 0 1 2 / 1 3 | Pa r e n T com Pa n y f i n a n c i a l sTaT e m e n Ts
N O T E S , PA R E N T C O m PA N y f I N A N C I A L S TAT E m E N T S
n oT e 2 3 . T r a n sac T i o n s w i T h r e l aT e d Pa rT i e s
the Company has no related parties with a controlling interest. the Company has the following related parties:
Supervisory Board and executive Board (and their related parties)
Associates, joint ventures and group enterprises; see the overview of group companies, note 39 in the consolidated financial
statements.
2012/13 2011/12
Supervisory Board and Executive Board (and their related parties)
Holding of shares, in terms of number 1,940.251 1,355.435
obligation towards executive Board, employee bonds 1.5 1.5
remuneration, Supervisory Board 1.8 2.1
remuneration, executive Board, see note 5 6.2 8.4
joint ventures and group enterprises
management fee to group enterprises 1.0 1.1
Interest income from group enterprises 62.1 54.8
receivables from group enterprises 1,159.1 1,151.8
Impairment for the year of investments in group enterprises -410.0 0.0
total impairment of investments in group enterprises 870.2 460.2
Costs allocated to group enterprises according to service agreements concluded 6.5 7.9
Guarantee commission to group enterprises 2.0 1.1
Dividends from subsidiaries 73.9 73.9
Capital increase in group enterprises 95.7 0.0
Surety and other security furnished for subsidiaries appear from note 21. Suretyships and guarantees have been issued on behalf of
joint ventures and associates; see note 34 in the consolidated financial statements.
Apart from this, no securities or guarantees had been furnished for balances owing to or by related parties at the reporting date.
receivables and payables are expected to be settled by payment in cash. no losses were realized on receivables from related par-
ties. the impairment made to provide for any probable losses on investments in group enterprises amounted to Dkk 410.0 million in
2012/13 (2011/12: Dkk 0.0 million).
Apart from the above, there were no transactions with related parties in the year under review.
n oT e 2 4 . P o s T - b a l a n c e s h e e T e v e n T s
reference is made to note 37 in the consolidated financial statements.
n oT e 2 5 . a P P r ova l o f a n n u a l r e P o rT fo r P u b l i c aT i o n
reference is made to note 38 in the consolidated financial statements.
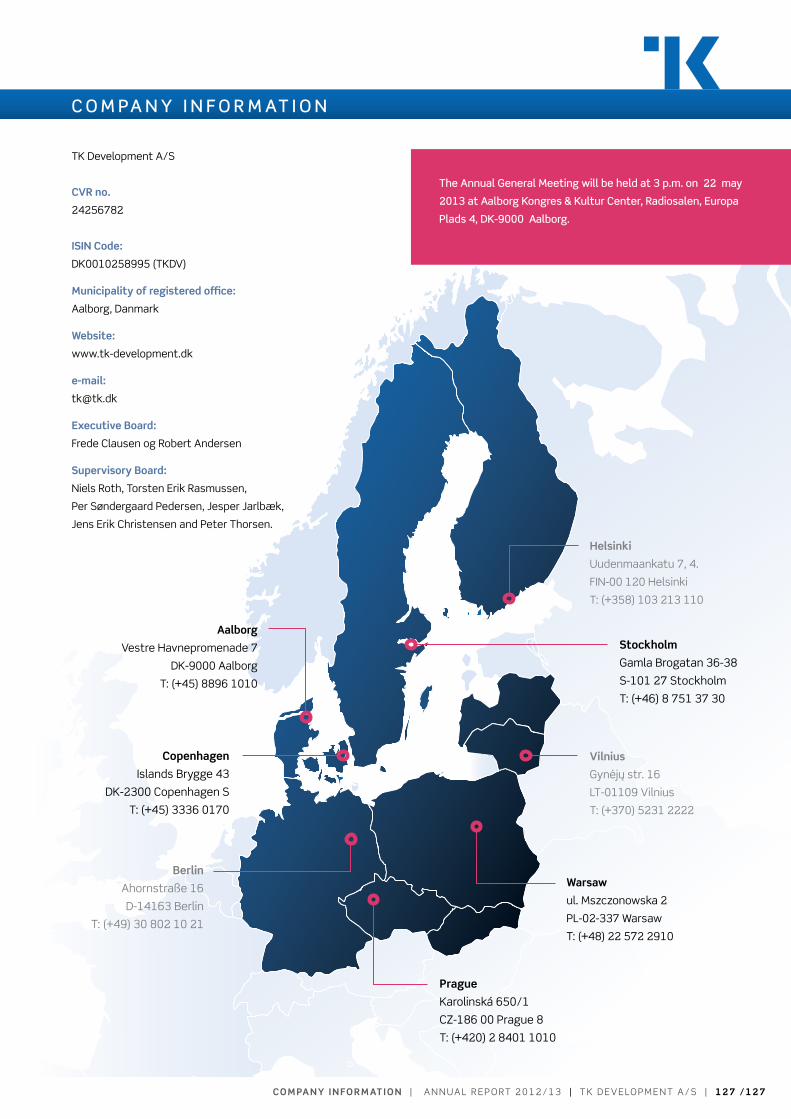
com Pa n y i n fo r m aT i o n | A n n uA l r e p o rt 2 0 1 2 / 1 3 | t k D e v e lo pm e n t A / S | 1 2 7 / 1 2 7
aalborg
vestre Havnepromenade 7
Dk-9000 Aalborg
t: (+45) 8896 1010
berlin
Ahornstraße 16
D-14163 Berlin
t: (+49) 30 802 10 21
helsinki
uudenmaankatu 7, 4.
FIn-00 120 Helsinki
t: (+358) 103 213 110
vilnius
Gynėjų str. 16
lt-01109 vilnius
t: (+370) 5231 2222
warsaw
ul. mszczonowska 2
pl-02-337 Warsaw
t: (+48) 22 572 2910
Prague
karolinská 650/1
CZ-186 00 prague 8
t: (+420) 2 8401 1010
stockholm
Gamla Brogatan 36-38
S-101 27 Stockholm
t: (+46) 8 751 37 30
copenhagen
Islands Brygge 43
Dk-2300 Copenhagen S
t: (+45) 3336 0170
C O m PA N y I N f O R m AT I O N
tk Development A/S
cvr no.
24256782
isin code:
Dk0010258995 (tkDv)
municipality of registered office:
Aalborg, Danmark
website:
www.tk-development.dk
e-mail:
executive board:
Frede Clausen og robert Andersen
supervisory board:
niels roth, torsten erik rasmussen,
per Søndergaard pedersen, Jesper Jarlbæk,
Jens erik Christensen and peter thorsen.
The Annual general meeting will be held at 3 p.m. on 22 may
2013 at Aalborg Kongres & Kultur Center, Radiosalen, Europa
Plads 4, DK-9000 Aalborg.