Pre-clinical Evaluation of Implicit Deformable Models for Three-dimensional Segmentation of Brain Aneurysms in CTA Monica Hernandez a , Rosario Barrena b , Gabriel Hernandez b , Guillermo Sapiro c and Alejandro F. Frangi *a a Visual Information Technologies (VIT) Lab, Aragon Institute of Engineering Research, University of Zaragoza, Ada Byron Bldg. D2.03, Maria de Luna 1, E-50018 Zaragoza, Spain b Aragon Institute of Health Sciences, Zaragoza, Spain c University of Minnesota, Minneapolis, USA ABSTRACT Knowledge of brain aneurysm dimensions is essential during the planning stage of minimally invasive surgical interventions using Guglielmi Detachable Coils (GDC). These parameters are obtained in clinical routine us- ing 2D Maximum Intensity Projection images from Computed Tomographic Angiography (CTA). Automated quantification of the three dimensional structure of aneurysms directly from the 3D data set may be used to provide accurate and objective measurements of the clinically relevant parameters. The properties of Implicit Deformable Models make them suitable to accurately extract the three dimensional structure of the aneurysm and its connected vessels. We have devised a two-stage segmentation algorithm for this purpose. In the first stage, a rough segmentation is obtained by means of the Fast Marching Method combining a speed function based on a vessel enhancement filtering and a freezing algorithm. In the second stage, this rough segmentation provides the initialization for Geodesic Active Contours driven by region-based information. The latter problem is solved using the Level Set algorithm. This work presents a comparative study between a clinical and a com- puterized protocol to derive three geometrical descriptors of aneurysm morphology that are standard in assessing the viability of surgical treatment with GDCs. The study was performed on a data base of 40 brain aneurysms. The manual measurements were made by two neuroradiologists in two independent sessions. Both inter- and intra-observer variability and comparison with the automated method are presented. According to these results, Implicit Deformable Models are a suitable technique for this application. Keywords: brain aneurysm, CTA, segmentation, Implicit Deformable Models, Geodesic Active Contours, Level Set, Fast Marching, Vessel Enhancement Filter. 1. INTRODUCTION Brain aneurysm is a potentially serious cerebral pathology due to eventual risk of intra-cerebral bleeding. Studies asserts that it has an incidence between 0.2 and 8.9% being more frequently in women in the 5th-7th decade of life. 9, 12, 22, 25 The most serious complication happens when the aneurysm breaks, since this has fatal con- sequences in 2.6 − 9.8% of the patients and serious consequences in 10.9% of the patients due to intra cranial bruise, subsequent recurrent bleeding, hydrocephaly and spasms in brain vessels. 5, 15, 17 In the last years, there has been a growing trend to practise minimally invasive endovascular procedures. In patients with aneurysm rupture, these techniques stabilize the patient and facilitate further more aggressive treatments with the purpose of preventing the spasm after the intra-cerebral bleeding. Aneurysm coiling with Guglielmi Detachable Coil (GDC) is probably the most widespread method for permanent embolization. It consists on the placement of coils inside the aneurysm using coaxial catheters and micro catheters introduced through the femoral artery. They promote blood coagulation inside the aneurysm avoiding blood flow and pressure thus hampering its rupture. 8 A correct placement of the GDC inside the aneurysm is crucial for the success of the treatment, for which it is desirable to have pre-surgical knowledge of the aneurysm dimensions as well as the three-dimensional * Corresponding author: [email protected] Medical Imaging 2003: Image Processing, Milan Sonka, J. Michael Fitzpatrick, Editors, Proceedings of SPIE Vol. 5032 (2003) © 2003 SPIE · 1605-7422/03/$15.00 1264

Welcome message from author
This document is posted to help you gain knowledge. Please leave a comment to let me know what you think about it! Share it to your friends and learn new things together.
Transcript
Pre-clinical Evaluation of Implicit Deformable Models forThree-dimensional Segmentation of Brain Aneurysms in CTA
Monica Hernandeza, Rosario Barrenab, Gabriel Hernandezb,
Guillermo Sapiroc and Alejandro F. Frangi*a
aVisual Information Technologies (VIT) Lab, Aragon Institute of Engineering Research,University of Zaragoza, Ada Byron Bldg. D2.03, Maria de Luna 1, E-50018 Zaragoza, Spain
bAragon Institute of Health Sciences, Zaragoza, SpaincUniversity of Minnesota, Minneapolis, USA
ABSTRACT
Knowledge of brain aneurysm dimensions is essential during the planning stage of minimally invasive surgicalinterventions using Guglielmi Detachable Coils (GDC). These parameters are obtained in clinical routine us-ing 2D Maximum Intensity Projection images from Computed Tomographic Angiography (CTA). Automatedquantification of the three dimensional structure of aneurysms directly from the 3D data set may be used toprovide accurate and objective measurements of the clinically relevant parameters. The properties of ImplicitDeformable Models make them suitable to accurately extract the three dimensional structure of the aneurysmand its connected vessels. We have devised a two-stage segmentation algorithm for this purpose. In the firststage, a rough segmentation is obtained by means of the Fast Marching Method combining a speed functionbased on a vessel enhancement filtering and a freezing algorithm. In the second stage, this rough segmentationprovides the initialization for Geodesic Active Contours driven by region-based information. The latter problemis solved using the Level Set algorithm. This work presents a comparative study between a clinical and a com-puterized protocol to derive three geometrical descriptors of aneurysm morphology that are standard in assessingthe viability of surgical treatment with GDCs. The study was performed on a data base of 40 brain aneurysms.The manual measurements were made by two neuroradiologists in two independent sessions. Both inter- andintra-observer variability and comparison with the automated method are presented. According to these results,Implicit Deformable Models are a suitable technique for this application.
Keywords: brain aneurysm, CTA, segmentation, Implicit Deformable Models, Geodesic Active Contours, LevelSet, Fast Marching, Vessel Enhancement Filter.
1. INTRODUCTION
Brain aneurysm is a potentially serious cerebral pathology due to eventual risk of intra-cerebral bleeding. Studiesasserts that it has an incidence between 0.2 and 8.9% being more frequently in women in the 5th-7th decadeof life.9, 12, 22, 25 The most serious complication happens when the aneurysm breaks, since this has fatal con-sequences in 2.6 − 9.8% of the patients and serious consequences in 10.9% of the patients due to intra cranialbruise, subsequent recurrent bleeding, hydrocephaly and spasms in brain vessels.5, 15, 17
In the last years, there has been a growing trend to practise minimally invasive endovascular procedures.In patients with aneurysm rupture, these techniques stabilize the patient and facilitate further more aggressivetreatments with the purpose of preventing the spasm after the intra-cerebral bleeding. Aneurysm coiling withGuglielmi Detachable Coil (GDC) is probably the most widespread method for permanent embolization. Itconsists on the placement of coils inside the aneurysm using coaxial catheters and micro catheters introducedthrough the femoral artery. They promote blood coagulation inside the aneurysm avoiding blood flow andpressure thus hampering its rupture.8
A correct placement of the GDC inside the aneurysm is crucial for the success of the treatment, for whichit is desirable to have pre-surgical knowledge of the aneurysm dimensions as well as the three-dimensional
* Corresponding author: [email protected]
Medical Imaging 2003: Image Processing, Milan Sonka, J. Michael Fitzpatrick, Editors,Proceedings of SPIE Vol. 5032 (2003) © 2003 SPIE · 1605-7422/03/$15.00
1264
gtc
M. Hernandez, A.F. Frangi, R. Barrena (2003), Pre-clinical evaluation of implicit deformable models for three-dimensional segmentation of brain aneurysms from CTA images, Medical Imaging 2003: Image Processing, Milan Sonka, J. Michael Fitzpatrick, Editors, Proceedings of SPIE vol. 5032:1264-74.
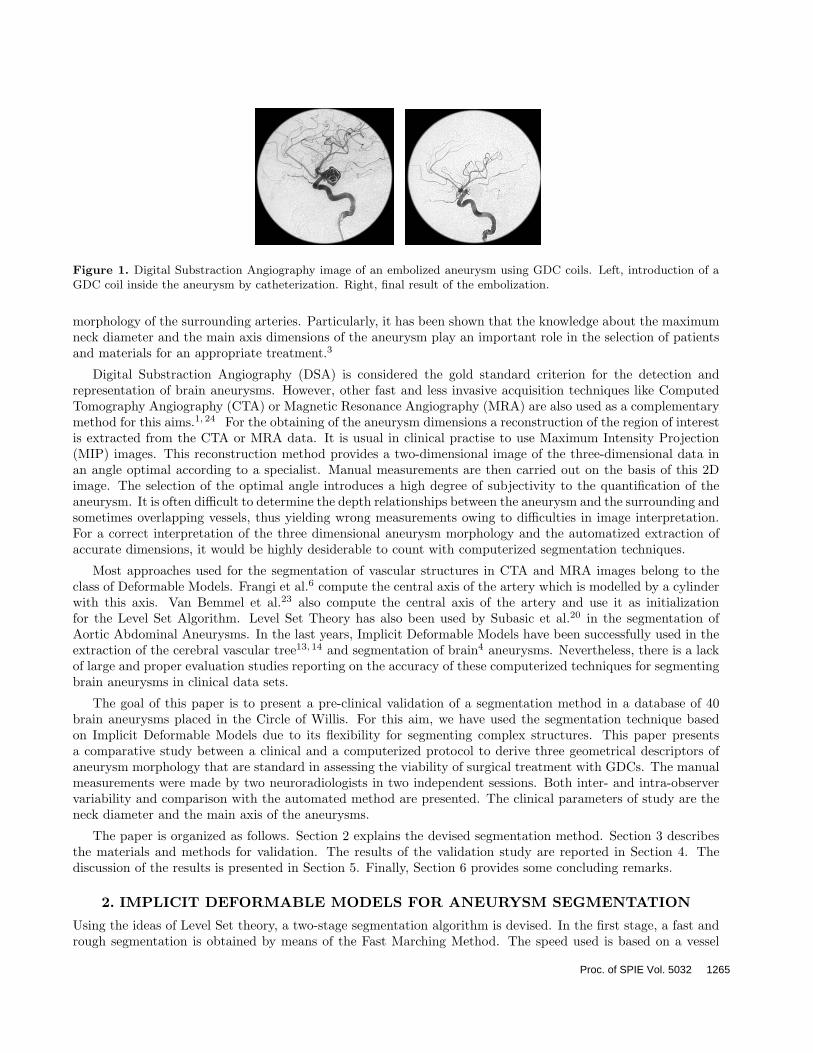
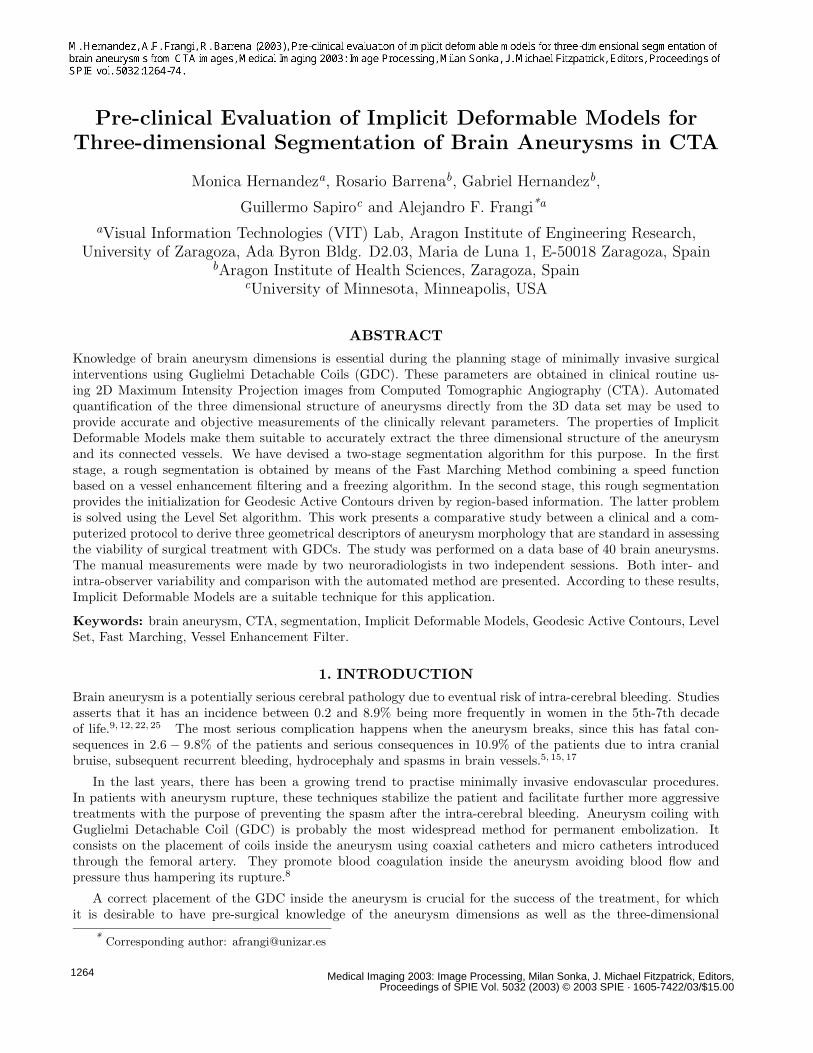
Figure 1. Digital Substraction Angiography image of an embolized aneurysm using GDC coils. Left, introduction of aGDC coil inside the aneurysm by catheterization. Right, final result of the embolization.
morphology of the surrounding arteries. Particularly, it has been shown that the knowledge about the maximumneck diameter and the main axis dimensions of the aneurysm play an important role in the selection of patientsand materials for an appropriate treatment.3
Digital Substraction Angiography (DSA) is considered the gold standard criterion for the detection andrepresentation of brain aneurysms. However, other fast and less invasive acquisition techniques like ComputedTomography Angiography (CTA) or Magnetic Resonance Angiography (MRA) are also used as a complementarymethod for this aims.1, 24 For the obtaining of the aneurysm dimensions a reconstruction of the region of interestis extracted from the CTA or MRA data. It is usual in clinical practise to use Maximum Intensity Projection(MIP) images. This reconstruction method provides a two-dimensional image of the three-dimensional data inan angle optimal according to a specialist. Manual measurements are then carried out on the basis of this 2Dimage. The selection of the optimal angle introduces a high degree of subjectivity to the quantification of theaneurysm. It is often difficult to determine the depth relationships between the aneurysm and the surrounding andsometimes overlapping vessels, thus yielding wrong measurements owing to difficulties in image interpretation.For a correct interpretation of the three dimensional aneurysm morphology and the automatized extraction ofaccurate dimensions, it would be highly desiderable to count with computerized segmentation techniques.
Most approaches used for the segmentation of vascular structures in CTA and MRA images belong to theclass of Deformable Models. Frangi et al.6 compute the central axis of the artery which is modelled by a cylinderwith this axis. Van Bemmel et al.23 also compute the central axis of the artery and use it as initializationfor the Level Set Algorithm. Level Set Theory has also been used by Subasic et al.20 in the segmentation ofAortic Abdominal Aneurysms. In the last years, Implicit Deformable Models have been successfully used in theextraction of the cerebral vascular tree13, 14 and segmentation of brain4 aneurysms. Nevertheless, there is a lackof large and proper evaluation studies reporting on the accuracy of these computerized techniques for segmentingbrain aneurysms in clinical data sets.
The goal of this paper is to present a pre-clinical validation of a segmentation method in a database of 40brain aneurysms placed in the Circle of Willis. For this aim, we have used the segmentation technique basedon Implicit Deformable Models due to its flexibility for segmenting complex structures. This paper presentsa comparative study between a clinical and a computerized protocol to derive three geometrical descriptors ofaneurysm morphology that are standard in assessing the viability of surgical treatment with GDCs. The manualmeasurements were made by two neuroradiologists in two independent sessions. Both inter- and intra-observervariability and comparison with the automated method are presented. The clinical parameters of study are theneck diameter and the main axis of the aneurysms.
The paper is organized as follows. Section 2 explains the devised segmentation method. Section 3 describesthe materials and methods for validation. The results of the validation study are reported in Section 4. Thediscussion of the results is presented in Section 5. Finally, Section 6 provides some concluding remarks.
2. IMPLICIT DEFORMABLE MODELS FOR ANEURYSM SEGMENTATION
Using the ideas of Level Set theory, a two-stage segmentation algorithm is devised. In the first stage, a fast andrough segmentation is obtained by means of the Fast Marching Method. The speed used is based on a vessel
Proc. of SPIE Vol. 5032 1265

enhancement filter. The output of the Fast Marching Algorithm is an image called action map with an abruptjump of the time values in a neighborhood of the edges of the aneurysm and surrounding vessels. This allows usto extract a pre-segmentation of the aneurysm using a threshold of the action map. In images where there areother structures, the Fast Marching Algorithm is combined with a freezing algorithm.
In the second stage, the pre-segmentation is used as initialization for Geodesic Active Contours model. We usea modified partial differential equation for the model as follows. The pre-segmentation defines two regions on theimage domain. The grey values belonging to these regions are modelled by Gaussian distributions. A constantspeed based on these descriptors is added to the motion of the model equation. The Level Set Algorithm is usedto track the motion of the embedding function. The final segmentation is the zero level set of the embeddingfunction.
2.1. FAST MARCHING METHOD
Let Γ0 be a curve or surface evolving along its normal direction with speed F > 0. Let T (p) be the time of arrivalof Γ0 at point p. The function T represents the level set of the evolution of Γ0. This function is the solution ofthe Eikonal equation
F · |∇T | = 1 (1)
with initial condition T (Γ0) = 0. The evolution of Γ0 at time t is the level set t of T .
The Fast Marching Method was introduced by Sethian19 as an efficient algorithm for solving the Eikonalequation. The algorithm is initialized by manually picking a point inside the saccular volume of the aneurysm.The resulting action map has an abrupt jump in the edges of the object. This allows us to choose an appropriatelevel set t as a rough pre-segmentation of the object. Due to the features of CTA vessel images, we used an speedbased on a vessel enhancement filter.
2.1.1. VESSEL ENHANCEMENT FILTER
A vessel enhancement filter was proposed by Frangi et al.7 with the aim of enhancing arteries in MRA and CTAimages. This filter computes a pseudo-probability for a voxel of belonging to a tubular structure using geometricproperties of the image given by the Hessian matrix. This measure is high inside the tubular structure and nearlyzero outside. If |λ1| ≤ |λ2| ≤ |λ3| are the eigenvalues of the Hessian matrix computed at scale σ, the vesselnessfunction is defined by the formula
νσ(x, y, z) =
0, if λ2 ≥ 0 or λ3 ≥ 0
(1− exp(−R2A
2α2 )) exp(−R2
B
2β2 )(1− exp(−S2
2c2 )), otherwise(2)
where RA =|λ2||λ1and RB =
|λ1|√|λ2·λ3|
are used to distinguish between blob- and line- like structures and S is
the Frobenius norm of the Hessian matrix. This parameter uses the additional information that CTA imagesprovide higher values of the filter in the arteries than in the background. The parameters α and β control thesensitivity of the filter for the values of RA and RB and were chosen to be 0.5 for all the images. The parameterc controls the sensitivity for the value S and was chosen as 0.25 of the intensity value of the image at the voxelchosen to initialize the Fast Marching algorithm. Changes in the selection of α, β and c were no significant inthe final result for all the images.
The speed function used in the Fast Marching algorithm is designed by applying the vessel enhancement filterin a multiscale fashion and calculating the maximum of νσ at multiple scales σ. Thus,
F (x, y, z) = maxσmin≤σ≤σmax
νσ(x, y, z) + ε (3)
where ε prevents F from being zero.
The speed is maximum at a scale close to the size of the artery or blob to be detected.11 So σmin and σmax
need to be chosen in the range of the interesting arteries and the width of the saccular region of the aneurysm.The parameter σmin is chosen equal to 0.03 mm for all images. If bonny structures are located near the aneurysm,σmax is chosen equal to 0.6 mm In other case, σmax is chosen equal to 2.7 mm The set of scales σn is chosen
1266 Proc. of SPIE Vol. 5032

according to an exponential sampling, as suggested by the Scale Space Theory: σn = σmin · en·0.15. Thus, noscale is privileged over the others in its contribution to the filter.
Depending on the morphology of the aneurysm and the adjacent bonny structures, the Fast Marching Algo-rithm provides a pre-segmentation far from the boundaries of the object of interest. In these cases, a freezingalgorithm was used to obtain a more accurate pre-segmentation. Freezing algorithm was introduced by De-schamps4 as a complement to the Fast Marching algorithm for the segmentation of thin and elongated struc-tures. The main idea of this algorithm is to consider that voxels evolving slowly have reached the boundary ofthe object, and can be removed from the list of points that are updated according to equation (1). This avoidsoverpassing the boundaries across the vessels when trying to evolve the front along the artery.
2.2. GEODESIC ACTIVE CONTOURS MODEL
Caselles, Kimmel and Sapiro proposed a model known in the literature as Geodesic Active Contours.2 It concilesParametric Models and the Level Set Theory. This model is based on the idea from geodesic snakes10 of evolvingan initial curve or surface to a local minimum of an energy functional. This functional depends on image termsthat attract the front to the edges of the image. Euler-Lagrange equations and the gradient descent methodprovide the computational framework to evolve the front toward the minimum of the functional. The resultingminimum is a model of the object of interest. The algorithm of level set is used to track the front motion.
The histograms of the images can be modelled as the sum of two Gaussian functions. Due to this fact we usea more sophisticated speed function based on regions and statistical approaches for modelling the motion of thefront.
2.2.1. GEODESIC ACTIVE REGIONS
Paragios16 made a wide study on the inclusion of statistical information in Geodesic Active Contours model.The result was a new model of curve and surface evolution based on region information.
The model is based on the idea that a curve or a surface provides a partition of the plane or space in threeregions: inside, outside and boundary. Considering the front evolving in the domain of an image, in each timethe front Γ provides the following partition:
Ω(t) = Ωin(t)⋃Ωout(t)
⋃Γ(t). (4)
Given a partition of the image domain defined by Γ(t), we can define its region descriptors. They are functionsdepending on Ωin, Ωout and the grey level of the image. In this case,
kin/out(x, y, z; t) = −logPin/out(x, y, z; t) (5)
where Pin and Pout are the probabilities for voxel (x, y, z) of belonging to Ωin and Ωout, respectively.
Due to the Gaussian features of the images, these probabilities can be modelled as Gaussian descriptors. So,
Pin/out(x, y, z; t) =1√
2πσin/out(t)exp
(− (I(x, y, z)− µin/out(t))2
2σ2in/out
)(6)
where the mean and standard deviation are calculated from the histogram of the image.
Following the ideas of the theory of Geodesic Active Contours, the energy functional associated to the region-based model is defined as
E(t) = ζ∫
Ωin(t)
kin(x, y, z; t) dx dy dz + ζ∫
Ωout(t)
kout(x, y, z; t) dx dy dz + η∫
Γ(t)
g(x, y, z)dσ (7)
where dσ is the Lebesgue measure on and ζ and η are user defined parameters.
Proc. of SPIE Vol. 5032 1267
The evolution of the regions in which the domain is divided, can be simplified expressing it in terms of theevolution of the boundary Γ(t). So the evolution can be expressed by the partial differential equation
∂Γ(p; t)∂t
= F (p, t)−→N (8)
The minimization of the functional E(t) obtained by the Euler-Lagrange equation and gradient descent methodis
∂Γ(p; t)∂t
= ζ(kout − kin)−→N − η(gκ−→N +∇g) (9)
So the associated level set equation will be
φt + ζ(kout − kin)|∇φ| − η(gκ|∇φ|+∇g∇φ) = 0. (10)
2.2.2. NUMERICAL IMPLEMENTATION
The distance transform of the pre-segmentation obtained in the first stage is computed using the Fast MarchingAlgorithm. This function is used as initial embedding in the Level Set Algorithm. We usually apply 10 iterationsof the equation (10) to assure an accurate segmentation. The numerical implementation of the equation (10)depends on the nature of each component:
• φt: we use forward differences in time to discretize this term.
• ζ(kout − kin)|∇φ|: this term acts as a balloon force, so we use an upwind numerical scheme for selectingthe correct solution.
• gκ|∇φ|: this acts as a viscous force, so we use central differences in space to discretize this term.• ∇g∇φ: this term acts as an advection force, so we use an upwind numerical scheme for selecting the correct
solution.
Between each two iterations we force the level set volume be a distance transform. The Sussman-Fatemialgorithm21 is applied during 10 iterations and an increment of time of 0.05. This avoids numeric instabilities inthe calculation of the curvature.
3. MATERIALS AND METHODS3.1. ANEURYSMS POPULATIONThe study was performed on a data base of 37 patients with ages between 28 and 74 years. The clinical parameterswere evaluated in 40 brain aneurysm. The aneurysm were mainly located in the vessels of the Circle of Willis,more specifically in the Anterior Communicating (17), Posterior Communicating (11) and Middle Cerebral (9)Arteries. There were also three aneurysms located in the Carotid (1), Pericallosal (1) and Basilar (1) Arteries.
3.2. IMAGING PROTOCOLImage acquisition was performed using an Helical Elscint CT Twin scanner (Marconi; Haifa, Israel). Acquisitionparameters were 120 kV/300 mA for the amplifier tube, 1.2 mm of collimation with an helical pitch of 1 andslice spacing of 0.6 mm Reconstruction parameters were 512 x 512 matrix with a square FOV of 20.8 cm yieldingan in-plane resolution of 0.4 mm A total of 140 ml of non ionic contrast fluid was intravenously administrated(Omnitrast 300 mg; Schering, Berling, Germany) at a rate of 3 ml/s, starting the scanning 20 seconds afterinjection onset.
3.3. MANUAL MEASUREMENTSThe scanned images were transferred to a SGI Indigo2 workstation (Silicon Graphics, Mountain View, CA) forview and postprocessing. The manual quantification of the aneurysms was performed using 2D Maximum Inten-sity Images (MIP) and measuring tools provided by the console software Omnipro(Marconi; Haifa, Israel). Theclinical parameters needed for the planning of the endovascular intervention were the maximum neck diameter,the width and the depth of the aneurysm. As it is customary in clinical routine, the measurements were carriedout along several projection angles and from those, the neuroradiologist chose the view angle producing maximalmeasurements.
1268 Proc. of SPIE Vol. 5032
Figure 2. Maximum Intensity Projection image of an aneurysm showing the clinical parameters measured for planningGDC interventions.
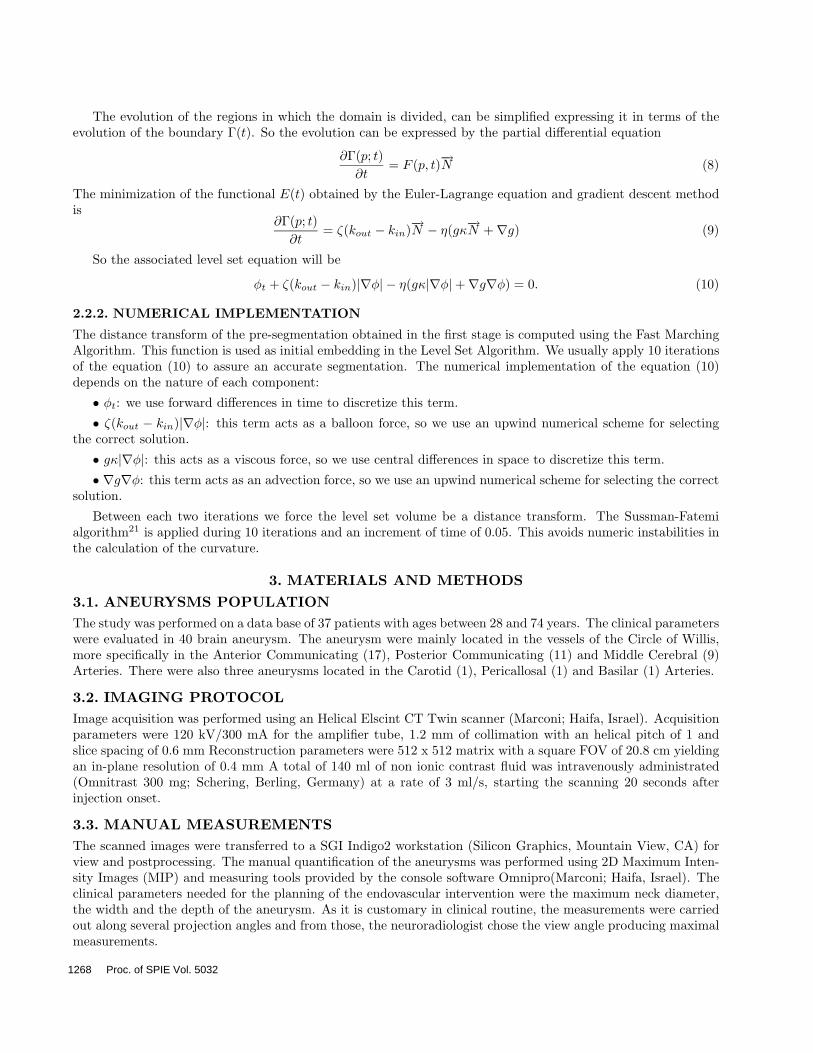
3.4. COMPUTERIZED MEASUREMENTSThe output of the devised algorithm is a distance transform of the surface that models the aneurysm andits surrounding vessels. Using the Marching Cubes Algorithm and the VTK visualization library,18 a 3Dvisualization of the aneurysm model is obtained automatically. To study the agreement between the manualmeasurements and the computerized measurements, the rendering viewpoint was the same as for the MIP imagesand perform the measurements projecting in the camera plane two points from the 3D scene that correspondsto the same magnitude as the 2D scene.
Figure 3. Scheme of the performance of computerized measurements.
4. RESULTS
4.1. EXAMPLESIn Fig. 4 we show some examples of the most representative aneurysms in our data base. The obtainedsegmentations are visualized using the technique of surface rendering.
4.2. EVALUATION METHODThe accuracy of the obtained segmentations was studied. Manual measurements were carried out by two expertsin two independent sessions. Bland-Altman plots were used as statistical method to obtain the repeatabilityof the manual method between the two observers and the limits of agreement, µ ± 1.96 · SD, between manualmeasurements and the computerized method, where µ is the mean of the differences or bias and SD is thestandard deviation of the differences.
Proc. of SPIE Vol. 5032 1269
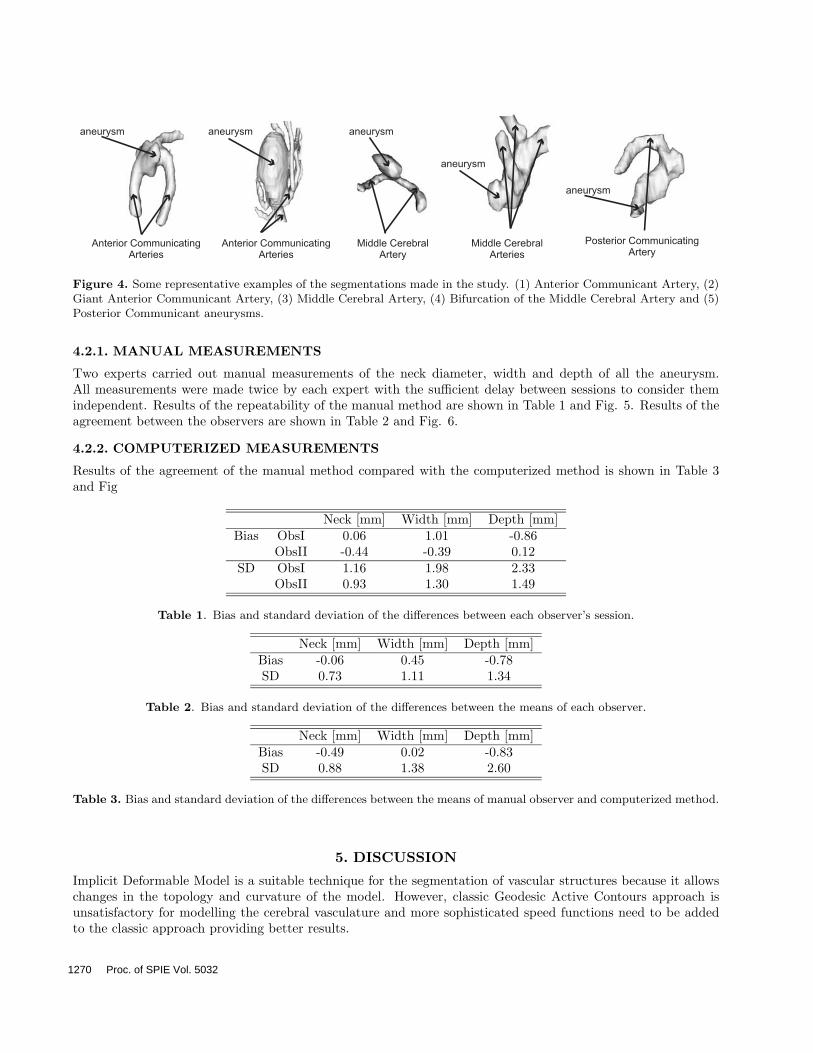
Figure 4. Some representative examples of the segmentations made in the study. (1) Anterior Communicant Artery, (2)Giant Anterior Communicant Artery, (3) Middle Cerebral Artery, (4) Bifurcation of the Middle Cerebral Artery and (5)Posterior Communicant aneurysms.
4.2.1. MANUAL MEASUREMENTS
Two experts carried out manual measurements of the neck diameter, width and depth of all the aneurysm.All measurements were made twice by each expert with the sufficient delay between sessions to consider themindependent. Results of the repeatability of the manual method are shown in Table 1 and Fig. 5. Results of theagreement between the observers are shown in Table 2 and Fig. 6.
4.2.2. COMPUTERIZED MEASUREMENTS
Results of the agreement of the manual method compared with the computerized method is shown in Table 3and Fig
Neck [mm] Width [mm] Depth [mm]Bias ObsI 0.06 1.01 -0.86
ObsII -0.44 -0.39 0.12SD ObsI 1.16 1.98 2.33
ObsII 0.93 1.30 1.49
Table 1. Bias and standard deviation of the differences between each observer’s session.
Neck [mm] Width [mm] Depth [mm]Bias -0.06 0.45 -0.78SD 0.73 1.11 1.34
Table 2. Bias and standard deviation of the differences between the means of each observer.
Neck [mm] Width [mm] Depth [mm]Bias -0.49 0.02 -0.83SD 0.88 1.38 2.60
Table 3. Bias and standard deviation of the differences between the means of manual observer and computerized method.
5. DISCUSSION
Implicit Deformable Model is a suitable technique for the segmentation of vascular structures because it allowschanges in the topology and curvature of the model. However, classic Geodesic Active Contours approach isunsatisfactory for modelling the cerebral vasculature and more sophisticated speed functions need to be addedto the classic approach providing better results.
1270 Proc. of SPIE Vol. 5032
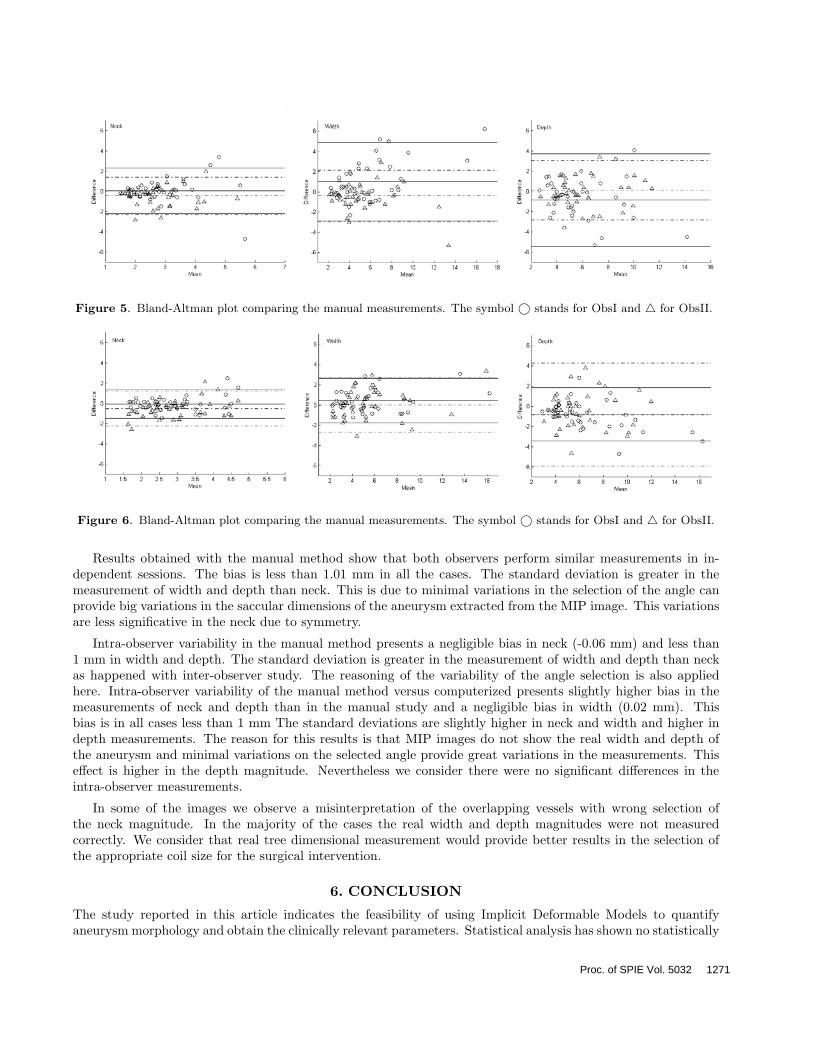
Figure 5. Bland-Altman plot comparing the manual measurements. The symbol © stands for ObsI and for ObsII.
Figure 6. Bland-Altman plot comparing the manual measurements. The symbol © stands for ObsI and for ObsII.
Results obtained with the manual method show that both observers perform similar measurements in in-dependent sessions. The bias is less than 1.01 mm in all the cases. The standard deviation is greater in themeasurement of width and depth than neck. This is due to minimal variations in the selection of the angle canprovide big variations in the saccular dimensions of the aneurysm extracted from the MIP image. This variationsare less significative in the neck due to symmetry.
Intra-observer variability in the manual method presents a negligible bias in neck (-0.06 mm) and less than1 mm in width and depth. The standard deviation is greater in the measurement of width and depth than neckas happened with inter-observer study. The reasoning of the variability of the angle selection is also appliedhere. Intra-observer variability of the manual method versus computerized presents slightly higher bias in themeasurements of neck and depth than in the manual study and a negligible bias in width (0.02 mm). Thisbias is in all cases less than 1 mm The standard deviations are slightly higher in neck and width and higher indepth measurements. The reason for this results is that MIP images do not show the real width and depth ofthe aneurysm and minimal variations on the selected angle provide great variations in the measurements. Thiseffect is higher in the depth magnitude. Nevertheless we consider there were no significant differences in theintra-observer measurements.
In some of the images we observe a misinterpretation of the overlapping vessels with wrong selection ofthe neck magnitude. In the majority of the cases the real width and depth magnitudes were not measuredcorrectly. We consider that real tree dimensional measurement would provide better results in the selection ofthe appropriate coil size for the surgical intervention.
6. CONCLUSION
The study reported in this article indicates the feasibility of using Implicit Deformable Models to quantifyaneurysm morphology and obtain the clinically relevant parameters. Statistical analysis has shown no statistically
Proc. of SPIE Vol. 5032 1271
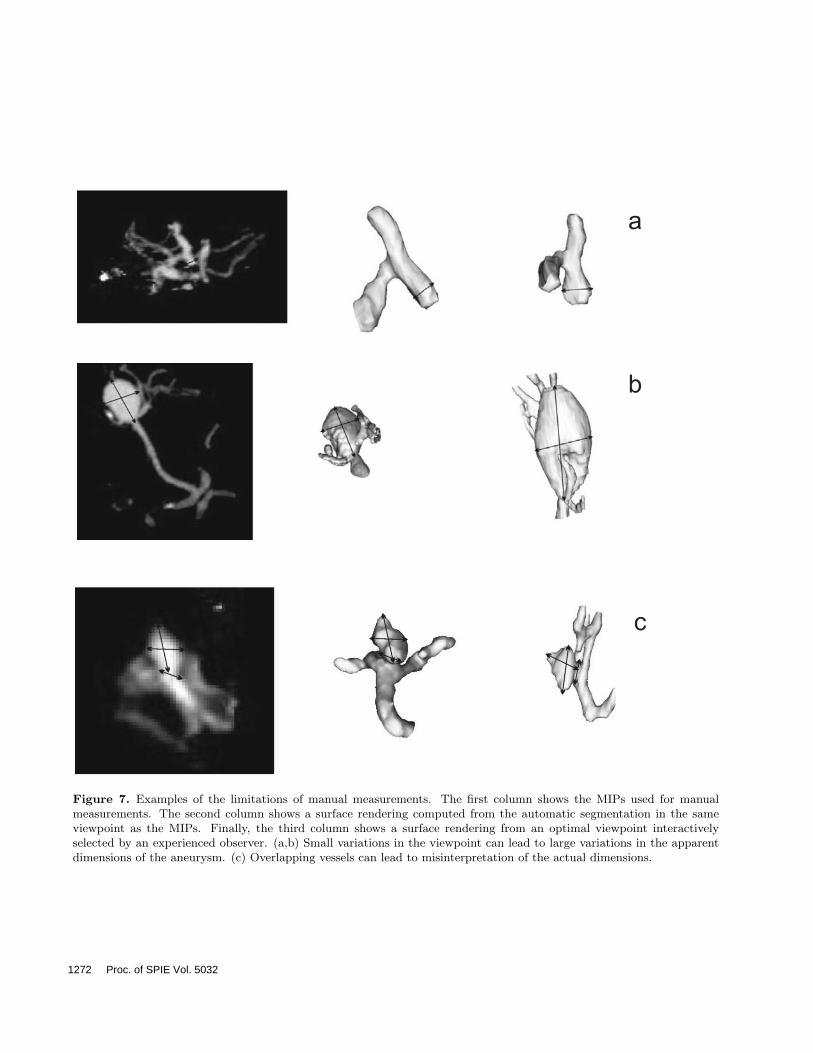
Figure 7. Examples of the limitations of manual measurements. The first column shows the MIPs used for manualmeasurements. The second column shows a surface rendering computed from the automatic segmentation in the sameviewpoint as the MIPs. Finally, the third column shows a surface rendering from an optimal viewpoint interactivelyselected by an experienced observer. (a,b) Small variations in the viewpoint can lead to large variations in the apparentdimensions of the aneurysm. (c) Overlapping vessels can lead to misinterpretation of the actual dimensions.
1272 Proc. of SPIE Vol. 5032
significant differences between manual and computerized measurements. In summary, the technique presentedin this work will contribute to the computerized pre-surgical planning of coiling procedures by providing moreaccurate and true 3D quantification of aneurysms morphology.
ACKNOWLEDGMENTS
MHG is supported by the grant AP2001-1678 from the Spanish Ministry of Education, Culture and Sport. AFFis supported by a Ramon y Cajal Research Fellowship from the Spanish Ministry of Science and Technology.This research was partially supported by the grants TIC2000-1635-C04-01, TIC2002-04495-C02 and FIT-070000-2002-935 from the same Ministry.
REFERENCES1. G.B. Anderson, D.E. Steinke, K.C. Petruk, R. Ashforth, and J.M. Findlay, Computed Tomographic Angiog-
raphy versus Digital Subtraction Angiography for the diagnosis and early treatment of ruptured intracranialaneurysms, Neurosurgery 45(6) (1999 Dec), 1315–20.
2. V. Caselles, R. Kimmel, and G. Sapiro, Geodesic active contours, International Journal of Computer Vision22 (1) (1997), 61–79.
3. G.M. Debrun, V.A. Aletich, P. Kehrli, M. Misra, J.I. Ausman, F. Charbel, and H. Shownkeen, Aneurysmgeometry: an important criterion in selecting patients for Guglielmi detachable coiling, Neuro. Med. Chir.38 (1998 Apr), 1–20.
4. T. Deschamps, Extraction de courbes et surfaces par mthodes de chemins minimaux et ensembles de niveaux.applications en imagerie medicale 3d, Ph.D. Thesis, University of Paris-Dauphine, France (2001 Dec).
5. Z. Dovey, M. Misra, J. Thornton, F.T. Charbel, G.M. Debrun, and J.I. Ausman, Guglielmi detachable coilingfor intracanial aneurysms: the story so far, Arch.Neurol. 58(4) (2001 Apr), 559–64.
6. A.F. Frangi, W.J. Niessen, P.D. Nederkoorn, J. Bakker, W.P.Th.M. Mali, and M.A. Viergever, Quantitativeanalysis of vessel morphology from 3D MR angiograms: in vitro and in vivo results, Magnetic Resonance inMedicine 45(2) (2001 Feb), 311–22.
7. A.F. Frangi, W.J. Niessen, K.L. Vincken, and M.A. Viergever, Multiscale vessel enhancement filtering,Lecture Notes in Computer Science 1496 (1998), 130–137.
8. G. Guglielmi, F. Vinuela, I. Spetka, and V. Macellari, Electrothrombosis of saccular aneurysms via endovas-cular approach, Neruosurg. 75(1) (1991 Jul), 1–7.
9. M. Kaminogo, M. Yonekura, and S. Shibata, Incidence and outcome of multiple intracranial aneurysms ina defined population, Stroke 34(1) (2003 Jan), 16–21.
10. M. Kass, A. Witkin, and D. Terzopoulos, Snakes: Active contour models, International Journal of ComputerVision 1(4) (1988), 321–331.
11. T. Lindeberg, Feature detection with automatic scale selection, International Journal of Computer Vision30(2) (1998), 77–116.
12. F.H. Linn, G.J. Rinkel, A. Algra, and J. van Gijn, Incidence of subarachnoid hemorrhage: role of region,year, and rate of Computed Tomography: a meta-analysis, Stroke 27(4) (1996 Apr), 625–9.
13. L.M. Lorigo, O. Faugeras, W.E.L. Grimson, R. Keriven, R. Kikinis, and C.F. Westin, Co-dimension 2geodesic active contours for MRA segmentation, Lecture Notes in Computer Science 1613 (1999), 126–.
14. L.M. Lorigo, O.D. Faugeras, W.E.L. Grimson, R. Keriven, R. Kikinis, A. Nabavi, and C.F. Westin., Curves:Curve evolution for vessel segmentation, Medical Image Analysis 5(3) (2001), 195–206.
15. A.P. Lozier, E.S. Connolly, S.D. Lavine, and R.A. Solomon, Guglielmi detachable coil embolization of pos-terior circulation aneurysms: a systematic review of the literature, Stroke 33(10) (2002 Oct), 2509–18.
16. N. Paragios, Geodesic active regions and level set methods: Contributions and applications in artificialvision, Ph.D. Thesis, University of Nice Sophia-Antipolis, France (2000).
17. T.W. Raaymakers, G.J. Rinkel, M. Limburg, and A. Algra,Mortality and morbidity of surgery for unrupturedintracranial aneurysms: a meta-analysis., Stroke 29(8) (1998 Aug), 1531–8.
18. W.J. Schroeder, K.M. Martin, and W.E. Lorensen, The visualization toolkit (VTK), Pearson Education(1997).
Proc. of SPIE Vol. 5032 1273

19. J.A. Sethian, A fast marching level set method for monotonically advancing fronts, Proc. Nat. Acad. Sci. 4(1996), 1591–1595.
20. M. Subasic, S. Loncaric, and E. Sorantin, 3-D deformable model segmentation of abdominal aneurysm,Proceedings of SPIE Medical Imaging, San Diego, USA, (2001).
21. M. Sussman, P. Smereka, and S.J. Osher, A level set method for computing solutions to incompressibletwo-phase flow, Journal of Computational Physics 114 (1994), 146–159.
22. F. Tomasello, D. D’Avella, F.M. Salpietro, and M. Longo, Asymptomatic aneurysms. Literature meta-analysis and indications for treatment., J. Neurosurg. Sci. 42(1) (1998 Mar), 47–51.
23. C.M. van Bemmel, L. Spreeuwers, M.A. Viergever, and W.J. Niessen, Level-set based carotid artery segmen-tation for stenosis grading, Lecture Notes in Computer Science 2489 (2002), 36–43.
24. P.M. White, E.M. Teasdale, J.M. Wardlaw, and V. Easton, Intracranial aneurysms: CT angiography andmr angiography for detection prospective blinded comparison in a large patient cohort., Radiology 219(3)(2001 Jun), 739–49.
25. H.R. Winn, J.A. Jane, J. Taylor, D. Kaiser, and G.W. Britz, Prevalence of asymptomatic incidentalaneurysms: review of 4568 arteriograms, J. Neurosurg. 97(1) (2002 Jan), 240.
1274 Proc. of SPIE Vol. 5032
Related Documents