Optimization of wavelengths set for multispectral reflectance imaging of rat olfactory bulb activation in vivo Rémi Renaud a , Mounir Bendhamane †a , Romain Chery a , Claire Martin a , Hirac Gurden a , Frédéric Pain *a a UMR 8165, CNRS, Université Paris-Sud 11, Bâtiment 440, F-91405 Orsay Cedex, France ABSTRACT Wide field multispectral imaging of light backscattered by brain tissues provides maps of hemodynamics changes (total blood volume and oxygenation) following activation. This technique relies on the fit of the reflectance images obtain at two or more wavelengths using a modified Beer-Lambert law 1,2 . It has been successfully applied to study the activation of several sensory cortices in the anesthetized rodent using visible light 1–5 . We have carried out recently the first multispectral imaging in the olfactory bulb 6 (OB) of anesthetized rats. However, the optimization of wavelengths choice has not been discussed in terms of cross talk and uniqueness of the estimated parameters (blood volume and saturation maps) although this point was shown to be crucial for similar studies in Diffuse Optical Imaging in humans 7–10 . We have studied theoretically and experimentally the optimal sets of wavelength for multispectral imaging of rodent brain activation in the visible. Sets of optimal wavelengths have been identified and validated in vivo for multispectral imaging of the OB of rats following odor stimulus. We studied the influence of the wavelengths sets on the magnitude and time courses of the oxy- and deoxyhemoglobin concentration variations as well as on the spatial extent of activated brain areas following stimulation. Beyond the estimation of hemodynamic parameters from multispectral reflectance data, we observed repeatedly and for all wavelengths a decrease of light reflectance. For wavelengths longer than 590 nm, these observations differ from those observed in the somatosensory and barrel cortex and question the basis of the reflectance changes during activation in the OB. To solve this issue, Monte Carlo simulations (MCS) have been carried out to assess the relative contribution of absorption, scattering and anisotropy changes to the intrinsic optical imaging signals in somatosensory cortex (SsC) and OB model. Keywords : Multispectral, reflectance, wavelength optimization, hemodynamics, somatosensory cortex, olfactory bulb * Corresponding author † now at Department of Anatomy and Neurobiology, University of Tennessee Health Science Center, Memphis, Tennessee 38163, USA Biophotonics: Photonic Solutions for Better Health Care III, edited by Jürgen Popp, Wolfgang Drexler, Valery V. Tuchin, Dennis L. Matthews, Proc. of SPIE Vol. 8427, 84271O © 2012 SPIE · CCC code: 1605-7422/12/$18 · doi: 10.1117/12.922566 Proc. of SPIE Vol. 8427 84271O-1 Downloaded from SPIE Digital Library on 03 Jul 2012 to 129.175.97.14. Terms of Use: http://spiedl.org/terms

Welcome message from author
This document is posted to help you gain knowledge. Please leave a comment to let me know what you think about it! Share it to your friends and learn new things together.
Transcript

Optimization of wavelengths set for multispectral reflectance imaging
of rat olfactory bulb activation in vivo
Rémi Renauda, Mounir Bendhamane†a, Romain Cherya, Claire Martina, Hirac Gurdena, Frédéric
Pain*a
aUMR 8165, CNRS, Université Paris-Sud 11, Bâtiment 440, F-91405 Orsay Cedex, France
ABSTRACT
Wide field multispectral imaging of light backscattered by brain tissues provides maps of hemodynamics changes (total
blood volume and oxygenation) following activation. This technique relies on the fit of the reflectance images obtain at
two or more wavelengths using a modified Beer-Lambert law1,2
. It has been successfully applied to study the activation
of several sensory cortices in the anesthetized rodent using visible light1–5
. We have carried out recently the first
multispectral imaging in the olfactory bulb6 (OB) of anesthetized rats. However, the optimization of wavelengths choice
has not been discussed in terms of cross talk and uniqueness of the estimated parameters (blood volume and saturation
maps) although this point was shown to be crucial for similar studies in Diffuse Optical Imaging in humans7–10
. We have
studied theoretically and experimentally the optimal sets of wavelength for multispectral imaging of rodent brain
activation in the visible. Sets of optimal wavelengths have been identified and validated in vivo for multispectral imaging
of the OB of rats following odor stimulus. We studied the influence of the wavelengths sets on the magnitude and time
courses of the oxy- and deoxyhemoglobin concentration variations as well as on the spatial extent of activated brain
areas following stimulation. Beyond the estimation of hemodynamic parameters from multispectral reflectance data, we
observed repeatedly and for all wavelengths a decrease of light reflectance. For wavelengths longer than 590 nm, these
observations differ from those observed in the somatosensory and barrel cortex and question the basis of the reflectance
changes during activation in the OB. To solve this issue, Monte Carlo simulations (MCS) have been carried out to assess
the relative contribution of absorption, scattering and anisotropy changes to the intrinsic optical imaging signals in
somatosensory cortex (SsC) and OB model.
Keywords : Multispectral, reflectance, wavelength optimization, hemodynamics, somatosensory cortex, olfactory bulb
* Corresponding author † now at Department of Anatomy and Neurobiology, University of Tennessee Health Science Center, Memphis,
Tennessee 38163, USA
Biophotonics: Photonic Solutions for Better Health Care III, edited by Jürgen Popp, Wolfgang Drexler, Valery V. Tuchin, Dennis L. Matthews, Proc. of SPIE Vol. 8427, 84271O
© 2012 SPIE · CCC code: 1605-7422/12/$18 · doi: 10.1117/12.922566
Proc. of SPIE Vol. 8427 84271O-1
Downloaded from SPIE Digital Library on 03 Jul 2012 to 129.175.97.14. Terms of Use: http://spiedl.org/terms

1. INTRODUCTION Intrinsic optical signal imaging (IOSI) is widely used to investigate neurovascular coupling of sensory activation in
animal models. It relies on local changes of oxy- and deoxyhemoglobin concentrations. Changes in these physiological
parameters induce changes in reflected light4. To assess variations of these parameters from reflectance variations, it is
necessary to illuminate tissues with at least two wavelengths. This is the purpose of multispectral imaging. However,
wavelengths used to illuminate cortical tissues play a crucial role in the accuracy of derivation of hemodynamic
parameters8–10
via a modified Beer-Lambert law and it is necessary to minimize cross talk between chromophores and
separability of the imaging system11
. Optimization has been led for human near infrared spectroscopy8,11
but not for small
animal imaging in visible light. Moreover, MCS were performed in layered model of SsC and OB to estimate the effect
of optical parameters changes on reflectance signal.
2. MATERIAL AND METHODS
2.1 Wavelength optimization program
Multispectral imaging technique allows to extract chromophores concentrations from recorded reflectance data1,2,5,12
. In
our study, only two chromophores were considered : oxyhemoglobin and deoxyhemoglobin. This implies that we must,
at least, illuminate the tissue with two different wavelengths to assess their concentrations via a modified Beer-Lambert
law fit. It has been shown that choice of wavelengths set is not a trivial issue and play a crucial role in chromophores
concentrations calculation7–10
. The first step was of wavelengths optimization was to determine what kind of wavelengths
sets are the best to fit hemodynamics time courses from reflectance variation data. As described in reference 9 we have to
take into account two parameters to determine the better wavelengths combinations. The first one is the cross talk that
depends directly on the choice of wavelengths. It represents the influence of concentration variation in one chromophore
on the other. Indeed, assuming that oxyhemoglobin and deoxyhemoglobin are the only absorbers, a change of
oxyhemoglobin concentration occurs, it may mimic a deoxyhemoglobin concentration change and vice-versa. Cross talk
is defined from a chromophore a (at concentration [a]) to another chromophore b (at concentration [b]) by a single
parameter :
][][
baC ba Δ
Δ=→ (1)
The principle is to determine the influence of a localized chromophore (i.e. in one layer) concentration change on global
variation (in all layers). Considering only local variation of chromophore a leads to the following expression of cross talk
of chromophore a on chromophore b for two wavelengths (for detailed calculation, please refer to Uludag et al11
) :
)().().()().().())()().(().(
2*
121*
21
1*
2*
21
λλελελλελελλλελε
jbajba
jjaaba ll
llC
−
−=→ (2)
Where εa and εb are the extinction coefficients of chromophores a and b (in l.mol-1.cm-1). lj*(λ) are the relative partial
Proc. of SPIE Vol. 8427 84271O-2
Downloaded from SPIE Digital Library on 03 Jul 2012 to 129.175.97.14. Terms of Use: http://spiedl.org/terms

pathlength at wavelength λ defined as the quotient between partial pathlength in layer j (lj(λ) in cm) and total pathlength
(L(λ) in cm). The second parameter for wavelengths optimization is separability that accounts for the effect of physical
noise of the imaging system on hemodynamics estimations. Previously, only couples of optimal wavelengths were
considered for near-infrared spectroscopy7,8,10,11
. Here, we wanted to assess the best couples for visible range, as well as
triplets of wavelengths allowing the best fit for rodent in vivo multispectral imaging.
2.2 Monte Carlo simulation for reflectance measurements
MCS were carried out to assess relative reflectance changes for optical parameters variations. They are based on
established algorithms for photons propagation in biological tissues13
, and were performed for both layered models of
SsC and OB described previously14,6
. The absorption coefficient µa-λ is calculated as the linear combination of the
contribution of each chromophore, and written as follows :
∑=i
iia tc )(.).10ln( ,, λλ εμ (3)
where εi,λ is the molecular extinction coefficient of each chromophore (in l.mol−1.cm−1 ) and ci is its concentration (in
mol.l−1 ) . The absorption coefficient of each layer is wavelength dependent and takes into account absorption due to
hemoglobin (µa-HbT,λ) plus a minor but not negligible absorption from cells (µa-cell,λ). Absorption coefficients for
hemoglobin at different wavelengths (μa-HbT,λ) were calculated for the different layers using tabulated molar extinction
coefficients for oxy- and deoxyhemoglobin from Oregon Medical Laser Center site. Oxygen saturation at rest was set to
60% (S = 0.6). The absorption coefficient for other absorbers (μa-cell,λ) was taken from experimental measurements in
tissues devoid of blood15
. In addition, a wavelength-independent scattering coefficient, μs, and a wavelength-dependent
anisotropy factor, gλ, were considered for each layer. Scattering coefficient and anisotropy factor were taken from
measurements on white and gray matters in blood-free human brain tissues15
. The refractive index n for tissue was fixed
at 1.40 for all layers16–18
. Both specular and diffuse reflectance were calculated at 630 nm for basal state and non-basal
state optical properties (see Table 1 and Table 2 respectively for OB and SsC used optical properties at 630 nm). Non-
basal optical properties consist in an independent variation of absorption coefficient µa (±5%, ±10%), scattering
coefficient µs (±10%) or anisotropy factor g (+1%). Each variation was considered globally (i.e. in every layer of the
model) or locally (i.e. only in defined « activated » layer, highlighted in tables 1 and 2). To assess the effect of optical
properties changes on the diffuse reflectance value, the ratio between non-basal diffuse reflectance and basal reflectance
was calculated in each case.
2.3. Animal preparation and multispectral imaging setup
Studies were conducted in accordance with European Commission directive 2010/63/EU. Long Evans rats (mean
weight=300g, n=3) were anesthetized with an intraperitoneal injection of ketamine (60 mg⁄kg Imalgen) and metedomidin
(0.4 mg⁄kg Domitor) mix. The anesthesia level was monitored and adjusted if necessary throughout the experiment. Rats
were then placed in a stereotactic instrument.
Proc. of SPIE Vol. 8427 84271O-3
Downloaded from SPIE Digital Library on 03 Jul 2012 to 129.175.97.14. Terms of Use: http://spiedl.org/terms

Table 1. Optical properties of olfactory bulb model at 630 nm. Basal state optical properties are highlighted in dark gray.
Layer highlighted in gray is the « activated » layer. ONL : Olfactory Nerve Layer. GL : Glomerular Layer. UGL :
Underneath Glomerular Layer.
Table 2. Optical properties of somatosensory cortex model at 630 nm. Basal state optical properties are highlighted in
dark gray. Layer highlighted in gray is the « activated » layer.
A cranial window of about 3×3 mm² was created over the OB and filled with agarose covered by a microscope coverslip
to minimize brain movements and ensure a flat optical interface. Body temperature was monitored and maintained with a
heating pad throughout the experiment. Reflectance images evoked by OB activation were recorded with a classic
multispectral setup consisting in a cooled 12-bit CCD camera mounted on a macroscope. Illumination was performed
using a OneLight Spectra light engine based on a broad-band light source and a digital mirror device. The light engine
can store eight mirror patterns (i.e. eight wavelengths with associated intensities) prior to the experiment, which allows
fast switching between wavelengths (switch is achieved in less than 40 μs). Stimulation of the OB was performed with
pure odorants (hexanal diluted at 20% in mineral oil) delivered by a transistor-transistor logic-controlled olfactometer.
CCD camera was used to trigger lamp (driven with a custom-written Labview program) and olfactometer via an Arduino
microcontroller. Then, for reflectance imaging, illumination is carried out sequentially at 440, 486, 530, 560, 584, 610,
630, and 670 nm during the imaging trial, which consists of 5 seconds of rest, 5 seconds of odor stimulation by hexanal
20%, and 50 seconds post stimulation. The intertrial interval is at least 1 min to avoid habituation of the rat to the
stimulus. Images are acquired at a frame rate of 3 Hz per wavelength (24 frames per second). Further details regarding
the timing of the imaging set-up and image processing can be found in Renaud et al19
.
Proc. of SPIE Vol. 8427 84271O-4
Downloaded from SPIE Digital Library on 03 Jul 2012 to 129.175.97.14. Terms of Use: http://spiedl.org/terms

3. RESULTS
3.1 Wavelength optimization
3.1.1 Wavelength combinations : crosstalk and separability
Cross talk (figure 1) and separability were calculated in the 440-640 nm range (step of 2 nm) following method proposed
by Uludag et al11
for two wavelengths combinations.
Figure 1. Cross talk for dual wavelength combinations in 440-640 nm range for OB activated layer. The lower is the
cross talk, the better is the wavelengths pair.
Calculation has shown very low values for separability (<10-3) for all wavelengths pairs and it is not presented here. Two
criterions were taken into account to determine which wavelength combination is the best for rodent cerebral
multispectral imaging. First, a wavelengths couple with low cross talk is determined (λ1, λ2). However, for combination
commonly used1,2,5 (from 560 to 610 nm) CTV are generally under 0.05 and a variation around the point under 10%.
Even if some couples are good, considering spectral width of 4 nm reveals that combinations are not so good as
expected. For example, (484, 500) CTV is about 0.14 but varies of more than 50% around the point. For (584, 610) with
a CTV ~0.037 with a variation around the point about 3%, or (530, 630) with a CTV of 0.037 and a variation around the
point about 1.6%. For wavelengths triplets (λ1, λ2, λ3), results were the same concerning the 440-460 nm interval and
combinations using these wavelengths, whereas combinations using high wavelengths (above 600 nm) are good (with
CTVs under 0.05). Due a difficulty to clearly represent cross talk for three wavelengths combinations, only general
considerations will be made here. CTVs were lightly under CTVs for commonly used wavelengths couples (~0.1), but
variations around a point was greater, so find a good combination must take into account both criterions of low CTV and
low variation around the point. For example, (530, 584, 630) combination with a CTV of 0.024 varying around the point
about 0.8%.
Proc. of SPIE Vol. 8427 84271O-5
Downloaded from SPIE Digital Library on 03 Jul 2012 to 129.175.97.14. Terms of Use: http://spiedl.org/terms

3.1.2 Influence on hemodynamics time courses and spatial extent
Hemodynamics (oxy- ([HbO]), deoxyhemoglobin ([HbR]) concentrations and hemoglobin total concentration [HbT])
were derived using three different wavelengths triplets. Hemodynamics time courses (figure 2) and spatial extent (figure
3) were calculated for three triplets with different CTV and different variation around the point (see table 3). Figure 2
shows a decrease of [HbO] during activation with a maximum about -3% reached at the end of stimulation period. There
is an increase in [HbR] and which maximum (about +7.5%) with the same temporal characteristic. Increase of [HbT]
appears to be sustained with a plateau at ~2% until 20 s after the end of stimulation. For chosen triplets, shape of time
courses is the same for three combinations. [HbO] decreases, [HbR] increases, [HbT] increases during activation. For
(584, 610, 630) and (530, 584, 630) triplets, there is no significant differences. But discrepancies appears for (486, 530,
584) triplet. First, noise is higher, amplitudes of [HbR] and [HbT] changes are 2 folds higher than for the two other
triplets.
Figure 2. Hemodynamics time courses for three wavelengths triplets. Black squares : (530, 584, 630) triplet, dark gray
diamonds : (584, 610, 630) triplet, light gray triangles : (486, 530, 584) triplet. Rectangle represents stimulation period,
horizontal dashed line is baseline. Hemodynamics time courses for (A) ∆[HbO], (B) ∆[HbR] and (C) ∆[HbT].
Proc. of SPIE Vol. 8427 84271O-6
Downloaded from SPIE Digital Library on 03 Jul 2012 to 129.175.97.14. Terms of Use: http://spiedl.org/terms

Table 3. Values of CTV and average variation around the point for three triplets.
Figure 3 shows hemodynamics spatial extent obtained by calculations using a modified Beer-Lambert law. As already
seen on time courses, (486, 530, 584) triplet is noisier than two other triplets. Looking at the spatial extent, ∆[HbR] and
∆[HbT] shows no differences between the three triplets, whereas for ∆[HbO], activated zone appears more clearly for
(584, 610, 630) and (530, 584, 630) than for (486, 530, 584).
Figure 3. ∆[HbO], ∆[HbR] and ∆[HbT] spatial extent and anatomical maps at the end of stimulation period for three
triplets. (A) (486, 530, 584) triplet. (B) (584, 610, 630) triplet. (C) (530, 584, 630) triplet. Color bars represents relative
variations from baseline (in percent). Black circle stands for the chosen ROI where time courses were plotted. Hot point
on bottom left are due to bubbles in animal preparation. (D) Anatomical map at 530 nm. Red circle matches with black
circle.
Proc. of SPIE Vol. 8427 84271O-7
Downloaded from SPIE Digital Library on 03 Jul 2012 to 129.175.97.14. Terms of Use: http://spiedl.org/terms
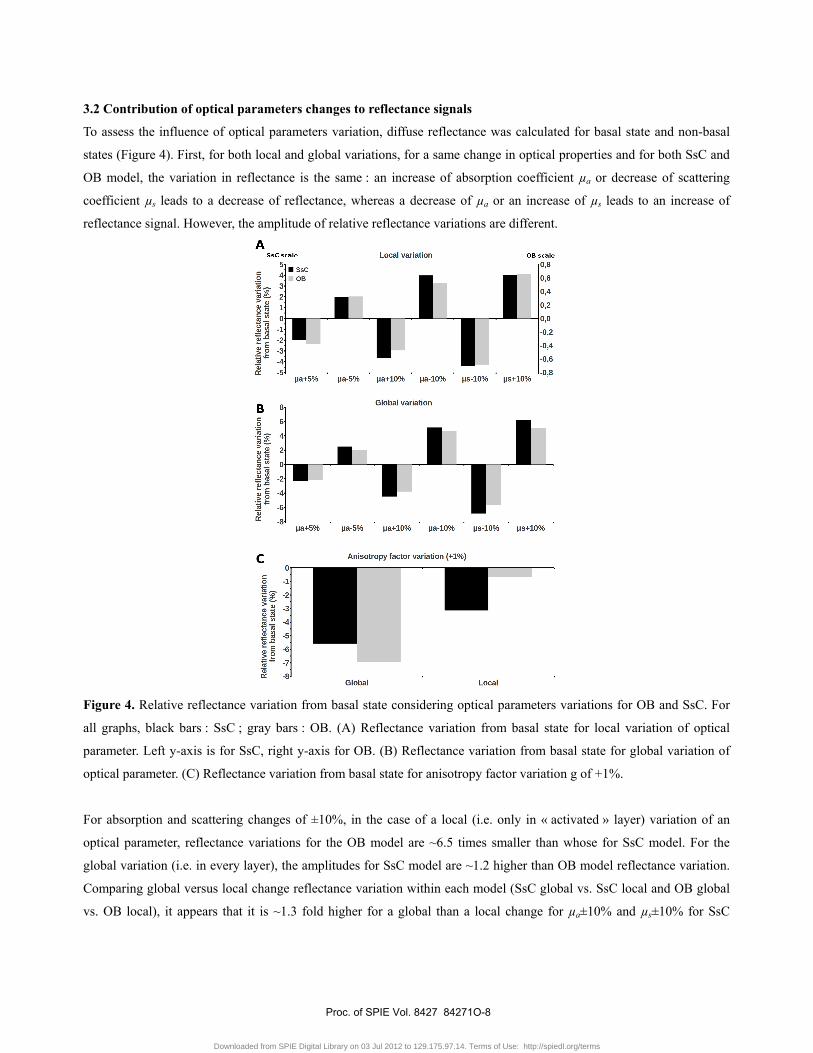
3.2 Contribution of optical parameters changes to reflectance signals
To assess the influence of optical parameters variation, diffuse reflectance was calculated for basal state and non-basal
states (Figure 4). First, for both local and global variations, for a same change in optical properties and for both SsC and
OB model, the variation in reflectance is the same : an increase of absorption coefficient µa or decrease of scattering
coefficient µs leads to a decrease of reflectance, whereas a decrease of µa or an increase of µs leads to an increase of
reflectance signal. However, the amplitude of relative reflectance variations are different.
Figure 4. Relative reflectance variation from basal state considering optical parameters variations for OB and SsC. For
all graphs, black bars : SsC ; gray bars : OB. (A) Reflectance variation from basal state for local variation of optical
parameter. Left y-axis is for SsC, right y-axis for OB. (B) Reflectance variation from basal state for global variation of
optical parameter. (C) Reflectance variation from basal state for anisotropy factor variation g of +1%.
For absorption and scattering changes of ±10%, in the case of a local (i.e. only in « activated » layer) variation of an
optical parameter, reflectance variations for the OB model are ~6.5 times smaller than whose for SsC model. For the
global variation (i.e. in every layer), the amplitudes for SsC model are ~1.2 higher than OB model reflectance variation.
Comparing global versus local change reflectance variation within each model (SsC global vs. SsC local and OB global
vs. OB local), it appears that it is ~1.3 fold higher for a global than a local change for µa±10% and µs±10% for SsC
Proc. of SPIE Vol. 8427 84271O-8
Downloaded from SPIE Digital Library on 03 Jul 2012 to 129.175.97.14. Terms of Use: http://spiedl.org/terms

model and ~7.5 fold higher for a global than a local change for µa±10% and µs±10% in the OB model. Finally,
reflectance variations for the OB and the SsC about 2 times higher for a µa±10% change than for µa±5% change for
global and local change. For anisotropy factor variation, the effect is far stronger for a global change (-5.6% and -6.9%
respectively for SsC and OB models) than for local change (-3.1% and -0.6% respectively for SsC and OB models).
Moreover, reflectance variation for SsC and OB is respectively ~1.8 fold higher and ~10 fold for a global change than for
a local change.
4. DISCUSSION
4.1 Wavelength optimization
Choice of illumination wavelengths for multispectral imaging is crucial to determine with maximum accuracy
hemodynamics (total hemoglobin and hemoglobin oxygenation level) variations. Here, crosstalk and separability were
calculated in 440-640 nm range used in intrinsic optical signal imaging, then for multispectral imaging. The first
assumption made is to consider oxy- and deoxyhemoglobin as main absorbers, water and lipids were not taken into
account20
because of their absorption coefficient values in selected wavelengths range (about 10-3 cm−1 for water and less
than 10-1 cm−1 for lipids – data taken from OMLC site) compared to values of oxy- and deoxyhemoglobin (~1000 fold
higher). It appears that, seperability for two wavelengths was found to be very low in visible range (>10-3) compared to
value found by Uludag for near infrared spectroscopy. This fact can be due to higher absorption in visible range than in
near infrared range for oxy- and deoxyhemoglobin. Even if two wavelengths are enough to derive two chromophores
concentrations variations with multispectral method, CTVs for three wavelengths combinations was calculated. It
appears that CTVs are better and that variations around the point are lower than for dual wavelength combination for
some wavelengths triplets. Moreover, comparing with hemodynamics time courses derived with two wavelengths (data
not shown), it appears that noise is lower in the case of well chosen wavelengths triplets, whereas taking four
wavelengths (data not shown) do not lower noise and do not change shapes of hemodynamics time course obtained with
triplets combinations. Wavelengths combinations used in previous multispectral study1,2,5,12
have good CTV but spectral
width is not taken into account.
4.2 Monte Carlo simulations for assessing reflectance variations induced by optical properties changes
4.2.1 Values of optical parameters changes
Cerebral activation leads to hemodynamic changes (blood volume, hemoglobin oxygenation level) as well as increase of
cells metabolism, which translate into optical parameters changes. Amplitude of optical parameters variations are now
justified. Absorption coefficient increase of 5 and 10% likely represents an increase of equivalent blood volume (total
hemoglobin concentration [HbT]) commonly found in multispectral studies in rat1,2,12,21
or a change decrease of blood
oxygenation level (decreasing oxygen saturation increase µa linearly and inversely). A variation of -5 and -10% of µa was
performed to assess the reflectance variation amplitude for an oxygen saturation increase during a cerebral activation.
Scattering variations represents both variations of scatterrers size and concentration that could happen during activation
Proc. of SPIE Vol. 8427 84271O-9
Downloaded from SPIE Digital Library on 03 Jul 2012 to 129.175.97.14. Terms of Use: http://spiedl.org/terms

(only size for the anisotropy factor), for the following calculations, the Oregon Medical Laser Center Mie scattering
calculator was used. Assuming an average concentration of 0.475 spheres/µm3 for 0.50 µm diameter scaterrers (typically
intracellular mitochondria), an increase of scatterrers volume of 1% increases scattering coefficient of ~4%, it has been
shown that increase of mitochondria diameter may be negative (-5%) or positive (from +1 to +5%)22
, we chose an
average variation of about ±2.5%. A decrease of scattering is noted in several intrinsic signal studies on slices – tissue
devoid of blood – for a synaptic activation23–26
via an increase in transmitted light (then decrease in reflected light)
through the tissue between 6%25
(with a decrease in reflected light of 4%23
) and 7%26
, as reflectance variation for a value
of 10% scattering variation was similar, this value was chosen for our study. With the same hypothesis, we estimate an
anisotropy factor variation of approximately +1% for a scatterrers diameter variation of 2.5%.
4.2.2 Influence of models geometry and effect of optical parameters changes on diffuse reflectance
Multilayer models for SsC and OB – previously discussed in previous work19 – were used to assess the influence of
optical parameters changes on diffuse reflectance value and to explain opposite signs of reflectance time courses for
wavelengths above 600 nm between SsC1,2
and OB27
. For MCS results, relative reflectance variation amplitude
discrepancies are due to differences of « activated » layer thickness between SsC and OB. Indeed, thickness of
« activated » layer for the OB is 100 µm whereas for SsC this layer is considered 2700µm thick in our models leading to
a reduced effect of this layer in the case of OB but a predominant role in the SsC. Moreover, « activated » layer of OB
contributes for approximately 20% to reflectance signal at 630 nm, while « activated » layer of SsC contributes for about
70% at 630 nm (data not shown). Last, « activated » layer in SsC is about 33% more absorbant than in OB. It means that
the SsC « activated » layer increase the effects of optical parameters changes more than OB one do. For intrinsic optical
signal imaging, it appears to be necessary to distinguish the observed variation of light from the real changes in optical
parameters (describes as absorption and scattering). Strictly speaking, an increase (decrease) of absorption coefficients
may be due to an increase (decrease) in blood volume or a decrease (increase) of blood oxygen saturation, and probably
increase (decrease) of other absorbers (or cell organites). Tissues scattering is physically described by anisotropy factor
and scattering coefficient. Studies led on brain slices attempted to determine contribution of cell swelling and other
phenomenon to observed transmitted light variations23,24,26,28
. It appears that cell swelling is not so dominant in
transmittance changes but some that some other events like astrocytic hypertrophy and/or neuronal morphological,
structural modifications25,26
. As described above, reflectance decreases for a synaptic activation. These experiments were
performed in vitro on living tissues. There was no effect of blood on the optical intrinsic signals recorded. Decrease in
reflected light is due to a decrease in reduced scattering coefficient (µs' = (1-g).µs). These observed in vitro changes are
similar in amplitude to those recorded in vivo during an activation which are supposed to originate from hemoglobin
only (blood oxygen level and blood volume). So the inversion of sign in reflectance time courses between SsC and OB
for wavelengths above 600 nm2,6,27
may be due to a possible scattering increase stronger in SsC than in OB or is mainly
due to oxygenation saturation variations discrepancy.
Proc. of SPIE Vol. 8427 84271O-10
Downloaded from SPIE Digital Library on 03 Jul 2012 to 129.175.97.14. Terms of Use: http://spiedl.org/terms

[1] Devor, A. et al. "Coupling of total hemoglobin concentration, oxygenation, and neural activity in rat somatosensory cortex." Neuron 39, 353-359 (2003). [2] Dunn, A. K., Devor, A., Dale, A. M. & Boas, D. A. "Spatial extent of oxygen metabolism and hemodynamic changes during functional activation of the rat somatosensory cortex." Neuroimage 27, 279-290 (2005). [3] Berwick, J. et al. "Neurovascular coupling investigated with two-dimensional optical imaging spectroscopy in rat whisker barrel cortex." Eur. J. Neurosci 22, 1655-1666 (2005). [4] Frostig, R. D., Lieke, E. E., Ts'o, D. Y. & Grinvald, A. "Cortical functional architecture and local coupling between neuronal activity and the microcirculation revealed by in vivo high-resolution optical imaging of intrinsic signals." Proc. Natl. Acad. Sci. U.S.A 87, 6082-6086 (1990). [5] Prakash, N. et al. "Temporal profiles and 2-dimensional oxy-, deoxy-, and total-hemoglobin somatosensory maps in rat versus mouse cortex." Neuroimage 37 Suppl 1, S27-36 (2007). [6] Renaud, R., Martin, C., Gurden, H. & Pain, F. "Multispectral reflectance imaging of brain activation in rodents: methodological study of the differential path length estimations and first in vivo recordings in the rat olfactory bulb." Journal of Biomedical Optics 17, 016012 (2012). [7] Kawaguchi, Okui, N., Sakaguchi, K. & Okada, E. "Theoretical analysis of crosstalk between oxygenated and deoxygenated haemoglobin in focal brain-activation measurements by near-infrared topography." OptoElectronics Review 16, 404-412 (2008). [8] Okui, N. & Okada, E. "Wavelength dependence of crosstalk in dual-wavelength measurement of oxy- and deoxy-hemoglobin." J Biomed Opt 10, 11015 (2005). [9] Strangman, G., Franceschini, M. A. & Boas, D. A. "Factors affecting the accuracy of near-infrared spectroscopy concentration calculations for focal changes in oxygenation parameters." NeuroImage 18, 865-879 (2003). [10] Yamashita, Y., Maki, A. & Koizumi, H. "Wavelength dependence of the precision of noninvasive optical measurement of oxy-, deoxy-, and total-hemoglobin concentration." Medical Physics 28, 1108 (2001). [11] Uludağ, K., Steinbrink, J., Villringer, A. & Obrig, H. "Separability and cross talk: optimizing dual wavelength combinations for near-infrared spectroscopy of the adult head." NeuroImage 22, 583-589 (2004). [12] Hillman, E. M. C. et al. "Depth-resolved optical imaging and microscopy of vascular compartment dynamics during somatosensory stimulation." Neuroimage 35, 89-104 (2007). [13] Wang, L., Jacques, S. L. & Zheng, L. "MCML--Monte Carlo modeling of light transport in multi-layered tissues." Comput Methods Programs Biomed 47, 131-146 (1995). [14] L'Heureux, B., Gurden, H. & Pain, F. "Autofluorescence imaging of NADH and flavoproteins in the rat brain: insights from Monte Carlo simulations." Opt Express 17, 9477-9490 (2009). [15] Yaroslavsky, A. N. et al. "Optical properties of selected native and coagulated human brain tissues in vitro in the visible and near infrared spectral range." Phys Med Biol 47, 2059-2073 (2002). [16] Bolin, F. P., Preuss, L. E., Taylor, R. C. & Ference, R. J. "Refractive index of some mammalian tissues using a fiber optic cladding method." Appl. Opt. 28, 2297-2303 (1989). [17] Nishidate, I., Yoshida, K. & Sato, M. "Changes in optical properties of rat cerebral cortical slices during oxygen glucose deprivation." Appl Opt 49, 6617-6623 (2010). [18] Sato, C., Nemoto, M. & Tamura, M. "Reassessment of activity-related optical signals in somatosensory cortex by an algorithm with wavelength-dependent path length." Jpn. J. Physiol 52, 301-312 (2002). [19] Renaud, R. et al. "Multispectral imaging of the olfactory bulb activation: influence of realistic differential pathlength correction factors on the derivation of oxygenation and total hemoglobin concentration maps." Proc. SPIE 7902, 1-12 (2011). [20] Cuccia, D. J., Bevilacqua, F., Durkin, A. J. & Tromberg, B. J. "Modulated imaging: quantitative analysis and tomography of turbid media in the spatial-frequency domain." Opt. Lett. 30, 1354-1356 (2005). [21] Devor, A. et al. "Coupling of the cortical hemodynamic response to cortical and thalamic neuronal activity." Proc. Natl. Acad. Sci. U.S.A 102, 3822-3827 (2005). [22] Johnson, L. J., Chung, W., Hanley, D. F. & Thakor, N. V. "Optical scatter imaging detects mitochondrial swelling in living tissue slices." Neuroimage 17, 1649-1657 (2002). [23] Aitken, P. G., Fayuk, D., Somjen, G. G. & Turner, D. A. "Use of intrinsic optical signals to monitor physiological changes in brain tissue slices." Methods 18, 91-103 (1999). [24] Andrew, R. D., Jarvis, C. R. & Obeidat, A. S. "Potential sources of intrinsic optical signals imaged in live brain slices." Methods 18, 185-196, 179 (1999). [25] Fayuk, D., Aitken, P. G., Somjen, G. G. & Turner, D. A. "Two different mechanisms underlie reversible, intrinsic optical signals in rat hippocampal slices." J. Neurophysiol 87, 1924-1937 (2002).
Proc. of SPIE Vol. 8427 84271O-11
Downloaded from SPIE Digital Library on 03 Jul 2012 to 129.175.97.14. Terms of Use: http://spiedl.org/terms

[26] Syková, E., Vargová, L., Kubinová, S., Jendelová, P. & Chvátal, A. "The relationship between changes in intrinsic optical signals and cell swelling in rat spinal cord slices." Neuroimage 18, 214-230 (2003). [27] Meister, M. & Bonhoeffer, T. "Tuning and topography in an odor map on the rat olfactory bulb." J. Neurosci 21, 1351-1360 (2001). [28] Jarvis, C. R., Lilge, L., Vipond, G. J. & Andrew, R. D. "Interpretation of intrinsic optical signals and calcein fluorescence during acute excitotoxic insult in the hippocampal slice." Neuroimage 10, 357-372 (1999).
Proc. of SPIE Vol. 8427 84271O-12
Downloaded from SPIE Digital Library on 03 Jul 2012 to 129.175.97.14. Terms of Use: http://spiedl.org/terms
Related Documents