C:\ali\process improvement team\budget\final\aqm budget discussions.doc,12/12/2006 Title V Fee Discussions Background Information Prepared for: Title V Committee Members Prepared by: Delaware Department of Natural Resources and Environmental Control Air Quality Management Section 146 South State Street Dover, DE 19901 715 Grantham Lane New Castle, De 19701 December 2006

Welcome message from author
This document is posted to help you gain knowledge. Please leave a comment to let me know what you think about it! Share it to your friends and learn new things together.
Transcript

C:\ali\process improvement team\budget\final\aqm budget discussions.doc,12/12/2006
Title V Fee Discussions
Background Information
Prepared for: Title V Committee Members
Prepared by: Delaware Department of Natural Resources and
Environmental Control Air Quality Management Section
146 South State Street Dover, DE 19901
715 Grantham Lane
New Castle, De 19701
December 2006

i
STATE OF DELAWARE
DEPARTMENT OF NATURAL RESOURCES & Environmental Control
DIVISION OF AIR & WASTE MANAGMENT 89 Kings Highway Dover, Delaware 19901
November 22, 2006 Dear Title V Fee Team Member: I am writing to invite your participation on a Title V Fee team to review the status of the 2005 Title V fee renewal legislation and the potential need for a revision. We appreciate the previous and continued involvement many of you have had in developing recommendations for the Title V Operating Permit Fee Structure to the Delaware Legislature. As I have already discussed with many of you, we need to revisit the 2005 Title V fee renewal legislation prior to the 2008 expiration date. During the 2005 fee renewal development period, we made an error in presenting the Title V carryover balance. Specifically, in March 2005 the Air Quality Management staff used a snapshot of the existing cash balance partway through the year, instead of analyzing the historic and expected carryover balance using trends for expenses and revenues. Consequently, by overestimating the carryover balance, we underestimated the revenue needed to maintain our programs. Accordingly, we are seeking your renewed support to remedy this resulting revenue shortfall, consistent with the fundamental agreement at the outset of the fee negotiations, that the Title V Fee Team did not intend to cut any aspect of the Title V program. The Team planned for a shortfall of $200,000 per year less than the projected costs of the 2006 Title V program. However, the current projected Title V program deficit is between $400,000 and $500,000 per year, assuming that the current 22% vacancy rate is maintained (not a viable situation) and the annual average values paid in overhead and Office of the Secretary salary support is also maintained. As a result, the cash reserves will be depleted by the end of December 2006. This miscalculation is a result of inaccurately predicting the effects of a reduced vacancy rate and an unplanned increase in base salaries as a result of a statewide increase in selective market salaries for engineers. This increase alone resulted in a $200,000 increase in salary costs. In order to address this budget deficit in the short term, the Division of Air and Waste Management has imposed significant austerity measures on the Air Quality Management Section, including a hiring freeze, eliminating all training and travel not covered by other organizations, and use of other Division resources to cover certain
OFFICE OF THE Director
TELEPHONE: (302) 739-9400 FAX: (302) 739-1894

ii
expenses like building rent. The Clean Air Act specifically states that these expenses should be covered by Title V fees. While these short team measures will delay the impending budget crisis while creating significant hardship on staff, they are not sustainable in the long term. The Department is seeking your input on options to address this situation. We have scheduled a meeting on December 14, 2006 from 10 am to 12 pm at the Lukens Drive office to review our plans. Directions to the Lukens Drive office are enclosed. We apologize for the short notice, but believe that this issue must be dealt with quickly. We look forward to your continued support on this effort. If you have any questions, please contact me directly at (302) 739-9400 or Ali Mirzakhalili at (302) 739-9402. Sincerely, AIR AND WASTE MANAGEMENT DIVISION James D. Werner Director

iii
Invitation Distribution List
Name Affiliation Joseph Booth Legislative Hall
Catherine (Kitty) Bronson Division of Air and Waste Management
Kim Chesser Office of the Secretary Nancy Cook Legislative Hall
Marjorie Crofts Division of Air and Waste Management Joseph DiPinto Legislative Hall
Paul Foster Air Quality Management Steve Freebery SPI Polyols Penny Gentry Air Quality Management Louis Graham Dow Reichhold
Mary Lou Guyer Legislative Hall Lawrence Haas Legislative Hall Rich Heffron Delaware State Chamber of Commerce
Gerald Hocker Legislative Hall
John Hughes Department of Natural Resources and Environmental Control
Paul Jann DuPont Brian Lyncha Cabe Associates June Macartor Delaware Nature Society
Ellen Malenfant Division of Air and Waste Management Amy Mann Air Quality Management
Joseph Martini Air Quality Management David McBride Air Quality Management Ali Mirzakhalili Air Quality Management Gary Patterson Delaware Petroleum Council John Peronti General Motors
Robert Quillen Legislative Hall Brian Quinney SPI Nick Sapone Camdel Metals David Small Office of the Secretary Jan Sunde Accounting Office
Lee Ann Walling Governor's Office Bill Walsh Delaware Nature Society
James Werner Division of Air and Waste Management Stu Widom Conectiv
Bob Wojewodzki Premcor Bill Wood Delaware Chemical Industry Council
Joan Wutka Legislative Hall

iv
Table of Contents
Section
Description
Page No.
1.0 Introduction 1 1.1 AQMS Mission………………………………………. 1 1.2 AQMS Organization…………………………………. 1 1.3 AQMS Staffing……………………………………….. 4 2.0 Evaluation of Current Expenditures 6 3.0 Current Title V Fee Schedule 9 3.1 Review of Current Schedule…………………………... 9 3.2 Summary of Revenues Received……………………… 10 4.0 Salary Expenditures 13 4.1 Summarized by Activity………………………………. 13 4.2 Discussion of Title V Revenue Gap…………………… 13 5.0 General Trends 16 5.1 Revenue Change Over Time…………………………... 16 5.2 Title V Fees per Ton of Emissions……………………. 16 5.3 Average Cost Per Facility……………………………... 16 5.4 Percent of Title V Program Spent on Salary…………... 17 6.0 AQMS Scheduled Activities 19 S.0 Supplemental Information 20

v
List of Tables
Table No.
Title
Page
1.2 AQMS Funding Matrix: Total Positions per Funding
Source August 22, 2006……………………………...... 5
2.1 AQMS FY 2005 Expenditures by Funding Source……. 7 2.2 AQMS FY 2006 Expenditures by Funding Source……. 8 3.1 Title V Fee Schedule Base Fee Categories……………. 9 3.2 Title V Fee Schedule User Fee Categories…………….. 10 3.3 Summary of Impact of Applying Federal Consumer
Price Index.......................................................................
10 3.4 Summary of Title V Fees Collected…………………… 11 4.1 Salary Expenditures by Activity………………………. 14 4.2 Title V Calendar Year Revenue and Expenses………... 15 5.1 Title V Fees per Ton of Emissions…………………….. 16 5.2 Average Title V Fee Per Source……………………….. 17 5.3 Average Title V Fee in 1998 Dollars Per Source……… 17 5.4 Percent of Title V Revenue Spent on Salary and
Vacancy Rates.................................................................
18 S.1 FY2005 Top Ten Activities/Facilities for Hours
Worked.............................................................................
20 S.2 FY2005 Top Ten Facilities Only for Hours Worked…... 20 S.3 FY2005 Top Ten Activities/Facilities for Total Dollars.. 21 S.4 FY2005 Top Ten Facilities for Total Dollars………….. 21 S.5 FY2006 Top Tend Activities/Facilities for Hours
Worked.............................................................................
21 S.6 FY2006 Top Ten Facilities Only for Hours Worked....... 22 S.7 FY2006 Top Ten Activities/Facilities for Total Dollars.. 22 S.8 FY2006 Top Ten Facilities for Total Dollars………….. 22 S.9 FY2005 Hours Coded to Miscellaneous by Activity
Code.................................................................................
23 S.10 FY2006 Hours Coded to Miscellaneous by Activity
Code……….....................................................................
24
vi
List of Figures
Figure No.
Title
Page No.
1.1 Air Quality Management Staffing Organization……..... 2 3.1 Summary of Title V Fees Collected………………….... 12

1
Section 1.0 Introduction
During the 2005 fee renewal development period, the Air Quality Management Section (AQMS) made an error in presenting the Title V carryover balance. Specifically, in March 2005 the Air Quality Management staff used a snapshot of the existing cash balance partway through the year, instead of analyzing the historic and expected carryover balance using trends for expenses and revenues. Consequently, by overestimating the carryover balance, we underestimated the revenue needed to maintain our programs. AQMS is in the process of developing documentation for submittal to the Title V Committee that will define AQMS’ future financial and programmatic needs. We anticipate completion of this work during the First Quarter 2007. The process includes the following activities:
• Evaluation of AQMS expenditures • Development of a Needs Assessment • Identification of Solutions • Development of an implementation strategy.
As the first activity in this process, we have completed a detailed evaluation of the current expenditures within AQMS. The results of this evaluation are presented in Sections 2 through 5 of this report. This evaluation included all AQMS expenditures that occurred during Fiscal Years 2005 (July 1, 2004 through June 30, 2005) and 2006 (July 1, 2005 through June 30, 2006). For specific trends analysis, budget data from Calendar Years 1993 through 2006 were evaluated. For reference purposes, AQMS’ mission and staffing organization are presented in the remaining subsections of this introduction. 1.1 AQMS Mission The mission of the AQMS is to optimize the air resources and management practices within Delaware by working cooperatively with the citizens and businesses in Delaware in order to protect public health, welfare, and the environment. 1.2 AQMS Organization The AQMS is operated through an Air Quality Administrator and is organized by branches (identified in Figure 1.1) that are defined as:
• Engineering and Compliance; • Air Surveillance; and • Planning.

2
Figure 1.1 Air Quality Management Staffing Organization

3
1.2.1 ADMINISTRATOR’S OFFICE
This office oversees day-to-day operations of the AQMS. Staff within this office perform all budgeting, grant, and permit fee functions.
1.2.2 AIR SURVEILLANCE BRANCH This branch consists of an Ambient Air Quality and Source Monitoring Program. The Ambient Air Quality Monitoring Program performs the following activities:
• Measures and reports the ambient (outdoor) concentrations of selected air pollutants along with selected weather parameters.
• Conducts special studies to address citizen concerns, to evaluate the need to relocate or add additional fixed sites, or to measure the impact of a particular air pollution source.
• Routinely monitors selected hazardous air pollutants (air toxics). • Generates a daily pollution standards index (PSI) which is distributed to
the local media. • Publishes the Delaware Annual Air Quality Report.
The Source Monitoring Program performs the following activities:
• Conducts engineering reviews of the plans and methods used for all stack tests (stack tests are periodic air pollution measurements made directly at the source).
• Reviews the plans for the installation and subsequent testing of Continuous Emission Monitoring Systems (CEMS).
• Identifies asbestos and other particles using Polarized Light Microscopy (PLM).
• Conducts laboratory analysis of fuel oil (for sulfur content) used by large commercial combustion sources.
• Conducts biweekly testing of the motor vehicle exhaust emission analyzers used in the motor vehicle inspection lanes.
1.2.3 ENGINEERING & COMPLIANCE BRANCH The Engineering and Compliance Branch performs the following activities:
• Evaluates, prepares, and issues Air Pollution Control permits via State and Federal requirements, to include Title V Operating Permits. Permits to construct and operate are issued to both minor and major stationary sources of air contaminants.
• Implements a stationary source inspection program to ensure compliance with applicable air pollution control regulations.

4
• Prepares Secretary’s Orders pertaining to statutory and regulatory matters.
• Initiates appropriate enforcement actions via the Division’s Enforcement Panel procedures.
1.2.4 PLANNING BRANCH The Planning Branch performs the following functions:
• Prepares State Implementation Plan (SIP) revisions, including the many extensive ozone SIP revisions and the future fine particulate matter SIPs, in order to assure progress in attaining and maintaining ambient air quality standards.
• Prepares all necessary inventories of emissions from all sources of air pollution in the state, including stationary, area and mobile sources.
• Direct planning, reporting, and repair technician certification portions of the motor vehicle emission testing program and assure compliance with State and federal standards.
• Evaluates, prepares, and issues Air Pollution Control permits for area sources.
• Implements an area source inspection program to ensure compliance with applicable air pollution control regulations.
• Implements an Asbestos Abatement Renovation/Demolition Program to assure safe removal and disposal of Asbestos-Containing Materials.
• Participates with the Engineering and Compliance Branch in the development and tracking of an air toxics emission inventory.
• Maintain computerized databases for all types of air emissions statewide, and tracking of facility information including permit applications, and permit issuances.
• Develops new air pollution control regulations in accordance with State and Federal requirements.
1.3 AQMS Staffing The funding to support the 75 positions identified in Figure 1.1 is appropriated through use of the following funding sources:
• General Funds; • Appropriated Special Funds (Reg II and Title V Fees); and • Non-Appropriated Special Funds (Federal 103 and 105 Grants).
AQMS uses a combination of these funding sources to support each position in the section. This funding matrix, identified by position number is detailed in Appendix A, and summarized in Table 1.2.

5
Table 1.2 AQMS Funding Matrix: Total Positions per Funding Source August 22, 2006
FUNDING SOURCE
Office/Branch
General Funds
Title V
Reg. II
105 Grant
103 Grant
Total
Administrator
1.10
2.0
-
2.90
-
6.0
E&C*
4.9
23.40
0.8
3.90
-
33.0
Air Surveillance
3.7
5.20
0.8
3.8
1.5
15.0
Planning
3.10
9.90
2.90
5.10
-
21.0
Total
12.8
40.5
4.5
15.7
1.5
75.0
* Engineering and Compliance Note: This funding matrix represents position summaries as of August 22, 2006. The data summarized represents the 75 total positions allocated to the Section. Refer to Appendix A for a detailed funding matrix identified by position number. Currently, 15 of these 75 positions are vacant.
6
Section 2 Evaluation of Current Expenditures
The evaluation of AQMS expenditures was based upon expenditures that occurred during Fiscal Years 2005 and 2006. In performing this evaluation, expenditures were organized by Office / Branch. Additionally, expenditures were summed to produce a total expenditure summary for Air Quality Management. Expenditures were tracked by the appropriated funding source and by item code. The detailed reports of this evaluation are presented in Appendix B. Office/Branch expenditure summaries are presented in Tables 2.1 and 2.2 for Fiscal Years 2005 and 2006, respectively. The 105 Grant expenditures presented in these summaries were tracked for all of AQMS through the Administrator’s Office, and therefore are presented only in the Administrator’s Office as line item expenditures. They are reflective of expenditures for AQMS. Although AQMS has taken progressive measures to limit cost growth, the total operating expenses from Fiscal Year 2005 through Fiscal Year 2006 rose by approximately $600,000. The increase, largely reflective of increased salary and fringe costs, would have been sizably larger if AQMS had not performed the following austerity measures:
• Froze vacant positions. Currently, 15 of the 75 positions in AQMS remain vacant.
• Transferred portions of specific line items, i.e., building rent, indirect costs, to other sections within the Department.
Additionally, AQMS has:
• Limited staff’s approval to travel to meetings, trainings, and professional conferences.
• Restricted payment approval for staff enrollment in professional organizations, i.e., Air and Waste Management Association.
• Required AQMS to hold internal and external meetings at locations that do not charge facility rental fees.
• Suspended infrastructure upgrades (i.e., telephone system replacement to the AQMS satellite office).
• Disinvested in equipment that is dated and costly to maintain.

7
Table 2.1 AQMS FY 2005 Expenditures by Funding Source Funding Source
Branch General Fund 105 Grant 2875 Grant 8175 2905 Grant Title V Fees Other Fees Total
Administrator Salary+Fringe $ 133,677.74 $564,523.45 $ - $ 167,537.45 $ - $ 865,738.64 Operating Costs $ 31,773.99 $ 77,953.44 $ 66,173.00 $ 214,291.66 $ - $ 390,192.09 E&C1
Salary+Fringe $ 378,000.71 $ - $ - $ 1,532,140.04 $ 37,101.04 $1,947,241.79 Operating Costs $ 21,982.01 $ - $ - $ 262,738.36 $ 51,817.93 $ 336,538.30 Air Surveillance Salary+Fringe $ 261,917.30 $ - $ 55,000.49 $ 332,260.48 $ 25,000.85 $ 674,179.12 Operating Costs $ 91,637.98 $ - $ 44,373.81 $ 46,191.27 $ 1,300.62 $ 183,503.68 Planning Salary+Fringe $ 180,982.15 $ - $ - $ 492,083.09 $ 28,530.50 $ 701,595.74 Operating Costs $ 29,120.83 $ - $ - $ 295,401.02 $ 199.30 $ 324,721.15 Total $ 1,129,092.71 $642,476.89 $ 66,173.00 $ - $ 99,374.30 $ 3,342,643.37 $ 143,950.24 $5,423,710.51
1 Engineering and Compliance

8
Table 2.2 AQMS FY2006 Expenditures by Funding Source
Funding Source
Branch General Fund 105 Grant 2875 Grant 8175 2905 Grant Title V Fees Other Fees Total
Administrator Salary+Fringe $ 148,226.72 $ 784,604.51 $ - $ 216,459.95 $ 773.30 $ 1,150,064.48 Operating Costs $ 30,449.89 $ 324,504.10 $168,429.27 $ 157,451.68 $ 24,190.30 $ 705,025.24 E&C 1
Salary+Fringe $ 448,487.02 $ - $ - $1,286,957.16 $ 59,434.63 $ 1,794,878.81 Operating Costs $ 19,848.32 $ - $ 3,547.38 $ 201,450.26 $ 57,498.18 $ 282,344.14 Air Surveillance Salary+Fringe $ 380,666.79 $ - $ 99,616.83 $ 235,462.02 $ 35,341.32 $ 751,086.96 Operating Costs $ 92,099.99 $ - $ 69,055.40 $ 48,428.99 $ 35,668.25 $ 245,252.63 Planning Salary+Fringe $ 394,416.77 $ - $ - $ 406,198.76 $ 35,196.10 $ 835,811.63 Operating Costs $ 29,736.27 $ - $ - $ 230,768.72 $ 12,086.48 $ 272,591.47 Tota Costs $1,543,931.77 $1,109,108.61 $168,429.27 $ 3,547.38 $168,672.23 $2,783,177.54 $ 260,188.56 $ 6,037,055.36
1 Engineering and Compliance

9
Section 3.0 Current Title V Fee Scheduled
3.1 Review of Current Schedule The current Title V Fee Schedule was introduced to the Delaware Legislature in 2005 through Senate Bill 113. It was passed by the Senate on May 12, 2005, was passed by the House on June 28, 2005, and was signed by the Governor on July 12, 2005. The Title V Fee Schedule is outlined in 7 Delaware Code Chapter 60 Section 6097. Each facility subject to the Title V Program is billed on an annual basis. The fee billed to each facility is based upon two component fees, a base fee and a user fee. The base fee component relates to services that are common to all sources subject to the Title V program. The base fee is intended to cover services such as permit issuance and renewals, stationary source regulation development, ambient monitoring, emission inventory, control strategy development and the development, administration, and implementation of the Small Business Stationary Source Technical Program and the Environmental Compliance Program. The base fee is also intended to cover a portion of the Accidental Release Prevention Program. The Department calculates each facility’s base fee based upon the most recent 5 years of data for the engineering, compliance, and enforcement hours spent on the facility. See Table 3.1 for the six base fee categories.
Table 3.1 Title V Fee Schedule Base Fee Categories Category Hours Spent Fee Assessed
Category A Greater than 5,000 Hours $200,000 Category B From 2,500 to 5,000 Hours $60,000 Category C From 12,000 to 2,499 Hours $30,000 Category D From 750 to 1,199 Hours $15,000 Category E From 300 to 749 Hours $6,000 Category F From 0 to 299 Hours $3,000
The user fee component relates to activities that are not covered by the base fee including: development, administration, and implementation of a compliance and enforcement program; implementation and enforcement of the terms of any Title V operating permit or synthetic minor permit; permit revisions or amendments, including the development of an applicable requirement as part of the processing of the permit issuance, revision, or amendment; the supporting and tracking of data; modeling; and adequate resources to determine which sources are subject to the Title V program. The Department bases each facility’s user fee upon the emissions of each air contaminant, in whole tons and in the aggregate, excluding carbon monoxide, as listed in the 2002 Delaware Point Source Emission Inventory of Estimated Actual Air Contaminants. See Table 3.2 for the seven user fee categories.

10
Table 3.2 Title V Fee Schedule User Fee Categories Category Total Tons of Emissions Fee Assessed
Emission Ban G From 0 to 75 Tons $2,000 Emission Ban H From 76 to 200 Tons $5,000 Emission Ban I From 201 to 500 Tons $12,000 Emission Ban J From 501 to 1,000 Tons $25,000 Emission Ban K From 1,001 to 2,500 Tons $50,000 Emission Ban L From 2,501 to 6,000 Tons $75,000 Emission Ban M Greater Than 6,000 Tons $125,000
Note that Section 6097(b) specifically requires that the Title V fees collected must result in revenues sufficient to cover the Title V Program costs. In addition, Section 6097(g) allows the Department to increase the fees collected each year by the Federal Consumer Price Index for the previous calendar year. A fee increase pursuant to this subsection has not been pursued throughout the life of the Title V program. If the 2006 Federal Consumer Price Index is applied to the Title V Fee Schedule, which was created in 2005, the fees assessed for 2006 would increase from $2,956,000 to $3,064,976.96. This would also result in an increase in the 2006 Title V fees collected to date from $2,845,441.00 to $2,950,342.05. See Table 3.3 for a summary of this information. See Appendix C for the impact of applying the Federal Consumer Price Index to the Title V Fee Schedule on each facility.
Table 3.3 Summary of Impact of Applying Federal Consumer Price Index Current Fee
Schedule
Fee Scheduled with Federal Consumer Price Index
Applied
Resulting Increase
2006 Fees Assessed $2,956,000.00 $3,064,976.96 $108,976.962006 Fees Collected to Date $2,845,441.00 $2,950,342.05 $104,901.05
With the current Title V fee revenue gap approaching $500,000 per year, applying the Federal Consumer Price Index to the fees assessed would not breach the gap. However, it could be used as part of a larger strategy to address this problem. 3.2 Summary of Revenues Received The Department began collected Title V Fees in 1993. See Table 3.4 and Figure 3.1 for a summary of the Title V fees that have been collected each calendar year. As Figure 3.1 indicates, the last three calendar years have seen a rise in Title V Fee revenue. However, when the revenue is adjusted to 1998 dollars, a marked decline since 2000 in Title V fee revenue is noted. This marked decline in fee revenue coincides with increasing expenses resulting from increasing employee costs.

11
Table 3.4 Summary of Title V Fees Collected
Calendar Year
Title V Fees Collected
Title V Fees Collected Adjusted to 1998 Dollars (Based Upon Federal Consumer
Price Index) 1998 $2,433,766.93 $2,433,766.93 1999 $2,375,720.17 $2,324,384.08 2000 $2,965,995.68 $2,807,533.66 2001 $2,949,689.00 $2,716,380.27 2002 $2,832,755.00 $2,566,642.94 2003 $2,718,382.58 $2,408,132.39 2004 $2,517,320.62 $2,172,171.84 2005 $2,587,264.58 $2,159,365.73 2006 $2,845,441.00 $2,290,404.36

12
Figure 3.1 Summary of Title V Fees Collected
Summary of Title V Fees Collected
$0$250,000$500,000$750,000
$1,000,000$1,250,000$1,500,000$1,750,000$2,000,000$2,250,000$2,500,000$2,750,000$3,000,000
1993
1994
1995
1996
1997
1998
1999
2000
2001
2002
2003
2004
2005
2006
Calendar Year
Dol
lars
Calendar YearRevenue
Calendar YearRevenueAdjusted to 1998Dollars

13
Section 4.0 Salary Expenditures
4.1 Summarized by Activity Timesheet data for state fiscal years 2005 and 2006 was evaluated to determine the amount of time spent and the cost of Air Quality Management Section activities. See Table 4.1 for 2005 and 2006 Fiscal Year Expenditures by Air Quality Management activity. As Table 4.1 indicates, the Air Quality Management Section spends the majority of its time on Air Pollution Control and Title V Permitting activities. Air Pollution Control activities include writing permits, conducting inspections, and pursuing enforcement actions for non-Title V facilities, ambient monitoring, and source test observations. Title V Permitting activities include developing Title V permits and modifications including conducting regulatory research, evaluating engineering design, and drafting permit language. Please note that the expenditures summarized in Table 4.1 reflect initial staff time coding. These expenditure summaries do not consider:
1. Quarterly timesheet reconciling processes, i.e., “recoding”; or 2. Compensation of overtime for AQM staff that is provided as compensatory time, not
as actual overtime dollars. The summaries provided in Tables 2.1 and 2.2 are reflective of these considerations, and therefore provide a more accurate summary of salary expenditures. 4.2 Discussion of Title V Revenue Gap Title V calendar year revenue was compared to Title V calendar year expenses. See Table 4.2 for a history of Title V calendar year revenue versus calendar year expenses. As Table 4.2 indicates, Title V calendar year expenses have exceeded calendar year revenues since 2003. This was not an immediate concern as a large carryover balance had been generated from 1993 through 2002. This carryover balance was the result of consistency high vacancy rates in Title V funded positions. When the 2006 through 2008 Title V Fee Schedule was developed it was intended that Title V fee expenditures would exceed revenue by $200,000 per year in order to draw down the carryover balance, resulting in no carryover at the end of calendar year 2008. At that point a new fee schedule would be developed to fully support annual Title V expenditures. Unfortunately, in March 2005 when the Title V Fee Schedule was being developed, Air Quality Management overestimated the carryover balance. In addition, unpredicted increases in salary resulting from an increase in statewide selective market base salaries for engineers and an increase in overall salaries required by the legislature has resulted in an annual deficit of between $400,000 to $500,000 dollars per year. The selective market base salary increase

14
alone resulted in an expenditure increase of $200,000 per year. The Department predicts that the carryover balance will be depleted by the end of calendar year 2006.
Table 4.1 Salary Expenditures by Activity
Activity Hours SpentFY2005
Salary Dollars FY2005
Hours Spent FY2006
Salary Dollars FY2006
General Funds 10,444.22 $377,721.29 17,059.00 $683,776.80 Fee Funded Activities 3,499.89 $106,324.19 3,941.76 $138,681.92 Air Pollution Control 42,287.18 $1,404,846.10 38,867.94 $1,432,245.47
Asbestos Management 867.94 $20,971.99 849.24 $30,138.03 AQM Special Projects
(Non-Title V) 1,402.53 $38,307.12 697.76 $19,344.23
Supplemental ERB Admin – Training &
Meetings 169.09 $5,227.59 60.71 $2,425.95
Supplemental ERB Response 13.61 $429.04 1.54 $61.46
Title V Permitting 25,656.69 $805,894.05 23,936.87 $799,154.85 Title V Compliance 13,180.45 $463,314.28 11,385.72 $426,985.58 Title V Enforcement 2,985.72 $100,648.95 2,542.46 $82,599.91
Title V Administration 9,304.41 $300,199.07 5,613.26 $210,524.00 Title V Monitoring 4,305.06 $137,191.20 2,998.76 $101,824.35 Title V Planning 15,187.96 $588,133.60 11,868.07 $469,799.12
AQM-I&M 3,761.66 $87,025.27 3,866.81 $98,102.59 Ambient Air
Monitoring (PM2.5) 2,316.88 $61,966.30 3,393.59 $104,492.19
Title V Education/Outreach 1,546.99 $52,110.56 1,117.40 $40,646.16
Title V Compliance - Accidental Release
Prevention 9.53 $393.62 0.31 $13.72
Title V Supported Activities 3,055.63 $96,536.27 2,750.42 $100,547.34
Freedom of Information Act 10.46 385.93 - -
Title V – Small Business Assistance1 5.65 186.26 - -
Total 140,011.54 $4,647,812.68 130951.61 $4,741,363.68 Title V Total 75,238.08 $2,544,607.85 62213.27 $2,232,095.03
1Please note that the Title V Small Business Assistance Salary Information does not include the salary for the Small Business Ombudsman and other Small Business Program support staff. Timesheet Data was not available for non Air Quality Management Staff.

15
Table 4.2 Title V Calendar Year Revenue and Expenses Calendar Year Calendar Year Revenue Calendar Year Expenses
1993 $432,813.75 $432,000.00 1994 $1,039,087.85 $1,036,000.00 1995 $2,266,415.10 $1,359,000.00 1996 $2,391,842.35 $1,684,000.00 1997 $2,484,862.50 $2,071,061.98 1998 $2,433,766.93 $2,147,830.06 1999 $2,375,720.17 $2,243,849.79 2000 $2,965,995.68 $2,117,866.06 2001 $2,949,689.00 $2,574,684.09 2002 $2,832,755.00 $2,664,779.75 2003 $2,718,382.58 $2,917,461.40 2004 $2,517,320.62 $3,184,934.67 2005 $2,587,264.58 $2,900,004.80 2006 $2,845,441.00

16
Section 5.0
General Trends
5.1 Revenue Change Over Time As Table 4.9 and Figure 3.1 indicate, Title V revenue has increased since 2004. However, calendar year 2006 revenue is still $120,554.68 below calendar year 2000 funding. In addition, after adjusting revenue to 1998 dollars, calendar year 2006 revenue is $517,129.30 below calendar year 2000 funding. 5.2 Title V Fees per Ton of Emissions Annual Title V revenue was compared with the Periodic Ozone State Implementation Plan Emission Inventory for volatile organic compounds (VOCs), nitrogen oxides (NOX), and carbon monoxide (CO). Please note that the emission inventory data for 1999 and 2002 has not been published and is still undergoing review. The 2002 data is subject to change. See Table 5.1 for a comparison of Title V Fees per ton of emissions over time.
Table 5.1 Title V Fees per Ton of Emissions
Calendar Year
Calendar Year
Revenue
Calendar Year Total
Tons of Emissions
Calendar Year
Stationary Source Tons of Emissions
Fees Per Total Ton of
Emissions
Fees Per Stationary Source Ton of Emissions
1993 $432,813.75 166,388 114,046 $2.60 $3.80 1996 $2,391,842.35 281,727 74,731 $8.49 $32.01 1999 $2,375,720.17 119,345 67,584 $19.91 $35.15 2002 $2,832,755.00 368,043 52,222 $7.70 $54.24
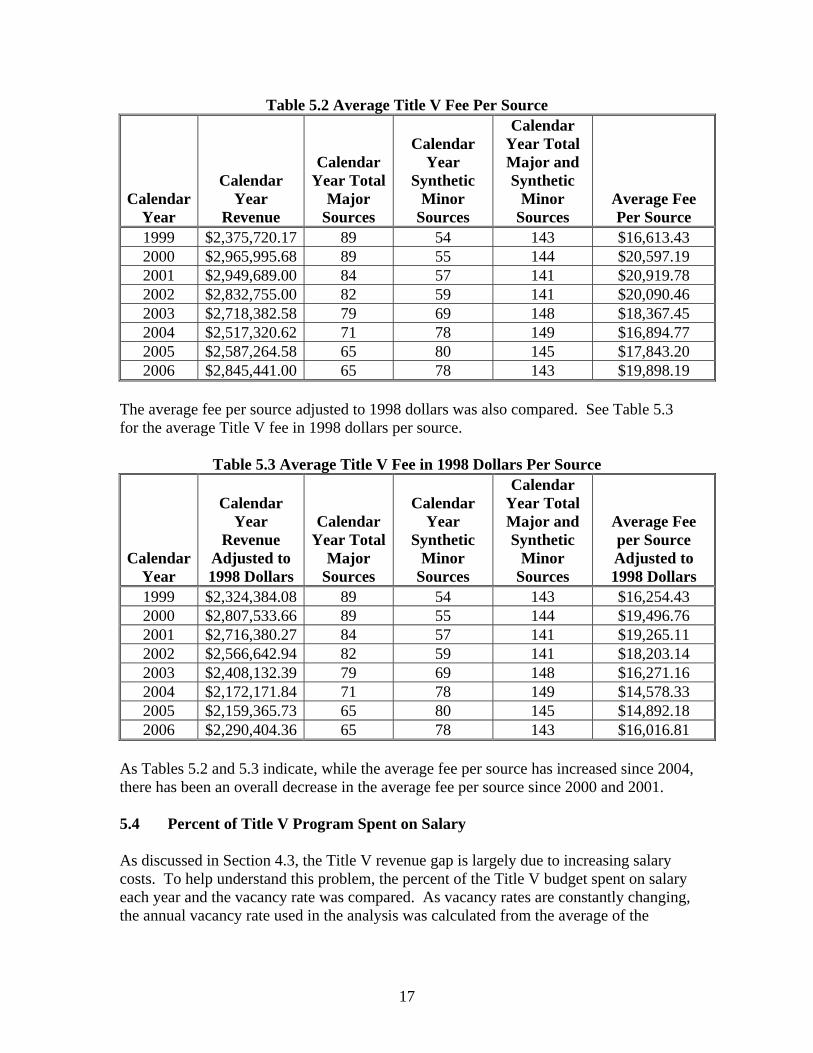
As Table 5.1 indicates, a marked increase in overall emissions in 2002 resulted in a decrease in Title V fees per ton of emissions. This marked increase in emissions resulted from an increase in emissions from mobile sources. However, when the cost per ton of emissions is compared to emissions from stationary sources only, Title V fees have increased per ton. 5.3 Average Cost Per Facility Annual Title V Fee revenue was also compared to the number of facilities subject to the Title V program each year. The number of facilities for each calendar year was obtained from the Semi-Annual Title V Operating Permit Program Status Reports issued on April 15 and October 15 of each year. The October 15 reports covering the period from January to June of each year were used. See Table 5.2 for the average fee per source each year.
17
Table 5.2 Average Title V Fee Per Source
Calendar Year
Calendar Year
Revenue
Calendar Year Total
Major Sources
Calendar Year
Synthetic Minor
Sources
Calendar Year Total Major and Synthetic
Minor Sources
Average Fee Per Source
1999 $2,375,720.17 89 54 143 $16,613.43 2000 $2,965,995.68 89 55 144 $20,597.19 2001 $2,949,689.00 84 57 141 $20,919.78 2002 $2,832,755.00 82 59 141 $20,090.46 2003 $2,718,382.58 79 69 148 $18,367.45 2004 $2,517,320.62 71 78 149 $16,894.77 2005 $2,587,264.58 65 80 145 $17,843.20 2006 $2,845,441.00 65 78 143 $19,898.19
The average fee per source adjusted to 1998 dollars was also compared. See Table 5.3 for the average Title V fee in 1998 dollars per source.
Table 5.3 Average Title V Fee in 1998 Dollars Per Source
Calendar Year
Calendar Year
Revenue Adjusted to 1998 Dollars
Calendar Year Total
Major Sources
Calendar Year
Synthetic Minor
Sources
Calendar Year Total Major and Synthetic
Minor Sources
Average Fee per Source Adjusted to 1998 Dollars
1999 $2,324,384.08 89 54 143 $16,254.43 2000 $2,807,533.66 89 55 144 $19,496.76 2001 $2,716,380.27 84 57 141 $19,265.11 2002 $2,566,642.94 82 59 141 $18,203.14 2003 $2,408,132.39 79 69 148 $16,271.16 2004 $2,172,171.84 71 78 149 $14,578.33 2005 $2,159,365.73 65 80 145 $14,892.18 2006 $2,290,404.36 65 78 143 $16,016.81
As Tables 5.2 and 5.3 indicate, while the average fee per source has increased since 2004, there has been an overall decrease in the average fee per source since 2000 and 2001. 5.4 Percent of Title V Program Spent on Salary As discussed in Section 4.3, the Title V revenue gap is largely due to increasing salary costs. To help understand this problem, the percent of the Title V budget spent on salary each year and the vacancy rate was compared. As vacancy rates are constantly changing, the annual vacancy rate used in the analysis was calculated from the average of the

18
vacancy rates in the two Semi-Annual Title V Operating Permit Program Status Reports published each year. See Table 5.4 for this analysis.
Table 5.4 Percent of Title V Revenue Spent on Salary and Vacancy Rates
Calendar Year
Calendar Year
Revenue
Calendar Year
Expenses
Calendar Year
Employee Expenses
Employee Expenses Percent of
Total Expenses
Calendar Year
Vacancy Rate
1997 $2,484,862.50 $2,071,061.98 $1,589,101.61 76.73% 1998 $2,433,766.93 $2,147,830.06 $1,585,198.41 73.80% 1999 $2,375,720.17 $2,243,849.79 $1,772,556.63 79.00% 15.22% 2000 $2,965,995.68 $2,117,866.06 $1,538,782.23 72.66% 17.39% 2001 $2,949,689.00 $2,574,684.09 $1,995,420.74 77.50% 17.39% 2002 $2,832,755.00 $2,664,779.75 $2,092,430.88 78.52% 19.56% 2003 $2,718,382.58 $2,917,461.40 $2,274,073.23 77.95% 19.56% 2004 $2,517,320.62 $3,184,934.67 $2,277,799.97 71.52% 8.70% 2005 $2,587,264.58 $2,900,004.80 $2,318,198.40 79.94% 15.22%
As Table 5.4 indicates, although the vacancy rate increased significantly from 2004 to 2005, employee expenses also increased significantly. As discussed in Section 4.3, this increase is the result of unpredicted increases in salary resulting from an increase in statewide selective market base salaries for engineers and an increase in overall salaries required by the legislature. In addition, health care costs have also increased significantly in the past few years, contributing to the rising employee costs.

19
Section 6
AQMS Scheduled Activities
AQMS has the following activities planned to address the budget shortfall within the section:
• Schedule stake-holder meetings to present progress and seek input. • Continue the evaluation and implementation of cost-cutting strategies
within the section. • Develop and document future section programmatic and funding
requirements. We anticipate that this process will be completed by First Quarter 2007. A report will detail the conclusions and recommendations of this activity.
• Work collectively with department officials in seeking solutions to the shortfall.

20
Supplemental Information Hours Spent and Salary Expenditures by Activity and Facility
S.1 Summarized by Facility The hours spent on each facility and salary expenditures for each facility were analyzed using FY2005 and FY2005 timesheet data. See Tables S.1 through S.8 for a summary of this information for the top ten activities and facilities. See Appendix D for salary expenditures by Title V facility and hours spent on each Title V facility.
Table S.1 FY2005 Top Ten Activities/Facilities for Hours Worked
Company/Activity Name Hours Worked % of Total Hours Spent
Miscellaneous 85,398.19 60.99% Premcor 8,512.11 6.08%
2002 Periodic Emission Inventory 3,170.94 2.26% 2003 Periodic Emission Inventory 1,769.73 1.26%
Delaware Solid Waste Authority - Cherry Island 1,469.46 1.05% Ciba Specialty Chemicals Corp. 1,464.86 1.05%
2005 Periodic Emission Inventory 1,380.67 0.99% 2004 Periodic Emission Inventory 1,373.64 0.98%
DuPont Edge Moor 983.44 0.70% DuPont Experimental Station 948.27 0.68%
Total 140,011.54 100.00%
Table S.2 FY2005 Top Ten Facilities Only for Hours Worked
Company/Activity Name Hours Worked % of Total Hours Spent
Premcor 8,512.11 6.08% Delaware Solid Waste Authority - Cherry Island 1,469.46 1.05%
Ciba Specialty Chemicals Corp 1,464.86 1.05% DuPont Edge Moor 983.44 0.70%
DuPont Experimental Station 948.27 0.68% Magellan Midstream Partners 839.64 0.60%
Conectiv - Hay Road 767.19 0.55% Printpak, Inc. 720.38 0.51%
Invista 702.74 0.50% Delaware Solid Waste Authority - Southern 609.81 0.44%
Total 140,011.54 100.00%

21
Table S.3 FY2005 Top Ten Activities/Facilities for Total Dollars
Company/Activity Name Total Dollars % of Total Dollars
Miscellaneous $2,840,501.24 61.11% Premcor $337,360.80 7.26%
2002 Periodic Emission Inventory $98,110.86 2.11% 2003 Periodic Emission Inventory $55,299.72 1.19%
Delaware Solid Waste Authority - Cherry Island $52,046.51 1.12% 2005 Periodic Emission Inventory $45,565.05 0.98% 2004 Periodic Emission Inventory $44,295.82 0.95% Ciba Specialty Chemicals Corp. $40,548.10 0.87%
DuPont Edge Moor $33,053.82 0.71% DuPont Experimental Station $31,564.27 0.68%
Total $4,647,812.68 100.00%
Table S.4 FY2005 Top Ten Facilities for Total Dollars
Company/Activity Name Total Dollars % of Total Dollars
Premcor $337,360.80 7.26% Delaware Solid Waste Authority - Cherry Island $52,046.51 1.12%
Ciba Specialty Chemicals Corp. $40,548.10 0.87% DuPont Edge Moor $33,053.82 0.71%
DuPont Experimental Station $31,564.27 0.68% Conectiv - Hay Road $26,429.32 0.57%
Invista $23,292.25 0.50% Magellan Midstream Partners $22,805.51 0.49%
NVF Company - Yorklyn $22,153.34 0.48% Conectiv - Edge Moor $21,616.81 0.47%
Total $4,647,812.68 100.00%
Table S.5 FY2006 Top Ten Activities/Facilities for Hours Worked
Company/Activity Name Hours Worked % of Total Hours Spent
Miscellaneous 80,030.23 61.11% Premcor 6,782.42 5.18%
2005 Periodic Emission Inventory 4,989.42 3.81% Delaware Solid Waste Authority - Cherry Island 1,405.09 1.07%
2002 Periodic Emission Inventory 1,285.76 0.98% Sunoco, Inc. 1,127.84 0.86%
Conectiv - Hay Road 909.82 0.69% Citisteel, USA 881.74 0.67%

22
Value Stream Mapping 881.35 0.67% Delmarva Power Indian River 849.96 0.65%
Total 130,952.64 100.00%
Table S.6 FY2006 Top Ten Facilities Only for Hours Worked
Company/Activity Name Hours Worked % of Total Hours Spent
Premcor 6,782.42 5.18% Delaware Solid Waste Authority - Cherry Island 1,405.09 1.07%
Sunoco, Inc. 1,127.84 0.86% Conectiv - Hay Road 909.82 0.69%
Citisteel, USA 881.74 0.67% Delmarva Power Indian River 849.96 0.65%
DuPont - Edge Moor 737.35 0.56% Delaware Solid Waste Authority - Central 709.41 0.54%
MacDermid Imaging Technology, Inc. 661.7 0.51% Delaware Solid Waste Authority - Southern 656.2 0.50%
Total 130,952.64 100.00%
Table S.7 FY2006 Top Ten Activities/Facilities for Total Dollars
Company/Activity Name Total Dollars % of Total Dollars
Miscellaneous $2,861,431.69 60.35% Premcor $303,585.56 6.40%
2005 Periodic Emission Inventory $180,537.03 3.81% Delaware Solid Waste Authority - Cherry Island $52,742.29 1.11%
Sunoco, Inc. $45,373.64 0.96% 2002 Periodic Emission Inventory $44,078.52 0.93%
Citisteel USA $34,194.12 0.72% Value Stream Mapping $33,505.27 0.71% Conectiv - Hay Road $31,780.19 0.67%
Delmarva Power Indian River $30,377.56 0.64% Total $4,741,400.96 100.00%
Table S.8 FY2006 Top Ten Facilities for Total Dollars
Company/Activity Name Total Dollars % of Total Dollars
Premcor $303,585.56 6.40% Delaware Solid Waste Authority - Cherry Island $52,742.29 1.11%
Sunoco, Inc. $45,373.64 0.96% Citisteel USA $34,194.12 0.72%
Conectiv - Hay Road $31,780.19 0.67% Delmarva Power Indian River $30,377.56 0.64%

23
DuPont - Edge Moor $26,852.27 0.57% Delaware Solid Waste Authority - Central $24,548.19 0.52%
Conectiv - Edge Moor $23,283.99 0.49% Delaware Solid Waste Authority - Southern $22,070.15 0.47%
Total $4,741,400.96 100.00% As Tables S.1 through S.8 indicate, AQMS consistently focuses the most time and money on Premcor and the Cherry Island Landfill. It should be noted that in FY2006, the Value Stream Mapping initiative made the top ten list for both time spent and total salary expenditures. This indicates that while Value Stream Mapping is reducing permitting time and inefficiencies, a significant amount of time has been spent to make the initiative successful. Since time coded to the “Miscellaneous” site code was the largest percentage of time for AQM, an in depth analysis of how this time was spent was conducted for FY2005 and FY2006. All time coded to the “Miscellaneous” site code was broken down by activity code. See Tables S.9 and S.10 for this information.
Table S.9 FY2005 Hours Coded to Miscellaneous by Activity Code Activity Code Activity Description Hours Worked
% Hours Worked
OD Other Duties (See Below for Details) 23,864.69 27.95% AP Admin Planning/Coordinating 12,950.08 15.16% AC Admin Clerical 10,667.97 12.49% R Regs Development 5,215.15 6.11% IC Inspection Compliance 4,254.82 4.98% AD Admin Document Review 3,865.27 4.53% T Training 3,435.30 4.02% PR Personnel Promotion (CL) 3,064.99 3.59% PL Planning 2,669.88 3.13% 0 2,045.50 2.40% AE Admin Info and Education 1,941.14 2.27% M Staff Meetings 1,842.42 2.16% IF Inspection Field Oversight 1,715.33 2.01% AW Admin Word Processing/Data Input 1,383.86 1.62% F Freedom of Information 1,012.88 1.19% D Data Management 925.54 1.08% G Hearing/Meetings 884.98 1.04% AR Admin Record/Timesheets 738.29 0.86% IN Inspection New Installations 441.72 0.52% ER Enforcement Review 360.77 0.42% PH Personnel Hiring 287.06 0.34% OR Outreach - Regulated Community 258.51 0.30% AB Admin Bud/Fin Mgt/Procur 221 0.26% LR Legal Contract Review 186.9 0.22% ET Prepare Technical Paper 135.91 0.16% CA Comp-Time Accrued 130.73 0.15%

24
Activity Code Activity Description Hours Worked
% Hours Worked
RR Regulation Development Review 116.98 0.14% LG Legal AG Contact 103.98 0.12% LA Legal Appeals 93.17 0.11% EH Open Burning Helpline 92.42 0.11% PE Personnel EPPA 69.71 0.08% IT IT Technical 54.02 0.06% AG Admin Grant Management 48.24 0.06% PC Personnel Classification 44.22 0.05% N Environmental Response 42.65 0.05% ED Data Collection 41.75 0.05% II Incident Investigation 39.72 0.05% LC Legal Cons Order/Admin Order 32.82 0.04% EE Estimating Emissions 30.69 0.04% EP Inventory Planning 25.71 0.03% AA Admin Accounting 14.46 0.02% IM Inspection Multi-Media 13.58 0.02% PP Personnel Promotion (CL) 12.03 0.01% IR Inspection Removals/Abandon 8.27 0.01% IS Inspection Oversight (Permit) 5.89 0.01% CR Community Right-To-Know 5.75 0.01% EA Quality Assurance 1.22 0.00% LN Legal Negotiations 0.23 0.00% Grand Total Grand Total 85,398.19 100.00%
Table S.10 FY2006 Hours Coded to Miscellaneous by Activity Code
Activity Code Activity Hours Worked
% Hours Worked
OD Other Duties (See Below for Details) 22303.98 27.87% AP Admin Planning/Coordinating 10367.17 12.95% AC Admin Clerical 7948.81 9.93% R Regs Development 6717.65 8.39% AD Admin Document Review 4009.15 5.01% PL Planning 3880.74 4.85% PR Permit Review 3641.45 4.55% IC Inspection Compliance 2881.21 3.60% T Training 2338.19 2.92% D Data Management 2267.79 2.83% M Staff Meetings 1996.47 2.49% AE Admin Info and Education 1916.41 2.39% IF Inspection Field Oversight 1860.43 2.32% AB Admin Bud/Fin Mgmt/Procur 1726.36 2.16% 0 1533.08 1.92% G Hearing/Meetings 822.85 1.03% F Freedom of Information 781.78 0.98% OR Outreach - Regulated Community 615.55 0.77% ED Data Collection 418.74 0.52%

25
Activity Code Activity Hours Worked
% Hours Worked
EH Open Burning Helpline 372.02 0.46% AR Admin Record/Timesheets 321.09 0.40% CA Comp-Time Accrued 312.31 0.39% LG Legal AG Contact 148.01 0.18% PH Personnel Hiring 115.99 0.14% ER Enforcement Review 112.24 0.14% RR Regulation Development Review 111.91 0.14% ET Prepare Technical Paper 101.91 0.13% IN Inspection New Installations 93.12 0.12% AW Admin Word Process/Data Input 53.44 0.07% LR Legal Contract Review 52.52 0.07% PE Personnel EPPA 39.74 0.05% AG Admin Grant Mgmt 32.19 0.04% EA Quality Assurance 22.96 0.03% EP Inventory Planning 13.08 0.02% N Environmental Response 13.01 0.02% IS Inspection Oversight (Permit) 12.77 0.02% LC Legal Cons Order/Admin Order 12.69 0.02% CR Community Right-To-Know 12.38 0.02% II Incident Investigation 9.23 0.01% EE Estimating Emissions 8.86 0.01% LA Legal Appeals 7.34 0.01% PC Personnel Classification 6.78 0.01% IM Inspection Multi-Media 5.49 0.01% IT IT Technical 4.41 0.01% IR Inspection Removals/Abandon 3.76 0.00% ST Stack Testing 1.10 0.00% EC Quality Control 1.03 0.00% AA Admin Accounting 1.00 0.00% PP Personnel Promotion (CL) 0.04 0.00% Grand Total Grand Total 80030.23 100.00%
As Tables S.9 and S.10 indicate, a significant amount of the time coded to the “Miscellaneous” site code was spent on administrative clerical work, meetings, training, and “other duties.” Investigation into the time spent on “other duties” revealed that the majority of that time is spent servicing the air monitoring stations and collecting air samples. There is no activity code dedicated to these activities and they are coded to “other duties” by default.
Related Documents


