Metrologia, 53 (2016) 1061-1068, doi: 10.1088/0026-1394/53/4/1061. © BIPM & IOP Publishing Ltd 1 Title: UNCERTAINTY ANALYSIS OF GAS FLOW MEASUREMENTS USING CLEARANCE-SEALED PISTON PROVERS IN THE RANGE FROM 0.0012 G/MIN TO 60 G/MIN Authors: G. Bobovnik * , J. Kutin and I. Bajsić all from: Laboratory of Measurements in Process Engineering, Faculty of Mechanical Engineering, University of Ljubljana, Aškerčeva 6, SI-1000 Ljubljana, Slovenia Corresponding author: * Gregor Bobovnik (see the address above) Tel.: +386 1 4771 220 Fax: +386 1 4771 118 E-mail: [email protected]

Welcome message from author
This document is posted to help you gain knowledge. Please leave a comment to let me know what you think about it! Share it to your friends and learn new things together.
Transcript

Metrologia, 53 (2016) 1061-1068,
doi: 10.1088/0026-1394/53/4/1061. © BIPM & IOP Publishing Ltd
1
Title: UNCERTAINTY ANALYSIS OF GAS FLOW MEASUREMENTS USING
CLEARANCE-SEALED PISTON PROVERS IN THE RANGE FROM
0.0012 G/MIN TO 60 G/MIN
Authors: G. Bobovnik*, J. Kutin and I. Bajsić
all from: Laboratory of Measurements in Process Engineering,
Faculty of Mechanical Engineering, University of Ljubljana,
Aškerčeva 6, SI-1000 Ljubljana, Slovenia
Corresponding author:
* Gregor Bobovnik (see the address above)
Tel.: +386 1 4771 220
Fax: +386 1 4771 118
E-mail: [email protected]

Metrologia, 53 (2016) 1061-1068,
doi: 10.1088/0026-1394/53/4/1061. © BIPM & IOP Publishing Ltd
2
ABSTRACT:
This paper deals with an uncertainty analysis of gas flow measurements using a compact, high-
speed, clearance-sealed realization of a piston prover. A detailed methodology for the
uncertainty analysis, covering the components due to the gas density, dimensional and time
measurements, the leakage flow, the density correction factor and the repeatability, is
presented. The paper also deals with the selection of the isothermal and adiabatic measurement
models, the treatment of the leakage flow and discusses the need for averaging multiple
consecutive readings of the piston prover. The analysis is prepared for the flow range
(50000:1) covered by the three interchangeable flow cells. The results show that using the
adiabatic measurement model and averaging the multiple readings, the estimated expanded
measurement uncertainty of the gas mass flow rate is less than 0.15 % in the flow range above
0.012 g/min, whereas it increases for lower mass flow rates due to the leakage flow related
effects. At the upper end of the measuring range, using the adiabatic instead of the isothermal
measurement model, as well as averaging multiple readings, proves important.
KEYWORDS:
piston prover, uncertainty analysis, adiabatic measurement model, leakage flow, CMC

Metrologia, 53 (2016) 1061-1068,
doi: 10.1088/0026-1394/53/4/1061. © BIPM & IOP Publishing Ltd
3
1 INTRODUCTION
The piston-prover concept is widely used for primary standards in the field of gas flow
measurements [1–10]. The general principle of operation is based on determining the time
interval that a piston needs to pass a known volume of gas at a defined pressure and
temperature. A general model for the mass flow rate can be expressed with:
,2 ,2 ,1 ,m d
m m d d m l
V Vq q
t t
, (1)
where Vm is the measuring volume of the gas collected by the piston prover during the
t = t2 t1 interval, m,2 is the mean density of the gas in the measuring volume at the time t2,
Vd is the connecting volume of the gas between the meter under test and the piston at the time
t1, (d,2 d,1) is the change in the mean density of the gas in the connecting volume during the
t interval, and qm,l is the leakage mass flow rate.
This article deals with a commercially available, high-speed, clearance-sealed realization of the
piston prover [11,12] that is schematically shown in Fig. 1. Such a prover is used in our
accredited calibration laboratory as a primary standard for gas flow rate measurements and it
consists of a base and three interchangeable flow cells with overlapping measuring ranges from
0.0012 g/min to 60 g/min (from 0.001 l/min to 50 l/min) for air flow at ambient conditions.
The base contains the processor, the time base and the atmospheric pressure sensor, while each
of the flow cells houses a graphite piston and glass cylinder assembly with integrated
temperature and pressure gauge sensors.

Metrologia, 53 (2016) 1061-1068,
doi: 10.1088/0026-1394/53/4/1061. © BIPM & IOP Publishing Ltd
4
Fig. 1. Scheme of the clearance-sealed piston prover.
In our earlier work [13,14] we identified some deficiencies of the isothermal measurement
model employed by the manufacturer in the piston prover and then proposed and developed an
improved adiabatic measurement model. The adiabatic model was further amended [15,16]
with the compensation of the heat exchange related effects that arise because of the
temperature difference between the gas flow and the cylinder wall. In both stages the adiabatic
measurement model was also experimentally validated. In [17] we presented an uncertainty
analysis of the mass flow rate measured using the flow cell C of the piston prover.
Cylinder
Gauge
pressure sensor,
p1, p2
Gas inflow, qm
Piston
Piston
Piston
Gauge
pressure sensor,
p12
Temp. sensor,
T
Atmospheric
pressure sensor,
Pa
Lm
Dc

Metrologia, 53 (2016) 1061-1068,
doi: 10.1088/0026-1394/53/4/1061. © BIPM & IOP Publishing Ltd
5
The aim of this article is to present a more detailed methodology of the uncertainty analysis for
the mass flow rate measurements using a clearance-sealed piston prover under ambient
conditions that includes and extends our previous findings. The analysis also deals with the
selection of the measurements model and discusses the need for averaging multiple consecutive
readings of the piston prover. The presented uncertainty analysis is made for the flow range
covered by all three flow cells (50000:1). We show that, with an appropriate treatment of the
leakage flow, the nominal lower end value of 0.006 g/min for the smallest flow cell, declared
by the manufacturer, can be decreased by five times, down to 0.0012 g/min. The evaluation of
the uncertainties is made according to JCGM 100: 2008 [18].
The paper is organized as follows. Section 2 of the article outlines the applied measurement
models, while Section 3 describes the measurement system. The individual contributions to the
uncertainty of the mass flow rate due to the gas density, the dimensional and time
measurements, the leakage flow rate, the density correction factor and the repeatability of the
measured mass flow rate are discussed in Section 4. The final results of the analysis are given
in Section 5 and include comparisons of the resulting uncertainties of the mass flow rate of dry
air for isothermal and adiabatic measurement models and also for single or multiple averaged
readings from the piston prover.

Metrologia, 53 (2016) 1061-1068,
doi: 10.1088/0026-1394/53/4/1061. © BIPM & IOP Publishing Ltd
6
2 MEASUREMENT MODEL
The measurement model employed in the piston prover under discussion can be written as:
*
( )
,,
pmm a v l
Vq P T q
t. (2)
The nominal gas density (Pa,T) at the atmospheric pressure Pa and the time-averaged gas
temperature in the piston prover T are calculated using the equation for a real gas:
,/
aa
PP T
Z R M T, (3)
where Z is the compressibility factor, which is pressure and temperature dependent, R is the
universal gas constant and M is the molar mass of the gas. The effective measuring volume *
mV
is expressed as
2
*
4
m m
DV L , (4)
where Lm is the distance passed by the piston in the time interval t, D is the piston diameter,
D + is the effective diameter of the cylinder, where is the clearance thickness, and ( )
,
p
v lq is
the Poiseuille leakage flow rate. The cylinder diameter is reduced from D + 2 to D + in
order to account for the Couette leakage flow component, which arises due to the piston
movement relative to the cylinder wall (in a small clearance the mean gas velocity is nearly
half of the piston velocity [19]). The density correction factor accounts for the variations in
the density of the gas relative to (Pa,T). Considering the improved adiabatic model that
accounts for the quasi-adiabatic nature of the relatively high-frequency oscillations of the gas,
the correction factor reads as [13,14]:

Metrologia, 53 (2016) 1061-1068,
doi: 10.1088/0026-1394/53/4/1061. © BIPM & IOP Publishing Ltd
7
( ) 12 2 12 2 1
*
11
A d
a a a m
Vp p p p p
P P P V. (5)
where p1 and p2 are the gauge pressures at the times t1 and t2, respectively, 12p is the time-
averaged value of the gauge pressure during the timing cycle and γ is the adiabatic index. In the
uncertainty analysis, the adiabatic model will also be compared to the isothermal measurement
model:
( ) 2 2 1
*1
T d
a a m
Vp p p
P P V, (6)
which is originally employed in the piston prover.
The measurement model (2-5) can be derived from the general model (1) using the following
assumptions: a spatially homogenous gas density in Vm and Vd for each time instant, 1 ,1 d
and 2 ,2 ,2 m d , a thermal equilibrium between the inlet gas flow and the cylinder wall,
and negligible gas compressibility effects in the density correction factor, 1 2Z Z Z .
Accounting for the heat exchange effects, which arise due to the temperature difference
between the gas flow and the cylinder wall, the density correction factor is modified to [16]:
* 1 T wallk T T , (7)
where *
is the adiabatic or isothermal correction factor given by equations (5) or (6), kT is the
sensitivity coefficient, the value of which depends on the selected flow cell as well as on the
measured flow rate, and Twall is the temperature of the cylinder wall.

Metrologia, 53 (2016) 1061-1068,
doi: 10.1088/0026-1394/53/4/1061. © BIPM & IOP Publishing Ltd
8
3 MEASUREMENT SYSTEM
The mass flow rate of air is measured by the piston prover that consists of a base (Sierra
Instruments, Cal=Trak SL-800) and three interchangeable flow cells with overlapping flow
ranges: cell A (SL-800-10, flow range: 0.0012 g/min – 0.6 g/min, D = 0.93 cm, Lm = 10.17
cm), cell B (SL-800-24, flow range: 0.06 g/min – 6 g/min, D = 2.40 cm, Lm = 10.17 cm) and
cell C (SL-800-44, flow range: 0.6 g/min – 60 g/min, D = 4.44 cm, Lm = 7.61 cm).
In the piston prover the measurement time interval ∆t is measured using the internal time base.
The piston diameter D and the distance Lm that a piston passes between two optical sensors are
obtained from the external dimensional calibrations. The clearance thickness is evaluated
from the analytical model for the Poiseuille leakage flow rate [11]. The Poiseuille leakage flow
rate ( )
,
p
v lq is determined periodically by the external calibration provider as well as using the in-
house calibrations. In the second case, we are using the validated dynamic summation method,
which is described in Appendix A. The values of the internal connecting volume Vd for each
flow cell, which includes the interior passages, the valve and the portion of the cylinder below
the point at which the timing begins, are provided by the manufacturer.
The pressure Pa is measured using an atmospheric pressure sensor located in the prover’s base
and the temperature T is measured using the integrated temperature sensor at the inlet of the
cylinder for each flow cell. The density of the selected gas, which depends on the absolute
pressure and the temperature, is obtained from the REFPROP database [20].
The characteristic gauge pressures p1 and p2 are measured using the internal pressure sensor of
the flow cell. In order to apply the adiabatic correction model, instead of the isothermal used by

Metrologia, 53 (2016) 1061-1068,
doi: 10.1088/0026-1394/53/4/1061. © BIPM & IOP Publishing Ltd
9
the manufacturer, the time-averaged pressure is measured by adding an external pressure
sensor (Validyne P855, measuring range: –1.4 kPa to 1.4 kPa, voltage output: –5 V to 5 V, low
pass filter at 250 Hz / –3 dB) . This external sensor is connected in parallel with the internal
pressure gauge sensor and its voltage output is measured with a DAQ board (National
Instruments, USB-6251 BNC). The communication with the piston prover and with the DAQ
board, as well as the processing of the measurement signals, is realized using LabVIEW
software (National Instruments, Ver. 10.0).
The piston prover is connected to a stable flow source, which is realized using critical nozzles
(TetraTec Instruments, array of five Venturi-shaped critical nozzles, flow range: 0.6 g/min –
60 g/min) or with a set of mass flow controllers (Bronkhorst F-201CV, four controllers,
maximum flow rates: 0.013 g/min (2 pieces), 0.13 g/min, 1.3 g/min, control stability: 0.1 %
max. flow rate). The smallest, but still suitable, mass flow controller is selected outside the
flow range of the critical nozzle array.
The measurement result is obtained as a single reading or as the moving-average value of
multiple consecutive readings. With a single reading, we mean a value obtained from a single
measurement cycle (run) of the piston prover. The moving-average value is, in general,
obtained by averaging ten consecutive readings, except for the smallest flow rates of the flow
cell A (qm 0.006 g/min), where only three readings are averaged, because of the relatively
long time (about 10 min at 0.0012 g/min) needed to carry out a single measurement.
12p

Metrologia, 53 (2016) 1061-1068,
doi: 10.1088/0026-1394/53/4/1061. © BIPM & IOP Publishing Ltd
10
4 EVALUATION OF THE UNCERTAINTY CONTRIBUTIONS
4.1. Nominal gas density
The components of the standard relative uncertainty of the air density are presented in Table 1.
The uncertainties of the absolute pressure and the temperature are determined using the
calibration results and the calibration history (time drift) of the sensors. The stated uncertainty
of the temperature is equal for all three flow cells. The contribution of the compressibility
factor represents the uncertainty of the underlying REFPROP models and is estimated by a
comparison of its values with those of a particular reference model (e.g., CIPM-2007 formula
for air [21]). The molar mass is affected by the actual composition of the gas applied in the
measurement process. The dry air used with the measurement system in our laboratory is
obtained by passing compressed air through a set of filters and the desiccant dryer (Kaeser DC
7.5, dew point = –70°C). Following Ref. [21], we can calculate the uncertainty of the molar
mass of dry air by combining the uncertainties of the mole fraction of CO2 (2COx ) and of the
relative humidity of the air ():
2
2
2 100 kPa( ) / 0.41 ( ) 0.01 ( )COu M M u x u
p
, (8)
where p is the pressure in kPa at which the relative humidity is measured. The mole fraction
of CO2 is not measured, but it is assumed to be equal to 4·10-4
and to be encompassed by a
rectangular distribution having a half-width of 4·10-4
, which leads to a standard uncertainty of
2
4( ) 4 10 / 3 COu x . The relative standard humidity is measured with a capacitive sensor at
500 kPa, and its relative standard uncertainty is equal to 5 %.

Metrologia, 53 (2016) 1061-1068,
doi: 10.1088/0026-1394/53/4/1061. © BIPM & IOP Publishing Ltd
11
Table 1. Components of the air density standard uncertainty, 2
,( ) / ( ) / rel i i iiu c u x x
ix , ( ) /rel i i ic u x x
, ( ) /rel i i ic u x x
Pa u(Pa) / Pa
0.026 %
T u(T) / T
–0.026 %
Z u(Z) / Z
–0.010 %
M u(M) / M
0.014 %
u() /
0.040 %
4.2. Dimensional and time measurements
The term * / mV t depends on the dimensional quantities of the piston and the cylinder (D, Lm,
) as well as the measurement time interval t. The contributions to the relative standard
uncertainty of the uncorrected volume flow rate are shown in Table 2 ( << D can be
considered in the notation of the sensitivity coefficients, because is smaller than 10–3
cm for
all flow cells). The uncertainties of the respective quantities are determined using the
calibration results and the calibration history (time drifts), while the uncertainty, u(), is
estimated according to Ref. [11].
Before a dimensional calibration of the piston diameter D is performed, the flow cell is
disassembled and the piston-cylinder assembly is cleaned, with the intention being to remove
any dirt or dust that could obstruct the smooth motion of the piston. It is very likely that the
piston cleaning slightly affects its diameter, so the actual drift of the diameter is probably
smaller than the value considered in the analysis. The distance Lm that a piston passes between
two optical sensors is also determined after the flow cell is reassembled, meaning that the
difference between the values obtained in the last two calibrations represents not only the time

Metrologia, 53 (2016) 1061-1068,
doi: 10.1088/0026-1394/53/4/1061. © BIPM & IOP Publishing Ltd
12
drift (attributed to, e.g., the ageing of the optical sensors) but also to the reproducibility of the
optical sensors’ reassembly. Therefore, the present analysis estimates the time drift of Lm as
one half of the difference between the values obtained in the last two calibrations.
Table 2. Relative components of the uncorrected volume flow uncertainty for all three flow
cells, 2* *
,( / ) / ( / ) ( ) / m m rel i i iiu V t V t c u x x
ix , ( ) /rel i i ic u x x Cell A Cell B Cell C
t / u t t 0.018 % 0.018 % 0.018 %
Lm /m mu L L 0.016 % 0.013 % 0.013 %
D 2 /u D D 0.026 % 0.0070 % 0.0070 %
2 /u D 0.015 % 0.0065 % 0.0044 %
* *( / ) / ( / ) m mu V t V t 0.038 % 0.024 % 0.023 %
4.3. Leakage flow rate
The leakage flow rates ( )
,
p
v lq for all three flow cells equal to: 0.122 cm3/min (cell A),
0.191 cm3/min (cell B) and 0.78 cm
3/min (cell C) having standard uncertainties
( )
,( )p
v lu q of:
0.004 cm3/min (cell A), 0.019 cm
3/min (cell B) and 0.13 cm
3/min (cell C). The uncertainties
are given by their time drift and the repeatability, which is estimated by the experimental
standard deviation of consecutive measurements of the leakage flow rate. For the flow cell A
the time drift (0.018 cm3/min) alone contributes about 2 % to the standard uncertainty of the

Metrologia, 53 (2016) 1061-1068,
doi: 10.1088/0026-1394/53/4/1061. © BIPM & IOP Publishing Ltd
13
measured gas flow rate at its lower end of the measuring range. Therefore a leakage flow rate is
determined immediately before or after any of the performed measurements or calibrations and
the uncertainty of the leakage volume flow rate for flow cell A is estimated by accounting only
for its repeatability.
The described approach probably overpredicts the actual uncertainty related to the leakage flow
rate in all cases, since its estimated repeatability is also partly included in the estimated
repeatability of the measured mass flow rate (see Section 4.5). The dispersion of the leakage
flow rate is probably related to the variations of the piston position relative to the cylinder
walls and to the piston rocking [11].
4.4. Density correction factor
A detailed uncertainty analysis of the density correction factors for the adiabatic and isothermal
models was already presented in [14]. Here, the analysis is amended with an additional
uncertainty component ( )
Tu , which represents the heat exchange effects arising due to the
temperature difference between the temperatures of the inlet gas flow and the cylinder wall
(see [16] for more details). In the current analysis, this contribution accounts for the fact that
the heat-transfer correction equation (7) is not applied for the calculation of the density
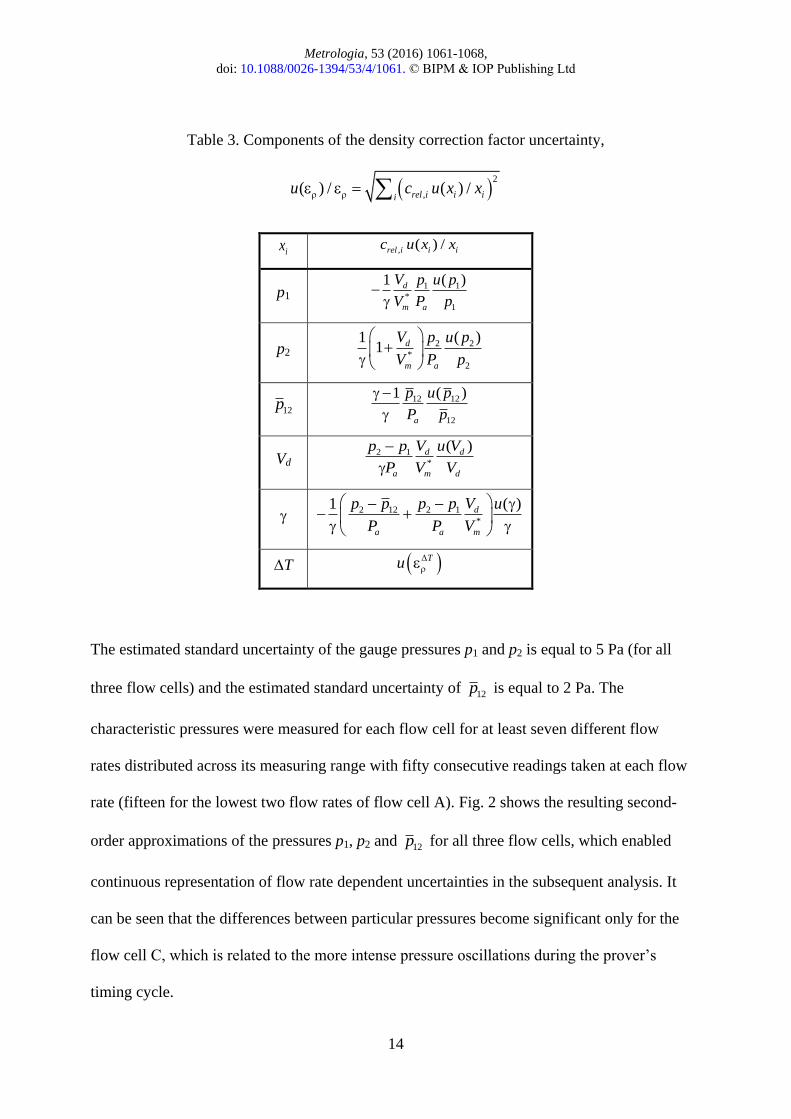
correction factor. Table 3 lists the significant components of the standard uncertainty for the
adiabatic model (considering 1 in the notation of the sensitivity coefficients).
Metrologia, 53 (2016) 1061-1068,
doi: 10.1088/0026-1394/53/4/1061. © BIPM & IOP Publishing Ltd
14
Table 3. Components of the density correction factor uncertainty,
2
,( ) / ( ) / rel i i iiu c u x x
ix , ( ) /rel i i ic u x x
p1 1 1
*
1
( )1
d
m a
V p u p
V P p
p2 2 2
*
2
( )11
d
m a
V p u p
V P p
12p 12 12
12
( )1
a
p u p
P p
Vd 2 1
*
( )
d d
a m d
V u Vp p
P V V
2 12 2 1
*
1 ( )
d
a a m
Vp p p p u
P P V
T Δ
Tu
The estimated standard uncertainty of the gauge pressures p1 and p2 is equal to 5 Pa (for all
three flow cells) and the estimated standard uncertainty of 12p is equal to 2 Pa. The
characteristic pressures were measured for each flow cell for at least seven different flow
rates distributed across its measuring range with fifty consecutive readings taken at each flow
rate (fifteen for the lowest two flow rates of flow cell A). Fig. 2 shows the resulting second-
order approximations of the pressures p1, p2 and 12p for all three flow cells, which enabled
continuous representation of flow rate dependent uncertainties in the subsequent analysis. It
can be seen that the differences between particular pressures become significant only for the
flow cell C, which is related to the more intense pressure oscillations during the prover’s
timing cycle.

Metrologia, 53 (2016) 1061-1068,
doi: 10.1088/0026-1394/53/4/1061. © BIPM & IOP Publishing Ltd
15
Fig. 2. The approximations of characteristic pressures in the timing cycles of the piston prover
for all three flow cells ( cell A, ○ cell B, □ cell C)
The internal connection volumes Vd for a particular flow cell equal: *1.31 mV (cell A),
*1.28 mV (cell B) and *1.69 mV (cell C). The value of the standard uncertainty is equal to
2.46 cm3
for flow cell A and 6.29 cm3 for flow cells B and C. The estimated values cover the
possible change of the connecting volume, which corresponds to the volume of a 0.5 m long
connecting tube that is typically used with the individual flow cell. The adiabatic index for
dry air is equal to 1.4 and is encompassed by a rectangular distribution having a half-width of
0.1 that leads to a standard uncertainty of ( ) 0.1/ 3 u [14].
In Ref. [16] the heat transfer in the cylinder was studied theoretically and experimentally.
Supported by these findings and the results of additional simulations carried out for the
smallest flow cells it was established that the relative heat-transfer correction (7) does not
0.001 0.01 0.1 1 10 1000.0
0.2
0.4
0.6
0.8
1.0
p12
p1
p2
qm / g/min
Ch
arac
teri
stic
pre
ssu
res
/ k
Pa

Metrologia, 53 (2016) 1061-1068,
doi: 10.1088/0026-1394/53/4/1061. © BIPM & IOP Publishing Ltd
16
exceed 0.035 % if the maximum temperature difference between the inlet flow and the cylinder
wall is 0.15 K below 6 g/min or up to 0.5 K at 60 g/min. It was proven that the required
temperature difference can be assured by the proper temperature stabilization of the piston
prover and its surroundings. So, the standard uncertainty estimation of Δ( ) 0.035 % / 3Tu
can be reasonably attributed to the heat exchange related effects.
Fig. 3 shows the individual contributions and the resulting relative uncertainty of the density
correction factor using the adiabatic model for flow cell C. The increase at higher flow rates is
related to the increased difference between the characteristic pressures, which is reflected in the
increased uncertainty contributions of and Vd. The largest uncertainty contribution in the
entire measuring range is related to the heat exchange effects in the cylinder. For the other two
flow cells, A and B, the value of the relative uncertainty of the density correction factor is
smaller than 0.023 % across their entire measuring range. The temperature inhomogeneity also
remains as the largest uncertainty contribution in these two cells.

Metrologia, 53 (2016) 1061-1068,
doi: 10.1088/0026-1394/53/4/1061. © BIPM & IOP Publishing Ltd
17
Fig. 3. Contributions to the uncertainty of the density correction factor for flow cell C
In Fig. 4 , the values of the adiabatic (5) and isothermal (6) density correction factors are
compared for flow cell C. The values of the correction factors for both models are close to 1
across the entire measuring range of the piston prover, reaching the highest values of
approximately 1.006 at the highest flow rates. Next, we define the difference between the
isothermal and adiabatic models: ( ) ( ) ( )( ) / T A A . It was established that is lower or
equal to 0.01 % for the flow cells A and B because of the relatively small differences between
the characteristic pressures. On the other hand, as shown in Fig. 4, the in flow cell C
increases to above 0.05 % for flow rates greater than 10 g/min (up to 0.13 % at 40 g/min),
which is in the range of the increased pressure oscillations in the measuring cycle.
0.1 1 10 1000.00
0.01
0.02
0.03
u()/
Contributions of:
p1
p2
p12
Vd
T
qm / g/min
Sta
ndar
d u
nce
rtai
nty
/ %

Metrologia, 53 (2016) 1061-1068,
doi: 10.1088/0026-1394/53/4/1061. © BIPM & IOP Publishing Ltd
18
Fig. 4. Values of the adiabatic and isothermal density correction factor and their relative
difference for flow cell C
4.5. Repeatability
The repeatability was estimated from the same set of measurements that were conducted to
determine the characteristic pressures in the timing cycle of the piston prover (see Section 4.4).
In such manner fifty (fifteen) single readings and forty-one (thirteen) moving-average readings
at each flow rate were obtained (numbers in parentheses refer to the lowest two flow rates of
flow cell A). Fig. 5 presents the repeatability estimated as the experimental standard deviation,
s(qm), of: (i) single readings, (ii) moving-average readings. The results show that averaging
consecutive readings of the piston prover decreases the experimental standard deviation on
average by almost a factor of 3. The worse repeatability at higher flow rates, especially evident
when only a single reading is taken into account, is related to the increased pressure
1 10 100
1.000
1.002
1.004
1.006
/ %
(A)
(T)
qm / g/min
0.00
0.05
0.10
0.15

Metrologia, 53 (2016) 1061-1068,
doi: 10.1088/0026-1394/53/4/1061. © BIPM & IOP Publishing Ltd
19
oscillations and to the quantization error of the measurement time interval. Fig. 5 also shows
the repeatability envelopes considered further in the uncertainty analysis.
Fig. 5. The relative experimental standard deviation for single and moving-average readings
( cell A, ○ cell B, □ cell C)
0.001 0.01 0.1 1 10 1000.001
0.01
0.1
1
single readings (open symbols)
moving-average readings (closed symbols)
qm / g/min
s(q
m)/
qm /
%

Metrologia, 53 (2016) 1061-1068,
doi: 10.1088/0026-1394/53/4/1061. © BIPM & IOP Publishing Ltd
20
5 COMBINED AND EXPANDED UNCERTAINTY
The combined standard uncertainty of the mass flow rate can be expressed by combining the
individual components presented in the previous section. The components and their sensitivity
coefficients are listed in Table 4 (considering ( ) *
, / Δp
v l mq V t in the notation of the sensitivity
coefficients).
Table 4. Components of the combined standard mass flow rate uncertainty,
2
,( ) / ( ) / m m rel i i iiu q q c u x x
xi , ( ) /rel i i ic u x x
/ u
* / ΔmV t * *( / Δ ) / ( / Δ )m mu V t V t
( ) / u
( )
,
p
v lq ( ) *
,( ) / ( / Δ )p
v l mu q V t
repeatability ( ) /m ms q q
Fig. 6 shows the combined standard relative uncertainty of the mass flow rate for the flow
cell A when using the moving-average readings and the adiabatic measurement model. The
contributions of particular components listed in Table 4 are also presented in the graph. In the
considered case the combined standard uncertainty is close to 0.5 % for the smallest flow rate
at 0.0012 g/min, from where it decreases to about 0.07 % at 0.015 g/min and remains below
this value up to the maximum flow rate of 0.6 g/min. The increase of the uncertainty below
0.015 g/min is mostly attributed to the leakage flow component and to the repeatability of the

Metrologia, 53 (2016) 1061-1068,
doi: 10.1088/0026-1394/53/4/1061. © BIPM & IOP Publishing Ltd
21
measured mass flow rate. At higher flow rates the most important uncertainty contributions are
the uncertainties of the uncorrected measuring volume flow rate, the density of the air and the
density correction factor (the first two contributions are almost identical and hardly
distinguishable in the graph). The last three contributions remain the most important also for
the larger two flow cells B and C. When using the moving-average readings the repeatability
contribution for these two cells remains relatively small (0.01 %) and the combined relative
standard uncertainty remains smaller than 0.07 % across their entire measuring.
Fig. 6. Combined mass flow rate standard relative uncertainty for the moving-average readings
of flow cell A, including the contributions of the individual components
Finally, the expanded measurement uncertainty of the mass flow rate measured by the piston
prover is evaluated as ( ) / ( ) / m m m mU q q k u q q using the coverage factor, k, for 95.45 %
0.001 0.01 0.1 10.00
0.10
0.20
0.30
0.40
0.50
u(qm)/q
m
Contributions of:
Vm
*/t
ql
s(qm)
qm / g/min
u(q
m)/
qm /
%

Metrologia, 53 (2016) 1061-1068,
doi: 10.1088/0026-1394/53/4/1061. © BIPM & IOP Publishing Ltd
22
confidence interval by taking into account the effective degrees of freedom, which are
calculated according to the Welch-Satterthwaite formula [18]. In the case of the isothermal
model, the expanded relative uncertainty was evaluated by treating the relative difference
between the isothermal and the adiabatic density correction factor, , as the uncorrected
systematic error [14]: ( ) / ( ) / m m m mU q q k u q q . In Fig. 7 the expanded relative
uncertainty of the air mass flow rate is presented for the measuring range of all three flow cells
using three different measurement methods.
Fig. 7. The relative expanded uncertainty for different measurement methods ( cell A,
○ cell B, □ cell C)
0.001 0.01 0.1 1 10 100
0.10
1.00 adiabatic & moving-average reading
isothermal & moving-average reading
adiabatic & single reading
qm / g/min
U(q
m)/
qm /
%

Metrologia, 53 (2016) 1061-1068,
doi: 10.1088/0026-1394/53/4/1061. © BIPM & IOP Publishing Ltd
23
At flow rates less than 0.015 g/min the expanded uncertainty increases steeply to
approximately 1 % because of the leakage flow contribution. The selection of the adiabatic or
the isothermal correction model is not very influential for flow cells A and B (observed
differences only up to 0.01 %), but it considerably affects the measurements in the flow range
covered by flow cell C. If the isothermal model is applied, the expanded uncertainty increases
steeply for flow rates above 3 g/min and reaches its peak of 0.24 % at about 40 g/min, whereas
for the adiabatic model the uncertainty remains below 0.11 %.
The difference between the single readings and the moving-average readings is more evident at
the lower (< 0.06 g/min) and the upper (> 20 g/min) ends of the measuring range, where the
values of ( ) /m mU q q differ up to as much as about 0.15 % and 0.06 %, respectively. The
observed difference is related to the increased non-repeatability of the single-reading
measurements (see Fig. 5) and the increase of the coverage factor for 95% confidence interval
at both ends of the flow range (up to k = 2.4 at 60 g/min).

Metrologia, 53 (2016) 1061-1068,
doi: 10.1088/0026-1394/53/4/1061. © BIPM & IOP Publishing Ltd
24
6 CONCLUSIONS
A detailed methodology for the evaluation of the measurement uncertainty of a clearance-
sealed piston prover is presented. The piston prover under consideration uses three
interchangeable flow cells to cover the mass flow range between 0.0012 g/min and 60 g/min.
The uncertainty analysis accounts for the contributions due to the gas density, the dimensional
and time quantities, the leakage flow rate, the density correction factor and the repeatability of
the measured mass flow rate.
The uncertainty analysis, which was made for flow measurements of dry air, identifies the
largest individual contributions to the combined measurement uncertainty of the mass flow
rate. Uncertainties related to the air density, the dimensional and the time quantities as well as
the density correction factor are approximately of the same order of magnitude across the entire
mass flow range. Therefore, reducing only one of them would not considerably affect the
resulting combined uncertainty. Exceptions are the lower and upper ends of the observed
measuring range, where the proper treatment of the leakage flow effects and the repeatability
effects, respectively, can decrease the combined uncertainty. The former requires the leakage
flow rate to be determined immediately before or after the measurements and the latter requires
a sufficient number of averaged readings. In the range of increased pressure oscillations,
qm > 10 g/min, the conducted measurements show that averaging multiple readings instead of
taking only a single reading as the measurement result can reduce the repeatability of the
measured mass flow rate by a factor of 3 or 4.
The paper also demonstrates that for mass flow rates greater than about 10 g/min the selection
of the density correction model proves to be very important. Using the developed adiabatic
model instead of the isothermal one, which is originally applied in the piston prover, can

Metrologia, 53 (2016) 1061-1068,
doi: 10.1088/0026-1394/53/4/1061. © BIPM & IOP Publishing Ltd
25
reduce the combined uncertainty by up to 50 %. However, in the studied configuration of the
piston provers, its use requires an external fast response pressure gauge sensor to be fitted in
parallel with the internal gauge sensor of the flow cell.
Using the adiabatic measurement model, including the averaging of multiple readings, the
estimated expanded measurement uncertainty of the gas mass flow rate for the clearance-sealed
prover is smaller than 0.15 % in the flow range between 0.012 g/min and 60 g/min. It was
demonstrated that with a proper treatment of the leakage flow effects, the measuring range of
the smallest flow cell was extended down to 0.0012 g/min. At this flow rate the expanded
uncertainty increases up to almost 1%, which is mostly because of the repeatability of the
leakage flow rate during the measurement.
The analysis also suggests that the dimensional calibration procedure for the piston diameter
and the piston travel distance should be modified in order to provide the relevant history data
for the estimation of the time drifts of both quantities. It would also be advisable to perform
additional dimensional calibrations of the cylinder inner diameters that would enable direct
calculations of the clearance thicknesses, thereby removing the need to use an analytical model
for its estimation.

Metrologia, 53 (2016) 1061-1068,
doi: 10.1088/0026-1394/53/4/1061. © BIPM & IOP Publishing Ltd
26
APPENDIX A.: DYNAMIC SUMMATION METHOD
The method is used to measure the leakage flow rate ( )
,
p
v lq in the clearance-sealed piston prover.
As shown in Fig. A.1, the gas is supplied from two stable flow sources to two parallel flow
branches, each restricted by a valve, which reunite before the inlet to the piston prover. During
the measurement the uncorrected readings of the piston prover have to be recorded, which can
be achieved by setting the leakage volume flow rate in equation (2) to zero. So, the actual mass
flow rate (qm) can be written as the sum of the uncorrected reading of the piston prover (*
mq )
and the leakage mass flow rate past the piston cylinder clearance (qm,l):
*
,m m m lq q q . (A.1)
The mass flow rate is consecutively measured from each flow source separately (qm1, qm2) by
closing the valve in the other branch, as well as from both flow sources simultaneously
(qm1+m2). By closing a valve in a particular branch the gas is diverted to the ambient
environment (shown with dashed lines in Fig. A.1). Assuming that all mass flow rate sources
remain stable during the measurement, the following holds true:
* * *
1 2 , 1 , 2 ,m m m l m m l m m lq q q q q q . (A.2)
Hence, it follows that the leakage mass flow rate can be determined by subtracting the two
uncorrected flow readings obtained in the separate measurements for each flow source from the
uncorrected reading obtained in the simultaneous measurement:
* * *
, 1 2 1 2m l m m m mq q q q . (A.3)
Finally, the leakage volume flow rate as defined in the measurement model of the piston prover
is given by
,( )
,
m lp
v l
, (A.4)

Metrologia, 53 (2016) 1061-1068,
doi: 10.1088/0026-1394/53/4/1061. © BIPM & IOP Publishing Ltd
27
where and are taken as the average values during the measurement.
Figure A.1. Schematic representation of the experimental setup
Flow
source 1
Flow
source 2
qm1
qm2
qm1, qm2, qm1+m2 Piston
prover

Metrologia, 53 (2016) 1061-1068,
doi: 10.1088/0026-1394/53/4/1061. © BIPM & IOP Publishing Ltd
28
REFERENCES
[1] Wright J D and Mattingly G E 1998 NIST Calibration Services for Gas Flow Meters:
Piston Prover and Bell Prover Gas Flow Facilities (Gaithersburg, MD: National
Institute of Standards and Technology)
[2] Wright J D, Mattingly G E, Nakao S, Yokoi Y and Takamoto M 1998 International
comparison of a NIST primary standard with an NRLM transfer standard for small mass
flow rates of nitrogen gas Metrologia 35 211–21
[3] Berg R F and Cignolo G 2003 NIST–IMGC comparison of gas flows below one litre
per minute Metrologia 40 154–8
[4] Cignolo G, Alasia F, Capelli A, Goria R and La Piana G 2005 A primary standard
piston prover for measurement of very small gas flows: an update Sensor Rev. 25 40–5
[5] Sillanpää S, Niederhauser B and Heinonen M 2006 Comparison of the primary low gas
flow standards between MIKES and METAS Measurement 39 26–33
[6] Choi H M, Park K-A, Oh Y K and Choi Y M 2009 Improvement and uncertainty
evaluation of mercury sealed piston prover using laser interferometer Flow Meas.
Instrum. 20 200–5
[7] Su C-M, Lin W-T and Masri S 2011 Establishment and verification of a primary low-
pressure gas flow standard at NIMT MAPAN J. Metrol. Soc. India. 26 173–86
[8] Berg R F, Gooding T and Vest R E 2014 Constant pressure primary flow standard for
gas flows from 0.01 cm3 min-1 to 100 cm3 min-1 (0.007–74 μmol s-1) Flow Meas.
Instrum. 35 84–91
[9] Xu Z-P, Dai J-Y, Chen H-Y and Xie D-L 2014 Development of a reciprocating double-
pistons gas prover Flow Meas. Instrum. 38 116–20

Metrologia, 53 (2016) 1061-1068,
doi: 10.1088/0026-1394/53/4/1061. © BIPM & IOP Publishing Ltd
29
[10] van der Beek M P and van den Brink R 2015 Gas oil piston prover, primary reference
values for gas-volume Flow Meas. Instrum. 44 27–33
[11] Padden H 2002 Uncertainty analysis of a high-speed dry piston flow prover
Measurement Science Conf. (Anaheim, CA)
[12] Padden H 2003 Development of a 0.2% high-speed dry piston prover Measurement
Science Conf. (Anaheim, CA)
[13] Kutin J, Bobovnik G and Bajsić I 2011 Dynamic effects in a clearance-sealed piston
prover for gas flow measurements Metrologia 48 123–32
[14] Kutin J, Bobovnik G and Bajsić I 2013 Dynamic pressure corrections in a clearance-
sealed piston prover for gas flow measurements Metrologia 50 66–72
[15] Kutin J, Bobovnik G and Bajsić I 2013 Dynamic temperature effects in a clearance-
sealed piston prover for gas flow measurements 16th Int. Flow Measurement Conf.—
FLOMEKO (Paris, France)
[16] Kutin J, Bobovnik G and Bajsić I 2015 Heat exchange effects on the performance of a
clearance-sealed piston prover for gas flow measurements Metrologia 52 857–863
[17] Bobovnik G, Kutin J and Bajsić I 2015 Evaluation of the uncertainty of gas flow
measurements by clearance-sealed piston prover XXI IMEKO World Congress
(Prague, Czech Republic) 1044–1049
[18] JCGM 2008 Evaluation of Measurement Data—Guide to the Expression of
Uncertainty in Measurement (JCGM 100:2008)
[19] Landau L D and Lifshitz E M 1987 Fluid Mechanics, Second Edition (Oxford:
Pergamon Press)

Metrologia, 53 (2016) 1061-1068,
doi: 10.1088/0026-1394/53/4/1061. © BIPM & IOP Publishing Ltd
30
[20] Lemmon E W, Huber M L and McLinden M O 2010 NIST Reference Fluid
Thermodynamic and Transport Properties—REFPROP Version 9.0 (Gaithersburg,
MD: National Institute of Standards and Technology)
[21] Picard A, Davis R S, Gläser M and Fujii K 2008 Revised formula for the density of
moist air (CIPM-2007) Metrologia 45 149–155
Related Documents


