DELIVERABLE REPORT DELIVERABLE N 0 : D1.2 DISSEMINATION LEVEL: PUBLIC TITLE: REPORT ON DEFINED KEY PERFORMANCE INDICATORS (KPI) DATE: 31/08/2014 VERSION: FINAL AUTHOR(S): SERGIO BARBARINO [PROCTER & GAMBLE] ADITHYA HARIRAM [PROCTER & GAMBLE | CZECH TECHNICAL UNIVERSITY], REVIEWED BY: MARC BILLIET [INTERNATIONAL ROADTRANSPORT UNION] JAN KYNCL [CZECH TECHNICAL UNIVERSITY IN PRAGUE] MAXIMO MARTINEZAVILA [PROCTER & GAMBLE] APPROVED BY: COORDINATOR – MARCUS ELMER [VOLVO] GRANT AGREEMENT N 0 : 605170 PROJECT TYPE: THEME 7 TRANSPORT – SST GC.SST.2012.1-5: INTEGRATION AND OPTIMISATION OF RANGE EXTENDERS ON ELECTRIC VEHICLES PROJECT ACRONYM: TRANSFORMERS PROJECT TITLE: CONFIGURABLE AND ADAPTABLE TRUCKS AND TRAILERS FOR OPTIMAL TRANSPORT EFFICIENCY PROJECT START DATE: 01/09/2013 PROJECT WEBSITE: WWW.TRANSFORMERS-PROJECT.EU COORDINATION: VOLVO (SE) PROJECT MANAGEMENT: UNIRESEARCH (NL)

Welcome message from author
This document is posted to help you gain knowledge. Please leave a comment to let me know what you think about it! Share it to your friends and learn new things together.
Transcript

DELIVERABLE REPORT
DELIVERABLE N0: D1.2
DISSEMINATION LEVEL: PUBLIC
TITLE: REPORT ON DEFINED KEY PERFORMANCE INDICATORS (KPI)
DATE: 31/08/2014
VERSION: FINAL
AUTHOR(S): SERGIO BARBARINO
[PROCTER & GAMBLE]
ADITHYA HARIRAM
[PROCTER & GAMBLE | CZECH TECHNICAL UNIVERSITY],
REVIEWED BY: MARC BILLIET [INTERNATIONAL ROADTRANSPORT UNION]
JAN KYNCL [CZECH TECHNICAL UNIVERSITY IN PRAGUE]
MAXIMO MARTINEZAVILA [PROCTER & GAMBLE]
APPROVED BY: COORDINATOR – MARCUS ELMER [VOLVO]
GRANT AGREEMENT N0: 605170
PROJECT TYPE: THEME 7 TRANSPORT – SST GC.SST.2012.1-5: INTEGRATION AND
OPTIMISATION OF RANGE EXTENDERS ON ELECTRIC VEHICLES
PROJECT ACRONYM: TRANSFORMERS
PROJECT TITLE: CONFIGURABLE AND ADAPTABLE TRUCKS AND TRAILERS FOR
OPTIMAL TRANSPORT EFFICIENCY
PROJECT START DATE: 01/09/2013
PROJECT WEBSITE: WWW.TRANSFORMERS-PROJECT.EU
COORDINATION: VOLVO (SE)
PROJECT MANAGEMENT: UNIRESEARCH (NL)

Public
605170 – D.1.2 – REPORT ON DEFINED KEY PERFORMANCE INDICATORS 2 / 32
Executive summary
This report presents the Key Performance Indicator’s (KPIs) that have been defined for evaluating and
comparing the operational parameters of a truck-(semi)trailer configuration. These indicators could link
the topline metric to business outcomes through environmental benefits, societal benefits, transport
efficiency, resource efficiency, capacity optimization and closes the loop back to the frontline. The model
used to identify KPIs is illustrated in Figure 1.
Figure 1: KPI Identification Model
Keeping the identification model in mind; the ‘End User’ KPIs were identified. They are different since
they do not dive into evaluating the articulated vehicle combination from a purely technical standpoint,
but rather they are based on evaluating the vehicle on parameters that affect and matter to business
which operate and use these vehicles. Figure 2 shows the KPI Area’s identified. By studying the
performance of the new truck-(semi)trailer configuration, against the existing state-of-the-art truck-
(semi)trailer configuration would be constructive for the successful market acceptance of the proposed
alternative.
Figure 2: Key Performance Area

Public
605170 – D.1.2 – REPORT ON DEFINED KEY PERFORMANCE INDICATORS 3 / 32
Contents Executive summary ............................................................................................................... 2
Acronyms............................................................................................................................. 4
1 Key Performance Indicators .............................................................................................. 5
2 Outcomes of the Workshop on Performance Metrics ............................................................. 7
3 Key Performance Indicators (KPIs) .................................................................................... 8
3.1 Transport Efficiency .................................................................................................. 9
3.2 Operational parameters ............................................................................................ 16
3.3 Vehicle Uptime ........................................................................................................ 20
3.4 Loading parameters ................................................................................................. 22
3.5 Safety .................................................................................................................... 24
3.6 Driver Comfort ........................................................................................................ 26
4 Challenges .................................................................................................................... 29
5 Epilogue ....................................................................................................................... 30
6 References .................................................................................................................... 31
Acknowledgment .................................................................................................................. 32

Public
605170 – D.1.2 – REPORT ON DEFINED KEY PERFORMANCE INDICATORS 4 / 32
Acronyms
KPI – Key Performance Indicators,
NPS - Net Promoter Score
CSAT - Customer Satisfaction Score
WTR - Willingness to Recommend
TSP – Transport Service Provider,
FC – Fuel Consumption
HoD – Hybrid on Demand
ECH – Effective Cargo Height
N - Power-driven vehicles having at least four wheels and used for the carriage of goods
N1 - Vehicles used for the carriage of goods and having a maximum mass not exceeding 3.5 tonnes.
(Pick-up Truck)
N2 - Vehicles used for the carriage of goods and having a maximum mass exceeding 3.5 tonnes but
not exceeding 12 tonnes. (Commercial Truck)
N3 - Vehicles used for the carriage of goods and having a maximum mass exceeding 12 tonnes.
(Commercial Truck)
OEM – Original Equipment Manufacturer
FMEA – Failure Mode and Effect Analysis
ICE – Internal Combustion Engine
VRLA - Valve Regulated Lead Acid Battery
OH&S - Occupational Health & Safety
EMG – Electric Motor and Generator
TERM – Transport and Environment Reporting Mechanism

Public
605170 – D.1.2 – REPORT ON DEFINED KEY PERFORMANCE INDICATORS 5 / 32
1 Key Performance Indicators
People working in the road freight transport sector take pride in their duty and go by the saying “If you
have it, a truck probably brought it”. With numerous players ranging from large companies to single
unit family owned firms competing with each, all of them strive to understand and improve customer
experience by using myriad metrics, such as Net Promoter Score (NPS), Customer Satisfaction Score
(CSAT), and Willingness to Recommend (WTR) etc. The challenge posed in delivering Work Package 1
(WP1), was to understand this and link it to Key Performance Indicator’s (KPIs) for the measurement,
comparison and marketability of a hybrid-on-demand truck-(semi)trailer configuration. But how do we
know which is best? And which ones exactly should one be using?
The answer, of course, is “it depends" – on the industry to which the Transport Service Provider (TSP)
caters , for example, or on what's proven to be most predictive or positive to respond to converging
pressures like the recessionary scenario and the rising cost of crude oil coinciding with governments
and consumers making a serious commitment to low-carbon living. A survey carried out by Goodyear
Dunlop covering over 400 European fleet managers indicate the following; points highlighted in bold
indicate the parameters that designers and engineers for PROJECT TRANSFORMERS must duly consider.
Nearly 1 in 6 (15%) fear they will be priced out of business by 2020 due to increasing
environmental regulation.
A further 40% fear they do not have the available funds to invest in cleaner trucks.
Finally, a third of fleets have no plans in place to prepare for CO2 legislation expected to come
into effect over the next decade.
While these issues are most acute for long-haul fleets over 300 km – which carry about 72% of all road
freight transported in Europe in terms of tonne/km – regional and short-haul fleets share concerns
about their future sustainability, and their views are also reflected in the survey findings.
Europe’s fleets have taken the following measures to reduce fuel costs over the last decade:
Invested in eco-driving training (69%)
Procured new vehicles (59%)
Improved logistics (44%)
Used fuel efficient tires (42%)
Procured new equipment (i.e. aerodynamic retrofits) (24%)
Reduced operations to reduce costs (8%)
Shifted away from long-haul loads (6%)
Only 8% of the interviewed fleets have done nothing to respond to the rising cost of fuel in the last
decade. When it comes to preparing for a stricter carbon regulatory regime a third of fleets say they
have no plans in place to prepare for expected CO2 regulation. Of those who do, the most popular
approaches are:
1. Begin taking into account CO2 emissions when calculating total lifetime cost when
procuring new vehicles (37%)
2. Improve logistics planning (32%)
3. Investing in improvements to the fuel efficiency of existing vehicles (32%)
4. Closer monitoring of CO2 emissions (24%)
5. Introducing a voluntary CO2 target (23%)
Deliverable D1.1 focused on identifying the requirements from the end users of road freight services
and the stakeholders who own and operate trucks and (semi)trailers. It has succinctly summarized the
complex scenario and the growing importance of road freight system in logistics and supply chain in
Europe but has also highlighted the progress made in reduction of emissions through standards and
improvement of efficiency over time. This report focuses on defining KPIs that would be necessary for
evaluating the Hybrid on Demand Truck-(semi)trailer configurations proposed in Project
TRANSFORMERS such that these indicators could link the topline metric to business outcomes through
environmental benefits, societal benefits, transport efficiency, resource efficiency, capacity optimization
and closes the loop back to the frontline.
By studying the performance of the new truck-(semi)trailer configuration, against the existing state-of-
the-art truck-(semi)trailer configuration would be constructive for the successful market uptake of the
proposed alternative. These KPIs have been identified by carrying out literature surveys, organizing

Public
605170 – D.1.2 – REPORT ON DEFINED KEY PERFORMANCE INDICATORS 6 / 32
workshops with the End Users Group and telephonic interviews with experts. The inputs were then
verified by collecting feedback via a digital questionnaire that was circulated to various stakeholders in
the industry. Now, having gathered inputs from representatives coming from different sections of the
road freight transport sector, it was possible to get a fair understanding on the expectations of the
industry as a whole. The 6 KPIs areas identified are as follows:
Transport Efficiency
Operational Parameters
Vehicle Uptime
Loading Parameters
Safety and Limitations
Driver Comfort

Public
605170 – D.1.2 – REPORT ON DEFINED KEY PERFORMANCE INDICATORS 7 / 32
2 Outcomes of the Workshop on Performance Metrics
The workshops organized meant to set the right performance indicators and choose the most important
ones which would then define the course of further work under the project.
Prioritization of KPIs:
Load and Volume Efficiency can lead to better utilization of trucks
Transport price (whole cost – also includes charges of the vehicle) vs. transport cost (EUR for
t/km),
Flexibility of loading
Return on Investment from TransFormers solution vs Standard Trailer should be between 30 to 36
months
Parameters:
Palettes (number of pallets or just volume optimization – packaging in general not only pallets
(41% of transport in 2011 was done by means of palletized goods and for grouped goods carried
together, palletized transport constituted 8% in terms of tonne-kilometers.
TransFormers solution must contribute positively to to improve vehicle uptime and reliability.
Loading/ unloading time
o Performance when approaching cities. i.e. ability to cope with congestion and assist a
driver with better control.
o In general it has been observed that for an empty mile vs. loaded miles trip, a vehicle
combination has around 8 l/100km difference in fuel consumption.
KPIs depending on the end-users and they can be classified in the following way:
§ LOGISTIC PERFORMANCE KPIs:
% Empty miles %load factor by weight and volume Impact on driver performance
Failure of propulsion system with a downsized tractor
§ SAFETY KPIs:
Number of vehicles in blind spot
per kilometer
Number of vulnerable
road users in blind spot
per kilometer
Intelligent
Transport
Systems
load
security
Security of the vehicles in parking
spaces
Safety when
loading/unloading
Battery theft risk Stability
Acceleration& breaking
§ SOCIAL KPIs:
Minutes of driving time Teaching drivers how to use these innovative trucks Ease of driving
Minutes of stopping time Energy/m3/km Energy/kg/km Liters/ Km/Driver
§ ENVIRONMENTAL KPIs:
Measuring CO2 performance in grams/m3/km or grams/Tonne/km for a defined drive cycle. Taking
whole cycle into account, recycling of externalities, used batteries, after-life use of battery, re-use of
electric drives etc. and not only emissions.
Public
605170 – D.1.2 – REPORT ON DEFINED KEY PERFORMANCE INDICATORS 8 / 32
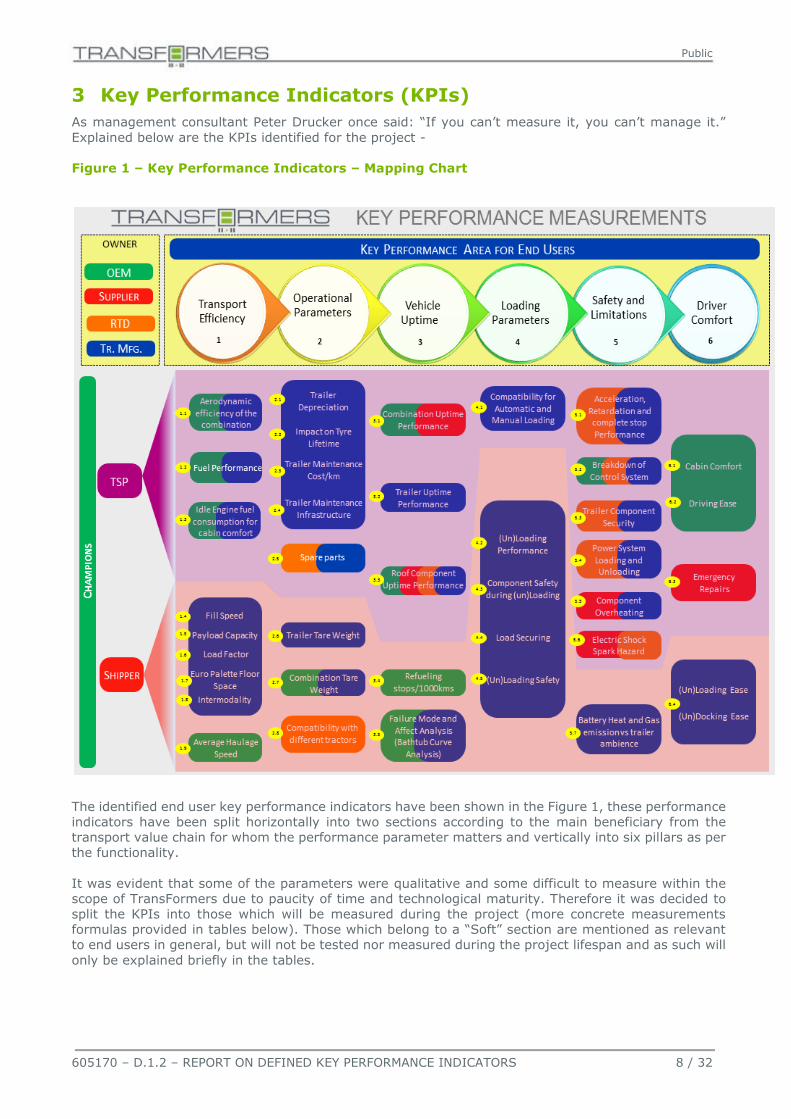
3 Key Performance Indicators (KPIs)
As management consultant Peter Drucker once said: “If you can’t measure it, you can’t manage it.”
Explained below are the KPIs identified for the project -
Figure 1 – Key Performance Indicators – Mapping Chart
The identified end user key performance indicators have been shown in the Figure 1, these performance
indicators have been split horizontally into two sections according to the main beneficiary from the
transport value chain for whom the performance parameter matters and vertically into six pillars as per
the functionality.
It was evident that some of the parameters were qualitative and some difficult to measure within the
scope of TransFormers due to paucity of time and technological maturity. Therefore it was decided to
split the KPIs into those which will be measured during the project (more concrete measurements
formulas provided in tables below). Those which belong to a “Soft” section are mentioned as relevant
to end users in general, but will not be tested nor measured during the project lifespan and as such will
only be explained briefly in the tables.

Public
605170 – D.1.2 – REPORT ON DEFINED KEY PERFORMANCE INDICATORS 9 / 32
3.1 Transport Efficiency
Transport efficiency relates to parameters that directly and indirectly impact the flow of goods in the
supply chain. The KPIs falling under transport efficiency has been defined as follows:
1 – TRANSPORT EFFICIENCY 1.1 - AERODYNAMIC EFFICIENCY
KPI Type Measurable
Measurement Unit
Interlinked to
Description
Aerodynamic improvements for a complete vehicle (tractor-trailer) could
help reach fuel savings compared to a standard tractor-trailer combination.
This has the following additional effects:
Better fuel efficiency,
Less cost per kilometer (fuel efficiency),
Fewer average stops per route at same tank size,
Shorter delivery time because of less refueling stops (logistic
efficiency),
Less CO2 & NOx emission (environmental efficiency) and
Possible spray reduction (safety efficiency).
The contribution of adding aero devices is commonly measured by
measuring fuel consumption in a controlled test setup and repeating the test
with and without the aero component added to the vehicle. For a more
general use of the findings, the fuel consumption reduction measured in the
test needs to be translated to a potential difference in drag coefficient. This
translation is dependent on test setup and brand, and is described in further
detail in D4.1. Percentage in fuel savings (∆FC – fuel consumption difference) compared to
standard vehicle
ηaero =∆FCachived
∆FCpredicted
∆FCachived =FCaero − FCstandard
FCstandard
Drag force in a trailer is calculated as:
FD =1
2 ρ U∞
2 CD(ψ∞)A
Here: FD − Drag force ρ − Density of Air U∞ − Spped of the vehicle relative to the surrounding ψ∞ − Yaw − angle of the surrounding air relative to the vehicle motion CD(ψ∞) − Drag coefficient as a function of yaw − angle A − Projected frontal area of the vehicle
FD(Reduction) =FD(high)
FD(low)
The drag force is proportional to the frontal area. But this is only right if the
drag coefficient stays the same. Typically the drag coefficient is calculated
with this formula by measuring the drag force in a wind tunnel test or getting
it by numerical simulation.
Potential for fuel tank reduction with maintained vehicle range = the
measured fuel savings of the HoD trailer (in l/km), can also be evaluated.
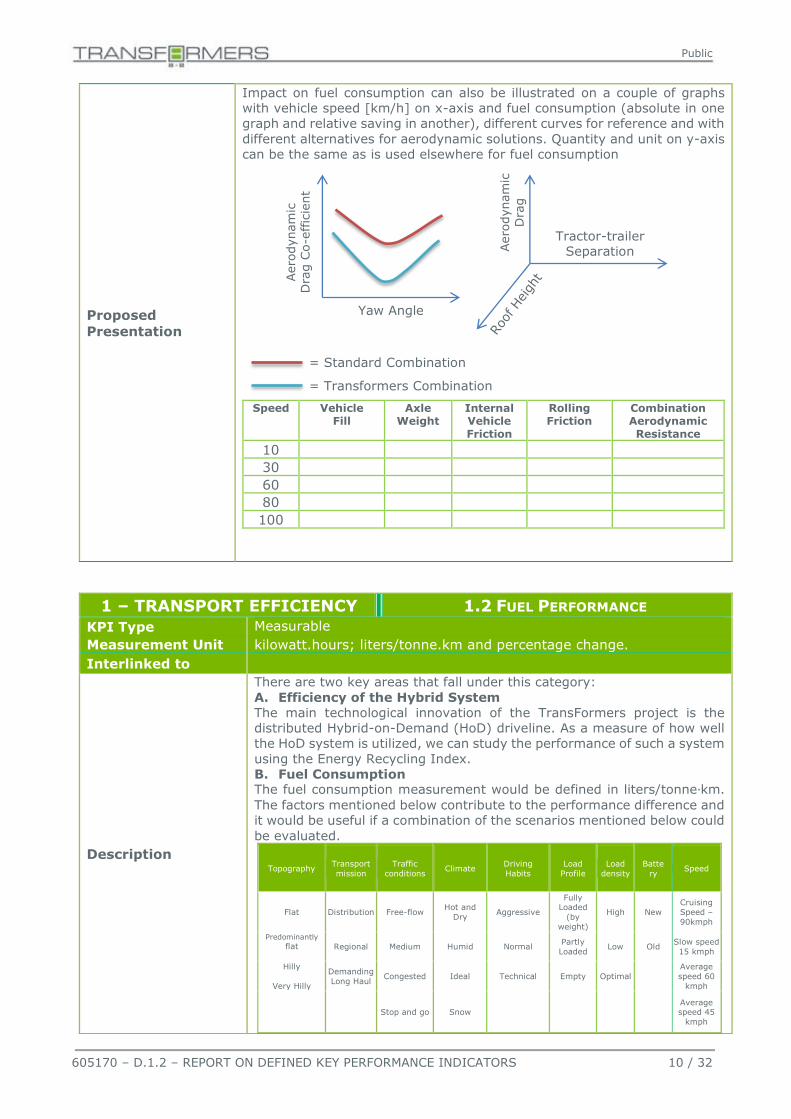
Impact on fuel consumption can also be illustrated on a couple of graphs
with vehicle speed [km/h] on x-axis and fuel consumption (absolute in one
graph and relative saving in another), different curves for reference and with different alternatives for aerodynamic solutions. Quantity and unit on y-axis
can be the same as is used elsewhere for fuel consumption
Proposed
Formula
Public
605170 – D.1.2 – REPORT ON DEFINED KEY PERFORMANCE INDICATORS 10 / 32
Proposed
Presentation
Impact on fuel consumption can also be illustrated on a couple of graphs
with vehicle speed [km/h] on x-axis and fuel consumption (absolute in one
graph and relative saving in another), different curves for reference and with
different alternatives for aerodynamic solutions. Quantity and unit on y-axis
can be the same as is used elsewhere for fuel consumption
Speed Vehicle
Fill Axle
Weight Internal Vehicle Friction
Rolling Friction
Combination Aerodynamic Resistance
10
30
60
80
100
1 – TRANSPORT EFFICIENCY 1.2 FUEL PERFORMANCE
KPI Type Measurable
Measurement Unit kilowatt.hours; liters/tonne.km and percentage change.
Interlinked to
Description
There are two key areas that fall under this category:
A. Efficiency of the Hybrid System
The main technological innovation of the TransFormers project is the
distributed Hybrid-on-Demand (HoD) driveline. As a measure of how well
the HoD system is utilized, we can study the performance of such a system
using the Energy Recycling Index.
B. Fuel Consumption The fuel consumption measurement would be defined in liters/tonne∙km.
The factors mentioned below contribute to the performance difference and
it would be useful if a combination of the scenarios mentioned below could
be evaluated.
Topography Transport
mission
Traffic
conditions Climate
Driving
Habits
Load
Profile
Load
density
Batte
ry Speed
Flat Distribution Free-flow Hot and
Dry Aggressive
Fully Loaded
(by
weight)
High New
Cruising
Speed –
90kmph
Predominantly flat
Regional Medium Humid Normal
Partly
Loaded Low Old
Slow speed
15 kmph
Hilly
Very Hilly
Demanding
Long Haul Congested Ideal Technical Empty Optimal
Average
speed 60
kmph
Stop and go Snow Average speed 45
kmph
Yaw Angle
Aero
dynam
ic
Dra
g C
o-e
ffic
ient
= Standard Combination
= Transformers Combination
Tractor-trailer Separation A
ero
dynam
ic
Dra
g

Public
605170 – D.1.2 – REPORT ON DEFINED KEY PERFORMANCE INDICATORS 11 / 32
Example - The load is the specific load of the vehicle, the topography can
be from flat to hilly or mountainous, the traffic situation contains any
constraints from traffic jam to construction work, the climatic conditions
from cold to hot and dry to humid etc.
Gradient could be measured as maximum power, or highest possible
gradient [%] that the vehicle can climb without losing speed on highest
gear, starting from 90 km/h.
It would of course be ideal to deliver results on all of these conditions,
probably not in the scope of the project due to time and capacity
constraints. Hence, after the testing phase it is necessary to specify the
performance for the cases we actually tested. It will also be useful to see
the fuel saving possibilities linked to cabin comfort during taxing.
A. Efficiency of the Hybrid System
As a measure of how well the HoD system is utilized, we define the Energy
Recycling Index described in formulation. The index gives an indication as
for how much the hybrid system is put to use. The value is always within
0 to 1, or 0 to 100%, and a higher value indicates that more of the energy
consumed for a certain transport mission came from the batteries and
therefor from the source of energy that was recuperated during
regenerative braking.
The Energy Recycling Index is defined as:
𝐼𝑊,𝑟𝑒 =𝐶𝑜𝑛𝑠𝑢𝑚𝑒𝑑 𝑟𝑒𝑐𝑢𝑝𝑒𝑟𝑎𝑡𝑒𝑑 𝑒𝑛𝑒𝑟𝑔𝑦
𝐶𝑜𝑛𝑠𝑢𝑚𝑒𝑑 𝑡𝑜𝑡𝑎𝑙 𝑒𝑛𝑒𝑟𝑔𝑦
B. Fuel Consumption
𝐹𝑢𝑒𝑙 𝐶𝑜𝑛𝑠𝑢𝑚𝑝𝑡𝑖𝑜𝑛 (𝐹𝐶) =𝐹𝑢𝑒𝑙 𝐶𝑜𝑛𝑠𝑢𝑚𝑒𝑑 𝑏𝑦 𝑡ℎ𝑒 𝑉𝑒ℎ𝑖𝑐𝑙𝑒 𝑖𝑛 𝐿𝑖𝑡𝑟𝑒𝑠
𝑃𝑎𝑦𝑙𝑜𝑎𝑑 𝐶𝑎𝑟𝑟𝑖𝑒𝑑 × 𝐷𝑒𝑓𝑖𝑛𝑒𝑑 𝐷𝑖𝑠𝑡𝑎𝑛𝑐𝑒
Percentage reduction in fuel consumption is computed by comparison with
the reference, standard combination compared to transformers
combination. (Reference in the case of load efficiency will be chosen based
on statistics and current state of the art)
Proposed
Formula
On average 72% of road freight transport in the EU is carried out with articulated vehicles consisting of
a tractor and semi-trailer. 87.4% of the semi-trailers used have a payload capacity of more than 20
tonnes. (14 tonnes average empty, 26 tonnes average payload)
Max authorized weight: 40 tonnes
Battery and electric driveline components weight: around 1 tonne
It has been observed through our discussions that one of the key primary objectives one must evaluate
and compare the new truck-(semi)trailer configuration would be for improved loading efficiency for each
mission
A. TSPs
B. Shippers
C. Authority
Now, while designing KPIs we know that, 𝜂𝑙𝑜𝑎𝑑 happens to be one of the most important factors. Let us
consider the tare weight of the tractor trailer combination under consideration to be given as Μ0 tonnes,
and the maximum weight onto which it can be loaded be given as Μ𝑚𝑎𝑥 tonnes (set as per regulation),
then for a given percentage of loading/space occupied (𝛼) the total actual utilization of the trailer
(Μ𝑎𝑐𝑡𝑢𝑎𝑙) is given by equation as shown below. This has been schematically illustrated in Figure 2. Then,
from the above relations we can mathematically deduce that actual weight of the truck is:
Μ𝑎𝑐𝑡𝑢𝑎𝑙 = Μ0 + 𝛼(Μ𝑚𝑎𝑥 − Μ0)
Figure 2: Trailer Loading Schematic
↑ 𝜂𝑙𝑜𝑎𝑑 𝑚𝑖𝑠𝑠𝑖𝑜𝑛⁄

Public
605170 – D.1.2 – REPORT ON DEFINED KEY PERFORMANCE INDICATORS 12 / 32
Thus, by definition, loading efficiency is defined as the ratio of the actual weight Μ𝑎𝑐𝑡𝑢𝑎𝑙 to the total
weight, 𝑀𝑚𝑎𝑥 of the trailer:
∴ %𝜂𝑙𝑜𝑎𝑑 =∝×𝑀𝑎𝑐𝑡𝑢𝑎𝑙
𝑀𝑚𝑎𝑥
× 100
No loss of load capacity in terms of weight or volume as compared to a current average standard
articulated combination will be accepted, i.e. a compensation for the tonne lost to batteries needs to be
found for goods that have a density >0.3 tonnes/m3 by means of aerodynamic efficiency gains or
regulatory considerations to make adaptation of the solution attractive in the long run.
1 – TRANSPORT EFFICIENCY 1.3 – FILL SPEED
KPI Type Measurable
Measurement Unit Minutes
Interlinked to
Description
Fill speed calculates the time required to fill the trailer to its designed
capacity. Higher fill speed results in better trailer turnaround, and improved
dock capacity utilization. According to the use case (weight or volume limited
transport) the fill rate is depending on the density of the freight.
The fill rate consequences for optimizing the load factor will be minimized.
For short distance transport fill rate enlargements of more than 15 min are
unrealistic. The complete time consequences for fill speed need to be
calculated and presented.
Proposed
Formula
Freight density is calculated as the volume of freight against volume of the
whole trailer 𝐹𝑖𝑙𝑙 𝑆𝑝𝑒𝑒𝑑 =
𝑇𝑜𝑡𝑎𝑙 𝑇𝑖𝑚𝑒 𝑡𝑜 𝑀𝑜𝑣𝑒 𝑡ℎ𝑒 𝐶𝑎𝑟𝑔𝑜𝑚𝑜𝑢𝑛𝑡 2𝑛𝑑 𝑓𝑙𝑜𝑜𝑟 𝑡𝑜 𝑛𝑒𝑤 ℎ𝑒𝑖𝑔ℎ𝑡
+ 𝑡𝑖𝑚𝑒 𝑡𝑜 𝑚𝑜𝑣𝑒 𝑟𝑜𝑜𝑓 𝑡𝑜 𝑛𝑒𝑤 𝑠𝑒𝑡𝑡𝑖𝑛𝑔𝑠 + 𝑒𝑥𝑡𝑟𝑎 𝑡𝑖𝑚𝑒 𝑡𝑜 𝑠𝑒𝑐𝑢𝑟𝑒 𝑙𝑜𝑎𝑑
⁄
1 – TRANSPORT EFFICIENCY
1.4 – PAYLOAD CAPACITY
KPI Type Measurable
Measurement
Unit
Tonnes
Interlinked to

Public
605170 – D.1.2 – REPORT ON DEFINED KEY PERFORMANCE INDICATORS 13 / 32
Description
Payload capacity is defined as the total weight a semi-trailer can carry based on
its design. Payload should be as high as possible to increase amount of goods
which can be transported with one trailer in a weight limited transport case
Total payload weight capacity is affected by the weight of the tractor unit and of
the trailer. The only difference in weight on the tractor unit in the scope of this
project would be the hypothetical reduction of fuel tank size.
High payload => a higher degree of efficiency. And high efficiency => less freight
transports, better turnarounds => less CO2 emissions and lower costs.
By developing an adaptable body on a trailer in which height can be reduced in
the front with 500mm and 1000 mm in the back to reduce the drag with a
maximum of 12.5% so in optimal driving conditions fuel savings can be reached
up to a maximum of 4%.
Proposed
Formula
𝑃𝑎𝑦𝑙𝑜𝑎𝑑 𝐶𝑎𝑝𝑎𝑐𝑖𝑡𝑦= 𝑀𝑎𝑥𝑖𝑚𝑢𝑚 𝐴𝑙𝑙𝑜𝑤𝑒𝑑 𝑊𝑒𝑖𝑔ℎ𝑡 − (𝑇𝑟𝑎𝑐𝑡𝑜𝑟 𝑊𝑒𝑖𝑔ℎ𝑡 + 𝑇𝑟𝑎𝑖𝑙𝑒𝑟 𝑊𝑒𝑖𝑔ℎ𝑡+ 𝐹𝑢𝑒𝑙 𝑊𝑒𝑖𝑔ℎ𝑡)
Possible Risk
Because of a higher tare weight due to the electrical components and
components for the adjustable roof, customer may not accept less payload
capacity.
Not usable for high density cargo
Limited flexibility not only in terms of weight but also dimensions
Improvement of aerodynamics without losing load capacity
1 – TRANSPORT EFFICIENCY 1.5 – LOAD FACTOR
KPI Type Measurable
Measurement
Unit
Percentage
Interlinked to 1.1, 1.3 and 1.4
Description
The load factor is another measure of the efficiency of road transport, and is clearly
defined by the European Environment Agency under TERM 030 Indicator. The
higher the load factor, the fewer vehicle-km are needed to generate a given amount of tonne∙km. Fewer vehicle-km mean less traffic and hence less
congestion. In the EU, the average load factor of loaded heavy goods vehicles was
13.6 tonnes in 2010[3]. Similar to the situation with empty runs, international
transport operations appear to be more efficient than national ones and transport
for hire or reward is more efficient than own account transport. For a weight
utilization standpoint, load factor is expressed as a percentage of capacity in
tonnes, and is the ratio of the load to the total vehicle capacity.
However, when we look at light goods being shipped, volume factor plays a role,
and is the ratio of the load volume to the total carrying volume capacity of the
trailer. Thus, looking at these two parameters effective cargo height (ECH) and
Effective density makes a big difference. For loading, ECH can be enlarged with
double stock/floor systems or cargo height enlargers within the cargo load unit.

Public
605170 – D.1.2 – REPORT ON DEFINED KEY PERFORMANCE INDICATORS 14 / 32
Effective Cargo Height is defined as the sum of cargo height per level or sum of
stacked cargo the average load to total vehicle freight capacity, in tonnes or
volume. By developing a trailer-cargo concept that increases the “effective cargo
height” (ECH), so the filling can be load optimized (double stock, etc.) to reach a
better payload capacity.
European average load factor can be calculated by using the ratio tonne∙km per
vehicle∙km, an apparent increase in load factor can be explained by an actual
increase in load factor, a decrease in empty haulage or an increase in the weight
of goods of a given volume.
𝐶𝑎𝑟𝑔𝑜 𝐶𝑎𝑝𝑎𝑐𝑖𝑡𝑦 =𝐸𝑓𝑓𝑒𝑐𝑡𝑖𝑣𝑒 𝐶𝑎𝑟𝑔𝑜 𝐻𝑒𝑖𝑔ℎ𝑡
𝑂𝑟𝑖𝑔𝑖𝑛𝑎𝑙 𝐶𝑎𝑟𝑔𝑜 𝐻𝑒𝑖𝑔ℎ𝑡
Cargo Capacity increases if E𝑓𝑓𝑒𝑐𝑡𝑖𝑣𝑒 𝐶𝑎𝑟𝑔𝑜 𝐻𝑒𝑖𝑔ℎ𝑡 𝑖𝑠 𝑚𝑎𝑛𝑎𝑔𝑒𝑑 𝑡𝑜 50% 𝑜𝑓 𝑡ℎ𝑒 𝑝𝑎𝑦𝑙𝑜𝑎𝑑 – green line on graph
𝑂𝑟𝑖𝑔𝑖𝑛𝑎𝑙 𝐶𝑎𝑟𝑔𝑜 𝐻𝑒𝑖𝑔ℎ𝑡 = 𝐴𝑐𝑡𝑢𝑎𝑙 ℎ𝑒𝑖𝑔ℎ𝑡 𝑜𝑓 𝑡ℎ𝑒 𝑝𝑎𝑙𝑒𝑡𝑡𝑒 for a HOD trailer concept.
Proposed
Formula
Possible Risk
Decrease in loading performance
Load securing
Difficult handling
Possible overloading of trailer (axles)
Proposed
Presentation
Getting an optimum density for the cargo shipped is the responsibility of the
shipper, but the complexity in the number of goods and the demand patterns make
it difficult to always ship at an optimum load and volume factor. Given that this
cannot change, it would be useful to understand the impact on loading balancing
patters that can change for a hybrid on demand trailer vs standard trailer for
different density of goods and palette combinations.
Vehicle Configuration
Average Density of
Shipment
Load Factor
Vol. Factor
Drag Co-efficient
Effective cargo height = | No. of Palettes=
Effective cargo height = | No. of Palettes=
Effective cargo height = | No. of Palettes=
Effective cargo height = | No. of Palettes=
Public
605170 – D.1.2 – REPORT ON DEFINED KEY PERFORMANCE INDICATORS 15 / 32
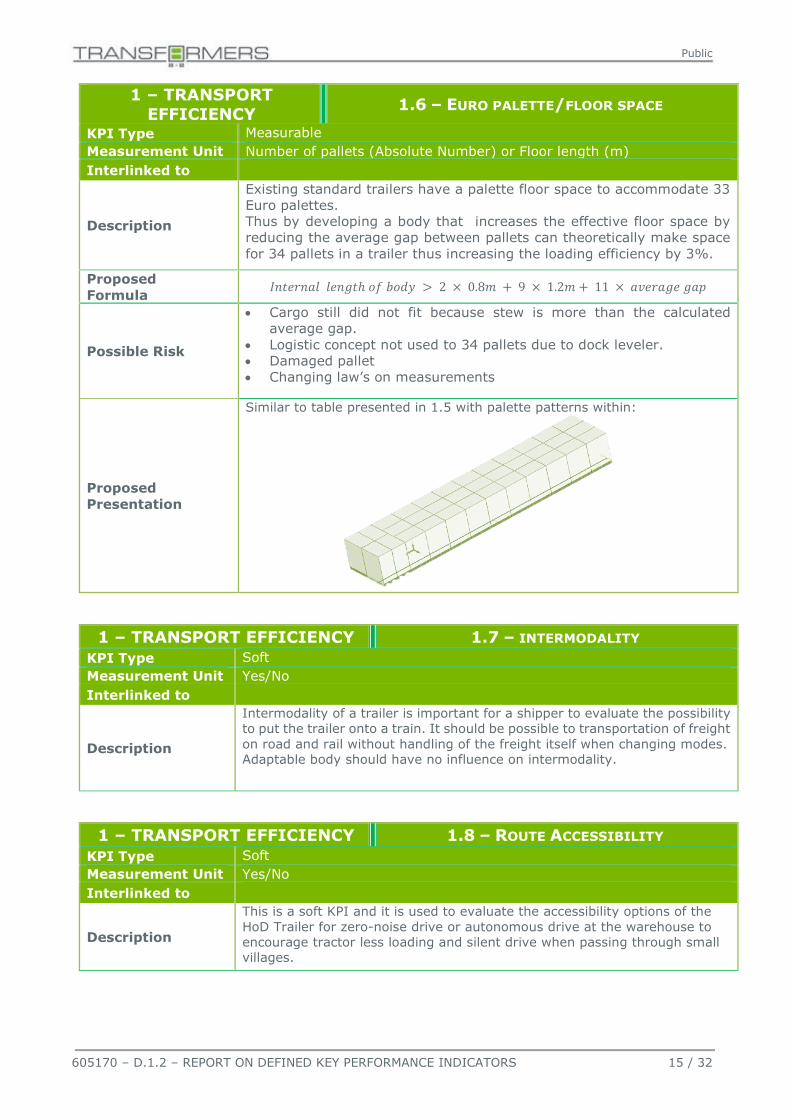
1 – TRANSPORT
EFFICIENCY 1.6 – EURO PALETTE/FLOOR SPACE
KPI Type Measurable
Measurement Unit Number of pallets (Absolute Number) or Floor length (m)
Interlinked to
Description
Existing standard trailers have a palette floor space to accommodate 33
Euro palettes.
Thus by developing a body that increases the effective floor space by
reducing the average gap between pallets can theoretically make space
for 34 pallets in a trailer thus increasing the loading efficiency by 3%.
Proposed
Formula 𝐼𝑛𝑡𝑒𝑟𝑛𝑎𝑙 𝑙𝑒𝑛𝑔𝑡ℎ 𝑜𝑓 𝑏𝑜𝑑𝑦 > 2 × 0.8𝑚 + 9 × 1.2𝑚 + 11 × 𝑎𝑣𝑒𝑟𝑎𝑔𝑒 𝑔𝑎𝑝
Possible Risk
Cargo still did not fit because stew is more than the calculated
average gap.
Logistic concept not used to 34 pallets due to dock leveler.
Damaged pallet
Changing law’s on measurements
Proposed
Presentation
Similar to table presented in 1.5 with palette patterns within:
1 – TRANSPORT EFFICIENCY 1.7 – INTERMODALITY
KPI Type Soft
Measurement Unit Yes/No
Interlinked to
Description
Intermodality of a trailer is important for a shipper to evaluate the possibility
to put the trailer onto a train. It should be possible to transportation of freight
on road and rail without handling of the freight itself when changing modes.
Adaptable body should have no influence on intermodality.
1 – TRANSPORT EFFICIENCY 1.8 – ROUTE ACCESSIBILITY
KPI Type Soft
Measurement Unit Yes/No
Interlinked to
Description
This is a soft KPI and it is used to evaluate the accessibility options of the
HoD Trailer for zero-noise drive or autonomous drive at the warehouse to
encourage tractor less loading and silent drive when passing through small
villages.
Public
605170 – D.1.2 – REPORT ON DEFINED KEY PERFORMANCE INDICATORS 16 / 32
1 – TRANSPORT EFFICIENCY 1.9 – AVERAGE HAULAGE SPEED
KPI Type Measurable
Measurement Unit Kilometers/hour for 100 kilometers
Interlinked to
Description
The average haulage speed can be defined as time taken to cover a particular
route over a specified transport profile. This defines the kilometers driven
over hours spent on the road, idle times excluded.
As stated in 1.2, the Transformers solution is expected to allow for a more
even vehicle speed without compromising fuel consumption performance. The
increased performance uphill could potentially increase average haulage
speeds.
Proposed
Formula 𝐴𝑣𝑒𝑟𝑎𝑔𝑒 𝑆𝑝𝑒𝑒𝑑 =
𝐷𝑖𝑠𝑡𝑎𝑛𝑐𝑒 𝐶𝑜𝑣𝑒𝑟𝑒𝑑 𝑖𝑛 𝐾𝑖𝑙𝑜𝑚𝑒𝑡𝑒𝑟𝑠
(𝑇𝑖𝑚𝑒 𝑇𝑎𝑘𝑒𝑛 − 𝐼𝑑𝑙𝑒 𝑇𝑖𝑚𝑒)𝑖𝑛 𝐻𝑜𝑢𝑟𝑠
3.2 Operational parameters
These parameters are linked to the operation of the vehicle and its impact on the transport company’s
economic health and shipper’s ability to utilize the vehicles capability completely. The operating costs
of the vehicle should not be higher than an average standard articulated combination. The loss of a
tonne in payload could lead to more trips to transport goods, possibly resulting in opposite effect on
environment and fuel consumption. Now, considering a Hybrid on Demand semi-trailer it is composed
of a standard trailer with an additional power system weighing around 1 tonne out of 40 tonnes,
resulting in reduction of load capacity. Ideally the payload capacity is around 24 tonnes for a 40-tonne
transport unit and 10 tonnes for N2 vehicles. It means that a loss of 1 tonne of load capacity ensures a
4% less fuel consumption, which translates as an annual fuel consumption of 40,320 liters for N3,
without using the electrical power to operate the transport unit. In other terms, the electric energy used
from the battery shall compensate the energy lost for carrying those tonnages – load capacity.
Considering 25 tonnes for 42,000 liters versus 24 tonnes (1 tonne battery loss of payloads), which
means without considering the energy used by batteries, that to carrying 24 tonnes of goods it will take
40,320 liters, which is a reduction of 4%.
The benefit of an additional electrically powered propulsion system can be used in urban transport,
because start/stop operation consumes a lot of energy, and this energy transfer could possibly be taken
by the electric drive in hybrid operations. On long haulage and a relatively flat route profile the benefit
will be less, meaning that the transport unit will carry 1 tonne of additional dead weight. However, if
we consider the use of batteries for the urban sector only, the amount saved through the 25% reduction,
will just pay the price of annual battery change or reduce the bill for it.
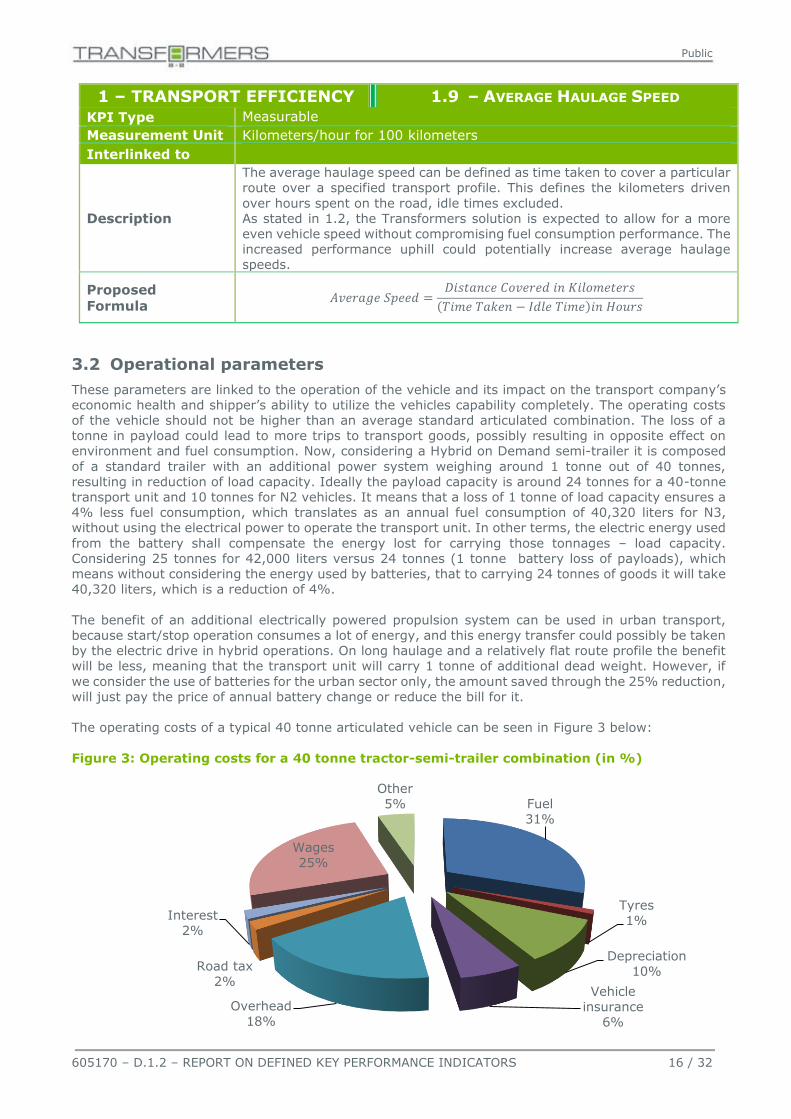
The operating costs of a typical 40 tonne articulated vehicle can be seen in Figure 3 below:
Figure 3: Operating costs for a 40 tonne tractor-semi-trailer combination (in %)
Fuel
31%
Tyres
1%
Depreciation
10%
Vehicle
insurance
6%
Overhead
18%
Road tax
2%
Interest
2%
Wages
25%
Other
5%

Public
605170 – D.1.2 – REPORT ON DEFINED KEY PERFORMANCE INDICATORS 17 / 32
The breakdown of these operating costs can vary from country to country, especially wages and fuel
costs. However, this graph shows that fuel represents a key cost factor and many other costs such as
tyres, overhead, depreciation and taxation are either directly or indirectly linked to the vehicle.
The parameters mentioned below have been classified as KPIs for operational parameters:
2 – OPERATIONAL
PARAMETERS 2.1 – TRAILER DEPRECIATION
KPI Type Soft
Measurement
Unit
Interlinked to
Description
It is very difficult to obtain detailed information on purchase prices of articulated
vehicles. On average, it can be assumed that the cost of a new vehicle is € 90,000
– 120,000. The calculation of the depreciation depends on many elements
including mileage and types of use and these elements contribute to influence
the second hand market. Every year a vehicle loses a percentage of its value:
34% after 1 year, 46% after two years, 55% after three years, 63% after 4
years, 67% after 5 years, 71% after 6 years, 75% after 7 years and 77% after
8 years. On average, vehicles are used for 7 years.
Transport operators have different approaches for dealing with the depreciation
of their vehicles, one being to declare the costs in their tax statement.
Investment in and depreciation of new vehicles also depends on the type of
contracts with clients. New investments in cleaner technology could have an
impact on these contracts or vise-versa. Contractual liabilities with a given client–
e.g. 10 year contract to carry goods for a company is not easy to change.
Normally, businesses purchasing a vehicle put the acquisition costs on their
books as a capital asset and tax law in many countries then permits the deduction
of acquisition costs from profits and therefore reduces income tax. In their overall
calculation, transport operators also factor in that new vehicles often have an
improved fuel saving performance compared to older vehicles, they pay lower
vehicle tax and infrastructure charges. Furthermore and in addition, large
transport operators have special deals with manufacturers offering them
considerable rebates on vehicles and special guarantee services. On the other
hand small transport companies who don’t have the purchasing power to buy a
new vehicle are in fact leasing the vehicle instead, which is an equally efficient
strategy to cope with vehicle depreciation and its influencing factors. Lastly, all
transport companies certainly intend to pass on running costs of a vehicle – which
should include the depreciation of the vehicle – to their clients.
Vehicle depreciation (in euro)
It is very likely that with a HoD trailer depreciation will be affected because of
120000
7920064800
5400044400
3960034800
30000
Year

Public
605170 – D.1.2 – REPORT ON DEFINED KEY PERFORMANCE INDICATORS 18 / 32
the additional electrical (HoD) and movable (roof) components. However it would
be advantageous if the salvage and depreciation on a straight line basis could be
calculated or assessed within the project once the additional costs and the
depreciation of the electrical components, etc. are identified and known.
Proposed
Formula 𝐷𝑒𝑝𝑟𝑒𝑐𝑖𝑎𝑡𝑖𝑜𝑛 =
𝐶𝑜𝑠𝑡 − 𝑆𝑎𝑙𝑣𝑎𝑔𝑒 𝑉𝑎𝑙𝑢𝑒
𝐿𝑖𝑓𝑒 𝑖𝑛 𝑁𝑢𝑚𝑏𝑒𝑟 𝑜𝑓 𝑃𝑒𝑟𝑖𝑜𝑑𝑠
2 – OPERATIONAL PARAMETERS 2.2 – IMPACT ON TYRE LIFETIME
KPI Type Soft
Measurement Unit
Interlinked to
Description
It is believed that the operating lifetime of the tyre will be affected because
of the HoD and the driven axle and on the circumstances the vehicle is driven
in. It would be interesting to study the influence of a HoD within a trailer
based on the distance which will be driven during the project. However it
won´t be enough to make a clear statement to the tyre lifetime.
2 – OPERATIONAL PARAMETERS 2.3 – TRAILER MAINTENANCE COST/KM
KPI Type Soft
Measurement Unit
Interlinked to
Description
As a general rule of thumb, moving parts relate to more maintenance. How
will the trailer maintenance cost be affected because of the additional
electrical (HoD) and movable (roof) components? Could the benefits in
savings be justified for increase in maintenance costs?
Proposed
Formula 𝑃𝑟𝑜𝑏𝑎𝑏𝑖𝑙𝑖𝑡𝑦 𝑜𝑓 𝐵𝑟𝑒𝑎𝑘𝑑𝑜𝑤𝑛 × 𝑁𝑢𝑚𝑏𝑒𝑟 𝑜𝑓 𝑀𝑜𝑣𝑖𝑛𝑔 𝑃𝑎𝑟𝑡𝑠 × 𝑇𝑖𝑚𝑒
Possible Risk
It is believed that the maintenance costs of the additional electrical and
movable components can´t be assessed during the project. The lifetime of
the electrical components in this use case isn´t known already.
Parameters like motor is not of optimal power used, fixed gear (loss of power,
high speed, so greater wear) can also impact the maintenance cost.
2 – OPERATIONAL PARAMETERS 2.4 – TRAILER MAINTENANCE
INFRASTRUCTURE KPI Type Soft
Measurement Unit
Interlinked to
Description
With a Hybrid on Demand Trailers could it be imperative for training truck
service center to maintain driven axle could be needed? The trailer
maintenance infrastructure is given. They have to be trained to handle the electrical components (high voltage knowledge) and the driven axle.

Public
605170 – D.1.2 – REPORT ON DEFINED KEY PERFORMANCE INDICATORS 19 / 32
2 – OPERATIONAL PARAMETERS 2.5 – SPARE PARTS
KPI Type Soft
Measurement Unit
Interlinked to
Description
Use of standard parts helps boost the availability and affordability of spare
parts to keep the service levels of the tractor-trailer configuration.
The infrastructure to buy spare parts is given. The spare parts for the HoD,
the movable roof and aerodynamic measures have to be integrated into the
spare part management. It should be considered that the components used
be:
Delivered from stock
Supplied all over Europe within 48 hours
2 – OPERATIONAL PARAMETERS 2.6 – TRAILER TARE WEIGHT
KPI Type Measurable
Measurement Unit Tonne, Percentage Change
Interlinked to
Description
Tare weight as low as possible, defined to get good knowledge of usable cargo
for the different options. However, it is clear that the tare weight of the
transformers trailer will be higher than the tare weight of a comparable
standard trailer because of the additional weight of the driven axle, EMG,
battery, movable roof components etc. However it will be useful to know the
percentage change in weight and the loss in payload capacity through this
KPI. This will be useful to understand the dynamics in efficiency, cost and
benefit analysis.
Proposed
Formula
Difference between tare weight of a comparable standard trailer and a
transformers trailer
𝑇𝑎𝑟𝑒 𝑤𝑒𝑖𝑔ℎ𝑡 𝑖𝑠 𝑤𝑒𝑖𝑔ℎ𝑡 𝑏𝑎𝑠𝑒 𝑡𝑟𝑎𝑖𝑙𝑒𝑟 + 𝑜𝑝𝑡𝑖𝑜𝑛 𝐻𝑜𝐷
+ 𝑜𝑝𝑡𝑖𝑜𝑛 𝐴𝑒𝑟𝑜𝑑𝑦𝑛𝑎𝑚𝑖𝑐 𝑚𝑒𝑎𝑠𝑢𝑟𝑒𝑠 + 𝑜𝑝𝑡𝑖𝑜𝑛 𝑎𝑑𝑎𝑝𝑎𝑡𝑏𝑎𝑙𝑒 𝑏𝑜𝑑𝑦+ 𝑜𝑝𝑡𝑖𝑜𝑛 𝑚𝑜𝑣𝑎𝑏𝑙𝑒 𝑟𝑜𝑜𝑓 + 𝑜𝑝𝑡𝑖𝑜𝑛 𝑑𝑜𝑢𝑏𝑙𝑒 𝑠𝑡𝑜𝑐𝑘 𝑠𝑜𝑙𝑢𝑡𝑖𝑜𝑛.
2 – OPERATIONAL PARAMETERS 2.7 – COMBINATION TARE WEIGHT
KPI Type Measurable
Measurement Unit
Interlinked to 2.6
2 – OPERATIONAL PARAMETERS 2.8 – COMPATIBILITY WITH DIFFERENT
TRACTORS KPI Type Soft
Measurement Unit
Interlinked to
Description
Variability in different types of tractors is seen. Would it be advantageous if
a tractor manufactured in 2004 be used to pull a hybrid on demand trailer?
What are the modifications a transport service provider has to make to his
trailer to make it compatible to an old tractor? At what costs does this come?
And does it complicate the existing system?

Public
605170 – D.1.2 – REPORT ON DEFINED KEY PERFORMANCE INDICATORS 20 / 32
3.3 Vehicle Uptime
The uptime of a vehicle determines the costs and lost revenues from the downtime an automobile
suffers due to faults and breakdown in the system. The opposite of uptime is downtime.
There are three categories of downtime:
1. Planned service and repairs: required services and repairs that are planned, together with
the customer, to fit the customer's operation as well as possible.
2. Unplanned repairs: repairs that require service within days. The repair itself cannot be
avoided, but the time spent away from operation can be minimized.
3. Breakdowns: includes major breakdowns that require towing to a workshop and minor
breakdowns that can be resolved on the road. The number of breakdowns can be minimized to
save time and money.
Optimization of uptime is done in three steps:
1. Minimize the effect of breakdowns by reducing or removing both time and repair cost. Discuss
how this can be realized.
2. Move time for unplanned repairs to planned repairs. The repair cost will remain, but the time
away from operation can most likely be reduced.
3. Discuss if it is possible to plan the services and repairs outside of the customer's operation time.
The possibilities to realize this vary greatly between different workshops and countries.
Knowing tractor-trailer combinations are systems that undergo repairs and the frequency of the repairs
depend on how well they are used and the conditions they are operated in. The combination also consists
of several non-repairable parts. For a conventional tractor it has been observed that the cost for service
and repairs is on average around five percent of an operator's costs. Typically breakdowns and
unplanned repairs are more expensive to the operator than the planned services and repairs.
Now comparing Hybrid on Demand trailers to the existing trailer configurations available in the market,
these trailer configurations do not have additional propulsion system making it clear that its uptime is
also important for the end users. According to surveys, operators state that the 'un-measurable' effect
of unplanned downtime on their long-term customer relationships and reputation, as well as the
disruption to their daily business, is worse than the actual cost of the isolated incident.
Possible performance areas that have been recommended are as follows:
3 – VEHICLE UPTIME 3.1 – COMBINATION UPTIME PERFORMANCE
KPI Type Soft/Measurable
Measurement Unit
Interlinked to
Description
It is expected that the adjustable truck roof deflector would probably not
contribute to a reduction of uptime, only a decrease in performance in case
of failure. Presence of easily exchangeable service parts contribute to better
uptime.
From an OEM perspective, it could be reasoned that the uptime performance
of the tractor unit will not be significantly affected by the Case A
Transformers solution. What should be mentioned here is also that in case
of a trailer driveline related failure, the vehicle combination as a whole will
be able to fulfill its mission, but at a decreased performance level.
The wear of components is not expected to change significantly either,
although fewer gear shifts and reduced usage of truck retarder could
contribute positively for the uptime.
Proposed
Formula
By analyzing failure data of several components commonly used in tractor
trailer combinations, this information can be in the reliability framework.
Possible evaluations can be done by applying Survival Analysis or Weibull
distribution for reliability characterization.
Possible Risk
Non availability of data to perform a study and develop an accurate
understanding, since uptime performance of the new components would
not be investigated within the scope of project.
Public
605170 – D.1.2 – REPORT ON DEFINED KEY PERFORMANCE INDICATORS 21 / 32
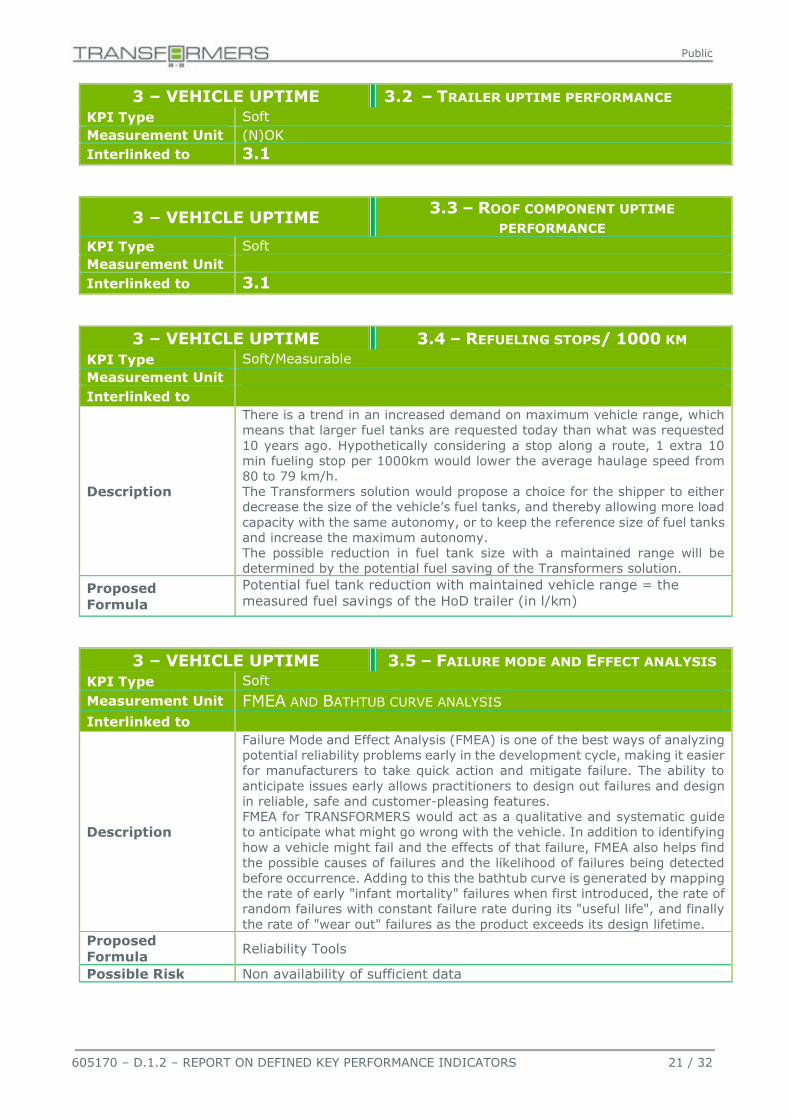
3 – VEHICLE UPTIME 3.2 – TRAILER UPTIME PERFORMANCE
KPI Type Soft
Measurement Unit (N)OK
Interlinked to 3.1
3 – VEHICLE UPTIME 3.3 – ROOF COMPONENT UPTIME
PERFORMANCE KPI Type Soft
Measurement Unit
Interlinked to 3.1
3 – VEHICLE UPTIME 3.4 – REFUELING STOPS/ 1000 KM
KPI Type Soft/Measurable
Measurement Unit
Interlinked to
Description
There is a trend in an increased demand on maximum vehicle range, which
means that larger fuel tanks are requested today than what was requested
10 years ago. Hypothetically considering a stop along a route, 1 extra 10
min fueling stop per 1000km would lower the average haulage speed from
80 to 79 km/h.
The Transformers solution would propose a choice for the shipper to either
decrease the size of the vehicle’s fuel tanks, and thereby allowing more load
capacity with the same autonomy, or to keep the reference size of fuel tanks
and increase the maximum autonomy.
The possible reduction in fuel tank size with a maintained range will be
determined by the potential fuel saving of the Transformers solution.
Proposed
Formula
Potential fuel tank reduction with maintained vehicle range = the
measured fuel savings of the HoD trailer (in l/km)
3 – VEHICLE UPTIME 3.5 – FAILURE MODE AND EFFECT ANALYSIS
KPI Type Soft
Measurement Unit FMEA AND BATHTUB CURVE ANALYSIS
Interlinked to
Description
Failure Mode and Effect Analysis (FMEA) is one of the best ways of analyzing
potential reliability problems early in the development cycle, making it easier
for manufacturers to take quick action and mitigate failure. The ability to
anticipate issues early allows practitioners to design out failures and design
in reliable, safe and customer-pleasing features.
FMEA for TRANSFORMERS would act as a qualitative and systematic guide
to anticipate what might go wrong with the vehicle. In addition to identifying
how a vehicle might fail and the effects of that failure, FMEA also helps find
the possible causes of failures and the likelihood of failures being detected
before occurrence. Adding to this the bathtub curve is generated by mapping
the rate of early "infant mortality" failures when first introduced, the rate of
random failures with constant failure rate during its "useful life", and finally
the rate of "wear out" failures as the product exceeds its design lifetime.
Proposed
Formula Reliability Tools
Possible Risk Non availability of sufficient data

Public
605170 – D.1.2 – REPORT ON DEFINED KEY PERFORMANCE INDICATORS 22 / 32
Proposed
Visualization
The analysis must possibly describe a particular form of the hazard function
which comprises three parts:
The first part is a decreasing failure rate, known as early failures.
The second part is a constant failure rate, known as random failures.
The third part is an increasing failure rate, known as wear-out failures.
The name is derived from the cross-sectional shape of a bathtub
3.4 Loading parameters
A vehicle is generally loaded at the shipper’s plant for loading and the consignee’s plant for unloading.
Faster and optimal loading and unloading is advantageous in many aspects. It would also be greatly
useful if the HoD trailer could self-diagnose improper loading as improper loading can cause one side
of a truck or trailer to carry a greater percentage of the load. It can affect starting from standstill,
causing the drive wheels to slip on the lighter side and wear either side of an axle. Although the gross
load may not be excessive, one wheel, one axle, or one side of the truck may be overloaded because
of improper distribution of the load.
From an end user perspective hybrid on demand (semi)trailer should possibly contribute to:
Increased throughput at the (un)loading docks, by ease of loading
Quicker pallet loading and extraction from the trailer
Adoptable for both manual and automated processes
Electrical components must be away from damage due to loading
Loading Capacity
Load securing contributing to ‘Perfect Order’ metrics
4 – LOADING PARAMETERS 4.1 – COMPATIBILITY FOR AUTOMATIC AND
MANUAL LOADING KPI Type Soft
Measurement Unit
Interlinked to
Description
With automation initiative taking place at many warehouses, it would be
interesting to understand if TRANSFORMERS design for trailers could
work well for both manually loaded trailers and automatically loaded
trailers.
Proposed
Formula Qualitative measure
4 – LOADING PARAMETERS 4.2 – (UN)LOADING PERFORMANCE
KPI Type Measurable
Measurement Unit (N)OK
Interlinked to 1.2

Public
605170 – D.1.2 – REPORT ON DEFINED KEY PERFORMANCE INDICATORS 23 / 32
Description
Loading and unloading performance is determined by the time which is
needed to load or unload the trailer at the dock. It is not only a trailer related
topic, but a logistic topic.
Better loading and unloading performance results in shorter standing times at the docks ⇒ less waiting time and perhaps less trailers needed for the same
amount of goods which in turn results in less turnarounds. End users could
benefit by faster loading and unloading cycles as well, since the time for the
movement of goods out of the trailer from the docks to the warehouse could
be shortened.
Proposed
Formula
Time reduction for (un)loading process
Conversion from time to efficiency Loading of cargo not influenced by double stock or movable roof systems.
Time to set double stock calculated and planned
Possible Risk Break down of components
Damage caused by docking (rear door)
4 – LOADING PARAMETERS 4.3 – (UN)LOADING SAFETY
KPI Type Soft
Measurement Unit (n)ok
Interlinked to 5
Description
A higher safety during (un)loading leads to less accidents at docks, fewer
accidents, less downtimes at docks, etc. Health and safety aspects have to
be fulfilled like today. Accident prevention regulation has to be considered. It
is essential that movable parts are always secured when operators are busy
(un)loading
Proposed
Formula Qualitative measure
Possible Risk Secure fails due to damage
No maintenance done
4 – LOADING PARAMETERS 4.4 – COMPONENT SAFETY DURING
(UN)LOADING KPI Type Soft
Measurement Unit
Interlinked to 3.5
Description
It is essential that the cubical feature of the trailer is maintained such that it
does not interfere with the normal operations of loading and unloading, and
that there is no scope for damage of components during such operation.
However due to design constraints if an optimization component happens to
be within the trailer, it is necessary to understand where it is placed and
how it interferes with the efficiency of loading and unloading. Also how
prone it is when hit by a forklift by accident and what does it mean to a
trailer operation.
Proposed
Formula Qualitative measure - CE approval
Possible Risk Damage by forklift
Cargo not secured on pallet
4 – LOADING PARAMETERS 4.5 – LOAD SECURING
KPI Type Soft
Measurement Unit
Interlinked to

Public
605170 – D.1.2 – REPORT ON DEFINED KEY PERFORMANCE INDICATORS 24 / 32
Description
Securing of the goods during the transport with a trailer results in lower
damages of the goods result in higher transport efficiency, thus contributing
to end users perfect order metrics. The load securing must be possible
according existing standards and EU guidelines.
Proposed
Formula
The standards adopted are -
VSI 2700 ff
EN 12195
EN 12642 EN12642 XL
3.5 Safety
As highlighted in Deliverable 1.1, improved safety leads to improved productivity and employee
wellbeing, as accidents cause injury and emotional distress, which cannot be measured financially,
accidents affect the bottom line of transport operators as well; emotional argumentation is likely to be
persuasive. Customers know that the occurrence of just one accident will have a serious effect on lives,
business and reputation. Thus, it just makes good sense to minimize the risk. Safety features included
in a vehicle can be classified into two broad categories:
1. Reduce risk of having an accident (Active safety)
2. Minimize consequence of an accident (Passive safety)
Studies show that safety is very important to many operators, particularly in countries where accidents
are common, or where social responsibility and/or image and reputation are highly regarded. As a
general rule the safety and limitations can be connected to the vehicle uptime. Possible key evaluation
in this area is:
5 – SAFETY 5.1 – ACCELERATION, RETARDATION AND
COMPLETE STOP PERFORMANCE KPI Type Measureable
Measurement Unit meters/second2
Interlinked to
Description
The HoD-trailer is able to help the tractor-trailer combination during
acceleration, by providing tractive torque to one of the trailer axles. For
equal acceleration performance (compared to standard tractor/trailer)
this will relieve the tractor from (peak) power request. This will reduce
the fuel consumption and emission of the engine, due to a more average
power request. For steady-state operation (zero acceleration) the HoD
trailer may also assist with additional tractive power, for example during
hill-climbs. This will also relieve to the tractor ICE from power requests.
For retardation and complete stop, the electric motor in the HoD-trailer
will be operated in “regeneration” mode, meaning that power is
transferred to and collected in the battery. The braking performance is
not affected due to the use of a brake-blending capable intelligent brake
system on the trailer. Acceleration, retardation and complete stop performance should be at least
state of the art (tests not part of the project) fulfilling all the necessary legal
requirements.
Proposed
Formula
𝑣 = 𝑎 × 𝑡
𝑣 = 𝑠𝑝𝑒𝑒𝑑
𝑎 = 𝑎𝑐𝑐𝑒𝑙𝑒𝑟𝑎𝑡𝑖𝑜𝑛
𝑡 = 𝑡𝑖𝑚𝑒

Public
605170 – D.1.2 – REPORT ON DEFINED KEY PERFORMANCE INDICATORS 25 / 32
Possible Risk
There is no risk with regard to safety. If the HoD trailer cannot provide
adequate tractive or braking torque due to battery status (because of
excessive power demands or because the battery is (running towards)
empty or full), then the tractor-trailer combination resembles a “normal”
(conventional) combination, with corresponding conventional (drive &
brake) performance.
Possible risk relates to gearbox/ICE control. If additional (positive or
negative) torque is coming from HoD trailer, the gearbox may think it is
driving down or up a hill, and may choose a wrong gear. Especially when
releasing or applying HoD power suddenly this may result in unexpected
behavior. In worst case, the engine may stall, however the risk is
considered to be negligible.
5 – SAFETY 5.2 – BREAKDOWN OF CONTROL SYSTEM
KPI Type Soft
Measurement Unit
Interlinked to 3.5
5 – SAFETY 5.3 – TRAILER COMPONENT SECURITY
KPI Type Soft
Measurement Unit
Interlinked to
Description
How is high value components protected? This has to be considered in the
design. Some basic measures would be to secure the battery compartment
with lock and keys and alarm enabled inside the cabin to alert the sleeping
driver.
Proposed
Formula Qualitative Parameter
5 – SAFETY 5.4 – POWER SYSTEM LOADING AND
UNLOADING KPI Type Soft
Measurement Unit
Interlinked to
Description
If lithium ion batteries are chosen they may have to be replaced, if VRLA
batteries have been chosen they may have to be maintained. How will the
trailer be designed to ensure safer loading and unloading of the heavy
battery? Similarly the question can be raised for the power converters,
electrical motor/generator set and the dynamic system that controls the
moving parts.
Proposed
Formula Qualitative Measurement
5 – SAFETY 5.5 – COMPONENT OVERHEATING
KPI Type Soft
Measurement Unit
Interlinked to

Public
605170 – D.1.2 – REPORT ON DEFINED KEY PERFORMANCE INDICATORS 26 / 32
Description
System design has to make sure that the heat won´t affect the cargo
Temperature sensor to detect actual temperature during testing to derive
possible future measures if necessary
Component can be covered with heat shields if necessary.
Proposed
Formula Qualitative Measure
5 – SAFETY 5.6 – ELECTRIC SHOCK AND SPARK HAZARD
KPI Type Soft
Measurement Unit
Interlinked to
Description
This is a design parameter on what are the risks untrained personnel face
while dealing with the electrical components in the trailer during routine
checkup, repair and maintenance.
Proposed
Formula ISO/TC 22 Road vehicles
5 – SAFETY 5.7 – BATTERY HEAT AND GAS EMISSIONS VS.
TRAILER AMBIENCE KPI Type Measurable
Measurement Unit Internal Temperature
Interlinked to
Description
Transport vehicles today have their engine and emission away from the
goods. With a trailer design that includes an auxiliary drive and a power
system close to the shipment, it is essential to understand what impact such
a design would have?
Proposed
Formula
Heat – Quantitative
Gas Emission – Qualitative
3.6 Driver Comfort
Attracting and keeping good drivers requires more than just a reliable and comfortable truck. It is also
about management, culture, working conditions, and remuneration. Finding, keeping and looking after
the best drivers are key challenges for most long haul operators.
Drivers affect the profitability of a business in three ways.
1. Driver performance: A good driver performs more efficiently than an average one.
2. Occupational Health & Safety (OH&S): Costs related to sick days and workplace adjustments.
3. Driver turnover: Costs related to training and recruitment and lost income when trucks are idle.
Studies show that the combination of good performing drivers, low driver turnover and minimal OH&S
issues can significantly boost an operator's business. If HoDd could offer the world's best driving
experience, it will greatly boost transport operators profile to attract and retain the best drivers.
Keeping the above factors in mind, driver comfort is important for both end-users and transport service
providers. The following performance metrics have been identified when it comes to evaluating their
comfort with respect to tractor-trailer configuration:

Public
605170 – D.1.2 – REPORT ON DEFINED KEY PERFORMANCE INDICATORS 27 / 32
6 – DRIVER COMFORT 6.1 – CABIN COMFORT
KPI Type Soft
Measurement Unit
Interlinked to 1.3
Description
For long haul transportation the cabin comfort is very important soft fact
for the driver. The cabin comfort can also be divided into working comfort
and resting comfort. The resting comfort is of high importance for mainly
long haul applications, while the working comfort is of equal importance
regardless of long haul or regional distribution missions. If we are to
recommend the Transformers solution for different transport scenarios, we
should emphasize that working comfort should not be compromised in any
case, but the need for resting comfort is different depending on task.
It is also important to mention that the resting comfort is only relevant at
standstills, while the working comfort is relevant also when the truck is in
motion. This means that adaptable solutions should focus on working
comfort while in motion, and resting comfort during standstills.
Factors that will influence the individual comfort in the cabin are the
available space, area to rest and standing height for the driver.
Proposed
Formula
Qualitative Measure
As for the climate comfort, it will not be tested in this project, and we
think it would be rather difficult to do any meaningful simulations. It
would be possible however to write a few lines explaining why the
impact on climate comfort for case A will be minimal, close to none.
For case B together with a power connection, it is likely that a future
truck will have more electrified climate function
6 – DRIVER COMFORT 6.2 – DRIVING EASE
KPI Type Soft
Measurement Unit
Interlinked to 6.1
Description
Existing driver assistance systems (like telematic functions or the
automated gear shift) that provide the driver with helpful support to make
his/her working environment more comfortable. They also help large fleet
operators monitor driving habits and possibly help customize insurance
costs linked to driving habits.
Now, in Transformers with adaptable aerodynamic features, auxiliary drive
power from the trailer, the experience of driving would be completely
different than the present state of the art road transport system. Will
controlling all these additional systems add stress to the driver or will these
systems adapt itself automatically once the vehicle is set in motion?
The Transformers solution should not provide the driver with additional
work load and needs of learning new complicated ways of operating and
driving the vehicle, but rather a seamless, integrated solution
Proposed
Formula Qualitative Measure
6 – DRIVER COMFORT 6.4 – EMERGENCY REPAIRS
KPI Type Soft
Measurement Unit
Interlinked to 3

Public
605170 – D.1.2 – REPORT ON DEFINED KEY PERFORMANCE INDICATORS 28 / 32
Description
As discussed in “Vehicle Uptime” pillar, tractor-(semi)trailer systems are
systems that are subject to breakdowns and repairs. The following
performance metric deals with system complexity design to get the
vehicle up and running, in a similar fashion of that of replacing a flat tyre.
What are the additional spares does the driver need to carry? Will
important parameters of the truck be monitored by a digital screen or an
analog diagnosis needs to be done?
Proposed
Formula Qualitative Measure
6 – DRIVER COMFORT 6.5 – (UN)LOADING/DOCKING EASE
KPI Type Soft
Measurement Unit (not)ok
Interlinked to 1.4 AND 4
Description
When a trailer drops a shipment or is loaded with goods, the following
actions are affirmative:
Docking -> Loading -> Undocking -> Docking -> Unloading -> Undocking
With moving roof, what are the adjustments the driver make to Trailer must
be positioned on dock? Would special tools or handling from driver for
closing, securing of vehicle be required? Are those systems easy to operate
and understand?
No negative influence on the (un)loading / docking ease for the driver
should occur.
- Decreased waiting/standing time at the docks
Proposed
Formula Qualitative Measure

Public
605170 – D.1.2 – REPORT ON DEFINED KEY PERFORMANCE INDICATORS 29 / 32
4 Challenges
New opportunities and technologies allow modern vehicles to be more efficient and advanced from a
design point of view. However, the purpose of the project is not to create an innovative truck that
nobody will be able to use. This may be caused by either legal restrictions or simply reluctance to invest
or to lose (even if minor) load capacity.
Possible benefits vs. challenges:
Possible Benefits Possible Challenges Lower emissions Higher operating costs
Lower fuel consumption Reduced overall vehicle capacity
Higher load factor Lower transport rates
Fewer vehicles on the road Slow market uptake
Sum: Which way is higher? Can they be compensated by incentives.
Which incentives could be considered?

Public
605170 – D.1.2 – REPORT ON DEFINED KEY PERFORMANCE INDICATORS 30 / 32
5 Epilogue
Future configurable and adaptable truck-(semi)trailers combinations need to be a viable alternative to
existing combinations that are on the market today. The new combinations need to be attractive and
efficient from an environmental, energy, operational and a logistics point of view. Furthermore, they
must comply with the needs and expectations of logistics providers and end users, with the regulations
and be able to operate on the existing road and multimodal infrastructure network. The above-
mentioned KPIs serve as a basis for further development of works leading to the creation of a
Transformers truck.
Summarizing, it is important to ensure that there will be no loss of load capacity in terms of weight or
volume as compared to a current average standard articulated combination, i.e. a compensation for the
tonne lost to batteries needs to be found. It must be designed such that there are reduced complications
during loading and unloading operations. Moreover, the reduction of 25% of fuel consumption compared
to the average standard articulated vehicle is feasible (Empty is 22l/100km, full 28 l/100km). Lastly,
the operational costs of the vehicle should not be higher than an average standard articulated
combination.
No compliance with the above-stated points may lead to a creation of an innovative solution in freight
transport which will not find its application in practice.
As next steps, there will be case scenarios chosen to further investigate the functionalities and efficiency
of the Transformers truck (Deliverable 1.3 – Report on defined Scenarios and test cases).

Public
605170 – D.1.2 – REPORT ON DEFINED KEY PERFORMANCE INDICATORS 31 / 32
6 References
TRANSFORMERS - Deliverable D1.1
Goodyear Dunlop - Driving fleet fuel efficiency: The Road to 2020, January 2012.
European Commission DG for Mobility and Transport Unit D.3 – Land transport - Road Freight Transport
Vademecum 2010 Report Market trends and structure of the road haulage sector in the EU in 2010
September 2011
Hirz, M. and Stadler, S., "A New Approach for the Reduction of Aerodynamic Drag of Long-Distance
Transportation Vehicles," SAE Int. J. Commer. Veh. 6(2):453-458, 2013, doi:10.4271/2013-01-2414.

Public
605170 – D.1.2 – REPORT ON DEFINED KEY PERFORMANCE INDICATORS 32 / 32
Acknowledgment
This project has received funding from the European Union’s Seventh Framework Programme for research; technological development and demonstration under grant agreement no 605170.
http://cordis.europa.eu/fp7/cooperation/home_en.html
http://ec.europa.eu
PROJECT PARTICIPANTS:
VOLVO VOLVO TECHNOLOGY AB
BOSCH ROBERT BOSCH GMBH
DAF DAF TRUCKS NV
DAI DAIMLER AG
FEHRL FORUM DES LABORATOIRES NATIONAUX EUROPEENS DE RECHERCHE ROUTIERE
FHG FRAUNHOFER-GESELLSCHAFT ZUR FOERDERUNG DER ANGEWANDTEN FORSCHUNG E.V
IFSTTAR INSTITUT FRANCAIS DES SCIENCES ET TECHNOLOGIES DES TRANSPORTS, DE
L'AMENAGEMENT ET DES RESEAUX
IRU IRU PROJECTS ASBL
P&G PROCTER & GAMBLE SERVICES COMPANY NV
SCB SCHMITZ CARGOBULL AG
TNO NEDERLANDSE ORGANISATIE VOOR TOEGEPAST NATUURWETENSCHAPPELIJK ONDERZOEK
UNR UNIRESEARCH BV
VEG VAN ECK BEESD BV
VIF KOMPETENZZENTRUM - DAS VIRTUELLE FAHRZEUG, FORSCHUNGSGESELLSCHAFT MBH
DISCLAIMER
The FP7 project has been made possible by a financial contribution by the European Commission under Framework Programme 7. The Publication as provided reflects only the authors’ view. Every effort has been made to ensure complete and accurate information concerning this document.
However, the author(s) and members of the consortium cannot be held legally responsible for any mistake in printing or faulty instructions. The authors and consortium members retrieve the right not to be responsible for the topicality, correctness, completeness or quality of the information provided. Liability claims regarding damage caused by the use of any information provided, including any kind of information that is incomplete or incorrect, will therefore be rejected. The information contained on this website is based on author’s experience and on information received from the project partners.
Related Documents