Title & Outline Development of a Sediment Transport Model for the Chesapeake Bay: Supporting Physical Data from VIMS Potomac River Intensive Surveys with Emphasis on LISST Suspended Particle Size Grace M. Cartwright and Carl T. Friedrichs Virginia Institute of Marine Science OUTLINE: 1. Draft Data Report 2. Preliminary Trends from Particle

Title & Outline
Jan 14, 2016
Title & Outline. Development of a Sediment Transport Model for the Chesapeake Bay: Supporting Physical Data from VIMS Potomac River Intensive Surveys with Emphasis on LISST Suspended Particle Size Grace M. Cartwright and Carl T. Friedrichs Virginia Institute of Marine Science OUTLINE: - PowerPoint PPT Presentation
Welcome message from author
This document is posted to help you gain knowledge. Please leave a comment to let me know what you think about it! Share it to your friends and learn new things together.
Transcript

Title & OutlineDevelopment of a Sediment Transport Model for the
Chesapeake Bay:
Supporting Physical Data from VIMS Potomac River Intensive Surveys with Emphasis on LISST
Suspended Particle Size
Grace M. Cartwright and Carl T. FriedrichsVirginia Institute of Marine Science
OUTLINE:
1. Draft Data Report
2. Preliminary Trends from Particle Size Analysis
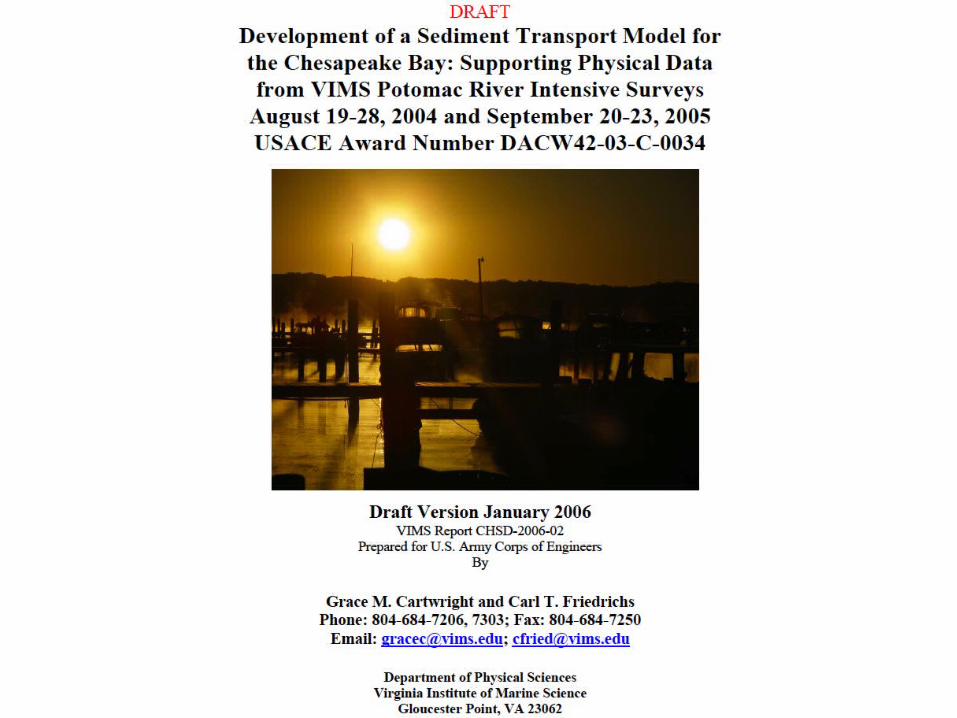
Report cover

Station locations
General station locations along
Potomac
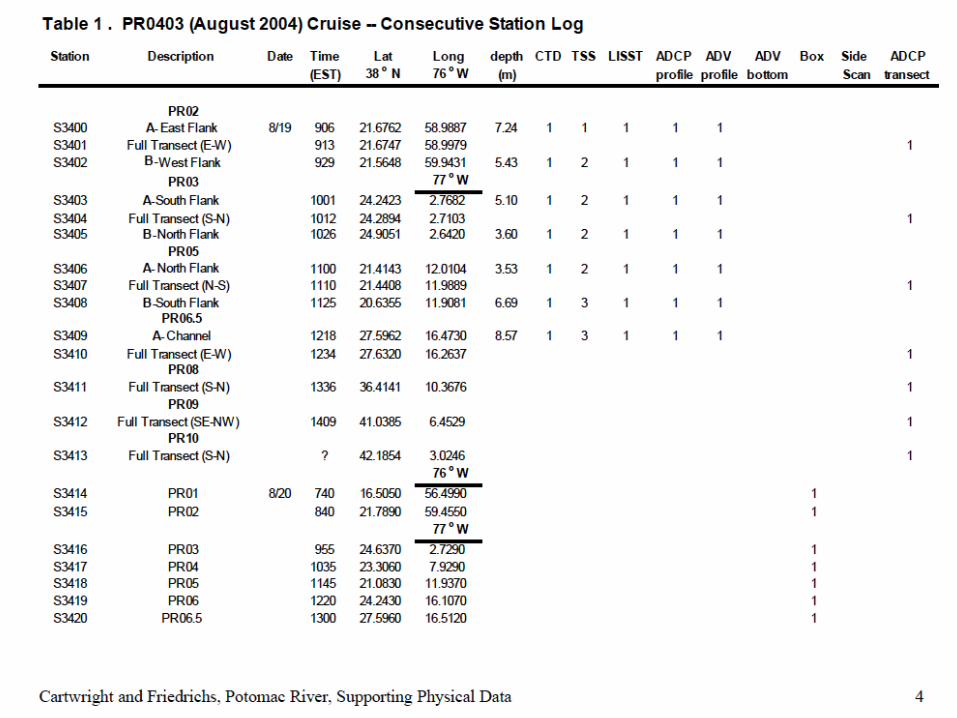
Table 1
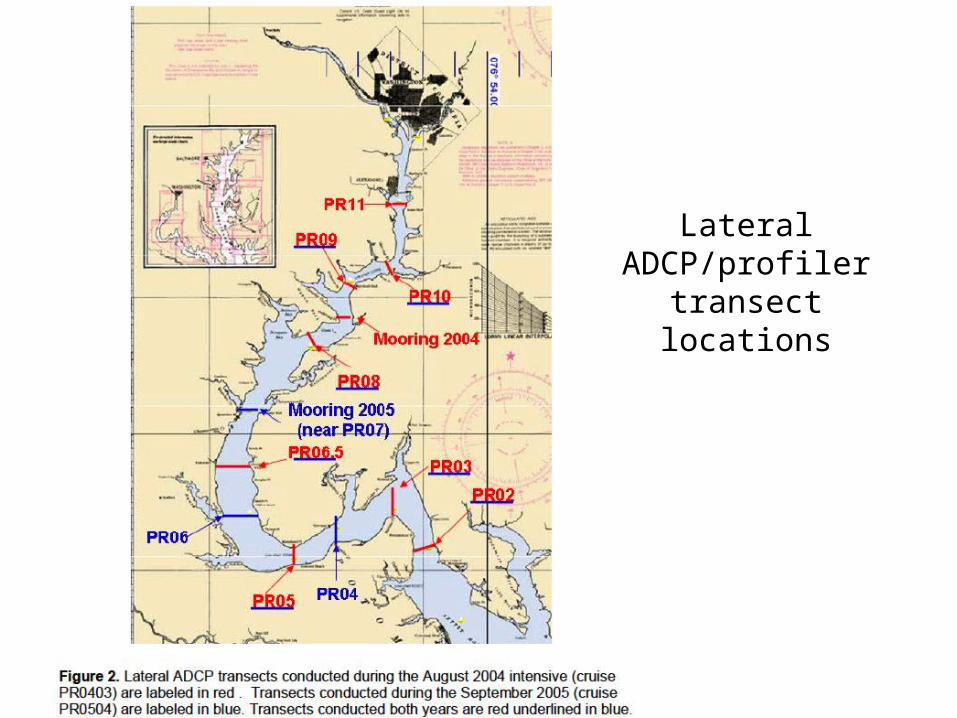
Transects map
Lateral ADCP/profiler transect locations
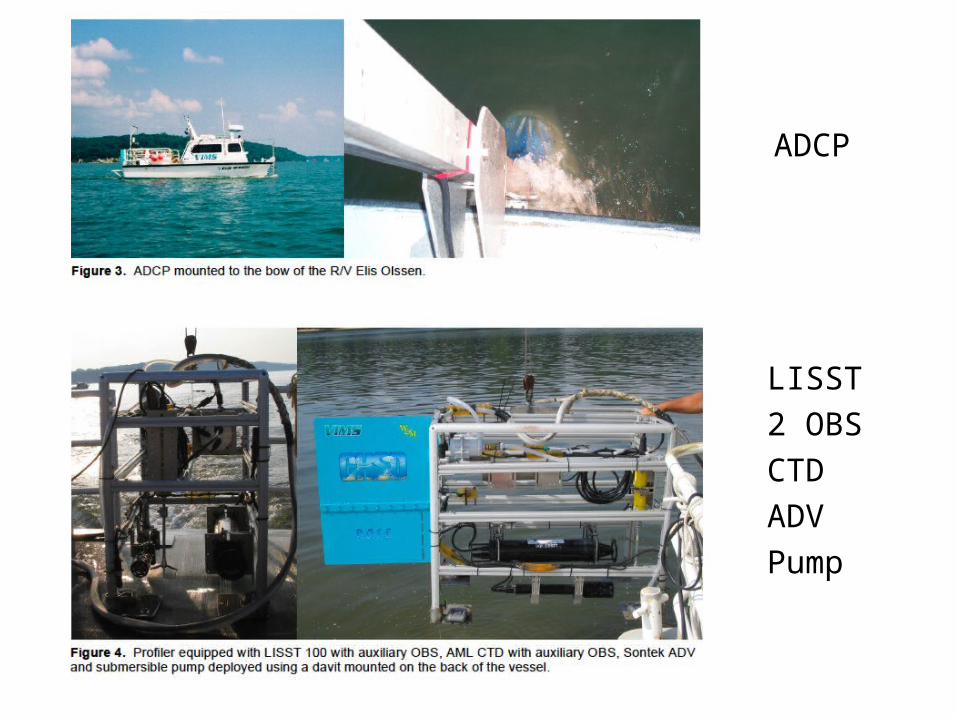
ADCP, Proflier ADCP
LISST
2 OBS
CTD
ADV
Pump
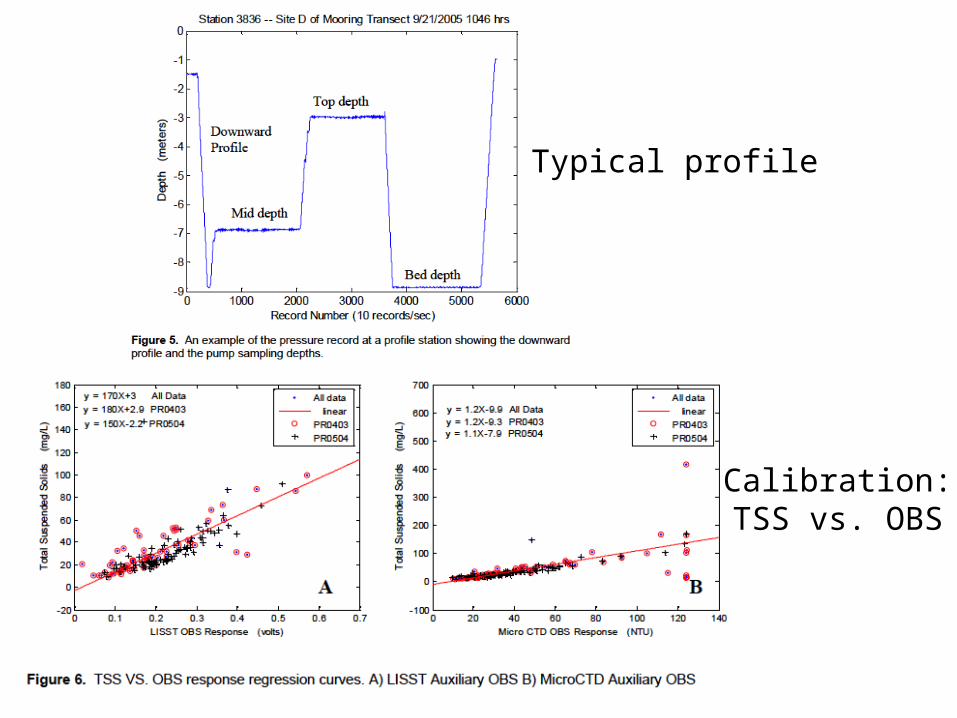
Profile & OBSsTypical profile
Calibration:TSS vs. OBS
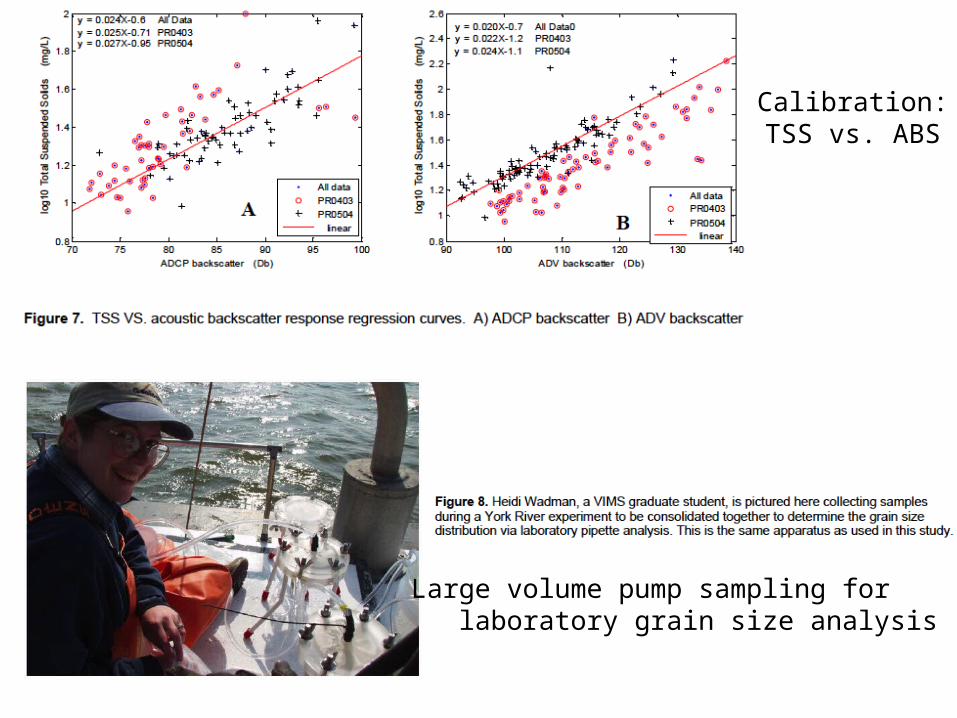
ABS & Heidi
Large volume pump sampling for laboratory grain size analysis
Calibration:TSS vs. ABS

Bottom samplingBed grab with
1 cm interval
subsamples
of top 5 cm:
% water
organic matter
sand/silt/clay
Eh profile

Transects
LISST D50
profiles
CTDsalinity profiles
ADCP velocitytransect
ADCP conc
transect

Data sheet

Title & OutlineDevelopment of a Sediment Transport Model for the
Chesapeake Bay:
Supporting Physical Data from VIMS Potomac River Intensive Surveys with Emphasis on LISST
Suspended Particle Size
Grace M. Cartwright and Carl T. FriedrichsVirginia Institute of Marine Science
OUTLINE:
1. Draft Data Report
2. Preliminary Trends from Particle Size Analysis

Along axis
UMCES Data: D50 depends on location, elevation and TSS.Two distinct populations indicated: (i) suspended, (ii) flocculated
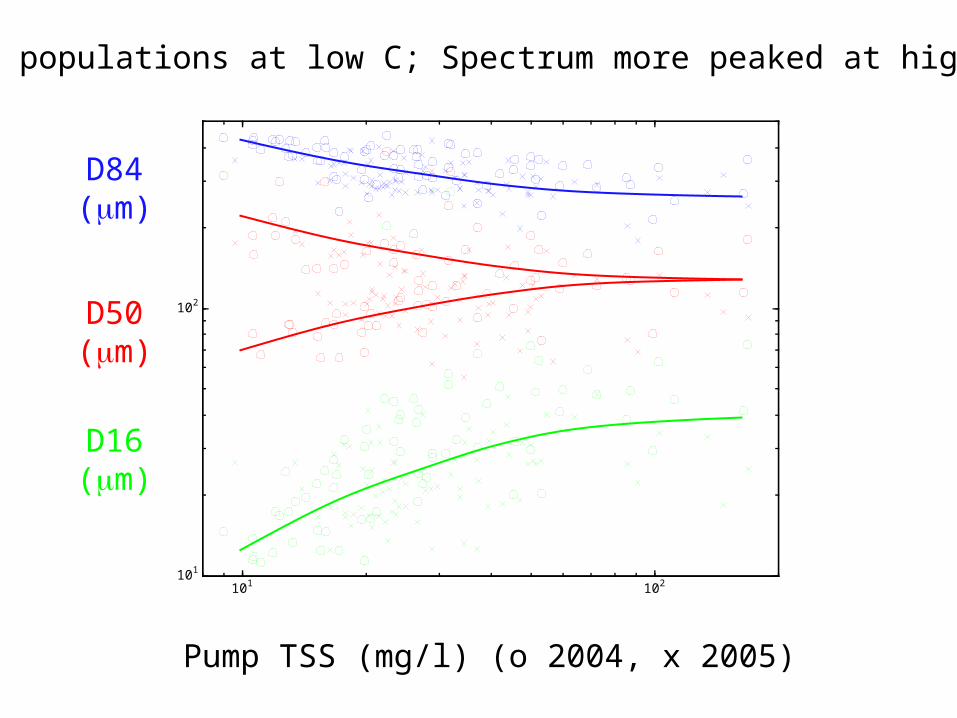
Size vs. TSS
101 102101
102
Pump TSS (mg/l) (o 2004, x 2005)
D84(m)
D16(m)
D50(m)
Two populations at low C; Spectrum more peaked at high C

Inorganic
101 1020
10
20
30
40
50
60
70
80
90
100
%Inorganic
Pump TSS (mg/l) (o 2004, x 2005)
Two populations: (i) highly inorganic, (ii) organic/inorganic mixture
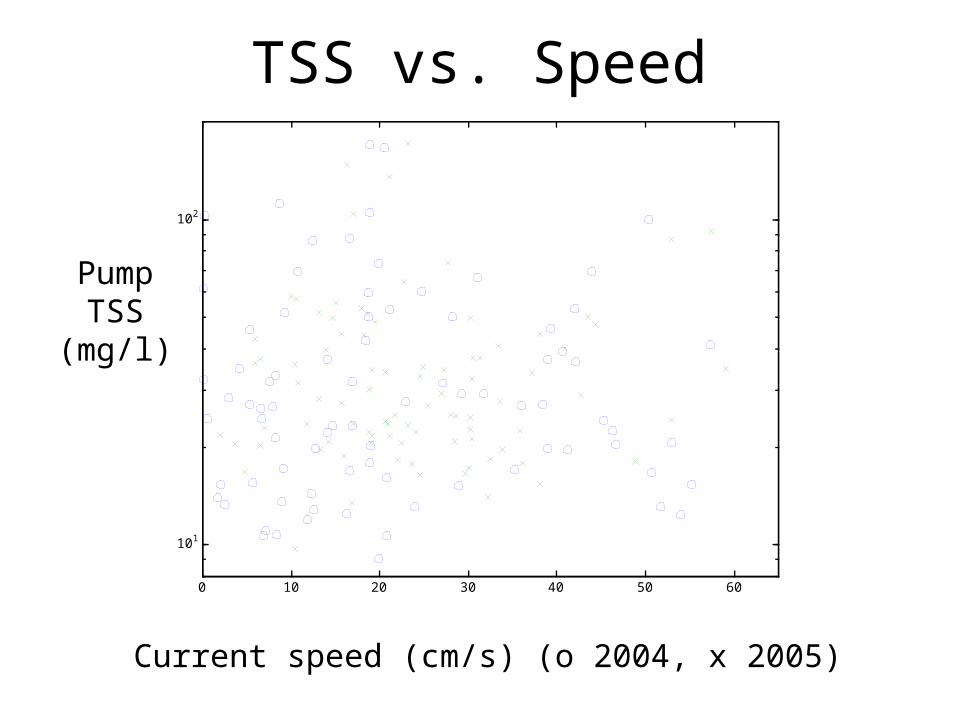
TSS vs. speed
0 10 20 30 40 50 60
101
102
TSS vs. Speed
PumpTSS
(mg/l)
Current speed (cm/s) (o 2004, x 2005)

TSS vs. sp, z<1
0 10 20 30 40 50 60
101
102
Nearbed TSS vs Speed
PumpTSS
(mg/l)
Current speed (cm/s) (o 2004, x 2005)
Height above bed
< 1 m
PCs
0 10 20 300
0.5
1
1.5
2
2.5
3
3.5
4
0 10 20 300
0.5
1
1.5
2
2.5
3
3.5
4
0 10 20 300
1
2
3
4
5
-2 0 2 4101
102
-4 -2 0 2101
102
-5 0 5101
102
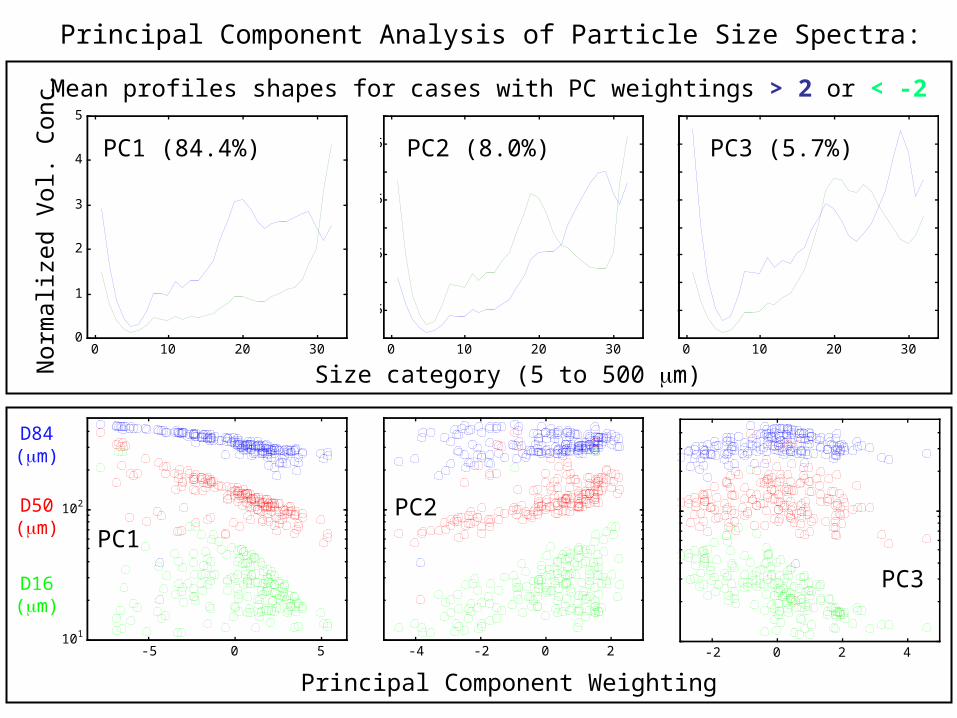
D84(m)
D16(m)
D50(m)
Principal Component Weighting
Nor
mal
ized
Vol
. C
onc.
Size category (5 to 500 m)
Mean profiles shapes for cases with PC weightings > 2 or < -2
PC1PC2
PC3
PC1 (84.4%) PC2 (8.0%) PC3 (5.7%)
Principal Component Analysis of Particle Size Spectra:
Title & OutlineDevelopment of a Sediment Transport Model for the
Chesapeake Bay:
Supporting Physical Data from VIMS Potomac River Intensive Surveys with Emphasis on LISST
Suspended Particle Size
Grace M. Cartwright and Carl T. FriedrichsVirginia Institute of Marine Science
OUTLINE:
1. Draft Data Report
2. Preliminary Trends from Particle Size Analysis
Related Documents