Title of manuscript: “Applying Analytical Modeling to the Decentralization of Health Homecare Services”

Welcome message from author
This document is posted to help you gain knowledge. Please leave a comment to let me know what you think about it! Share it to your friends and learn new things together.
Transcript

Title of manuscript:
“Applying Analytical Modeling to the Decentralization of Health Homecare Services”

1
ABSTRACT
The homecare program in the Saskatoon Health Region (Canada) is responsible for providing
healthcare services to elderly persons and patients recently discharged from acute care facilities.
At the beginning of their eight-hour shifts, each homecare worker reports to a central facility to
receive an assigned list of healthcare visits. These health professionals report back to this site at
shift end to complete required reports and return various medical supplies and equipment.
Homecare management has observed that workers are incurring lengthy travel distances
(annually in excess of 800,000 kilometres) while driving to client homes scattered throughout the
city. In an effort to demonstrate successful operational research (OR) practice, we develop an
optimization model to investigate the decentralization of homecare offices within this city. Our
analytical model informs managerial decision-making by prioritizing the candidate facilities and
demonstrating the impact of various cost factors on location planning.
Keywords: Homecare services; Integer programming; Location

2
1. Introduction
The Saskatoon Health Region (SHR) is the largest health jurisdiction in the Canadian
province of Saskatchewan. As described on its website (www.saskatoonhealthregion.ca), it
serves roughly 300,000 individuals in more than 100 cities, towns, villages and First Nation
communities spread over 34,000 square kilometres. The health region operates in excess of 75
facilities and delivers a vast array of programs and services, including hospital and long term
care, public health and homecare, and mental health and addiction services. With nearly 900
physicians and over 13,000 nurses and other healthcare workers, it is the province’s largest
employer. Figure 1 provides a health region map. Saskatoon, the principal city within this
region, includes over 250,000 residents and is positioned towards the middle-left portion of
Figure 1.

3
Figure 1: Saskatoon Health Region map
The health region’s homecare program is responsible for providing a variety of services
within Saskatoon, such as in-home respite, meal preparation, security calls, home management,
wound care and medication assistance. These services employ home health aides (HHA) and
nurses to deliver important assistance to elderly persons as well as patients (known as “clients”)
recently discharged from acute care facilities. Generally, nurses provide more medically complex
homecare services than those offered by HHAs.

4
In order to more effectively manage homecare demand within Saskatoon, the city is
divided into four quadrants. Quadrant managers are tasked with the challenging assignment of
ensuring that limited homecare staff resources are efficiently deployed to meet client care needs.
To accomplish this, these managers scrutinize care plans to determine the prioritization of clients
receiving homecare services. Further, the managers build a more detailed care plan for each
individual that includes, among other features, client preferences for caregiver gender, ideal
times for homecare visits, required equipment for client services, and so forth.
At the beginning of their eight-hour shifts, each HHA or nurse reports to the Idylwyld
Centre, a two-story facility located close to Saskatoon’s downtown core. This facility serves as
the city’s homecare base. Upon reporting to the Idylwyld Centre, staff members are provided
with their assigned daily schedules. At the conclusion of their daily list of visits and service
calls, each HHA or nurse reports back to the Idylwyld Centre to complete required reports and
return various medical supplies and equipment.
Despite the best intentions of quadrant managers (who attempt to provide healthcare
workers with daily assignments that reduce travel burden), it is not entirely uncommon for staff
members to repeatedly travel across the city to fulfill their healthcare obligations. These
occurrences could arise due to staff unavailability (e.g. a nurse or HHA calls in sick), surges in
homecare demand, last-minute client cancellations, or particular services taking longer than
anticipated. With the city spanning an area roughly 25 kilometres (east to west) and about 20
kilometres (north to south), inefficient travelling intensifies staff anxiety, reduces available time
for providing homecare services, frustrates clients, and increases total system costs. Current
contractual agreements govern healthcare worker reimbursements for travel between consecutive
homecare appointments. For example, a HHA is paid a fixed amount of $3.50 for any distance

5
traveled up to 9.1 kilometres and $0.38 per kilometre for any trips beyond this distance. Nurses
are paid a fixed amount of $4.50 for trips up to 11.4 kilometres and $0.40 per kilometre for
distances above this threshold.
Health region management has recognized that requiring each homecare worker to report
to the Idylwyld Centre at the beginning and conclusion of their shifts may engender system
inefficiencies. For example, it may be preferable for SHR to consider a network of homecare
offices distributed throughout the Saskatoon metropolitan area. Under this proposed
decentralized configuration, homecare workers could report to an office closer to their residence.
Although homecare workers are not reimbursed for travel prior to or after their shifts, such a
move would most likely increase staff satisfaction. Further, having multiple offices located
within Saskatoon may provide greater opportunity for homecare professionals to be associated
with and provide service to specific city zones, thereby reducing total distance travelled and
decreasing system expenditures.
This paper, which describes the development of a cost-effective decentralized network of
homecare offices, is an account of an actual OR project. Management’s motivation to
analytically explore this location problem stems from a variety of reasons. As depicted above,
an optimal configuration would lead to travel distance and cost savings. Currently, these
homecare workers are annually travelling in excess of 800,000 kilometres. Since the
government reimburses homecare travel through taxation revenues, cost savings would reduce
the burden on the public purse.
Secondly, reducing travel times would permit more time for direct care. Within the
current system, homecare workers provide actual client care for roughly 50% of their typical
working day. The remaining half is absorbed with driving to client homes, finding parking spots,

6
and negotiating travel through congested urban streets. Moreover, the demand for nurse and
HHA services increased by nearly 20% and 15%, respectively, in a recent three-year stretch.
This augmentation of homecare demand – accompanied by the ubiquitous problem of staff
recruitment - fuels the need to identify a solution in which medical professionals devote less of
their day to traveling.
An additional impetus for a location analysis involves the city of Saskatoon’s plan to
expand the roadway near the Idylwyld Centre. This would curtail the available office space in
this building, thereby reducing the amount of medical equipment and supplies that could be
stored. Further, it would limit the number of staff members that could report there for duty at the
beginning and end of their shifts.
As an aside, we note that one could model this situation as a vehicle routing problem in
which care givers were provided optimal tours for visiting a daily client roster. However, it was
felt that showcasing any benefits of network decentralization would provide sufficient
managerial insights into how the system could improve its efficiency.
Our paper proceeds as follows. The next section provides a brief literature summary.
We then explain the development of our analytical optimization model, after which we describe
various homecare office location results. We conclude the paper with some summary remarks.
2. Literature summary
The determination of the optimal number, size and location of facilities to serve a base of
customers is one of a well-studied class of problems known as location-allocation analysis.
Researchers from several academic disciplines including economics, engineering, mathematics
7
and operational research have studied these problems. Cooper [4] was an early contributor.
Love, Morris and Wesolowsky [12] provided a seminal treatment.
Academics and practitioners have explored a vast array of health service areas.
Moreover, researchers have investigated healthcare facility location within a myriad of regions
and countries, thus demonstrating the global appeal of this particular topic.
Daskin and Dean [5] provided a principal piece in this specific stream of research. They
illustrated that healthcare facilities should be situated in locations that optimize accessibility,
adaptability and availability of required services. Within the context of in-patient facilities,
Davies [6] also postulated the prime importance of ease of access.
The notion of patient accessibility is synonymous with coverage; namely, determining the
specific percentage of patients “covered” by a healthcare facility located within particular travel
limits. For instance, Radiah-Shariff, Hasnah-Moin and Omar [17] studied healthcare facility
location planning in Malaysia. They incorporated the limited capacity of facilities and
determined the percentage of the population residing within allowable distance targets of any
health service site. In a novel application, Chan et al. [2] explored cardiac arrests in Toronto,
Canada. The authors geographically plotted all public location cardiac incidents over a five-year
period as well as all automated external defibrillator (AED) locations. They quantified coverage
as the percentage of such arrests occurring within 100 metres of an AED. By using AEDs
positioned at 30 best locations, nearly one-third of all arrests would have happened within the
distance target. This represented improvement over the current deployment method. Marianov
and Taborga [14] determined the best location for public health centres that operated in
competition with private entities. In this environment, public centres provided paid services to
prosperous patients and subsidized care to low-income groups. Therefore, the number of public
8
centres that could be constructed would depend on the number of visits from wealthier patients,
since the revenue from these affluent patients at public centres would be used to defray the costs
of treating lower-income individuals.
Bowers, Mould and Marshall [1] specified that a relocation of healthcare services may
improve access, but could result in negatively impacting other system features (such as waiting
times). With careful planning, the authors illustrated how more patient care could be delivered
locally. Exploring data from the Department of Veterans Affairs, Syam and Cote [20] developed
a location-allocation model for such services as rehabilitation for traumatic brain injuries. They
investigated the degree of service centralization through a determination of the optimal
assignment of admission districts to treatment units.
Graber-Naidich, Carter and Verter [8] explored the location of different types of primary
care facilities. Some of these centres involved remuneration through fee-for-service
arrangements while others were salary-based. Their mathematical model, subsequently applied
to a specific Canadian city, sought to determine the impact on accessibility of provided care
offered through a particular facility location scheme. Gu, Wang and McGregor [9] investigated
the best location for breast cancer screening programs in the Canadian province of Alberta.
Increasing patients’ participation in this program was imperative since it promoted enhanced
quality of life. Therefore, the authors sought to increase the accessibility of these preventive
services. Verter and Lapierre [21] also analyzed the location of precautionary healthcare
facilities. The main objective of their research was to maximize participation, defined as the
probability that a patient requiring preventive healthcare services would select the closest facility
location.
9
Malczewski and Ogryczak [13] employed an interactive approach to find best locations
for a pediatric hospital in Warsaw. They deployed a multi-objective analysis to minimize such
factors as travel cost, investment cost, operating cost and the hospital’s environmental pollution.
Further, they maximized users’ satisfaction. Rahman and Smith [18] used quantitative models to
find the best locations of hospitals in developing countries such as Bangladesh. Ndiaye and
Alfares [15] analyzed the location of public services for particular populations (e.g., nomadic
groups) that seasonally relocate. Their integer programming model determined the best number
and location of health units to serve the resulting seasonal demand, and was successfully applied
to a network of 17 Middle East nomadic groups. Ghaderi and Jabalameli [7] studied the
accessibility of Iranian healthcare facilities. They determined best locations for sites in
conjunction with a budget constraint on facility construction costs. Ultimately, they proposed a
pair of heuristic approaches to address the problem. Through an exploration of Turkish primary
care facility systems, Gunes, Yaman, Cekyay and Verter [10] considered physician incentives in
the planning portions of the study. The author’s case study demonstrated the impact of focusing
on patient or physician preferences.
Rajagopalan, Saydam and Xiao [19] explored the dynamic redeployment of ambulances.
In this case, ambulance demand fluctuated during the week and throughout the day. The authors
determined the minimum number of ambulances and their concomitant locations. Investigating a
situation in which demands were stochastic, Chan et al. [3] formulated a stochastic location-
routing problem for a medical-evacuation case study of the United States Air Force. Jia,
Ordonez and Dessouky [11] used different facility location models to plan the location of
emergency medical services for large-scale crises such as terrorist attacks, hurricanes and
earthquakes in the Los Angeles, California area. Since these events rarely occur but have huge

10
influence on medical service demand, the authors adopted an objective of minimizing the loss of
life. They determined that facilitating access to multiple highways and being safe from crisis
damage are important criteria in selecting locations. Exploring an actual Quebec City case,
Price, Turcotte and Hebert [16] studied the relocation of a blood bank. Due to population
increases, blood demand was expected to rise. The authors gathered data related to mobile
clinics, blood deliveries and donors who travel to clinic centres, and performed a series of
gravity models to optimize location options.
The analytical model presented in this case study differs from other literature in the
following ways. First, we note that our approach involves determining locations from which
healthcare professionals are daily deployed to serve a client base as opposed to positioning sites
to which patients will visit. The latter approach - that of locating facilities such as hospitals or
care centres that draw patients- seems to be especially predominant within the cited research.
Our model addresses accessibility from the perspective of healthcare professionals.
Secondly, a direct connection exists between our modeling efforts and lean process
improvement investigations. To wit, we are combining practical OR with lean process analysis.
Within the field of lean, researchers and other decision-makers identify opportunities to reduce
the sources of waste or non-value added activities. In the present homecare context, we have
observed that healthcare professionals are devoting roughly half of their daily shift time to
activities such as driving through congested streets and securing parking spots. Since they fail to
add direct value to the patient, these activities epitomize waste. Reducing travel time (through a
decentralization arrangement that provides homecare offices more proximate to the patients) will
provide enhanced system capacity for patient care, thus helping the overall process to become
more efficient.
11
Thirdly, to the best of our knowledge, our study represents the initial attempt to
mathematically model the essential area of homecare health operations.
Finally, since the particular jurisdiction in this case study reimburses homecare travel
through taxation monies, any system improvements resulting from our optimization model would
reduce the financial encumbrance on the provincial citizenry. This differentiates our work from
those investigations that have explored privately-funded healthcare systems.
3. Model
Recall that the Idylwyld Centre is the health region’s current homecare office. Using the
knowledge and judgments of health region senior management, this group identified five
potential office locations distributed throughout the city of Saskatoon. Each of the proposed
locations is situated near a major thoroughfare or a commercial real estate area. Figure 2
provides shows much of the city’s road network along with the Idylwyld Centre (dark dot), five
candidate locations (numbered circles) and Saskatoon’s three hospitals (white stars). The
candidate facilities involve office space in the following areas, with the numbers representing
particular circles on the map:
Lawson Heights Mall (1)
Confederation Park Mall (2)
University Heights Square (3)
Market Mall (4)
Avenue H South (5)

12
Figure 2: Current and potential homecare office locations
Our analytical facility location model determines the optimal set of sites that leads to
overall cost minimization. We consider factors such as new facility lease costs, as well as the
travel expenditures associated with meeting homecare demand. Using information from
Saskatoon commercial real estate data, we obtained the total lease cost for office space of
suitable capacity at or near each proposed site. Besides determining the best number and
location of homecare offices, it is desirable to establish the size of each facility in terms of the
number of healthcare professionals assigned to each site.
In order to proceed with finding the best set of locations, we segmented the city of
Saskatoon into 64 residential neighborhoods. Using Google map, we computed the distance
travelled between the set of locations (either current facility or proposed sites) and the centre of
each neighborhood. This assumes, of course, that each area’s demand originates at each
neighborhood’s hub. Nonetheless, we felt that such an aggregated approach would still provide

13
realistic travel distances. Health region management concurred with this tactic. Moreover, this
method was deemed preferable to calculating travel distances from all locations to individual
homecare clients. Since the set of clients displays some variation over time (some patients may
no longer require service, with new clients being routinely added to the homecare roster), it
would be an extremely challenging task to calculate actual distances at the level of the individual
client.
We also required each neighborhood’s demand for homecare services. Homecare
managers provided this information in terms of the annual number of visits for either HHAs or
nurses. We note that the region’s roster currently includes 128 HHAs and 83 nurses available for
delivering homecare services.
For the most recent fiscal year, annual homecare travel was 820,155 kilometres. This
travel distance necessitated a reimbursement of $377,883. Therefore, we can evaluate our
analytical model’s performance in terms of reducing this overall cost amount. Using the
subscript i to represent locations and j to denote neighborhoods, our optimization model is as
follows:
MINIMIZE ∑ ∑{𝐶𝑖𝑗𝐻𝐻𝐴𝑆𝑖𝑗
𝐻𝐻𝐴 + 𝐶𝑖𝑗𝑅𝑁𝑆𝑖𝑗
𝑅𝑁} x 365 + ∑ 𝐿𝑖𝑋𝑖
6
𝑖=1
64
𝑗=1
6
𝑖=1
Subject to:
∑ 𝑆𝑖𝑗𝐻𝐻𝐴 ≥ 𝑑𝑗
𝐻𝐻𝐴 ∀ 𝑗 ∈ 𝐽
6
𝑖=1
[1]
∑ 𝑆𝑖𝑗𝑅𝑁 ≥ 𝑑𝑗
𝑅𝑁 ∀ 𝑗 ∈ 𝐽
6
𝑖=1
[2]

14
15 𝑋𝑖 ≤ ∑ 𝑆𝑖𝑗𝐻𝐻𝐴 ≤ 128 𝑋𝑖 ∀ 𝑗 ∈ 𝐽
6
𝑖=1
[3]
10 𝑋𝑖 ≤ ∑ 𝑆𝑖𝑗𝑅𝑁 ≤ 83 𝑋𝑖 ∀ 𝑗 ∈ 𝐽
6
𝑖=1
[4]
∑ ∑ 𝑆𝑖𝑗𝐻𝐻𝐴
64
𝑗=1
6
𝑖=1
≤ 128
[5]
∑ ∑ 𝑆𝑖𝑗𝑅𝑁
64
𝑗=1
6
𝑖=1
≤ 83
[6]
𝑆𝑖𝑗𝐻𝐻𝐴 ∈ 𝑁0 ∀ 𝑖 ∈ 𝐼; 𝑗 ∈ 𝐽 [7]
𝑆𝑖𝑗𝑅𝑁 ∈ 𝑁0 ∀ 𝑖 ∈ 𝐼; 𝑗 ∈ 𝐽 [8]
𝑋𝑖 ∈ {0, 1} ∀ 𝑖 ∈ 𝐼 [9]
Our analytical model deployed the following parameters:
𝐶𝑖𝑗𝐻𝐻𝐴: Daily cost of travelling from location i to neighborhood j for a HHA
𝐶𝑖𝑗𝑅𝑁: Daily cost of travelling from location i to neighborhood j for a registered nurse
𝐿𝑖 : Annual lease cost associated with location i
𝑑𝑗𝐻𝐻𝐴
: Daily demand for HHAs from neighborhood j
𝑑𝑗𝑅𝑁
: Daily demand for RNs from neighborhood j
We adopted the following variable definitions:
𝑆𝑖𝑗𝐻𝐻𝐴: Number of HHAs sent from location i to neighborhood j
𝑆𝑖𝑗𝑅𝑁: Number of registered nurses sent from location i to neighborhood j
𝑋𝑖 = 1: if facility is placed at location i; else, 0
The objective function tabulates the annual travel cost as well as lease costs for new
facilities. Constraints [1] and [2] ensure that the number of homecare professionals assigned

15
from all open locations to each neighborhood is such that the demand of that neighborhood is
fully covered.
In constraints [3] and [4], we prevent assigning a neighborhood’s demand to an unopened
site. The maximum amount corresponds to the number of available HHAs or nurses. Officials
were careful to consider candidate locations that had sufficient office space to house, if needed,
the entire allotment of homecare workers. The minimum numbers refer to the lowest possible
assignment of staff that would still make a location suitable. It would be rather inefficient to
open an office location within the city and only assign one or two homecare professionals to it.
Even though HHAs or nurses spend nearly all of their shift time “out of the office”, homecare
management desired a certain minimum allocation so that resources ascribed to leased spaces
were appropriately deployed. They related that the minimum values of 15 (HHA) and 10
(nurses) were reasonably suitable minima. Constraints [5] and [6] limit the total number of
HHAs and nurses sent from all open locations to all neighborhoods. Finally, constraints [7]
through [9] feature numerical bounds on various variables.
4. Results
We optimized our analytical model by using Premium Solver on a Lenovo Thinkpad
T430 laptop with an Intel Core i5-3320M processor. This software package determined the best
set of locations, as well as the number of HHAs and nurses that should be dispatched from any
site to each neighborhood. Generally, the model solved to optimality within seconds. The speed
with which the software addressed the problem intensified management’s appreciation of the
methodology’s ability to identify least-cost location-allocation arrangements.

16
Table 1 reports model results for instances in which we forced the optimizer to select a
certain number of open sites. It lists the annual travelling and lease costs associated with each
solution. We provide the results for 1 through 5 open sites. Obviously, when we selected 6 as
the desired number of locations, the model retained the current Idylwyld Centre and opened each
new candidate location.
As per our expectations, the annual transportation costs drop and the overall lease costs
climb as we increase the number of open facilities. With more facilities in operation, homecare
professionals are located closer to each neighborhood thus reducing travel distances. However,
additional open facilities necessitate greater total lease costs. Total annual costs increase
monotonically as we escalate the number of open facilities.
Table 1: Optimization model results
Number of open
facilities
Annual
transportation cost
Annual lease cost Total annual cost
1 $377,883
$0 $377,883
2 $373,517
$122,429 $495,945
3 $324,905
$242,827 $567,732
4 $319,450 $271,680 $591,130
5 $317,863 $330,387 $648,250
If healthcare planners wanted to minimize overall costs, the best system configuration
would be a one-facility network. In fact, this particular location would be the current Idylwyld
Centre because the optimal result for a one-location case (as given in Table 1) involves zero

17
lease costs. Since the health region owns Idylwyld Centre, they do not incur any lease costs for
its operation.
Moreover, Table 1 demonstrates that the reduced transportation costs associated with
facility expansions are outweighed by the resulting lease cost increases. Undoubtedly, health
region management made a correct assertion that driving expenditures would drop with
decentralized operations. Nonetheless, in this particular instance, shortened transportation times
produce insufficient savings. Reduced travel times increase available client care capacity, but
the concomitant cost opening of more facilities increases total costs. Indeed, centralization
offers cost advantages within the current configuration. If management did want to proceed with
decentralized sites, it would need to identify opportunities to lower overall lease costs (perhaps
by pinpointing potential locations unexplored in the current optimization model that could yield
rental advantages).
Despite the fact that a centralized network offers optimal cost performance, health region
management was particularly interested in the relative ranking of the candidate locations, since
this offers an opportunity to assess decentralization merits. This can be understood by observing
the order in which each location entered the optimal network configuration. We provide these
details in Table 2. The number after each location refers to its symbol provided in the Figure 2
map. No matter the number of facilities that are required to be open, the Idylwyld Centre is
always one of the best sites to use. After the Idylwyld Centre, the Avenue H South location is
the second best choice. This outcome was influenced by this particular location’s relatively low
lease costs. The third best place for a new facility is the Market Mall location due to the high
demand for homecare services in the particular neighborhoods surrounding this site. To wit, this
facility is situated near a conglomeration of senior citizen apartment buildings. The

18
Confederation Mall and Lawson Heights Mall locations are the next to enter the optimal
solution. The University Heights Square location is not listed in Table 2, thus suggesting that it
is the least preferred site. We note that it did not become part of any optimal solution until we
forced the model to open all six locations.
Table 2: Optimal locations
Proposed locations Number of facilities to open
1 2 3 4 5
Idylwyld Centre
Avenue H South (5)
Market Mall (4)
Confederation Mall (2)
Lawson Heights Mall (1)
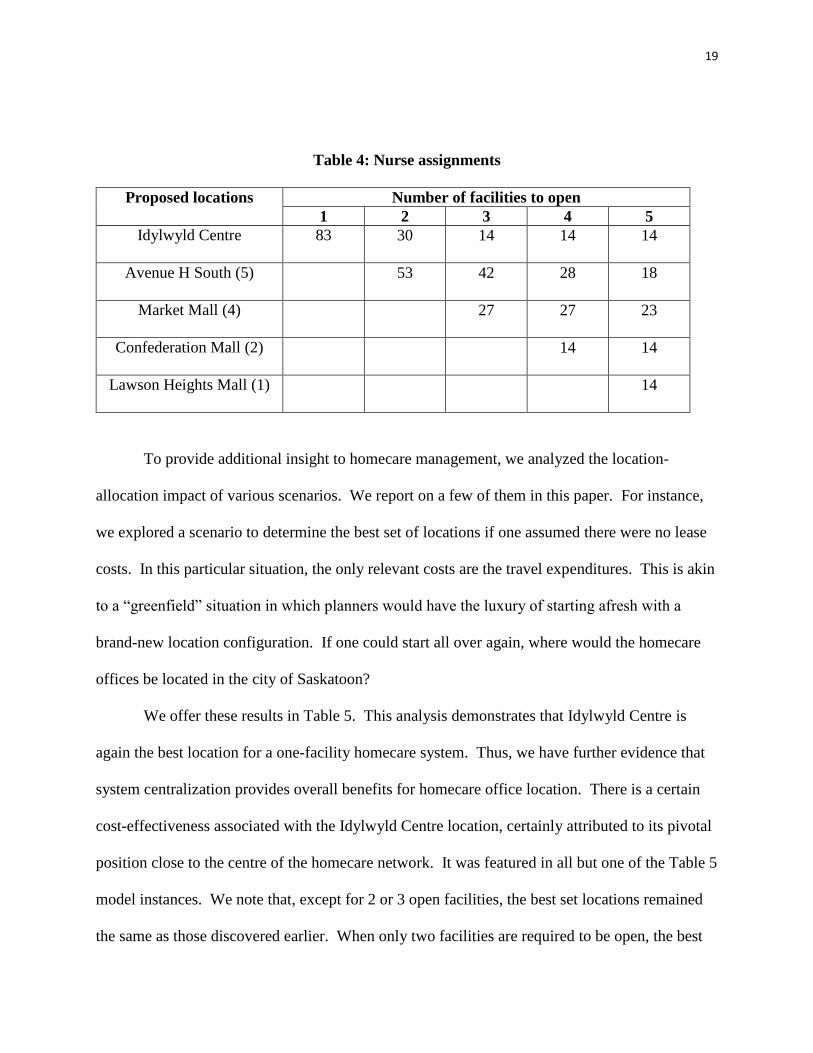
Tables 3 and 4 provide the number of HHAs and nurses, respectively, assigned to each
office location. One may interpret these results as depicting the capacities of the various sites.
Table 3: HHA assignments
Proposed locations Number of facilities to open
1 2 3 4 5
Idylwyld Centre
128 73 35 28 21
Avenue H South (5)
55 44 30 21
Market Mall (4)
49 49 44
Confederation Mall (2)
21 21
Lawson Heights Mall (1)
21
19
Table 4: Nurse assignments
Proposed locations Number of facilities to open
1 2 3 4 5
Idylwyld Centre
83 30 14 14 14
Avenue H South (5)
53 42 28 18
Market Mall (4)
27 27 23
Confederation Mall (2)
14 14
Lawson Heights Mall (1)
14
To provide additional insight to homecare management, we analyzed the location-
allocation impact of various scenarios. We report on a few of them in this paper. For instance,
we explored a scenario to determine the best set of locations if one assumed there were no lease
costs. In this particular situation, the only relevant costs are the travel expenditures. This is akin
to a “greenfield” situation in which planners would have the luxury of starting afresh with a
brand-new location configuration. If one could start all over again, where would the homecare
offices be located in the city of Saskatoon?
We offer these results in Table 5. This analysis demonstrates that Idylwyld Centre is
again the best location for a one-facility homecare system. Thus, we have further evidence that
system centralization provides overall benefits for homecare office location. There is a certain
cost-effectiveness associated with the Idylwyld Centre location, certainly attributed to its pivotal
position close to the centre of the homecare network. It was featured in all but one of the Table 5
model instances. We note that, except for 2 or 3 open facilities, the best set locations remained
the same as those discovered earlier. When only two facilities are required to be open, the best

20
locations were Idylwyld Centre and University Heights Square. For three facility locations, we
found that Market Mall, Confederation Mall and Lawson Heights Mall were chosen as the best
sites.
Table 5: Greenfield locations
Proposed locations Number of facilities to open
1 2 3 4 5
Idylwyld Centre
Avenue H South (5)
Market Mall (4)
Confederation Mall (2)
Lawson Heights Mall (1)
University Heights Square (3)
Notwithstanding the finding that the Idylwyld Centre produced cost efficiencies, we
modeled a scenario in which homecare management forced the closure of the Idylwyld Centre.
If one were to do this and restrict the number of open facilities to one, the best location would be
the Avenue H South site. However, we found that the annual transportation cost would rise to
$414,389, an increase of over $36,000 from the one-site transportation costs reported in Table 1.
This solution also incurred lease costs of $122,429, meaning that the total system costs would
definitely increase by using Avenue H South as the one-facility alternative instead of Idylwyld
Centre. This further underscores the importance of the current office location in the city’s
homecare network.

21
5. Conclusions
In this paper, we have explored the application of analytical modeling to the
decentralization of homecare offices for the Saskatoon Health Region. This health jurisdiction
currently includes a sole facility located at the Idylwyld Centre, close to the city’s downtown
core. Challenging circumstances involve lengthy travel distances for its highly-trained homecare
staff, thus precipitating a reduction in the amount of client care time these professionals can
provide throughout the day. The city is experiencing growth in homecare demand. Further, a
roadway expansion near the present location may reduce available office space, thereby forcing
the health region to consider an alternative location scheme.
We used a model that minimized total annual costs subject to a set of constraints. Based
on homecare management suggestions, we studied five possible candidate locations. Our model
results reported the optimal number, location and size of homecare offices under a variety of
particular scenarios. System centralization offers superior cost performance. The preferred
locations are (in descending order) Idylwyld Centre, Avenue H South, Market Mall,
Confederation Mall, Lawson Heights Mall and University Heights Square.
In terms of possible limitations, we did assume that homecare staff would pick the
shortest route (the ones computed with Google map) when travelling between consecutive
appointments. In reality, it is conceivable that staff would select a different (longer) route
according to individual preferences, or on days involving high traffic or construction along the
pre-determined shortest route. Notwithstanding this assumption, we feel that our model results
can inform homecare management decision-making. It analytically demonstrates the impact of
various cost factors on location planning, prioritizes a list of candidate facilities, and illustrates
the current advantages of system centralization.

22
References
[1] J. Bowers J, G. Mould, C. Marshall, Location of services and the impact on healthcare
quality: Insights from a simulation of a musculoskeletal physiotherapy service, Journal of
the Operational Research Society (forthcoming) doi:10.1057/jors.2014.85.
[2] T.C.Y. Chan et al., Identifying locations for public access defibrillators using
mathematical optimization, Circulation 127 (2013): 1801-1809.
[3] Y. Chan et al., A multiple-depot, multiple-vehicle, location-routing problem with
stochastically processed demands, Computers and Operations Research 28 (2001): 803-
826.
[4] L. Cooper, Location-allocation problems, Operations Research 11 (1963): 331-343.
[5] M.S. Daskin, L.K. Dean, Location of health care facilities from operations research in
health care: A handbook of methods and applications. In: Sainfort F, Brandeau M and
Pierskalla W (eds). Springer-Verlag, New York, (2004): 43-76.
[6] R. Davies, Location problems in the planning of in-patient facilities in the health service.
Journal of the Operational Research Society 28 (1977): 939-952.
[7] A. Ghaderi, M.S. Jabalameli, Modeling the budget-constrained dynamic uncapacitated
facility-location network design problem and solving it via two efficient heuristics: A
case study of health care, Mathematical and Computer Modelling 57 (2013): 382-400.
[8] A. Graber-Naidich, M.W. Carter, V. Verter, Primary care network development: The
regulator’s perspective, Journal of the Operational Research Society (forthcoming)
doi:10.1057/jors.2014.119.
[9] W. Gu, X. Wang, E. McGregor, Optimization of preventive health care facility location,
International Journal of Health Geographics 9 (2010): 1-16.
[10] E.D. Gunes, H. Yaman, B. Cekyay, V. Verter, Matching patient and physician preference
in designing a primary care facility network, Journal of the Operational Research Society
65 (2014): 483-496.
[11] H. Jia, F. Ordonez, M. Dessouky, A modeling framework for facility location of medical
services for large-scale emergencies, IIE Transactions 39 (2007): 41-55.
[12] R.F. Love, J.G. Morris, G.O. Wesolowsky, Facilities Location: Models and Methods.
North-Holland, New York, 1988.
[13] J. Malczewski, W. Ogryczak, An interactive approach to the central facility location
problem: Locating pediatric hospitals in Warsaw, Geographical Analysis 22 (1990): 244-
258.

23
[14] V. Marianov, P. Taborga, Optimal location of public health centres which provide free
and paid services, Journal of the Operational Research Society 52 (2001): 391-400.
[15] M. Ndiaye, H. Alfares, Modeling health care facility location for moving population
Groups, Computers & Operations Research 35 (2008): 2154-2161.
[16] W.L. Price, M. Turcotte, H. Hebert, Locating a blood bank, Interfaces 16 (1986): 17-26.
[17] S.S. Radiah-Shariff, N. Hasnah-Moin, M. Omar M, Location allocation modeling for
healthcare facility planning in Malaysia, Computers & Industrial Engineering 62 (2012):
1000-1010.
[18] S. Rahman, D.K. Smith, Use of location-allocation models in health service development
planning in developing nations, European Journal of Operational Research 123 (2000):
437-452.
[19] H.K. Rajagopalan, C. Saydam, J. Xiao, A multiperiod set covering location model for
dynamic redeployment of ambulances, Computers and Operations Research 35 (2008):
814-826.
[20] S.S. Syam, M.J. Cote, A comprehensive location-allocation method for specialized
healthcare services, Operations Research in Health Care 1 (2012): 73-83.
[21] V. Verter, S.D. Lapierre, Location of preventive health care facilities, Annals of
Operations Research 110 (2002): 123-132.
Related Documents