1 Title: NASA Global Satellite and Model Data Products and Services for Tropical Cyclone Research Zhong Liu 1,2 , David Meyer 1 , Chung-Lin Shie 1,3 , and Angela Li 1 1 NASA Goddard Earth Sciences Data and Information Services Center (GES DISC) 2 George Mason University 3 University of Maryland Baltimore County Submitted to, "Current Topics in Tropical Cyclone Research," edited by Dr. Anthony Lupo August 11, 2019 https://ntrs.nasa.gov/search.jsp?R=20200001572 2020-07-25T10:34:51+00:00Z

Welcome message from author
This document is posted to help you gain knowledge. Please leave a comment to let me know what you think about it! Share it to your friends and learn new things together.
Transcript
1
Title: NASA Global Satellite and Model Data Products and Services for Tropical
Cyclone Research
Zhong Liu1,2, David Meyer1, Chung-Lin Shie1,3, and Angela Li1
1 NASA Goddard Earth Sciences Data and Information Services Center (GES DISC)
2 George Mason University
3 University of Maryland Baltimore County
Submitted to,
"Current Topics in Tropical Cyclone Research," edited by Dr. Anthony Lupo
August 11, 2019
https://ntrs.nasa.gov/search.jsp?R=20200001572 2020-07-25T10:34:51+00:00Z

2
Abstract:
The lack of observations over vast tropical oceans is a major challenge for tropical cyclone
research. Satellite observations and model reanalysis data play an important role in filling these-
gaps. Established in the mid-1980's, the Goddard Earth Sciences Data and Information Services
Center (GES DISC), as one of the 12 NASA data centers, archives and distributes data from
several Earth science disciplines such as precipitation, atmospheric dynamics, atmospheric
composition, hydrology, including well-known NASA satellite missions (e.g. TRMM, GPM) and
model assimilation projects (MERRA-2). Acquiring datasets suitable for tropical cyclone
research in a large data archive is a challenge for many, especially for those who are not familiar
with satellite or model data. Over the years, the GES DISC has developed user-friendly data
services. For example, Giovanni is an online visualization and analysis tool, allowing users to
visualize and analyze over 2000 satellite- and model-based variables with a Web browser,
without downloading data and software. In this chapter, we will describe data and services at the
GES DISC with emphasis on tropical cyclone research. We will also present two case studies
and discuss future plans.
Keywords: satellites, models, data, data services, NASA
3
1. Introduction
Tropical cyclones form over vast tropical oceans where in-situ observations are sparse and
discontinuous. The lack of observational data over these areas historically has been a major
obstacle for tropical cyclone research and other weather and climate related studies.
Understanding the complex atmospheric and oceanic processes, and their interactions at multiple
scales (e.g. convective, synoptic) over the life cycle of tropical cyclones, requires multi-scale,
multi-platform observational networks. It has been a great challenge to design, deploy, and
maintain such networks without interruption, particularly in the harsh environments imposed by
these extreme phenomena. Since the satellite era began, data collected from satellites, along with
model reanalysis data, have played an important role in providing continuous global observations,
filling in data gaps, and enabling research on weather and climate on different scales.
The concept of using satellites to observe Earth’s weather and climate was developed as early
as 1946 [1]. NASA launched the first successful, weather satellite, TIROS-1 (Television
InfraRed Observational Satellite) on April 1, 1960 [1, 2]. In 1964, the Nimbus project was
initiated and a total of 7 experimental meteorological satellites were launched over a 14-year
time period (1964-1978) [1, 2]. Since then, weather and climate research have come to rely
heavily on long-term, consistent satellite observations from multiple operational space borne
platforms to continuously observe the Earth’s atmospheric and surface conditions.
The Earth-observing satellite era began in earnest after NASA transferred the technology to
the National Oceanic and Atmospheric Administration (NOAA) in the 1970s. This was followed
by several operational weather satellites series, including the Polar-orbiting Operational
Environmental Satellites (POES) and the Geostationary Operational Environmental Satellites
(GOES), to provide continuous global weather observations. Meanwhile, the Defense

4
Meteorological Satellite Program (DMSP), also launched in the 1970s, provided additional
observations of global weather events. These series evolved into the weather constellation of
satellites operating today, using research and operational satellites from domestic and
international organizations, providing the frequent, global observations necessary for improved
understanding and forecasting of Earth’s complex weather systems.
Atmospheric 3-D winds, air and sea surface temperatures, pressure, precipitation, water
vapor, aerosols, etc. are among the fundamental variables for tropical cyclone research and
applications. As aforementioned, few in-situ observations are available over vast and remote
tropical oceans. Direct measurements of these variables are difficult both from surface and space.
Over the years, satellite-based algorithms have been developed and improved to derive these
essential variables from few key measurements such as radiances observed onboard satellites,
and their datasets are archived and distributed to support tropical cyclone research.
Established in the mid-1980's (Table 1), the Goddard Earth Sciences Data and Information
Services Center (GES DISC), as one of the 12 NASA Distributed Active Archive Centers
(DAACs), archives and distributes satellite and model data for a range of Earth science
disciplines [3], such as precipitation, atmospheric dynamics, atmospheric composition,
hydrology, derived from well-known NASA Earth’s satellite missions (e.g. the Tropical Rainfall
Measuring Mission (TRMM), the Global Precipitation Measurement (GPM)) as well as model
assimilation projects (MERRA-2, NLDAS). These data have been widely used in tropical
cyclone research.
To facilitate data access, the GES DISC has developed user-friendly data services for
researchers around the world (Fig. 1). For example, the Geospatial Interactive Online
Visualization ANd aNalysis Infrastructure (Giovanni) [4-7] is a powerful online visualization
5
and analysis tool, allowing users to visualize and analyze over 2000 satellite- and model-based
variables with a Web browser, without downloading data or software. Locating datasets suitable
for tropical cyclone research in a large data archive is a challenge for many users, especially
those who are not familiar with satellite data. For example, a search for “precipitation” in the
GES DISC website [3] can return over 400 results. To facilitate data access, the GES DISC has
recently developed a “data list” (also known as “variable set”) concept that groups relevant
variables from different datasets together to serve specific research needs. A prototype data list
targeting hurricane study has been implemented.
The chapter is organized as follows: first, we give a brief overview of NASA satellite and
model data at GES DISC, followed by introducing datasets for tropical cyclone studies, data
services, case studies, and summary with future directions.
2. Overview of NASA Satellite Mission and Model Data Collections at GES DISC
The GES DISC archives and distributes data from a range of satellite observations, models,
ground measurements, and field campaigns in multiple Earth science disciplines including global
precipitation, atmospheric dynamics, hydrology, and atmospheric composition with a total
volume of 2.3+ Petabytes consisting of 100+ million data files covering 3000+ public and
restricted collections. Over 1200 data collections are being curated at GES DISC. Table 2 lists
their satellite missions including the past, current and future satellite missions. Table 3 lists basic
data services and user support. More details about data services are described in Section 4.
The GES DISC is a certified trusted repository of Earth science data. Increasingly, funding
organizations and publishers require data to be published to certified data repositories adhering
to FAIR principles – (Findability, Accessibility, Interoperability, and Reusability). The GES
DISC is a regular member of the International Council for Science (ICSU) World Data System
6
(WDS). Established to archive and distribute data from the 1957-1958 International Geophysical
Year, WDS spans a range of scientific disciplines data at 52 centers in 12 countries who adhere
to the established principles. The GES DISC is also registered as a scientific data repository
through re3data.org and meets the repository criteria include DOI assignments, dataset landing
pages, dataset documentation, redundant archive (backups), data integrity checks, and user
services. This registry is used by high-impact journals such as Nature Scientific Data [8].
3. Datasets for Tropical Cyclone Research
There are many research areas associated with tropical cyclones such as cyclone genesis,
intensification, track forecasting, rainfall amounts, etc. While GES DISC archives many
variables required to conduct such research, other variables may be located at other NASA
DAACs (such as sea surface state and temperature). It can be challenging enough to find relevant
variables for a specific research area from a large collection of satellite observations from a
single data archive – locating relevant datasets from multiple data centers is even more
challenging. Due to the page limit, in this section, we can only present a brief overview of
several key data collections at GES DISC for tropical cyclone research.
3.1 Brightness temperature collection
Brightness temperature, derived from radiance measured from satellite instruments, is a
fundamental physical variable in satellite meteorology. Infrared satellite images have been
available since the Nimbus era to support weather analysis and forecast. For example, infrared
images are used in tropical cyclone monitoring and forecast operations at the NOAA National
Hurricane Center and the U.S. Navy Joint Typhoon Warning Center. Animations made from
infrared images are frequently used in daily local TV weather news, online weather news and
scientific presentations. The GES DISC archives brightness temperatures from infrared

7
instruments from the Nimbus era up to more recent and current passive microwave satellite
instruments from domestic and international research and operational satellites.
Datasets from the Nimbus data rescue project [9] consists of digitized black-and-white film
images (Fig. 2) and radiance data obtained by the Nimbus satellites during the 1960s, 70s and
80s [10]. Related instruments onboard the Nimbus satellites over this time period are listed in
Table 4. Negatives of photo facsimile 70 mm file strips were scanned and saved as JPEG 2000
digital files. There are 20 datasets from the Nimbus satellites (1-7) beginning on Aug. 28, 1964
and ending on May 9, 1985.
Tropical cyclone research requires frequent and continuous observations of the Earth’s
atmosphere to analyze and understand event development and processes. Operational
geostationary satellites make such observations from cloud tops possible, although it is still
challenging to continuously observe changes inside a weather system. The first geostationary
satellite in operation is GOES 1, which was launched on October 16, 1975 [1]. As more
operational geostationary satellites were added by different international agencies, infrared data
from these satellites can be stitched and provide a near-global (60° N-S) coverage of the Earth’s
atmosphere [11, 12].
With support from the NASA Global Precipitation Climatology Project (GPCP) and by the
Tropical Rainfall Measuring Mission (TRMM), the NOAA National Weather Service (NWS)
Climate Prediction Center (CPC) has developed a globally-merged (60° N-S) pixel-resolution IR
brightness temperature dataset (equivalent blackbody temperatures), merged from all available
domestic and international geostationary satellites [11, 12]. This half-hourly and 4 km x 4 km
resolution dataset is also called the merged IR and is available at the GES DISC from 2000
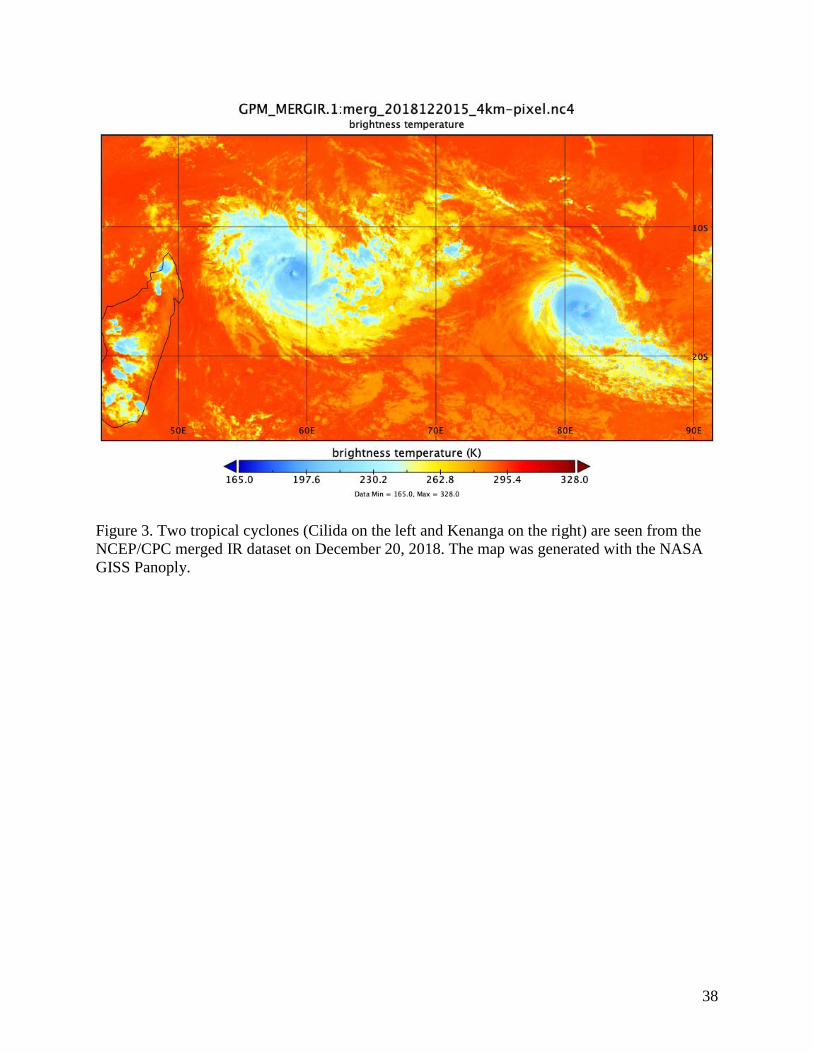
onwards [12]. Figure 3 is a sample of the dataset, showing two tropical cyclones (Cilida and

8
Kenanga) on December 20, 2018. In addition to tropical cyclone and other research, the merged
IR dataset has been an important input for a number of algorithms that derive near-global IR-
based precipitation estimates in several well-known satellite-based global precipitation products
[13, 14] such as the Integrated Multi-satEllite Retrievals for GPM (the Global Precipitation
Measurement) or IMERG [13].
Currently in operation, the GPM Microwave Imager (GMI) [15] is used as the reference
standard to generate Level-1C common calibrated brightness temperature products from the
GPM constellation consisting of both domestic and international satellites, based on the
algorithms developed by the GPM intercalibration (X-CAL) working group [16]. These Level-
1C products are transformed from their equivalent Level-1B radiance data. There are many
applications of these passive microwave brightness products. For example, the GPM profiling
algorithm (GPROF) uses these Level-1C products to generate hydrometeor profiles and surface
precipitation estimates (Fig. 4) used as input data in IMERG.
3.2 TRMM and GPM precipitation dataset collection
Launched in November 1997, the TRMM satellite (40° N-S), a joint mission between NASA
and JAXA (the Japan Aerospace Exploration Agency), carried several precipitation related
instruments, including the first spaced-borne Ku-band precipitation radar (PR), a passive TRMM
microwave imager (TMI), a visible and infrared scanner (VIRS), and a lightning imaging sensor
(LIS) [17]. TRMM ended in April 2015. Over a 17-year period, TRMM provided observations
that are used to produce groundbreaking 3-D images of rain and storms over vast and remote
tropical oceans and continents. TRMM provides opportunities for researchers to understand
characteristics of atmospheric systems through instantaneous measurements in different
wavelengths from the onboard instruments.

9
TRMM data available at GES DISC [18] are listed in Table 5. They can be categorized in
different processing levels, ranging from Level 1 to 3 [19]. Level-1 TRMM datasets consist of
reconstructed and unprocessed instrument data at full resolution data at Level-1, 1A, 1B, and 1C
[19] from the three TRMM instruments. Level-2 TRMM datasets are derived geophysical
variables at the same resolution and location as Level 1 source data such as the GPROF
hydrometeor profiles and surface precipitation estimates. Level-3 TRMM datasets are Level-2
variables that are mapped on uniform space-time grid scales, ranging from 3-hourly to monthly.
For example, the TRMM Multi-satellite Precipitation Analysis (TMPA) datasets [20-22] are
Level-3 products, including both near-real-time and research grade products. The TMPA datasets
have been widely used in research and applications around the world, especially in gauge sparse
regions. TRMM products processed with GPM algorithms are also available [3]. Their data
format and naming convections are consistent with those of GPM [3]. TRMM LIS data are
archived at the Global Hydrology Resource Center (GHRC) [23]. Studies to investigate the
relationship between lightning and precipitation have been reported (e.g. [24]).
Built on the success of TRMM, GPM [15] is another joint mission between NASA and
JAXA to continue key measurements after the TRMM era. The main concept of GPM is to form
an international constellation of research and operational satellites and use GPM as a core
satellite that carries advanced radar and passive microwave radiometer instruments to measure
precipitation from space as well as serve as a reference standard to unify precipitation
measurements from other domestic and international satellites in the constellation [15]. In
addition to the passive GPM microwave imager or GMI, a dual-frequency precipitation radar
(DPR) has been added in GPM (Fig. 5a). A new frequency (Ka-band) in the DPR is capable to
detect light rain from space, which is one of challenges in satellite precipitation retrieval

10
algorithms. The GMI carries four additional high frequency channels for measuring falling snow,
compared to the TMI. The GMI’s spatial resolution is improved significantly with a 1.2 m
diameter antenna [15].
GPM data products at GES DISC [25] are categorized also in three processing levels (Table
6). Like the TRMM era, a new multi-satellite, multi-retrieval product suite (IMERG) has been
developed, with significant improvements in both spatial (0.1 x 0.1 deg.) and temporal (half
hourly) resolutions over TMPA. There are three dataset categories in IMERG, Early, Late and
Final. The IMERG-Early provides near-real-time (latency: ~4 hours) global precipitation
estimates which are suitable for various research and applications such as flood watching. As
more data are available, IMERG-Late (latency: ~12 hours) provides better estimates on
precipitation than the Early. The IMERG Final (latency: ~3.5 months) is a research-grade dataset
that is bias corrected with ground gauge data from the Global Precipitation Climatology Centre
(GPCC). Figure 6 is an example of IMERG Final, showing the accumulated rainfall of Hurricane
Harvey during August 24-31, 2017.
3.3 MERRA-2 dataset collection
Datasets from the Modern-Era Retrospective analysis for Research and Applications, Version
2 (MERRA-2) are developed by the NASA Global Modeling and Assimilation Office (GMAO),
to place NASA’s Earth Observing System (EOS) satellite observations in a climate context and
to improve the representation of the atmospheric branch in the hydrological cycle from previous
reanalysis or MERRA [26]. MERRA-2, available from 1980 onwards, also includes the first
long-term global aerosol reanalysis through assimilating satellite-based observations and
representing their interactions with other physical processes in the Earth’s climate system [26].
There are 95 product groups and the file format is in NetCDF-4. Key meteorological variables in
11
MERRA-2 for tropical cyclone studies such as wind, air temperature, and geopotential height are
available at GES DISC. The spatial resolution is about 0.5 deg. x 0.625 deg. in the latitudinal and
longitudinal directions, respectively, with 42 pressure levels and 72 model levels. MERRA-2
temporal resolutions range from hourly, 3-hourly, daily to monthly. Initial evaluation of
MERRA-2 has been done and is available on the GMAO website [27].
4. Tools and Data Services at GES DISC
4.1 Tools
In research, data evaluation is often the first step to examine and understand a new physical
dataset. Due to the complexity of satellite-based datasets, it is not an easy task to conduct such a
task, especially for those without some prior knowledge about the dataset. Over the years, many
tools have been developed by different organizations to facilitate such tasks. In this chapter, we
describe two popular tools, GES DISC Giovanni and NASA GISS Panoply.
4.1.1 GES DISC Giovanni
Giovanni [4-7, 28] provides a simple and easy way to analyze and visualize more than 2000
satellite- and model-based physical parameters archived at GES DISC without downloading data
and software. Variables of many well-known satellite missions and projects mentioned earlier
such as TRMM, GPM, MERRA2, etc. are included in Giovanni.
Giovanni was first developed at the beginning of the TRMM era when TRMM TMPA
datasets were available to the public [6]. Precipitation is a very popular variable and is used in
many disciplines such as hydrology and agriculture. At that time, standard archived TMPA files
were written in HDF4, a format that was not well known outside the remote sensing community.
As a result, many TRMM users had difficulties to handle such format, which was a major barrier
for TMPA data access and utilization. Recognizing this problem, scientists and software
12
engineers at GES DISC worked closely with the TMPA product provider and developed a Web-
based tool, the TRMM Online Visualization and Analysis System (TOVAS) [6]. With a Web
browser, one can obtain average and accumulated rainfall maps as well as time series plots and
Hovmöller diagrams in their areas of interest. Users can download results in several commonly
used formats such as ASCII which can be directly imported into Microsoft Excel for further
processing. Later, several MODIS atmospheric products (e.g. aerosols, atmospheric water vapor)
were added to TOVAS.
To meet an increasing demand for adding more analytical functions and variables, GES
DISC developed Giovanni, allowing functions and variables to be added through a Web-based
interface [4, 5]. In current version of Giovanni [7], more advanced information technologies have
been implemented in the development, such as having all variables accessible in one Web
interface, facet searching, sorting, provenance, etc. As of this writing, over 2000 variables from
different Earth science disciplines are available and searchable in Giovanni, including data sets
curated through other DAACs. More than 1300 referral research papers have been published by
users around the world, with help from Giovanni. In short, Giovanni provides an easy way to
evaluate and explore Earth science data at GES DISC.
With over 2000 variables in Giovanni, it is necessary to provide flexible search capabilities.
Frist, users can type in key words such as IMERG and see variables only related to the key
words. Often results from a search can contain many variables. For example, a search for
precipitation returns 143 variables. To locate those of interest, one can sort the results based on
source, spatial and temporal resolutions, begin or end dates. Facets have been developed to help
narrow down search results, including disciplines, measurements, platform/instrument, spatial
resolutions, temporal resolutions, wavelengths, etc.
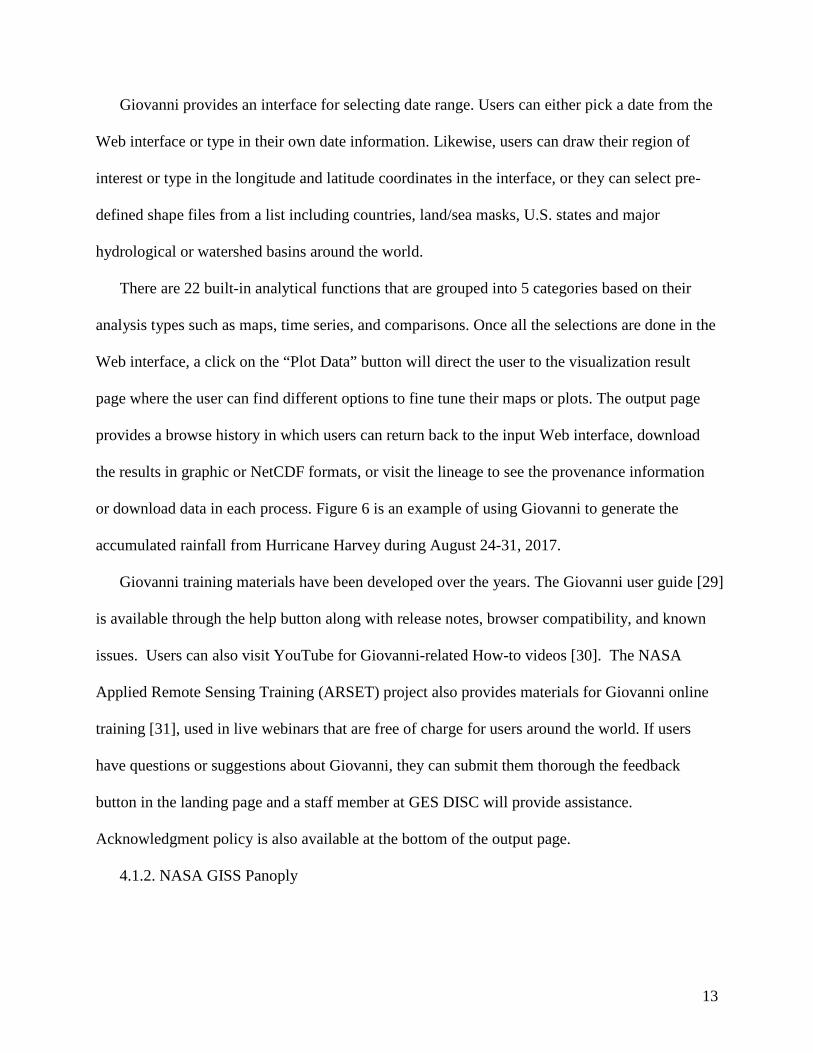
13
Giovanni provides an interface for selecting date range. Users can either pick a date from the
Web interface or type in their own date information. Likewise, users can draw their region of
interest or type in the longitude and latitude coordinates in the interface, or they can select pre-
defined shape files from a list including countries, land/sea masks, U.S. states and major
hydrological or watershed basins around the world.
There are 22 built-in analytical functions that are grouped into 5 categories based on their
analysis types such as maps, time series, and comparisons. Once all the selections are done in the
Web interface, a click on the “Plot Data” button will direct the user to the visualization result
page where the user can find different options to fine tune their maps or plots. The output page
provides a browse history in which users can return back to the input Web interface, download
the results in graphic or NetCDF formats, or visit the lineage to see the provenance information
or download data in each process. Figure 6 is an example of using Giovanni to generate the
accumulated rainfall from Hurricane Harvey during August 24-31, 2017.
Giovanni training materials have been developed over the years. The Giovanni user guide [29]
is available through the help button along with release notes, browser compatibility, and known
issues. Users can also visit YouTube for Giovanni-related How-to videos [30]. The NASA
Applied Remote Sensing Training (ARSET) project also provides materials for Giovanni online
training [31], used in live webinars that are free of charge for users around the world. If users
have questions or suggestions about Giovanni, they can submit them thorough the feedback
button in the landing page and a staff member at GES DISC will provide assistance.
Acknowledgment policy is also available at the bottom of the output page.
4.1.2. NASA GISS Panoply

14
Although users can access over 2000 variables through Giovanni, all these variables are in
Level-3. While adding data variables from other levels in Giovanni are being considered, users
can use Panoply [32], developed by NASA Goddard GISS, to view Level-2 and Level-3 data.
Panoply is another powerful tool for viewing NASA data. Panoply can be installed in several
platforms and operating systems (e.g. macOS, Windows), requiring Java 8 or later version
installed in their systems. Most datasets archived at GES DISC can be viewed by Panoply. Once
Panoply is installed, there are several ways to import data to Panoply. If NetCDF-3 or NetCDF-4
is the default setting for opening files in the system, Panoply will automatically open the file
when you download it from GES DISC. Popular Level-2 and Level-3 datasets are often available
in OPeNDAP and GrADS Data Server (GDS). Users can directly use their dataset links in
Panoply to visualize the variables. Although analytical functions in Panoply are quite limited, it
is so far an easy way to visualize datasets that are currently not available in Giovanni (Figs. 3, 4
and 5a).
4.2 Data services
Data services are essential for data archive centers. The totally redesigned GES DISC
website [3] (Fig. 1) makes datasets, documents and help information easy to find. Due to a large
volume of datasets and information archived at GES DISC, a search capability is necessary to
facilitate dataset discovery and exploration. From the search box (Fig. 1), users can search
datasets and information in the following categories: data collections, data documentation, alerts,
FAQs, glossary, How-to’s, image gallery, news and tools. The category for data collections is the
default since many users come to GES DISC for datasets. Users can also browse data by
category, including, subject, measurement, source, processing level, project, temporal resolution

15
and spatial resolution. As of this writing, the GES DISC archives more than ~2.3 PB data with
over 117 million files. Over 2.4 billion files have been distributed with data volume over 23 PB.
After a user types in a key word in the search box (Fig. 1), the search results are listed.
Faceting and sorting are available for identifying datasets of interest, similar to those in Giovanni.
For example, a search for IMERG returns 15 datasets and users can use Version to sort different
versions and find out the datasets of the latest version. “Get Data” or “Subset / Get Data” right
below a dataset name provides a direct link to the data download interface. A click on a dataset
name leads to the dataset landing page with more information on dataset summary, data citation,
documentation and more data access methods including links to online archive, Giovanni, Web
services such as OPeNDAP, GDS, and THREDDS (the Thematic Real-time Environmental
Distributed Data Services) available for some popular datasets.
Most NASA datasets are global coverage. Many study areas are either local or regional;
therefore, spatial subsetting is important to reduce download volumes, permitting the user more
time to do research. Spatial subsetting is available for a large number of datasets at GES DISC.
Users can use a computer mouse to drag an area of interest or type in the geolocation coordinates
in the subsetter interface. Some subsetters can do more than spatial subsetting such as parameter
subsetting, i.e., selecting wanted variables from a list, which can also help reduce data to be
downloaded. For MERRA-2 data, the subsetter can also regrid the original MERRA-2 data into
different grid structures with a list of interpolation methods (e.g., bilinear, bicubic). Furthermore,
the MERRA-2 subsetter can subset data at pressure levels. NetCDF-4 is available for many
datasets at GES DISC, which can be handled by many software packages or tools such as
Panoply, ArcGIS.
16
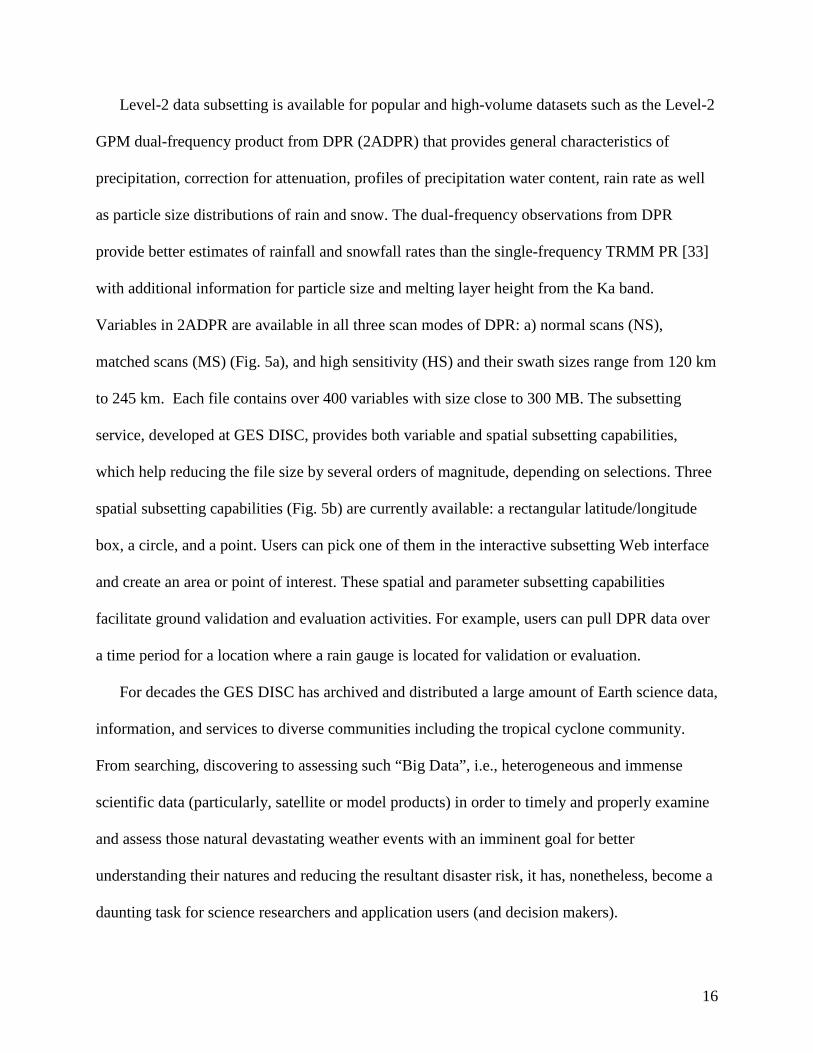
Level-2 data subsetting is available for popular and high-volume datasets such as the Level-2
GPM dual-frequency product from DPR (2ADPR) that provides general characteristics of
precipitation, correction for attenuation, profiles of precipitation water content, rain rate as well
as particle size distributions of rain and snow. The dual-frequency observations from DPR
provide better estimates of rainfall and snowfall rates than the single-frequency TRMM PR [33]
with additional information for particle size and melting layer height from the Ka band.
Variables in 2ADPR are available in all three scan modes of DPR: a) normal scans (NS),
matched scans (MS) (Fig. 5a), and high sensitivity (HS) and their swath sizes range from 120 km
to 245 km. Each file contains over 400 variables with size close to 300 MB. The subsetting
service, developed at GES DISC, provides both variable and spatial subsetting capabilities,
which help reducing the file size by several orders of magnitude, depending on selections. Three
spatial subsetting capabilities (Fig. 5b) are currently available: a rectangular latitude/longitude
box, a circle, and a point. Users can pick one of them in the interactive subsetting Web interface
and create an area or point of interest. These spatial and parameter subsetting capabilities
facilitate ground validation and evaluation activities. For example, users can pull DPR data over
a time period for a location where a rain gauge is located for validation or evaluation.
For decades the GES DISC has archived and distributed a large amount of Earth science data,
information, and services to diverse communities including the tropical cyclone community.
From searching, discovering to assessing such “Big Data”, i.e., heterogeneous and immense
scientific data (particularly, satellite or model products) in order to timely and properly examine
and assess those natural devastating weather events with an imminent goal for better
understanding their natures and reducing the resultant disaster risk, it has, nonetheless, become a
daunting task for science researchers and application users (and decision makers).

17
Aiming to substantially assist our users in their online effectively (i.e., quickly and properly)
acquiring the data they want and/or need a “one-stop shop” with a minimum effort from our
large data collection for their investigating and assessing the targeted disastrous weather such as
hurricanes, the GES DISC has recently developed a value-added and knowledge-based data
service prototype by preparing/presenting the “List” of relevant data and the pertinent resources
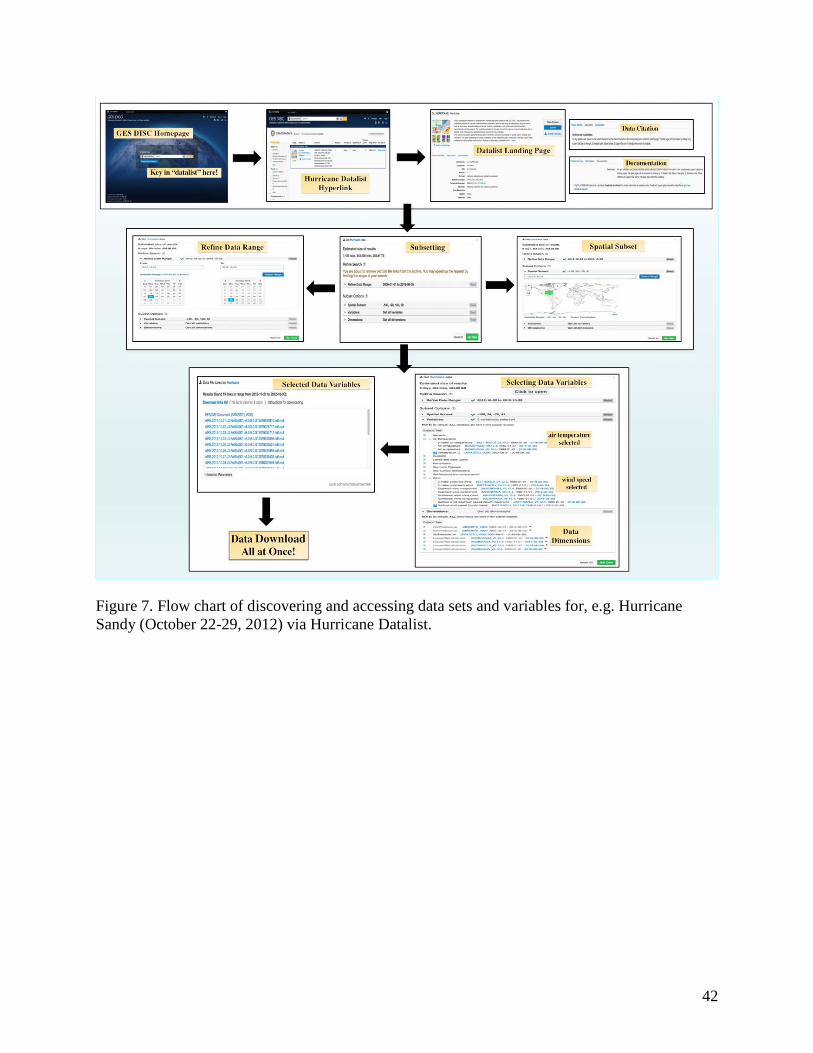
accordingly. Such a data service framework, termed as “Datalist” (currently containing
“Hurricane Datalist” only), which basically consists of suites of annotated Web addresses (URLs)
that point to the proper and relevant data and resource addresses “one-stop shop”. Figure 7
(concept based on [34, 35]) shows a basic workflow of how a user can online, via accessing
Hurricane Datalist, acquire and assess the respective datasets (down to the variable level such as
wind and air temperature, etc.) or services (such as Subsetting and Giovanni) they want or need
relevant to their targeted hurricane event, e.g., Hurricane Sandy (October 22-29, 2012) over the
US continent and coast area at one stop. Basically, through visiting the Hurricane Datalist page
(Fig. 7), users can readily choose and apply those handy “Subsetting” options of: 1) refining data
temporal range; 2) selecting spatial domain; 3) choosing targeted variables, and acquiring and
downloading the data they want and/or need. Moreover, a useful “window shopping” service is
offered to users, allowing them to utilize Giovanni to plot and view their interested variables pre-
“data downloading” that help them make proper decisions. Figure 8 shows two maps produced
with Giovanni for the two sampled data variables, i.e., the MERRA-2 wind speeds (Fig. 8a) and
the AIRS air temperature (Fig. 8b).
Users must register the NASA Earthdata login system before downloading data from any
NASA data center (including GES DISC). A help feature [3] is available to assist users when
they have questions about data and services, which can be very helpful for those who are not

18
familiar with NASA satellite datasets and may not know where to begin. Using this feature, GES
DISC staff and supporting scientists can guide users regarding questions related to datasets, tools,
documentation and services. FAQs and How-To recipes are also available and searchable.
5. Case Studies
5.1 Case 1: Evaluation of MERRA-2 precipitation during Hurricane Katrina landfall
Evaluation (e.g. comparison) of a dataset prior to download is important to understand (for
example) any biases or systematic differences in datasets, which is quite common for remote
sensing and model datasets. Over oceans, few in-situ observations are available, especially for
precipitation, making it very difficult to assess their biases. MERRA-2 datasets provide over 39
years of continueous analysis ranging from hourly to monthly, as mentioned earlier, and can be
used to study events and environmental changes (e.g. trends) in tropical oceans and other regions
as well.
There are two types of precipitation parameters in MERRA-2: a) precipitation from the
atmospheric model (variable PRECTOT in the MERRA-2 dataset collection) and b) observation-
corrected precipitation (variable PRECTOTCORR) [36, 37]. Observational data are introduced
in the latter parameter due to considerable errors that propagate into land surface hydrological
fields and beyond [38].
Bosilovich et al. [37] have conducted a general evaluation of MERRA precipitation estimates,
including precipitation climatology, interannual variability, diurnal cycle, Madden-Julian
Oscillation (MJO) events, global water cycle and U.S. summertime variability. Although the
preliminary evaluation provides a basic understanding of the MERRA-2 precipitation products,
evaluation for extreme weather events is still needed to better understand MERRA-2
precipitation behavior and characteristics.
19
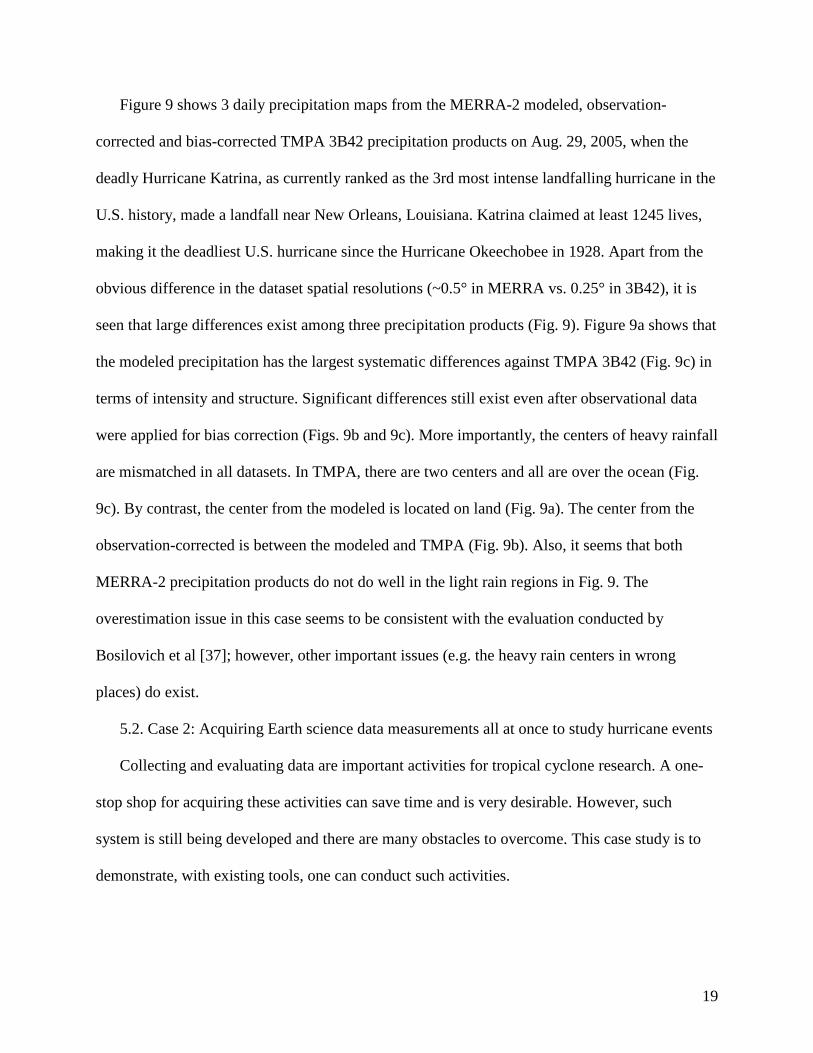
Figure 9 shows 3 daily precipitation maps from the MERRA-2 modeled, observation-
corrected and bias-corrected TMPA 3B42 precipitation products on Aug. 29, 2005, when the
deadly Hurricane Katrina, as currently ranked as the 3rd most intense landfalling hurricane in the
U.S. history, made a landfall near New Orleans, Louisiana. Katrina claimed at least 1245 lives,
making it the deadliest U.S. hurricane since the Hurricane Okeechobee in 1928. Apart from the
obvious difference in the dataset spatial resolutions (~0.5° in MERRA vs. 0.25° in 3B42), it is
seen that large differences exist among three precipitation products (Fig. 9). Figure 9a shows that
the modeled precipitation has the largest systematic differences against TMPA 3B42 (Fig. 9c) in
terms of intensity and structure. Significant differences still exist even after observational data
were applied for bias correction (Figs. 9b and 9c). More importantly, the centers of heavy rainfall
are mismatched in all datasets. In TMPA, there are two centers and all are over the ocean (Fig.
9c). By contrast, the center from the modeled is located on land (Fig. 9a). The center from the
observation-corrected is between the modeled and TMPA (Fig. 9b). Also, it seems that both
MERRA-2 precipitation products do not do well in the light rain regions in Fig. 9. The
overestimation issue in this case seems to be consistent with the evaluation conducted by
Bosilovich et al [37]; however, other important issues (e.g. the heavy rain centers in wrong
places) do exist.
5.2. Case 2: Acquiring Earth science data measurements all at once to study hurricane events
Collecting and evaluating data are important activities for tropical cyclone research. A one-
stop shop for acquiring these activities can save time and is very desirable. However, such
system is still being developed and there are many obstacles to overcome. This case study is to
demonstrate, with existing tools, one can conduct such activities.
20
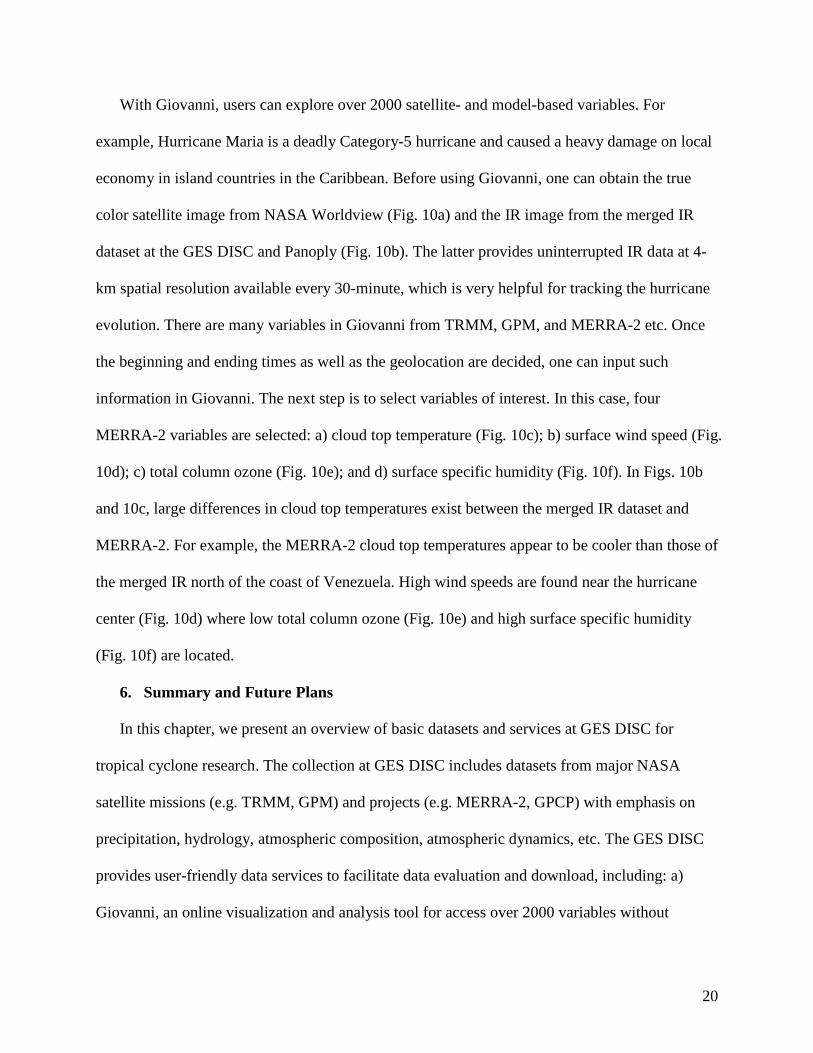
With Giovanni, users can explore over 2000 satellite- and model-based variables. For
example, Hurricane Maria is a deadly Category-5 hurricane and caused a heavy damage on local
economy in island countries in the Caribbean. Before using Giovanni, one can obtain the true
color satellite image from NASA Worldview (Fig. 10a) and the IR image from the merged IR
dataset at the GES DISC and Panoply (Fig. 10b). The latter provides uninterrupted IR data at 4-
km spatial resolution available every 30-minute, which is very helpful for tracking the hurricane
evolution. There are many variables in Giovanni from TRMM, GPM, and MERRA-2 etc. Once
the beginning and ending times as well as the geolocation are decided, one can input such
information in Giovanni. The next step is to select variables of interest. In this case, four
MERRA-2 variables are selected: a) cloud top temperature (Fig. 10c); b) surface wind speed (Fig.
10d); c) total column ozone (Fig. 10e); and d) surface specific humidity (Fig. 10f). In Figs. 10b
and 10c, large differences in cloud top temperatures exist between the merged IR dataset and
MERRA-2. For example, the MERRA-2 cloud top temperatures appear to be cooler than those of
the merged IR north of the coast of Venezuela. High wind speeds are found near the hurricane
center (Fig. 10d) where low total column ozone (Fig. 10e) and high surface specific humidity
(Fig. 10f) are located.
6. Summary and Future Plans
In this chapter, we present an overview of basic datasets and services at GES DISC for
tropical cyclone research. The collection at GES DISC includes datasets from major NASA
satellite missions (e.g. TRMM, GPM) and projects (e.g. MERRA-2, GPCP) with emphasis on
precipitation, hydrology, atmospheric composition, atmospheric dynamics, etc. The GES DISC
provides user-friendly data services to facilitate data evaluation and download, including: a)
Giovanni, an online visualization and analysis tool for access over 2000 variables without

21
downloading data and software; b) data subsetting services that allow spatial and variable
subsetting of Level-2 and Level-3 datasets; c) different data access methods (online archive,
OPeNDAP, GDS, THREDDS) and data formats for a wide variety of users with various
technical expertise in handling complex remote sensing datasets; d) information about
documentation and data citation; and e) user services to answer data or service related questions.
We present two case studies to show how our datasets can be used in tropical cyclone
research. In the first case, three different precipitation datasets were compared during the landfall
of Hurricane Katrina. Results show that large differences exist among the three datasets. The
MERRA-2 modeled precipitation has a large wet bias compared to the other two datasets. The
areas of heavy precipitation for both modeled and observation-corrected are different from those
of 3B42. The results suggest that these differences need to be considered when using the model
precipitation products. The second case is an example of exploring different satellite- and model-
based variables from existing data services and tools such as Worldview, Panoply and Giovanni.
Two main areas are focused in future plans: datasets and services. First, as mentioned earlier,
NASA Earth data are archived at 12 discipline-oriented data centers across the United States.
Datasets at other NASA data centers are also important for tropical cyclone research. For
example, the Physical Oceanography DAAC at JPL archives key measurements for tropical
cyclone research such as satellite-based ocean surface wind, sea surface temperature, etc. NASA
airborne and field campaign datasets for hurricane research, archived at the Global Hydrology
Resource Center, play an important role in product validation and case studies. One challenge is
to facilitate data discovery and access across the DAACs because relevant datasets are located in
different or multiple centers and each center has its unique Web interface for ordering data as
well as tools for customized analysis and visualization, which may create problems to some users.

22
It would be more user-friendly and efficient to have a one-stop Web interface with data services
for acquiring datasets from different data centers. Prototypes have been developed specifically
for tropical cyclone research, but they have not been fully integrated into operation and only
limited datasets are available; therefore, the datasets can be incomplete. Currently, only NASA
Earthdata allows searching datasets from the 12 NASA data centers with very limited data
services available. As well, tools can be consolidated and further developed to facilitate access to
datasets at different data centers. More on this is to be elaborated in the services.
Analysis-ready data can save time and expedite research and discovery because data are pre-
processed at a data center based on research needs. These data are friendly to user’s written
analysis software or publicly available software packages or tools. For example, time series data
subsetting can be a challenging issue for some communities (e.g. hydrology). NASA data are file
based, one-time step per file with complex data structures containing few or more variables,
which is not optimal for time series data access [39]. To make data analysis ready, data may need
to be re-organized for efficient access, such as is demonstrated by the data rods concept [39].
Increasingly, machine learning (ML) and artificial intelligence (AI) algorithms are being used in
many areas including tropical cyclone research. Training data play an important role in both ML
and AI development and applications. Making training data from collections at DAACs analysis
ready (e.g. providing event-based data subsets) can save time for downloading data and
processing.
The NASA's Earth Observing System Data and Information System (EOSDIS) cloud
evolution [40] is a project to deploy NASA Earth science data and services into a commercial
cloud environment to improve data accessibility and serviceability across all NASA DAACs.
Prototypes are currently in development to demonstrate cross-DAAC data discovery, access and

23
servicing. Some datasets are moving natively and operationally into cloud environments as of
this writing, such as those from the upcoming Surface Water and Ocean Topography (SWOT).
Selected GES DISC datasets are scheduled to be deployed into a cloud environment in 2020,
including the IMERG and MERRA-2 collections. Placing the EOSDIS archive collectively in the
cloud will, for the first time, place NASA Earth Observation (EO) data “close to compute” and
improve management and accessibility of these data while also expediting science discovery for
data users. This will also enable large-scale data analytics for data users, especially allow more
efficient use data from multiple DAACs.
As mentioned earlier, NASA Earth science data collected from satellites, model assimilation,
airborne missions, and field campaigns are large, complex and evolving. It can be a daunting
task to obtain data from different centers with different interfaces or tools. Data services
increasingly play an important role to facilitate data discovery, access, and exploration. Data
services at GES DISC are evolving as well. For example, our currently predefined Datalist by no
means can contain variables in all possible research topics in hurricane research. User defined
Datalist would allow users to define their own Datalist is the next thing to be developed. The
user defined Datalist not only can save time for dataset search, but also can be sharable to other
collaborators or scientists.
Since tropical cyclone research can be categorized based on different spatial and temporal
scales. For mesoscale or synoptic scale, event case studies are heavily conducted in tropical
cyclone research, requiring that an event information can be easily retrieved from a database (e.g.
Hurricane best track data or HURDAT) in order to locate relevant datasets for subsetting,
analysis and visualization with that information (spatial and temporal constrains). Furthermore,
datasets can also be searched and located based on other information such as track, intensity, or

24
criteria set by users. At present, neither Giovanni nor the GES DISC Web interface has such
capabilities. Adding such event databases can also create data subsets for other research activities
such as wild fires, volcanic eruptions, heat waves, snow storms, nor’easters.
Integration, analysis and visualization for NASA Level-2 and airborne products are
challenging because there are a lot of data-related issues such as formats, structures, terminology,
etc. Furthermore, integration of Level-2 and Level-3 products is also needed since model and
multi-satellite products (MERRA-2, IMERG) are gridded Level-3 products. The first challenge
is to be able to locate (then collocate) available datasets (e.g. swath) for an event and subset the
data for the area of interest. The latter work has been done for some GPM products at GES DISC,
as mentioned earlier. Customized development is necessary to deal with different data structures
from different satellite missions as well as airborne and field campaigns, requiring a close
collaboration among data centers. At present, there is no Level-2 dataset in Giovanni. Adding
Level-2 datasets and airborne data in Giovanni is important to significantly expand the
capabilities of Giovanni in tropical cyclone research because observations are very limited over
vast tropical oceans and all these available observations are important for a wide variety of
research activities, regardless. Participation and feedback from users or stakeholders always
plays a key role to ensure development results to be user friendly and useful.
For climate scale, data services need to provide essential information and datasets including
climatological datasets (e.g. sea surface temperature, ocean surface wind speed), anomalies,
trends, etc. to help researchers to understand changes and trends in environmental conditions
over tropical oceans where tropical cyclones are born and developing. Long-term datasets are
important, such as MERRA-2 datasets provide over 39 years of global assimilation analysis
(1980 – present) which is suitable for generating climatological datasets. Giovanni provides on-

25
the-fly generation of climatology and time series plots for several key datasets, such as MERRA-
2, TMPA, and IMERG, for tropical cyclone research.
Acknowledgements: We thank scientists and engineers at GES DISC for their contributions
to data management, distribution, and development of data services. We also thank scientific
investigators and many users for their feedback and suggestions that improve our data services.
GES DISC is funded by NASA’s Science Mission Directorate.

26
References:
[1] Kidder S.Q. and T. H. von der Haar, 1995, Satellite Meteorology ‐ An introduction. Academic Press. 1995. Pp 466. ISBN 012 406430 2.
[2] Datta, A. 2019, A brief history of weather satellites, Available online: https://www.geospatialworld.net/blogs/a-brief-history-of-weather-satellites/, last accessed: August 11, 2019.
[3] NASA GES DISC, 2019, The NASA GES DISC Website, Available online: https://disc.gsfc.nasa.gov/ last accessed: August 11, 2019.
[4] Acker, J. G., and G. Leptoukh (2007), Online analysis enhances use of NASA Earth science data, Eos Trans. AGU, 88(2), 14–17, https://doi.org/10.1029/2007EO020003.
[5] Berrick, S. W., et al., 2009, Giovanni: A Web service workflow-based data visualization and analysis system, IEEE Trans. Geosci. Remote Sens., 47(1), 106–113, https://doi.org/10.1109/TGRS.2008.2003183.
[6] Liu, Z., et al., 2007, Online visualization and analysis: A new avenue to use satellite data for weather, climate, and interdisciplinary research and applications, in Measuring Precipitation from Space: EURAINSAT and the Future, Adv. Global Change Res. Ser., vol. 28, edited by V. Levizzani et al., pp. 549–558, Springer, New York, https://doi.org/10.1007/978-1-4020-5835-6.
[7] Liu, Z., and J. Acker, 2017, Giovanni: The bridge between data and science, Eos, 98, https://doi.org/10.1029/2017EO079299. Published on 24 August 2017.
[8] Nature, 2019, Scientific Data, Available online: https://www.nature.com/sdata/, last accessed: August 11, 2019.
[9] NASA, 2019, New Data from Old Satellites: A Nimbus Success Story, Available online: https://earthdata.nasa.gov/new-data-from-old-satellites-a-nimbus-success-story, last accessed: August 11, 2019.
[10] NASA NSIDC, 2019, The Nimbus Data Rescue Project, Available online: https://nsidc.org/data/nimbus, last accessed: August 11, 2019.
[11] Janowiak J. E., R. J. Joyce, and Y. Yarosh, 2001: A Real-Time Global Half-hourly Pixel-Resolution Infrared Dataset and Its Applications. Bull. Amer. Meteor. Soc., vol. 82, No.3., 205-217.
[12] NASA GES DISC, 2019, NOAA/NCEP/CPC Half Hourly 4km Global (60S - 60N) Merged IR, Available online: https://disc.gsfc.nasa.gov/datasets/GPM_MERGIR_V1/summary, last accessed: August 11, 2019.
[13] Huffman, G.J., D.T. Bolvin, D. Braithwaite, K. Hsu, R. Joyce, C. Kidd, E.J. Nelkin, P. Xie, 2019, IMERG Algorithm Theoretical Basis Document (ATBD) Version 06, Available online, https://pmm.nasa.gov/sites/default/files/document_files/IMERG_ATBD_V06.pdf, last accessed: August 11, 2019.
[14] Joyce, R. J., J. E. Janowiak, P. A. Arkin, and P. Xie, 2004: CMORPH: A method that produces global precipitation estimates from passive microwave and infrared data at high spatial and temporal resolution. J. Hydromet., 5, 487-503.
[15] Hou, A. Y., and Coauthors, 2014: The Global Precipitation Measurement mission. Bull. Amer. Meteor. Soc., 95, 701–722, https://doi.org/10.1175/BAMS-D-13-00164.1.
[16] NASA GSFC PPS and X-Cal Working Group, 2017, Algorithm Theoretical Basis Document (ATBD) NASA Global Precipitation Measurement Level 1C Algorithms Version 1.8, Available online: https://pps.gsfc.nasa.gov/Documents/L1C_ATBD.pdf, last accessed: August 11, 2019.

27
[17] Garstang, M., and C. D. Kummerow, 2000: The Joanne Simpson Special Issue on the Tropical Rainfall Measuring Mission (TRMM). J. Appl. Meteor., 39, 1961.
[18] Liu, Z. D. Ostrenga, W. Teng and S, Kempler, 2012, Tropical Rainfall Measuring Mission (TRMM) Precipitation Data Services for Research and Applications, Bulletin of the American Meteorological Society, doi: http://dx.doi.org/10.1175/BAMS-D-11-00152.1
[19] NASA, 2019, NASA Data Processing Levels, Available online: https://earthdata.nasa.gov/collaborate/open-data-services-and-software/data-information-policy/data-levels, last accessed: August 11, 2019.
[20] Huffman, G. J., and Coauthors, 2007: The TRMM Multisatellite Precipitation Analysis (TMPA): Quasi-Global, Multiyear, Combined-Sensor Precipitation Estimates at Fine Scales. J. Hydrometeor., 8, 38–55.
[21] Huffman, G.J., R.F. Adler, D.T. Bolvin, E.J. Nelkin, 2010: The TRMM Multi-satellite Precipitation Analysis (TAMPA). Chapter 1 in Satellite Rainfall Applications for Surface Hydrology , F. Hossain and M. Gebremichael, Eds. Springer Verlag, ISBN: 978-90-481-2914-0, 3-22.
[22] Huffman, G.J. and D.T. Bolvin, 2013: TRMM and Other Data Precipitation Data Set Documentation. Available online: ftp://meso-a.gsfc.nasa.gov/pub/trmmdocs/3B42_3B43_doc.pdf, last accessed: August 11, 2019.
[23] NASA GHRC, 2019, Global Hydrology Resource Center, Available online: https://ghrc.nsstc.nasa.gov/home/, last accessed: August 11, 2019.
[24] Soula S., 2009, Lightning and Precipitation. In: Betz H.D., Schumann U., Laroche P. (eds) Lightning: Principles, Instruments and Applications. Springer, Dordrecht, ISBN: 978-1-4020-9078-3, DOI: https://doi.org/10.1007/978-1-4020-9079-0_20.
[25] Liu, Z., D. Ostrenga, B. Vollmer, et al. 2017. "Global Precipitation Measurement Mission Products and Services at the NASA GES DISC." Bulletin of the American Meteorological Society, 98 (3): 437-444 [10.1175/bams-d-16-0023.1].
[26] Gelaro, R., and Coauthors, 2017: The Modern-Era Retrospective Analysis for Research and Applications, version 2 (MERRA-2). J. Climate, 30, 5419–5454, https://doi.org/10.1175/JCLI-D-16-0758.1.
[27] NASA GMAO, 2019, Modern-Era Retrospective analysis for Research and Applications, Version 2, Available online: https://gmao.gsfc.nasa.gov/reanalysis/MERRA-2/, last accessed: August 11, 2019.
[28] NASA GES DISC, 2019, Giovanni, Available online: https://giovanni.gsfc.nasa.gov/giovanni/, last accessed: August 11, 2019.
[29] NASA GES DISC, 2019, Giovanni User Guide, Available online: https://giovanni.gsfc.nasa.gov/giovanni/doc/UsersManualworkingdocument.docx.html, last accessed: August 11, 2019.
[30] NASA GES DISC, 2019, Giovanni Tutorials on YouTube, Available online: https://www.youtube.com/results?search_query=nasa+giovanni+tutorial, last accessed: August 11, 2019.
[31] NASA ARSET, 2019, Applied Remote Sensing Training, Available online: https://arset.gsfc.nasa.gov/, last accessed: August 11, 2019.
[32] NASA GISS, 2019, Panoply, Available online: https://www.giss.nasa.gov/tools/panoply/download/, last accessed: August 11, 2019.
[33] Iguchi, T, S. Seto, R. Meneghini, N. Yoshida, J. Awaka, M. Le, V. Chandrasekar, and T. Kubota, 2017, GPM/DPR Level-2 Algorithm Theoretical Basis Document (ATBD),
28
Available online: https://pmm.nasa.gov/sites/default/files/document_files/ATBD_DPR_201708_whole_1.pdf, last accessed: August 11, 2019.
[34] Shie, C.-L., W. L. Teng, Z. Liu, T. Hearty, S. Shen, A. Li, M. Hegde, K. Bryant, E. Seiler and S. Kempler, 2016: Data List - Specifying and Acquiring Earth Science Data Measurements All at Once, the 2016 AGU Fall Meeting, 12-16 December 2016, San Francisco, CA.
[35] Li, A., M. Hegde, K. Bryant, E. Seiler, C.-L. Shie, W. L. Teng, Z. Liu, T. Hearty, S. Shen and S. J. Kempler, 2016: Data List: A Value-Added Service to Enable Easy Data Selection, the 2016 AGU Fall Meeting, 12-16 December 2016, San Francisco, CA.
[36] Reichle, R. H., and Q. Liu, 2014. Observation-Corrected Precipitation Estimates in GEOS-5. NASA/TM–2014-104606, Vol. 35.
[37] Bosilovich, M., S. Akella, L. Coy, R. Cullather, C. Draper, R. Gelaro, R. Kovach, Q. Liu, A. Molod, P. Norris, K. Wargan, W. Chao, R. Reichle, L. Takacs, Y. Vikhliaev, S. Bloom, A. Collow, S. Firth, G. Labow, G. Partyka, S. Pawson, O. Reale, S. Schubert, and M. Suarez, 2015. Techinical Report Series on Global Modeling and Data Assimilation, Vol. 43, R. Koster, Editor. Available online: http://gmao.gsfc.nasa.gov/pubs/tm/docs/Bosilovich803.pdf, last accessed: August 11, 2019.
[38] Rienecker, M.M., M.J. Suarez, R. Gelaro, R. Todling, J. Bacmeister, E. Liu, M.G. Bosilovich, S.D. Schubert, L. Takacs, G.-K. Kim, S. Bloom, J. Chen, D. Collins, A. Conaty, A. da Silva, et al., 2011, MERRA: NASA's Modern-Era Retrospective Analysis for Research and Applications. J. Climate, 24, 3624-3648, doi:10.1175/JCLI-D-11-00015.1.
[39] Teng, W., H. Rui, R. Strub, and B. Vollmer, 2016. Optimal reorganization of NASA earth science data for enhanced accessibility and usability for the hydrology community, Journal of the American Water Resources Association (JAWRA), 52(4), 825-835, doi:10.1111/1752-1688.12405.
[40] NASA, 2019, NASA Cloud Evolution, Available online: https://earthdata.nasa.gov/eosdis/cloud-evolution, last accessed: August 11, 2019.

29
Table 1. A brief history of the GES DISC • Mid-1980’s - one of two original DAACs (with NASA’s Langley Research Center) -
“Goddard DAAC” • 1990’s Version 0 era
• AVHRR (Advanced Very High Resolution Radiometer) pathfinder • TOVS (TIROS Operational Vertical Sounder) pathfinder • SeaWIFS (Sea-viewing Wide Field-of-view Sensor) • UARS (Upper Atmosphere Research Satellite)
• 1997 - TRMM (first EOS launch) • 2000/2002 - Terra/Aqua MODIS (Moderate Resolution Imaging Spectroradiometer) • 2005/2006 - EOSDIS evolution - split Goddard DAAC:
• GES DISC - atmosphere/hydrology/climate focus • Level 1 and Atmospheres Archive Distribution System (LAADS) - MODIS
instrument focus • Ocean Biology DAAC - ocean biology focus

30
Table 2. Past, current and future NASA satellite missions that are associated with their data products curated at GES DISC. * End-of-mission/project. Atmospheric composition missions:
• Nimbus 1-7* BUV, SBUV, TOMS • Shuttle SBUV* • UARS* • Aqua AIRS • Aura HIRDLS*, OMI, MLS • ACOS* • SNPP Sounder, OMPS • JPSS-1 Sounder, OMPS • OCO-2 • Copernicus Sentinel 5P • TOVS Pathfinder*
Water cycle/precipitation missions: • TRMM* • GPM • SMERGE
Climate variability/solar missions: • SORCE • TCTE • TSIS • CAR
Future assigned missions: • OCO-3 • TROPICS • Copernicus Sentinel 6 • GeoCarb
Model projects: • MERRA*/MERRA-2 • NLDAS, GLDAS, FLDAS, NCA-LDAS
Other projects: • MEaSUREs: Making Earth System Data Records for Use in Research Environments • CMS:
31
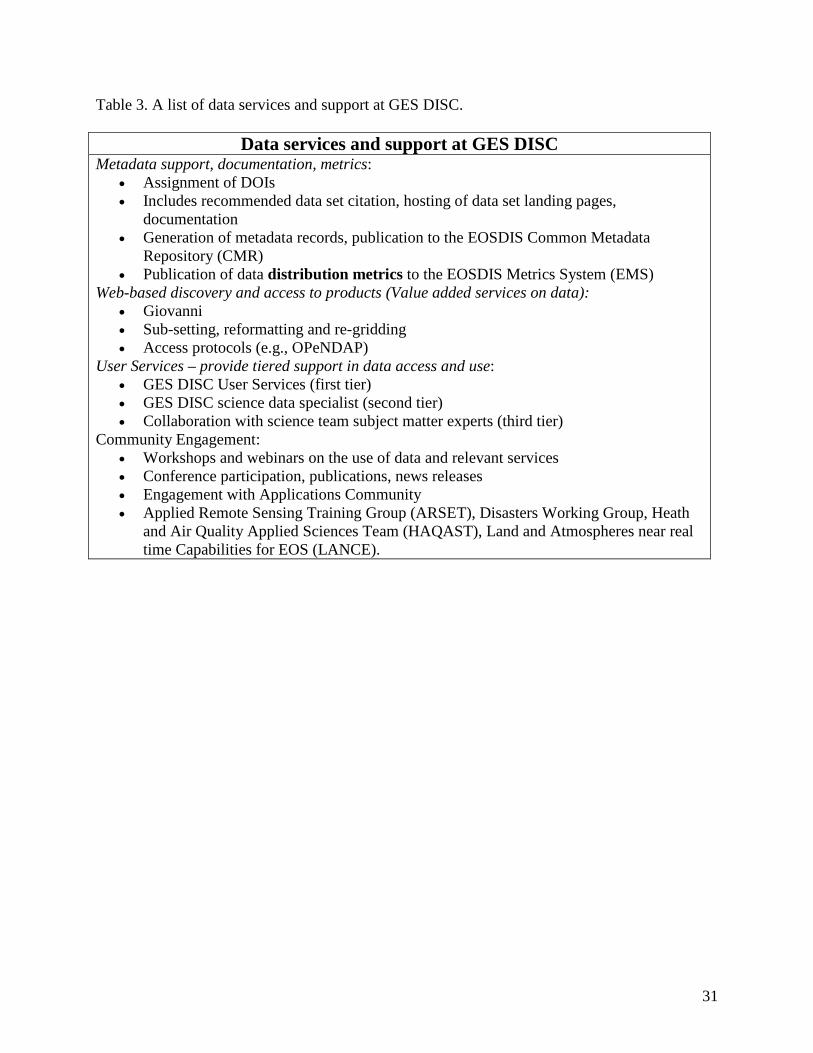
Table 3. A list of data services and support at GES DISC.
Data services and support at GES DISC Metadata support, documentation, metrics:
• Assignment of DOIs • Includes recommended data set citation, hosting of data set landing pages,
documentation • Generation of metadata records, publication to the EOSDIS Common Metadata
Repository (CMR) • Publication of data distribution metrics to the EOSDIS Metrics System (EMS)
Web-based discovery and access to products (Value added services on data): • Giovanni • Sub-setting, reformatting and re-gridding • Access protocols (e.g., OPeNDAP)
User Services – provide tiered support in data access and use: • GES DISC User Services (first tier) • GES DISC science data specialist (second tier) • Collaboration with science team subject matter experts (third tier)
Community Engagement: • Workshops and webinars on the use of data and relevant services • Conference participation, publications, news releases • Engagement with Applications Community • Applied Remote Sensing Training Group (ARSET), Disasters Working Group, Heath
and Air Quality Applied Sciences Team (HAQAST), Land and Atmospheres near real time Capabilities for EOS (LANCE).

32
Table 4. Instruments onboard the Nimbus satellites.
• The High Resolution Infrared Radiometer (HRIR) (Numbus-1, 2, 3)
• The Medium-Resolution Infrared Radiometer (MRIR) (Nimbus-3)
• The Satellite Infrared Spectrometer (SIRS) (Nimbus-3)
• The Nimbus-4 Selective Chopper Radiometer (SCR) (Nimbus-4, 5)
• The Infrared Interferometer Spectrometer (IRIS) (Nimbus-4)
• The Temperature-Humidity Infrared Radiometer (THIR) (Nimbus-4, 5, 6, 7)
• The Satellite Infrared Spectrometer (SIRS) (Nimbus-4)
• The Electrically Scanning Microwave Radiometer (ESMR) (Nimbus-5)
• The High Resolution Infrared Radiometer (HIRS) (Nimbus-6)

33
Table 5. A list of TRMM datasets at GES DISC. TRMM products processed with GPM algorithms are also available [3]. Their data format and naming convections are consistent with those of GPM. More information is available in each dataset landing page.
Processing Level Dataset Name Resolution
Level-1
• 1B01: Visible and infrared radiance
• 1B11: Passive microwave brightness temperature
• 1B21: Precipitation radar power
• 1C21: Precipitation radar reflectivity
5 km x 5 km - 16 orbits per day
Level-2
• 2A12: TMI hydrometeor profile
• 2A21: Precipitation radar surface cross-section
• 2A23: Precipitation radar rain characteristics
• 2A25: Precipitation radar rainfall rate and profile
• 2B31: Combined rainfall profile (PR, TMI)
5 km x 5 km - 16 orbits per day
Level-3
• 3A11: Oceanic rainfall • 3A12: Mean 2A12, profile
and surface rainfall • 3A25: Spaceborne radar
rainfall • 3A26: Surface rain total • 3A46: SSM/I rain • 3B31: Combined rainfall • 3B42RT: 3-hour real-time
TRMM Multi-satellite Precipitation Analysis (TMPA)
• 3B42RT daily: 3B42RT derived daily product
• 3B42: Research version of TMPA
• 3B42 daily: 3B42 derived daily product
• 3B43: Multi-satellite precipitation
• 3A11: 5 deg., monthly • 3A12: 0.5 deg., monthly • 3A25: 0.5 deg., 5 deg.,
monthly • 3A26: 5 deg., monthly • 3A46: 1 deg., monthly • 3B31: 5 deg., monthly • 3B42RT: 0.25 deg., 3-
hourly • 3B42RT daily: 0.25 deg.,
daily • 3B42: 0.25 deg., 3-hourly • 3B42 daily: 0.25 deg.,
daily • 3B43: 0.25 deg., monthly

34
Table 6. A list of GPM datasets at GES DISC. More information is available in each dataset landing page.
Processing Level Dataset Name Resolution
Level-1
• 1A-GMI: GMI packet data transmitted by the satellite
• 1B-GMI: GMI brightness temperatures
• 1C-GMI: Calibrated GMI brightness temperatures
• 1C-R: Common calibrated brightness temperatures collocated
• 1C-constellation: Calibrated brightness temperatures for each passive-microwave instrument in the GPM constellation
• 1A-GMI: 8km x 15km (varies based on scan position), 16 orbits per day
• 1B-GMI: Varies by Channel - 16 orbits per day
• 1C-GMI: Varies by Channel - 16 orbits per day
• 1C-R: Varies by Channel - 16 orbits per day
• 1C-constellation: Varies by satellite
Level-2
• 2A-GPROF-GMI: GMI single-orbit rainfall estimates
• 2A-GPROF-constellation: Single-orbit rainfall estimates from each passive-microwave instrument in the GPM constellation
• 2A-DPR: DPR Ka&Ku single orbit rainfall estimates
• 2A-Ka: DPR Ka-only single orbit rainfall estimates
• 2A-Ku: DPR Ku-only single orbit rainfall estimates
• 2B-CMB: Combined GMI + DPR single orbit rainfall estimates
• 2A-GPROF-GMI: 8km x 15km (varies based on scan position), 16 orbits per day
• 2A-GPROF-constellation: Varies by satellite
• 2A-DPR: 5.2km x 125m - 16 orbits per day
• 2A-Ka: 5.2km x 125m - 16 orbits per day
• 2A-Ku: 5.2km x 125m - 16 orbits per day
• 2B-CMB: 5km
Level-3
• 3-GPROF: GMI rainfall averages
• 3-GPROF Constellation: Gridded rainfall estimates
• 3-GPROF: 0.25 deg., daily and monthly
• 3-GPROF Constellation: 0.25 deg., daily and

35
from each microwave imager in the GPM constellation
• 3-DPR: DPR rainfall averages
• 3-CMB: Combined GMI + DPR rainfall averages
• IMERG: Rainfall estimates combining data from all passive-microwave instruments in the GPM Constellation (Early, Late, and Final)
monthly • 3-DPR: 0.25 deg., daily
and monthly • 3-CMB: 0.25 deg. and 5
deg., daily and monthly • IMERG: 0.1 deg., 30-
minute, daily, and monthly

36
Figure 1. The GES DISC website. This all-in-one design allows search for dataset and information at GES DISC. Users can access the latest news, projects, missions, tools, resources and more in this website.

37
Figure 2. A sample of HRIR/Nimbus-1 images of nighttime brightness bemperature on 70 mm film.
38
Figure 3. Two tropical cyclones (Cilida on the left and Kenanga on the right) are seen from the NCEP/CPC merged IR dataset on December 20, 2018. The map was generated with the NASA GISS Panoply.

39
Figure 4. GPM GMI surface precipitation from tropical cyclone Kenanga over the Indian Ocean on December 20, 2018. The data were generated by the GES DISC Level-2 subsetter and the map created with NASA GISS Panoply.

40
Figure 5. a): Near surface precipitation from the GPM DPR Matched Scans (MS), showing Super Typhoon Meranti on September 12, 2016 before impacting the Philippines, Taiwan and Fujian Province. The data were generated with the Level-2 subsetter and the map with NASA GISS Panoply. b): Three spatial subsetting options (box, circle and point) in the Level-2 subsetter.

41
Figure 6. Accumulated rainfall during August 24-31, 2017 from Hurricane Harvey. The map was generated with the GPM IMERG – Final daily dataset and Giovanni.
42
Figure 7. Flow chart of discovering and accessing data sets and variables for, e.g. Hurricane Sandy (October 22-29, 2012) via Hurricane Datalist.

43
Figure 8. a) MERRA-2 wind speeds, b) AIRS air temperature during October 28-29, 2012 involving Hurricane Sandy (October 22-29, 2012).

44
Figure 9. Daily precipitation total (in mm) during Hurricane Katrina landfall on August 29, 2005 from: a) MERRA-2 modeled precipitation; b) Observation-corrected precipitation; and c) TMPA 3B42.

45
Figure 10. Sample images of Hurricane Maria at 12Z September 19, 2017 from different datasets and services: a) True color image from Suomi NPP in NASA Worldview; b) NOAA/CPC Merged IR from the GES DISC archive; c) MERRA-2 cloud top temperature; d) MERRA-2 surface wind speed; e) MERRA-2 total column ozone; and f) MERRA-2 surface specific humidity.
Related Documents