1 Title: Field Tree Data Collection Protocol Project: Climate-Ready Trees PIs: Dr. E. Gregory McPherson. Dr. Alison Berry, Dr. Natalie van Doorn Last updated: 8-2-16 Data file: Climate-ready trees data x-xx-16.xlsx Column Variable Description Units Changes in use 1 Park park name none 2 Crew initials of field crew none 3 Date date of observation none 4 Id unique number assigned to each tree (numbered north to south) none 5 spcode 2-letter code consisting of the first letter of the genus name and the first letter of the species name none 6 Status tree’s existence none 7 crownvig considers cumulative vigor of crown in relation to twig dieback, defoliation, discoloration & branch loss none Only used in 2015 8 dbh1 diameter-at-breast-height (dbh) of tree (first stem if there are multiple). For trees of at least 2.5 cm diameter at 1.37 m or smaller but with single leader: record dbh with tape. See Fig. 1. For trees with stem diameter smaller than 2.5 cm at 1.37 m, the caliper should be measured at 30.5 cm (1ft) above the ground instead. When using caliper tools, record two perpendicular measurements, which will be averaged when this tree’s diameter is used in data analysis. See Fig. 2 Diagram A. For multi-stemmed trees, measure each stem (i.e. dbh1, dbh2, etc.) and record ht (i.e., dbhht1, dbht2, etc.). See Fig 2 Diagrams B-E for directions on where to measure. cm 9 dbhht1 height at which dbh of main stem was measured cm 10 dbh2 second dbh (if needed for multiple stems or as second caliper measure). See Eq. 1 in Appendix to calculate aggregate diameter. cm

Welcome message from author
This document is posted to help you gain knowledge. Please leave a comment to let me know what you think about it! Share it to your friends and learn new things together.
Transcript

1
Title: Field Tree Data Collection Protocol
Project: Climate-Ready Trees
PIs: Dr. E. Gregory McPherson. Dr. Alison Berry, Dr. Natalie van Doorn
Last updated: 8-2-16
Data file: Climate-ready trees data x-xx-16.xlsx
Column Variable Description Units Changes
in use
1 Park park name none
2 Crew initials of field crew none
3 Date date of observation none
4 Id unique number assigned to each tree
(numbered north to south)
none
5 spcode 2-letter code consisting of the first letter of
the genus name and the first letter of the
species name
none
6 Status tree’s existence none
7 crownvig considers cumulative vigor of crown in
relation to twig dieback, defoliation,
discoloration & branch loss
none Only
used in
2015
8 dbh1 diameter-at-breast-height (dbh) of tree (first
stem if there are multiple).
For trees of at least 2.5 cm diameter
at 1.37 m or smaller but with single
leader: record dbh with tape. See
Fig. 1.
For trees with stem diameter smaller
than 2.5 cm at 1.37 m, the caliper
should be measured at 30.5 cm (1ft)
above the ground instead. When
using caliper tools, record two
perpendicular measurements, which
will be averaged when this tree’s diameter is used in data analysis.
See Fig. 2 Diagram A.
For multi-stemmed trees, measure
each stem (i.e. dbh1, dbh2, etc.) and
record ht (i.e., dbhht1, dbht2, etc.).
See Fig 2 Diagrams B-E for
directions on where to measure.
cm
9 dbhht1 height at which dbh of main stem was
measured
cm
10 dbh2 second dbh (if needed for multiple stems or
as second caliper measure). See Eq. 1 in
Appendix to calculate aggregate diameter.
cm

2
11 dbhht2 height at which dbh2 was measured cm
12 dbh3 third dbh if needed for multiple stems cm
13 dbht3 height at which dbh3 was measured cm
14 treeht tree height from ground level to tree top
(omit erratic leader as shown in Fig. 3)
m
15 base average distance between ground and
lowest foliage layer (omitting erratic
branch)
m
16 cdiam1 crown diameter from north-south
(occasional erratic branch should not be
included, see Fig 4)
m
17 cdiam2 crown diameter from west-east m
18 treearch intrinsic architecture of the particular
species (central leader tree or lack of leader
dominance)
none
19 branchangle acute vs. wide branch angles none
20 folhealth defoliation, discoloration and damage none added in
2016
21 folinjury apparent cause(s) of damage to foliage none added in
2016
22 brhealth branch/twig dieback, discoloration and
damage
none added in
2016
23 brinjury apparent cause(s) of damage to branch(es) none added in
2016
24 trhealth percentage of trunk circumference with
wood decay at the point of decay; in the
case of multiple points, where decay is
greatest
none added in
2016
25 trinjury apparent cause(s) of damage to trunk none added in
2016
26 pestdisease1
(or 2 or 3 if
applicable)
only note the pest/disease symptoms that
are present. See Fig. 5 for examples
none
27 mulch average mulch depth to soil surface
measured at 0.5 m from trunk (n=none,
d=deep (>2”), t=thin (<2” or sporadic)
cm added in
2016
28 Photo photo number (unique for the date of
observation) of photo showing entire tree in
context of its immediate location and static
objects in the landscape (e.g. buildings)
none
29 Lat latitude decimals,
degrees
30 Long longitude decimals,
degrees
31 Notes note any management needs none

3

4
CODES
Variable: park
Description: 2-letter code representing park name
Code Description
CP Reference plot (UCD)
FL Fisherman's Lake
KB Kohl's bikepath
LC Laguna Creek
RP Regency Park
UR Reference plot (UCR)
HB Holleigh Bernson Memorial Park
HD Hansen Dam Recreation Area
VP Valley Plaza Recreation Center
WP Woodley Park
VD Vista Del Mar
JG Jim Gilliam Recreation Center
BO Bogdanovich
WE Westchester
SC Reference plot (South Coast)
Variable: spcode
Description: 2-letter code representing species name
Code Description
AA Acacia aneura Mulga
AS Acacia stenophylla Shoestring acacia
CF Cedrela fissilis Brazilian cedarwood
CR Celtis reticulata Netleaf hackberry
CL Chilopsis linearis ‘Bubba’ Desert Willow
CP Corymbia papuana
(formerly known as Eucalyptus papuana, EP)
Ghost gum
DS Dalbergia sissoo Rosewood
EE Ebenopsis ebano Texas ebony
HF Hesperocyparis forbesii Tecate cypress
MP Maclura pomifera ‘White Shield’ White Shield Osage Orange
PB Mariosousa willardiana Palo blanco
PD Parkinsonia x ‘Desert Museum’ Desert Museum palo verde
PR Pistacia 'Red Push' Red Push Pistache
PG Prosopis glandulosa x Maverick Thornless honey mesquite
PI Prunus ilicifolia subsp. lyonii Catalina cherry
QC Quercus canbyi Canby’s oak
QF Quercus fusiformis Escarpment live oak

5
QT Quercus tomentella Island oak
UP Ulmus propinqua Emerald Sunshine elm
Variable: status
Description: description of tree’s existence
Code Description
A Alive includes any tree with green leaves - even a
few leaves - and/or live buds, including
extremely unhealthy trees
Sd standing dead must be completely dead above-ground,
with no green leaves and no live buds
R removed and missing tree has been removed since the previous
observation with no new tree in its place
Rr removed and replaced previously inventoried tree has been
removed since the previous observation and
a new tree is in its place
U Unknown tree has unknown status (possibly due to
issues in accessing the property, or
confusion about location notes from the
previous field notes).
Variable: treearch
Description: tree architecture (leader dominance)
Code Description
c Central leader tree: single main trunk with smaller branch diameters. vs
b Branches vigorous- spreading or codominant: branch size equal to or greater
than leader, no single main trunk.
Variable: branchangle
Description: overall tree branch angle
Code Description
a acute: 0°-30° from vertical
w wide: 30°-45°
Variable: folhealth
Description: Percentage defoliation, discoloration and damage
Code Description
1 <5% no damage
2 5-20% slight damage
3 20-40% moderate damage
4 40-70% severe damage
5 >70% very severe damage

6
Variable: folinjury
Description: Apparent cause(s) of damage to foliage
Code Description
A Air pollution
B Boron toxicity
D Drought
E Excess water
F Frost/freezing damage
I Insects
M Mechanical damage
P Parasitic disease
SA Salinity/leaf burn
SB Sunburn/sunscald
U Unknown
V Vandalism
W Wind
Variable: brhealth
Description: Percentage branch/twig dieback, discoloration & damage
Code Description
1 <5% no damage
2 5-20% slight damage
3 20-40% moderate damage
4 40-70% severe damage
5 >70% very severe damage
Variable: brinjury
Description: Apparent cause(s) of damage to branch(es)
Code Description
A Air pollution
D Drought
E Excess water
F Frost/Cold damage
I Insects
M Mechanical damage
P Parasitic disease
SA Salinity
SB Sunburn/sunscald
U Unknown
V Vandalism
W Wind

7
Variable: trhealth
Description: Percentage of trunk circumference with wood decay at the point of decay;
in the case of multiple points, where decay is greatest.
Code Description
1 0-25% decay
2 26-50% decay
3 51-75% decay
4 76-100% decay
Variable: trinjury
Description: Apparent cause(s) of damage to trunk
Code Description
A Air pollution
D Drought
E Excess water
F Frost/freeze damage
G Girdling
I Insects
M Mechanical damage
P Parasitic disease
SA Salinity
SB Sunburn/sunscald
U Unknown
V Vandalism
W Wind
Variable: pestdisease1, pestdisease2, pestdisease3
Description: Code consists of 2-letter issue and severeness (Y/N). E.g. EH1, FRY)
Code Description
n No evidence of pests or diseases
AR Armillaria - 0 – No
1 - Yes
EH Exit holes - potential signs or symptoms
indicating presence of a boring insect infestation
or disease
1 - Pencil-width round exit
holes
2 - Small, D-shaped exit
holes
3 - Multiple exit holes the
size of a pen tip
4 - Tiny holes surrounded
by cankers
5 - Other

8
EX Exudation: Indicates the potential presence of
insects (e.g., GSOB, oak wilt, PSHB, sirex
woodwasp)
1 - Red or black staining
(“ooze”)
2 - Black fungal mat
present below cracked
bark
3 - Brown fungal mat
present in sapwood
4 - Shallow, round
discolored ‘divots’ 5 - Wet or dry
discoloration around exit
holes
6 - White powdery
substance around exit
holes
7 - Black or reddish ooze
around cankers
8 - White woolly egg
masses, undersides of
leaves
EG Eggs / Egg Sites = Indicates the potential
infestation of an egglaying insect of concern
(e.g., HWA, GM, EAB/ALB)
0 – No
1 - Yes
FR Frass = Indicates potential infestation by
barkboring insect (e.g., EAB, ALB)
0 – No
1 - Yes
ES Epicormic Sprouts = Indicates signs/ symptoms
of a tree under stress caused by either insects,
disease, or anthropogenic causes
0 – No
1 - Yes
WD Woodpecker Damage = Indicates the potential
presence of bark-boring insects
0 – No
1 - Yes
SG S-shaped Galleries = Indicates the presence of a
bark-boring insect
0 – No
1 - Yes
AL Adult Insect or Larvae presence = Indicates the
potential infestation of an egglaying insect of
concern (e.g., HWA, GM, EAB/ALB)
1 - Moth with white to
light brown wings
2 - Black beetle with white
spots and long antennae
3 - Small emerald green
beetle
4 - Small brown beetle
with orange spots on its
outer wings
5 - Caterpillar with three
sets of blue spots, sets of
red spots
6 - Tiny brown beetle

9
(PSHB)
7 - Bright green winged
insect (Citrus psyllid)
CR Bark Fissures/Cracks = Indicates potential
internal damage to inner bark/phloem as a result
of insect or pathogen
0 – No
1 - Yes
CA Cankers = A sign of death of the cambium due
to pathogen exposure and/or sunburn.
0 – No
1 - Yes
GA Galls = Galls are swellings or tumors that can be
on twig, branch, leaves. Indicates exposure to
pathogen or response to insect infestation.
0 – No
1 - Yes
FB Fruit/Bud Damage = Indicates potential
exposure to pests or diseases that affect fruit
trees (e.g., citrus greening), and tree buds in
general
1 - Misshapen fruits
2 - Discolored fruits
3 - Buds appear shriveled
LL Premature Leaf Loss = Indicates that the tree is
under stress due to pest infestation or exposure
to pathogen
0 – No
1 – Yes
LD Leaf Defoliation = Leaf defoliation is caused by
insects that feed on leaves. Certain insects feed
on the outer edges of leaves, others feed on the
inner parts of the leaf (nearest the midrib).
1 - Holes on leaves are
near outer edge of leaf
2 - Holes are closer to the
central vein (midrib) of the
leaf
WB Wilted or Browning Leaves = Wilted leaves are
an indication that the tree is not receiving
enough water either through lack of watering
(human), drought, disease or other sources of
damage limiting water uptake.
0 – No
1 – Yes
10
APPENDIX
A) Equation 1:
Multi-stemmed tree diameter = SQRT [SUM (stem diameter2)]
E.g., a multi-stemmed woodland tree with stems of 12.2, 13.2, 3.8, and 22.1 would be calculated
as:
= SQRT [(12.22)2 + (13.22)
2 + (3.82)
2 + (22.12)
2]
= SQRT (825.93)
= 28.7
B) Best practices for measuring diameter of a tree (and special considerations):

11
Figure 1A. Best practices for measuring dbh

12
Figure 1B. Example of measuring dbh incorrectly

13
Figure 1C. Special considerations for dbh

14
Figure 1C (cont’d). Special considerations for dbh
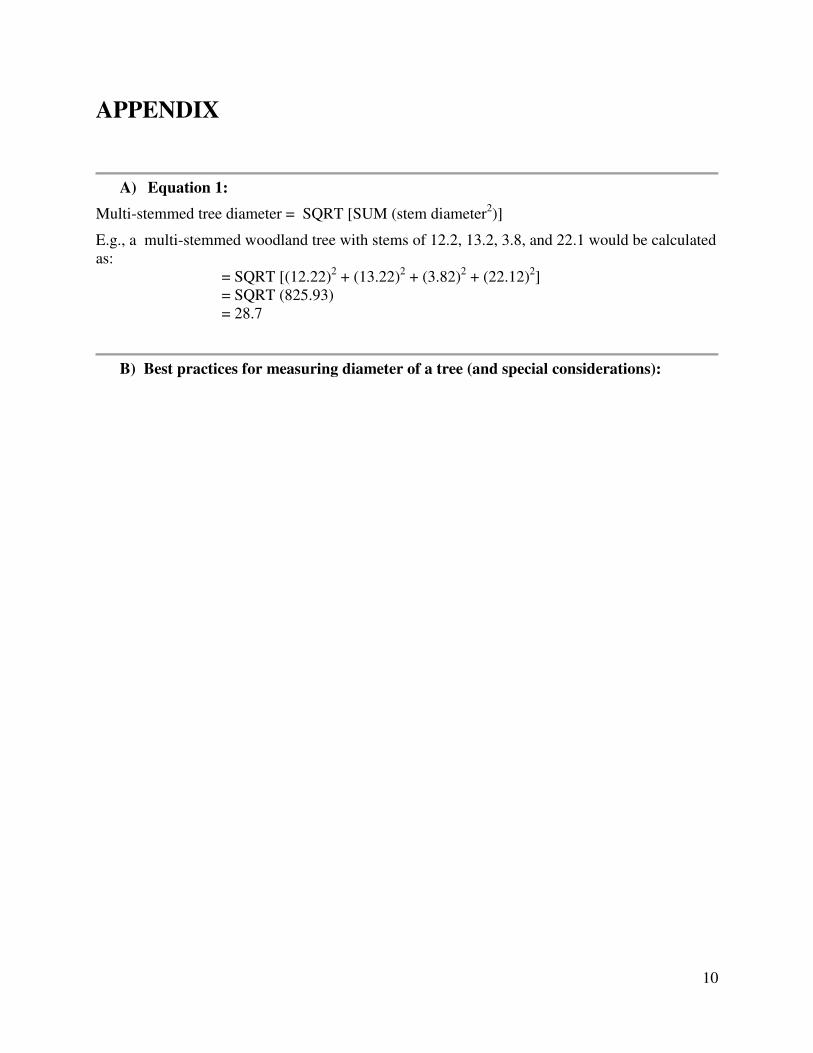
C) Multi-stem trees
Multi-stem trees, also called forked trees, often require extra time and attention to detail. In order
to qualify as a fork, the stem in question must be at least 1/3 the diameter of the main stem and
must branch out from the main stem at an angle of 45 degrees or less. In other words, you should
not record DBH for a low horizontal branch. Multi-stem trees are handled differently depending

15
on whether the fork originates below 1.0 ft (30.5 cm), between 1.0 ft (30.5 cm) and 4.5 ft (1.37
m), or above 4.5 ft (1.37 m). Use the diagrams below to help you determine how to record DBH
on multi-stem trees.
For the illustrations about multi-stem trees, the dashed lines indicate the pith – the tissue at the
center of each stem. Noting where the stems fork and imagining where the piths intersect with
multi-stem trees is the first step in figuring out how to record DBH for multi-stem trees. You will
have to take your best guess about where the piths intersect, but do not stress over it. As long as
the exact height of measurement is recorded, future field crews will be able to measure at the
same spot on the tree.
Important note: As with all DBH measurements, always record the exact height at which you
measured diameter, to ensure consistency with future data collection. For multi-stem trees, you
will record the DBH and height of DBH separately for each stem.
Figure 2.
16
Figure 2 (cont’d).

17
Figure 2 (cont’d).

18
Omit leader from total tree height measurement. Measure to white line.
Figure 2 (cont’d).
D) Measuring distance from ground to tree top.
Figure 3. Erratic leader is omitted from measurement of distance from ground level to tree top.
E) Measuring distance across crown

19
Crow n Diameter
Do not include this branch
Figure 4. Erratic branch (in box at left) is omitted from crown diameter measurement. Distance
measured is represented by white line.
F) Symptoms of pests and disease.

20
Figure 5. Examples of pest and disease symptoms (from urbantreegrowth.org)

21
Figure 5 cont’d . Examples of pest and disease symptoms (from urbantreegrowth.org)

22
Fig. 5 cont’d . Examples of pest and disease symptoms (from urbantreegrowth.org)
G) Symptoms of air pollution, boron toxicity, drought, excess water, frost/freeze damage,
girdling, insects, mechanical damage, parasitic disease, salinity, sunburn/sunscald,
vandalism, wind
Air pollution
The effects of pollution on plants include mottled foliage, “burning” at leaf tips or margins, twig dieback, stunted growth, premature leaf drop, delayed maturity, abortion or early drop of
blossoms, and reduced yield or quality (Figure G1). In general, the visible injury to plants is of
three types: (1) collapse of leaf tissue with the development of necrotic patterns, (2) yellowing or
other color changes, and (3) alterations in growth or premature loss of foliage.
The exposure of succulent, broad-leaved plants to sulfur dioxide (SO2) and its by-product
sulfuric acid usually results in dry, papery blotches that are generally white, tan, or straw-colored
and marginal or interveinal (Figure G2). Uninjured tissue next to the veins remains green. On
some species, chronic injury causes brown to reddish brown or black blotches (Figure G3). Both
the upper and lower leaf surfaces are affected. The leaf veins normally remain green. Chlorosis
(yellowing) and a gradual bleaching of the surrounding tissues is fairly common. Pan
(peroxyacetyl nitrate) exposure symptoms include patchy silvering or light tan glazing of lower
leaf surfaces. Affected leaf may exhibit spots or patches of papery thin almost transparent
tissues. Nitrous oxide causes yellowing of leaf margins and interveinal chlorosis.

23
Figure G1. Yellowish mottle and marginal
chlorosis on sweetgum leaf exposed to
flourides.
Figure G2. Marginal and interveinal necrosis
on American beech leaves exposed to sulfur
dioxide.
Figure G3. Dark, reddish pigmentation on
dogwood leaves exposed to sulfur dioxide.
Figure G4. Flecking as a result of ozone.
Acute symptoms of ozone vary from stippling, flecking (Figure G4), bleaching or dead areas.
Chronic injury develops more slowly over days or weeks. Upper surfaces of broadleaf plants
may have tan, red, brown, purple or black coloration (Figure G5). Yellowing usually occurs
when plants are exposed to low doses of ozone and tip burn appears from exposure to high doses
(Figure G6). This tip browning results from necrotic banding of medium aged tissue along the
middle of needles, which is the most sensitive. Tip burn symptoms affect all of the needles
equally on a branch. These dead needle tips may also break off over time giving the appearance
of shorter than normal needles.

24
Figure G5. Ozone damage symptoms include
upper surfaces of broadleaf plants having tan,
red, brown, purple or black coloration.
Figure G6. Molting and yellowing of needs
on a pine.
Sources: https://extension.umd.edu/hgic/air-
pollution-damage-trees-and-shrubs
http://www.aces.edu/pubs/docs/A/ANR-
0913/ANR-0913.pdf
Figure G7. Dark pigmented stipple on upper
surface of yellow poplar leaves exposed to
ozone.
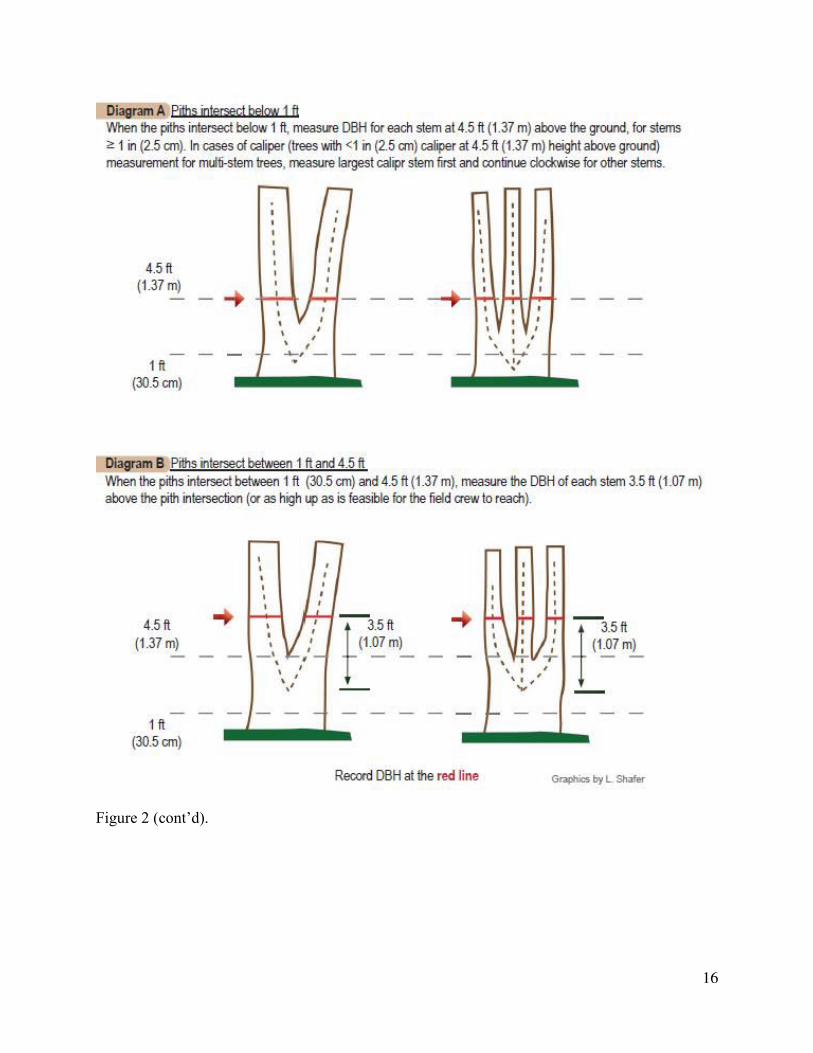
Boron toxicity
Symptoms of boron toxicity occur on older leaves of plants, and look much like symptoms of
high salinity, or of iron or manganese deficiencies. Early stages of boron toxicity show up as
chlorosis (yellowing) of leaf tips, and are followed by necrosis (death) of leaf margins and of the
tissues in between leaf veins (Figure G8). In particular, later stages of boron toxicity exhibit as
blackened areas or irregularly shaped black spots along leaf margins or between leaf veins,
depending on the plant species affected. Conifer needles die from the tip downward, with the
most extensive damage occurring on older needles. It must be emphasized that nutrient
deficiencies or specific ion toxicities cannot be accurately diagnosed by observing symptoms.
Soil, water and/or tissue samples should be tested where a definitive diagnosis is required.
Source: http://www.unce.unr.edu/publications/files/ho/2012/sp1204.pdf
25
Figure G8. Boron toxicity symptoms on bur oak
present as browning at the tips of the foliage.
Drought
Common symptoms of drought include:
wilting or drooping leaves that do not return to normal by evening,
curled or yellow leaves that may fold or drop,
foliage that becomes grayish and loses its green luster, or is already brown,
new leaves that are smaller or stem sections that are closer together than normal.
Excess water
Plants exposed to excess moisture often show similar symptoms as plants under drought stress.
The primary symptom of excess moisture is yellowing of lower and inner needles. If excess
water continues, plants may wilt, followed by scorch, needle drop, dieback or death. Excess
moisture can result if soil is poorly drained, naturally wet, or over watered.
Frost/freeze damage
Sometimes frost damage is apparent almost immediately following freezing. However, this is not
always the case and with some plants, particularly woody ones, the damage may take several
months to appear. Symptoms include:
Tender young growth may be damaged by spring frosts, causing scorching and pale
brown patches to appear between the leaf veins. This tends to be on the exposed and top
edges of the plant e.g. acer and carpenteria

26
Hard frost in winter can cause the leaves of hardy evergreen plants to be scorched and
turn brown, and may eventually lead to the death of the plant, e.g. bay and pittosporum
Spring frosts can damage blossoms and young fruits. This may cause a corky layer to
form at the flower end of the fruit i.e. apple and damage to blossom may lead to few or
no fruits forming
The foliage of certain plants exhibiting early symptoms of frost damage appears water-
soaked and dark-green, turning black in time
Source: https://www.rhs.org.uk/advice/profile?pid=704#section-2
Girdling
Girdling roots grow in a circular or spiral pattern. If left unchecked they eventually cut off the
sap flow from the stems and leaves (Figure G9). Girdling of the trunk may result from stake ties
being left on too long (Figure G10).
Figure G9. Figure G10.
Source: http://extension.umd.edu/hgic/girdling-
roots-trees-and-shrubs
Source:
http://www.umass.edu/urbantree/factsheets/
Images/stake_damage.jpg
Sunburn/ sunscald
Sunburn, or leaf scorch, is damage to foliage and other herbaceous plant parts caused by a
combination of too much light and heat and insufficient moisture. A yellow or brown area
develops on foliage, which then dies beginning in areas between the veins (Figure G11).
Sunscald is damage to bark caused by excessive light or heat. Sunscald-damaged bark becomes
cracked, sunken
Damage to tree trunks in most likely on the south and west sides of the tree where the sun is
strongest. Occasionally growth cracks form in the tree trunk as a normal part of trunk

27
development. Growth cracks can be differentiated from frost cracks or cankers because there is
no heartwood visible, and no decay or oozing from the crack.
Figure G11a. Sunburned branch Figure G11b. Sunscalded leaves
Source:
http://www.ipm.ucdavis.edu/PMG/GARDEN/
ENVIRON/sunburn.html
Insects
See section F for details.
Mechanical damage
Scattered dieback throughout a tree or shrub may be a result of mechanical damage (Figure G12-
13). When equipment or machinery bangs into a tree or shrub it can crush the cambium layer or
tear off bark and break branches (Figure G14). Repeated bumping of the trunk or stems,
especially in young trees and shrubs, can severely damage or kill sections of the cambium layer
just below the bark. Sap flow is interrupted between the roots and leaves, causing some twigs or
branches to die. Mechanical damage also opens the tree or shrub to disease and insect organisms,
which may further damage the plant. Lawn mowers, tractors and string trimmers are the primary
cause of mechanical damage to plants. Trees and shrubs planted near parking lots, sidewalks,
driveways or roads are also vulnerable to damage from cars or foot traffic bumping into them.
Avoid mechanical injury by maintaining a mulched, weed free area around ornamentals.
Source: http://extension.umd.edu/hgic/mechanical-injury-trees-and-shrubs

28
Figure G12. Broken branches on juniper. Figure G13. Dieback on shrub from
compacted soil due to foot traffic.
Source: http://extension.umd.edu/hgic/mechanical-injury-trees-and-shrubs
Figure G14. Tulip tree damaged by lawn mower
or string trimmer (weed-eater).
Photo courtesy of Aron Namenwirth.
Parasitic disease
Armillaria is a genus of parasitic fungi that live on trees and woody shrubs. Armillaria spp. cause
a white rot of wood. Symptoms include mycelial fans (white mats of fungal mycelium, between
the inner bark and wood; Figure G15), rhizomorphs (attached to infected roots or to the surface

29
of uninfected roots; Figure G16), and mushrooms (caps are honey-brown, usually with small
tufts of dark hairs, gills are whitish with notched attachment, spore prints are white, and stems
are white to brown, usually with an irregular, mottled appearance; Figure G17). The mushrooms
are generally in clusters near or on the base of trees.
Figure G15. Mycelial fans can be seen when
the bark is cut or peeled back.
Figure G16. Rhizomorphs.
Photo by Steven Renquest
Figure G17. A cluster of mushrooms at the
base of a western white pine with Armillaria
root rot.
Phytophtora is a genus of plant-damaging oomycetes (water molds). Phytophtora spp. incite root
and collar root disease on a range of hosts. Leaves will appear drought stressed, sometimes
turning dull green, yellow, red, or purple as they wilt. Infected trees may survive a few years
before the disease kills the whole plant. The bark around the soil-line may appear darkened.
Cutting away some bark should reveal red-brown discoloration in the wood underneath it.

30
Disease symptoms are distinguishable from Armillaria root rot because mycelial mats do not
develop in tissues infected with Phytophthora root rot. Source:
http://www.missouribotanicalgarden.org
Salinity
Salt toxicity symptoms often starts with interveinal chlorosis (yellowing of the leaves between
the veins with the veins remaining green). Burning on leaf surface or margins is also a symptom.
As salts accumulate, the damage increases. Leaf burn becomes more severe until defoliation and
twig dieback occurs. See Figures G18-23.
Sources:http://www.thebrittonfund.org/wpcontent/uploads/2012/06/BFsalinity2013.pdf and
http://www.salinitymanagement.org/Salinity%20Management%20Guide/sp/sp_7a.html
Figure G18. Necrosis of tips and margins of
older leaves; chlorosis of leaves.
Figure G19. Necrotic leaves on spray-irrigated
ginkgo biloba.

31
Figure G20. Necrosis and defoliation of lower
branches of the coast live oak (caused by
wetting of the plant’s leaves with saline rrigation water).
Figure G21. Severe burns on growing tips of
spray-irrigated Escallonia.

32
Figure G22. Tips of needles exhibit reddish
“burns”. Figure G23. Burned leaf margins on spray-
irrigated California holly grape.
Vandalism
Source: ttps://savingourtrees.wordpress.com/2012/02/ Source: Wikimedia Commons

33
Vandals chopped tree with a sharp object. Photo courtesy
of Brampton Guardian
Wind
Branch failure. Tree blown over.
Related Documents