Title Blue light alarm for a better morning : the effects of blue light exposure on wakening Sub Title Author 藤本, 隆寛(Fujimoto, Takahiro) 加藤, 朗( Katō, Akira) Publisher 慶應義塾大学大学院メディアデザイン研究科 Publication year 2021 Jtitle JaLC DOI Abstract Notes 修士学位論文. 2021年度メディアデザイン学 第891号 Genre Thesis or Dissertation URL https://koara.lib.keio.ac.jp/xoonips/modules/xoonips/detail.php?koara_id=KO40001001-0000202 1-0891 慶應義塾大学学術情報リポジトリ(KOARA)に掲載されているコンテンツの著作権は、それぞれの著作者、学会または出版社/発行者に帰属し、その権利は著作権法によって 保護されています。引用にあたっては、著作権法を遵守してご利用ください。 The copyrights of content available on the KeiO Associated Repository of Academic resources (KOARA) belong to the respective authors, academic societies, or publishers/issuers, and these rights are protected by the Japanese Copyright Act. When quoting the content, please follow the Japanese copyright act. Powered by TCPDF (www.tcpdf.org)

Welcome message from author
This document is posted to help you gain knowledge. Please leave a comment to let me know what you think about it! Share it to your friends and learn new things together.
Transcript
Title Blue light alarm for a better morning : the effects of blue light exposure on wakeningSub TitleAuthor 藤本, 隆寛(Fujimoto, Takahiro)
加藤, 朗( Katō, Akira)Publisher 慶應義塾大学大学院メディアデザイン研究科
Publication year 2021Jtitle
JaLC DOIAbstract
Notes 修士学位論文. 2021年度メディアデザイン学 第891号Genre Thesis or DissertationURL https://koara.lib.keio.ac.jp/xoonips/modules/xoonips/detail.php?koara_id=KO40001001-0000202
1-0891
慶應義塾大学学術情報リポジトリ(KOARA)に掲載されているコンテンツの著作権は、それぞれの著作者、学会または出版社/発行者に帰属し、その権利は著作権法によって保護されています。引用にあたっては、著作権法を遵守してご利用ください。
The copyrights of content available on the KeiO Associated Repository of Academic resources (KOARA) belong to the respective authors, academic societies, orpublishers/issuers, and these rights are protected by the Japanese Copyright Act. When quoting the content, please follow the Japanese copyright act.
Powered by TCPDF (www.tcpdf.org)
Master’s Thesis
Academic Year 2021
Blue Light Alarm for a Better Morning
— The Effects of Blue Light Exposure on Wakening —
Keio University
Graduate School of Media Design
Takahiro Fujimoto
A Master’s Thesis
submitted to Keio University Graduate School of Media Design
in partial fulfillment of the requirements for the degree of
Master of Media Design
Takahiro Fujimoto
Master’s Thesis Advisory Committee:
Professor Akira Kato (Main Research Supervisor)
Professor Hideki Sunahara (Sub Research Supervisor)
Master’s Thesis Review Committee:
Professor Akira Kato (Chair)
Professor Hideki Sunahara (Co-Reviewer)
Professor Kai Kunze (Co-Reviewer)
Abstract of Master’s Thesis of Academic Year 2021
Blue Light Alarm for a Better Morning
— The Effects of Blue Light Exposure on Wakening —
Category: Science / Engineering
Summary
Today, people do not have to step outside to work, and can stay up until the morn-
ing due to the ubiquitous proliferation of information technology and electronic
lights. This trend has become more prominent since the outbreak of COVID-19.
People are getting less exposure to natural light during the day and more exposure
to electronic lights at nighttime. Blue light is a blue spectrum of light visible to the
human eye. It is also contained in sunlight and light from our electronic displays
and is mostly beneficial for people during the day. However, sleep researchers
claim that exposure to blue light after dark inhibits the secretion of melatonin,
a sleep-inducing hormone, which leads to the disruption of our circadian rhythm.
Although there are many research about how blue light disrupts the onset of sleep,
there are not so many studies on the offset of sleep; waking up.
This paper will examine how blue light will affect the quality of waking up. A
blue LED (470nm wavelength) is used to expose five participants with blue light
one hour before their designated wake-up time while measuring the participant’s
heart rate, noise of the room, brightness of the room and the movement in their
own bed. The experiment’s duration was on average ten nights per participant.
While the hour-long blue light exposure, all the participants showed an increase
in body movement and heart rate fluctuation, implying that the participants were
experiencing sleep stages 1, 2 and REM sleep. Furthermore, from this study, the
participants showed positive responses to the ”light-alarm”, claiming that their
quality of waking up was increased. Some interesting reactions were observed such
as the light exposure in the morning stopping them from waking up mid-sleep and
making them feel sleepier at night.
i
Abstract
Keywords:
sleep, blue light, circadian rhythm, melatonin, sensing, heart rate, alarm
Keio University Graduate School of Media Design
Takahiro Fujimoto
ii
Contents
Acknowledgements ix
1 Introduction 1
1.1. Introduction . . . . . . . . . . . . . . . . . . . . . . . . . . . . . . 1
1.2. Purpose of this Research . . . . . . . . . . . . . . . . . . . . . . . 2
1.3. Thesis Overview . . . . . . . . . . . . . . . . . . . . . . . . . . . . 2
2 Related Works 4
2.1. Circadian Rhythm . . . . . . . . . . . . . . . . . . . . . . . . . . 4
2.1.1 Effect of Alcohol on Heart Rate and Sleep Stages . . . . . 6
2.2. Blue Light and sleep . . . . . . . . . . . . . . . . . . . . . . . . . 6
2.3. Light and Getting to Sleep . . . . . . . . . . . . . . . . . . . . . . 8
2.3.1 The Effects of Home Lighting on Getting to Sleep . . . . . 8
2.4. Blue Light Stimulus for a Better Morning . . . . . . . . . . . . . . 8
3 Approach 10
3.1. Concept . . . . . . . . . . . . . . . . . . . . . . . . . . . . . . . . 10
3.1.1 Overview . . . . . . . . . . . . . . . . . . . . . . . . . . . 10
3.2. Experiment Design . . . . . . . . . . . . . . . . . . . . . . . . . . 12
3.2.1 Experiment Flow . . . . . . . . . . . . . . . . . . . . . . . 12
3.2.2 Network Composition . . . . . . . . . . . . . . . . . . . . . 13
3.2.3 Lamp . . . . . . . . . . . . . . . . . . . . . . . . . . . . . 14
3.2.4 Sensors . . . . . . . . . . . . . . . . . . . . . . . . . . . . . 15
4 Results 16
4.1. Experiments . . . . . . . . . . . . . . . . . . . . . . . . . . . . . . 16
4.1.1 Flashing Blue Light . . . . . . . . . . . . . . . . . . . . . . 16
4.1.2 Heart Rate as a Measure to Observe Sleep Cycle . . . . . . 16
iii

Contents
4.1.3 Waking up to Blue Light . . . . . . . . . . . . . . . . . . . 16
4.2. Final Experiment . . . . . . . . . . . . . . . . . . . . . . . . . . . 18
4.2.1 Evaluation of the Final Experiment . . . . . . . . . . . . . 19
4.2.2 Overview of Analysis . . . . . . . . . . . . . . . . . . . . . 19
4.2.3 Results . . . . . . . . . . . . . . . . . . . . . . . . . . . . . 20
5 Discussion 42
5.1. Possible Applications . . . . . . . . . . . . . . . . . . . . . . . . . 46
5.2. Future Works . . . . . . . . . . . . . . . . . . . . . . . . . . . . . 48
5.3. Conclusion . . . . . . . . . . . . . . . . . . . . . . . . . . . . . . . 48
References 49
Appendices 54
A. Instruction Manual for Experiment Setup . . . . . . . . . . . . . . 54
B. Leeds Sleep Evaluation Questionnaire . . . . . . . . . . . . . . . . 57
iv
List of Figures
3.1 Experiment Overview Diagram
Icon credit:
Freepik: Applewatch/Gyroscope/Lamp/Laptop/Mic/Router/Smartphone
Eucalyp: CdS Cell . . . . . . . . . . . . . . . . . . . . . . . . . . 11
3.2 wavelength Characteristics of OSB5XNE3X1S. . . . . . . . . . . 14
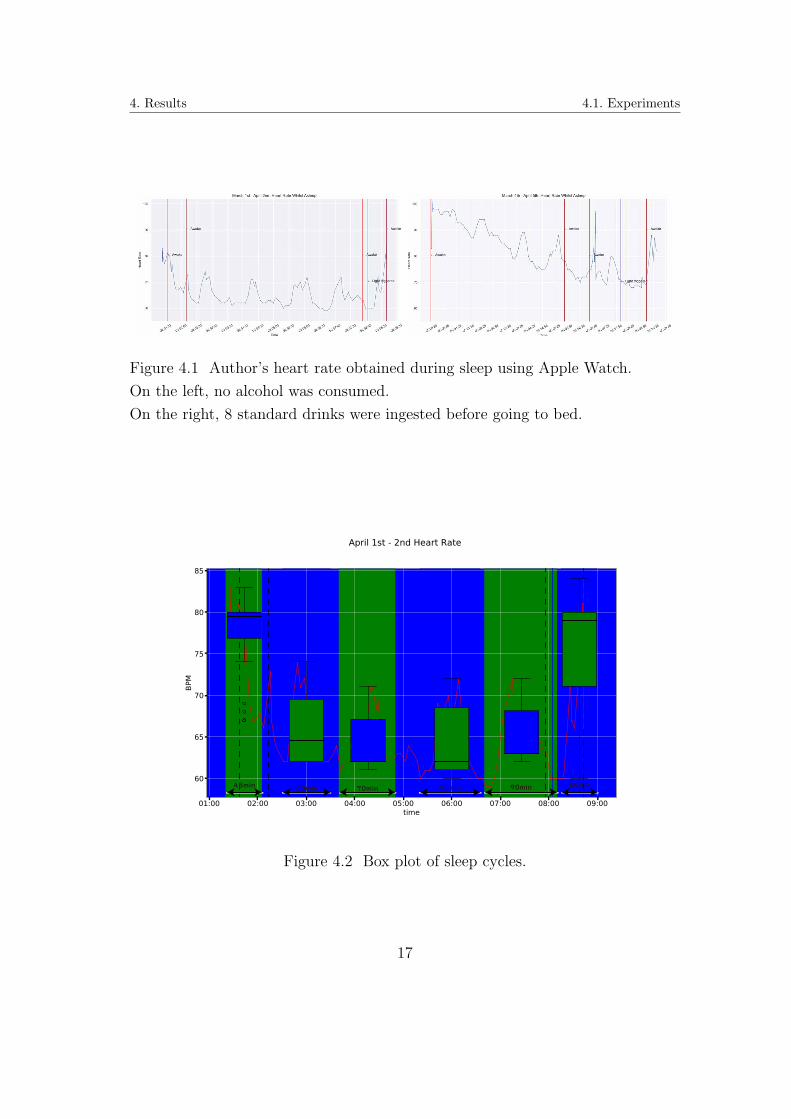
4.1 Author’s heart rate obtained during sleep using Apple Watch.
On the left, no alcohol was consumed.
On the right, 8 standard drinks were ingested before going to bed. 17
4.2 Box plot of sleep cycles. . . . . . . . . . . . . . . . . . . . . . . . 17
4.3 The area shaded blue is when the subject is being exposed to the
blue light. The time of awakening is marked in red. . . . . . . . 18
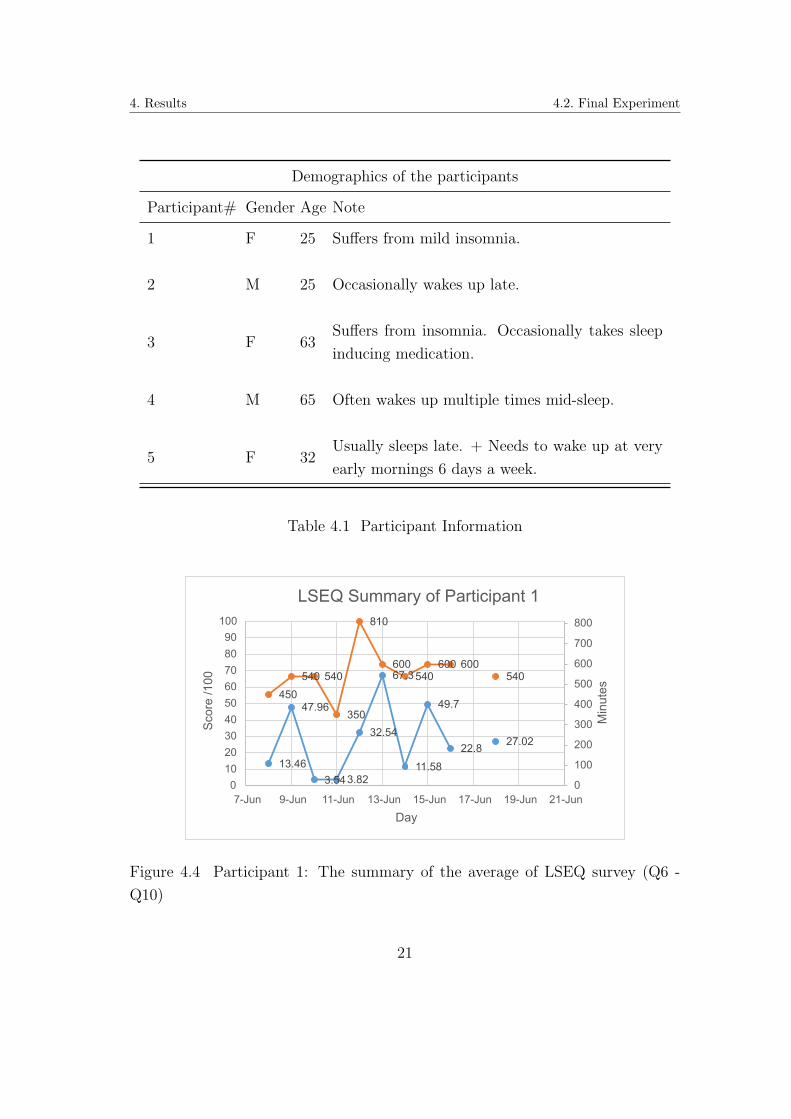
4.4 Participant 1: The summary of the average of LSEQ survey (Q6
- Q10) . . . . . . . . . . . . . . . . . . . . . . . . . . . . . . . . 21
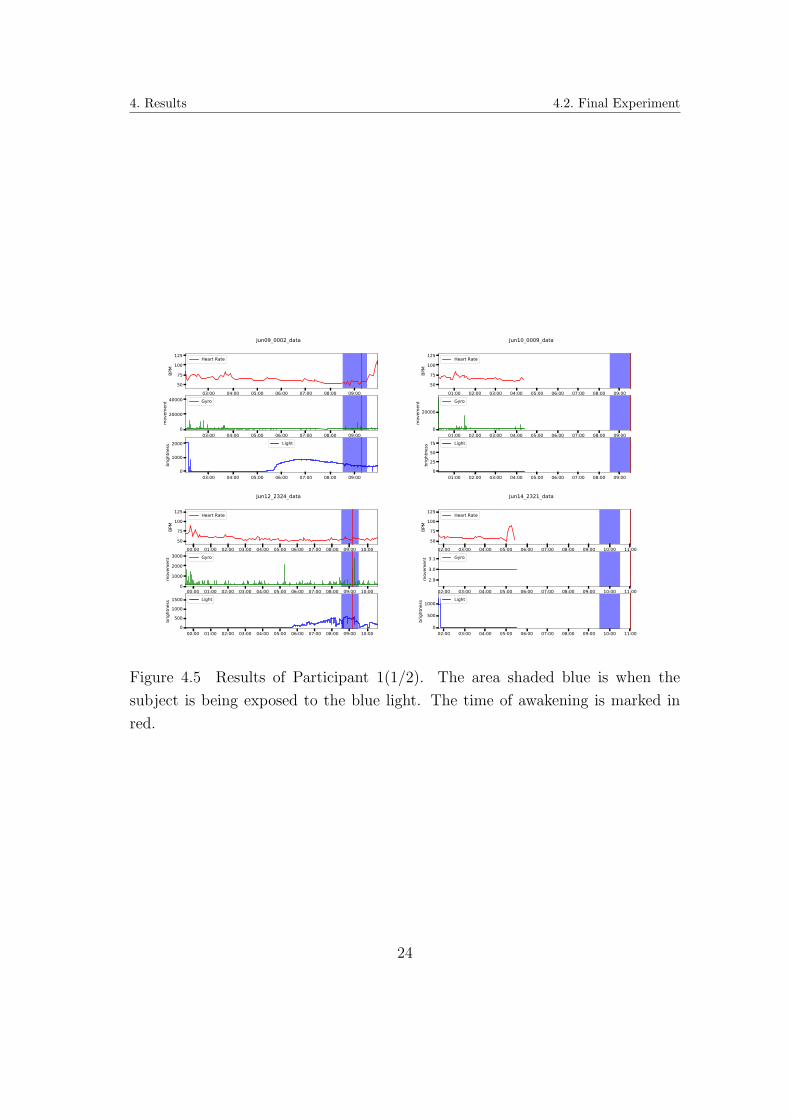
4.5 Results of Participant 1(1/2). The area shaded blue is when the
subject is being exposed to the blue light. The time of awakening
is marked in red. . . . . . . . . . . . . . . . . . . . . . . . . . . . 24
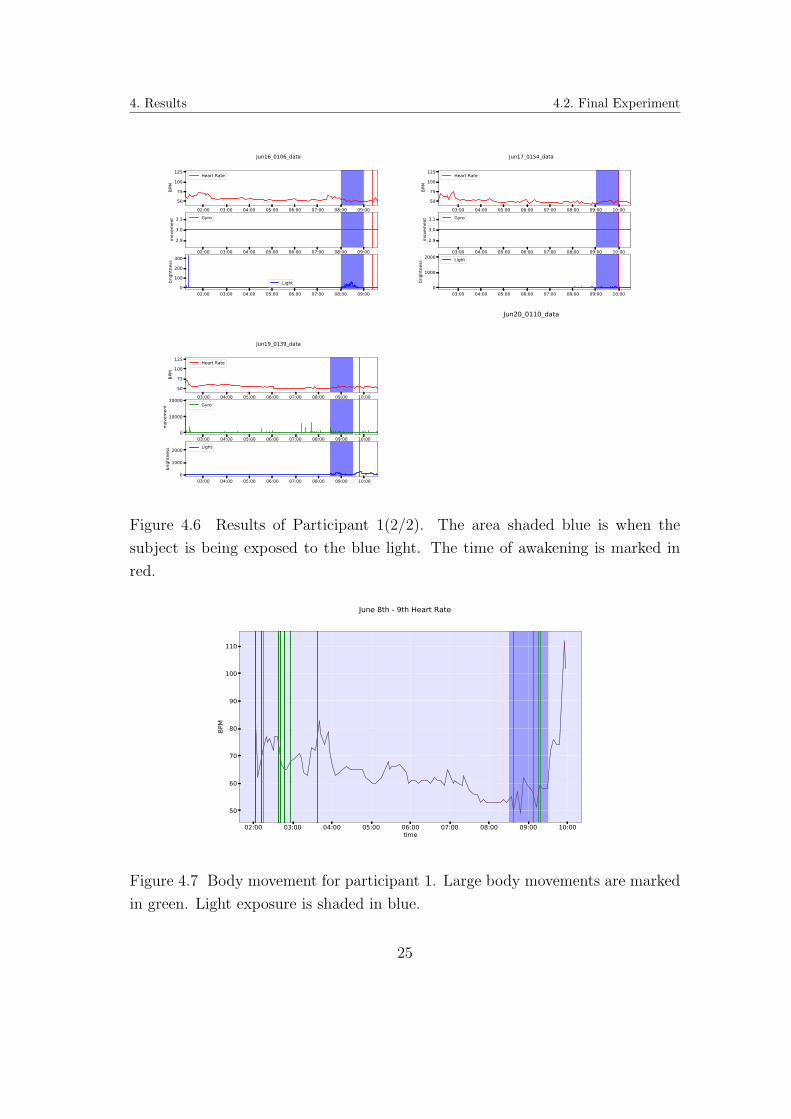
4.6 Results of Participant 1(2/2). The area shaded blue is when the
subject is being exposed to the blue light. The time of awakening
is marked in red. . . . . . . . . . . . . . . . . . . . . . . . . . . . 25
4.7 Body movement for participant 1. Large body movements are
marked in green. Light exposure is shaded in blue. . . . . . . . . 25
4.8 Participant 2: The summary of the average of LSEQ survey (Q6
- Q10) . . . . . . . . . . . . . . . . . . . . . . . . . . . . . . . . 29
4.9 Results of Participant 2(1/3). The area shaded blue is when the
subject is being exposed to the blue light. The time of awakening
is marked in red. . . . . . . . . . . . . . . . . . . . . . . . . . . . 29
v

List of Figures
4.10 Results of Participant 2(2/3). The area shaded blue is when the
subject is being exposed to the blue light. The time of awakening
is marked in red. . . . . . . . . . . . . . . . . . . . . . . . . . . . 30
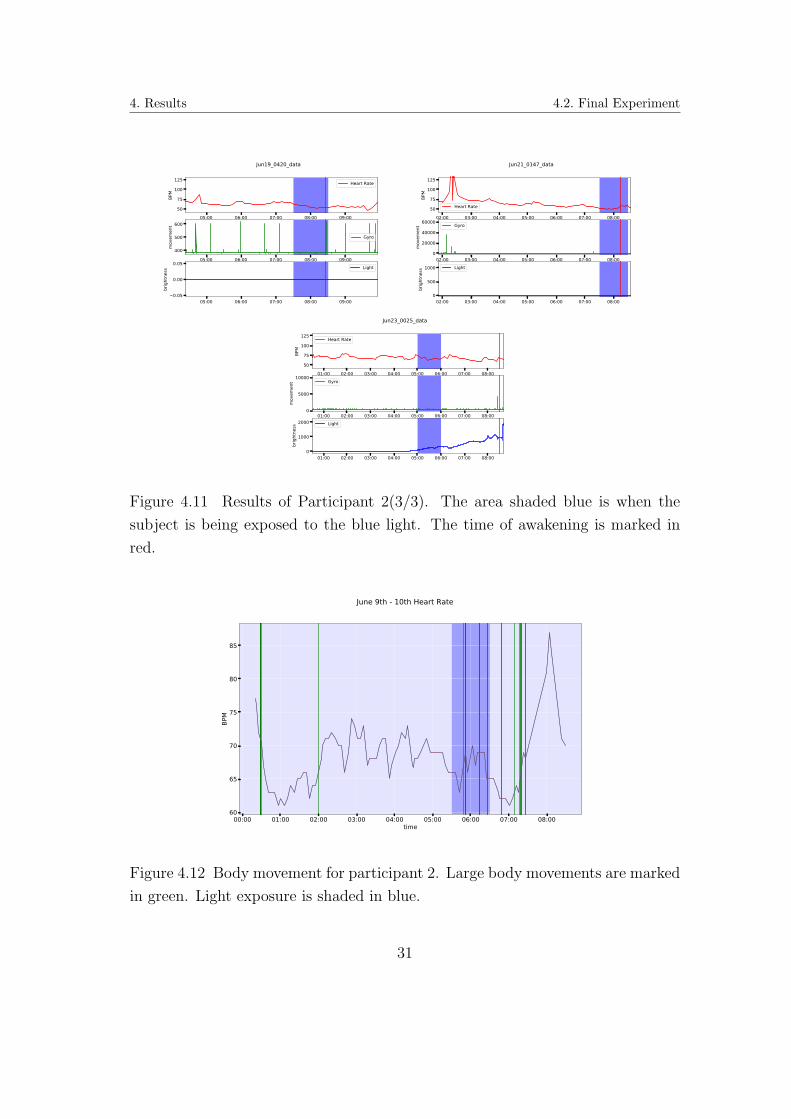
4.11 Results of Participant 2(3/3). The area shaded blue is when the
subject is being exposed to the blue light. The time of awakening
is marked in red. . . . . . . . . . . . . . . . . . . . . . . . . . . . 31
4.12 Body movement for participant 2. Large body movements are
marked in green. Light exposure is shaded in blue. . . . . . . . . 31
4.13 Participant 3: The summary of the average of LSEQ survey (Q6
- Q10) . . . . . . . . . . . . . . . . . . . . . . . . . . . . . . . . 32
4.14 Results of Participant 3(1/2). The area shaded blue is when the
subject is being exposed to the blue light. The time of awakening
is marked in red. . . . . . . . . . . . . . . . . . . . . . . . . . . . 33
4.15 Results of Participant 3(2/2). The area shaded blue is when the
subject is being exposed to the blue light. The time of awakening
is marked in red. . . . . . . . . . . . . . . . . . . . . . . . . . . . 34
4.16 Participant 1: The summary of the average of LSEQ survey (Q6
- Q10) . . . . . . . . . . . . . . . . . . . . . . . . . . . . . . . . 35
4.17 Results of Participant 4(1/3). The area shaded blue is when the
subject is being exposed to the blue light. The time of awakening
is marked in red. . . . . . . . . . . . . . . . . . . . . . . . . . . . 36
4.18 Results of Participant 4(2/3). The area shaded blue is when the
subject is being exposed to the blue light. The time of awakening
is marked in red. . . . . . . . . . . . . . . . . . . . . . . . . . . . 37
4.19 Results of Participant 4(3/3). The area shaded blue is when the
subject is being exposed to the blue light. The time of awakening
is marked in red. . . . . . . . . . . . . . . . . . . . . . . . . . . . 38
4.20 Body movement for participant 4. Large body movements are
marked in green. Light exposure is shaded in blue. . . . . . . . . 38
4.21 Participant 5: The summary of the average of LSEQ survey (Q6
- Q10) . . . . . . . . . . . . . . . . . . . . . . . . . . . . . . . . 39
vi
List of Figures
4.22 Results of Participant 5(1/2). The area shaded blue is when the
subject is being exposed to the blue light. The time of awakening
is marked in red. . . . . . . . . . . . . . . . . . . . . . . . . . . . 40
4.23 Results of Participant 5(2/2). The area shaded blue is when the
subject is being exposed to the blue light. The time of awakening
is marked in red. . . . . . . . . . . . . . . . . . . . . . . . . . . . 41
4.24 Body movement for participant 5. Large body movements are
marked in green. Light exposure is shaded in blue. . . . . . . . . 41
A.1 Instruction Manual (EN) . . . . . . . . . . . . . . . . . . . . . . 55
A.2 Instruction Manual (JP) . . . . . . . . . . . . . . . . . . . . . . 56
B.1 Leeds Sleep Evaluation Questionnaire (EN) . . . . . . . . . . . . 57
B.2 Leeds Sleep Evaluation Questionnaire (JP) . . . . . . . . . . . . 58
vii
List of Tables
2.1 Sleep stage classification results [1] . . . . . . . . . . . . . . . . . 6
4.1 Participant Information . . . . . . . . . . . . . . . . . . . . . . . 21
4.2 Results Summary of Participant 1 . . . . . . . . . . . . . . . . . 22
4.3 Results Summary of Participant 2 . . . . . . . . . . . . . . . . . 23
4.4 Results Summary of Participant 3 . . . . . . . . . . . . . . . . . 26
4.5 Results Summary of Participant 4 . . . . . . . . . . . . . . . . . 27
4.6 Results Summary of Participant 5 . . . . . . . . . . . . . . . . . 28
viii

Acknowledgements
First of all, I would like to thank my supervisor Akira Kato, subsupervisors Hideki
Sunahara and Kai Kunze. I would also like to thank Bon, who was always open
to any questions and helped me throughout my days at KMD.
I am very grateful for all of the participants who were kind enough to take
part in my 10 days long experiment. Futa, my drinking buddy, thanks. I’m sure
you will never read my thesis, and I am not planning to tell you that I have
written your name here. But you’ve been a big support throughout this study!
I’m also grateful for all of my buddies at KMD. My life at this school would
not have been the same and will not be the same after graduation without you
guys. Big hand of applause to my friends in the project room (when it used to
be open), even you, the guy whom I’ve never spoken with! Thank you, Ryo, from
the student administration, you handsome bloke. You make life so much easier
for EVERYONE in this school. Thank you, random guy from SDM, we’ve walk
past each other so many times, even in the times of lockdown. I don’t know your
name, we’ve never greeted each other, but I hope the feeling we have is mutual.
Finally, I would like to thank my parents who has always supported my aca-
demic endeavours throughout my life. Thank you for spending so much money on
my education, I will make sure to make use of each and every bit of experience I
have accumulated in my life and pass it on to the next generation.babababababababababababababababababab
·······················································- cut here -·······················································The names of people I should not forget (in alphabetical order):
Chikuma, Fuko, Futa, Kiku, Maki, Matsuken, Raful, Ragnar, Taku, Ya-
mamu
·······················································- cut here -·······················································
ix

Chapter 1
Introduction
1.1. Introduction
Waking up is a pain for many. The human body has an internal clock which tells
the human when to be sleepy and when to be awake, called the circadian clock.
The synchronisation of this system is largely dependent on sun light. With the
prevalence of electronic lights, the humankind is spending more time indoors, and
less time outdoors. A survey which reached out to 2,002 individuals in 2018 found
that children aged 3-12 are spending 35% less time outside [2]. Light stimulus
causes the part of the brain called pineal gland to stop secreting a hormone called
melatonin. It’s said that older generations have an easier time waking up due to
a decrease in production of melatonin [3]. The decrease in melatonin secretion is
also the reason for mid-sleep wakening. Melatonin is what keeps people sleeping.
One statistic shows that people are not getting enough sleep. A survey asking
1,031 people showed that in 1942, most people spent 7 hours sleeping, in 2013,
only 40% of the population get less than 6 hours of sleep [4, 5].
The blue light contained in natural light is critical to adjust the circadian
rhythm. Since the Corona virus pandemic, people in the world are spending
up to 33% more time inside their homes [6] Implying that more people are getting
deprived of exposure to natural light. This is a recipe for a crooked circadian
rhythm.
This work takes a look into the effect of blue light emitted by an LED on
human sleep hypothesising that using blue light prior to wakening will make it
easier to ”wake up on the right side of the bed”. With more people spending
less time being exposed to natural light, if exposing to blue LED light has the
potential to remediate the human circadian rhythm, these findings may lead to a
vast application of blue LEDs.
1
1. Introduction 1.2. Purpose of this Research
1.2. Purpose of this Research
The purpose of this research is to quantitatively observe the effects of blue light on
increasing the quality of wakening. This study will design a device to take data
such as heart rate, body movement, any irregular sound and room brightness
from the participant’s own bedrooms while exposing the subject to blue light
emitted from an LED at the designated time. On wakening, the participants will
be asked to fill out a sleep quality evaluation questionnaire named Leeds Sleep
Evaluation Questionnaire(LSEQ) to examine from a subjective perspective on the
experiment.
1.3. Thesis Overview
• Chapter1
The purpose of this chapter is to ease the reader into the topic while in-
troducing the hypothesis. The second purpose is to give a briefing on this
thesis.
• Chapter2
This chapter reviews the current understanding of the major elements men-
tioned in this study. By grasping the essences of the papers referenced in
this chapter, the viability of the hypothesis will become clear.
• Chapter3
Chapter 3 will explain the concept of this research and revisit the hypothesis.
It will go in depth explaining the experiment design, the devices which were
assembled and how they work together.
• Chapter4
Including the various preliminary experiments, chapter 4 will explore the
core parameters which need to be set for the final experiment. The way
in which the data is processed and evaluated will also be explained in this
chapter. A brief explanation of the tools that were used will be provided
as well. At the End of the chapter, the results which were collected will be
summarised and listed.
2

1. Introduction 1.3. Thesis Overview
• Chapter5
This chapter will summarise the findings from this study. Some considera-
tions such as experimental limitations will be mentioned. Furthermore, the
possible applications of the findings and future works can be found here.
3
Chapter 2
Related Works
2.1. Circadian Rhythm
The circadian rhythm is mainly controlled by the suprachiasmatic nuclei(SCN)
in the anterior hypothalamus. This part of the hypothalamus is responsible for
regulating the secretion of the sleep related hormone, melatonin produced in the
pineal gland. Stimulus given to the body which acts as a cue to adjust the
circadian rhythm are called Zeitgebers [7]. The most important Zeitgeber is known
to be light stimulus [8].
Sleep Stages
During a single night’s sleep, there are five different stages of sleep. These are
broadly classified as Rapid Eye Movement(REM) and Non-Rapid Eye Move-
ment(NREM) sleep which will be explained below largely referring to a paper [9]
published in 1989. From top to bottom, the following list is in the order of shallow
to deep sleep.
• REM Sleep
This is the only stage of sleep where people dream. There are four to six
occurrences of REM sleep in a single night’s sleep, they become longer each
episode. In total, REM sleep comprises 20% to 25% of the time sleeping.
• NREM Stage 1
In the onset and offset of sleep, the phase is called stage 1. Its duration
is around 1 to 7 minutes and during this stage, the person is easily woken
up by subtle noise or olfactory stimuli. The person is not so responsive to
4

2. Related Works 2.1. Circadian Rhythm
visual stimulus at this stage. Stage 1 sleep comprises 2% to 7% of the time
sleeping.
• NREM Stage 2
Following stage 1, the sleeping person enters stage 2 sleep. It continues
for 10 to 25 minutes. The stimulus which was successful in waking up the
sleeping subject at stage 1 does not lead to awakening at this phase. Stage
2 sleep comprises 45% to 55% of the time sleeping.
• NREM Stage 3 / NREM Stage 4
In this phase, the muscle in the body is very relaxed. In the first cycle, there
is only a few minutes of stage 3 before stage 4 sleep. Stage 3 and stage 4
sleep accounts for 15% to 25% of sleep(stage 3: 3% to8%, stage 4: 10% to
15% ) [10].
Throughout a night’s sleep, the sleeper experiences the cycle of REM sleep and
NREM. The first cycle takes around 70 to 100 minutes. While the cycle following
the first takes around 90 to 120 minutes. Body movements during sleep usually
implies that the sleep stage is changing to a sleep stage closer to consciousness. It
is said that body movements indicate a stage 1 or stage 2 sleep. During sleep stages
3 and 4, the muscles relax completely, and there are close to no body movements.
Furthermore, during REM sleep, a phenomena called sleep atonia occurs, where
the body experiences a temporary paralysis. The sleepers may hallucinate an
alien mutilation at this time, phases like this is called sleep paralysis.
Heart Rate Variability and Sleep Cycle
Heart Rate Variability(HRV) refers to the observation of one’s change in their
heart rate over time. It is possible to monitor one’s sleep stages through HRV.
The physiological mechanism of change in hear rate is due to the influence of the
two nervous systems handling the autonomic function; sympathetic and parasym-
pathetic nervous systems respectively abbreviated as SNS and PNS [11, 12]. The
heart rate decreases during sleep stages 1, 2, 3, 4 with smaller signs of high fre-
quency variability in the heart rate. On the other hand, whilst REM sleep, the
heart rate increased with higher variability [13]. Furthermore, a study in 2021
5
2. Related Works 2.2. Blue Light and sleep
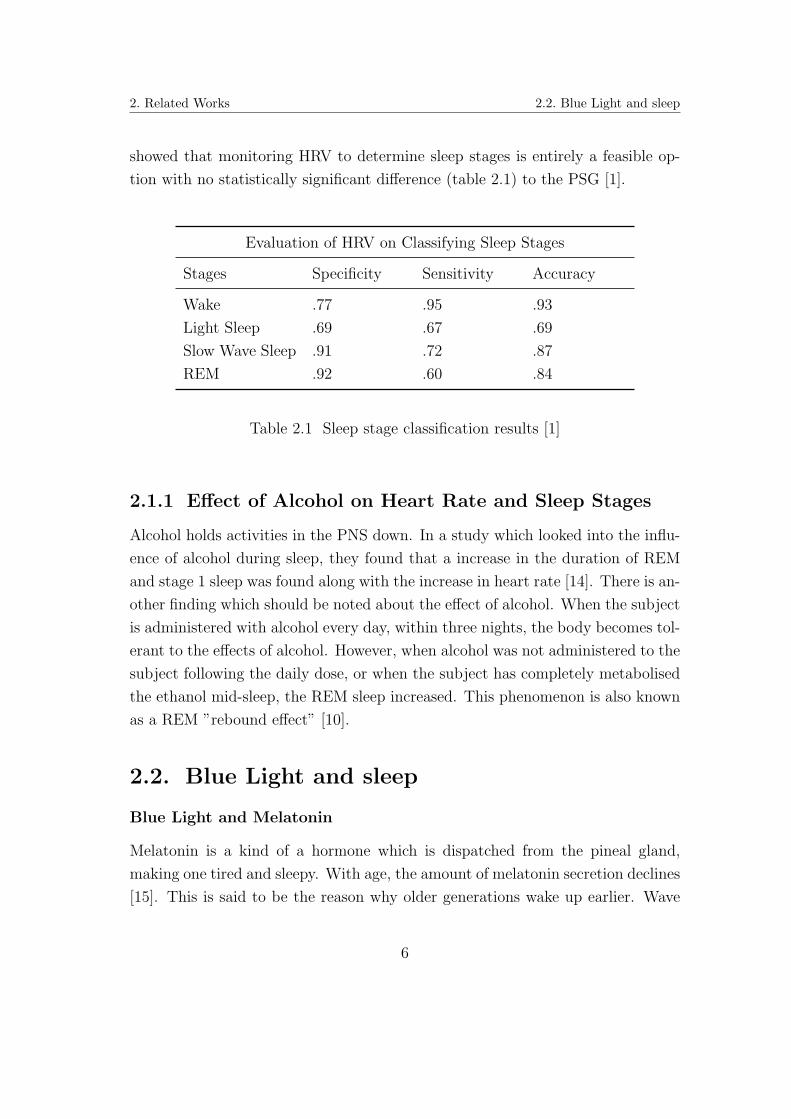
showed that monitoring HRV to determine sleep stages is entirely a feasible op-
tion with no statistically significant difference (table 2.1) to the PSG [1].
Evaluation of HRV on Classifying Sleep Stages
Stages Specificity Sensitivity Accuracy
Wake .77 .95 .93
Light Sleep .69 .67 .69
Slow Wave Sleep .91 .72 .87
REM .92 .60 .84
Table 2.1 Sleep stage classification results [1]
2.1.1 Effect of Alcohol on Heart Rate and Sleep Stages
Alcohol holds activities in the PNS down. In a study which looked into the influ-
ence of alcohol during sleep, they found that a increase in the duration of REM
and stage 1 sleep was found along with the increase in heart rate [14]. There is an-
other finding which should be noted about the effect of alcohol. When the subject
is administered with alcohol every day, within three nights, the body becomes tol-
erant to the effects of alcohol. However, when alcohol was not administered to the
subject following the daily dose, or when the subject has completely metabolised
the ethanol mid-sleep, the REM sleep increased. This phenomenon is also known
as a REM ”rebound effect” [10].
2.2. Blue Light and sleep
Blue Light and Melatonin
Melatonin is a kind of a hormone which is dispatched from the pineal gland,
making one tired and sleepy. With age, the amount of melatonin secretion declines
[15]. This is said to be the reason why older generations wake up earlier. Wave
6

2. Related Works 2.2. Blue Light and sleep
lengths between 446–477nm has been shown to have the most effect on melatonin
regulation [16]. A study in 1988 tested the difference in melatonin suppression with
white light with a brightness of 3000, 1000, 500, 350, 200 lux. The results showed
a decrease in melatonin secretion by 71%, 67%, 44%, 38%, 16% respectively [17].
In a research conducted in 2011, experiment subjects were exposed with two
different kinds of light between 2:00-3:30 AM to see a difference in the suppression
of melatonin. One light source was a 4000K fluorescent white light. The other
source of light was a blue LED with a peak bandwidth of 469nm [18]. This
research revealed that a narrow band blue light is more effective in suppressing
the secretion of melatonin.
Blue Light and Getting to Sleep
An experiment in 2016 compared reading a story from an iPad and a book before
getting to sleep. The subject’s brain waves were measured using EEG. The re-
searchers found impact in the EEG when the subjects were reading from an iPad,
with an average of 30 minutes delay in sleep onset [19]. Another study in the
same year examined the efficacy of enhancing melatonin secretion, sleep quality
and sleepiness at night by wearing blue light blocking glasses. The study had 12
volunteers wear blue light blocking lenses 2 hours prior to bedtime while reading
from a ”self-luminous portable device”. The results showed that on both sleepi-
ness and melatonin secretion, the spectacle wearers showed significant differences
to the control group [20]. On the other hand, a study in 2017 concluded that
there are not enough concrete evidence to support the benefits of wearing blue
light blocking spectacles hours before going to bed for sleep quality [21]. Referring
to the study referenced in chapter 2.2, the blue light emitted from the electronic
displays may not have been a strong enough light source to affect one’s circadian
rhythm. Anyhow, there were no studies found on the intensity (lux) of the blue
light source if the wavelength characteristics showed dominance in wavelengths of
446-477nm which is the wave length which affects humans the most [16].
7

2. Related Works 2.3. Light and Getting to Sleep
2.3. Light and Getting to Sleep
In 2013, at the Sleep and Chrono-biology Laboratory in University of Colorado
Boulder, a team of scientists observed the shift in the participant’s circadian
rhythm after camping in the mountains for a week through measuring melatonin
in their saliva. They found that being exposed to only natural light drastically
changed the participant’s circadian rhythms and concluded that a decrease in
exposure to natural light during the day time and an increase in exposure to
electrical lighting during the day time has shifted the circadian clock [22]. It is
not definitely stated in this study whether the lack of natural light exposure or
the increase in exposure to electrical lighting after dark was the causation of this
phenomena. However, it seems plausible that it is possible to shift one’s circadian
cycle using electrical light. Another study in 1989 used a 3000 and 1000 lux
white light which was known to be effective in suppressing melatonin secretion
at that time. They found that exposing the subjects to light at 2100-2200 did
not suppress much melatonin, however, when they exposed the subjects at 0000-
0100 and 0400-0500, the melatonin concentration was less than half of what it
was before the light exposure [23]. Based on the findings of this study, the light
may well be effective in reducing melatonin concentration when exposed before
the subject wakes up.
2.3.1 The Effects of Home Lighting on Getting to Sleep
In recent years, there are many studies which investigate the influence of lighting
before one goes to sleep, especially blue light. Overall, these researches mostly
concludes that electronic lighting in homes have a negative effect on sleepiness at
night [24,25].
2.4. Blue Light Stimulus for a Better Morning
There are many related works on how blue light prevents people from getting
tired before going to bed. There are also works which shine light on how the
increase/ decrease in exposure to natural light affects the human circadian rhythm.
However, the effect of blue light exposure in the morning on the waking up routine
8

2. Related Works 2.4. Blue Light Stimulus for a Better Morning
has not been surveyed enough. This study hypothesises that by delimiting the
accumulation of melatonin during the last cycle of sleep, the sleepers can avoid
sleep inertia - the groggy feeling people get right after wakening -. Below are the
core suppositions which support this hypothesis.
• High melatonin blood concentration on wakening is the source of sleep in-
ertia.
• Blue light inhibits the secretion of melatonin.
• Blue light which are emitted from LEDs are sufficient to cause the effect
stated above granted that it has enough brightness.
9

Chapter 3
Approach
3.1. Concept
Blue light is known to reduce the secretion of melatonin in our body. This study
will use this effect aiming to alleviate the occurrence and effect of sleep iner-
tia. Sleep inertia, also known as sleep drunkenness, is a state which immedi-
ately follows wakening, with symptoms such as disorientation and declined per-
formance [26]. A study in 2013 concluded that the main cause of sleep inertia is
excessive discharge of melatonin in our body, a sleep-inducing hormone.
The concept of this study is to use blue light to reduce the secretion of mela-
tonin prior to wakening, aiming to alleviate the occurrence and effect of sleep
inertia. This study will evaluate the efficacy of this experiment through sensor
measurement and a standard questionnaire, which will be discussed later in this
chapter.
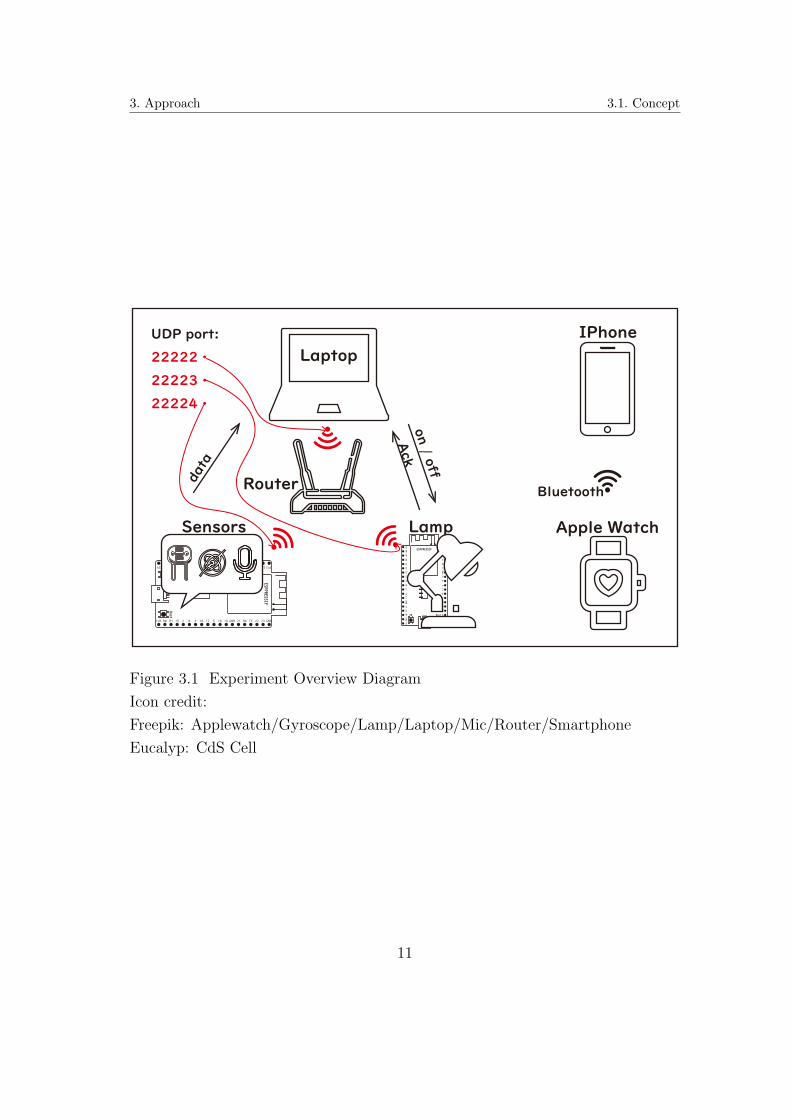
3.1.1 Overview
A diagram of five major items in this experiment is shown in figure3.1.
1. Laptop
The laptop will be the timekeeper. A program will be running which re-
ceives data from the sensors and saves it with a timestamp. It also sends
”on” / ”off” signals to the lamp controller when the designated time comes.
2. Lamp
This lamp is controlled by the laptop via WiFi. Positioned to expose the
light near the participants pillow, the lamp is turned on one hour prior to
the participant’s designated time of wakening.
10
3. Approach 3.1. Concept
Lamp
Router
Sensors
Laptop
ESPPRESSIF
ENBoot
CLK D0 D1 15 2 40 16 17 5 18 19 GND 22RX TX21 23 GND
3V3ENVPVN3432 35332526271412D3 13D2 GNDCMD5VESPPRESSIF
EN Boot
CLKD0 D1
152
40
1617
518
19GND
22RX
TX21
23GND3V3
ENVP
VN34
3235
3325
2627
1412
D313
D2GND
CMD5V
Apple Watch
IPhone
Ack
on / off
data
UDP port:
22222・
22223・
22224・
Bluetooth
Figure 3.1 Experiment Overview Diagram
Icon credit:
Freepik: Applewatch/Gyroscope/Lamp/Laptop/Mic/Router/Smartphone
Eucalyp: CdS Cell
11
3. Approach 3.2. Experiment Design
3. Sensors
The sensing device is equipped with ESP32, a micro-controller with the ca-
pability to communicate via Bluetooth and WiFi. It retrieves and processes
the sensor data, serialises it, and sends it to the laptop through the router. 9
bytes of data is sent each transmission, which contains the sequence number,
microphone value, gyro-sensor value and the CdS cell value. The sequence
number is used to detect major lapses in the network communication.
4. Router
In this experiment, the various devices, namely the laptop, sensor board and
the Lamp communicates throughWiFi. The router takes care of leasing local
IP addresses, and routing the data to designated recipients.
5. Apple Watch
The Apple Watch is used to take the participant’s heart rate while asleep.
It is connected to the participant’s IPhone and the exported data is sent to
be analysed after the experiment.
3.2. Experiment Design
3.2.1 Experiment Flow
The participants are handed the experiment kit to take home. All of the goods
needed to participate in the experiment is inside with a set of instructions to setup
the devices. A total of ten trials will be conducted per participant.
• Initial Setup
Firstly, the lamp is fixed above the pillow while the gyro sensor is placed
underneath. The microphone and the CdS cell are placed so that it is not
blocked by any objects. Secondly, the participants are asked to plug in the
router, and to switch on the laptop. The participant does not need to con-
figure anything related to the WiFi since all of the devices are preconfigured
to connect to the router. On the desktop of the laptop, there will be a
program which the test subject is asked to execute.
12
3. Approach 3.2. Experiment Design
• Single Iteration of Experiment
The participant starts the program on the laptop, which then asks the par-
ticipant to designate the time of wakening the following morning. Two
seconds after the participant confirms the input time, the program starts
collecting the sensor data.
When the program starts running, the participant is free to go to bed after
making sure that they are wearing the Apple Watch.
Upon waking up, they are asked to fill out a sheet of questionnaire.
3.2.2 Network Composition
Three devices, laptop, lamp, and the sensor, are connected to the router. When
they are connected, the router gives them an arbitrary local IP address (192.168.111.X)
through the Dynamic Host Configuration Protocol(DHCP) Server. All the de-
vices send their datagrams to 192.168.111.255, a broadcast address which sends
the packet to every node in the local network. The transport protocol used in this
experiment is User Datagram Protocol(UDP). As shown in figure 3.1, three UDP
ports are used in this setup.
• UDP port 22222
The laptop sends it’s ”on/off” signals to 192.168.111.255:22222(IP address:port)
and the only device in this setup who listens to port 22222 is the micro-
controller embedded in the lamp.
• UDP port 22223
Since the experiment is designed using UDP, due to the protocol’s nature,
some signals get lost in transmission unlike its sibling, the Transmission
Control Protocol. Hence, the 22223 port is used by the Lamp to send an
acknowledgement(ACK) packet whenever it receives the ”on/off” signal.
• UDP port 22224
Port 22224 is used by the micro-controller which is embedded in the sensor
circuit board. It continuously streams the sensed data to this port, which
the laptop is listening to.
13

3. Approach 3.2. Experiment Design
Figure 3.2 wavelength Characteristics of OSB5XNE3X1S.
3.2.3 Lamp
[htbp] The light is connected to ESP32. When the laptop sends the ”on” signal
to the micro-controller, the micro controller starts sending pulse width modula-
tion(PWM) signals. The signal runs through a smoothing circuit to prevent the
signal from oscillating. The smoothed signal triggers the MOS-FET, running the
current through the LED. When the laptop sends the ”off” signal, the micro-
controller stops sending the signals to the MOS-FET, which leads to the LEDs
turning off. The LED that is used in this experiment is OSB5XNE3X1S. Accord-
ing to the data sheet, a single LED uses three watts at the recommended configu-
ration. It’s brightness is 35 lumens, with a radiation angle of 120◦. Three of these
LEDs are mounted on one device, roughly exposing the subject’s eyes with the
brightness of 200 - 300 lux of light if placed within half a metre of the participant’s
head. This value, according to the study referred to in chapter 2.2, theoretically
induces 16% to 38% decrease in melatonin secretion [17]. Furthermore, while the
study mentioned used a white light which wavelength characteristics are evened
out, this study uses an LED which has a wavelength characteristic of 470 nm
(see figure 3.2) being the dominant wavelength which is known to have a stronger
effect on decreasing melatonin secretion [16].
14
3. Approach 3.2. Experiment Design
3.2.4 Sensors
There are three sensors on the sensor board:
• Gyro-sensor L3GD20H
The gyro-sensor is placed on the bed to sense the participant’s movement
during sleep.
This Gyro-sensor communicates with the micro controller through the I2C
protocol. It sends the angular data of x, y, and z axis. The micro-controller
100 samples, summing up the absolute value of each axis. Then, it takes
the average of the samples and loads it to the serialised data stack.
• Microphone SPU0414HR5H-SB
The microphone is used to sense any ”out of the ordinary” sound in the
environment. This is important to rule out the effect of the surrounding
noise during the experiment.
The micro-controller reads the data from the sensor through analogue input.
Similar to the gyro-sensor, 100 samples are taken, and the maximum value
is loaded to the data stack.
• CdS Cell
CdS Cells are electronic components composed of Cadmium Sulphide and
is also known as a photo resistor. Its conductivity increases when the cell is
exposed to light. In this study, it is used to measure the relative brightness
of the room that the participant is sleeping in. It can also show the exact
timing of when the blue light lamp is triggered.
One other sensor is used in this experiment is the optical heart rate sensor inside
Apple Watch. This is the main source of information to predict the sleep cycle
that the participant is going through. According to several attempts of recording
data during sleep, the Apple Watch takes a single measurement of heart rate every
15 seconds to 10 minutes.
15

Chapter 4
Results
4.1. Experiments
4.1.1 Flashing Blue Light
In this first trial, the light was configured to flash twice in a second on the arrival
of the designated time. The flashing light seemed to cause abrupt wakening, which
defeated the purpose of this study of reducing the effect of sleep inertia. After
testing out several frequencies combined with fading in/out effects, the increase
in the rate of change in brightness sensed through the eyelids tended to make
the stimulus more noticeable even when asleep. Another finding is that while a
repeated on/off sequences is quite noticeable, a single occurrence of a light turning
on is not. This is considered and implemented in the final experiment.
4.1.2 Heart Rate as a Measure to Observe Sleep Cycle
The main measurement that this study will be focusing on will be the heart rate
collected using the Apple Watch. Congruent with the findings of one of the related
works [14], data showed (see figure 4.1 right) that alcohol consumption leads to
the increase in heart rate. Moreover, the gradual descent of the heart rate was
seen, which may indicate the liver breaking down the alcohol. The graph in figure
4.1 (left) also seems reassuring that the heart rate measured using Apple Watch
gives an adequate reference of the sleep cycle (figure 4.2).
4.1.3 Waking up to Blue Light
In the next experiment, the light emitting device was set to stay on for an hour
before the audio alarm went off. Values from a Gyro Sensor and a CdS cell sensor
16
4. Results 4.1. Experiments
Figure 4.1 Author’s heart rate obtained during sleep using Apple Watch.
On the left, no alcohol was consumed.
On the right, 8 standard drinks were ingested before going to bed.
60min 45min90min75min70min45min
Figure 4.2 Box plot of sleep cycles.
17

4. Results 4.2. Final Experiment
were also collected during this trial. The gyro sensor was placed under the pillow,
while the CdS cell was placed on the bed board near the blue light source. From
the second day, the light was configured to turn on in the middle of the night
where the subject was assumed to be deep asleep and unlikely to wake up from
the light being turned on. Though the heart rate did not change drastically after
the exposure of blue light in this experiment, the values in the had a tendency of
gradually rising after the onset of blue light. This experiment also showed that
placing the gyro-sensor and the CdS cell sensors at the said positions is effective
in finding the subject’s body movement during sleep and the brightness of the
subject’s room.
00:00 01:00 02:00 03:00 04:00 05:00 06:00 07:00
60
80
100
BPM
Heart Rate
00:00 01:00 02:00 03:00 04:00 05:00 06:00 07:000
10000
20000
mov
emen
t Gyro
00:00 01:00 02:00 03:00 04:00 05:00 06:00 07:000
1000
2000
brig
htne
ss
Light
May13_2338_data
02:00 03:00 04:00 05:00 06:00 07:00 08:00 09:00 10:00 11:00
60
80BP
M
Heart Rate
02:00 03:00 04:00 05:00 06:00 07:00 08:00 09:00 10:00 11:000
10000
20000
mov
emen
t Gyro
02:00 03:00 04:00 05:00 06:00 07:00 08:00 09:00 10:00 11:000
1000
2000
brig
htne
ss Light
May15_0108_data
04:00 05:00 06:00 07:00 08:00 09:00 10:0060
80
100
BPM
Heart Rate
04:00 05:00 06:00 07:00 08:00 09:00 10:000
50001000015000
mov
emen
t Gyro
04:00 05:00 06:00 07:00 08:00 09:00 10:000
1000
2000
brig
htne
ss Light
May16_0304_data
01:00 02:00 03:00 04:00 05:00 06:00 07:00
75100125150
BPM
Heart Rate
01:00 02:00 03:00 04:00 05:00 06:00 07:000
20000
40000
60000
mov
emen
t Gyro
01:00 02:00 03:00 04:00 05:00 06:00 07:000
1000
2000
brig
htne
ss Light
May17_0038_data
Figure 4.3 The area shaded blue is when the subject is being exposed to the blue
light. The time of awakening is marked in red.
4.2. Final Experiment
To scale this experiment, the system explained with figure 3.1 in chapter 3.1.1 was
devised. The flow of the experiment, explained in chapter 3.2.1 is shown to the
participants using an instruction manual of two-pages A.1 A.2. The instruction
18

4. Results 4.2. Final Experiment
lists the contents of the bag on the first page, and on the second page, there are
instructions on the initial setup, each night and day. Essentially, the instructions
ask the participants to plug everything in, position the sensors at certain places,
put on the heart rate monitoring watch before they go to bed and not to forget
to fill in the questionnaire when they wake up.
4.2.1 Evaluation of the Final Experiment
There are two parts in evaluating this experiment. Each morning following the
experiment, the participants fill in the Leeds sleep Evaluation Questionnaire. This
is used to distinguish which experiment attempts were subjectively better for
the participants compared to others. From the sensor data, the movement of
the participant while asleep, the noisiness of the environment and the relative
brightness of the room that the participant is sleeping in will be quantified. Along
with these values, this study will look into the participant’s heart rate and how it
reacts to the exposure of blue light during sleep.
Leeds Sleep Evaluation Questionnaire
The Leeds Sleep Evaluation Questionnaire is a questionnaire designed by Par-
rot and Hindmarch and contains ten questions which is answered by striking a
line through a 100mm scale. It was designed to survey the participant’s subjec-
tive evaluation of sleepiness [27]. Four factors of sleep is measured through the
questions: getting to sleep, quality of sleep, awakening from sleep and behaviour
following wakefulness. The copy of the actual questionnaire used during the ex-
periment can be found in the appendix. In this study, questions through six to
ten (awakening from sleep and behaviour following wakefulness.) will be used to
determine if the blue light had any positive effect on waking up.
4.2.2 Overview of Analysis
This analysis compares the variability in heart rate which is a good indicator
of sleep cycles [12] with the change of the values retrieved from the light sensor
near wakening. The users will set the activation time of the light at their desired
time for each morning. The purpose of this study is to find the influence of the
19
4. Results 4.2. Final Experiment
light stimulus and to see if the blue light has any contribution to a gentle waking
routine.
The study’s initial plan was to sort the waking routines into ”good” groups and
”bad” groups based on the data gathered through the LSEQ survey then compare
the sensor values to find a pattern. However, to utilise the incomplete samples,
the sensor data for each of the mornings while the exposure of the blue light was
examined to find a pattern.
4.2.3 Results
Summary
The experiment was carried out by 5 participants, with duration of around 10
days each. The participants were not told that they needed to participate for 10
consecutive days. The table which shows which data was available on which dates
can be found below (Tables 4.2, 4.3 and 4.4). Many problems were found in the
data collection procedure when the results came, which will be explained in the
following passages.
Participant 1
Out of the 11 attempts from this participant, there were 6 nights which, due to
network problems, the complete data was not retrieved (figure 4.5 top right /
bottom right). There were 4 nights worth of data which had all the data available
for this participant. Regarding the data for the LSEQ questionnaires and the
heart rate data, there were 6 nights which could be used to see the tendencies.
Overall, a gradual increase in the heart rate even within the one-hour exposure of
blue light could be observed (figures 4.5 and 4.6) with increased body movements
(figure 4.7). Moreover, after a brief interview with participant 1 after the 10-day
long experiment, we found that the participant did not feel that they were affected
by the light at all. However, the participant did comment that they saw the blue
light emitted from the device before they heard the alarm several times in the
questionnaire comment area. The correlation of the sleep duration and the LSEQ
wake-up quality average was 0.46.
20
4. Results 4.2. Final Experiment
Demographics of the participants
Participant# Gender Age Note
1 F 25 Suffers from mild insomnia.
2 M 25 Occasionally wakes up late.
3 F 63Suffers from insomnia. Occasionally takes sleep
inducing medication.
4 M 65 Often wakes up multiple times mid-sleep.
5 F 32Usually sleeps late. + Needs to wake up at very
early mornings 6 days a week.
Table 4.1 Participant Information
13.46
47.96
3.543.82
32.54
67.3
11.58
49.7
22.8 27.02
450540 540
350
810
600540
600 600540
0
100
200
300
400
500
600
700
800
0102030405060708090
100
7-Jun 9-Jun 11-Jun 13-Jun 15-Jun 17-Jun 19-Jun 21-Jun
Min
utes
Scor
e /1
00
Day
LSEQ Summary of Participant 1
Figure 4.4 Participant 1: The summary of the average of LSEQ survey (Q6 -
Q10)
21

4. Results 4.2. Final Experiment
Participant 1: Results of Final Experiment
Questionnaire Gyro data HR data CdS data Night of
O O O O JUN8
O X X X JUN9
O X X X JUN10
O X X X JUN11
O O O O JUN12
O X X X JUN13
O X O O JUN14
O X O O JUN15
O X O O JUN16
X X X X JUN17
O O O O JUN18
O X X X JUN19
Table 4.2 Results Summary of Participant 1
22

4. Results 4.2. Final Experiment
Participant 2: Results of Final Experiment
Questionnaire Gyro data HR data CdS data Night of
O O O X JUN8
O O O O JUN9
O O O O JUN10
X O O O JUN11
X O O O JUN12
O O O O JUN13
X X X X JUN14
X X X X JUN15
O O O X JUN16
O O O X JUN17
O O O X JUN18
X X X X JUN19
O O O X JUN20
X X X X JUN21
O O O X JUN22
Table 4.3 Results Summary of Participant 2
23
4. Results 4.2. Final Experiment
03:00 04:00 05:00 06:00 07:00 08:00 09:0050
75
100
125
BPM
Heart Rate
03:00 04:00 05:00 06:00 07:00 08:00 09:000
20000
40000
mov
emen
t Gyro
03:00 04:00 05:00 06:00 07:00 08:00 09:000
1000
2000
brig
htne
ss Light
Jun09_0002_data
01:00 02:00 03:00 04:00 05:00 06:00 07:00 08:00 09:0050
75
100
125
BPM
Heart Rate
01:00 02:00 03:00 04:00 05:00 06:00 07:00 08:00 09:000
20000m
ovem
ent Gyro
01:00 02:00 03:00 04:00 05:00 06:00 07:00 08:00 09:000
25
50
75
brig
htne
ss Light
Jun10_0009_data
00:00 01:00 02:00 03:00 04:00 05:00 06:00 07:00 08:00 09:00 10:0050
75
100
125
BPM
Heart Rate
00:00 01:00 02:00 03:00 04:00 05:00 06:00 07:00 08:00 09:00 10:000
1000
2000
3000
mov
emen
t Gyro
00:00 01:00 02:00 03:00 04:00 05:00 06:00 07:00 08:00 09:00 10:000
500
1000
1500
brig
htne
ss Light
Jun12_2324_data
02:00 03:00 04:00 05:00 06:00 07:00 08:00 09:00 10:00 11:0050
75
100
125
BPM
Heart Rate
02:00 03:00 04:00 05:00 06:00 07:00 08:00 09:00 10:00 11:00
2.9
3.0
3.1
mov
emen
t Gyro
02:00 03:00 04:00 05:00 06:00 07:00 08:00 09:00 10:00 11:000
500
1000
brig
htne
ss Light
Jun14_2321_data
Figure 4.5 Results of Participant 1(1/2). The area shaded blue is when the
subject is being exposed to the blue light. The time of awakening is marked in
red.
24
4. Results 4.2. Final Experiment
02:00 03:00 04:00 05:00 06:00 07:00 08:00 09:0050
75
100
125BP
MHeart Rate
02:00 03:00 04:00 05:00 06:00 07:00 08:00 09:00
2.9
3.0
3.1
mov
emen
t Gyro
02:00 03:00 04:00 05:00 06:00 07:00 08:00 09:000
100
200
300
brig
htne
ss
Light
Jun16_0106_data
03:00 04:00 05:00 06:00 07:00 08:00 09:00 10:0050
75
100
125
BPM
Heart Rate
03:00 04:00 05:00 06:00 07:00 08:00 09:00 10:00
2.9
3.0
3.1
mov
emen
t Gyro
03:00 04:00 05:00 06:00 07:00 08:00 09:00 10:000
1000
2000
brig
htne
ss Light
Jun17_0154_data
03:00 04:00 05:00 06:00 07:00 08:00 09:00 10:0050
75
100
125
BPM
Heart Rate
03:00 04:00 05:00 06:00 07:00 08:00 09:00 10:000
10000
20000
mov
emen
t Gyro
03:00 04:00 05:00 06:00 07:00 08:00 09:00 10:000
1000
2000
brig
htne
ss Light
Jun19_0139_data
Jun20_0110_data
Figure 4.6 Results of Participant 1(2/2). The area shaded blue is when the
subject is being exposed to the blue light. The time of awakening is marked in
red.
02:00 03:00 04:00 05:00 06:00 07:00 08:00 09:00 10:00time
50
60
70
80
90
100
110
BPM
June 8th - 9th Heart Rate
Figure 4.7 Body movement for participant 1. Large body movements are marked
in green. Light exposure is shaded in blue.
25

4. Results 4.2. Final Experiment
Participant 3: Results of Final Experiment
Questionnaire Gyro data HR data CdS data Night of
X X X X JUN8
O X O O JUN9
O X X X JUN10
O X X X JUN11
O X X X JUN12
O X O O JUN13
O X O O JUN14
O X O O JUN15
O X O X JUN16
O X O X JUN17
O X O O JUN18
Table 4.4 Results Summary of Participant 3
Participant 2
Out of the 15 days that participant 2 took part in this experiment, there were
4 days in which the participant could not initiate the device. Some days the
participant was not home, and other days the participant was too tired and/or
intoxicated to be able to carry out the experiment routine. Furthermore, for all
the remaining 11 days, the questionnaire, the data retrieved from the gyro sensor
and the heart rate data were available. The brightness data from the CdS cell
were not so perfect with only five days where the activation of the light emitting
device was observed. When the heart rate data and the time of when participant 2
was exposed to the blue light were compared, 8 mornings out of the 11 recordings
showed fluctuations in the heart rate while the participant was being exposed to
the light (figures 4.9, 4.10, 4.11). Large body movements were observed through
the sensor for most of the nights (figure 4.12). Overall, this participant claimed
that using the blue light device made their awakenings more pleasant compared
to standard morning wake up routines. Also, This particular participant did not
set an alarm for most of the mornings during this experiment, nevertheless, the
26
4. Results 4.2. Final Experiment
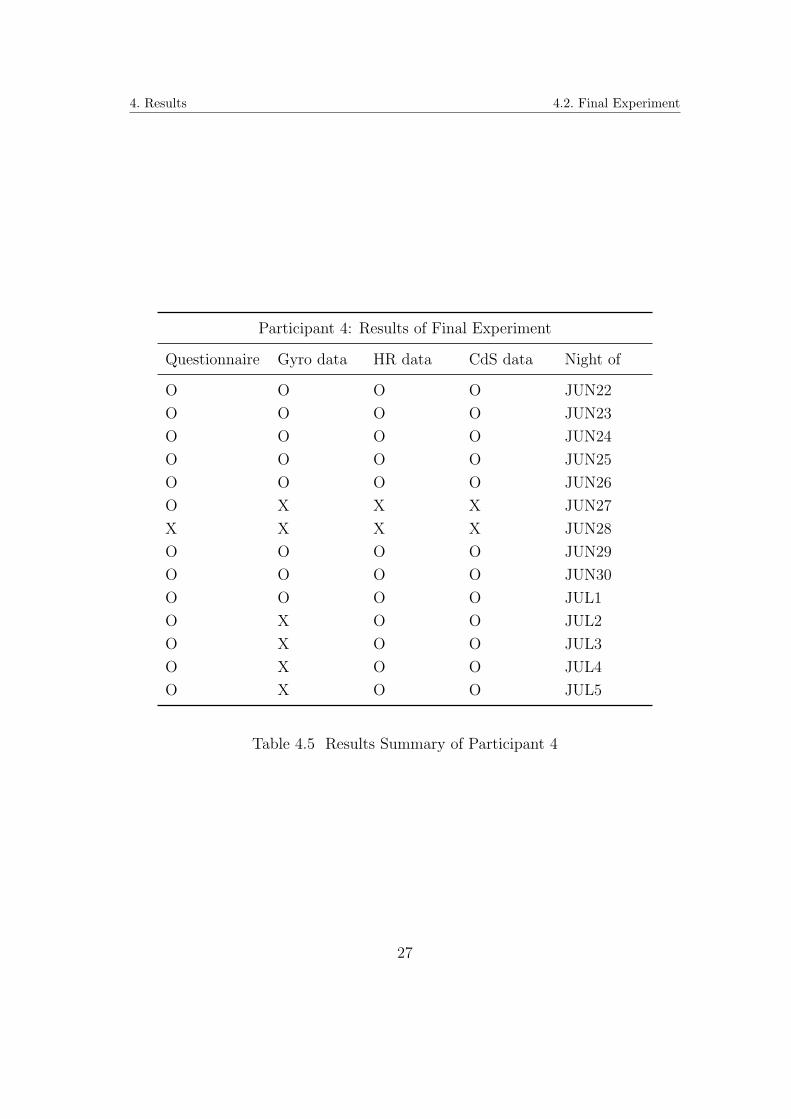
Participant 4: Results of Final Experiment
Questionnaire Gyro data HR data CdS data Night of
O O O O JUN22
O O O O JUN23
O O O O JUN24
O O O O JUN25
O O O O JUN26
O X X X JUN27
X X X X JUN28
O O O O JUN29
O O O O JUN30
O O O O JUL1
O X O O JUL2
O X O O JUL3
O X O O JUL4
O X O O JUL5
Table 4.5 Results Summary of Participant 4
27
4. Results 4.2. Final Experiment
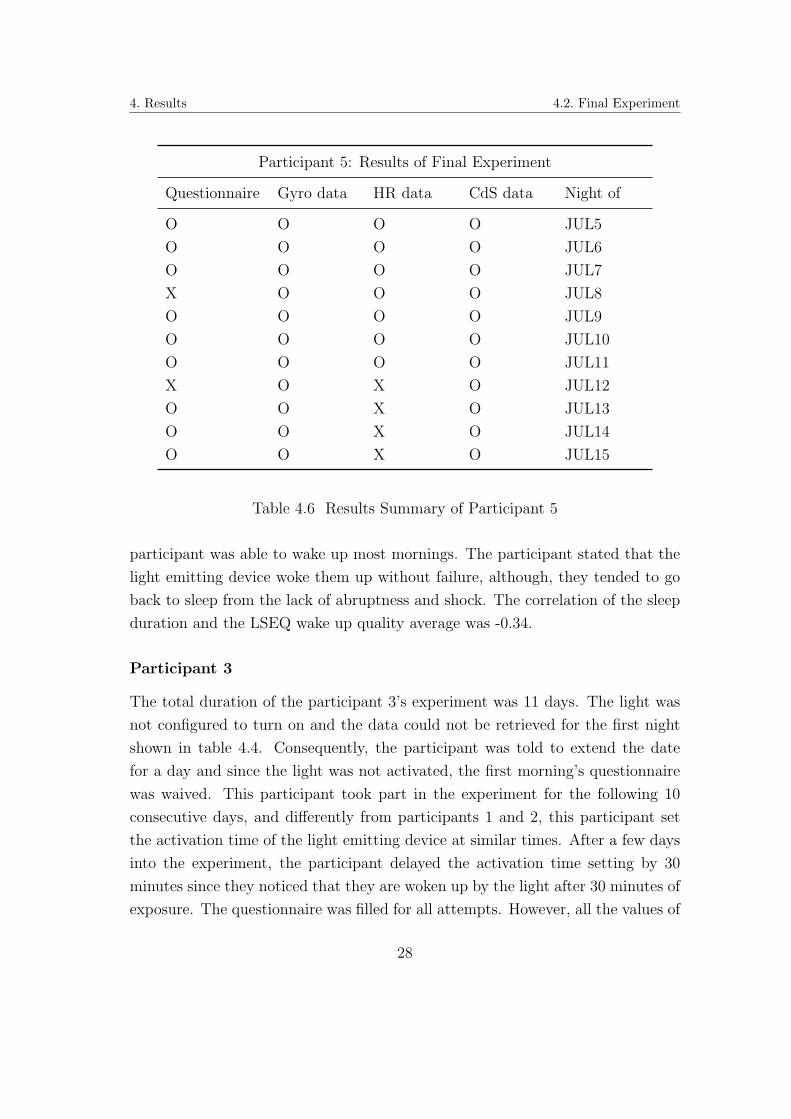
Participant 5: Results of Final Experiment
Questionnaire Gyro data HR data CdS data Night of
O O O O JUL5
O O O O JUL6
O O O O JUL7
X O O O JUL8
O O O O JUL9
O O O O JUL10
O O O O JUL11
X O X O JUL12
O O X O JUL13
O O X O JUL14
O O X O JUL15
Table 4.6 Results Summary of Participant 5
participant was able to wake up most mornings. The participant stated that the
light emitting device woke them up without failure, although, they tended to go
back to sleep from the lack of abruptness and shock. The correlation of the sleep
duration and the LSEQ wake up quality average was -0.34.
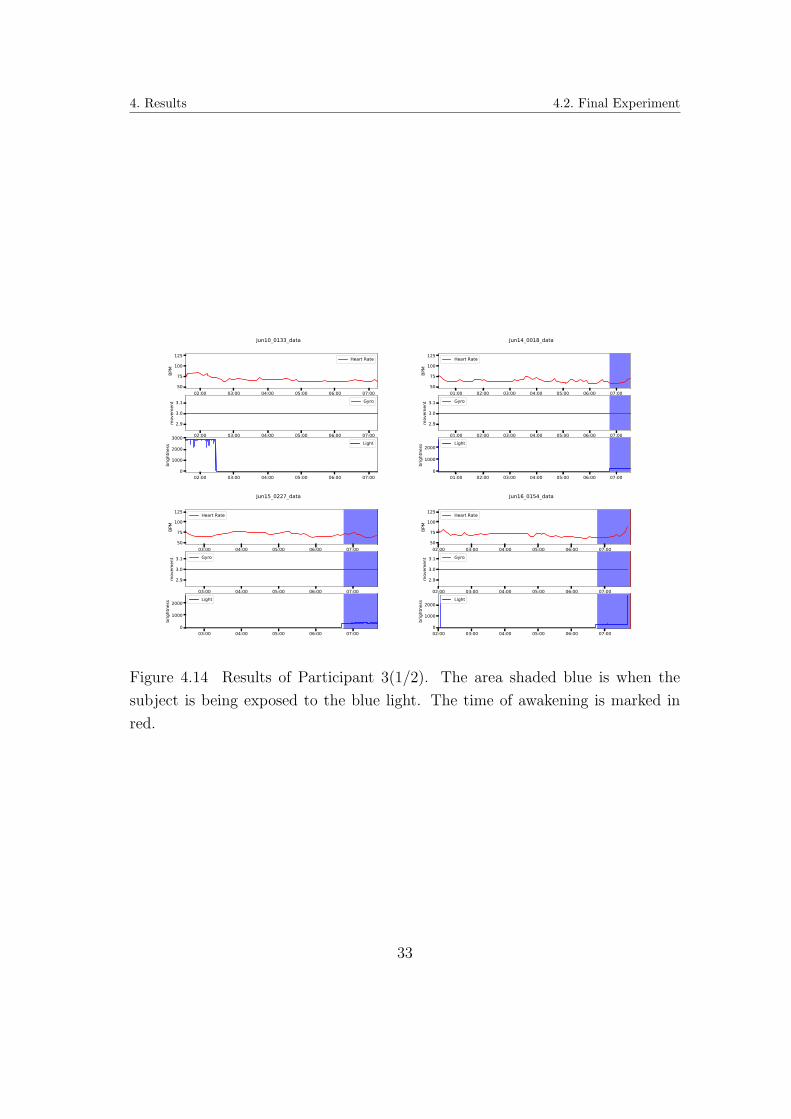
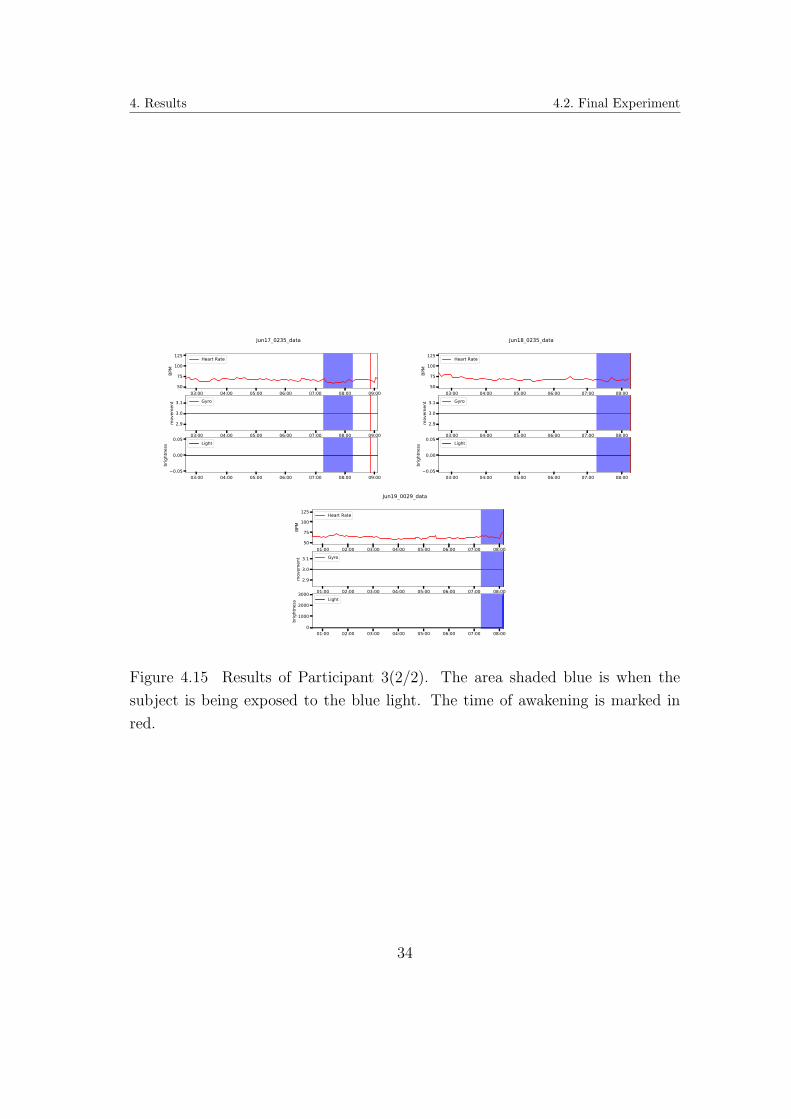
Participant 3
The total duration of the participant 3’s experiment was 11 days. The light was
not configured to turn on and the data could not be retrieved for the first night
shown in table 4.4. Consequently, the participant was told to extend the date
for a day and since the light was not activated, the first morning’s questionnaire
was waived. This participant took part in the experiment for the following 10
consecutive days, and differently from participants 1 and 2, this participant set
the activation time of the light emitting device at similar times. After a few days
into the experiment, the participant delayed the activation time setting by 30
minutes since they noticed that they are woken up by the light after 30 minutes of
exposure. The questionnaire was filled for all attempts. However, all the values of
28

4. Results 4.2. Final Experiment
54.4
74.84
97.16
69.1658.98
91.28
26.26
89.56 90.56
36.7
360420
360
570
480
345 360300
360
480
300
400
500
600
700
800
900
0
20
40
60
80
100
120
7-Jun 9-Jun 11-Jun 13-Jun 15-Jun 17-Jun 19-Jun 21-Jun 23-Jun
Min
utes
Scor
e /1
00
Day
LSEQ Summary of Participant 2
Figure 4.8 Participant 2: The summary of the average of LSEQ survey (Q6 -
Q10)
02:00 03:00 04:00 05:00 06:00 07:00 08:0050
75
100
125
BPM
Heart Rate
02:00 03:00 04:00 05:00 06:00 07:00 08:000
20000
40000
mov
emen
t Gyro
02:00 03:00 04:00 05:00 06:00 07:00 08:000
50010001500
brig
htne
ss Light
Jun09_0107_data
01:00 02:00 03:00 04:00 05:00 06:00 07:0050
75
100
125
BPM
Heart Rate
01:00 02:00 03:00 04:00 05:00 06:00 07:000
2000
4000
6000
mov
emen
t Gyro
01:00 02:00 03:00 04:00 05:00 06:00 07:000
200
brig
htne
ss Light
Jun10_0014_data
01:00 02:00 03:00 04:00 05:00 06:0050
75
100
125
BPM
Heart Rate
01:00 02:00 03:00 04:00 05:00 06:000
20000
40000
mov
emen
t Gyro
01:00 02:00 03:00 04:00 05:00 06:000
200
400
600
brig
htne
ss Light
Jun11_0013_data
03:00 04:00 05:00 06:00 07:00 08:00 09:0050
75
100
125
BPM
Heart Rate
03:00 04:00 05:00 06:00 07:00 08:00 09:000
2000
4000
6000
mov
emen
t Gyro
03:00 04:00 05:00 06:00 07:00 08:00 09:000
250
500
750
brig
htne
ss Light
Jun12_0226_data
Figure 4.9 Results of Participant 2(1/3). The area shaded blue is when the
subject is being exposed to the blue light. The time of awakening is marked in
red.
29

4. Results 4.2. Final Experiment
02:00 04:00 06:00 08:00 10:00 12:0050
75
100
125
BPM
Heart Rate
02:00 04:00 06:00 08:00 10:00 12:000
10000
20000
30000
mov
emen
t Gyro
02:00 04:00 06:00 08:00 10:00 12:000
500
1000
1500
brig
htne
ss Light
Jun13_0042_data
01:00 02:00 03:00 04:00 05:00 06:00 07:00 08:0050
75
100
125
BPM
Heart Rate
01:00 02:00 03:00 04:00 05:00 06:00 07:00 08:000
20000
40000
mov
emen
t Gyro
01:00 02:00 03:00 04:00 05:00 06:00 07:00 08:000
500
1000
1500
brig
htne
ss Light
Jun14_0003_data
01:00 02:00 03:00 04:00 05:0050
75
100
125
BPM
Heart Rate
01:00 02:00 03:00 04:00 05:00400
500
600
700
mov
emen
t Gyro
01:00 02:00 03:00 04:00 05:000
500
1000
brig
htne
ss
Light
Jun16_2358_data
00:00 01:00 02:00 03:00 04:00 05:00 06:0050
75
100
125
BPM
Heart Rate
00:00 01:00 02:00 03:00 04:00 05:00 06:00
400
500
600
mov
emen
t Gyro
00:00 01:00 02:00 03:00 04:00 05:00 06:000
100
200
brig
htne
ss Light
Jun17_2353_data
Figure 4.10 Results of Participant 2(2/3). The area shaded blue is when the
subject is being exposed to the blue light. The time of awakening is marked in
red.
30
4. Results 4.2. Final Experiment
05:00 06:00 07:00 08:00 09:0050
75
100
125
BPM
Heart Rate
05:00 06:00 07:00 08:00 09:00
400
500
600
mov
emen
t
Gyro
05:00 06:00 07:00 08:00 09:000.05
0.00
0.05
brig
htne
ss Light
Jun19_0420_data
02:00 03:00 04:00 05:00 06:00 07:00 08:0050
75
100
125
BPM
Heart Rate
02:00 03:00 04:00 05:00 06:00 07:00 08:000
20000
40000
60000
mov
emen
t Gyro
02:00 03:00 04:00 05:00 06:00 07:00 08:000
500
1000
brig
htne
ss Light
Jun21_0147_data
01:00 02:00 03:00 04:00 05:00 06:00 07:00 08:0050
75
100
125
BPM
Heart Rate
01:00 02:00 03:00 04:00 05:00 06:00 07:00 08:000
5000
10000
mov
emen
t Gyro
01:00 02:00 03:00 04:00 05:00 06:00 07:00 08:000
1000
2000
brig
htne
ss Light
Jun23_0025_data
Figure 4.11 Results of Participant 2(3/3). The area shaded blue is when the
subject is being exposed to the blue light. The time of awakening is marked in
red.
00:00 01:00 02:00 03:00 04:00 05:00 06:00 07:00 08:00time
60
65
70
75
80
85
BPM
June 9th - 10th Heart Rate
Figure 4.12 Body movement for participant 2. Large body movements are marked
in green. Light exposure is shaded in blue.
31

4. Results 4.2. Final Experiment
65.96
54.2447.14
61.2
38.96
62
76.32
54.8
74.76
51.04
370330
266
423
310345 365
315
430 436
200250300350400450500550600650700
0102030405060708090
7-Jun 9-Jun 11-Jun 13-Jun 15-Jun 17-Jun 19-Jun 21-Jun
Min
utes
Scor
e /1
00
Day
LSEQ Summary of Participant 3
Figure 4.13 Participant 3: The summary of the average of LSEQ survey (Q6 -
Q10)
the gyro sensor continuously read a value of 3 (see figures 4.14 and 4.15), which is
an error code for the I2C interface. The CdS cell was not picking up light for three
consecutive days, and then two consecutive days three days apart and this was due
to an object covering the sensor up. The heart rate data from this participant
also showed a gradual increase while the exposure of the light. Participant 3
described the light to have the effect of starting the day with a bright mood.
Also, in the comments, participant 3 noted that since the experiment started,
they were waking up with a clear head and was able to wake up steadily despite
being deprived of sleep. They also said ”having something to contribute just by
sleeping gives me a reason to go to bed.”. The correlation of the sleep duration
and the LSEQ wake up quality average was 0.53.
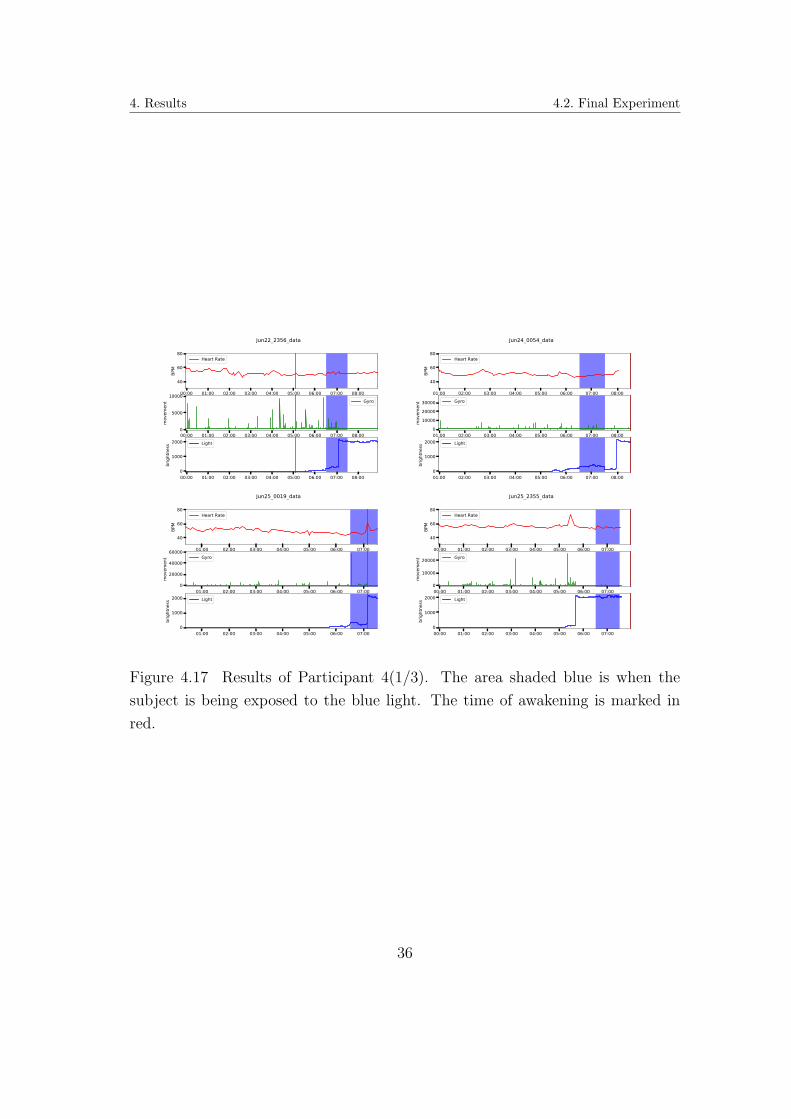
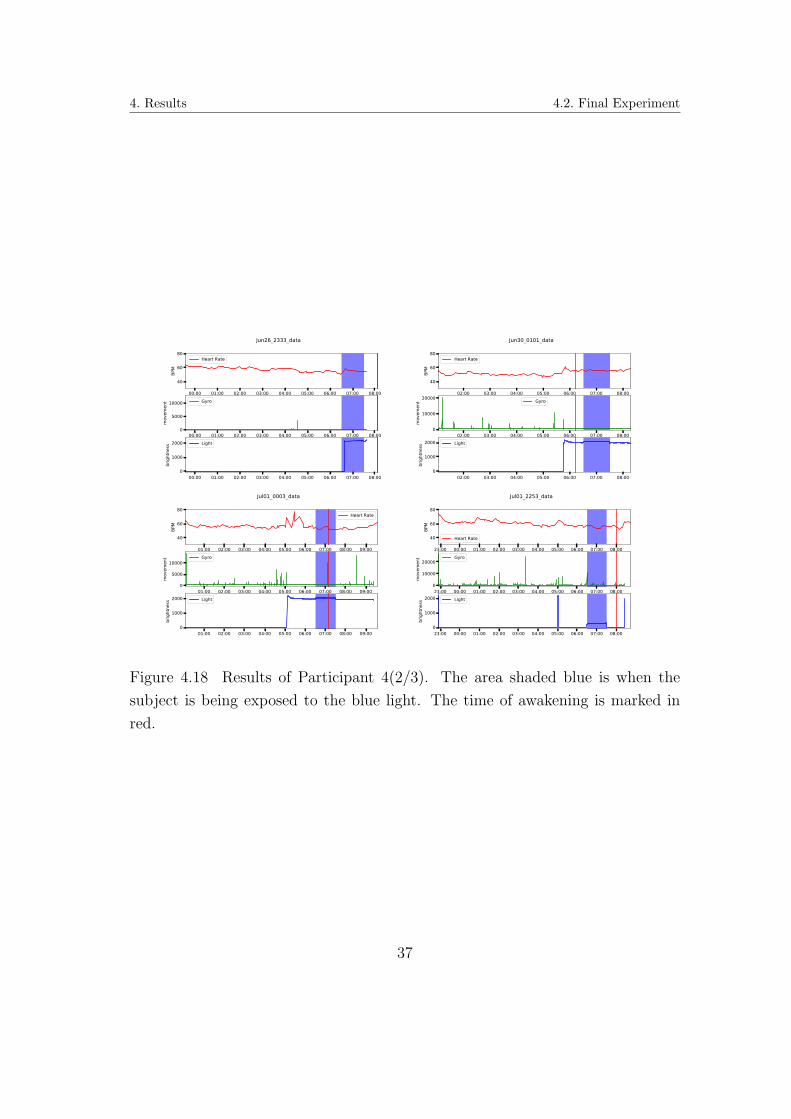
Participant 4
The duration of participant 4’s experiment was 14 days. There was a night where
the sensor board had connection problems with the computer (table 4.5, JUL27).
The following day, the participant did not take any data since the participant
was not home. This participant set the activation time of the light at 5:30 AM
regardless of when the participant went to bed. The participant had sleeping
32
4. Results 4.2. Final Experiment
02:00 03:00 04:00 05:00 06:00 07:0050
75
100
125
BPM
Heart Rate
02:00 03:00 04:00 05:00 06:00 07:00
2.9
3.0
3.1
mov
emen
t Gyro
02:00 03:00 04:00 05:00 06:00 07:000
1000
2000
3000
brig
htne
ss Light
Jun10_0133_data
01:00 02:00 03:00 04:00 05:00 06:00 07:0050
75
100
125
BPM
Heart Rate
01:00 02:00 03:00 04:00 05:00 06:00 07:00
2.9
3.0
3.1
mov
emen
t Gyro
01:00 02:00 03:00 04:00 05:00 06:00 07:000
1000
2000
brig
htne
ss Light
Jun14_0018_data
03:00 04:00 05:00 06:00 07:0050
75
100
125
BPM
Heart Rate
03:00 04:00 05:00 06:00 07:00
2.9
3.0
3.1
mov
emen
t Gyro
03:00 04:00 05:00 06:00 07:000
1000
2000
brig
htne
ss Light
Jun15_0227_data
02:00 03:00 04:00 05:00 06:00 07:0050
75
100
125
BPM
Heart Rate
02:00 03:00 04:00 05:00 06:00 07:00
2.9
3.0
3.1
mov
emen
t Gyro
02:00 03:00 04:00 05:00 06:00 07:000
1000
2000
brig
htne
ss Light
Jun16_0154_data
Figure 4.14 Results of Participant 3(1/2). The area shaded blue is when the
subject is being exposed to the blue light. The time of awakening is marked in
red.
33
4. Results 4.2. Final Experiment
03:00 04:00 05:00 06:00 07:00 08:00 09:0050
75
100
125
BPM
Heart Rate
03:00 04:00 05:00 06:00 07:00 08:00 09:00
2.9
3.0
3.1
mov
emen
t Gyro
03:00 04:00 05:00 06:00 07:00 08:00 09:000.05
0.00
0.05
brig
htne
ss Light
Jun17_0235_data
03:00 04:00 05:00 06:00 07:00 08:0050
75
100
125
BPM
Heart Rate
03:00 04:00 05:00 06:00 07:00 08:00
2.9
3.0
3.1
mov
emen
t Gyro
03:00 04:00 05:00 06:00 07:00 08:000.05
0.00
0.05
brig
htne
ss Light
Jun18_0235_data
01:00 02:00 03:00 04:00 05:00 06:00 07:00 08:0050
75
100
125
BPM
Heart Rate
01:00 02:00 03:00 04:00 05:00 06:00 07:00 08:00
2.9
3.0
3.1
mov
emen
t Gyro
01:00 02:00 03:00 04:00 05:00 06:00 07:00 08:000
1000
2000
3000
brig
htne
ss Light
Jun19_0029_data
Figure 4.15 Results of Participant 3(2/2). The area shaded blue is when the
subject is being exposed to the blue light. The time of awakening is marked in
red.
34

4. Results 4.2. Final Experiment
38.442.22
47.2851.29
58.7 59.14 59.9 58.76
47.3249.54
37.14410 419
335
422
324
250304
575
472
200250300350400450500550600650700
0
10
20
30
40
50
60
70
21-Jun 23-Jun 25-Jun 27-Jun 29-Jun 1-Jul 3-Jul 5-Jul
Min
utes
Scor
e /1
00
Day
LSEQ Summary of Participant 4
Figure 4.16 Participant 1: The summary of the average of LSEQ survey (Q6 -
Q10)
problems where they would wake up mid sleep. For this reason, there were con-
siderable days where the participant was awake before the light being activated.
To not stress the participant out about being asleep when the light was activated,
the participant was asked to try exposing themself to the light even if they were
awake. The gyro sensor seemed to have stopped working on the last four days of
the experiment. For the mornings when the participant was sleeping when the
light was activated, an increase in body movement (figure 4.20) and heart rate
fluctuation was observed (figures 4.17, 4.18 and 4.19). The correlation between
the sleep duration and the waking up quality for the LSEQ survey was negative
0.64. Participant 4 felt that the light had helped them sleep through the whole
night without waking up for some of the nights.
Participant 5
For participant 5, the duration of the experiment was 11 days. For two of the days,
the questionnaire could not be retrieved (table 4.6). Also, the Apple Watch which
is responsible for measuring heart rate data stopped logging values after the night
of JUL 11th. As the watch’s real-time heart rate monitor was working, the cause
is unknown. This participant usually woke up in early mornings, with an average
35
4. Results 4.2. Final Experiment
00:00 01:00 02:00 03:00 04:00 05:00 06:00 07:00 08:00
40
60
80
BPM
Heart Rate
00:00 01:00 02:00 03:00 04:00 05:00 06:00 07:00 08:000
5000
10000
mov
emen
t Gyro
00:00 01:00 02:00 03:00 04:00 05:00 06:00 07:00 08:000
1000
2000
brig
htne
ss Light
Jun22_2356_data
01:00 02:00 03:00 04:00 05:00 06:00 07:00 08:00
40
60
80
BPM
Heart Rate
01:00 02:00 03:00 04:00 05:00 06:00 07:00 08:000
100002000030000
mov
emen
t Gyro
01:00 02:00 03:00 04:00 05:00 06:00 07:00 08:000
1000
2000
brig
htne
ss Light
Jun24_0054_data
01:00 02:00 03:00 04:00 05:00 06:00 07:00
40
60
80
BPM
Heart Rate
01:00 02:00 03:00 04:00 05:00 06:00 07:000
20000
40000
60000
mov
emen
t Gyro
01:00 02:00 03:00 04:00 05:00 06:00 07:000
1000
2000
brig
htne
ss Light
Jun25_0019_data
00:00 01:00 02:00 03:00 04:00 05:00 06:00 07:00
40
60
80
BPM
Heart Rate
00:00 01:00 02:00 03:00 04:00 05:00 06:00 07:000
10000
20000
mov
emen
t Gyro
00:00 01:00 02:00 03:00 04:00 05:00 06:00 07:000
1000
2000
brig
htne
ss Light
Jun25_2355_data
Figure 4.17 Results of Participant 4(1/3). The area shaded blue is when the
subject is being exposed to the blue light. The time of awakening is marked in
red.
36
4. Results 4.2. Final Experiment
00:00 01:00 02:00 03:00 04:00 05:00 06:00 07:00 08:00
40
60
80
BPM
Heart Rate
00:00 01:00 02:00 03:00 04:00 05:00 06:00 07:00 08:000
5000
10000
mov
emen
t Gyro
00:00 01:00 02:00 03:00 04:00 05:00 06:00 07:00 08:000
1000
2000
brig
htne
ss Light
Jun26_2333_data
02:00 03:00 04:00 05:00 06:00 07:00 08:00
40
60
80
BPM
Heart Rate
02:00 03:00 04:00 05:00 06:00 07:00 08:000
10000
20000
mov
emen
t Gyro
02:00 03:00 04:00 05:00 06:00 07:00 08:000
1000
2000
brig
htne
ss Light
Jun30_0101_data
01:00 02:00 03:00 04:00 05:00 06:00 07:00 08:00 09:00
40
60
80
BPM
Heart Rate
01:00 02:00 03:00 04:00 05:00 06:00 07:00 08:00 09:000
5000
10000
mov
emen
t Gyro
01:00 02:00 03:00 04:00 05:00 06:00 07:00 08:00 09:000
1000
2000
brig
htne
ss Light
Jul01_0003_data
23:00 00:00 01:00 02:00 03:00 04:00 05:00 06:00 07:00 08:00
40
60
80
BPM
Heart Rate
23:00 00:00 01:00 02:00 03:00 04:00 05:00 06:00 07:00 08:000
10000
20000
mov
emen
t Gyro
23:00 00:00 01:00 02:00 03:00 04:00 05:00 06:00 07:00 08:000
1000
2000
brig
htne
ss Light
Jul01_2253_data
Figure 4.18 Results of Participant 4(2/3). The area shaded blue is when the
subject is being exposed to the blue light. The time of awakening is marked in
red.
37

4. Results 4.2. Final Experiment
00:00 01:00 02:00 03:00 04:00 05:00 06:00 07:00
40
60
80BP
M
Heart Rate
00:00 01:00 02:00 03:00 04:00 05:00 06:00 07:000
10000
20000
30000
mov
emen
t Gyro
00:00 01:00 02:00 03:00 04:00 05:00 06:00 07:000
1000
2000
brig
htne
ss Light
Jul02_2332_data
01:00 02:00 03:00 04:00 05:00 06:00 07:00
40
60
80
BPM
Heart Rate
01:00 02:00 03:00 04:00 05:00 06:00 07:0033490
33500
33510
mov
emen
t Gyro
01:00 02:00 03:00 04:00 05:00 06:00 07:000
1000
2000
brig
htne
ss Light
Jul04_0004_data
00:00 01:00 02:00 03:00 04:00 05:00 06:00 07:00 08:00
40
60
80
BPM
Heart Rate
00:00 01:00 02:00 03:00 04:00 05:00 06:00 07:00 08:0032000
33000
34000
35000
mov
emen
t Gyro
00:00 01:00 02:00 03:00 04:00 05:00 06:00 07:00 08:000
1000
2000
brig
htne
ss Light
Jul04_2305_data
01:00 02:00 03:00 04:00 05:00 06:00 07:00
40
60
80
BPM
Heart Rate
01:00 02:00 03:00 04:00 05:00 06:00 07:0032000
33000
34000
35000
mov
emen
t Gyro
01:00 02:00 03:00 04:00 05:00 06:00 07:000
1000
2000br
ight
ness Light
Jul06_0055_data
Figure 4.19 Results of Participant 4(3/3). The area shaded blue is when the
subject is being exposed to the blue light. The time of awakening is marked in
red.
Figure 4.20 Body movement for participant 4. Large body movements are marked
in green. Light exposure is shaded in blue.
38

4. Results 4.2. Final Experiment
97.32
82.9887.74
55.7868.16
97.6
83.3896.6 97.52
317365
417
285
450
366
290 306330
200250300350400450500550600650700
0
20
40
60
80
100
120
4-Jul 6-Jul 8-Jul 10-Jul 12-Jul 14-Jul 16-Jul
Min
utes
Scor
e /1
00
Day
LSEQ Summary of Participant 5
Figure 4.21 Participant 5: The summary of the average of LSEQ survey (Q6 -
Q10)
sleep duration of 5 hours and 47 minutes. The correlation of sleep duration and
wake up quality was negative 0.07 (figure 4.21). The participant claimed that they
usually require 6 hours of sleep when the participant can rest for two to three hours
before going to bed before midnight. During this experiment, the participant was
overloaded with work, causing them to sleep around 1AM- 2AM every day. This
may be the reason for the sleep duration having an extremely low correlation to
the wake up quality. This participant described the light to have had the effect
of making waking up in mornings easier. The data consistently showed increase
in body movement and an episode of increased heart rate fluctuations while the
exposure of blue light.
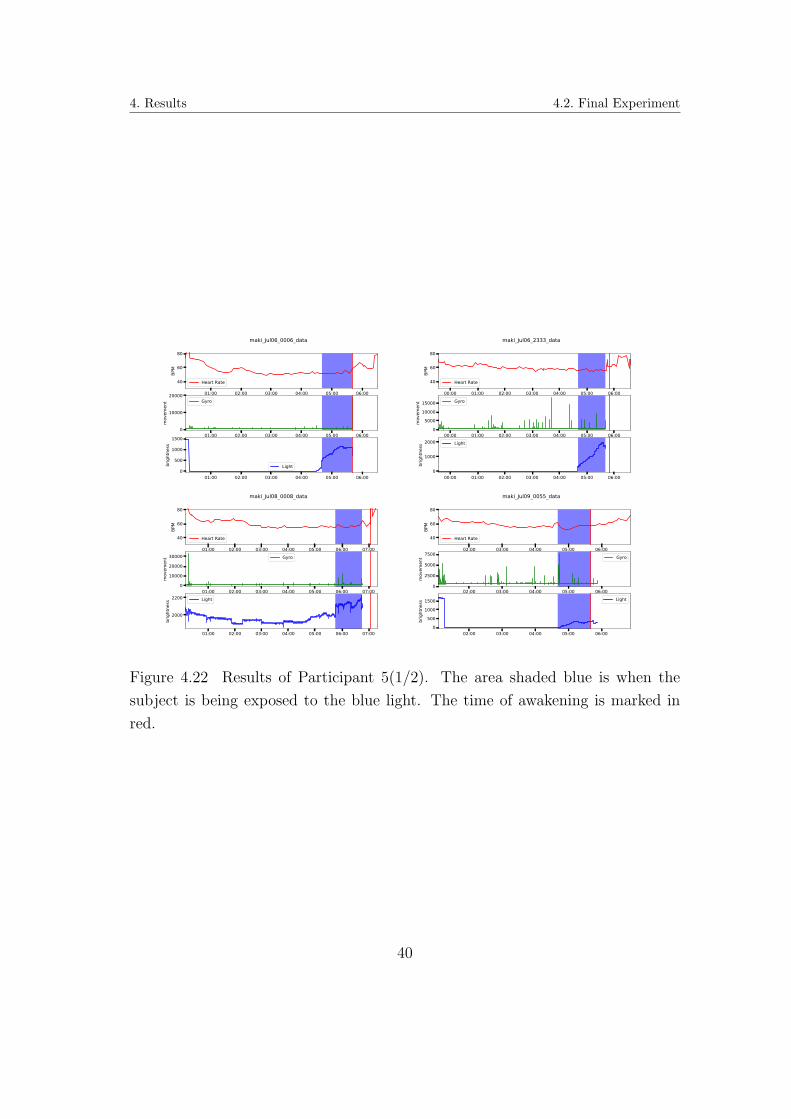
39
4. Results 4.2. Final Experiment
01:00 02:00 03:00 04:00 05:00 06:00
40
60
80
BPM
Heart Rate
01:00 02:00 03:00 04:00 05:00 06:000
10000
20000
mov
emen
t Gyro
01:00 02:00 03:00 04:00 05:00 06:000
500
1000
1500
brig
htne
ss
Light
maki_Jul06_0006_data
00:00 01:00 02:00 03:00 04:00 05:00 06:00
40
60
80
BPM
Heart Rate
00:00 01:00 02:00 03:00 04:00 05:00 06:000
50001000015000
mov
emen
t Gyro
00:00 01:00 02:00 03:00 04:00 05:00 06:000
1000
2000
brig
htne
ss Light
maki_Jul06_2333_data
01:00 02:00 03:00 04:00 05:00 06:00 07:00
40
60
80
BPM
Heart Rate
01:00 02:00 03:00 04:00 05:00 06:00 07:000
10000
20000
30000
mov
emen
t Gyro
01:00 02:00 03:00 04:00 05:00 06:00 07:00
2000
2200
brig
htne
ss Light
maki_Jul08_0008_data
02:00 03:00 04:00 05:00 06:00
40
60
80
BPM
Heart Rate
02:00 03:00 04:00 05:00 06:000
2500
5000
7500
mov
emen
t Gyro
02:00 03:00 04:00 05:00 06:000
50010001500
brig
htne
ss Light
maki_Jul09_0055_data
Figure 4.22 Results of Participant 5(1/2). The area shaded blue is when the
subject is being exposed to the blue light. The time of awakening is marked in
red.
40

4. Results 4.2. Final Experiment
02:30 03:00 03:30 04:00 04:30 05:00 05:30 06:00 06:30
40
60
80BP
M
Heart Rate
02:30 03:00 03:30 04:00 04:30 05:00 05:30 06:00 06:300
5000
10000
mov
emen
t Gyro
02:30 03:00 03:30 04:00 04:30 05:00 05:30 06:00 06:300
1000
2000
3000
brig
htne
ss Light
maki_Jul10_0154_data
01:00 02:00 03:00 04:00 05:00 06:00 07:00
40
60
80
BPM
Heart Rate
01:00 02:00 03:00 04:00 05:00 06:00 07:00
2000
4000
mov
emen
t Gyro
01:00 02:00 03:00 04:00 05:00 06:00 07:000
1000
2000
3000
brig
htne
ss Light
maki_Jul11_0050_data
01:00 02:00 03:00 04:00 05:00 06:00 07:00
40
60
80
BPM
Heart Rate
01:00 02:00 03:00 04:00 05:00 06:00 07:000
10000
20000
30000
mov
emen
t Gyro
01:00 02:00 03:00 04:00 05:00 06:00 07:000
2000
4000
brig
htne
ss Light
maki_Jul11_1120_data
Figure 4.23 Results of Participant 5(2/2). The area shaded blue is when the
subject is being exposed to the blue light. The time of awakening is marked in
red.
00:00 01:00 02:00 03:00 04:00 05:00 06:00time
50
60
70
80
90
100
110
BPM
June 5th - 6th Heart Rate
Figure 4.24 Body movement for participant 5. Large body movements are marked
in green. Light exposure is shaded in blue.
41

Chapter 5
Discussion
Summary
The main contribution of this study is to design a system which could measure
the sleep cycle of the subject at their own homes. When measuring sleep in a lab,
the subjects sense stress simply from being in an unfamiliar environment. This
may cause discrepancies to the participant’s usual sleep pattern. The goodness of
this system is that the measurement of the sleeping data can be taken from the
participant’s familiar comfortable bed with easily affordable, accessible sensors.
The experiment showed that the body movement data and the heart rate data
together show an imperfect but okay indication of the participant’s sleep stage.
Overall, there are not enough complete data samples to definitively state that
being exposed to blue light prior to awakening contributes to a better waking
experience. However, the data taken from the heart rate monitor and the few body
movement data values show that the light was effective in waking the participants
up. All the participants showed consistent patterns of increased body movements
and heart rate fluctuations. The increase in body movement shows that the
sleeper is in stage 1 or 2 of sleep. Past studies have revealed that ”bad” waking
experiences are often caused from waking up in sleep stages 3, 4 or REM sleep.
Sleep stages 1 and 2 are a good sleep phase to wake up at. Although, as the
data showed, many participants experienced fluctuations in the heart rate during
the exposure, implying REM sleep. This is not a good phase to wake up. Data
showed that the participants seemed to be shifting back and forth between sleep
stages 1, 2, consciousness and REM sleep. Furthermore, most of the time, the
fluctuation in the heart rate, indicating REM sleep, ended within the first 20
minutes of exposure which may have contributed to the better waking experience
for the participants. Moreover, from the comment box beside the questionnaire
42

5. Discussion
(found in B.1, B.2), there were promising comments such as:
• ”I do not need the alarm clock to wake myself up when I have this light set
up.”
• ”The light wakes me up gently.”
• ”Waking up bears no stress when I am woken up by this light. I don’t feel like
I’ve been woken up, I feel like I’ve just opened my eyes from a long blink.”
• ”I woke up 30 minutes before I set my alarm, this does not usually happen.”
• ”Compared to other mornings when I am deprived of sleep, I feel less groggy
even though I definitely have not had enough sleep.”
• ”I usually stay in bed because my body refuses to budge after I gain con-
sciousness, but that is not the case right now.”
• ”My heart palpitates on wakening most mornings, I have not felt it since I
started taking part in the experiment (Day10).”
One of the participants is still using the light emitting device every morning. At
this moment, it has already been over a month since the start of the experiment.
Before, the participant was using the light each morning, they would experience
palpitation (a sudden rise in heart rate) once every three days on waking up.
Although, the participant claims to not have experienced the palpitation ever
since they started using the light device. The same participant also commented
that they felt less groggy with the light in sleep deprived mornings. Although
further interview revealed that there was a sleepiness rebound after few hours.
This phenomenon is also seen in another study [28].
There were also some notable comments which could be developed into an
interesting future work.
• ”The light wakes me up so gently that I often go straight back to sleep, I
want something to prevent this.”
• ”I feel like I get sleepier at night.”
43
5. Discussion
• ”After a few days of being exposed to the light at the same time each morning,
I stopped waking up mid-sleep. I don’t know if the light is helping, or if it’s
another reason but I slept through the whole night!!”
Delay Before Waking
Participant 1 on average took 62 minutes from the onset of the light alarm to
wake up.
Participant 2 on average took 52 minutes from the onset of the light alarm to
wake up.
Participant 3’s wake-up time could not be estimated since the sensor regarding
the body movement was failing. Although, the participant self-reported that the
average wake-up time for them was around 30 minutes.
Information on participant 4’s delay before waking following the blue light ex-
posure could not be deemed relevant since the participant was awake for most
mornings before the light was activated.
Participant 5 on average took 28 minutes from the onset of the light alarm to
wake up.
Looking at the age difference in participant 1, 2 versus participant 3, the time
difference is in line with the study explaining the decline of melatonin production
with age [15]. Still, this experiment does have a small sample size making this
merely a suggestion. Participant 5 may have been more sensitive to the light
stimulus since they had important plans every morning during the experiment.
Note that ’wake up’ here is used to describe the occurrence of the initial large
movement in the gyro sensor data.
LSEQ Wake Up Average
There were too many data missing for participant 1 to picture the difference in
the heart rate, body movement with the timing of the light exposure.
For participant 2, the LSEQ Wake up Average scores had a negative correlation
with the sleeping duration. When the comments were examined to investigate the
reason, the factor was alcohol. When the participant had one too many drinks,
they tended to sleep longer, waking up with a hangover which led to the low
LSEQ Wake Up scores. Other than alcohol, the timing of when the blue light was
44
5. Discussion
activated seemed to have a relation with the LSEQ scores. When the heart rate
is increasing or is at the peak when the light is activated, the scores tended to be
high. Whereas, when the heart rate has just crossed over the peak when the light
was activated, the heart rate tended to create a sine curve like shape within the
light activated area on the graph and the scores tended to be lower.
For participant 3, the gyro sensor completely failed to work, so there is no way
to tell with precision when the subject woke up. However, the same movement of
heart rate compared with the light activation was witnessed.
Variances Between Activation Times
Participants 2, 3 and 4 were mostly setting their light activation time at similar
or fixed times and sleeping at similar times. On the other hand, participant 1
had a highly varying sleeping schedule with bedtimes frequently changing plus or
minus 2 hours. This may be one of the reasons why participant 1 did not feel that
they were influenced by the blue light. Interestingly, even for participant 1 who
did not feel the influence of the light, body movements were prevalent (when the
sensor was taking data properly.), indicating a possible reaction to the light.
Problems with the Sensors Used
Out of all the data collected, when the gyro sensor was properly picking up the
movements of the subjects, the graphs showed when the participants woke up and
realised that the light was turned on. The heart rate increased synchronously
with the gyro sensor peaks on most occasions and if the measurement was taken
for an extended period, one would be able to distinguish the sleeping cycle and
stages to see the change in duration with the participant being exposed with the
light. However, this study did not take measurements of when the participants
were not being exposed to the light so it may be difficult even then to see a clear
difference in the sleeping stages. One possible experiment design is to periodically
turn the light on and off, perhaps with a cycle of 90 minutes, to see if the sleeping
cycles start to synchronise with the light. This way, there would not be a need
to compare two experiment conditions. If it is the case that blue light has the
capability to manipulate or direct how the sleeping stages shift from one another,
the light alarm may be devised as a scientifically proven waking device.
45
5. Discussion 5.1. Possible Applications
The sensors not being able to collect appropriate data may be due to the lack of
explanation or a check sheet which explains further in detail about how they should
position the sensors. The participants were not told specifically about the light
sensor, which may have led to them placing the light sensor at ineffective locations.
Also, the participants were not specifically told to sleep alone each night. There
were cases where the gyro sensor measurements were picking up movements of
another person on the bed which could be estimated from the inconsistencies in
the heart rate change. The gyro sensor sometimes had a problem with the I2C
communication protocol right after being disconnected from the Wi-Fi network
and reconnecting. Retrospectively, the design of the device should have foreseen
this event and incorporated an LED indicator to show that the I2C interface is
having an error. Some of the data were not retrieved because the computer cut
off from the Wi-Fi network abruptly. Since none of the computers did not try to
reconnect to the network after being disconnected, it may be a problem caused
by the Debian OS which were running in the computers used for this study. Also,
the manufacturer of Apple Watch was deploying an update for Apple Watch OS
during this experiment. Three recordings of one of the participant’s data could
not be retrieved since the synchronisation with the iPhone had stopped until the
Apple Watch OS was installed. What seemed to have happened is that the data
which overflowed from the Watch’s internal storage had been discarded. Ideally,
all the data collected on a single night should be uploaded to a server on a daily
basis and plotted to a graph, so that the examiner has the ability to check if there
are any faults with the measurements.
5.1. Possible Applications
As an Alarm Clock Device
Throughout this study, many of the participants who experienced using the blue
light alarm claimed that they have experienced an easier waking up routine. Some
even claimed to have felt that they did not need an alarm clock in the morning
to wake up at the desired time, given that they have had sufficient time to sleep.
Moreover, a repeated usage of this device for a longer duration of time may have
the effect of adjusting the circadian rhythm. However, in this study, the devices
46

5. Discussion 5.1. Possible Applications
were only used for 10 days for each participant so further studies on the use of the
device for a lengthened period of time is necessary to be assertive on this matter.
Sensing Alcohol Influence During Sleeping Hours
As shown in figure 4.1, alcohol significantly changes the HRV during sleep. While
a healthy night of sleep has somewhat of a ”standard” outline of the HR graph,
the influence of alcohol is easily visible. A closer look into this may accommodate
a new sleep tech device to objectively measure the user’s sleeping quality. A
paper published in Nature in 2021 proposes a contactless heartbeat monitor [29].
A combination with this monitoring device and the light alarm may provide a
better user experience as well.
Equipped and Built into the Bedroom
Furthermore, a futuristic house where the whole bedroom is equipped with a blue
LED where it lights up to smoothly wake up the user at the programmed time
can be one ultimate application.
Jet-lag Proof Airplanes
Currently, the cabin inside air crafts developed by Airbus is equipped with full
colour LEDs predominantly for artistic means [30]. Lighting up the aircraft with
blue-light aiming to manipulate the passenger’s melatonin secretion may lead to
a better after-flight experience with less symptoms of jetlag.
Syncing the Circadian Rhythm of Submarine Crews
Not much information was found about the use of light with different wavelengths.
However, in a submarine where natural light is absent, the use of blue light at the
right moments may significantly boost the quality of life for submarine crews.
47
5. Discussion 5.2. Future Works
5.2. Future Works
To achieve the full implementation of the applications in section 5.1 and to grasp
the full capability of the effects of blue light on sleep cycles, the following aspects
should be investigated:
• Blue light exposed at a fixed time each morning, may have the capability to
boost melatonin secretion after dark.
• Blue light exposed at a fixed time each morning, may have the capability
stop one from waking up mid-sleep.
• melatonin concentration decrease with LED light source with varying inten-
sities should be examined.
• The timing, amount of time and the light intensity or exposure patterns
needed to boost melatonin secretion at the night.
• The individual difference of when the blue light starts taking effect while
the subject is sleeping, perhaps observable from the same experiment with
a larger population.
• Further studies on the relationship between melatonin concentration and
HRV during sleep.
• Examining the contactless heart rate monitor if it gives a fair measurement
of the heart rate.
5.3. Conclusion
For the people who participated in the experiment, data consistently showed in-
crease in body movements and an episode of heart rate fluctuation, albeit the
sample size being small. This indicates that the sleepers were in lighter sleep
stages, where it is recommended for the sleeper to wake up to avoid sleep inertia.
Considering the overall positive comments which were received from the subjects,
it is plausible that exposing blue light an hour before waking gives the subjects a
better waking up experience.
48
References
[1] Liisa Kuula and Anu-Katriina Pesonen. Heart rate variability and first-
beat method for detecting sleep stages in healthy young adults: Feasibil-
ity study. JMIR Mhealth Uhealth, 9(2):e24704, Feb 2021. URL: http:
//mhealth.jmir.org/2021/2/e24704/, doi:10.2196/24704.
[2] BusinessWire. Survey finds today’s children are spending 35% less time
playing freely outside, Sep 2018. URL: https://www.businesswire.
com/news/home/20180920005526/en/Survey-Finds-Today%E2%80%99s-
Children-Are-Spending-35-Less-Time-Playing-Freely-Outside.
[3] Ian Hickie, Joanne Carpenter, and Rebecca Robillard. Variations in the
sleep–wake cycle from childhood to adulthood: chronobiological perspec-
tives. ChronoPhysiology and Therapy, 2015:37, 07 2015. doi:10.2147/CPT.
S41765.
[4] Jeffrey M. Jones. In u.s., 40% get less than recommended amount of
sleep, Jun 2021. URL: https://news.gallup.com/poll/166553/less-
recommended-amount-sleep.aspx.
[5] Shawn Youngstedt, Eric Goff, Alexandria Reynolds, Daniel Kripke, Michael
Irwin, Richard Bootzin, Nidha Khan, and Girardin Jean-Louis. Has adult
sleep duration declined over the last 50+ years? Sleep Medicine Reviews, 28,
08 2015. doi:10.1016/j.smrv.2015.08.004.
[6] Research Ritchie and data: Hannah. Covid-19: Google mobility trends.
URL: https://ourworldindata.org/covid-google-mobility-trends.
[7] Wytske A. Hofstra and Al W. de Weerd. How to assess circadian rhythm
in humans: A review of literature. Epilepsy & Behavior, 13(3):438–
444, 2008. URL: https://www.sciencedirect.com/science/article/
49

References
pii/S1525505008001625, doi:https://doi.org/10.1016/j.yebeh.2008.
06.002.
[8] Jeanne F. Duffy and Jr. Kenneth P. Wright. Entrainment of the human cir-
cadian system by light. Journal of Biological Rhythms, 20(4):326–338, 2005.
PMID: 16077152. URL: https://doi.org/10.1177/0748730405277983,
arXiv:https://doi.org/10.1177/0748730405277983, doi:10.1177/
0748730405277983.
[9] Mary Carskadon and William Dement. Normal human sleep: An overview.
principles and practice of sleep medicine. m.h. kryger (ed.). W.B. Saunders,
Philadelphia, pages 3–13, 01 1989.
[10] T. Lee-Chiong. Sleep: A Comprehensive Handbook. 11 2005. doi:10.1002/
0471751723.
[11] Phyllis K. Stein and Yachuan Pu. Heart rate variability, sleep and sleep
disorders. Sleep Medicine Reviews, 16(1):47–66, 2012. URL: https:
//www.sciencedirect.com/science/article/pii/S1087079211000293,
doi:https://doi.org/10.1016/j.smrv.2011.02.005.
[12] Armin Bunde, Shlomo Havlin, Jan W. Kantelhardt, Thomas Penzel, Jorg-
Hermann Peter, and Karlheinz Voigt. Correlated and uncorrelated regions
in heart-rate fluctuations during sleep. Phys. Rev. Lett., 85:3736–3739, Oct
2000. URL: https://link.aps.org/doi/10.1103/PhysRevLett.85.3736,
doi:10.1103/PhysRevLett.85.3736.
[13] Danguole ZEmaityte, Giedrius Varoneckas, and Eugene Sokolov. Heart
rhythm control during sleep. Psychophysiology, 21(3):279–289, 1984.
URL: https://onlinelibrary.wiley.com/doi/abs/10.1111/j.1469-
8986.1984.tb02935.x, arXiv:https://onlinelibrary.wiley.
com/doi/pdf/10.1111/j.1469-8986.1984.tb02935.x, doi:https:
//doi.org/10.1111/j.1469-8986.1984.tb02935.x.
[14] Yohei Sagawa, Hideaki Kondo, Namiko Matsubuchi, Takaubu Take-
mura, Hironobu Kanayama, Yoshihiko Kaneko, Takashi Kanbayashi,
Yasuo Hishikawa, and Tetsuo Shimizu. Alcohol has a dose-related effect on
50
References
parasympathetic nerve activity during sleep. Alcoholism: Clinical and Exper-
imental Research, 35(11):2093–2100, 2011. URL: https://onlinelibrary.
wiley.com/doi/abs/10.1111/j.1530-0277.2011.01558.x, arXiv:https:
//onlinelibrary.wiley.com/doi/pdf/10.1111/j.1530-0277.2011.
01558.x, doi:https://doi.org/10.1111/j.1530-0277.2011.01558.x.
[15] Richard J. Wurtman. Age-Related Decreases in Melatonin Secretion―
Clinical Consequences. The Journal of Clinical Endocrinology & Metabolism,
85(6):2135–2136, 06 2000. URL: https://doi.org/10.1210/jcem.85.6.
6660, arXiv:https://academic.oup.com/jcem/article-pdf/85/6/2135/
9174440/jcem2135.pdf, doi:10.1210/jcem.85.6.6660.
[16] George C. Brainard, John P. Hanifin, Jeffrey M. Greeson, Brenda
Byrne, Gena Glickman, Edward Gerner, and Mark D. Rollag. Ac-
tion spectrum for melatonin regulation in humans: Evidence for a
novel circadian photoreceptor. Journal of Neuroscience, 21(16):6405–
6412, 2001. URL: https://www.jneurosci.org/content/21/16/6405,
arXiv:https://www.jneurosci.org/content/21/16/6405.full.pdf,
doi:10.1523/JNEUROSCI.21-16-06405.2001.
[17] Iain M. Mclntyre, Trevor R. Norman, Graham D. Burrows, and
Stuart M. Armstrong. Human melatonin suppression by light
is intensity dependent. Journal of Pineal Research, 6(2):149–156,
1989. URL: https://onlinelibrary.wiley.com/doi/abs/10.1111/j.
1600-079X.1989.tb00412.x, arXiv:https://onlinelibrary.wiley.com/
doi/pdf/10.1111/j.1600-079X.1989.tb00412.x, doi:https://doi.org/
10.1111/j.1600-079X.1989.tb00412.x.
[18] Kathleen E. West, Michael R. Jablonski, Benjamin Warfield, Kate S. Ce-
cil, Mary James, Melissa A. Ayers, James Maida, Charles Bowen, David H.
Sliney, Mark D. Rollag, John P. Hanifin, and George C. Brainard. Blue
light from light-emitting diodes elicits a dose-dependent suppression of mela-
tonin in humans. Journal of Applied Physiology, 110(3):619–626, 2011.
PMID: 21164152. URL: https://doi.org/10.1152/japplphysiol.01413.
2009, arXiv:https://doi.org/10.1152/japplphysiol.01413.2009, doi:
51
References
10.1152/japplphysiol.01413.2009.
[19] Janne Grønli, Ida Kristiansen Byrkjedal, Bjørn Bjorvatn, Øystein Nødtvedt,
Børge Hamre, and Stale Pallesen. Reading from an ipad or from a book
in bed: the impact on human sleep. a randomized controlled crossover
trial. Sleep Medicine, 21:86–92, 2016. URL: https://www.sciencedirect.
com/science/article/pii/S1389945716000599, doi:https://doi.org/
10.1016/j.sleep.2016.02.006.
[20] Masahiko Ayaki, Atsuhiko Hattori, Yusuke Maruyama, Masaki Nakano, Mi-
chitaka Yoshimura, Momoko Kitazawa, Kazuno Negishi, and Kazuo Tsubota.
Protective effect of blue-light shield eyewear for adults against light pollution
from self-luminous devices used at night. Annual Review of Chronopharma-
cology, 33(1):134–139, January 2016. Publisher Copyright: © 2016 Taylor
& Francis. doi:10.3109/07420528.2015.1119158.
[21] John G Lawrenson, Christopher C Hull, and Laura E Downie. The ef-
fect of blue-light blocking spectacle lenses on visual performance, macu-
lar health and the sleep-wake cycle: a systematic review of the literature.
Ophthalmic and Physiological Optics, 37(6):644–654, 2017. URL: https://
onlinelibrary.wiley.com/doi/abs/10.1111/opo.12406, arXiv:https:
//onlinelibrary.wiley.com/doi/pdf/10.1111/opo.12406, doi:https:
//doi.org/10.1111/opo.12406.
[22] Kenneth P. Wright, Andrew W. McHill, Brian R. Birks, Brandon R.
Griffin, Thomas Rusterholz, and Evan D. Chinoy. Entrainment of
the human circadian clock to the natural light-dark cycle. Current
Biology, 23(16):1554–1558, 2013. URL: https://www.sciencedirect.
com/science/article/pii/S0960982213007641, doi:https://doi.org/
10.1016/j.cub.2013.06.039.
[23] Ian M. McIntyre, Trevor R. Norman, Graham D. Burrows, and Stuart M.
Armstrong. Human melatonin response to light at different times of the
night. Psychoneuroendocrinology, 14(3):187–193, 1989. URL: https://
www.sciencedirect.com/science/article/pii/0306453089900164, doi:
https://doi.org/10.1016/0306-4530(89)90016-4.
52
References
[24] Asuka Ishihara, Insung Park, Yoko Suzuki, Katsuhiko Yajima, Huiyun Cui,
Masashi Yanagisawa, Takeshi Sano, Junji Kido, and Kumpei Tokuyama.
Metabolic responses to polychromatic led and oled light at night. Scientific
reports, 11(1):1–11, 2021.
[25] Sean W Cain, Elise M McGlashan, Parisa Vidafar, Jona Mustafovska, Si-
mon PN Curran, Xirun Wang, Anas Mohamed, Vineetha Kalavally, and An-
drew JK Phillips. Evening home lighting adversely impacts the circadian
system and sleep. Scientific reports, 10(1):1–10, 2020.
[26] Patricia Tassi and Alain Muzet. Sleep inertia. Sleep Medicine Reviews,
4(4):341–353, 2000. URL: https://www.sciencedirect.com/science/
article/pii/S1087079200900984, doi:https://doi.org/10.1053/smrv.
2000.0098.
[27] J.A. Rosas and W.M. Anderson. Questionnaires and rating scales.
In Clete A. Kushida, editor, Encyclopedia of Sleep, pages 8–13. Aca-
demic Press, Waltham, 2013. URL: https://www.sciencedirect.
com/science/article/pii/B9780123786104001297, doi:https:
//doi.org/10.1016/B978-0-12-378610-4.00129-7.
[28] Henri Comtet, Pierre A Geoffroy, Mio Kobayashi Frisk, Jeffrey Hubbard, Lu-
divine Robin-Choteau, Laurent Calvel, Laurence Hugueny, Antoine U Viola,
and Patrice Bourgin. Light therapy with boxes or glasses to counteract effects
of acute sleep deprivation. Scientific reports, 9(1):1–9, 2019.
[29] Anran Wang, Dan Nguyen, Arun R Sridhar, and Shyamnath Gollakota. Us-
ing smart speakers to contactlessly monitor heart rhythms. Communications
biology, 4(1):1–12, 2021.
[30] AIRBUS. Led lighting (spectrum), 2021. URL: http://https://services.
airbus.com/en/in-flight-experience/cabin-upgrades/lighting-
comfort/led-lighting-spectrum.html.
53

Appendices
A. Instruction Manual for Experiment Setup
54

Appendices A. Instruction Manual for Experiment Setup
Figure A.1 Instruction Manual (EN)
55

Appendices A. Instruction Manual for Experiment Setup
Figure A.2 Instruction Manual (JP)
56

Appendices B. Leeds Sleep Evaluation Questionnaire
B. Leeds Sleep Evaluation Questionnaire
Lee
ds
Sle
ep E
valu
ati
on Q
ues
tion
na
ire
How
wou
ld y
ou d
escr
ibe
the
wa
y yo
u c
urr
entl
y fa
ll a
slee
p i
n c
omp
ari
son
to
usu
al?
-G
etti
ng
to
slee
p
How
wou
ld y
ou d
escr
ibe
the
qu
ali
ty o
f yo
ur
slee
p c
omp
are
d t
o n
orm
al
slee
p?
-Q
ua
lity
of
slee
p
How
wou
ld y
ou d
escr
ibe
you
r a
wa
ken
ing
in
com
pa
riso
n t
o u
sua
l? -
Aw
ake
fol
low
ing
sle
ep
How
do
you
fee
l w
hen
you
wa
ke u
p?
-A
wa
ke f
ollo
win
g s
leep
How
do
you
fee
l n
ow?
-B
eha
viou
r fo
llow
ing
wa
ken
ing
How
wou
ld y
ou d
escr
ibe
you
r b
ala
nce
an
d c
o-or
din
ati
on u
pon
aw
ake
nin
g?
-B
eha
viou
r fo
llow
ing
wa
ken
ing
1.
M
ore
dif
ficu
lt
tha
n u
sua
l
Ea
sier
th
an
usu
al
2.
S
low
er t
ha
n
usu
al
Mor
e q
uic
kly
tha
n u
sua
l
4.
M
ore
rest
less
tha
n u
sua
l
Ca
lmer
th
an
usu
al
5.
W
ith
mor
e
wa
kefu
l p
erio
ds
tha
n u
sua
l
Wit
h l
ess
wa
kefu
l p
erio
ds
tha
n u
sua
l
3.
I fe
el l
ess
slee
py
tha
n u
sua
l
Mor
e sl
eep
y
tha
n u
sua
l
6.
M
ore
dif
ficu
lt
tha
n u
sua
l
Ea
sier
th
an
usu
al
10
.
Mor
e d
isru
pte
d
th
an
usu
al
Les
s d
isru
pte
d
tha
n u
sua
l
9.
T
ired
Ale
rt
7.
R
equ
ires
a
per
iod
of
tim
e
lon
ger
th
an
usu
al
Sh
orte
r th
an
usu
al
8.
T
ired
Ale
rt
Wh
at
tim
e d
id y
ou *
go
to b
ed l
ast
nig
ht?
_
___:
____
Wh
at
tim
e d
id y
ou *
*get
up
fro
m b
ed t
oda
y? _
___:
____
* th
e ti
me
you
wen
t to
bed
, n
ot t
he
tim
e yo
u s
lep
t.
** t
he
tim
e yo
u g
ot u
p f
rom
bed
, n
ot w
hen
you
r
ega
ined
con
scio
usn
ess.
ID#
Da
y#
Fee
db
ack
on
th
e ex
per
ien
ce:
Figure B.1 Leeds Sleep Evaluation Questionnaire (EN)
57

Appendices B. Leeds Sleep Evaluation Questionnaire
Lee
ds
Sle
ep E
valu
ati
on Q
ues
tion
na
ire
寝つ
きに
つい
て
睡眠
の質
につ
いて
起床
時
起床
時の
気分
現在
の気
分
起床
時の
心身
の感
覚
1.
困
難容
易
2.
寝
付く
まで
に
時間
がか
かっ
た
特に
はや
く
寝つ
けた
4.
寝
苦し
かっ
た寝
やす
かっ
た
5.
い
つも
より
夜中
起き
るこ
とが
多か
った
いつ
もよ
り夜
中
起き
るこ
とが
少な
かっ
た
3.
ま
った
く眠
く
なか
った
とて
も
眠か
った
6.
困
難容
易
10
. 心
身の
バ
ラン
スが
悪い
心身
のバ
ラン
ス
がと
れて
いる
9.
疲
れて
いる
すっ
きり
して
いる
7.
起
床す
るま
でに
時間
がか
かっ
た
起床
する
まで
容易
8.
疲
れて
いる
すっ
きり
して
いる
昨晩
の*
就寝
時間
は何
時で
すか
?
:___
_
今朝
の**
起床
時間
は何
時で
すか
?
:___
_
* 眠
りに
つい
た時
間で
はな
く、
ベッ
ドや
布団
に入
った
時間
。
** 目
が覚
めた
時間
では
なく
、ベ
ッド
や布
団か
ら起
き上
がっ
た時
間。
ID#
Da
y#
今回
の体
験に
つい
ての
コメ
ント
欄:
Figure B.2 Leeds Sleep Evaluation Questionnaire (JP)
58
Related Documents