RIGHT: URL: CITATION: AUTHOR(S): ISSUE DATE: TITLE: Biochemical studies and applications of sugar and polyamine metabolisms in gut microbes( Dissertation_全文 ) Sugiyama, Yuta Sugiyama, Yuta. Biochemical studies and applications of sugar and polyamine metabolisms in gut microbes. 京都大学, 2020, 博士(農学) 2020-03-23 https://doi.org/10.14989/doctor.r13344

Welcome message from author
This document is posted to help you gain knowledge. Please leave a comment to let me know what you think about it! Share it to your friends and learn new things together.
Transcript
RIGHT:
URL:
CITATION:
AUTHOR(S):
ISSUE DATE:
TITLE:
Biochemical studies and applications ofsugar and polyamine metabolisms in gutmicrobes( Dissertation_全文 )
Sugiyama, Yuta
Sugiyama, Yuta. Biochemical studies and applications of sugar and polyaminemetabolisms in gut microbes. 京都大学, 2020, 博士(農学)
2020-03-23
https://doi.org/10.14989/doctor.r13344

Biochemical studies and applications of
sugar and polyamine metabolisms in gut microbes
Yuta Sugiyama
2020

TABLE OF CONTENTS
ABBREVIATIONS ........................................................................................................................... 4
GENERAL INTRODUCTION ....................................................................................................... 1
CHAPTER I
Introduction of H-antigen structures on various glycoconjugates ..................................................... 7
SECTION I
Generation of highly functional 1,2-α-L-fucosynthase
from 1,2-α-L-fucosidase of Bifidobacterium bifidum .................................................................. 7
SUMMARY .............................................................................................................................. 41
SECTION II
Introduction of H-antigen structures on various glycoconjugates
using highly functional 1,2-α-L-fucosynthase .......................................................................... 42
SUMMARY .............................................................................................................................. 56
CHAPTER II
Analysis of polyamine biosynthetic and transport ability of human gut microbes ......................... 57
SECTION I
Analysis of polyamine biosynthetic and transport ability of the dominant human gut microbes and
prediction of the presence of novel polyamine biosynthetic and transport proteins ................... 57
SUMMARY .............................................................................................................................. 80
SECTION II
Polyamine biosynthetic and transport ability of human indigenous Bifidobacterium species ..... 81
SUMMARY .............................................................................................................................. 99
SECTION III
Analysis of a novel putrescine exporter SapBCDF of Escherichia coli ................................... 100
SUMMARY ............................................................................................................................119
CONCLUSION ........................................................................................................................ 120
ACKNOWLEDGEMENTS .................................................................................................... 122
LIST OF PUBLICATIONS .................................................................................................... 124
ABBREVIATIONS
AAT Agmatine aminopropyltransferase
ADC Arginine decarboxylase
ADI Agmatine deiminase
AdoMetDC S-Adenosylmethionine decarboxylase
AGM Agmatine
AguD Putrescine-agmatine antiporter
APAGM Aminopropylagmatine
APAUH Aminopropylagmatine ureohydrolase
Ara Arabinose
ARG Arginine
ASA Aspartate-β-semialdehyde
ATP Adenosine triphosphate
AUH Agmatine ureohydrolase
BbAfcA 1,2-α-L-Fucosidase from Bifidobacterium bifidum JCM1254
BHI Brain-heart infusion
BLAST Basic local alignment search tool
BlastP Protein BLAST
BT2970 1,3-1,4-α-L-Fucosidase from Bacteroides thetaiotaomicron VPI-5482
CAD Charged aerosol detector
CASDC Carboxyspermidine decarboxylase
CASDH Carboxyspermidine dehydrogenase
CSPD Carboxyspermidine
dcSAM Decarboxylated S-adenosylmethionine
dHex Deoxyhexose
DMSO Dimethylsulfoxide
DNA Deoxyribonucleic acid
2'-FL 2'-Fucosyllactose
3-FL 3-Fucosyllactose
FRT Flippase recognition target
Fru Fructose
Fuc Fucose
FucF Fucopyranosyl fluoride
FUT Fucosyltransferase
Gal Galactose

GalN Galactosamine
GalNAc N-Acetylgalactosamine
GAM Gifu anaerobic medium
GC Gas chromatography
GH Glycoside hydrolase
Glc Glucose
GlcN Glucosamine
GlcNAc N-Acetylglucosamine
GNB Galacto-N-biose
HEPES 4-(2-Hydroxyethyl)-1-piperazineethanesulfonic acid
Hex Hexose
HexNAc N-Acetylhexose
HMO Human milk oligosaccharide
HPAEC High-performance anion-exchange chromatography
HPLC High-performance liquid chromatography
kan+ Kanamycin resistant gene
Lac Lactose
LacNAc N-Acetyllactosamine
LB Luria-Bertani broth
LDFT Lactodifucotetraose
Le Lewis
LNB Lacto-N-biose I
LNFP Lacto-N-fucopentaose
LNT Lacto-N-tetraose
LNnT Lacto-N-neotetraose
MALDI-TOF MS Matrix assisted laser desorption/ionization-time of flight mass spectrometry
MdtJI Spermidine exporter from Escherichia coli
MES 2-(N-Morpholino) ethanesulfonic acid
MS Mass spectrometry
MTA 5’-Deoxy-5’methylthioadenosine
NCP N-Carbamoylputrescine
NCPAH N-Carbamoylputrescine amidohydrolase
NMR Nuclear magnetic resonance
OD Optical density
ODC Ornithine decarboxylase
ORN Ornithine
PA Pyridylaminated
PAD Pulsed amperometric detector
PCR Polymerase chain reaction
PCT Putrescine carbamoyltransferase
PGM Porcine gastric mucin
PlaP Low-affinity putrescine importer
PNA Peanut agglutinin
PNG-F Peptide: N-glycanase-F
pNP p-Nitrophenyl
PotABCD ATP-binding cassette type spermidine preferential importer
PotE Putrescine-ornithine antiporter
PotFGHI ATP-binding cassette type putrescine specific importer
PuuP High-affinity putrescine importer
Put (PUT) Putrescine
Rha Rhamnose
SAM S-Adenosylmethionine
SD Standard deviation
SDS-PAGE Sodium dodecyl sulfate-polyacrylamide gel electrophoresis
Spd (SPD) Spermidine
SPDsyn Spermidine synthase
Spm Spermine
TBS-T Tris-buffered saline containing 0.05 % (v/v) Tween-20
t-BuOH 2-Methyl-2-propanol
TCA Trichloroacetic acid
TLC Thin layer chromatography
Tris Tris (hydroxymethyl) aminomethane
UEA-I Ulex europaeus agglutinin I
WT Wild type
XLLG Xyloglucan nonasaccharide
Xyl Xylose
1
GENERAL INTRODUCTION
Over 2000 species (1) and approximately 40 trillion cells (2) of gut microbes colonize the
human colon. Recent studies have revealed that gut microbes influence host health and physiology,
and cause, for example, obesity (3), diabetes (4), and autism (5). Several studies have shown that host
interacts with gut microbes. For example, mothers supply human milk oligosaccharides (HMOs) (6,7),
which are the third most abundant solid component in breast milk and are not digestible by humans
(8), to Bifidobacterium species which have beneficial effects on human (9,10). Gut microbes produce
various bioactive metabolites, such as short-chain fatty acid (10), hydroxy fatty acid (11), aromatic
amino acid derivatives (12) from dietary compounds. The physiological effects of gut microbes on the
host are a result of host-gut microbe interactions. Hence, understanding the details of host-gut microbe
interactions is key for controlling host health and developing a good symbiosis with gut microbes.
However, the mechanism involved in host-gut microbe interactions are still unclear. The aim of this
study was to construct a basis for understanding host-gut microbe interactions at the compound level.
The author focused on glycans as the host-derived compounds and polyamines as the gut microbe-
derived compounds in this study.
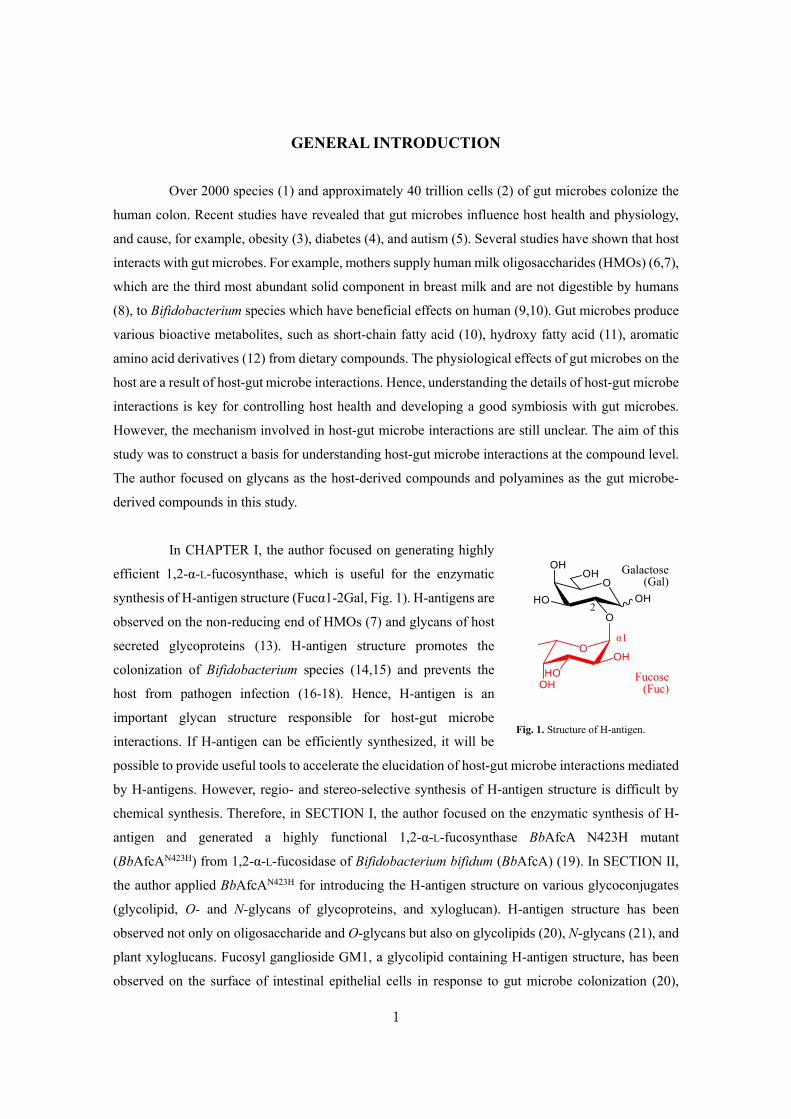
In CHAPTER I, the author focused on generating highly
efficient 1,2-α-L-fucosynthase, which is useful for the enzymatic
synthesis of H-antigen structure (Fucα1-2Gal, Fig. 1). H-antigens are
observed on the non-reducing end of HMOs (7) and glycans of host
secreted glycoproteins (13). H-antigen structure promotes the
colonization of Bifidobacterium species (14,15) and prevents the
host from pathogen infection (16-18). Hence, H-antigen is an
important glycan structure responsible for host-gut microbe
interactions. If H-antigen can be efficiently synthesized, it will be
possible to provide useful tools to accelerate the elucidation of host-gut microbe interactions mediated
by H-antigens. However, regio- and stereo-selective synthesis of H-antigen structure is difficult by
chemical synthesis. Therefore, in SECTION I, the author focused on the enzymatic synthesis of H-
antigen and generated a highly functional 1,2-α-L-fucosynthase BbAfcA N423H mutant
(BbAfcAN423H) from 1,2-α-L-fucosidase of Bifidobacterium bifidum (BbAfcA) (19). In SECTION II,
the author applied BbAfcAN423H for introducing the H-antigen structure on various glycoconjugates
(glycolipid, O- and N-glycans of glycoproteins, and xyloglucan). H-antigen structure has been
observed not only on oligosaccharide and O-glycans but also on glycolipids (20), N-glycans (21), and
plant xyloglucans. Fucosyl ganglioside GM1, a glycolipid containing H-antigen structure, has been
observed on the surface of intestinal epithelial cells in response to gut microbe colonization (20),
Fig. 1. Structure of H-antigen.
Galactose (Gal)
Fucose (Fuc)
2
α1

2
suggesting that fucosyl ganglioside GM1 contributes to the development of symbiosis between the
host and gut microbes in the colon. Fucosyl xyloglucan nonasaccharide is a bioactive plant glycan that
shows inhibition activity against auxin-stimulated stem growth (22). Therefore, the author
enzymatically synthesized these H-antigen containing glycoconjugates using BbAfcAN423H.
In CHAPTER II, the author focused on the polyamine
biosynthesis and transport ability of human gut microbes. Several
hundred micromolar to a few millimolar concentrations of
polyamines exist in the colonic lumen (23) and these polyamines are
derived from gut microbes (24-26). These colonic luminal
polyamines can affect host health, such as expanding lifespan,
cognitive improvement (27), amelioration of inflammation (28), and
vascular endothelial function improvement (29). Understanding the
polyamine biosynthetic and transport abilities of the human
dominant gut microbes which are the main source of colonic polyamines is important to maintain host
health via the regulation of colonic polyamine levels. Therefore, in SECTION I, the author analyzed
the biosynthetic and transport abilities of the polyamines (putrescine, spermidine, and spermine, Fig.
2) of the human dominant gut microbes that are culturable in Gifu anaerobic medium (30).
Furthermore, the author presumed the presence of novel polyamine biosynthetic and transport proteins
in the human dominant gut microbes based on the results of BlastP analysis combined with polyamine
biosynthetic- and transport abilities. SECTION II focused on the biosynthetic and transport abilities
of the polyamines (putrescine, spermidine, and spermine) of human indigenous Bifidobacterium
species. Bifidobacteria are one of the typical human indigenous bacteria (31-33). Although there are
many reports on the functionality of bifidobacteria as probiotics, the physiological analysis of
bifidobacteria itself has not progressed and, to the best of my knowledge, there is only one report on
the ability of biosynthesis and transport of polyamines (34). Therefore, the author evaluated the ability
of biosynthesis and transport of polyamines (Fig. 2) for 13 species reported as human indigenous
Bifidobacterium species (31-33). Furthermore, the possibility of the existence of novel polyamine
biosynthesis and transport protein(s) was presumed by inferring and collating the analyzed results in
the presence and absence of known polyamine biosynthetic and transport proteins. SECTION III
focused on the putrescine exporter of Escherichia coli, which functions under a neutral pH
environment. The colonic lumen is neutral pH (35). However, putrescine exporter that functions under
a neutral pH environment has not been identified in gut microbes. The author observed putrescine
excretion under a neutral pH environment in E. coli, a model gut microbe. The author performed
genome-wide screening using the Keio collection (36) and discovered SapBCDF as a novel putrescine
exporter in E. coli.
Fig. 2. Polyamine structures measured in this study.
Putrescine
Spermidine
Spermine
3
REFERENCES
1. Almeida, A., Mitchell, A. L., Boland, M., Forster, S. C., Gloor, G. B., Tarkowska, A.,
Lawley, T. D., and Finn, R. D. (2019) A new genomic blueprint of the human gut
microbiota. Nature 568, 499-504
2. Sender, R., Fuchs, S., and Milo, R. (2016) Revised Estimates for the Number of Human and
Bacteria Cells in the Body. PLoS Biol 14, e1002533
3. Ridaura, V. K., Faith, J. J., Rey, F. E., Cheng, J., Duncan, A. E., Kau, A. L., Griffin, N. W.,
Lombard, V., Henrissat, B., Bain, J. R., Muehlbauer, M. J., Ilkayeva, O., Semenkovich, C.
F., Funai, K., Hayashi, D. K., Lyle, B. J., Martini, M. C., Ursell, L. K., Clemente, J. C., Van
Treuren, W., Walters, W. A., Knight, R., Newgard, C. B., Heath, A. C., and Gordon, J. I.
(2013) Gut microbiota from twins discordant for obesity modulate metabolism in mice.
Science 341, 1241214
4. Pedersen, H. K., Gudmundsdottir, V., Nielsen, H. B., Hyotylainen, T., Nielsen, T., Jensen, B.
A., Forslund, K., Hildebrand, F., Prifti, E., Falony, G., Le Chatelier, E., Levenez, F., Doré,
J., Mattila, I., Plichta, D. R., Pöhö, P., Hellgren, L. I., Arumugam, M., Sunagawa, S., Vieira-
Silva, S., Jørgensen, T., Holm, J. B., Trošt, K., Kristiansen, K., Brix, S., Raes, J., Wang, J.,
Hansen, T., Bork, P., Brunak, S., Oresic, M., Ehrlich, S. D., Pedersen, O., and Consortium,
M. (2016) Human gut microbes impact host serum metabolome and insulin sensitivity.
Nature 535, 376-381
5. Sharon, G., Cruz, N. J., Kang, D. W., Gandal, M. J., Wang, B., Kim, Y. M., Zink, E. M.,
Casey, C. P., Taylor, B. C., Lane, C. J., Bramer, L. M., Isern, N. G., Hoyt, D. W., Noecker,
C., Sweredoski, M. J., Moradian, A., Borenstein, E., Jansson, J. K., Knight, R., Metz, T. O.,
Lois, C., Geschwind, D. H., Krajmalnik-Brown, R., and Mazmanian, S. K. (2019) Human
Gut Microbiota from Autism Spectrum Disorder Promote Behavioral Symptoms in Mice.
Cell 177, 1600-1618.e1617
6. Katayama, T. (2016) Host-derived glycans serve as selected nutrients for the gut microbe:
human milk oligosaccharides and bifidobacteria. Biosci Biotechnol Biochem 80, 621-632
7. Bode, L. (2012) Human milk oligosaccharides: every baby needs a sugar mama.
Glycobiology 22, 1147-1162
8. Brand-Miller, J. C., McVeagh, P., McNeil, Y., and Messer, M. (1998) Digestion of human
milk oligosaccharides by healthy infants evaluated by the lactulose hydrogen breath test. J
Pediatr 133, 95-98
9. Sivan, A., Corrales, L., Hubert, N., Williams, J. B., Aquino-Michaels, K., Earley, Z. M.,
Benyamin, F. W., Lei, Y. M., Jabri, B., Alegre, M. L., Chang, E. B., and Gajewski, T. F.
(2015) Commensal Bifidobacterium promotes antitumor immunity and facilitates anti-PD-
4
L1 efficacy. Science 350, 1084-1089
10. Fukuda, S., Toh, H., Hase, K., Oshima, K., Nakanishi, Y., Yoshimura, K., Tobe, T., Clarke, J.
M., Topping, D. L., Suzuki, T., Taylor, T. D., Itoh, K., Kikuchi, J., Morita, H., Hattori, M.,
and Ohno, H. (2011) Bifidobacteria can protect from enteropathogenic infection through
production of acetate. Nature 469, 543-547
11. Miyamoto, J., Igarashi, M., Watanabe, K., Karaki, S. I., Mukouyama, H., Kishino, S., Li, X.,
Ichimura, A., Irie, J., Sugimoto, Y., Mizutani, T., Sugawara, T., Miki, T., Ogawa, J., Drucker,
D. J., Arita, M., Itoh, H., and Kimura, I. (2019) Gut microbiota confers host resistance to
obesity by metabolizing dietary polyunsaturated fatty acids. Nat Commun 10, 4007
12. Dodd, D., Spitzer, M. H., Van Treuren, W., Merrill, B. D., Hryckowian, A. J., Higginbottom,
S. K., Le, A., Cowan, T. M., Nolan, G. P., Fischbach, M. A., and Sonnenburg, J. L. (2017) A
gut bacterial pathway metabolizes aromatic amino acids into nine circulating metabolites.
Nature 551, 648-652
13. Hakomori, S. (1999) Antigen structure and genetic basis of histo-blood groups A, B and O:
their changes associated with human cancer. Biochim Biophys Acta 1473, 247-266
14. Korpela, K., Salonen, A., Hickman, B., Kunz, C., Sprenger, N., Kukkonen, K., Savilahti, E.,
Kuitunen, M., and de Vos, W. M. (2018) Fucosylated oligosaccharides in mother's milk
alleviate the effects of caesarean birth on infant gut microbiota. Sci Rep 8, 13757
15. Lewis, Z. T., Totten, S. M., Smilowitz, J. T., Popovic, M., Parker, E., Lemay, D. G., Van
Tassell, M. L., Miller, M. J., Jin, Y. S., German, J. B., Lebrilla, C. B., and Mills, D. A.
(2015) Maternal fucosyltransferase 2 status affects the gut bifidobacterial communities of
breastfed infants. Microbiome 3, 13
16. Pham, T. A., Clare, S., Goulding, D., Arasteh, J. M., Stares, M. D., Browne, H. P., Keane, J.
A., Page, A. J., Kumasaka, N., Kane, L., Mottram, L., Harcourt, K., Hale, C., Arends, M. J.,
Gaffney, D. J., Dougan, G., Lawley, T. D., and Project, S. M. G. (2014) Epithelial IL-
22RA1-mediated fucosylation promotes intestinal colonization resistance to an
opportunistic pathogen. Cell Host Microbe 16, 504-516
17. Goto, Y., Obata, T., Kunisawa, J., Sato, S., Ivanov, I. I., Lamichhane, A., Takeyama, N.,
Kamioka, M., Sakamoto, M., Matsuki, T., Setoyama, H., Imaoka, A., Uematsu, S., Akira, S.,
Domino, S. E., Kulig, P., Becher, B., Renauld, J. C., Sasakawa, C., Umesaki, Y., Benno, Y.,
and Kiyono, H. (2014) Innate lymphoid cells regulate intestinal epithelial cell glycosylation.
Science 345, 1254009
18. Pickard, J. M., Maurice, C. F., Kinnebrew, M. A., Abt, M. C., Schenten, D., Golovkina, T.
V., Bogatyrev, S. R., Ismagilov, R. F., Pamer, E. G., Turnbaugh, P. J., and Chervonsky, A. V.
(2014) Rapid fucosylation of intestinal epithelium sustains host-commensal symbiosis in
sickness. Nature 514, 638-641
5
19. Katayama, T., Sakuma, A., Kimura, T., Makimura, Y., Hiratake, J., Sakata, K., Yamanoi, T.,
Kumagai, H., and Yamamoto, K. (2004) Molecular cloning and characterization of
Bifidobacterium bifidum 1,2-alpha-L-fucosidase (AfcA), a novel inverting glycosidase
(glycoside hydrolase family 95). J Bacteriol 186, 4885-4893
20. Umesaki, Y., Suzuki, A., Kasama, T., Tohyama, K., Mutai, M., and Yamakawa, T. (1981)
Presence of asialo GM1 and glucosylceramide in the intestinal mucosa of mice and
induction of fucosyl asialo GM1 by conventionalization of germ-free mice. J Biochem 90,
1731-1738
21. Canis, K., McKinnon, T. A., Nowak, A., Haslam, S. M., Panico, M., Morris, H. R., Laffan,
M. A., and Dell, A. (2012) Mapping the N-glycome of human von Willebrand factor.
Biochem J 447, 217-228
22. Augur, C., Yu, L., Sakai, K., Ogawa, T., Sinaÿ, P., Darvill, A. G., and Albersheim, P. (1992)
Further studies of the ability of xyloglucan oligosaccharides to inhibit auxin-stimulated
growth. Plant Physiol 99, 180-185
23. Matsumoto, M., Kakizoe, K., and Benno, Y. (2007) Comparison of fecal microbiota and
polyamine concentration in adult patients with intractable atopic dermatitis and healthy
adults. Microbiol Immunol 51, 37-46
24. Noack, J., Kleessen, B., Proll, J., Dongowski, G., and Blaut, M. (1998) Dietary guar gum
and pectin stimulate intestinal microbial polyamine synthesis in rats. J Nutr 128, 1385-1391
25. Noack, J., Dongowski, G., Hartmann, L., and Blaut, M. (2000) The human gut bacteria
Bacteroides thetaiotaomicron and Fusobacterium varium produce putrescine and
spermidine in cecum of pectin-fed gnotobiotic rats. J Nutr 130, 1225-1231
26. Matsumoto, M., Kibe, R., Ooga, T., Aiba, Y., Kurihara, S., Sawaki, E., Koga, Y., and Benno,
Y. (2012) Impact of intestinal microbiota on intestinal luminal metabolome. Sci Rep 2, 233
27. Kibe, R., Kurihara, S., Sakai, Y., Suzuki, H., Ooga, T., Sawaki, E., Muramatsu, K.,
Nakamura, A., Yamashita, A., Kitada, Y., Kakeyama, M., Benno, Y., and Matsumoto, M.
(2014) Upregulation of colonic luminal polyamines produced by intestinal microbiota
delays senescence in mice. Sci Rep 4, 4548
28. Matsumoto, M., Kurihara, S., Kibe, R., Ashida, H., and Benno, Y. (2011) Longevity in mice
is promoted by probiotic-induced suppression of colonic senescence dependent on
upregulation of gut bacterial polyamine production. PLoS One 6, e23652
29. Matsumoto, M., Kitada, Y., and Naito, Y. (2019) Endothelial Function is improved by
Inducing Microbial Polyamine Production in the Gut: A Randomized Placebo-Controlled
Trial. Nutrients 11
30. Gotoh, A., Nara, M., Sugiyama, Y., Sakanaka, M., Yachi, H., Kitakata, A., Nakagawa, A.,
Minami, H., Okuda, S., Katoh, T., Katayama, T., and Kurihara, S. (2017) Use of Gifu

6
Anaerobic Medium for culturing 32 dominant species of human gut microbes and its
evaluation based on short-chain fatty acids fermentation profiles. Biosci Biotechnol
Biochem 81, 2009-2017
31. Bottacini, F., Ventura, M., van Sinderen, D., and O'Connell Motherway, M. (2014)
Diversity, ecology and intestinal function of bifidobacteria. Microb Cell Fact 13 Suppl 1,
S4
32. Milani, C., Duranti, S., Lugli, G. A., Bottacini, F., Strati, F., Arioli, S., Foroni, E., Turroni,
F., van Sinderen, D., and Ventura, M. (2013) Comparative genomics of Bifidobacterium
animalis subsp. lactis reveals a strict monophyletic bifidobacterial taxon. Appl Environ
Microbiol 79, 4304-4315
33. Yatsunenko, T., Rey, F. E., Manary, M. J., Trehan, I., Dominguez-Bello, M. G., Contreras,
M., Magris, M., Hidalgo, G., Baldassano, R. N., Anokhin, A. P., Heath, A. C., Warner, B.,
Reeder, J., Kuczynski, J., Caporaso, J. G., Lozupone, C. A., Lauber, C., Clemente, J. C.,
Knights, D., Knight, R., and Gordon, J. I. (2012) Human gut microbiome viewed across age
and geography. Nature 486, 222-227
34. Hamana, K. (1997) Polyamine Distribution Patterns in Gram-Positive Eubacteria : The
Absence of Cellular Polyamine Synthesis. Ann. Rep. Coo. Med. Care Technol. Gunma Univ.
17, 137-144
35. Ringel-Kulka, T., Choi, C. H., Temas, D., Kim, A., Maier, D. M., Scott, K., Galanko, J. A.,
and Ringel, Y. (2015) Altered Colonic Bacterial Fermentation as a Potential
Pathophysiological Factor in Irritable Bowel Syndrome. Am J Gastroenterol 110, 1339-1346
36. Baba, T., Ara, T., Hasegawa, M., Takai, Y., Okumura, Y., Baba, M., Datsenko, K. A., Tomita,
M., Wanner, B. L., and Mori, H. (2006) Construction of Escherichia coli K-12 in-frame,
single-gene knockout mutants: the Keio collection. Mol Syst Biol 2, 2006.0008
7
CHAPTER I
Introduction of H-antigen structures on various glycoconjugates
SECTION I
Generation of highly functional 1,2-α-L-fucosynthase from 1,2-α-L-fucosidase of
Bifidobacterium bifidum
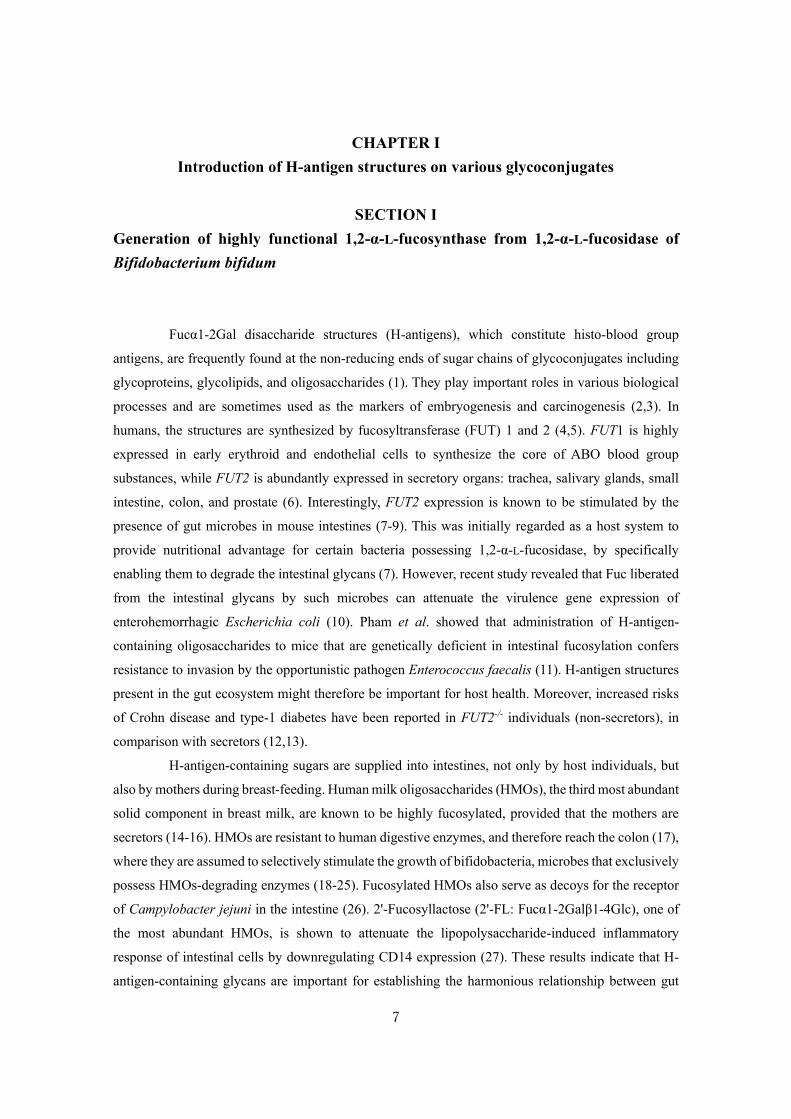
Fucα1-2Gal disaccharide structures (H-antigens), which constitute histo-blood group
antigens, are frequently found at the non-reducing ends of sugar chains of glycoconjugates including
glycoproteins, glycolipids, and oligosaccharides (1). They play important roles in various biological
processes and are sometimes used as the markers of embryogenesis and carcinogenesis (2,3). In
humans, the structures are synthesized by fucosyltransferase (FUT) 1 and 2 (4,5). FUT1 is highly
expressed in early erythroid and endothelial cells to synthesize the core of ABO blood group
substances, while FUT2 is abundantly expressed in secretory organs: trachea, salivary glands, small
intestine, colon, and prostate (6). Interestingly, FUT2 expression is known to be stimulated by the
presence of gut microbes in mouse intestines (7-9). This was initially regarded as a host system to
provide nutritional advantage for certain bacteria possessing 1,2-α-L-fucosidase, by specifically
enabling them to degrade the intestinal glycans (7). However, recent study revealed that Fuc liberated
from the intestinal glycans by such microbes can attenuate the virulence gene expression of
enterohemorrhagic Escherichia coli (10). Pham et al. showed that administration of H-antigen-
containing oligosaccharides to mice that are genetically deficient in intestinal fucosylation confers
resistance to invasion by the opportunistic pathogen Enterococcus faecalis (11). H-antigen structures
present in the gut ecosystem might therefore be important for host health. Moreover, increased risks
of Crohn disease and type-1 diabetes have been reported in FUT2-/- individuals (non-secretors), in
comparison with secretors (12,13).
H-antigen-containing sugars are supplied into intestines, not only by host individuals, but
also by mothers during breast-feeding. Human milk oligosaccharides (HMOs), the third most abundant
solid component in breast milk, are known to be highly fucosylated, provided that the mothers are
secretors (14-16). HMOs are resistant to human digestive enzymes, and therefore reach the colon (17),
where they are assumed to selectively stimulate the growth of bifidobacteria, microbes that exclusively
possess HMOs-degrading enzymes (18-25). Fucosylated HMOs also serve as decoys for the receptor
of Campylobacter jejuni in the intestine (26). 2'-Fucosyllactose (2'-FL: Fucα1-2Galβ1-4Glc), one of
the most abundant HMOs, is shown to attenuate the lipopolysaccharide-induced inflammatory
response of intestinal cells by downregulating CD14 expression (27). These results indicate that H-
antigen-containing glycans are important for establishing the harmonious relationship between gut

8
microbes and the host, and also for preventing various gut-related disorders. Hence, glycoconjugates
with H-antigens have great potential, not only as research tools, but also as therapeutic agents.
Enzymatic synthesis of H-antigen structure has been demonstrated by several groups using
α-1,2-fucosyltransferases or α-fucosidase (in this case, transfucosylation). Drouillard et al. succeeded
in constructing a recombinant E. coli strain that produces 2'-FL and lacto-N-fucopentaose IV (LNFP
IV: Fucα1-2Galβ1-4GlcNAcβ1-3Galβ1-4Glc, type-2 H-antigen) at gram-per-liter levels, by
introducing several glycosyltransferases including α-1,2-fucosyltransferase from Helicobacter pylori
(28). Gram-scale synthesis of 2'-FL was also accomplished by Baumgärtner et al. by using an
engineered E. coli (29). Zhao et al. synthesized 1 g of lacto-N-fucopentaose I (LNFP I: Fucα1-2Galβ1-
3GlcNAcβ1-3Galβ1-4Glc, type-1 H-antigen) using one-pot enzyme system involving α-1,2-
fucosyltransferase from Thermosynechococcus elongates and bifunctional fucokinase/GDP-Fuc
pyrophosphorylase, starting from Fuc and lacto-N-tetraose (LNT: Galβ1-3GlcNAcβ1-3Galβ1-4Glc)
(30). Vasiliu et al. employed human FUT2 to introduce α-(1→2)-linked Fuc residue at the non-
reducing end of poly-N-acetyllactosamine (type-2 H-antigen) (31). Glycosyltransferases thus serve as
valuable tools for synthesizing specific oligosaccharide with a defined structure, although they show
strict acceptor specificity and therefore the types of oligosaccharides to be synthesized have been
limited. Osanjo et al. described, using a mutant α-L-fucosidase (retaining enzyme) from Thermotoga
maritima, the transfer of Fuc from pNP-α-L-fucoside to Galβ-pNP to form Fucα1-2Galβ-pNP with
relatively high specificity (32). These results demonstrate the effectiveness of enzyme-based methods
for targeted oligosaccharide synthesis.
Glycosynthase is a mutant glycosidase that is devoid of hydrolysis but is able to transfer
glycosyl residue from a fluorine-activated sugar with opposite anomer; once the glycosidic bond is
formed, the linkage can be free from hydrolysis (33). This methodology, which was developed based
on the finding by Hehre et al. (34), was first applied to retaining glycosidases (35,36), and was recently
extended to inverting enzymes (37-40). Previously Wada et al. succeeded in applying the technology
to inverting 1,2-α-L-fucosidase from Bifidobacterium bifidum JCM1254 (BbAfcA, glycoside
hydrolase family [GH] 95). However, the reaction efficiency was too low for further use of the
generated 1,2-α-L-fucosynthase in oligosaccharide synthesis (40). Nonetheless, the author pursued
further exploration of the synthase because of high activity and specificity of wild-type BbAfcA
(BbAfcAWT) for all H-antigen-containing oligosaccharides and sugar chains of glycoproteins (H type-
1, H type-2, H type-3, and H type-4 chains) (41,42). 1,2-α-L-Fucosidase adopts a unique reaction
mechanism in which asparagine (Asn-423) activated by the neighboring aspartic acid (Asp-766) acts
as a base residue (43,44) (Fig. 1). The attacking water molecule is suitably poised for nucleophilic
attack by being supported by two asparagine residues (Asn-421 and Asn-423 [base]). Asn-421 makes
a hydrogen bond with glutamic acid residue of Glu-566 (acid residue), which allows the side chain of
Glu-566 to be properly oriented towards glycosidic oxygen. In the present study, the author first shows

9
a drastic improvement of the synthase reaction efficiency by introducing a series of mutations at the
catalytic residues of BbAfcA. The author then describes the detailed specificity analysis of the
synthase reaction using various mono- and oligosaccharides, and show its capability to efficiently
introduce H-antigen structures onto a glycoprotein. Finally, the author discusses a unique structural
requirement for acceptors of the synthase reaction, which was unraveled from glycosynthase
technology. My results show that this 1,2-α-L-fucosynthase serves as an alternative tool for introducing
H-antigens on a variety of glycoconjugates.
Fig. 1. Structure of the catalytic site of 1,2-α-L-fucosidase from B. bifidum. The catalytic residues (N421, N423, E566, and D766) and Gal-recognizing residues (H419, E485, W500, and E566) are shown by cyan sticks with the attacking water molecule depicted by a red sphere (PDB ID: 2EAC) (44). 2'-FL observed in the crystal structure of E566A mutant (PDB ID: 2EAD) is incorporated and shown in yellow. The hydrogen bond network is formed by the water, N421, N423, E566, and D766. The Gal residue of 2'-FL forms hydrogen bonds with the side chains of H419, E485, and E566, and is stacked by W500. The image was created by PyMol.

10
MATERIALS AND METHODS
Chemicals
Melibiose (Galα1-6Glc) and xylobiose (Xylβ1-4Xyl) were obtained from Tokyo Chemical
Industry Co. Ltd. (Tokyo, Japan). 4-β-Galactobiose (Galβ1-4Gal), 6-β-galactobiose (Galβ1-6Gal),
Lewis a trisaccharide (Lea: Galβ1-3(Fucα1-4)GlcNAc), Lewis x trisaccharide (Lex: Galβ1-4(Fucα1-
3)GlcNAc), N-acetyllactosamine (LacNAc: Galβ1-4GlcNAc), 3-fucosyllacose (Galβ1-4(Fucα1-
3)Glc), LNT, and LNFP I were obtained from Dextra Laboratories (Reading, UK), and Lewis b
tetrasaccharide (Leb: Fucα1-2Galβ1-3(Fucα1-4)GlcNAc) and Lewis y tetrasaccharide (Ley: Fucα1-
2Galβ1-4(Fucα1-3)GlcNAc) were acquired from Carbosynth (Compton, UK). 2'-FL and lacto-N-
neotetraose (LNnT: Galβ1-4GlcNAcβ1-3Galβ1-4Glc) were purchased from Sigma-Aldrich (St. Louis,
MO, USA), and lactodifucotetraose (LDFT: Fucα1-2Galβ1-4(Fucα1-3)Glc) was purchased from
Isosep (Tullinge, Sweden). Galacto-N-biose (GNB: Galβ1-3GalNAc), lacto-N-biose I (LNB: Galβ1-
3GlcNAc), 3-β-galactobiose (Galβ1-3Gal), 3-β-galactosylglucose (Galβ1-3Glc), and β-fucosyl
fluoride (β-FucF) were prepared, as described previously (40,45-47). Other reagents of analytical
grade were obtained from various commercial sources.
Construction of 1,2-α-L-fucosidase mutants
QuikChange site-directed mutagenesis method (Stratagene, CA) was used for introducing
amino acid replacements. pET23b-BbafcA, which carries the gene encoding the catalytic domain of
BbAfcA from Bifidobacterium bifidum JCM1254, was used as the template (42). The primers used are
listed in Table 1. The entire sequence of the catalytic domain of BbafcA was sequenced to ensure that
no base change other than those designed had occurred. The resulting plasmids were used to transform
Escherichia coli BL21 ΔlacZ (DE3) (48).
Expression and purification of 1,2-α-L-fucosidase mutants
Expression of the recombinant proteins was carried out, as described previously (42). The
enzymes were purified using Ni-nitrilotriacetic acid affinity chromatography according to the
manufacturer’s instruction (QIAGEN, Hilden, Germany), and dialyzed against 10 mM Tris-HCl buffer
(pH 8.0) using Slide-A Lyzer G2 (Thermo Fisher Scientific, Waltham, MA, USA). When necessary,
the proteins were further purified by Mono Q 5/50 GL (0−1 M NaCl in 20 mM Tris-HCl buffer, pH
8.0) (GE Healthcare Life Sciences, Buckinghamshire, UK) column chromatography. The purity of the
proteins was examined by sodium dodecyl sulfate-polyacrylamide gel electrophoresis. Protein
concentration was determined with the theoretical coefficient of 184,165 M-1 cm-1 at 280 nm.

11
Enzyme assay
Hydrolytic activity of 1,2-α-L-fucosidase mutants was measured using 2'-FL as a substrate
(1 mM). The liberated Fuc was quantified by fucose dehydrogenase-linked assay, as described
previously (42). The enzyme concentrations were 0.51 nM for wild-type (WT), 1.0 nM for N421D
mutant, 10.2 nM for N423D mutant, 51 nM for N423Q mutant, and 102 nM for the other mutants.
Fucosynthase activity of various mutants was examined using β-FucF and Lac as the donor
and acceptor substrates, respectively. The reaction was carried out at 30 ºC for 30 min in 100 mM
sodium citrate buffer (pH5.0), containing 10 mM substrates and 4 μM enzyme. The reaction products
were analyzed by a high-performance liquid chromatography (HPLC) system (Ultimate 3000, Thermo
Fisher Scientific) equipped with Asahipak NH2P-50 4E column (4.6 × 250 mm, Showa Denko, Tokyo,
Japan). Elution was carried out with 73 % acetonitrile at a flow rate of 1.0 mL/min, and was monitored
using a charged aerosol detector (CAD) (Thermo Fisher Scientific). The amount of synthesized 2'-FL
was determined based on the standard curve prepared from known concentrations of the compound.
Optimal pH of the synthase reaction was determined by testing the enzyme in 100 mM citrate-NaOH
buffer (pH 4.5‒6.0), 2-morpholinoethanesulfonic acid buffer (pH 6.0‒7.0), and 3-
morpholinopropanesulfonic acid buffer (pH 7.0‒8.0). Thermostability was examined by incubating
the enzyme for 30 min at various temperatures in 100 mM citrate-NaOH buffer (pH 5.5 for N423H
mutant and pH 5.0 for N423D/D766N mutant) prior to the assay.
Acceptor specificity of BbAfcAN423H was examined using various mono- and
oligosaccharides. The reaction was carried out at 30 ºC for 30 min in 100 mM citrate-NaOH buffer
(pH 5.5), containing 10 mM β-FucF and 10 mM acceptor, in the presence of 10 μM enzyme. The
reaction was stopped by boiling for 3 min. The reaction mixtures were analyzed by thin-layer
chromatography (TLC) and HPLC-CAD. The reaction efficiency was evaluated by determining the
consumed amounts of acceptors. TLC analysis was carried out using silica gel 60 aluminum sheet
(Merck, NJ). The plate was developed in a solvent system of 1-butanol/acetic acid/water (2/1/1), and
the sugars were visualized by heating the plate after spraying with diphenylamine-aniline-phosphoric
acid reagent (49). HPLC-CAD analysis was carried out using HILICpak VG-50 4E column (4.6 × 250
mm, Showa Denko) at 40 ºC. The elution was done with 73 % acetonitrile at a flow rate of 1.0 mL/min.
When xylobiose was used as an acceptor, acetonitrile/methanol/water of 75/20/5 was used as an eluent.
Porcine gastric mucin (PGM) was also used as an acceptor substrate. Prior to the synthase
reaction, the Fuc residues were removed from sugar chains of PGM. The defucosylation was carried
out at 30 ºC for 48 h in 50 mM sodium phosphate buffer (pH 6.5) containing 2 mg/mL PGM, 1 mM
dithiothreitol, and 10 μM 1,2-α-L-fucosidase WT (BbAfcAWT). After stopping the reaction by boiling,
the reaction mixture was dialyzed against water and lyophilized to obtain defucosylated PGM.
Fucosylation was carried out at 30 ºC for 30 min in the reaction mixture containing 50 mM citrate-
NaOH buffer (pH 5.5), 1 mg/mL defucosylated PGM, 10 mM β-FucF, and 10 μM BbAfcAN423H. For
12
lectin blotting, the samples were taken from the mixtures, spotted on Immobilon-P membrane
(Millipore, MA) that was pretreated with methanol. The membrane was incubated for 60 min with a
blocking reagent: 2 % (w/v) bovine serum albumin in Tris-buffered saline with 0.05 % (v/v) Tween-20
(TBS-T). Biotin conjugated lectins (UEA-I and PNA, J-Oil Mills, Tokyo, Japan), dissolved in TBS-T
(0.4 μg/mL), and horseradish peroxidase (HRP)-conjugated streptavidin (0.125 μg/mL) were then
added. The membrane was further incubated for 60 min at room temperature. After washing the
membrane with TBS-T, signals were detected using SuperSignal West Pico Chemiluminescent
Substrate (Thermo Fischer Scientific) and LAS-3000 (Fujifilm, Tokyo, Japan).
Purification of the synthesized oligosaccharides
Several synthesized oligosaccharides (see RESULTS) were purified for subsequent
instrumental analyses. The reaction mixtures (total volume of 750-4300 μL) were deionized with
Amberlite MB-3 (Organo, Tokyo, Japan), lyophilized and subjected to HPLC equipped with Sugar-D
column (20 × 250 mm, Nacalai Tesque, Kyoto, Japan). Elution was done under a constant flow (5.0
mL/min) of 72 % acetonitrile at 40 ºC, and monitored by refractive index detector (RID-10A,
Shimadzu, Kyoto, Japan). The peak fractions were combined, concentrated, lyophilized, and further
purified by using TSK-gel 80Ts (20 × 250 mm, Tosoh, Tokyo, Japan) column. Elution was carried out
by water at a flow rate of 7.0 mL/min and monitored by RID-10A. The peak fractions were collected,
lyophilized to dryness, and used for the instrumental analyses.
Nuclear magnetic resonance (NMR) spectroscopy
The NMR spectra 1D (1H and 13C) and 2D (1H-1H DQF-COSY, 1H-1H TOCSY, 1H-13C
HSQC and 1H-13C HMBC) were taken in D2O at 298K using Bruker Avance 800 or Avance 500
spectrometers (Bruker BioSpin, MA, USA) with 2-methyl-2-propanol as an internal standard (1.23
ppm for 1H; 31.3 ppm for 13C). Positions of the glycosyl linkages were assigned by the inter-ring
cross peaks with the anomeric 1H and 13C signals that appeared in the HMBC spectra.
High–performance anion exchange chromatography (HPAEC)
HPAEC with pulsed amperometric detection (PAD) (Thermo Fisher Scientific) analysis
was performed using Carbopac PA1 column (2 × 250 mm, Dionex, Sunnyvale, CA, USA) at 30 ºC.
The elution was done with 16 mM NaOH at a flow rate of 0.25 mL/min.
Release of O-glycans from porcine gastric mucin
The O-linked glycans were released by reductive β-elimination, essentially as described
previously (50). In brief, the lyophilized glycoprotein (100 μg) was resuspended in 500 μL of 100 mM
sodium hydroxide containing 1 M sodium borohydride, and the mixture was incubated for 18 h at 45
13
ºC in a glass tube. The mixture was then neutralized with 10 % (v/v) acetic acid on ice, and desalted
by a Dowex-50W-X8 (H+ form, 100-200 mesh, Sigma-Aldrich) column. Oligosaccharide alditols were
collected in the elution with 5 % acetic acid, and lyophilized. Borate was removed as an azeotrope
with methanol, by adding 0.3 mL of 10 % acetic acid in methanol and drying under a nitrogen stream
at 40 ºC. This step was repeated five times. The samples were reconstituted in 0.3 mL of 5 % acetic
acid and loaded onto a pre-equilibrated Sep-pak C18 cartridges (Waters, Milford, MA, USA). The
oligosaccharide alditols were recovered in flow-through and in washing with 2 mL of 5 % acetic acid,
and were lyophilized for subsequent permethylation.
Permethylation of oligosaccharides and alditols
Permethylation was performed according to the method of Anumula and Taylor (51), to
improve sensitivity and allow structure determination in MS analysis. The lyophilized
oligosaccharides and O-glycan alditols were reconstituted in 200 μL of anhydrous dimethylsulfoxide
(DMSO). Permethylation was carried out by mixing the sample vigorously for 5 min with 250 μL of
base (sodium hydroxide in DMSO) and 150 μL of iodomethane. After adding 2 mL of 5 % acetic acid
and 2 mL of dichloromethane, the permethylated samples were extracted in the organic phase, which
was then dried under a nitrogen stream at 40 ºC. The samples were loaded onto pre-equilibrated Sep-
pak C18 cartridges, washed with water and eluted with 85 % (v/v) acetonitrile. The eluted fractions
were again dried under a nitrogen stream at 40 ºC.
Matrix-assisted laser desorption/ionization time-of-flight mass spectroscopy (MALDI-TOF
MS) and MALDI-TOF/TOF MS analyses
Molecular masses of the permethylated samples were determined by MALDI-TOF MS in
positive ion mode (Bruker UltrafleXtreme, Bruker Daltonics, MA, USA) with 2,5-dihydroxybenzoic
acid as matrix. MALDI-TOF/TOF MS was also performed to obtain MS/MS spectra of the glycans of
interest. The MS and MS/MS spectra were manually interpreted to deduce glycan structures.
Theoretical masses were calculated using the software GlycoWorkbench 2.0 (52). Semi-quantitative
estimation of relative glycan amounts is calculated based on signal intensity of MS spectra.
14
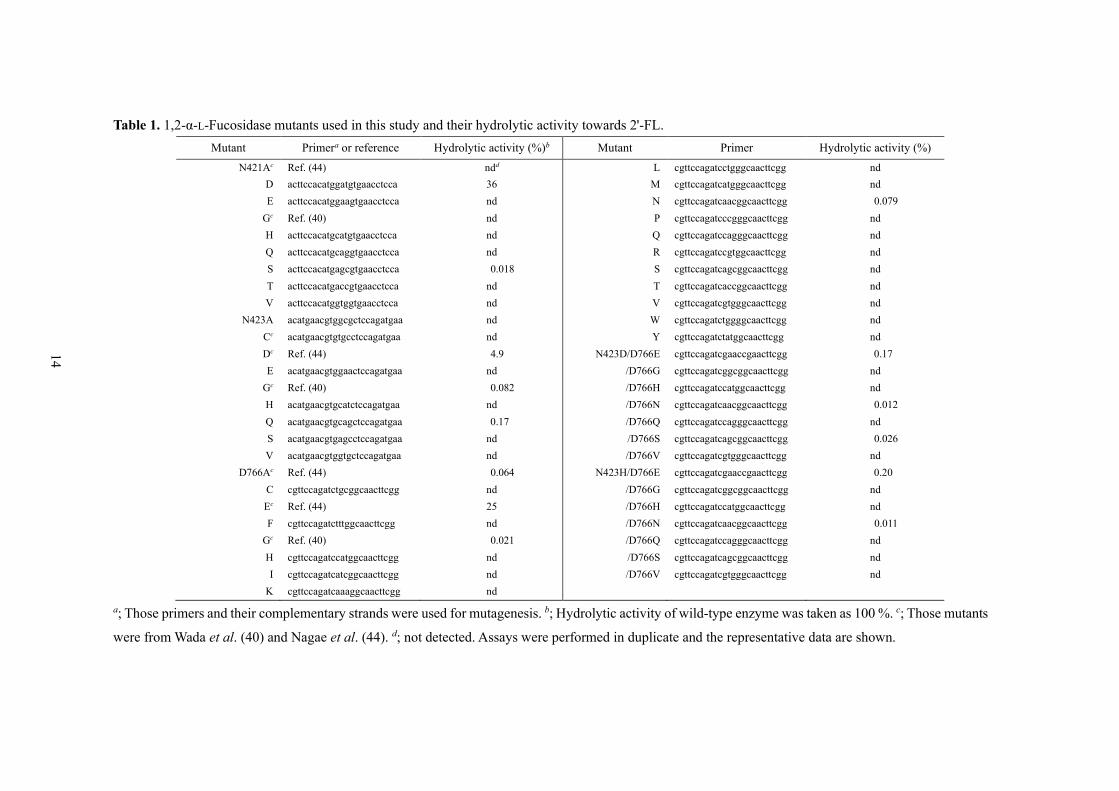
Table 1. 1,2-α-L-Fucosidase mutants used in this study and their hydrolytic activity towards 2'-FL.
Mutant Primera or reference Hydrolytic activity (%)b Mutant Primer Hydrolytic activity (%)
N421Ac Ref. (44) ndd L cgttccagatcctgggcaacttcgg nd
D acttccacatggatgtgaacctcca 36 M cgttccagatcatgggcaacttcgg nd
E acttccacatggaagtgaacctcca nd N cgttccagatcaacggcaacttcgg 0.079
Gc Ref. (40) nd P cgttccagatcccgggcaacttcgg nd
H acttccacatgcatgtgaacctcca nd Q cgttccagatccagggcaacttcgg nd
Q acttccacatgcaggtgaacctcca nd R cgttccagatccgtggcaacttcgg nd
S acttccacatgagcgtgaacctcca 0.018 S cgttccagatcagcggcaacttcgg nd
T acttccacatgaccgtgaacctcca nd T cgttccagatcaccggcaacttcgg nd
V acttccacatggtggtgaacctcca nd V cgttccagatcgtgggcaacttcgg nd
N423A acatgaacgtggcgctccagatgaa nd W cgttccagatctggggcaacttcgg nd
Cc acatgaacgtgtgcctccagatgaa nd Y cgttccagatctatggcaacttcgg nd
Dc Ref. (44) 4.9 N423D/D766E cgttccagatcgaaccgaacttcgg 0.17
E acatgaacgtggaactccagatgaa nd /D766G cgttccagatcggcggcaacttcgg nd
Gc Ref. (40) 0.082 /D766H cgttccagatccatggcaacttcgg nd
H acatgaacgtgcatctccagatgaa nd /D766N cgttccagatcaacggcaacttcgg 0.012
Q acatgaacgtgcagctccagatgaa 0.17 /D766Q cgttccagatccagggcaacttcgg nd
S acatgaacgtgagcctccagatgaa nd /D766S cgttccagatcagcggcaacttcgg 0.026
V acatgaacgtggtgctccagatgaa nd /D766V cgttccagatcgtgggcaacttcgg nd
D766Ac Ref. (44) 0.064 N423H/D766E cgttccagatcgaaccgaacttcgg 0.20
C cgttccagatctgcggcaacttcgg nd /D766G cgttccagatcggcggcaacttcgg nd
Ec Ref. (44) 25 /D766H cgttccagatccatggcaacttcgg nd
F cgttccagatctttggcaacttcgg nd /D766N cgttccagatcaacggcaacttcgg 0.011
Gc Ref. (40) 0.021 /D766Q cgttccagatccagggcaacttcgg nd
H cgttccagatccatggcaacttcgg nd /D766S cgttccagatcagcggcaacttcgg nd
I cgttccagatcatcggcaacttcgg nd /D766V cgttccagatcgtgggcaacttcgg nd
K cgttccagatcaaaggcaacttcgg nd
a; Those primers and their complementary strands were used for mutagenesis. b; Hydrolytic activity of wild-type enzyme was taken as 100 %. c; Those mutants
were from Wada et al. (40) and Nagae et al. (44). d; not detected. Assays were performed in duplicate and the representative data are shown.

15
RESULTS
Isolation of an efficient 1,2-α-L-fucosynthase
As mentioned, the catalytic center of 1,2-α-L-fucosidase (BbAfcA) comprises four residues
Asn-421 (N421), Asn-423 (N423), Glu-566 (E566) and Asp-766 (D766) (Fig. 1). E566 acts as a
general acid residue in hydrolysis, and should
hence serve as a base residue in the synthesis
reaction. Accordingly, the author first singly
introduced amino acid replacements at N421,
N423, and D766 sites. N421 was replaced with
A, D, E, G, H, Q, S, T, and V, while N423 was
replaced with A, C, D, E, G, H, Q, S, and V.
D766 was replaced with other 19 amino acids
(Table 1). The mutants showed drastically
impaired hydrolytic activity towards 2'-FL,
except for N421D, N423D, and D766E
mutants that retained 36 %, 4.9 %, and 25 %
activity of BbAfcAWT, respectively. Among
these single mutants, N423H exhibited the
highest fucosynthase activity when β-FucF
and lactose (Lac) were used as the substrates
(Fig. 2A). The synthase activity of the other
mutant N423D was comparable with that of
D766G mutant which was isolated in previous
study (40). None of the N421 mutants
exhibited synthase activity. The author then
introduced amino acid replacements at D766 position in a N423D background or N423H background,
i.e. N423D/D766E, N423D/D766G, N423D/D766H, N423D/D766N, N423D/D766Q, N423D/D766S,
N423H/D766E, N423H/D766G, N423H/D766H, N423H/D766N, N423H/D766Q, N423H/D766S,
and N423H/D766V double mutants were constructed (Table 1). Hydrolytic activity of these mutants
was also extremely low. D766N substitution in N423D background led to a drastic increase in the
synthase activity, while introduction of any additional replacement at D766 site resulted in a decrease
of the synthase activity in N423H background (Fig. 2B and 2C). Consequently, the author chose
N423H mutant (BbAfcAN423H) and N423D/D766N (BbAfcAN423D/D766N) mutants for further analysis.
(A)
(B)
(C)
Fig. 2. Fucosynthase activity of 1,2-α-L-fucosidase variants. Amino acid replacements were introduced at the catalytic residues N421, N423, and D766 singly or in combination. The purified enzyme (4 μM) was added to the reaction mixture consisting of 100 mM sodium citrate (pH5.5), β-FucF (10 mM), and Lac (10 mM), and the mixture (50 μl) was incubated at 30ºC for 30 min. The reaction products were analyzed by HPLC-CAD.
(A) The fucosynthase activity detected for N423D and N423H mutants was compared with that of D766G, the synthase isolated by Wada et. al. (40).
(B) The synthase activity of D766 mutants with N423D background.
(C) The synthase activity of D766 mutants with N423H background. The peaks of Fuc, Lac, and 2'-FL are indicated by arrowheads. Assays were repeated at least twice with essentially the same results, and the data for a representative experiment are shown.
16
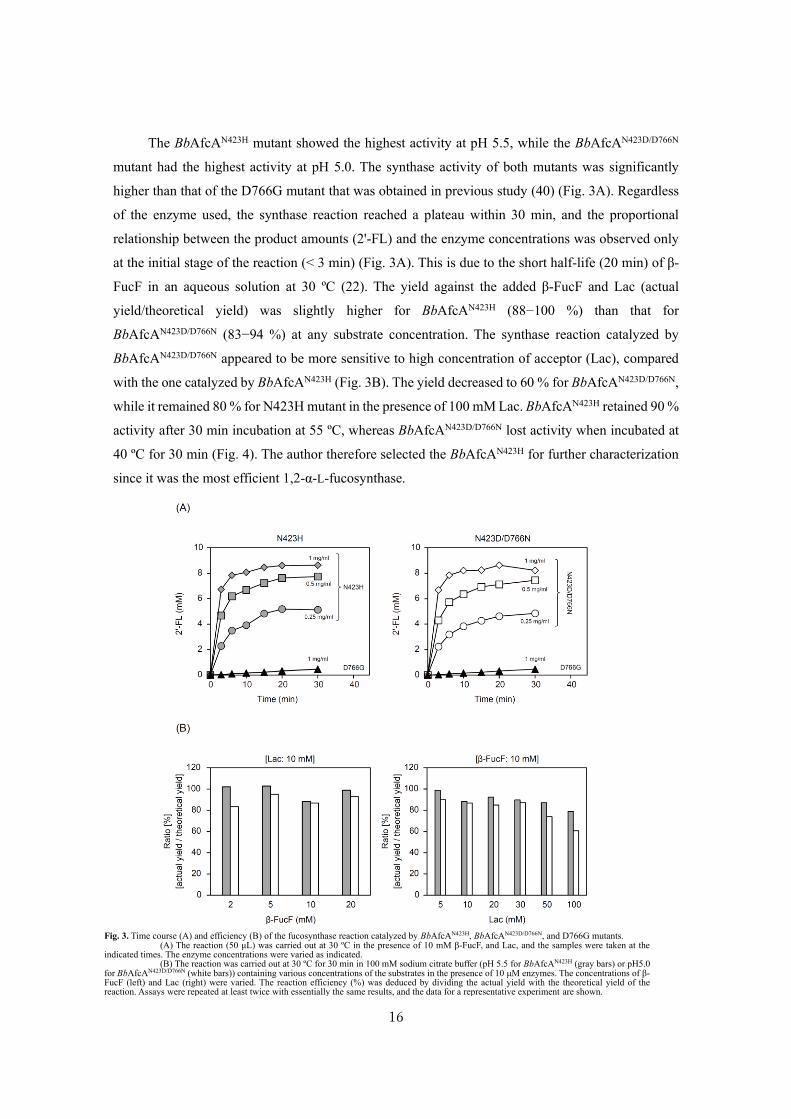
The BbAfcAN423H mutant showed the highest activity at pH 5.5, while the BbAfcAN423D/D766N
mutant had the highest activity at pH 5.0. The synthase activity of both mutants was significantly
higher than that of the D766G mutant that was obtained in previous study (40) (Fig. 3A). Regardless
of the enzyme used, the synthase reaction reached a plateau within 30 min, and the proportional
relationship between the product amounts (2'-FL) and the enzyme concentrations was observed only
at the initial stage of the reaction (< 3 min) (Fig. 3A). This is due to the short half-life (20 min) of β-
FucF in an aqueous solution at 30 ºC (22). The yield against the added β-FucF and Lac (actual
yield/theoretical yield) was slightly higher for BbAfcAN423H (88−100 %) than that for
BbAfcAN423D/D766N (83−94 %) at any substrate concentration. The synthase reaction catalyzed by
BbAfcAN423D/D766N appeared to be more sensitive to high concentration of acceptor (Lac), compared
with the one catalyzed by BbAfcAN423H (Fig. 3B). The yield decreased to 60 % for BbAfcAN423D/D766N,
while it remained 80 % for N423H mutant in the presence of 100 mM Lac. BbAfcAN423H retained 90 %
activity after 30 min incubation at 55 ºC, whereas BbAfcAN423D/D766N lost activity when incubated at
40 ºC for 30 min (Fig. 4). The author therefore selected the BbAfcAN423H for further characterization
since it was the most efficient 1,2-α-L-fucosynthase.
Fig. 3. Time course (A) and efficiency (B) of the fucosynthase reaction catalyzed by BbAfcAN423H, BbAfcAN423D/D766N, and D766G mutants. (A) The reaction (50 μL) was carried out at 30 ºC in the presence of 10 mM β-FucF, and Lac, and the samples were taken at the
indicated times. The enzyme concentrations were varied as indicated. (B) The reaction was carried out at 30 ºC for 30 min in 100 mM sodium citrate buffer (pH 5.5 for BbAfcAN423H (gray bars) or pH5.0
for BbAfcAN423D/D766N (white bars)) containing various concentrations of the substrates in the presence of 10 μM enzymes. The concentrations of β-FucF (left) and Lac (right) were varied. The reaction efficiency (%) was deduced by dividing the actual yield with the theoretical yield of the reaction. Assays were repeated at least twice with essentially the same results, and the data for a representative experiment are shown.

17
Acceptor specificity of BbAfcAN423H
The author examined the acceptor specificity of the BbAfcAN423H using various mono- and
oligosaccharides at 10 mM, listed in Table 2. β-FucF was used at the same concentration. The activity
was assessed by determining the
amounts of acceptors consumed
in the reactions. Among the
twelve monosaccharides, Gal
was consumed most efficiently
(83 %) in the reaction. A new
spot and a peak appeared in the
thin-layer chromatography
(TLC) and high–performance
anion exchange chromatography
with pulsed amperometric
detection (HPAEC-PAD)
analysis, respectively (Fig. 5A).
L-Ara, which forms a pyranose
ring in water (53), also served as
a good acceptor with 48 % being
consumed. Glc and Xyl acted as
poor substrates with 8.4 % and
7.2 % being utilized, and faint
spots and small peaks were
detected in the TLC and
HPAEC-PAD analysis,
respectively (Fig. 5B, 5C, and
5D). L-Rha was also slightly
Fig. 5. Acceptor specif icity of 1,2-α-L-fucosynthase BbAfcAN423H towards monosaccharides.
The reactions were carried out at 30 ºC for 30 min in 100 mM sodium citrate
buffer (pH5.5) containing β-FucF (10 mM), various monosaccharides (10 mM), and 10 μM
enzyme. The mixtures were analyzed by TLC (inset) and HPAEC-PAD. The chromatograms o
btained for (A) Gal, (B) L-Ara, (C) Glc, and (D) Xyl as acceptors are shown. The peaks of Fuc,
acceptor, and product (P) are indicated by arrowheads. Assays were repeated at least twice
with essentially the same results, and the data for a representative experiment are shown. See
also Table 2.
0
20
40
60
80
100
120
0 10 20 30 40 50 60 70
Re
lati
ve
acti
vit
y (
%)a
Temperature (ºC)
Fig. 4. Thermostability of BbAfcAN423H and BbAfcAN423D/D766N.
Each variant was incubated for 30 min at the indicated temperatures
in 10 mM Tris-HCl buffer (pH 8.0). After the incubation, the fucosynthase reaction
was performed. The reaction (25 μL) was carried out at 30 ºC in the presence of 2
μM variant, 10 mM β-FucF, and Lac for 15 min in 100 mM sodium citrate buffer
(pH 5.5 for BbAfcAN423H [gray circles] or pH5.0 for BbAfcAN423D/D766N [white
circles]). a The value obtained at 4 ºC as 100 %.
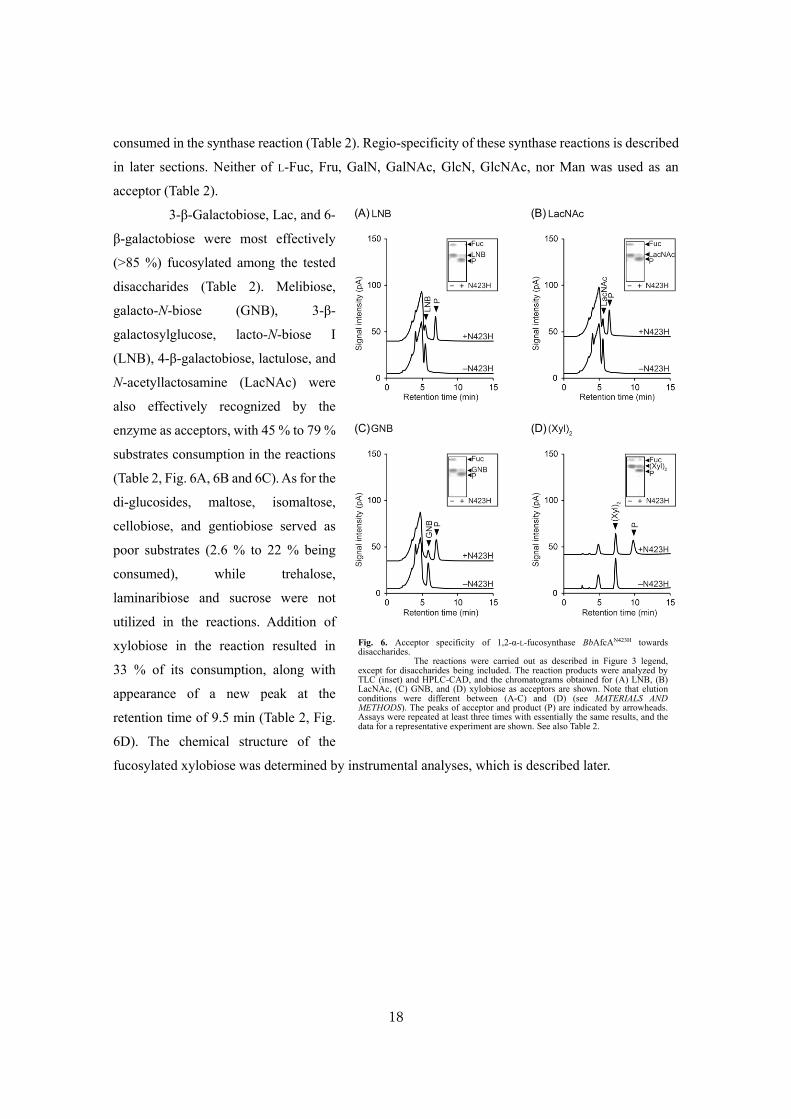
18
consumed in the synthase reaction (Table 2). Regio-specificity of these synthase reactions is described
in later sections. Neither of L-Fuc, Fru, GalN, GalNAc, GlcN, GlcNAc, nor Man was used as an
acceptor (Table 2).
3-β-Galactobiose, Lac, and 6-
β-galactobiose were most effectively
(>85 %) fucosylated among the tested
disaccharides (Table 2). Melibiose,
galacto-N-biose (GNB), 3-β-
galactosylglucose, lacto-N-biose I
(LNB), 4-β-galactobiose, lactulose, and
N-acetyllactosamine (LacNAc) were
also effectively recognized by the
enzyme as acceptors, with 45 % to 79 %
substrates consumption in the reactions
(Table 2, Fig. 6A, 6B and 6C). As for the
di-glucosides, maltose, isomaltose,
cellobiose, and gentiobiose served as
poor substrates (2.6 % to 22 % being
consumed), while trehalose,
laminaribiose and sucrose were not
utilized in the reactions. Addition of
xylobiose in the reaction resulted in
33 % of its consumption, along with
appearance of a new peak at the
retention time of 9.5 min (Table 2, Fig.
6D). The chemical structure of the
fucosylated xylobiose was determined by instrumental analyses, which is described later.
Fig. 4. Acceptor specificity of 1,2-α-L-fucosynthase N423H towards
monosaccharides. The reactions were carried out at 30ºC for 30 min in 100 mM
sodium citrate buffer (pH5.5) containing β-FucF (10 mM), various monosaccharides
(10 mM), and 10 μM enzyme. The mixtures were analyzed by TLC (inset) and
HPAEC-PAD. The chromatograms obtained for (a) Gal, (b) L-Ara, (c) Glc, and (d)
Xyl as acceptors are shown. The peaks of Fuc, acceptor, and product (P) are
indicated by arrowheads. Assays were repeated at least twice with essentially the
same results, and the data for a representative experiment are shown. See also Table
2.
Fig. 6. Acceptor specificity of 1,2-α-L-fucosynthase BbAfcAN423H towards disaccharides.
The reactions were carried out as described in Figure 3 legend, except for disaccharides being included. The reaction products were analyzed by TLC (inset) and HPLC-CAD, and the chromatograms obtained for (A) LNB, (B) LacNAc, (C) GNB, and (D) xylobiose as acceptors are shown. Note that elution conditions were different between (A-C) and (D) (see MATERIALS AND METHODS). The peaks of acceptor and product (P) are indicated by arrowheads. Assays were repeated at least three times with essentially the same results, and the data for a representative experiment are shown. See also Table 2.

19
3-Fucosyllactose (3-FL) was found to be a good acceptor for the synthase reaction, as 82 %
of the substrate was consumed (Table 2). A peak that shows the same retention time as that of standard
lactodifucotetraose (LDFT: Fucα1-2Galβ1-4(Fucα1-3)Glc) appeared in the high-performance liquid
chromatography with a charged aerosol detection (HPLC-CAD) analysis (Fig. 7A). The BbAfcAN423H
appeared to produce Leb and Ley tetrasaccharides from Lea and Lex trisaccharides with yields of 43 %
and 62 %, respectively (Table 2, Fig. 7B and 7C). A peak corresponding to LNFP I appeared when
LNT was used as the acceptor (Fig. 8A). The reaction efficiency was 75 % (Table 2). Use of LNnT as
the acceptor resulted in 59 % of the substrate consumption, and a peak with a retention time of 15 min
appeared in the HPLC-CAD analysis (Table 2 and Fig. 8B). The structures of these products are
described later.
Fig. 7. Acceptor specificity of 1,2-α-L-fucosynthase BbAfcAN423H towards trisaccharides.
The reactions were carried out as described in Fig. 5 legend, except for trisaccharides being included. The reaction products were analyzed by TLC (inset) and HPLC-CAD, and the chromatograms obtained for (A) 3-FL (B) Lea, and (C) Lex as acceptors are shown. The peaks of acceptor and product (P) are indicated by arrowheads. Assays were repeated at least three times with essentially the same results, and the data for a representative experiment are shown. See also Table 2. Standard (Std): (A) LDFT (B) Leb tetrasaccharide (C) Ley tetrasaccharide
Fig. 8. Acceptor specificity of 1,2-α-L-fucosynthase BbAfcAN423H towards oligosaccharides.
The reactions were carried out at 30 ºC for 30 min in 100 mM sodium citrate buffer (pH5.5) containing β-FucF (10 mM), acceptors (10 mM), and 10 μM enzyme. The mixtures were analyzed by TLC (inset) and HPLC-CAD. The chromatograms obtained for (A) LNT and (B) LNnT as acceptors are shown. The peaks of acceptor and product (P) are indicated by arrowheads. Assays were repeated at least three times with essentially the same results, and the data for a representative experiment are shown. See also Table 2.

20
Table 2. Acceptor specificity of 1,2-α-L-fucosynthase BbAfcAN423H.
Acceptor Product Yieldc (%)
Name Structure Deduceda or determinedb structure
Monosaccharides
L-Arabinose Fucα1-2Araa 48
L-Fucose 0
Fructose 0
Galactose Fucα1-2Gala 83
Galactosamine 0
N-Acetylgalactosamine 0
Glucose Fucα1-3Glca 8.4
Glucosamine 0
N-Acetylglucosamine 0
Mannose 0
L-Rhamnose Fucα1-4Rhaa 2.3
Xylose Fucα1-3Xyla 7.2
Disaccharides
Trehalose Glcα1-1αGlc 0
Sucrose Glcα1-2βFru 0
Maltose Glcα1-4Glc Glcα1-4(Fucα1-3)Glca 2.6
Isomaltose Glcα1-6Glc Glcα1-6(Fucα1-3)Glca 22
Laminaribiose Glcβ1-3Glc 0
Cellobiose Glcβ1-4Glc Glcβ1-4(Fucα1-3)Glca 5.6
Gentiobiose Glcβ1-6Glc Glcβ1-6(Fucα1-3)Glca 22
Melibiose Galα1-6Glc Fucα1-2Galα1-6Glca 45
3-β-Galactobiose Galβ1-3Gal Fucα1-2Galβ1-3Gala 86
Galacto-N-biose Galβ1-3GalNAc Fucα1-2Galβ1-3GalNAcb 57
3-β-Galactosylglucose Galβ1-3Glc Fucα1-2Galβ1-3Glca 79
21
Table 2. Continued.
Acceptor Product Yieldc (%)
Name Structure Deduceda or determinedb structure
Lacto-N-biose I Galβ1-3GlcNAc Fucα1-2Galβ1-3GlcNAca 68
4-β-Galactobiose Galβ1-4Gal Fucα1-2Galβ1-4Gala 63
Lactulose Galβ1-4Fru Fucα1-2Galβ1-4Frua 72
Lactose Galβ1-4Glc Fucα1-2Galβ1-4Glcb 86
N-Acetyllactosamine Galβ1-4GlcNAc Fucα1-2Galβ1-4GlcNAca 67
6-β-Galactobiose Galβ1-6Gal Fucα1-2 Galβ1-6Gala 85
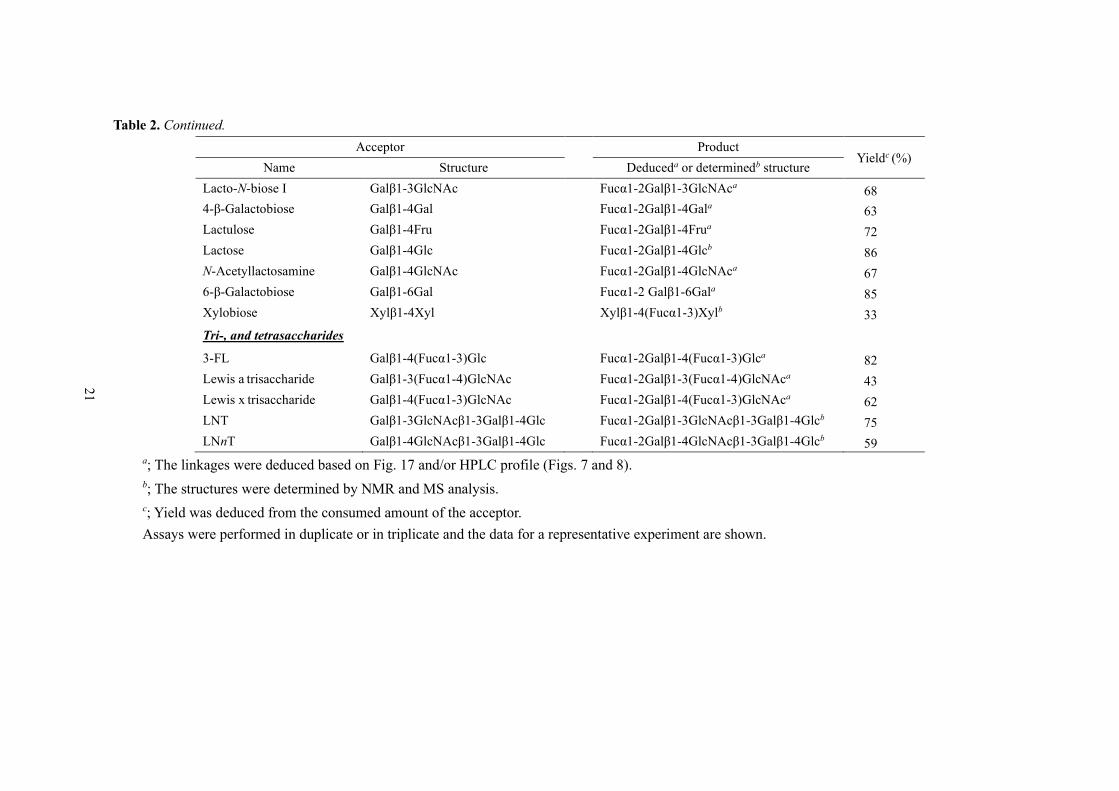
Xylobiose Xylβ1-4Xyl Xylβ1-4(Fucα1-3)Xylb 33
Tri-, and tetrasaccharides
3-FL Galβ1-4(Fucα1-3)Glc Fucα1-2Galβ1-4(Fucα1-3)Glca 82
Lewis a trisaccharide Galβ1-3(Fucα1-4)GlcNAc Fucα1-2Galβ1-3(Fucα1-4)GlcNAca 43
Lewis x trisaccharide Galβ1-4(Fucα1-3)GlcNAc Fucα1-2Galβ1-4(Fucα1-3)GlcNAca 62
LNT Galβ1-3GlcNAcβ1-3Galβ1-4Glc Fucα1-2Galβ1-3GlcNAcβ1-3Galβ1-4Glcb 75
LNnT Galβ1-4GlcNAcβ1-3Galβ1-4Glc Fucα1-2Galβ1-4GlcNAcβ1-3Galβ1-4Glcb 59
a; The linkages were deduced based on Fig. 17 and/or HPLC profile (Figs. 7 and 8).
b; The structures were determined by NMR and MS analysis.
c; Yield was deduced from the consumed amount of the acceptor.
Assays were performed in duplicate or in triplicate and the data for a representative experiment are shown.
22
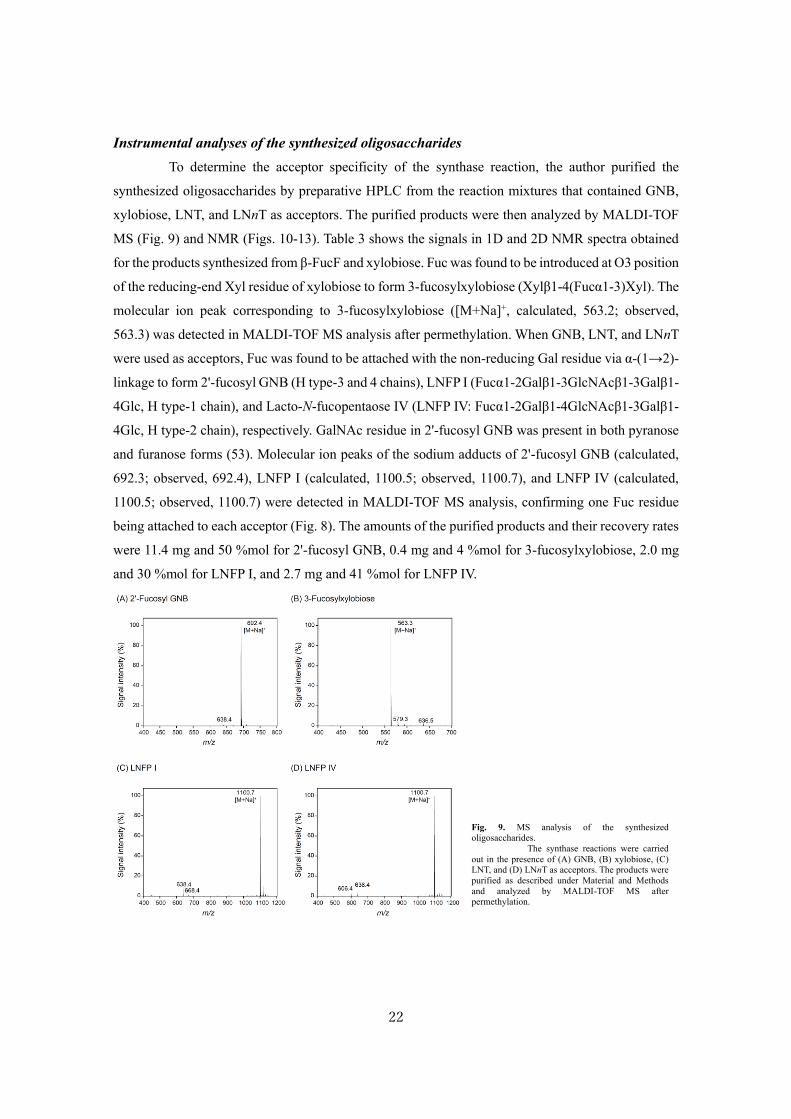
Instrumental analyses of the synthesized oligosaccharides
To determine the acceptor specificity of the synthase reaction, the author purified the
synthesized oligosaccharides by preparative HPLC from the reaction mixtures that contained GNB,
xylobiose, LNT, and LNnT as acceptors. The purified products were then analyzed by MALDI-TOF
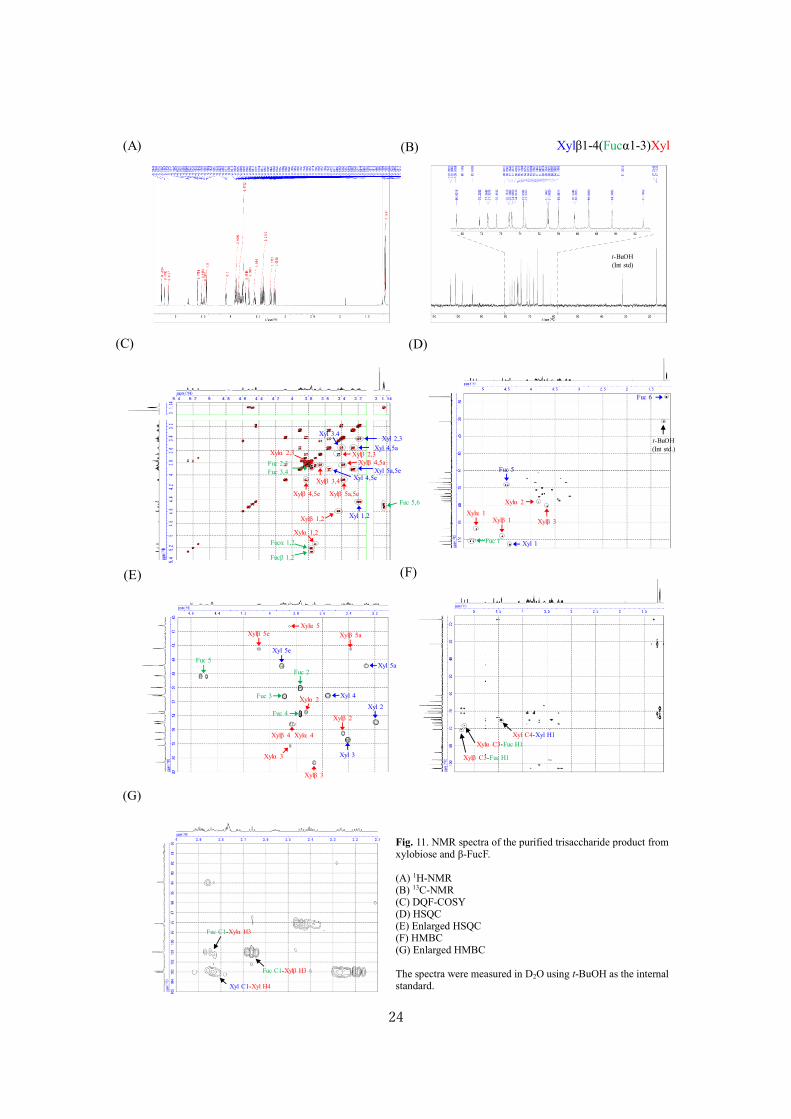
MS (Fig. 9) and NMR (Figs. 10-13). Table 3 shows the signals in 1D and 2D NMR spectra obtained
for the products synthesized from β-FucF and xylobiose. Fuc was found to be introduced at O3 position
of the reducing-end Xyl residue of xylobiose to form 3-fucosylxylobiose (Xylβ1-4(Fucα1-3)Xyl). The
molecular ion peak corresponding to 3-fucosylxylobiose ([M+Na]+, calculated, 563.2; observed,
563.3) was detected in MALDI-TOF MS analysis after permethylation. When GNB, LNT, and LNnT
were used as acceptors, Fuc was found to be attached with the non-reducing Gal residue via α-(1→2)-
linkage to form 2'-fucosyl GNB (H type-3 and 4 chains), LNFP I (Fucα1-2Galβ1-3GlcNAcβ1-3Galβ1-
4Glc, H type-1 chain), and Lacto-N-fucopentaose IV (LNFP IV: Fucα1-2Galβ1-4GlcNAcβ1-3Galβ1-
4Glc, H type-2 chain), respectively. GalNAc residue in 2'-fucosyl GNB was present in both pyranose
and furanose forms (53). Molecular ion peaks of the sodium adducts of 2'-fucosyl GNB (calculated,
692.3; observed, 692.4), LNFP I (calculated, 1100.5; observed, 1100.7), and LNFP IV (calculated,
1100.5; observed, 1100.7) were detected in MALDI-TOF MS analysis, confirming one Fuc residue
being attached to each acceptor (Fig. 8). The amounts of the purified products and their recovery rates
were 11.4 mg and 50 %mol for 2'-fucosyl GNB, 0.4 mg and 4 %mol for 3-fucosylxylobiose, 2.0 mg
and 30 %mol for LNFP I, and 2.7 mg and 41 %mol for LNFP IV.
Fig. 9. MS analysis of the synthesized
oligosaccharides.
The synthase reactions were carried
out in the presence of (A) GNB, (B) xylobiose, (C)
LNT, and (D) LNnT as acceptors. The products were
purified as described under Material and Methods
and analyzed by MALDI-TOF MS after
permethylation.

23
GalNAcα 1,2
Galα 1,2GalNAcβ 1,2
Fuc 5,6
Gal 3,4
Fuc 1,2
Gal 2,3
GalNAcβ 3,4GalNAcα 3,4
Galβ 1,2
GalNAcα C3-Gal H1
Fuc C1-Gal H2
Gal C2-Fuc H1
(C)
(D)
GalNAcα 1
Fuc 1
GalNAcβ 1
Gal 1
Fuc 5
Fuc 6
GalNAc 6
Gal 6
GalNAcβ 2
GalNAcα 2GalNAc Ac
t-BuOH
(Int std)
Fuc 5
GalNAcβ 3
Gal 2
Gal 4
Fuc 2
Gal 3
GlcNAcα 3
GalNAcβ 4
GalNAcα 4
Fuc 3
Fuc 4GalNAcα 5
Gal 5
(E)
(F)
t-BuOH
(Int std)
(A)
(B)
Fucα1-2Galβ1-3GalNAc
t-BuOH
(Int std)
(A)
(B)
GalNAcα 1,2
Galα 1,2GalNAcβ 1,2
Fuc 5,6
Gal 3,4
Fuc 1,2
Gal 2,3
GalNAcβ 3,4GalNAcα 3,4
Galβ 1,2
GalNAcα C3-Gal H1
Fuc C1-Gal H2
Gal C2-Fuc H1
(C)
(D)
GalNAcα 1
Fuc 1
GalNAcβ 1
Gal 1
Fuc 5
Fuc 6
GalNAc 6
Gal 6
GalNAcβ 2
GalNAcα 2GalNAc Ac
t-BuOH
(Int std)
Fuc 5
GalNAcβ 3
Gal 2
Gal 4
Fuc 2
Gal 3
GlcNAcα 3
GalNAcβ 4
GalNAcα 4
Fuc 3
Fuc 4GalNAcα 5
Gal 5
(E)
(F)
Fig. 10. NMR spectra of the purified trisaccharide product from GNB and β-FucF.
(A) 1H-NMR (B) 13C-NMR (C) DQF-COSY (D) HMBC (E) HSQC (F) Enlarged HSQC
The spectra were measured in D2O using 2-methyl-2-propanol (t-BuOH) as the internal standard.
24
Xylα 1
Xyl 1
Xylβ 1
Fuc 1
Fuc 5
Fuc 6
Xylβ 3
Xylα 2
t-BuOH
(Int std.)
Xyl 5a
Xylβ 3
Fuc 2
Fuc 4Xyl 2
Fuc 3
Xylα 3
Xylβ 5a
Xyl 3
Xyl 4
Xylα 5
Fuc 5
Xyl 5e
Xylβ 5e
Xylβ 2
Xylβ 4 Xylα 4
Xylα 2
(D)
(E)
Xylα 1
Xyl 1
Xylβ 1
Fuc 1
Fuc 5
Fuc 6
Xylβ 3
Xylα 2
t-BuOH
(Int std.)
Xyl 5a
Xylβ 3
Fuc 2
Fuc 4Xyl 2
Fuc 3
Xylα 3
Xylβ 5a
Xyl 3
Xyl 4
Xylα 5
Fuc 5
Xyl 5e
Xylβ 5e
Xylβ 2
Xylβ 4 Xylα 4
Xylα 2
(D)
(E)
t-BuOH
(Int std)
(A)
(B)
t-BuOH
(Int std)
(A)
(B)
Xylα 1,2
Fucα 1,2
Xylβ 1,2
Xyl 2,3
Xyl 1,2
Fuc 2,3
Fuc 3,4
Fucβ 1,2
Fuc 5,6
Xyl 3.4
Xyl 4,5a
Xyl 4,5eXyl 5a,5e
Xylβ 2,3
Xylβ 3,4
Xylβ 4,5e
Xylβ 4,5a
Xylβ 5a,5e
Xylα 2,3
(C)
Xylβ C3-Fuc H1
Xylα C3-Fuc H1
Xyl C4-Xyl H1
Fuc C1-Xylβ H3
Xyl C1-Xyl H4
Fuc C1-Xylα H3
(F)
(G)
Xylβ C3-Fuc H1
Xylα C3-Fuc H1
Xyl C4-Xyl H1
Fuc C1-Xylβ H3
Xyl C1-Xyl H4
Fuc C1-Xylα H3
(F)
(G)
Xylβ1-4(Fucα1-3)Xyl
Fig. 11. NMR spectra of the purified trisaccharide product from xylobiose and β-FucF. (A) 1H-NMR (B) 13C-NMR (C) DQF-COSY (D) HSQC (E) Enlarged HSQC (F) HMBC (G) Enlarged HMBC The spectra were measured in D2O using t-BuOH as the internal standard.

25
Table 3. 1H- and 13C-NMR data obtained for the product synthesized from β-FucF and xylobiose by BbAfcAN423H.
α-anomer β-anomer 1H 13C 1H 13C
Residue Position δ (ppm) Pattern J (Hz) δ (ppm) δ (ppm) Pattern J (Hz) δ (ppm)
Xyl
(reducing end)
1 5.14 d 3.4 (J1,2) 93.9 4.60 d 7.8 (J1,2) 98.1
2 3.72 dd 3.4 (J1,2), 8.6 (J2,3) 73.4 3.44 dd 7.9 (J1,2), 8.9 (J2,3) 76.4
3 3.85 m 78.2 3.66 t 9.1 (J2,3, J3,4) 80.6
4 3.83 m 75.2 3.84 m 75.1
5ax 3.85 m 61.2 3.38 dd 10.5 (J4,5eq), 11.7 (J5ax,5eq) 64.4
5eq 3.85 m 4.08 dd 5.3 (J4,5eq), 11.9 (J5ax,5eq)
Xyl
(non-reducing
end)
1 4.44 d 7.8 (J1,2) 103.0 4.44 d 7.8 (J1,2) 102.9
2 3.20 dd 8.0 (J1,2), 9.4 (J2,3) 74.8 3.18 dd 8.0 (J1,2), 9.4 (J2,3) 74.9
3 3.41 t 9.3 (J2,3, J3,4) 77.3 3.40 t 9.3 (J2,3, J3,4) 77.4
4 3.56 m 71.0 3.56 m 41.0
5ax 3.27 t 11.2 (J4,5ax, J5ax,5eq) 66.8 3.26 t 11.2 (J4,5ax, J5ax,5eq) 66.8
5eq 3.91 m 3.91 m
Fuc
1 5.20 d 3.9 (J1,2) 101.0 5.26 d 4.0 (J1,2) 101.0
2 3.76 m 70.0 3.77 m 70.0
3 3.89 m 71.1 3.89 m 71.1
4 3.77 m 73.6 3.77 m 73.6
5 4.48 q 6.7 (J5,6) 68.3 4.53 q 6.6 (J5,6) 68.3
6 1.18 d 6.6 (J5,6) 17.1 1.17 d 6.6 (J5,6) 17.1
The spectra were obtained in D2O at 298K with t-BuOH as an internal standard using Bruker Avance800 (for 1H) and Avance500 (for 13C). See also
Fig. 11.

26
Standard LNFP I
Pentasaccharide product from LNT and β-FucF
Fig. 12. 1H-NMR analysis of standard LNFP I (upper panel) and the purified pentasaccharide product from LNT and β-FucF (lower panel). The spectra was measured in D2O using t-BuOH as the internal standard.

27
t-BuOH
(Int std)
(A) (B)
GlcNAc (III) 1,2Glc (I) β 1,2
Fuc (V) 1,2 Glc (I) α 1,2
Gal (IV) 1,2
Gal (II) 1,2
Glc (I) β 2,3
Gal (II) 2,3
Gal (II) 3,4
GlcNAc (III) 2,3
GlcNAc (III) 3,4
GlcNAc (III) 4,5
GlcNAc (III) 5,6GlcNAc (III) 5,6’Gal (IV) 2,3
Glc (I) α 2,3
Fuc (V) 5,6
(C) (D)
Fuc (V) 6
GlcNAc (III) Ac
t-BuOH
(Int std)
(E)
Fuc (V) H1-Gal (IV) C2
GlcNAc (III) H1-Gal (II) C3
Gal (II) H1-Glc (I) C4
Gal (IV) H1-GlcNAc (III) C4
(F)
Fucα1-2Galβ1-4GlcNAcβ1-3Galβ1-4Glc
V IV III II I
Fig. 13. NMR spectra of the purified pentasaccharide product from LNnT and β-FucF. (A) 1H-NMR (B) 13C-NMR (C) DQF-COSY (D) TOCSY (E) HSQC (F) HMBC The spectra was measured in D2O using t-BuOH as the internal standard.

28
Glycoprotein as an acceptor substrate
The author examined whether the 1,2-α-L-fucosynthase acts on glycan chains of
glycoproteins. Porcine gastric mucin (PGM) was used for this purpose, as this glycoprotein is known
to naturally possess H-antigen structures at the non-reducing ends of its O-linked glycans. Fig. 14
shows the results of lectin blotting using UEA-I and PNA for detecting H- (left) and T-antigens (right),
respectively. Treatment of PGM with BbAfcAWT resulted in loss of signals for H-antigens (lanes 1 and
2), and unmasked T-antigen structures, which were otherwise less detectable, appeared instead (lanes
5 and 6). Incubation of defucosylated PGM with β-FucF in the presence of BbAfcAN423H rendered the
glycoprotein UEA-I-positive (lane 3), while this did not occur in the absence of the enzyme (lane 4).
The products were also stained by PNA although the signal intensity was slightly weaker than that
obtained for the substrate (defucosylated PGM) and the control reaction without the enzyme (lanes 6,
7 and 8).
O-Glycans were then released from the proteins, permethylated, and subjected to MALDI-
TOF MS (Fig. 15A) and MALDI-TOF/TOF MS (Fig. 15B) analysis. Each of O-glycan structures was
assigned, based on the diagnostic fragment ions in MS/MS spectra, two examples being shown in Fig.
15B. Relative contents of the selected peaks were expressed in terms of percentage of the total signal
intensity detected for each of the samples (permethylated alditols released from PGM, BbAfcAWT-
treated PGM, or BbAfcAWT/BbAfcAN423H-treated PGM), and compared (Fig. 16). Treatment of PGM
with BbAfcAWT significantly decreased the relative content of the glycan chain with m/z of 708.4
(probably, Fucα1-2Galβ1-3GalNAc-itol), and increased the relative content of the glycan chain with
m/z of 534.3 (Galβ1-3GalNAc-itol, white bars versus light gray bars in Fig. 16A). After the synthase
BbAfcAWT
BbAfcAN423H
Fig. 14. 1,2-α-L-Fucosynthase activity towards glycoproteins. Porcine gastric mucin (PGM) was used for examining its availability as an acceptor substrate.
Lectin blotting of non-treated PGM (lane 1 and 5), 1,2-α-L-fucosidase WT (BbAfcAWT)-treated PGM (lane 2 and 6), defucosylated PGM incubated with BbAfcAN423H and β-FucF (lane 3 and 7), and defucosylated PGM incubated with β-FucF in the absence of enzyme (lane 4 and 8). The samples were spotted on PVDF membrane in varying amounts (0.125 to 1.0 μg), and the membrane was blotted with UEA-I and PNA for detecting H- and T-antigens, respectively. The reactions and lectin-blotting were repeated twice with essentially the same results and the data for a representative experiment are shown.
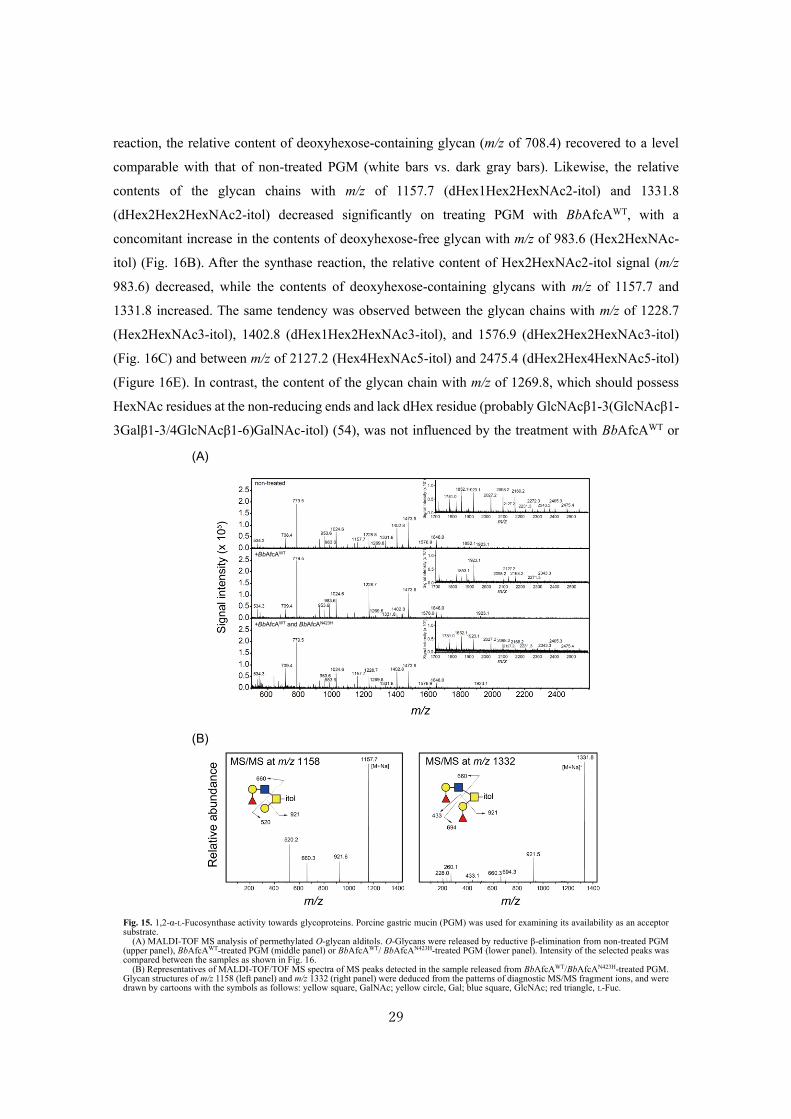
29
reaction, the relative content of deoxyhexose-containing glycan (m/z of 708.4) recovered to a level
comparable with that of non-treated PGM (white bars vs. dark gray bars). Likewise, the relative
contents of the glycan chains with m/z of 1157.7 (dHex1Hex2HexNAc2-itol) and 1331.8
(dHex2Hex2HexNAc2-itol) decreased significantly on treating PGM with BbAfcAWT, with a
concomitant increase in the contents of deoxyhexose-free glycan with m/z of 983.6 (Hex2HexNAc-
itol) (Fig. 16B). After the synthase reaction, the relative content of Hex2HexNAc2-itol signal (m/z
983.6) decreased, while the contents of deoxyhexose-containing glycans with m/z of 1157.7 and
1331.8 increased. The same tendency was observed between the glycan chains with m/z of 1228.7
(Hex2HexNAc3-itol), 1402.8 (dHex1Hex2HexNAc3-itol), and 1576.9 (dHex2Hex2HexNAc3-itol)
(Fig. 16C) and between m/z of 2127.2 (Hex4HexNAc5-itol) and 2475.4 (dHex2Hex4HexNAc5-itol)
(Figure 16E). In contrast, the content of the glycan chain with m/z of 1269.8, which should possess
HexNAc residues at the non-reducing ends and lack dHex residue (probably GlcNAcβ1-3(GlcNAcβ1-
3Galβ1-3/4GlcNAcβ1-6)GalNAc-itol) (54), was not influenced by the treatment with BbAfcAWT or
+BbAfcAWT
+BbAfcAWT and BbAfcAN423H
(A)
(B)
Fig. 15. 1,2-α-L-Fucosynthase activity towards glycoproteins. Porcine gastric mucin (PGM) was used for examining its availability as an acceptor substrate.
(A) MALDI-TOF MS analysis of permethylated O-glycan alditols. O-Glycans were released by reductive β-elimination from non-treated PGM (upper panel), BbAfcAWT-treated PGM (middle panel) or BbAfcAWT/ BbAfcAN423H-treated PGM (lower panel). Intensity of the selected peaks was compared between the samples as shown in Fig. 16.
(B) Representatives of MALDI-TOF/TOF MS spectra of MS peaks detected in the sample released from BbAfcAWT/BbAfcAN423H-treated PGM. Glycan structures of m/z 1158 (left panel) and m/z 1332 (right panel) were deduced from the patterns of diagnostic MS/MS fragment ions, and were drawn by cartoons with the symbols as follows: yellow square, GalNAc; yellow circle, Gal; blue square, GlcNAc; red triangle, L-Fuc.

30
BbAfcAN423H enzyme (Fig. 16D).
BbAfcAWT
BbAfcAN423H
BbAfcAWT
BbAfcAN423H
BbAfcAWT
BbAfcAN423H
BbAfcAWT
BbAfcAN423H
BbAfcAWT
BbAfcAN423H
Fig. 16. Comparison of the relative contents of the selected glycans between the non-treated PGM (white bars), BbAfcAWT-treated PGM (light
gray bars), and BbAfcAWT/BbAfcAN423H-treated (dark gray bars) PGM.
The relative contents of glycan alditols were estimated by dividing each of the signal intensity with the total signal intensity of the
respective samples, and were expressed in terms of percentage (%). Sugar composition was deduced based on the precursor ion mass as a sodium
adduct in MS spectra and the diagnostic fragment ions in MS/MS spectra. See also the legend of Figure 15. a; not detected.

31
DISCUSSION
Acceptor specificity
In the previous study on AfcA D766G synthase, Wada et al. only used Lac as an acceptor to
demonstrate its synthetic ability and regio-specificity (40). This is primarily due to the very low
conversion ratio of the synthase (less than 6 % against added β-FucF), which rendered product
purification laborious. In the present study, by virtue of the high catalytic efficiency of the
BbAfcAN423H, the author succeeded in examining its acceptor specificity, i.e. (+) subsite structure, in
more detail. The results revealed a unique feature of this enzyme. In addition to monosaccharide Gal
and Gal-containing oligosaccharides at the non-reducing ends, the synthase recognized
monosaccharides L-Ara, Glc, L-Rha, and Xyl and disaccharides maltose, isomaltose, cellobiose,
gentiobiose, and xylobiose as acceptors. The ability of the synthase to recognize L-Ara was expected,
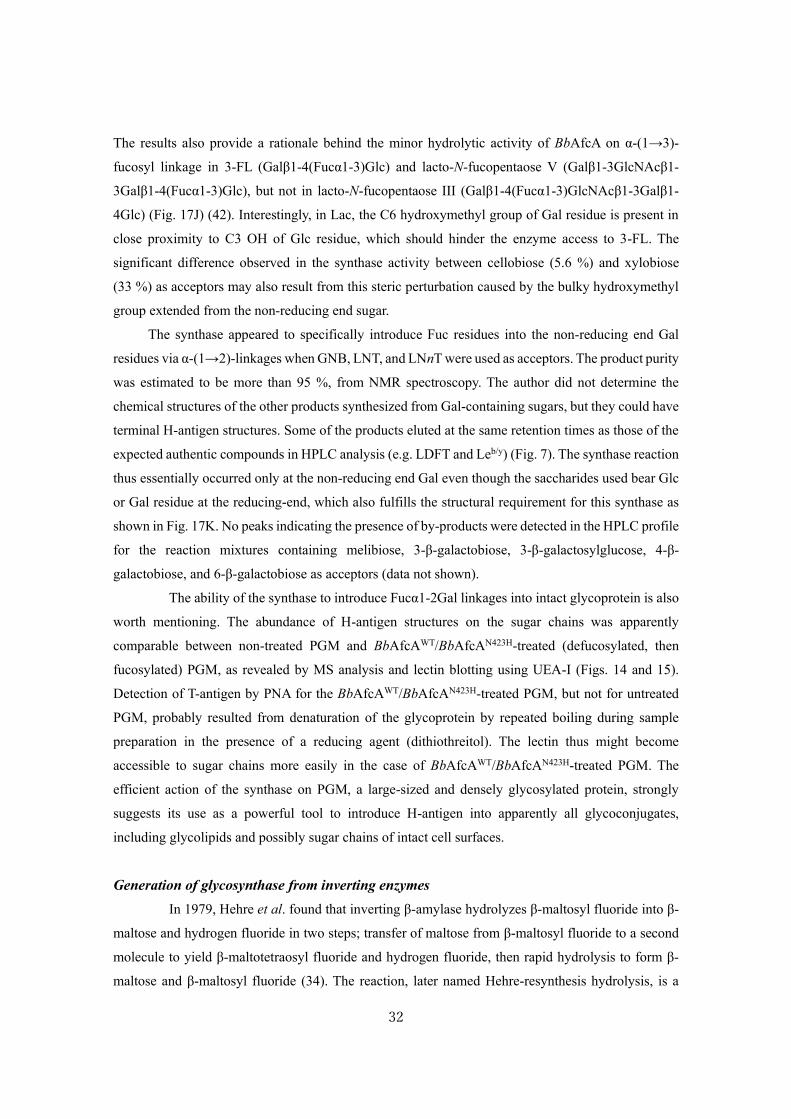
because O4 of the sugar adopts an axial conformation in the 4C1 pyranose form (53) (Fig. 17A and
17B). The synthesized product therefore should be Fucα1-2Ara. The lower yield than Gal could result
from the lack of C6-hydroxymethyl group that otherwise participates in a stacking interaction with
W500 of AfcA (44) (Fig. 1). The capability of the synthase to recognize L-Rha was also not surprising
because its C2- (axial), C3- (equatorial), C4 (equatorial)-hydroxyl groups, and endocyclic oxygen
overlap with C4-, C3-, C2-OHs, and endocyclic oxygen of Gal, respectively, when the 1C4 ring of the
sugar is inverted (Fig. 17C). It is therefore likely that the product is Fucα1-4Rha.
The finding that this synthase accepts gluco-series sugars was unexpected. The author then
isolated the product synthesized from β-FucF and xylobiose, and identified it as 3-fucosylxylobiose
(Xylβ1-4(Fucα1-3)Xyl). The results strongly suggest that the synthase can recognize the α-anomeric
conformation of Xyl or Glc as an acceptor (Fig. 17D and 17E). The O1 (axial), O2 (equatorial), and
O3 (equatorial) of the reducing-end Xyl residue of α-anomer of xylobiose structurally corresponds to
O4 (axial), O3 (equatorial), and O2 (equatorial) of Gal. AfcA recognizes Gal at subsite (+1) by four
hydrogen bonds with O2/O3/O4 atoms and by a stacking interaction with C6 hydroxymethyl group of
the sugar, and its catalytic pocket appears to widely open towards the reducing end, although the
catalytic pocket has (+2) subsite (44) (Fig. 1). Consequently, at the (+) subsite, the synthase accepted
oligosaccharide carrying α-Glc at reducing end, despite the Glc being linked with an additional Glc
via α/β-linkages at O4 and O6 positions to form maltose/cellobiose or isomaltose/gentiobiose (Fig.
17F-17I). Diglucosides with (1→3)-linkage such as laminaribiose did not serve as an acceptor because
the O3 position of the reducing-end Glc is occupied. The synthase failed to recognize α-GalNAc and
α-GlcNAc, although its C3 hydroxyl group is equatorial. Taken together, the structural requirement
for acceptors by 1,2-α-L-fucosynthase was assumed to be a six-membered ring with chair
conformation carrying one axial OH continued with two consecutive equatorial OHs (Fig. 17K). This
finding agrees with the mode of Gal recognition by BbAfcA in the crystal structure as mentioned above.
32
The results also provide a rationale behind the minor hydrolytic activity of BbAfcA on α-(1→3)-
fucosyl linkage in 3-FL (Galβ1-4(Fucα1-3)Glc) and lacto-N-fucopentaose V (Galβ1-3GlcNAcβ1-
3Galβ1-4(Fucα1-3)Glc), but not in lacto-N-fucopentaose III (Galβ1-4(Fucα1-3)GlcNAcβ1-3Galβ1-
4Glc) (Fig. 17J) (42). Interestingly, in Lac, the C6 hydroxymethyl group of Gal residue is present in
close proximity to C3 OH of Glc residue, which should hinder the enzyme access to 3-FL. The
significant difference observed in the synthase activity between cellobiose (5.6 %) and xylobiose
(33 %) as acceptors may also result from this steric perturbation caused by the bulky hydroxymethyl
group extended from the non-reducing end sugar.
The synthase appeared to specifically introduce Fuc residues into the non-reducing end Gal
residues via α-(1→2)-linkages when GNB, LNT, and LNnT were used as acceptors. The product purity
was estimated to be more than 95 %, from NMR spectroscopy. The author did not determine the
chemical structures of the other products synthesized from Gal-containing sugars, but they could have
terminal H-antigen structures. Some of the products eluted at the same retention times as those of the
expected authentic compounds in HPLC analysis (e.g. LDFT and Leb/y) (Fig. 7). The synthase reaction
thus essentially occurred only at the non-reducing end Gal even though the saccharides used bear Glc
or Gal residue at the reducing-end, which also fulfills the structural requirement for this synthase as
shown in Fig. 17K. No peaks indicating the presence of by-products were detected in the HPLC profile
for the reaction mixtures containing melibiose, 3-β-galactobiose, 3-β-galactosylglucose, 4-β-
galactobiose, and 6-β-galactobiose as acceptors (data not shown).
The ability of the synthase to introduce Fucα1-2Gal linkages into intact glycoprotein is also
worth mentioning. The abundance of H-antigen structures on the sugar chains was apparently
comparable between non-treated PGM and BbAfcAWT/BbAfcAN423H-treated (defucosylated, then
fucosylated) PGM, as revealed by MS analysis and lectin blotting using UEA-I (Figs. 14 and 15).
Detection of T-antigen by PNA for the BbAfcAWT/BbAfcAN423H-treated PGM, but not for untreated
PGM, probably resulted from denaturation of the glycoprotein by repeated boiling during sample
preparation in the presence of a reducing agent (dithiothreitol). The lectin thus might become
accessible to sugar chains more easily in the case of BbAfcAWT/BbAfcAN423H-treated PGM. The
efficient action of the synthase on PGM, a large-sized and densely glycosylated protein, strongly
suggests its use as a powerful tool to introduce H-antigen into apparently all glycoconjugates,
including glycolipids and possibly sugar chains of intact cell surfaces.
Generation of glycosynthase from inverting enzymes
In 1979, Hehre et al. found that inverting β-amylase hydrolyzes β-maltosyl fluoride into β-
maltose and hydrogen fluoride in two steps; transfer of maltose from β-maltosyl fluoride to a second
molecule to yield β-maltotetraosyl fluoride and hydrogen fluoride, then rapid hydrolysis to form β-
maltose and β-maltosyl fluoride (34). The reaction, later named Hehre-resynthesis hydrolysis, is a

33
prerequisite to convert inverting GHs into glycosynthases (37,40). Accordingly, efficient synthase
mutants would be obtained if the introduced amino acid replacement decreases hydrolytic activity
while retaining fluorine ion-releasing activity from donor substrates (37,55). In the case of typical
inverting GHs that utilize a pair of carboxylic residues as acid and base catalysts and a non-acidic
residue as an attacking water-holder, such conversion can occur simply by replacing the water holder
with a neutral residue while a base residue remains intact. Examples include GH8 reducing-end
xylose-releasing exo-oligoxylanase (37) and GH19 chitinase (56). However, several inverting GHs
adopt non-canonical reaction mechanisms (38,57), which lack a generalized strategy to convert them
to glycosynthases (37,40). 1,2-α-L-Fucosidase used in this study adopts a unique reaction mechanism
as mentioned (Fig. 1). Among the fifty-one BbAfcA mutants examined, two mutants BbAfcAN423H and
BbAfcAN423D/D766N, both containing a base replacement, showed high synthase activity, while the water
holder mutants (N421 mutants) showed no activity. Loss of hydrolytic activity of these mutants was
expected, but the retention of fluorine-releasing activity by the two mutants (BbAfcAN423H and
BbAfcAN423D/D766N) is unclear. Protonated imidazole or protonated carboxylic acid at residue 423
might be important during the catalytic cycle. Amino acid replacement at residue 421 might cause
dislocation of the side-chain of E566 due to the loss of a hydrogen-bond between them. Creation of
efficient glycosynthases from inverting GHs with atypical reaction mechanisms thus likely requires
an empirical approach.
Due to the instability of β-FucF in water at 30 ºC, the author did not determine the kinetic
parameters of the 1,2-α-L-fucosynthase reaction. However, assuming that the reaction catalyzed by
BbAfcAN423H proceeded linearly during the first three minutes (Fig. 3A), the specific activity of the
mutant for H-antigen synthesis is estimated to be 5 s-1. This value is considerably higher than those of
α-1,2-fucosyltransferases (1−20 min-1) and thus exceeds the H-antigen introducing activity of
currently available enzymes (28,30). Periodic feeding of β-FucF or conducting the reaction at a low
temperature (< 4 ºC) is necessary to scale up the synthesis of the H-antigen-containing glycans by 1,2-
α-L-fucosynthase.
34
Fig. 17. Structural representation demonstrating substrate specificity of 1,2-α-L-fucosidase/fucosynthase reaction.
Structures of (A) H-antigen, (B) L-arabinopyranose, (C) L-rhamnose, (D) α-anomer of 3-fucosylxylobiose, (E) α-anomer of glucose,
(F) α-anomer of maltose, (G) α-anomer of cellobiose, (H) α-anomer of isomaltose, (I) α-anomer of gentiobiose, and (J) α-anomer of 3-fucosyllactose
are shown. (K) Structural requirement for acceptor molecules of the 1,2-α-L-fucosynthase reaction

35
REFERENCES
1. Hakomori, S. (1999) Antigen structure and genetic basis of histo-blood groups A, B and O:
their changes associated with human cancer. Biochim Biophys Acta 1473, 247-266
2. Heimburg-Molinaro, J., Lum, M., Vijay, G., Jain, M., Almogren, A., and Rittenhouse-Olson,
K. (2011) Cancer vaccines and carbohydrate epitopes. Vaccine 29, 8802-8826
3. Tateno, H., Matsushima, A., Hiemori, K., Onuma, Y., Ito, Y., Hasehira, K., Nishimura, K.,
Ohtaka, M., Takayasu, S., Nakanishi, M., Ikehara, Y., Ohnuma, K., Chan, T., Toyoda, M.,
Akutsu, H., Umezawa, A., Asashima, M., and Hirabayashi, J. (2013) Podocalyxin is a
glycoprotein ligand of the human pluripotent stem cell-specific probe rBC2LCN. Stem Cells
Transl Med 2, 265-273
4. Mollicone, R., Candelier, J. J., Reguigne, I., Couillin, P., Fletcher, A., and Oriol, R. (1994)
Molecular genetics of alpha-L-fucosyltransferase genes (H, Se, Le, FUT4, FUT5 and
FUT6). Transfus Clin Biol 1, 91-97
5. Rouquier, S., Lowe, J. B., Kelly, R. J., Fertitta, A. L., Lennon, G. G., and Giorgi, D. (1995)
Molecular cloning of a human genomic region containing the H blood group
alpha(1,2)fucosyltransferase gene and two H locus-related DNA restriction fragments.
Isolation of a candidate for the human Secretor blood group locus. J Biol Chem 270, 4632-
4639
6. Su, A. I., Wiltshire, T., Batalov, S., Lapp, H., Ching, K. A., Block, D., Zhang, J., Soden, R.,
Hayakawa, M., Kreiman, G., Cooke, M. P., Walker, J. R., and Hogenesch, J. B. (2004) A
gene atlas of the mouse and human protein-encoding transcriptomes. Proc Natl Acad Sci U
S A 101, 6062-6067
7. Bry, L., Falk, P. G., Midtvedt, T., and Gordon, J. I. (1996) A model of host-microbial
interactions in an open mammalian ecosystem. Science 273, 1380-1383
8. Goto, Y., Obata, T., Kunisawa, J., Sato, S., Ivanov, I. I., Lamichhane, A., Takeyama, N.,
Kamioka, M., Sakamoto, M., Matsuki, T., Setoyama, H., Imaoka, A., Uematsu, S., Akira, S.,
Domino, S. E., Kulig, P., Becher, B., Renauld, J. C., Sasakawa, C., Umesaki, Y., Benno, Y.,
and Kiyono, H. (2014) Innate lymphoid cells regulate intestinal epithelial cell glycosylation.
Science 345, 1254009
9. Pickard, J. M., Maurice, C. F., Kinnebrew, M. A., Abt, M. C., Schenten, D., Golovkina, T.
V., Bogatyrev, S. R., Ismagilov, R. F., Pamer, E. G., Turnbaugh, P. J., and Chervonsky, A. V.
(2014) Rapid fucosylation of intestinal epithelium sustains host-commensal symbiosis in
sickness. Nature 514, 638-641
10. Pacheco, A. R., Curtis, M. M., Ritchie, J. M., Munera, D., Waldor, M. K., Moreira, C. G.,
and Sperandio, V. (2012) Fucose sensing regulates bacterial intestinal colonization. Nature

36
492, 113-117
11. Pham, T. A., Clare, S., Goulding, D., Arasteh, J. M., Stares, M. D., Browne, H. P., Keane, J.
A., Page, A. J., Kumasaka, N., Kane, L., Mottram, L., Harcourt, K., Hale, C., Arends, M. J.,
Gaffney, D. J., Dougan, G., Lawley, T. D., and Project, S. M. G. (2014) Epithelial IL-
22RA1-mediated fucosylation promotes intestinal colonization resistance to an
opportunistic pathogen. Cell Host Microbe 16, 504-516
12. McGovern, D. P., Jones, M. R., Taylor, K. D., Marciante, K., Yan, X., Dubinsky, M.,
Ippoliti, A., Vasiliauskas, E., Berel, D., Derkowski, C., Dutridge, D., Fleshner, P., Shih, D.
Q., Melmed, G., Mengesha, E., King, L., Pressman, S., Haritunians, T., Guo, X., Targan, S.
R., Rotter, J. I., and Consortium, I. I. G. (2010) Fucosyltransferase 2 (FUT2) non-secretor
status is associated with Crohn's disease. Hum Mol Genet 19, 3468-3476
13. Smyth, D. J., Cooper, J. D., Howson, J. M., Clarke, P., Downes, K., Mistry, T., Stevens, H.,
Walker, N. M., and Todd, J. A. (2011) FUT2 nonsecretor status links type 1 diabetes
susceptibility and resistance to infection. Diabetes 60, 3081-3084
14. Kobata, A. (2010) Structures and application of oligosaccharides in human milk. Proc Jpn
Acad Ser B Phys Biol Sci 86, 731-747
15. Kunz, C., Rudloff, S., Baier, W., Klein, N., and Strobel, S. (2000) Oligosaccharides in
human milk: structural, functional, and metabolic aspects. Annu Rev Nutr 20, 699-722
16. Urashima, T., Asakuma, S., Leo, F., Fukuda, K., Messer, M., and Oftedal, O. T. (2012) The
predominance of type I oligosaccharides is a feature specific to human breast milk. Adv
Nutr 3, 473S-482S
17. Brand-Miller, J. C., McVeagh, P., McNeil, Y., and Messer, M. (1998) Digestion of human
milk oligosaccharides by healthy infants evaluated by the lactulose hydrogen breath test. J
Pediatr 133, 95-98
18. Asakuma, S., Hatakeyama, E., Urashima, T., Yoshida, E., Katayama, T., Yamamoto, K.,
Kumagai, H., Ashida, H., Hirose, J., and Kitaoka, M. (2011) Physiology of consumption of
human milk oligosaccharides by infant gut-associated bifidobacteria. J Biol Chem 286,
34583-34592
19. Katayama, T. (2016) Host-derived glycans serve as selected nutrients for the gut microbe:
human milk oligosaccharides and bifidobacteria. Biosci Biotechnol Biochem 80, 621-632
20. Kitaoka, M., Tian, J., and Nishimoto, M. (2005) Novel putative galactose operon involving
lacto-N-biose phosphorylase in Bifidobacterium longum. Appl Environ Microbiol 71, 3158-
3162
21. Lewis, Z. T., Totten, S. M., Smilowitz, J. T., Popovic, M., Parker, E., Lemay, D. G., Van
Tassell, M. L., Miller, M. J., Jin, Y. S., German, J. B., Lebrilla, C. B., and Mills, D. A.
(2015) Maternal fucosyltransferase 2 status affects the gut bifidobacterial communities of

37
breastfed infants. Microbiome 3, 13
22. Sakurama, H., Fushinobu, S., Hidaka, M., Yoshida, E., Honda, Y., Ashida, H., Kitaoka, M.,
Kumagai, H., Yamamoto, K., and Katayama, T. (2012) 1,3-1,4-α-L-fucosynthase that
specifically introduces Lewis a/x antigens into type-1/2 chains. J Biol Chem 287, 16709-
16719
23. Sakurama, H., Kiyohara, M., Wada, J., Honda, Y., Yamaguchi, M., Fukiya, S., Yokota, A.,
Ashida, H., Kumagai, H., Kitaoka, M., Yamamoto, K., and Katayama, T. (2013) Lacto-N-
biosidase encoded by a novel gene of Bifidobacterium longum subspecies longum shows
unique substrate specificity and requires a designated chaperone for its active expression. J
Biol Chem 288, 25194-25206
24. Sela, D. A., Chapman, J., Adeuya, A., Kim, J. H., Chen, F., Whitehead, T. R., Lapidus, A.,
Rokhsar, D. S., Lebrilla, C. B., German, J. B., Price, N. P., Richardson, P. M., and Mills, D.
A. (2008) The genome sequence of Bifidobacterium longum subsp. infantis reveals
adaptations for milk utilization within the infant microbiome. Proc Natl Acad Sci U S A 105,
18964-18969
25. Wada, J., Ando, T., Kiyohara, M., Ashida, H., Kitaoka, M., Yamaguchi, M., Kumagai, H.,
Katayama, T., and Yamamoto, K. (2008) Bifidobacterium bifidum lacto-N-biosidase, a
critical enzyme for the degradation of human milk oligosaccharides with a type 1 structure.
Appl Environ Microbiol 74, 3996-4004
26. Ruiz-Palacios, G. M., Cervantes, L. E., Ramos, P., Chavez-Munguia, B., and Newburg, D.
S. (2003) Campylobacter jejuni binds intestinal H(O) antigen (Fuc alpha 1, 2Gal beta 1,
4GlcNAc), and fucosyloligosaccharides of human milk inhibit its binding and infection. J
Biol Chem 278, 14112-14120
27. He, Y., Liu, S., Kling, D. E., Leone, S., Lawlor, N. T., Huang, Y., Feinberg, S. B., Hill, D.
R., and Newburg, D. S. (2016) The human milk oligosaccharide 2'-fucosyllactose modulates
CD14 expression in human enterocytes, thereby attenuating LPS-induced inflammation. Gut
65, 33-46
28. Drouillard, S., Driguez, H., and Samain, E. (2006) Large-scale synthesis of H-antigen
oligosaccharides by expressing Helicobacter pylori alpha1,2-fucosyltransferase in
metabolically engineered Escherichia coli cells. Angew Chem Int Ed Engl 45, 1778-1780
29. Baumgärtner, F., Seitz, L., Sprenger, G. A., and Albermann, C. (2013) Construction of
Escherichia coli strains with chromosomally integrated expression cassettes for the
synthesis of 2'-fucosyllactose. Microb Cell Fact 12, 40
30. Zhao, C., Wu, Y., Yu, H., Shah, I. M., Li, Y., Zeng, J., Liu, B., Mills, D. A., and Chen, X.
(2016) The one-pot multienzyme (OPME) synthesis of human blood group H antigens and a
human milk oligosaccharide (HMOS) with highly active Thermosynechococcus elongates
38
α1-2-fucosyltransferase. Chem Commun (Camb) 52, 3899-3902
31. Vasiliu, D., Razi, N., Zhang, Y., Jacobsen, N., Allin, K., Liu, X., Hoffmann, J., Bohorov, O.,
and Blixt, O. (2006) Large-scale chemoenzymatic synthesis of blood group and tumor-
associated poly-N-acetyllactosamine antigens. Carbohydr Res 341, 1447-1457
32. Osanjo, G., Dion, M., Drone, J., Solleux, C., Tran, V., Rabiller, C., and Tellier, C. (2007)
Directed evolution of the alpha-L-fucosidase from Thermotoga maritima into an alpha-L-
transfucosidase. Biochemistry 46, 1022-1033
33. Shaikh, F. A., and Withers, S. G. (2008) Teaching old enzymes new tricks: engineering and
evolution of glycosidases and glycosyl transferases for improved glycoside synthesis.
Biochem Cell Biol 86, 169-177
34. Hehre, E. J., Brewer, C. F., and Genghof, D. S. (1979) Scope and mechanism of
carbohydrase action. Hydrolytic and nonhydrolytic actions of beta-amylase on alpha- and
beta-maltosyl fluoride. J Biol Chem 254, 5942-5950
35. Malet, C., and Planas, A. (1998) From beta-glucanase to beta-glucansynthase: glycosyl
transfer to alpha-glycosyl fluorides catalyzed by a mutant endoglucanase lacking its
catalytic nucleophile. FEBS Lett 440, 208-212
36. Mackenzie, L. F., Wang, Q., J., R. A., Warren, and Withers, S. G. (1998) Glycosynthases:
Mutant Glycosidases for Oligosaccharide Synthesis. J. Am. Chem. Soc. 120, 5583-5584
37. Honda, Y., and Kitaoka, M. (2006) The first glycosynthase derived from an inverting
glycoside hydrolase. J Biol Chem 281, 1426-1431
38. Honda, Y., Arai, S., Suzuki, K., Kitaoka, M., and Fushinobu, S. (2016) The crystal structure
of an inverting glycoside hydrolase family 9 exo-β-D-glucosaminidase and the design of
glycosynthase. Biochem J 473, 463-472
39. Ohnuma, T., Dozen, S., Honda, Y., Kitaoka, M., and Fukamizo, T. (2016) A glycosynthase
derived from an inverting chitinase with an extended binding cleft. J Biochem 160, 93-100
40. Wada, J., Honda, Y., Nagae, M., Kato, R., Wakatsuki, S., Katayama, T., Taniguchi, H.,
Kumagai, H., Kitaoka, M., and Yamamoto, K. (2008) 1,2-alpha-l-Fucosynthase: a
glycosynthase derived from an inverting alpha-glycosidase with an unusual reaction
mechanism. FEBS Lett 582, 3739-3743
41. Gotoh, A., Katoh, T., Sugiyama, Y., Kurihara, S., Honda, Y., Sakurama, H., Kambe, T.,
Ashida, H., Kitaoka, M., Yamamoto, K., and Katayama, T. (2015) Novel substrate
specificities of two lacto-N-biosidases towards β-linked galacto-N-biose-containing
oligosaccharides of globo H, Gb5, and GA1. Carbohydr Res 408, 18-24
42. Katayama, T., Sakuma, A., Kimura, T., Makimura, Y., Hiratake, J., Sakata, K., Yamanoi, T.,
Kumagai, H., and Yamamoto, K. (2004) Molecular cloning and characterization of
Bifidobacterium bifidum 1,2-alpha-L-fucosidase (AfcA), a novel inverting glycosidase

39
(glycoside hydrolase family 95). J Bacteriol 186, 4885-4893
43. Liu, J., Zheng, M., Zhang, C., and Xu, D. (2013) "Amide resonance" in the catalysis of 1,2-
α-L-fucosidase from Bifidobacterium bifidum. J Phys Chem B 117, 10080-10092
44. Nagae, M., Tsuchiya, A., Katayama, T., Yamamoto, K., Wakatsuki, S., and Kato, R. (2007)
Structural basis of the catalytic reaction mechanism of novel 1,2-alpha-L-fucosidase from
Bifidobacterium bifidum. J Biol Chem 282, 18497-18509
45. Nakajima, M., Nishimoto, M., and Kitaoka, M. (2010) Practical preparation of D-galactosyl-
beta1→4-L-rhamnose employing the combined action of phosphorylases. Biosci Biotechnol
Biochem 74, 1652-1655
46. Nishimoto, M., and Kitaoka, M. (2007) Practical preparation of lacto-N-biose I, a candidate
for the bifidus factor in human milk. Biosci Biotechnol Biochem 71, 2101-2104
47. Nishimoto, M., and Kitaoka, M. (2009) One-pot enzymatic production of beta-D-
galactopyranosyl-(1→3)-2-acetamido-2-deoxy-D-galactose (galacto-N-biose) from sucrose
and 2-acetamido-2-deoxy-D-galactose (N-acetylgalactosamine). Carbohydr Res 344, 2573-
2576
48. Ashida, H., Miyake, A., Kiyohara, M., Wada, J., Yoshida, E., Kumagai, H., Katayama, T.,
and Yamamoto, K. (2009) Two distinct alpha-L-fucosidases from Bifidobacterium bifidum
are essential for the utilization of fucosylated milk oligosaccharides and glycoconjugates.
Glycobiology 19, 1010-1017
49. Anderson, K., Li, S. C., and Li, Y. T. (2000) Diphenylamine-aniline-phosphoric acid
reagent, a versatile spray reagent for revealing glycoconjugates on thin-layer
chromatography plates. Anal Biochem 287, 337-339
50. Aoki, K., Porterfield, M., Lee, S. S., Dong, B., Nguyen, K., McGlamry, K. H., and
Tiemeyer, M. (2008) The diversity of O-linked glycans expressed during Drosophila
melanogaster development reflects stage- and tissue-specific requirements for cell
signaling. J Biol Chem 283, 30385-30400
51. Anumula, K. R., and Taylor, P. B. (1992) A comprehensive procedure for preparation of
partially methylated alditol acetates from glycoprotein carbohydrates. Anal Biochem 203,
101-108
52. Ceroni, A., Maass, K., Geyer, H., Geyer, R., Dell, A., and Haslam, S. M. (2008)
GlycoWorkbench: a tool for the computer-assisted annotation of mass spectra of glycans. J
Proteome Res 7, 1650-1659
53. Angyal, S., and Pickles, V. (1972) Equilibria between pyranoses and furanoses. II. Aldoses.
Aust J Chem 25, 1695-1710
54. Karlsson, N. G., Herrmann, A., Karlsson, H., Johansson, M. E., Carlstedt, I., and Hansson,
G. C. (1997) The glycosylation of rat intestinal Muc2 mucin varies between rat strains and
40
the small and large intestine. A study of O-linked oligosaccharides by a mass spectrometric
approach. J Biol Chem 272, 27025-27034
55. Hidaka, M., Fushinobu, S., Honda, Y., Wakagi, T., Shoun, H., and Kitaoka, M. (2010)
Structural explanation for the acquisition of glycosynthase activity. J Biochem 147, 237-244
56. Ohnuma, T., Fukuda, T., Dozen, S., Honda, Y., Kitaoka, M., and Fukamizo, T. (2012) A
glycosynthase derived from an inverting GH19 chitinase from the moss Bryum coronatum.
Biochem J 444, 437-443
57. Helland, R., Larsen, R. L., Finstad, S., Kyomuhendo, P., and Larsen, A. N. (2009) Crystal
structures of g-type lysozyme from Atlantic cod shed new light on substrate binding and the
catalytic mechanism. Cell Mol Life Sci 66, 2585-2598
41
SUMMARY
Fucα1-2Gal linkages, or H-antigens, constitute histo-blood group antigens and are
involved in various physiological processes. In addition, recent studies have shown that the H-
antigen-containing glycans play an important role, not only in establishing harmonious relationship
between gut microbes and the host, but also in preventing gut dysbiosis-related diseases. Therefore,
development of an efficient method for introducing Fuc residue at Gal residue at the non-reducing
end of glycans via α-(1→2) linkage is desired for research as well as medicinal purposes. In this
study, the author succeeded in derivatizing inverting 1,2-α-L-fucosidase (BbAfcA) into a highly
functional 1,2-α-L-fucosynthase (BbAfcAN423H). The synthase specifically synthesized H type 1-,
type 2-, type 3- and type 4-chain containing oligosaccharides with yields of 57‒75 % based on
acceptor depletion. The synthase was also able to specifically introduce Fuc residues into Lewis a/x
antigens to produce Lewis b/y antigens, with yields of 43 % and 62 %, respectively. In addition, the
enzyme efficiently introduced H-antigens into sugar chains of porcine gastric mucins, as revealed by
lectin blotting and mass spectroscopy analysis of the sugars. Detailed acceptor specificity analysis
using various mono- and oligosaccharides unraveled unique substrate recognition feature of this
synthase at the subsite (+1), which can be explained by previous x-ray crystallographic study of
BbAfcA by Nagae et al. (J Biol Chem 282, 18497-18509). These results show that the synthase
developed in this study could serve as an alternative to other H-antigen synthesis methods involving
α-1,2-fucosyltransferases and retaining α-fucosidase.
42
SECTION II
Introduction of H-antigen structures on various glycoconjugates
using highly functional 1,2-α-L-fucosynthase
H-antigens have been known as key structures in providing beneficial effects, such as
prevention of pathogenic infection and for the establishment of symbiosis between host and gut
microbiota as prebiotics (1-5). For instance, mothers supply babies with 2'-fucosyllactose (2'-FL) as
well as other fucosylated human milk oligosaccharides (HMOs) in their breast milk (6,7). It is also
known that in higher plants, α1,2-fucosylation regulates seedling growth (8,9). Thus, introduction of
fucosyl residue into various compounds is of particular interest not only because of their prebiotic and
pharmaceutical benefits but also because it can aid in elucidating the molecular mechanisms
underlying fucosylation-mediated cellular responses observed in various organisms.
In SECTION I of CHAPTER I, the author developed a highly functional 1,2-α-L-
fucosynthase (BbAfcAN423H), synthesizing 2'-FL with a considerably higher yield (88 % yield against
β-fucosyl fluoride [β-FucF]). The BbAfcAN423H had a broad acceptor specificity and could transfer
fucosyl residues onto various oligosaccharides and O-glycans in mucin glycoproteins (Table 2 and Fig.
16 in SECTION I of CHAPTER I). This 1,2-α-L-fucosynthase made it more feasible to introduce H-
antigens onto various glycoconjugates, which were conventionally difficult to obtain from biological
samples.
In this SECTION, the author explored additional application for the BbAfcAN423H with
acceptor molecules, other than those described in SECTION I of CHAPTER I. The BbAfcAN423H could
synthesize a wide range of glycoconjugates, including α1,2- L-fucosylated N- and O-glycans of fetuin
glycoprotein, fucosyl GM1 glycolipid, and fucosyl xyloglucan nonasaccharide. These results
demonstrated extensive robustness and broader application of this fucosynthase-based technique in
functional glycomics.
43
MATERIALS AND METHODS
Chemicals
Fetuin, asialofetuin, and ganglioside GM1 were purchased from Sigma-Aldrich (St. Louis, MO,
USA). Peptide:N-glycanase F (PNGase F) and sialidase obtained from Vibrio cholerae were purchased
from Roche (Mannheim, Germany). Xyloglucan nonasaccharide (XLLG) was obtained from Tokyo
Chemical Industry Co., Ltd. (Tokyo, Japan). Pyridylaminated (PA-) sugar chains (asialo bi- and tri-
antennary complex-type N-glycan) were purchased from TaKaRa Bio Inc. (Kusatsu, Japan). β-FucF
was prepared as previously described (10). Recombinant 1,3-1,4-α-L-fucosidase obtained from
Bacteroides thetaiotaomicron VPI-5482 (BT_2970) was expressed and purified as described
previously (11). Recombinant 1,2-α-L-fucosidase wild-type (BbAfcAWT) and 1,2-α-L-fucosynthase
BbAfcAN423H were prepared as described previously (SECTION I of CHAPTER I).
Fucosynthase reaction with ganglioside GM1 and analysis of the reaction product
Ganglioside GM1 (50 μg) was reconstituted in 2 μL of dimethylsulfoxide (DMSO). The
fucosynthase reaction was performed as follows: 50 μL of 100 mM sodium citrate buffer (pH 5.5)
containing 1 mg/mL ganglioside GM1, 10 mM β-FucF, and 10 μM BbAfcAN423H was incubated at
30 °C for 60 min. The reaction mixture was analyzed by thin-layer chromatography (TLC) using silica
gel 60 aluminum sheet (Merck, Darmstadt, Germany). The TLC plate was developed with a solvent
system of chloroform-methanol-0.2 % calcium chloride (60/35/8, v/v/v). The gangliosides were
visualized by heating the plate after spraying diphenylamine-aniline-phosphoric acid reagent (13). For
mass spectrometry (MS) analysis, the gangliosides were purified by using a Sep-Pak C18 cartridge
column (Waters, Milford, MA, USA) as follows: the enzyme was removed by acetone precipitation,
and the supernatant was evaporated by centrifugal concentration to dryness and reconstituted in 50 %
methanol. The samples were loaded onto the Sep-Pak C18 column pre-equilibrated with distilled water.
Bound materials, including the gangliosides, were eluted by chloroform-methanol (2:1, v/v) solution,
dried under a nitrogen stream, and subjected to matrix-assisted laser desorption/ionization-time of
flight MS (MALDI-TOF/MS) analysis as described below.
Fucosynthase reaction with XLLG and analysis of the reaction product
The reaction was carried out as follows: 100 μL of 100 mM sodium citrate buffer (pH 5.5)
containing 10 mM or 2 mM XLLG, 10 mM β-FucF, and 10 μM BbAfcAN423H was incubated at 30 °C
for 30 min. The reaction mixture was analyzed by high-performance anion exchange chromatography
with pulsed amperometric detection (HPAEC-PAD) (Thermo Fisher Scientific, Waltham, MA, USA).
CarboPac PA1 column (2 × 250 mm, Dionex, Sunnyvale, CA, USA) was used at 30 °C, and the elution
was carried out in 125 mM sodium hydroxide with a linear gradient of 0–330 mM sodium acetate for

44
20 min at a flow rate of 0.25 mL/min.
Fucosylation of glycoprotein
Prior to the fucosynthase reaction, the residual sialic acid residues of asialofetuin samples were
removed by treatment with sialidase obtained from Vibrio cholerae. Fucosynthase reaction was then
carried out as follows: 250 μL of 100 mM sodium citrate buffer (pH 5.5) with 1 mg/mL glycoprotein,
10 mM β-FucF, and 10 μM BbAfcAN423H was incubated at 30 °C for 60 min. Reaction was stopped by
boiling, and the reaction mixture was dialyzed against 10 mM Tris-HCl buffer (pH 8.0) and then
subjected to glycan analyses, as described below.
Fucosynthase reaction with PA-sugar chains and analysis of the reaction product
The reaction was carried out as follows: 60 μL of 100 mM sodium citrate buffer (pH 5.5)
containing 2 μM PA-sugar chains, 100 μM β-FucF, and 10 μM BbAfcAN423H was incubated at 30 °C
for 60 min. The reaction mixture was analyzed by high-performance liquid chromatography (HPLC).
The HPLC was carried out using Waters e2695 separation module with TSKgel amide-80 column (4.6
× 250 mm; Tosoh, Tokyo, Japan) at 40 °C. The elution was carried out with solvent A (acetonitrile/500
mM acetic acid-triethylamine containing 10 % acetonitrile (pH7.3) = 75/15) and solvent B
(acetonitrile/500 mM acetic acid-triethylamine containing 10 % acetonitrile (pH7.3) = 40/50) by a
following gradient program: the solvent B was linearly increasing from 0 % to 100 % in 100 min and
kept at 100 % for 20 min at a flow rate of 1 mL/min. The eluate was monitored by fluorescence of
excitation at 310 nm and emission at 380 nm using a Waters 2475 Multi-wavelength Fluorescence
Detector.
Lectin blot
For lectin blotting, asialofetuin samples (2 μg) were separated by sodium dodecyl sulfate-
polyacrylamide gel electrophoresis (SDS-PAGE), and then transferred onto Immobilon-P membrane
(Millipore, MA). The membrane was incubated for 60 min with blocking reagent; 2% (w/v) bovine
serum albumin in Tris-buffered saline containing 0.05 % (v/v) Tween-20 (TBS-T). The membrane was
then incubated with biotin-conjugated lectins, Ulex europaeus agglutinin I (UEA-I; J-Oil Mills, Tokyo,
Japan) or Peanut agglutinin (PNA; J-Oil Mills) (0.4 μg/mL) and horseradish peroxidase-conjugated
streptavidin (0.125 μg/mL) in blocking reagent for 60 min. The membrane was washed with TBS-T
and the signals were visualized using SuperSignal West Pico Chemiluminescent Substrate (Thermo
Fisher Scientific) and Luminescent Image Analyzer LAS-3000 (Fujifilm, Tokyo, Japan).
45
Release and separation of N-glycan from glycoproteins
N-Glycans were released from glycoproteins by PNGase F. To maximize the efficiency of
PNGase F treatment, the protein was digested to glycopeptides by trypsin in advance. The protein
sample was lyophilized, reconstituted in 200 μL of 100 mM Tris-HCl buffer (pH 8.2) containing 10
mM CaCl2, and then incubated with 5 μL of 20 mg/mL trypsin at 37 °C for 15.5 h. After incubation,
the sample was centrifuged at 15,000 rpm, 4 °C, for 10 min, and the supernatant was collected.
Residual pellet was resuspended in water, centrifuged again, and the supernatant was collected. Both
the supernatants were combined and dried by centrifugal concentration. The dried tryptic peptide was
reconstituted in 300 μL of 5 % (v/v) acetic acid, loaded onto a Sep-Pak C18 cartridge column pre-
equilibrated with 5 % acetic acid, and followed by washing with 5 % acetic acid. Bound materials
containing glycopeptides were eluted in 20 % iso-propanol in 5 % acetic acid and 40 % iso-propanol
in 5 % acetic acid. To release N-glycans from glycopeptides, the eluate was dried by a centrifugal
concentrator and reconstituted in 27 μL of distilled water and 20 μL of 100 mM sodium phosphate
buffer (pH 7.5), and then 3 μL of PNGase F was added. The solution was incubated at 37 °C for 16 h
and then dried. The sample was dissolved in 300 μL of 5 % acetic acid, and loaded on a pre-equilibrated
Sep-Pak C18 column. N-glycans released from glycopeptides were collected in a wash fraction with
5 % acetic acid, and then lyophilized and subjected to glycan permethylation, followed by MS analysis.
Glycan permethylation was performed as described in SECTION I of CHAPTER I.
Preparation of O-glycan samples
Following the separation of N-glycan released from glycoproteins on Sep-Pak C18 cartridge
columns as described above, the residual glycopeptides containing O-glycans were collected by
elution with 20 % and 40 % iso-propanol/5 % acetic acid solutions, and they were used for a
subsequent O-glycan analysis. To release the O-glycan from glycopeptides, reductive β-elimination
was performed. Glycopeptides (80–100 μg) were reconstituted in 500 μL of 100 mM sodium
hydroxide containing 1 M sodium borohydride, and the mixture was incubated at 45 °C for 18 h. After
incubation, the mixtures were placed on ice and then 10 % (v/v) acetic acid was added to neutralize
the reaction mixtures. The samples then underwent desalting on a Dowex-50W-X8 (H+ form, 100–200
m, Sigma-Aldrich) column and the pass-through and wash fractions with 5 % acetic acid were
collected and lyophilized. Residual borate was removed as an azeotrope with methanol by 0.3 mL of
10 % acetic acid in methanol, and dried under a nitrogen stream at 40 °C. To remove borate completely,
this step was repeated five times. The released oligosaccharide alditols were dissolved in 0.3 mL of
5 % acetic acid, and purified by a Sep-Pak C18 cartridge column. The flow-through fraction containing
the released oligosaccharide alditols was lyophilized and subjected to glycan permethylation, followed
by MS analysis.
46
MALDI-TOF MS analysis
Molecular masses of glycan samples were analyzed by the UltrafleXtreme instrumentation for
MALDI-TOF MS (Bruker Daltonics, Billerica, MA, USA) in the positive ion mode for permethylated
glycans, and in the negative ion mode for ganglioside GM1 and its derivatives. 2,5-Dihydroxybenzoic
acid was used as a matrix. MALDI-TOF/TOF MS was also performed to obtain MS/MS spectra of the
glycan precursor ion peaks of interest. Theoretical masses were calculated using the software
GlycoWorkbench 2.0 (14).
Determination of glycosidic linkage of fucosynthase reaction products
Positional assignment of the glycosidic linkages of the fucosyl residues introduced by the
fucosynthase reaction were performed by treatments with regio-specific enzymes, e.g. 1,2-α-L-
fucosidase (BbAfcAWT) and 1,3-1,4-α-L-fucosidase (BT_2970). 1,2-α-L-Fucosidase treatment was
performed at 37 °C in 150 μL of 100 mM sodium phosphate buffer (pH 6.5) containing 1 μM
BbAfcAWT, and 0.5 mg/mL fucosynthase-products as substrates. BT2970 treatment was performed at
37 °C in 150 μL of 100 mM 2-morpholinoethanesulfonic acid (MES) buffer containing 1.8 μM
BT_2970, and 0.5 mg/ml fucosynthase-products as substrates. After the treatments, the samples were
analyzed by MALDI-TOF MS and MALDI-TOF/TOF MS, as described earlier.
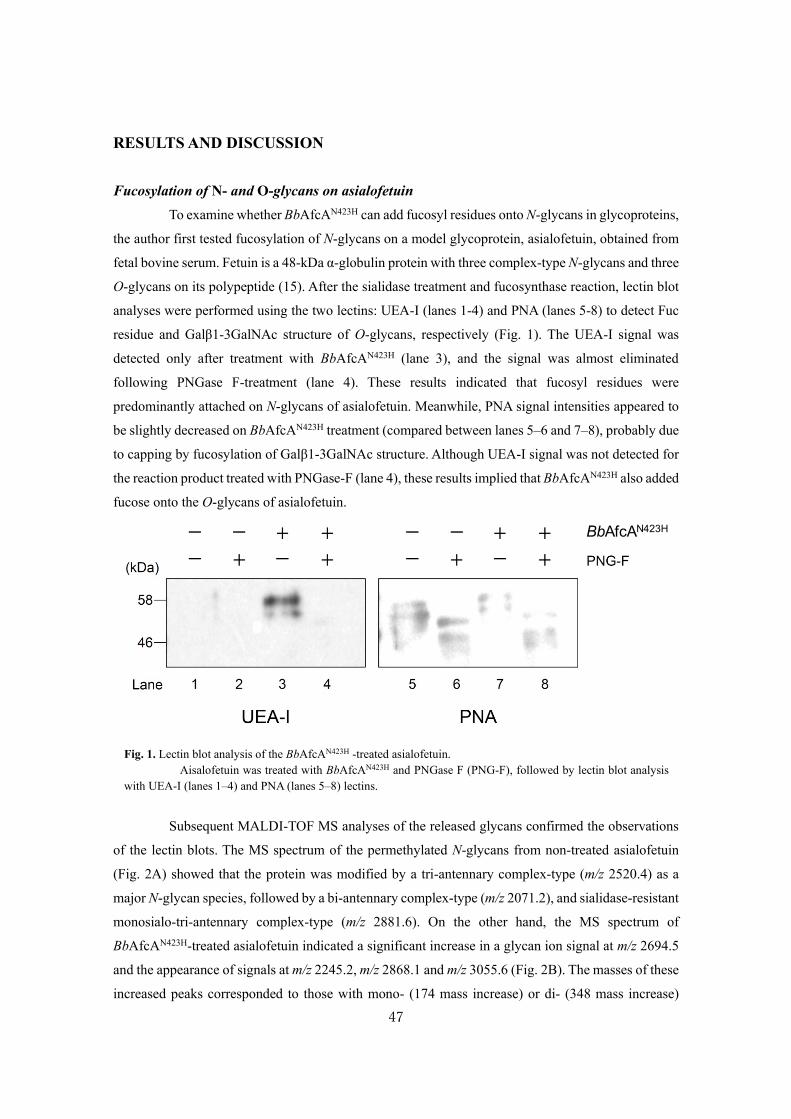
47
RESULTS AND DISCUSSION
Fucosylation of N- and O-glycans on asialofetuin
To examine whether BbAfcAN423H can add fucosyl residues onto N-glycans in glycoproteins,
the author first tested fucosylation of N-glycans on a model glycoprotein, asialofetuin, obtained from
fetal bovine serum. Fetuin is a 48-kDa α-globulin protein with three complex-type N-glycans and three
O-glycans on its polypeptide (15). After the sialidase treatment and fucosynthase reaction, lectin blot
analyses were performed using the two lectins: UEA-I (lanes 1-4) and PNA (lanes 5-8) to detect Fuc
residue and Galβ1-3GalNAc structure of O-glycans, respectively (Fig. 1). The UEA-I signal was
detected only after treatment with BbAfcAN423H (lane 3), and the signal was almost eliminated
following PNGase F-treatment (lane 4). These results indicated that fucosyl residues were
predominantly attached on N-glycans of asialofetuin. Meanwhile, PNA signal intensities appeared to
be slightly decreased on BbAfcAN423H treatment (compared between lanes 5–6 and 7–8), probably due
to capping by fucosylation of Galβ1-3GalNAc structure. Although UEA-I signal was not detected for
the reaction product treated with PNGase-F (lane 4), these results implied that BbAfcAN423H also added
fucose onto the O-glycans of asialofetuin.
Subsequent MALDI-TOF MS analyses of the released glycans confirmed the observations
of the lectin blots. The MS spectrum of the permethylated N-glycans from non-treated asialofetuin
(Fig. 2A) showed that the protein was modified by a tri-antennary complex-type (m/z 2520.4) as a
major N-glycan species, followed by a bi-antennary complex-type (m/z 2071.2), and sialidase-resistant
monosialo-tri-antennary complex-type (m/z 2881.6). On the other hand, the MS spectrum of
BbAfcAN423H-treated asialofetuin indicated a significant increase in a glycan ion signal at m/z 2694.5
and the appearance of signals at m/z 2245.2, m/z 2868.1 and m/z 3055.6 (Fig. 2B). The masses of these
increased peaks corresponded to those with mono- (174 mass increase) or di- (348 mass increase)
BbAfcAN423H
Fig. 1. Lectin blot analysis of the BbAfcAN423H -treated asialofetuin.
Aisalofetuin was treated with BbAfcAN423H and PNGase F (PNG-F), followed by lectin blot analysis
with UEA-I (lanes 1–4) and PNA (lanes 5–8) lectins.
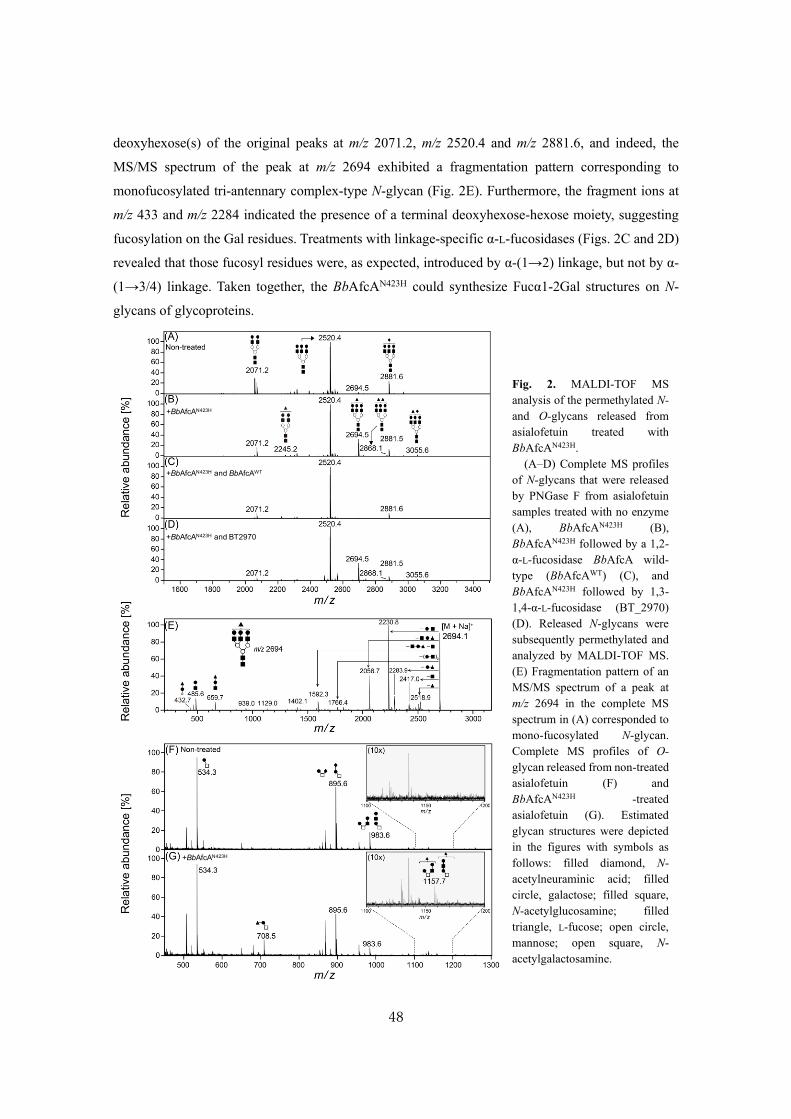
48
deoxyhexose(s) of the original peaks at m/z 2071.2, m/z 2520.4 and m/z 2881.6, and indeed, the
MS/MS spectrum of the peak at m/z 2694 exhibited a fragmentation pattern corresponding to
monofucosylated tri-antennary complex-type N-glycan (Fig. 2E). Furthermore, the fragment ions at
m/z 433 and m/z 2284 indicated the presence of a terminal deoxyhexose-hexose moiety, suggesting
fucosylation on the Gal residues. Treatments with linkage-specific α-L-fucosidases (Figs. 2C and 2D)
revealed that those fucosyl residues were, as expected, introduced by α-(1→2) linkage, but not by α-
(1→3/4) linkage. Taken together, the BbAfcAN423H could synthesize Fucα1-2Gal structures on N-
glycans of glycoproteins.
+BbAfcAN423H
+BbAfcAN423H and BbAfcAWT
+BbAfcAN423H and BT2970
+BbAfcAN423H
Fig. 2. MALDI-TOF MS
analysis of the permethylated N-
and O-glycans released from
asialofetuin treated with
BbAfcAN423H.
(A–D) Complete MS profiles
of N-glycans that were released
by PNGase F from asialofetuin
samples treated with no enzyme
(A), BbAfcAN423H (B),
BbAfcAN423H followed by a 1,2-
α-L-fucosidase BbAfcA wild-
type (BbAfcAWT) (C), and
BbAfcAN423H followed by 1,3-
1,4-α-L-fucosidase (BT_2970)
(D). Released N-glycans were
subsequently permethylated and
analyzed by MALDI-TOF MS.
(E) Fragmentation pattern of an
MS/MS spectrum of a peak at
m/z 2694 in the complete MS
spectrum in (A) corresponded to
mono-fucosylated N-glycan.
Complete MS profiles of O-
glycan released from non-treated
asialofetuin (F) and
BbAfcAN423H -treated
asialofetuin (G). Estimated
glycan structures were depicted
in the figures with symbols as
follows: filled diamond, N-
acetylneuraminic acid; filled
circle, galactose; filled square,
N-acetylglucosamine; filled
triangle, L-fucose; open circle,
mannose; open square, N-
acetylgalactosamine.

49
The efficiencies of the introduction of fucose onto the asialo-bi-antennary, asialo-, and
monosialo-tri-antennary complex-type N-glycans on asialofetuin were calculated to be 9 %, 26 %, and
20 %, respectively, based on the MS signal ion intensities. Occurrence of fucosylation seemed to be
varied among the glycan species. Therefore, the author examined the specificity of the synthase for
PA-labeled bi-, and tri-antennary complex-type N-glycans. Normal-phase HPLC analysis of the
BbAfcAN423H-treated PA-sugar chains showed newly generated two and three peaks in bi-, and tri-
antennary, respectively, in addition to the original PA-sugar chains (Fig. 3A and 3B), indicating the
addition of one to three fucose. The fucosylation efficiency reached 80 % and 81 % in bi- and tri-
antennary complex-type N-glycans, respectively, based on the consumption of the substrates. These
results indicated that BbAfcAN423H used the free bi-, and tri-antennary complex-type N-glycans at a
similar rate as the acceptor. Therefore, the varied occurrence of fucosylation on asialofetuin was
possibly due to the difference in the accessibility of the enzyme to the each glycan species. The
presence of H-antigens on N-glycans has been demonstrated in human von Willebrand factor (16).
Fucosylation of O-glycans on asialofetuin was also evidenced by MALDI-TOF MS
analysis. After the treatment of BbAfcAN423H, some new signals corresponding to the masses of
fucosylated O-glycan alditols (sodium adducts) were observed, i.e., m/z 708.5 for Fuc1Gal1GalNAc-
itol, and m/z 1157.7 for Fuc1Gal2GlcNAc1GalNAc-itol (Figs. 2F and 2G). This result may explain the
slight decrease in PNA signals in the lectin blot data.
Fig. 3. Fucosynthase reaction using PA-sugar chains as acceptors.
The reaction was carried out for PA-sugar chains of asialo-bi-antennary (A) and asialo-tri-antennary
(B) complex-type N-glycans with (+) and without (−) BbAfcAN423H (N423H). HPLC analyses of the reaction
products were performed as described in materials and methods. The part of chromatograms is shown. The peaks
of substrate (S) and products (P) are indicated by arrowheads.
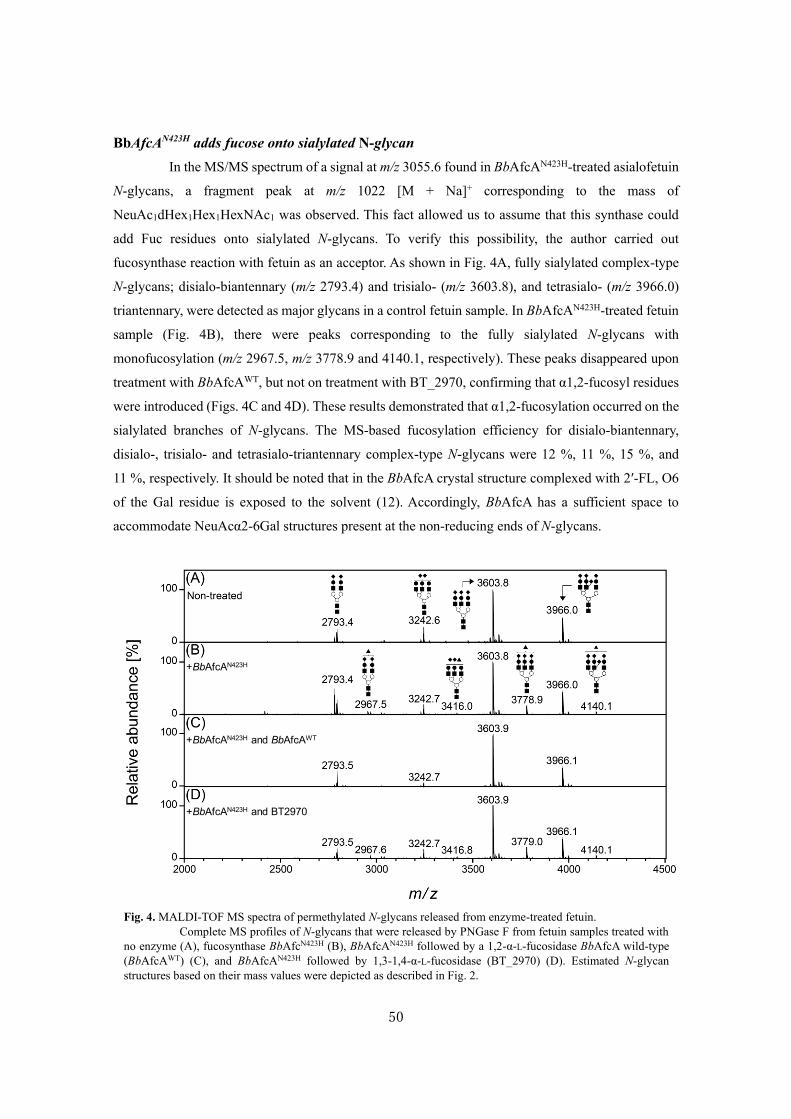
50
BbAfcAN423H adds fucose onto sialylated N-glycan
In the MS/MS spectrum of a signal at m/z 3055.6 found in BbAfcAN423H-treated asialofetuin
N-glycans, a fragment peak at m/z 1022 [M + Na]+ corresponding to the mass of
NeuAc1dHex1Hex1HexNAc1 was observed. This fact allowed us to assume that this synthase could
add Fuc residues onto sialylated N-glycans. To verify this possibility, the author carried out
fucosynthase reaction with fetuin as an acceptor. As shown in Fig. 4A, fully sialylated complex-type
N-glycans; disialo-biantennary (m/z 2793.4) and trisialo- (m/z 3603.8), and tetrasialo- (m/z 3966.0)
triantennary, were detected as major glycans in a control fetuin sample. In BbAfcAN423H-treated fetuin
sample (Fig. 4B), there were peaks corresponding to the fully sialylated N-glycans with
monofucosylation (m/z 2967.5, m/z 3778.9 and 4140.1, respectively). These peaks disappeared upon
treatment with BbAfcAWT, but not on treatment with BT_2970, confirming that α1,2-fucosyl residues
were introduced (Figs. 4C and 4D). These results demonstrated that α1,2-fucosylation occurred on the
sialylated branches of N-glycans. The MS-based fucosylation efficiency for disialo-biantennary,
disialo-, trisialo- and tetrasialo-triantennary complex-type N-glycans were 12 %, 11 %, 15 %, and
11 %, respectively. It should be noted that in the BbAfcA crystal structure complexed with 2′-FL, O6
of the Gal residue is exposed to the solvent (12). Accordingly, BbAfcA has a sufficient space to
accommodate NeuAcα2-6Gal structures present at the non-reducing ends of N-glycans.
+BbAfcAN423H
+BbAfcAN423H and BbAfcAWT
+BbAfcAN423H and BT2970
Fig. 4. MALDI-TOF MS spectra of permethylated N-glycans released from enzyme-treated fetuin.
Complete MS profiles of N-glycans that were released by PNGase F from fetuin samples treated with
no enzyme (A), fucosynthase BbAfcN423H (B), BbAfcAN423H followed by a 1,2-α-L-fucosidase BbAfcA wild-type
(BbAfcAWT) (C), and BbAfcAN423H followed by 1,3-1,4-α-L-fucosidase (BT_2970) (D). Estimated N-glycan
structures based on their mass values were depicted as described in Fig. 2.

51
Synthesis of fucosyl GM1 glycolipid
The author next examined whether this fucosynthase was able to transfer Fuc residues on to
glycolipids. GM1 ganglioside (Fig. 5A) was chosen, since fucosyl GM1 was shown to be expressed
in the mammalian digestive tract during the weaning period (17) and was also reported as a potential
marker of small-cell lung cancer and hepatocellular carcinoma (18). Fucosynthase reaction was
performed with GM1 obtained from bovine brain, and the reaction mixture was resolved by TLC
analysis. A new spot of the product was observed beneath the GM1 spot (Fig. 5B). Further MS analysis
revealed that in addition to GM1 peaks at m/z 1544.7 and m/z 1572.8, new peaks at m/z 1690.8 and
m/z 1718.8 appeared, masses of which are estimated to be that of monofucosylated GM1 gangliosides
(Figs. 5C and 5D). These peaks were eliminated on treatment with BbAfcAWT, confirming α1,2-
fucosylation on GM1 ganglioside (Fig. 5E).
BbAfcAN423H
+BbAfcAN423H
+BbAfcAN423H
and BbAfcAWT
Fig. 5. Fucosynthase reaction using
GM1 ganglioside as an acceptor.
Fucosynthase reaction
with GM1 ganglioside, the
structure of which is indicated in
(A), was performed as described in
Materials and methods, and then
analyzed by TLC (B) and MALDI-
TOF MS (C–E).
52
Fucosylation of plant-derived xyloglucan oligosaccharide
Xyloglucan is a major constituent of hemicellulosic polysaccharide in cell walls of higher
plants. XLLG has a β-(1→4) linked glucosyl backbone (β-1,4-glucan) with side chains of α-linked
Xyl and Galβ1-2Xyl residues, which are attached to the C-6 position of Glc (Fig. 6A). Fucosyl XLLGs
are present in plants and exhibit inhibiting activity for auxin-stimulated growth (19). To examine the
ability of the fucosynthase to synthesize the fucosyl XLLGs, the fucosylation reaction was carried out
with 10 mM XLLG and the reaction mixtures were analyzed by HPAEC-PAD. The product peaks were
observed in the BbAfcAN423H-treated sample (Fig. 6C). The reaction efficiency was 57% against
XLLG in this condition. MS analysis of the permethylated reaction products of the reaction with 2
mM XLLG revealed that mono- (m/z 1948.2), di- (m/z 2122.3), and tri-fucosyl XLLG (m/z 2296.0)
were generated by BbAfcAN423H treatment, although the signal intensity suggested that tri-fucosyl
XLLG was a very minor product (Fig. 6D). Fucosylation most likely occurs at C-2 position of Gal,
and could also possibly occur at the C-3 position of the reducing-end glucose in α-anomer, as
demonstrated in Fig. 16E in SECTION I of CHAPTER I. The fragmentation by MS/MS analysis of
these fucosylated XLLGs identified fragment ion peaks corresponding to m/z 1175, the presence of
which proved that the third fucosyl residue could be added onto the Glc residue at the reducing end to
synthesize a tri-fucosylated structure as shown in Fig. 6B. However, the addition of Fuc to the
reducing-end Glc of XLLG was observed only when the β-FucF (donor) concentration exceeded that
of XLLG (acceptor) considerably. Collectively, these results indicate that BbAfcAN423H is useful for
the production of fucosylated xyloglucan oligosaccharide.
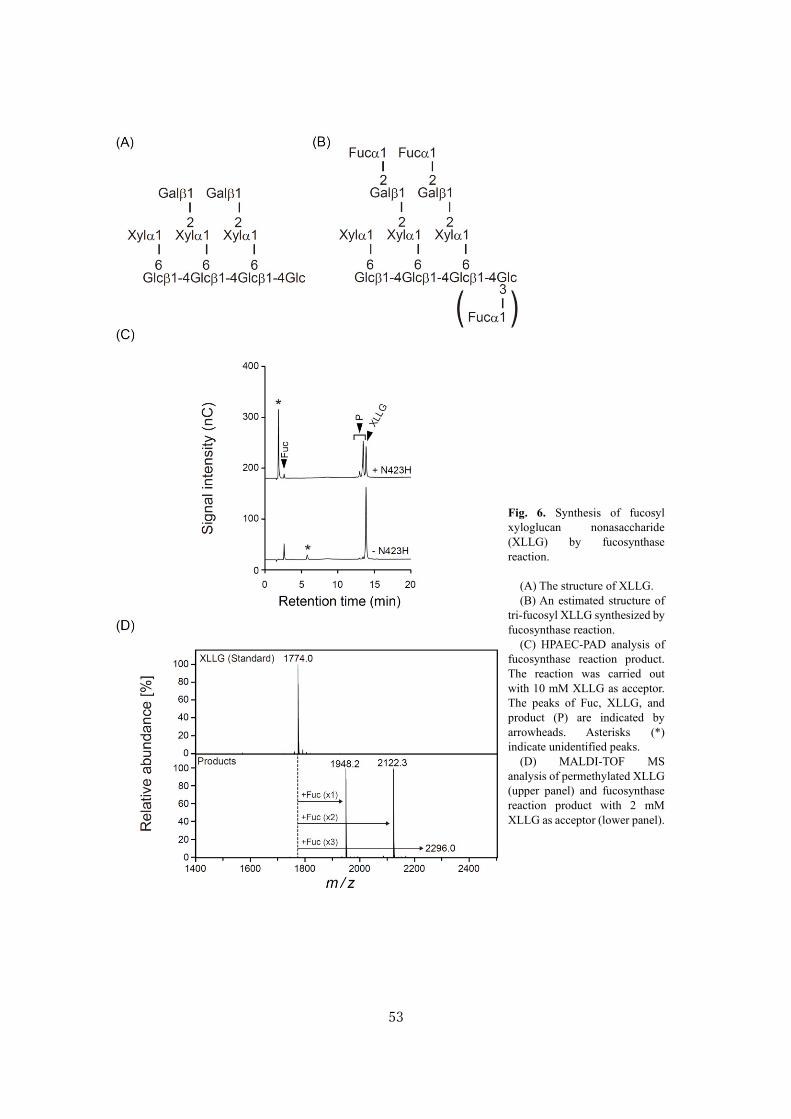
53
Fig. 6. Synthesis of fucosyl
xyloglucan nonasaccharide
(XLLG) by fucosynthase
reaction.
(A) The structure of XLLG.
(B) An estimated structure of
tri-fucosyl XLLG synthesized by
fucosynthase reaction.
(C) HPAEC-PAD analysis of
fucosynthase reaction product.
The reaction was carried out
with 10 mM XLLG as acceptor.
The peaks of Fuc, XLLG, and
product (P) are indicated by
arrowheads. Asterisks (*)
indicate unidentified peaks.
(D) MALDI-TOF MS
analysis of permethylated XLLG
(upper panel) and fucosynthase
reaction product with 2 mM
XLLG as acceptor (lower panel).

54
REFERENCES
1. Pickard, J. M., and Chervonsky, A. V. (2015) Intestinal fucose as a mediator of host-microbe
symbiosis. J Immunol 194, 5588-5593
2. Goto, Y., Obata, T., Kunisawa, J., Sato, S., Ivanov, I. I., Lamichhane, A., Takeyama, N.,
Kamioka, M., Sakamoto, M., Matsuki, T., Setoyama, H., Imaoka, A., Uematsu, S., Akira, S.,
Domino, S. E., Kulig, P., Becher, B., Renauld, J. C., Sasakawa, C., Umesaki, Y., Benno, Y.,
and Kiyono, H. (2014) Innate lymphoid cells regulate intestinal epithelial cell glycosylation.
Science 345, 1254009
3. Pham, T. A., Clare, S., Goulding, D., Arasteh, J. M., Stares, M. D., Browne, H. P., Keane, J.
A., Page, A. J., Kumasaka, N., Kane, L., Mottram, L., Harcourt, K., Hale, C., Arends, M. J.,
Gaffney, D. J., Dougan, G., Lawley, T. D., and Project, S. M. G. (2014) Epithelial IL-
22RA1-mediated fucosylation promotes intestinal colonization resistance to an
opportunistic pathogen. Cell Host Microbe 16, 504-516
4. Ruiz-Palacios, G. M., Cervantes, L. E., Ramos, P., Chavez-Munguia, B., and Newburg, D.
S. (2003) Campylobacter jejuni binds intestinal H(O) antigen (Fuc alpha 1, 2Gal beta 1,
4GlcNAc), and fucosyloligosaccharides of human milk inhibit its binding and infection. J
Biol Chem 278, 14112-14120
5. Matsuki, T., Yahagi, K., Mori, H., Matsumoto, H., Hara, T., Tajima, S., Ogawa, E., Kodama,
H., Yamamoto, K., Yamada, T., Matsumoto, S., and Kurokawa, K. (2016) A key genetic
factor for fucosyllactose utilization affects infant gut microbiota development. Nat Commun
7, 11939
6. Katayama, T. (2016) Host-derived glycans serve as selected nutrients for the gut microbe:
human milk oligosaccharides and bifidobacteria. Biosci Biotechnol Biochem 80, 621-632
7. Bode, L. (2012) Human milk oligosaccharides: every baby needs a sugar mama.
Glycobiology 22, 1147-1162
8. Zablackis, E., York, W. S., Pauly, M., Hantus, S., Reiter, W. D., Chapple, C. C., Albersheim,
P., and Darvill, A. (1996) Substitution of L-fucose by L-galactose in cell walls of
Arabidopsis mur1. Science 272, 1808-1810
9. Dumont, M., Lehner, A., Bardor, M., Burel, C., Vauzeilles, B., Lerouxel, O., Anderson, C.
T., Mollet, J. C., and Lerouge, P. (2015) Inhibition of fucosylation of cell wall components
by 2-fluoro 2-deoxy-L-fucose induces defects in root cell elongation. Plant J 84, 1137-1151
10. Wada, J., Honda, Y., Nagae, M., Kato, R., Wakatsuki, S., Katayama, T., Taniguchi, H.,
Kumagai, H., Kitaoka, M., and Yamamoto, K. (2008) 1,2-alpha-l-Fucosynthase: a
glycosynthase derived from an inverting alpha-glycosidase with an unusual reaction
mechanism. FEBS Lett 582, 3739-3743
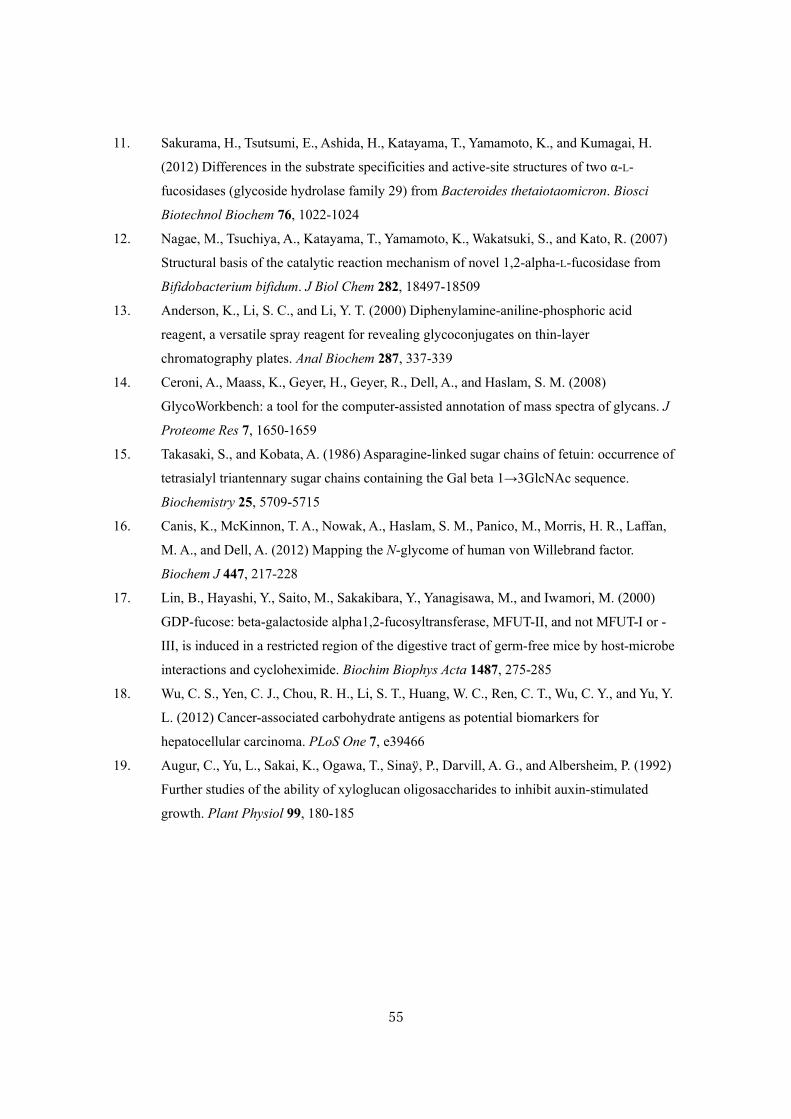
55
11. Sakurama, H., Tsutsumi, E., Ashida, H., Katayama, T., Yamamoto, K., and Kumagai, H.
(2012) Differences in the substrate specificities and active-site structures of two α-L-
fucosidases (glycoside hydrolase family 29) from Bacteroides thetaiotaomicron. Biosci
Biotechnol Biochem 76, 1022-1024
12. Nagae, M., Tsuchiya, A., Katayama, T., Yamamoto, K., Wakatsuki, S., and Kato, R. (2007)
Structural basis of the catalytic reaction mechanism of novel 1,2-alpha-L-fucosidase from
Bifidobacterium bifidum. J Biol Chem 282, 18497-18509
13. Anderson, K., Li, S. C., and Li, Y. T. (2000) Diphenylamine-aniline-phosphoric acid
reagent, a versatile spray reagent for revealing glycoconjugates on thin-layer
chromatography plates. Anal Biochem 287, 337-339
14. Ceroni, A., Maass, K., Geyer, H., Geyer, R., Dell, A., and Haslam, S. M. (2008)
GlycoWorkbench: a tool for the computer-assisted annotation of mass spectra of glycans. J
Proteome Res 7, 1650-1659
15. Takasaki, S., and Kobata, A. (1986) Asparagine-linked sugar chains of fetuin: occurrence of
tetrasialyl triantennary sugar chains containing the Gal beta 1→3GlcNAc sequence.
Biochemistry 25, 5709-5715
16. Canis, K., McKinnon, T. A., Nowak, A., Haslam, S. M., Panico, M., Morris, H. R., Laffan,
M. A., and Dell, A. (2012) Mapping the N-glycome of human von Willebrand factor.
Biochem J 447, 217-228
17. Lin, B., Hayashi, Y., Saito, M., Sakakibara, Y., Yanagisawa, M., and Iwamori, M. (2000)
GDP-fucose: beta-galactoside alpha1,2-fucosyltransferase, MFUT-II, and not MFUT-I or -
III, is induced in a restricted region of the digestive tract of germ-free mice by host-microbe
interactions and cycloheximide. Biochim Biophys Acta 1487, 275-285
18. Wu, C. S., Yen, C. J., Chou, R. H., Li, S. T., Huang, W. C., Ren, C. T., Wu, C. Y., and Yu, Y.
L. (2012) Cancer-associated carbohydrate antigens as potential biomarkers for
hepatocellular carcinoma. PLoS One 7, e39466
19. Augur, C., Yu, L., Sakai, K., Ogawa, T., Sinaÿ, P., Darvill, A. G., and Albersheim, P. (1992)
Further studies of the ability of xyloglucan oligosaccharides to inhibit auxin-stimulated
growth. Plant Physiol 99, 180-185
56
SUMMARY
In SECTION I of CHAPTER I, the author generated a highly functional 1,2-α-L-
fucosynthase (BbAfcA N423H) by protein engineering of 1,2-α-L-fucosidase from Bifidobacterium
bifidum JCM 1254. This synthase could specifically introduce H-antigens (Fucα1-2Gal) into the non-
reducing ends of oligosaccharides and in O-linked glycans in mucin glycoprotein. In this SECTION,
the author showed an extended application of the BbAfcAN423H by demonstrating its ability to insert
Fuc residues into N- and O-glycans in fetuin glycoproteins, GM1 ganglioside, and a plant-derived
xyloglucan nonasaccharide. This application study broadens the feasibility of this novel H-antigen
synthesis technique in functional glycomics.
57
CHAPTER II
Analysis of polyamine biosynthetic and transport ability of human gut microbes
SECTION I
Analysis of polyamine biosynthetic and transport ability
of the dominant human gut microbes
and prediction of the presence of novel polyamine biosynthetic and transport
proteins
Polyamines (putrescine [Put], spermidine [Spd], spermine [Spm]) are aliphatic amines
possessing two or more amino groups. They are widely distributed in eukaryotic (1) and prokaryotic
cells (2). In the mammalian colonic lumen, polyamines are present at millimolar concentrations (3),
and it was previously reported that these polyamines are derived from gut microbes (4-6). Polyamines
in the colonic lumen are transferred into the bloodstream via the colonic mucosa (7), after which they
have various effects on the body. For example, high concentrations of polyamines are found in cancer
cells because of their role in cell proliferation. The possibility of treating cancer by reducing gut
microbial polyamine levels via administration of antibiotics is being investigated (8). However,
polyamines in the intestinal tract have various beneficial effects on mammalian health, such as
increased longevity (7,9), recovery of injured mucosa (10), and favorable effects on cognitive function
(7). As intestinal polyamines are derived from gut microbes, colonic luminal polyamine concentration
is determined by microbial polyamine metabolism. The known pathways for microbial polyamine
biosynthesis and transport are summarized in Fig.1 (11-14). Kibe et al. reported that even though Put
increased in the colonic lumen, the abundance of known Put biosynthetic genes (speB, adi, and ncpah;
Fig. 1) were unchanged in mice gut microbiota (7). These results suggest that in addition to the
previously described polyamine biosynthetic pathway (Fig.1), there is a novel gene or set of genes
facilitating Put biosynthesis in the gut microbes. Therefore, identification of new genes for polyamine
biosynthesis and transport is indispensable for optimization of polyamine concentrations in human
colonic lumen, enabled by regulation of genes facilitating polyamine metabolism in gut microbes.
A “human gut microbial gene catalog” ranking the dominant microbial species/genera in the
human gut has been described (15). Recently, Gotoh et al. reported that Gifu anaerobic medium
(GAM) was useful for the cultivation of 32 species of dominant human gut microbes and for
comparison of their metabolite profiles (16). The polyamine concentration in stationary phases of
Alistipes (17), Bacteroides (17,18) and Parabacteroides (17) species, which are members of human
gut microbes, have been previously reported. However, in some microbes, the polyamine profile in
cells and in culture supernatants differ based on their growth phase (19,20): cellular polyamine

58
concentration is higher in growing phase than that in stationary phase, probably because polyamines
are important for cell proliferation. Therefore, the measurement of polyamine concentrations in the
cell and culture supernatant in different growth phases is necessary for a better insight into microbial
polyamine biosynthetic and transport activity. Furthermore, polyamine biosynthesis and transport
should be analyzed in dominant human gut microbial species other than those belonging to the
Alistipes, Bacteroides and Parabacteroides genera (Table 1) for a comprehensive understanding of
polyamine homeostasis in the human intestinal lumen.
In the present study, the author measured polyamine concentration in the cell and culture
supernatants of 32 species of dominant human gut microbes cultured in GAM at different growth
AdoMetDC(SpeD) SPDSyn
(SpeE)
NCPAH
PCT
(AguB)
SAM
ADC
(SpeA/AdiA)
AguD PlaP PuuP PotFGHI PotE
APAUH
AAT
ORN
NCP PUT
SPD
CSPD
ASA
APAGM
Urea
Urea
Phosphate
Carbamoyl
phosphate
CO2 + NH3
NH3
CO2
CO2
CO2
CO2
AGM
PotABCD MdtJI
dcSAM
ARG
MTA
SapBCDF
Fig. 1. Polyamine biosynthetic and transport pathways in microbes.
Polyamine biosynthetic and transport pathways previously described in microbes are integrated and illustrated. Gray squares
indicate transporters (importer, antiporter, and exporter) that were previously reported in Escherichia coli or Enterococcus faecalis. Black squares
with white letters show abbreviated names of enzymes experimentally identified in E. coli, En. faecalis, B. thetaiotaomicron, Thermus
thermophilus, Vibrio cholerae, or Pseudomonas aeruginosa. The abbreviations used are as follows: AAT, agmatine aminopropyltransferase (21);
ADC, arginine decarboxylase (22,23); ADI, agmatine deiminase (24); AdoMetDC, S-adenosylmethionine decarboxylase (25); AGM, agmatine;
AguD, putrescine-agmatine antiporter (26); APAGM, aminopropylagmatine; APAUH, aminopropylagmatine ureohydrolase (21); ARG, arginine;
ASA, aspartate-β-semialdehyde; AUH, agmatine ureohydrolase (27); CASDC, carboxyspermidine decarboxylase (19,20,28); CASDH,
carboxyspermidine dehydrogenase (19,28); CSPD, carboxyspermidine; dcSAM, decarboxylated S-adenosylmethionine; MdtJI, spermidine
exporter (29); MTA, 5ʹ-deoxy-5ʹ-methylthioadenosine; NCP, N-carbamoylputrescine; NCPAH, N-carbamoylputrescine amidohydrolase (30);
ODC, ornithine decarboxylase (31,32); ORN, ornithine; PCT, putrescine carbamoyltransferase (24); PlaP, low-affinity putrescine importer (33);
PotABCD, ATP-binding cassette type spermidine preferential importer (34); PotE, putrescine-ornithine antiporter (35,36); PotFGHI, ATP-binding
cassette type putrescine specific importer (37); PUT, putrescine; PuuP, high-affinity putrescine importer (38); SAM, S-adenosylmethionine;
SapBCDF, putrescine exporter (see SECTION III of CHAPTER II); SPD, spermidine; SPDSyn, spermidine synthase (39).

59
phases. Furthermore, by using in silico analysis, the author estimated the possibility of gut microbes
harboring the novel polyamine biosynthetic and transport proteins.

60
MATERIALS AND METHODS
Materials
GAM bouillon, putrescine dihydrochloride, spermidine trihydrochloride, and spermine
tetrahydrochloride were purchased from Nissui pharmaceuticals (Tokyo, Japan), Wako Pure
Chemicals (Osaka, Japan), Nacalai Tesque (Kyoto, Japan), and MP Biomedicals (Solon, OH),
respectively.
Strains and growth conditions
Microbial strains were obtained from the Japan Collection of Microorganisms (JCM), the
American Type Culture Collection (ATCC), and the German Collection of Microorganisms and
Cultures (DSMZ). Microbial strains used in this study are listed in Table 1. The conditions used for
their cultivation have been previously described (16).
Analysis of polyamine concentrations in cells and culture supernatants
Polyamine concentrations were measured by high-performance liquid chromatography
(HPLC); the analytical conditions were the same as those described previously (20). For analyzing the
relationship between the growth stages and polyamine concentrations in cells and culture supernatants,
cultures in growing and stationary phases were obtained at an indicated time (Fig. 2). Culture
supernatants and cells for the quantification of polyamines were obtained in the previous report (16).
Samples for measuring polyamine concentrations in cells and in culture supernatants by HPLC were
prepared as described previously (20). To minimize the effect of residual polyamines in GAM in the
cell pellet, culture supernatants were completely removed from the cell pellets, resulting in some cells
being discarded. Therefore, intracellular polyamine levels were normalized to the amount of cellular
protein and expressed as nmol/mg protein.
Search of occurrence of genes by BLAST analysis
Protein BLAST (BlastP) analysis (40) was performed against proteomes of all gut microbial
species. Proteins whose functions were demonstrated by experimentation were used as query proteins
for BlastP analysis; these query proteins are listed in Table 2. Proteins with more than 100-, 300-, and
500-bit scores were extracted.
Statistics
Values are indicated as mean ± standard deviation (SD). The significant differences were
analyzed by using SPSS® software version 21 (IBM, Armonk, NY).
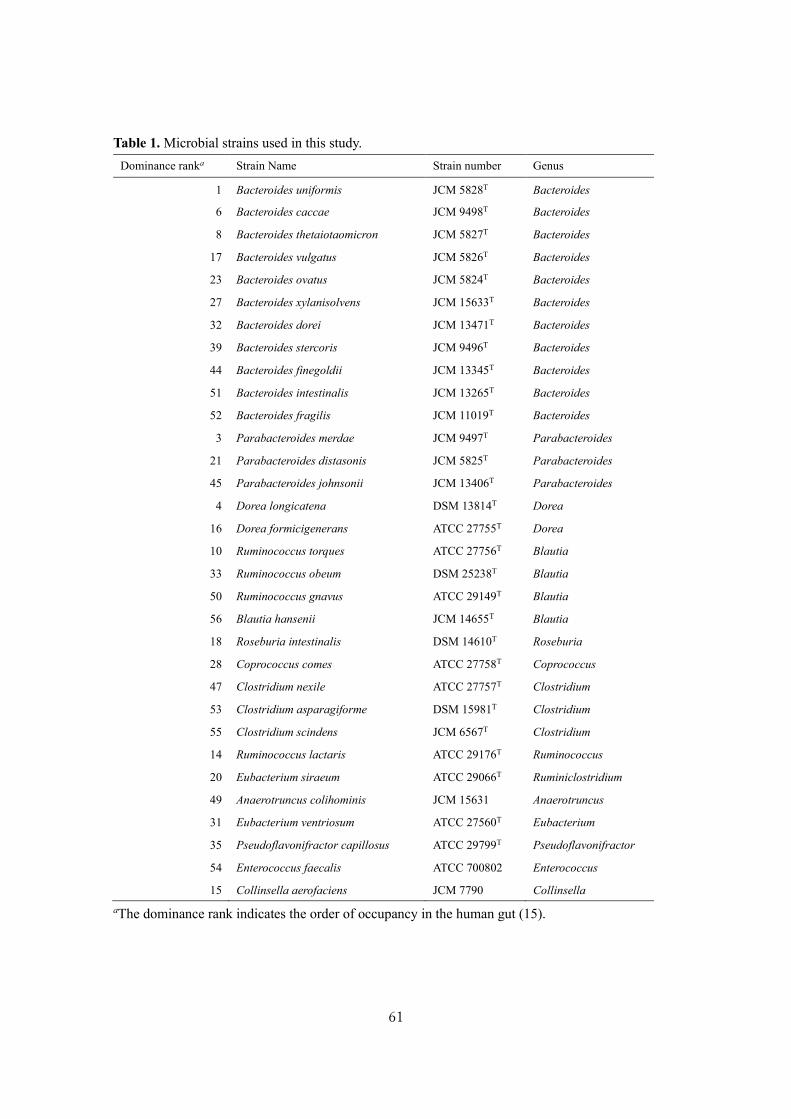
61
Table 1. Microbial strains used in this study.
Dominance ranka Strain Name Strain number Genus
1 Bacteroides uniformis JCM 5828T Bacteroides
6 Bacteroides caccae JCM 9498T Bacteroides
8 Bacteroides thetaiotaomicron JCM 5827T Bacteroides
17 Bacteroides vulgatus JCM 5826T Bacteroides
23 Bacteroides ovatus JCM 5824T Bacteroides
27 Bacteroides xylanisolvens JCM 15633T Bacteroides
32 Bacteroides dorei JCM 13471T Bacteroides
39 Bacteroides stercoris JCM 9496T Bacteroides
44 Bacteroides finegoldii JCM 13345T Bacteroides
51 Bacteroides intestinalis JCM 13265T Bacteroides
52 Bacteroides fragilis JCM 11019T Bacteroides
3 Parabacteroides merdae JCM 9497T Parabacteroides
21 Parabacteroides distasonis JCM 5825T Parabacteroides
45 Parabacteroides johnsonii JCM 13406T Parabacteroides
4 Dorea longicatena DSM 13814T Dorea
16 Dorea formicigenerans ATCC 27755T Dorea
10 Ruminococcus torques ATCC 27756T Blautia
33 Ruminococcus obeum DSM 25238T Blautia
50 Ruminococcus gnavus ATCC 29149T Blautia
56 Blautia hansenii JCM 14655T Blautia
18 Roseburia intestinalis DSM 14610T Roseburia
28 Coprococcus comes ATCC 27758T Coprococcus
47 Clostridium nexile ATCC 27757T Clostridium
53 Clostridium asparagiforme DSM 15981T Clostridium
55 Clostridium scindens JCM 6567T Clostridium
14 Ruminococcus lactaris ATCC 29176T Ruminococcus
20 Eubacterium siraeum ATCC 29066T Ruminiclostridium
49 Anaerotruncus colihominis JCM 15631 Anaerotruncus
31 Eubacterium ventriosum ATCC 27560T Eubacterium
35 Pseudoflavonifractor capillosus ATCC 29799T Pseudoflavonifractor
54 Enterococcus faecalis ATCC 700802 Enterococcus
15 Collinsella aerofaciens JCM 7790 Collinsella
aThe dominance rank indicates the order of occupancy in the human gut (15).

62
Table 2. Query proteins used for BlastP analysis.
Protein name
Description Genbank no. Reference
Query proteins involved in polyamine biosynthesis
AAT Agmatine aminopropyltransferase YP_144090 (21)
ADC
(AdiA) Arginine decarboxylase NP_418541 (23)
ADI
(AguA) Agmatine deiminase NP_814483 (24)
PCT
(AguB) Putrescine carbamoyltransferase EOT48407 (24)
APAUH Aminopropylagmatine ureohydrolase YP_144395 (21)
CASDC Carboxyspermidine decarboxylase NP_809587 (20)
CASDH Carboxyspermidine dehydrogenase WP_000025713 (28)
NCPAH N-Carbamoylputrescine amidohydrolase NP_248984 (30)
ADC
(SpeA) Arginine decarboxylase NP_417413 (22)
AUH
(SpeB) Agmatine ureohydrolase NP_417412 (27)
ODC
(SpeC) Ornithine decarboxylase NP_417440 (32)
AdoMetDC
(SpeD) S-Adenosylmethionine decarboxylase NP_414662 (25)
SPDsyn
(SpeE) Spermidine synthase NP_414663 (39)
ODC
(SpeF) Ornithine decarboxylase NP_415220 (31)
Query proteins involved in polyamine transport
AguD Agmatine/putrescine antiporter NP_814482 (26)
MdtI Membrane subunit of spermidine efflux transporter MdtJI NP_416116 (29)
MdtJ Membrane subunit of spermidine efflux transporter MdtJI NP_416117 (29)
PlaP Putrescine/H+ symporter NP_416518 (33)
PotA ATP-binding protein of spermidine ATP-binding cassette transporter PotABCD NP_415644 (34)
PotB Permease of spermidine ATP-binding cassette transporter PotABCD NP_415643 (34)
PotC Permease of spermidine ATP-binding cassette transporter PotABCD NP_415642 (34)
PotD Substrate-binding protein of spermidine ATP-binding cassette transporter PotABCD NP_415641 (34)
PotE Ornithine-putrescine antiporter ALI41513 (35)
PotF Substrate-binding protein of putrescine ATP-binding cassette transporter PotFGHI NP_415375 (37)
PotG ATP-binding protein of putrescine ATP-binding cassette transporter PotFGHI NP_415376 (37)
PotH Permease of putrescine ATP-binding cassette transporter PotFGHI NP_415377 (37)
PotI Permease of putrescine ATP-binding cassette transporter PotFGHI NP_415378 (37)
PuuP Putrescine/H+ symporter NP_415812 (38)
SapB Permease of putrescine ATP-binding cassette exporter SapBCDF NP_415809 (41)
SapC Permease of putrescine ATP-binding cassette exporter SapBCDF NP_415808 (41)
SapD ATP-binding protein of putrescine ATP-binding cassette exporter SapBCDF NP_415807 (41)
SapF ATP-binding protein of putrescine ATP-binding cassette exporter SapBCDF NP_415806 (41)
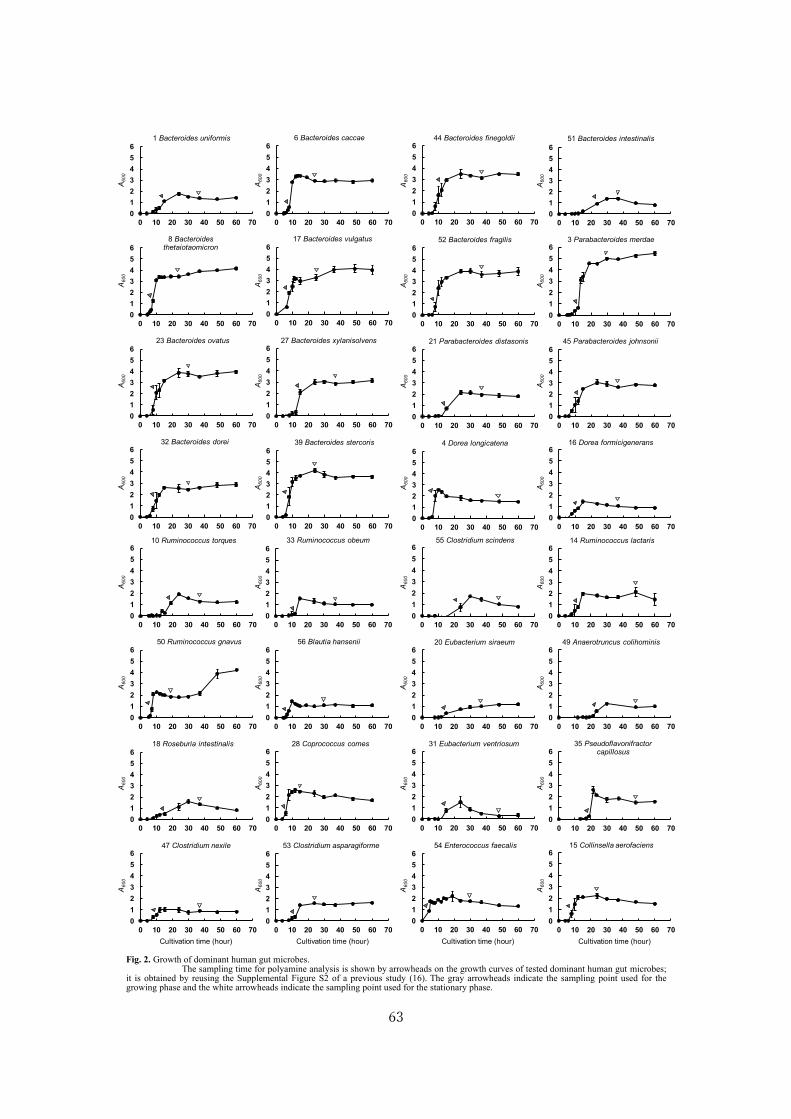
63
0
1
2
3
4
5
6
0 10 20 30 40 50 60 70
6 Bacteroides caccae
0
1
2
3
4
5
6
0 10 20 30 40 50 60 70
1 Bacteroides uniformis
0
1
2
3
4
5
6
0 10 20 30 40 50 60 70
8 Bacteroidesthetaiotaomicron
0
1
2
3
4
5
6
0 10 20 30 40 50 60 70
27 Bacteroides xylanisolvens
0
1
2
3
4
5
6
0 10 20 30 40 50 60 70
23 Bacteroides ovatus
0
1
2
3
4
5
6
0 10 20 30 40 50 60 70
39 Bacteroides stercoris
0
1
2
3
4
5
6
0 10 20 30 40 50 60 70
32 Bacteroides dorei
A6
00
A6
00
A6
00
A6
00
Cultivation time (hour) Cultivation time (hour)
0
1
2
3
4
5
6
0 10 20 30 40 50 60 70
17 Bacteroides vulgatus
A6
00
A6
00
A6
00
A6
00
A6
00
A6
00
A6
00
A6
00
Cultivation time (hour) Cultivation time (hour)
0
1
2
3
4
5
6
0 10 20 30 40 50 60 70
21 Parabacteroides distasonis
0
1
2
3
4
5
6
0 10 20 30 40 50 60 70
44 Bacteroides finegoldii
0
1
2
3
4
5
6
0 10 20 30 40 50 60 70
51 Bacteroides intestinalis
0
1
2
3
4
5
6
0 10 20 30 40 50 60 70
52 Bacteroides fragilis
0
1
2
3
4
5
6
0 10 20 30 40 50 60 70
3 Parabacteroides merdae
0
1
2
3
4
5
6
0 10 20 30 40 50 60 70
45 Parabacteroides johnsonii
0
1
2
3
4
5
6
0 10 20 30 40 50 60 70
4 Dorea longicatena
0
1
2
3
4
5
6
0 10 20 30 40 50 60 70
16 Dorea formicigenerans
A6
00
A6
00
A6
00
A6
00
A6
00
A6
00
A6
00
A6
00
Cultivation time (hour) Cultivation time (hour)
0
1
2
3
4
5
6
0 10 20 30 40 50 60 70
33 Ruminococcus obeum
0
1
2
3
4
5
6
0 10 20 30 40 50 60 70
47 Clostridium nexile
0
1
2
3
4
5
6
0 10 20 30 40 50 60 70
10 Ruminococcus torques
0
1
2
3
4
5
6
0 10 20 30 40 50 60 70
50 Ruminococcus gnavus
0
1
2
3
4
5
6
0 10 20 30 40 50 60 70
18 Roseburia intestinalis
0
1
2
3
4
5
6
0 10 20 30 40 50 60 70
56 Blautia hansenii
0
1
2
3
4
5
6
0 10 20 30 40 50 60 70
28 Coprococcus comes
0
1
2
3
4
5
6
0 10 20 30 40 50 60 70
53 Clostridium asparagiforme
A6
00
A6
00
A6
00
A6
00
A6
00
A6
00
A6
00
A6
00
Cultivation time (hour) Cultivation time (hour)
0
1
2
3
4
5
6
0 10 20 30 40 50 60 70
49 Anaerotruncus colihominis
0
1
2
3
4
5
6
0 10 20 30 40 50 60 70
54 Enterococcus faecalis
0
1
2
3
4
5
6
0 10 20 30 40 50 60 70
55 Clostridium scindens
0
1
2
3
4
5
6
0 10 20 30 40 50 60 70
14 Ruminococcus lactaris
0
1
2
3
4
5
6
0 10 20 30 40 50 60 70
20 Eubacterium siraeum
0
1
2
3
4
5
6
0 10 20 30 40 50 60 70
15 Collinsella aerofaciens
0
1
2
3
4
5
6
0 10 20 30 40 50 60 70
35 Pseudoflavonifractor capillosus
0
1
2
3
4
5
6
0 10 20 30 40 50 60 70
31 Eubacterium ventriosum
A6
00
A6
00
A6
00
A6
00
Fig. 2. Growth of dominant human gut microbes. The sampling time for polyamine analysis is shown by arrowheads on the growth curves of tested dominant human gut microbes; it is obtained by reusing the Supplemental Figure S2 of a previous study (16). The gray arrowheads indicate the sampling point used for the growing phase and the white arrowheads indicate the sampling point used for the stationary phase.
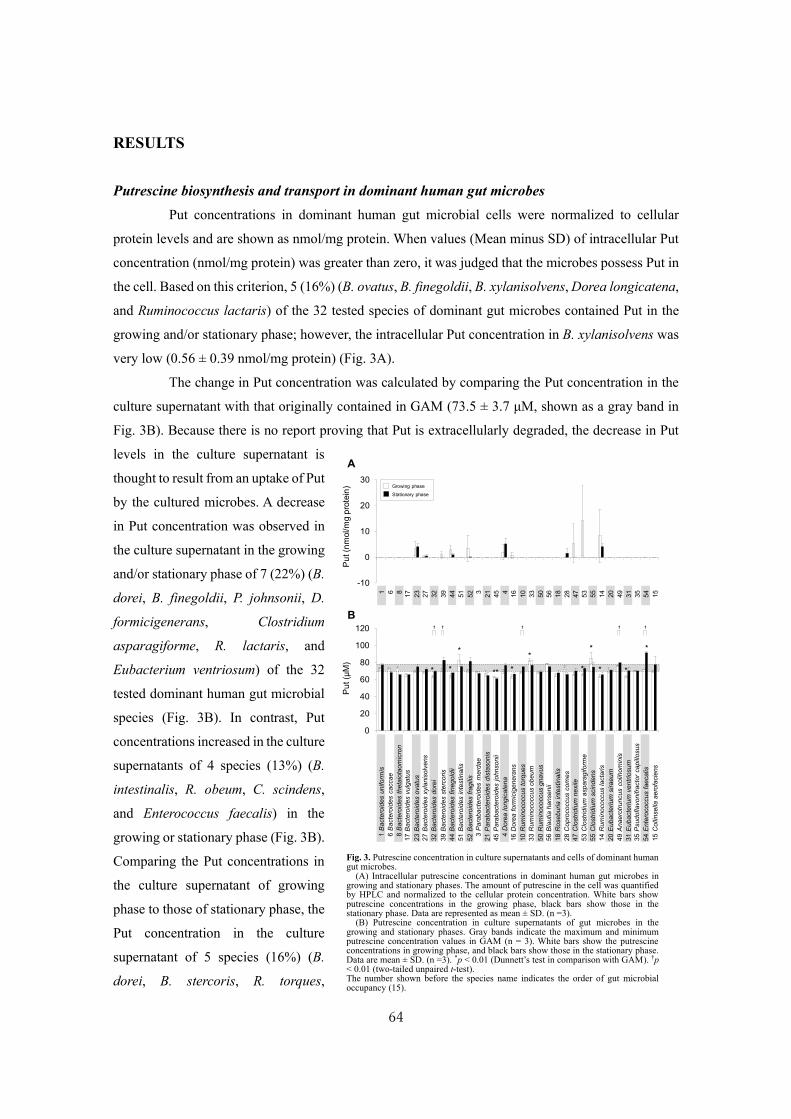
64
RESULTS
Putrescine biosynthesis and transport in dominant human gut microbes
Put concentrations in dominant human gut microbial cells were normalized to cellular
protein levels and are shown as nmol/mg protein. When values (Mean minus SD) of intracellular Put
concentration (nmol/mg protein) was greater than zero, it was judged that the microbes possess Put in
the cell. Based on this criterion, 5 (16%) (B. ovatus, B. finegoldii, B. xylanisolvens, Dorea longicatena,
and Ruminococcus lactaris) of the 32 tested species of dominant gut microbes contained Put in the
growing and/or stationary phase; however, the intracellular Put concentration in B. xylanisolvens was
very low (0.56 ± 0.39 nmol/mg protein) (Fig. 3A).
The change in Put concentration was calculated by comparing the Put concentration in the
culture supernatant with that originally contained in GAM (73.5 ± 3.7 μM, shown as a gray band in
Fig. 3B). Because there is no report proving that Put is extracellularly degraded, the decrease in Put
levels in the culture supernatant is
thought to result from an uptake of Put
by the cultured microbes. A decrease
in Put concentration was observed in
the culture supernatant in the growing
and/or stationary phase of 7 (22%) (B.
dorei, B. finegoldii, P. johnsonii, D.
formicigenerans, Clostridium
asparagiforme, R. lactaris, and
Eubacterium ventriosum) of the 32
tested dominant human gut microbial
species (Fig. 3B). In contrast, Put
concentrations increased in the culture
supernatants of 4 species (13%) (B.
intestinalis, R. obeum, C. scindens,
and Enterococcus faecalis) in the
growing or stationary phase (Fig. 3B).
Comparing the Put concentrations in
the culture supernatant of growing
phase to those of stationary phase, the
Put concentration in the culture
supernatant of 5 species (16%) (B.
dorei, B. stercoris, R. torques,
-10
0
10
20
30
0
20
40
60
80
100
120
Pu
t (μ
M)
Pu
t (n
mol/m
g p
rote
in)
15 C
olli
nsella
aero
facie
ns
54 E
nte
rococcus f
aecalis
1 B
acte
roid
es
uniform
is
6 B
acte
roid
es
caccae
8 B
acte
roid
es
theta
iota
om
icro
n
17 B
acte
roid
es
vulg
atu
s
16 D
ore
afo
rmic
igenera
ns
4 D
ore
alo
ngic
ate
na
45 P
ara
bacte
roid
es j
ohnsonii
21 P
ara
bacte
roid
es d
ista
sonis
3 P
ara
bacte
roid
es m
erd
ae
52 B
acte
roid
es
fragili
s
51 B
acte
roid
es
inte
stinalis
44 B
acte
roid
es
finegold
ii
39 B
acte
roid
es
ste
rcoris
32 B
acte
roid
es
dore
i
27 B
acte
roid
es
xyla
nis
olv
ens
23 B
acte
roid
es
ovatu
s
10 R
um
inococcus
torq
ues
20 E
ubacte
rium
siraeum
14 R
um
inococcus
lacta
ris
55 C
lostr
idiu
m s
cin
dens
53 C
lostr
idiu
m a
spara
giform
e
47 C
lostr
idiu
m n
exile
28 C
opro
coccus
com
es
18 R
oseburia
inte
stinalis
56 B
lautia
hansenii
50 R
um
inococcus
gnavus
33 R
um
inococcus
obeum
31 E
ubacte
rium
ventr
iosum
49 A
naero
truncus
colih
om
inis
35 P
sudoflavonifra
cto
rcapill
osus
15
541 6 8
17
164
45
213
52
51
44
39
32
27
23
10
20
14
55
53
47
28
18
56
50
33
31
49
35
** **
*
* *
*
**
**
A
B†† † † †
Growing phase
Stationary phase
Fig. 3. Putrescine concentration in culture supernatants and cells of dominant human gut microbes.
(A) Intracellular putrescine concentrations in dominant human gut microbes in growing and stationary phases. The amount of putrescine in the cell was quantified by HPLC and normalized to the cellular protein concentration. White bars show putrescine concentrations in the growing phase, black bars show those in the stationary phase. Data are represented as mean ± SD. (n =3).
(B) Putrescine concentration in culture supernatants of gut microbes in the growing and stationary phases. Gray bands indicate the maximum and minimum putrescine concentration values in GAM (n = 3). White bars show the putrescine concentrations in growing phase, and black bars show those in the stationary phase. Data are mean ± SD. (n =3). *p < 0.01 (Dunnett’s test in comparison with GAM). †p < 0.01 (two-tailed unpaired t-test). The number shown before the species name indicates the order of gut microbial occupancy (15).
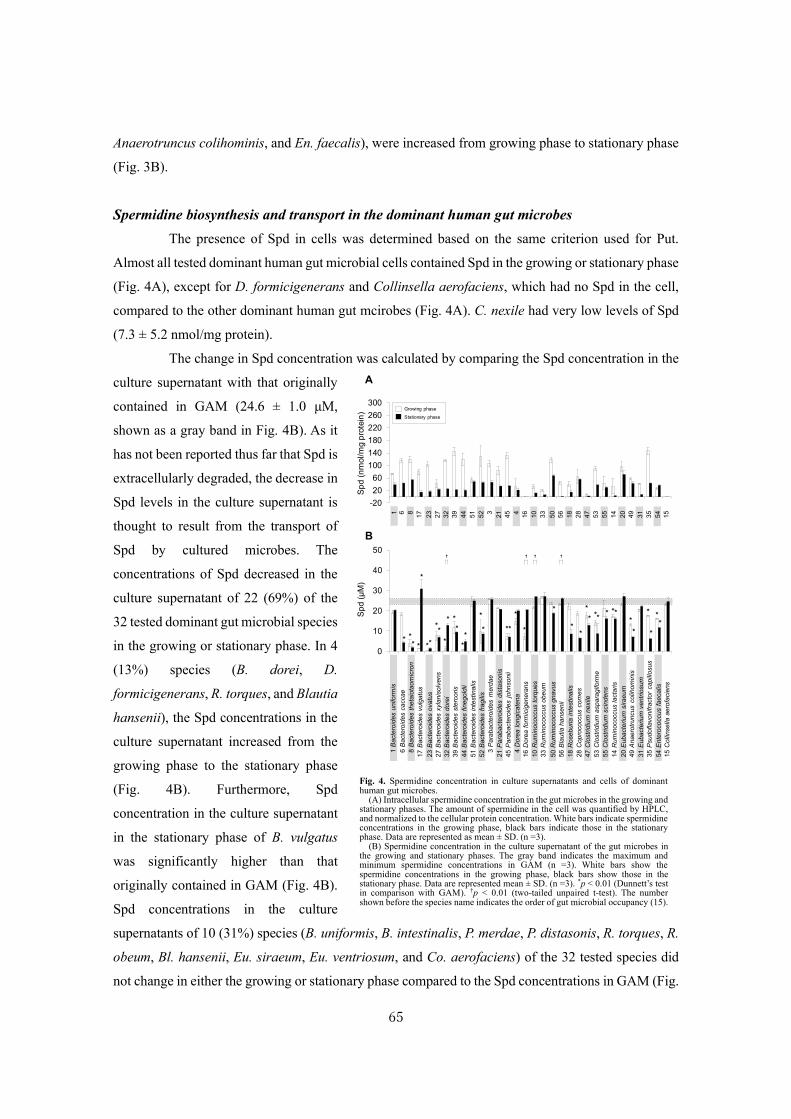
65
Anaerotruncus colihominis, and En. faecalis), were increased from growing phase to stationary phase
(Fig. 3B).
Spermidine biosynthesis and transport in the dominant human gut microbes
The presence of Spd in cells was determined based on the same criterion used for Put.
Almost all tested dominant human gut microbial cells contained Spd in the growing or stationary phase
(Fig. 4A), except for D. formicigenerans and Collinsella aerofaciens, which had no Spd in the cell,
compared to the other dominant human gut mcirobes (Fig. 4A). C. nexile had very low levels of Spd
(7.3 ± 5.2 nmol/mg protein).
The change in Spd concentration was calculated by comparing the Spd concentration in the
culture supernatant with that originally
contained in GAM (24.6 ± 1.0 μM,
shown as a gray band in Fig. 4B). As it
has not been reported thus far that Spd is
extracellularly degraded, the decrease in
Spd levels in the culture supernatant is
thought to result from the transport of
Spd by cultured microbes. The
concentrations of Spd decreased in the
culture supernatant of 22 (69%) of the
32 tested dominant gut microbial species
in the growing or stationary phase. In 4
(13%) species (B. dorei, D.
formicigenerans, R. torques, and Blautia
hansenii), the Spd concentrations in the
culture supernatant increased from the
growing phase to the stationary phase
(Fig. 4B). Furthermore, Spd
concentration in the culture supernatant
in the stationary phase of B. vulgatus
was significantly higher than that
originally contained in GAM (Fig. 4B).
Spd concentrations in the culture
supernatants of 10 (31%) species (B. uniformis, B. intestinalis, P. merdae, P. distasonis, R. torques, R.
obeum, Bl. hansenii, Eu. siraeum, Eu. ventriosum, and Co. aerofaciens) of the 32 tested species did
not change in either the growing or stationary phase compared to the Spd concentrations in GAM (Fig.
-20
20
60
100
140
180
220
260
300
0
10
20
30
40
50
Sp
d(n
mol/m
g p
rote
in)
Sp
d(μ
M)
15 C
olli
nsella
aero
facie
ns
54 E
nte
rococcus f
aecalis
8 B
acte
roid
es
theta
iota
om
icro
n
17 B
acte
roid
es
vulg
atu
s
16 D
ore
afo
rmic
igenera
ns
4 D
ore
alo
ngic
ate
na
45 P
ara
bacte
roid
es j
ohnsonii
21 P
ara
bacte
roid
es d
ista
sonis
3 P
ara
bacte
roid
es m
erd
ae
52 B
acte
roid
es
fragili
s
51 B
acte
roid
es
inte
stinalis
44 B
acte
roid
es
finegold
ii
39 B
acte
roid
es
ste
rcoris
32 B
acte
roid
es
dore
i
27 B
acte
roid
es
xyla
nis
olv
ens
23 B
acte
roid
es
ovatu
s
10 R
um
inococcus
torq
ues
20 E
ubacte
rium
siraeum
14 R
um
inococcus
lacta
ris
55 C
lostr
idiu
m s
cin
dens
53 C
lostr
idiu
m a
spara
giform
e
47 C
lostr
idiu
m n
exile
28 C
opro
coccus
com
es
18 R
oseburia
inte
stinalis
56 B
lautia
hansenii
50 R
um
inococcus
gnavus
33
Rum
inococcus
obeum
31 E
ubacte
rium
ventr
iosum
49 A
naero
truncus
colih
om
inis
35 P
sudoflavonifra
cto
rcapill
osus
6 B
acte
roid
es
caccae
1 B
acte
roid
es
uniform
is
15
548
17
164
45
213
52
51
44
39
32
27
23
10
20
14
55
53
47
28
18
56
50
33
31
49
3561
**
*
***
* **
*
*
*
*
**
** *
*
*
*
*
*
*
***
* *
*
*
*
** **
*
A
B
† † ††
Growing phase
Stationary phase
Fig. 4. Spermidine concentration in culture supernatants and cells of dominant human gut microbes.
(A) Intracellular spermidine concentration in the gut microbes in the growing and stationary phases. The amount of spermidine in the cell was quantified by HPLC, and normalized to the cellular protein concentration. White bars indicate spermidine concentrations in the growing phase, black bars indicate those in the stationary phase. Data are represented as mean ± SD. (n =3).
(B) Spermidine concentration in the culture supernatant of the gut microbes in the growing and stationary phases. The gray band indicates the maximum and minimum spermidine concentrations in GAM (n =3). White bars show the spermidine concentrations in the growing phase, black bars show those in the stationary phase. Data are represented mean ± SD. (n =3). *p < 0.01 (Dunnett’s test in comparison with GAM). †p < 0.01 (two-tailed unpaired t-test). The number shown before the species name indicates the order of gut microbial occupancy (15).
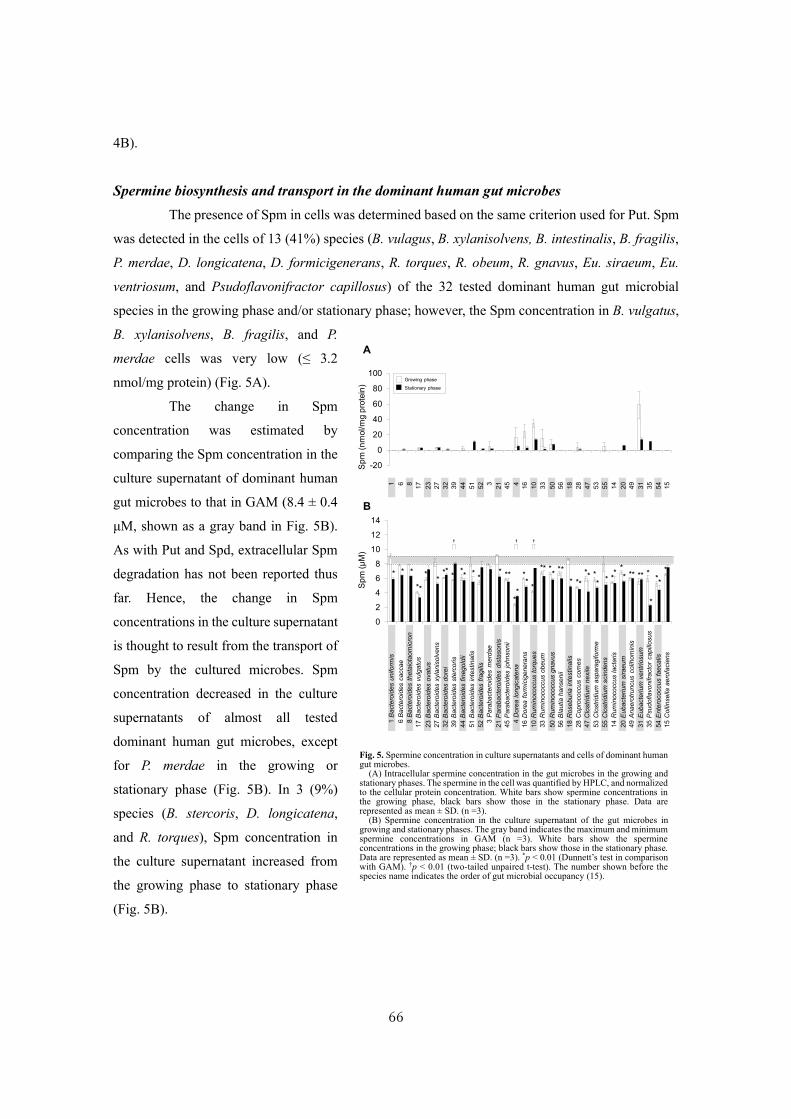
66
4B).
Spermine biosynthesis and transport in the dominant human gut microbes
The presence of Spm in cells was determined based on the same criterion used for Put. Spm
was detected in the cells of 13 (41%) species (B. vulagus, B. xylanisolvens, B. intestinalis, B. fragilis,
P. merdae, D. longicatena, D. formicigenerans, R. torques, R. obeum, R. gnavus, Eu. siraeum, Eu.
ventriosum, and Psudoflavonifractor capillosus) of the 32 tested dominant human gut microbial
species in the growing phase and/or stationary phase; however, the Spm concentration in B. vulgatus,
B. xylanisolvens, B. fragilis, and P.
merdae cells was very low (≤ 3.2
nmol/mg protein) (Fig. 5A).
The change in Spm
concentration was estimated by
comparing the Spm concentration in the
culture supernatant of dominant human
gut microbes to that in GAM (8.4 ± 0.4
μM, shown as a gray band in Fig. 5B).
As with Put and Spd, extracellular Spm
degradation has not been reported thus
far. Hence, the change in Spm
concentrations in the culture supernatant
is thought to result from the transport of
Spm by the cultured microbes. Spm
concentration decreased in the culture
supernatants of almost all tested
dominant human gut microbes, except
for P. merdae in the growing or
stationary phase (Fig. 5B). In 3 (9%)
species (B. stercoris, D. longicatena,
and R. torques), Spm concentration in
the culture supernatant increased from
the growing phase to stationary phase
(Fig. 5B).
-20
0
20
40
60
80
100
0
2
4
6
8
10
12
14
Sp
m(μ
M)
Sp
m(n
mol/m
g p
rote
in)
15 C
olli
nsella
aero
facie
ns
54 E
nte
rococcus f
aecalis
8 B
acte
roid
es
theta
iota
om
icro
n
17 B
acte
roid
es
vulg
atu
s
16 D
ore
afo
rmic
igenera
ns
4 D
ore
alo
ngic
ate
na
45 P
ara
bacte
roid
es j
ohnsonii
21 P
ara
bacte
roid
es d
ista
sonis
3 P
ara
bacte
roid
es m
erd
ae
52 B
acte
roid
es
fragili
s
51 B
acte
roid
es
inte
stinalis
44 B
acte
roid
es
finegold
ii
39 B
acte
roid
es
ste
rcoris
32 B
acte
roid
es
dore
i
27 B
acte
roid
es
xyla
nis
olv
ens
23 B
acte
roid
es
ovatu
s
10 R
um
inococcus
torq
ues
20 E
ubacte
rium
siraeum
14 R
um
inococcus
lacta
ris
55 C
lostr
idiu
m s
cin
dens
53 C
lostr
idiu
m a
spara
giform
e
47 C
lostr
idiu
m n
exile
28 C
opro
coccus
com
es
18 R
oseburia
inte
stinalis
56 B
lautia
hansenii
50 R
um
inococcus
gnavus
33 R
um
inococcus
obeum
31 E
ubacte
rium
ventr
iosum
49 A
naero
truncus
colih
om
inis
35 P
sudoflavonifra
cto
rcapill
osus
6 B
acte
roid
es
caccae
1 B
acte
roid
es
uniform
is
15
548
17
164
45
213
52
51
44
39
32
27
23
10
20
14
55
53
47
28
18
56
50
33
31
49
3561
*
**
*
** *
**
**
*
**
*** **
****
*
*
*** ** *
* *****
*
**
****
** * * *
A
B
Growing phase
Stationary phase
†† †
Fig. 5. Spermine concentration in culture supernatants and cells of dominant human gut microbes.
(A) Intracellular spermine concentration in the gut microbes in the growing and stationary phases. The spermine in the cell was quantified by HPLC, and normalized to the cellular protein concentration. White bars show spermine concentrations in the growing phase, black bars show those in the stationary phase. Data are represented as mean ± SD. (n =3).
(B) Spermine concentration in the culture supernatant of the gut microbes in growing and stationary phases. The gray band indicates the maximum and minimum spermine concentrations in GAM (n =3). White bars show the spermine concentrations in the growing phase; black bars show those in the stationary phase. Data are represented as mean ± SD. (n =3). *p < 0.01 (Dunnett’s test in comparison with GAM). †p < 0.01 (two-tailed unpaired t-test). The number shown before the species name indicates the order of gut microbial occupancy (15).
67
Presence of known polyamine biosynthetic and transport proteins in tested dominant human
gut microbes
The results of BlastP analysis that determined the presence or absence of known polyamine
biosynthetic or transport proteins in the dominant human gut microbes are shown in Fig. 6. In tested
Bacteroides and Parabacteroides species, homologs of the known Put biosynthetic proteins SpeA,
AguA, and NCPAH, which synthesize Put from arginine via N-carbamoylputrescine, are highly
conserved (Figs. 1 and 6), with the exception of P. distasonis, which does not encode a SpeA homolog
(Fig. 6). In addition, B. xylanisolvens encodes homologs of SpeC and SpeF (Fig. 6). Homologs of
PotFGHI are found in all tested Bacteroides and Parabacteroides species (Fig. 6). Except for B.
uniformis and B. dorei, the tested Bacteroides and Parabacteroides species possess an AguD homolog.
A homolog of PlaP, one of the two Put/proton symporters, is found in B. uniformis, B. vulagatus, B.
dorei, B. fragilis, P. merdae, and P. johnsonii. However, a homolog of PuuP, the other Put/proton
symporter, is found only in B. uniformis (Fig. 6). Among the components of SapBCDF, B.
xylanisolvens encodes homologs of SapB and SapF, while B. fragilis encodes homologs of SapD and
SapF (Fig. 6). Homologs of CASDH and CASDC, which are known Spd biosynthetic proteins, are
found in all Bacteroides and Parabacteroides species used in this study (Fig. 6), while only B.
xylanisolvens encodes a SpeD homolog (Fig. 6). All tested Bacteroides and Parabacteroides species
possess homologs of PotABCD, but do not encode homologs of MdtI and MdtJ (Fig. 6).
Of the known Put biosynthetic proteins, Dorea species encodes only the AguB homolog (Fig.
6). Homologs of PotFGHI and SapBCDF are found in D. longicatena and D. formicigenerans (Fig.
6); additionally, D. longicatena encodes an AguD homolog (Fig. 6). Homologs of known Spd
biosynthetic proteins are absent from D. longicatena and D. formicigenerans (Fig. 6); both of these
species possess PotABCD homologs (Fig. 6).
A homolog of AguB is possessed by all tested Blautia species except in R. obeum;
additionally, a SpeB homolog is found in all Blautia species except in R. torques (Fig. 6). R. torques
and R. obeum possess homologs of AguA and NCPAH; in addition, R. torques possesses a SpeA
homolog (Fig. 6). PotFGHI homologs are found in all tested Blautia species (Fig. 6). R. torques, R.
obeum, and Bl. hansenii encode SapBCDF homologs, while R. gnavus lacks a SapC homolog but
encodes SapBDF homologs (Fig. 6). Homologs of APAUH, CASDH, CASDC, and SpeE are found in
all tested Blautia species (Fig. 6). All Blautia species except for Bl. hansenii encode an AAT homolog
(Fig. 6). A homolog of SpeD is present only in Bl. hansenii (Fig. 6). Out of all the known Spd transport
proteins, only the PotABCD homologs are found in Blautia species (Fig. 6).
C. nexlile, C. asparagiforme, and C. scindens encode an AguB homolog (Fig. 6); in addition,
C. asparagiforme and C. nexile possess a SpeB homolog (Fig. 6). Out of all the known Put transport
proteins, only homologs of PotFGHI and SapBCDF are found in the Clostridium species used in this
study (Fig. 6). Out of all the known Spd biosynthetic proteins, homologs of AAT, CASDC, CASDH,

68
and SpeE are found only in C. nexile (Fig. 6). An APAUH homolog is found in C. nexile and C.
asparagiforme (Fig. 6). Of the known Spd transport proteins, PotABCD homologs are found in the
tested Clostridium species (Fig. 6).
Microbes belonging to genera other than Bacteroides, Parabacteroides, Dorea, Blautia, and
Clostridium encode an AguB homolog (Fig. 6). Coprococcus comes, R. lactaris, and Ps. capillosus
encode a SpeB homolog (Fig. 6). A homolog of AguA is found in Roseburia intestinalis, Eu. siraeum,
Co. aerofaciens, and En. faecalis (Fig. 6). Ro. intestinalis, R. lactaris, and Eu. siraeum possess an
NCPAH homolog (Fig. 6). Ro. intestinalis, Cop. comes, R. lactaris, A. colihominis, Eu. ventriosum,
Ps. capillosus, and En. faecalis possess PotFGHI homologs, and Eu. siraeum and Co. aerofaciens
possess only the PotG homolog. (Fig. 6). Homologs of SapBCDF are found in Ro. intestinalis, Cop.
comes, A. colihominis, Eu. ventriosum, Ps. capillosus, En. faecalis, and Co. aerofaciens (Fig. 6). AguD
and its homolog are encoded in both En. faecalis and Co. aerofaciens (Fig. 6). Eu. siraeum does not
possess homologs of the known Put transport proteins (Fig. 6). Homologs of known Spd biosynthetic
proteins are absent in A. colihominis, Eu. ventriosum, En. faecalis, and Co. aerofaciens (Fig. 6). In
contrast, Ps. capillosus encodes homologs of all the known Spd biosynthetic proteins (Fig. 6). Of the
known Spd biosynthetic proteins, Ro. intestinalis encodes homologs of AAT, CASDH, CASDC, and
SpeE (Fig. 6). Cop. comes possesses only APAUH and CASDH homologs (Fig. 6). R. lactaris encodes
homologs of all the known Spd biosynthetic proteins except SpeD (Fig. 6). Eu. siraeum possesses
homologs of all known Spd biosynthetic proteins except APAUH (Fig. 6). Ro. intestinalis, Cop. comes,
R. lactaris, A. colihominis, Eu. ventriosum, Ps. capillosus, and En. faecalis possess PotABCD
homologs, whereas Eu. siraeum and Co. aerofaciens enocode only the PotA homolog out of the known
Spd transport proteins (Fig. 6).

69
1Bacteroides uniformis
6Bacteroides caccae
8Bacteroides thetaiotaomicron
17Bacteroides vulgatus
23Bacteroides ovatus
27Bacteroides xylanisolvens
32Bacteroides dorei
39Bacteroides stercoris
44Bacteroides finegoldii
51Bacteroides intestinalis
52Bacteroides fragilis
3Parabacteroides merdae
21Parabacteroides distasonis
45Parabacteroides johnsonii
4Dorea longicatena
16Dorea formicigenerans
10Ruminococcus torques
33Ruminococcus obeum
50Ruminococcus gnavus
56Blautia hansenii
18Roseburia intestinalis
28Coprococcus comes
47Clostridium nexile
53Clostridium asparagiforme
55Clostridium scindens
14Ruminococcus lactaris
20Eubacterium siraeum
49Anaerotruncus colihominis
31Eubacterium ventriosum
35Pseudoflavonifractor capillosus
54Enterococcus faecalis
15Collinsella aerofaciens
AguA
AguB
NC
PA
H
SpeB
SpeC
S
peF
Pla
PP
otE
PuuP
PotF
AguD
AdiA
SpeA
AA
TA
PA
UH
CA
SD
HC
AS
DC
SpeD
SpeE
MdtI
MdtJ
PotD
Put Spd
> 500 bits
500−300 bits
300−100 bits
< 100 bits
PotG
PotH
PotI
SapB
SapC
SapD
SapF
PotC
PotB
PotA
Fig. 6. Occurrence of homologous proteins responsible for synthesis and transport of polyamines in the genomes of dominant human gut microbes. The BlastP analysis was performed against the genomes of the dominant human gut microbes using query proteins listed in table 2.
Black, dark gray, light gray, and white boxes indicate the result of homologs with scores > 500 bits, between 300 and 500 bits, between 100 and
300 bits, and < 100 bits, respectively. The number shown before the species name indicates the order of gut microbial occupancy in a “human gut
microbial gene catalog” (15).
70
DISCUSSION
The presence of novel polyamine biosynthetic/transport proteins in the dominant human gut
microbes was determined by integrating biosynthetic and transport activity for each polyamine (Figs.
3-5) and by BlastP analysis (Fig. 6).
First, the presence of novel Put biosynthetic proteins was estimated. Five species (B. ovatus,
B. xylanisolvens, B. finegoldii, D. longicatena, and R. lactaris) contained Put in the cell in the growing
or stationary phase (Fig. 3A). A decrease in Put levels in the medium were observed in cultures of B.
finegoldii and R. lactrais (Fig. 3B), suggesting that Put in the cell originates from Put in the medium.
Among the remaining three microbial species that appeared not to take up Put from the media (Fig.
3B), B. ovatus and B. xylanisolvens encode homologs of AdiA, SpeA, AguA, and NCPAH (Fig. 6) and
B. xylanisolvens encodes a homolog of ODC (Fig. 6). These results suggest that these two species
synthesize Put using known Put biosynthetic proteins. In contrast, D. longicatena only possesses a
PCT homolog with a low score (Fig. 6); its incomplete pathway suggests that D. longicatena has novel
Put biosynthetic enzyme(s).
All the 7 strains that appeared to take up Put from the media (B. dorei, P. johnsonii, D.
longicatena, D. formicigenerans, R. torques, R. lactaris, and A. colihominis) (Fig. 3B) contain a
PotFGHI homolog (Fig. 6), and B. dorei and P. johnsonii possess a PlaP homolog in addition to
PotFGHI homologs (Fig. 6). These results suggest that these known transporters are involved in the
observed uptake of Put. Put concentration in the culture supernatant increased in 5 species (B. dorei,
B. stercoris, R. torques, A. colihominis, and En. faecalis) (Fig. 3B) from the growing phase to
stationary phase. The Put-agmatine antiporter AguD and Put exporter SapBCDF have been previously
described in En. faecalis (26) and Escherichia coli (41) (described details in SECTION III of
CHAPTER II), respectively. En. faecalis possesses homologs of SapBCDF in addition to AguD,
suggesting that En. faecalis exports Put to the culture supernatant via AguD and/or homologs of
SapBCDF. An AguD homolog was found in B. stercoris (Fig. 6), and R. torques and A. colihominis
possesses homologs of SapBCDF (Fig. 6). These observations suggest that Put is exported to the
culture supernatant from B. sterocoris via AguD homolog, and from R. torques and A. colihominis via
SapBCDF homologs. However, B. dorei does not possess homologs of AguD, PotE, or SapBCDF (Fig.
6). These results suggest that a novel Put exporter(s) is present in B. dorei.
Next, the presence of novel Spd biosynthetic proteins was assessed. Almost all the tested
dominant human gut microbes except D. formicigenerans and Co. aerofaciens contained intracellular
Spd (Fig. 4A). A decrease in Spd in the medium of 22 species was observed (Fig. 4B), suggesting that
Spd in the cell originates from Spd in the medium. Among the remaining 9 species (B. uniformis, B.
intestinalis, P. merdae, P. distasonis, R. torques, R. obeum, Bl. hansenii, Eu. siraeum, and Eu.
ventriosum), which appeared not to take up Spd from the medium (Fig. 4B), B. uniformis, B.
71
intestinalis, P. merdae, P. distasonis, R. torques, R. obeum, Bl. hansenii, and Eu. siraeum encode
CASDC and CASDH homologs (Fig. 6). In addition, R. torques, R. obeum, Bl. hansenii, and Eu.
siraeium encode a SpeE homolog (Fig. 6). Furthermore, R. torques and R. obeum possess homologs
of AAT and APAUH (Fig. 6), suggesting that these 8 species synthesize Spd using known Spd
biosynthetic enzymes. In contrast, Eu. ventriousm did not possess any homolog of the known Spd
biosynthetic proteins (Fig. 6), suggesting that Eu. ventriosum possesses a novel Spd biosynthetic
enzyme(s). All 22 strains that appear to take up Spd from the medium (Fig. 4B) possess PotABCD
homologs (Fig. 6). These observations suggest that PotABCD homologs are involved in the observed
Spd uptake. Although Spd concentration in the culture supernatant of 4 strains (B. dorei, D.
formicigenerans, R. torques, and Bl. hansenii) increased from the growing to stationary phases (Fig.
4B), homologs of the known Spd exporter MdtJI were not found (Fig. 6). Additionary, Spd
concentration in the culture supernatant of B. vulgatus was significantly higher than Spd originally
contained in GAM, however, B. vulgatus does not possess the homologs of MdtJI. These results
suggested that a novel Spd exporter(s) is present in these 5 species.
In this study, the author found that cells of 13 species (B. vulgatus, B. xylanisolvens, B.
intestinalis, B. fragilis, P. merdae, D. longicatena, D. formicigenerans, R. torques, R. obeum, R. gnavus,
Eu. siraeum, Eu. ventriosum, and Ps. capillosus) contained Spm (Fig. 5A). A decrease in Spm was
observed with all these species except P. merdae in the medium (Fig. 5B), suggesting that Spm in the
cell originates from Spm in the medium. Since Spm levels in the culture supernatant did not change
after cultivation of P. merdae, Spm found in the cell of this microbe was not derived from the growth
medium (Fig. 5B). Kim et al. recently reported that Agrobacterium tumefaciens C58 synthesizes Spm
from Spd by using CASDH and CASDC (homologs of which are found in P. merdae) (Fig. 6) only
when ODC activity was partially inhibited using difluoromethylornithine (DFMO, ODC specific
inhibitor) (42). Although the possibility of Spm synthesis in P. merdae with homologs of CASDH and
CASDC cannot be completely excluded, it is possible that P. merdae has a novel Spm biosynthetic
protein(s) because the condition under which Ag. tumefaciens C58 synthesizes Spm is not
physiological.
All tested dominant human gut microbes except for P. merdae decreased Spm in the culture
supernatant in the growing or stationary phase (Fig. 5B). Kashiwagi et al. reported that PotABCD in
E. coli showed a weak Spm uptake activity (43). In addition, Yao et al. biochemically showed that
PotABCD in Streptococcus aureus showed a Spm uptake activity, which was comparable to its Spd
uptake activity (44). Therefore, it is possible that almost all dominant human gut microbes take up
Spm via a PotABCD homolog. However, because Eu. siraeum and Co. aerofaciens have only a PotA
homolog (Fig. 6), these two species could have a novel Spm transporter(s). Spm concentration in the
culture supernatant of 3 species (B. stercoris, D. longicatena, and R. torques) increased from the
growing to stationary phase (Fig. 5B). No Spm exporter in these microbes has been previously
72
described. Therefore, it is conceivable that these 3 species possess a novel Spm exporter(s).
In the present study, the author showed that 32 species of the tested dominant human gut
microbes possess different polyamine biosynthetic and transport activities. The potential presence of
novel polyamine metabolism and transport genes was shown by combining polyamine concentration
analysis in the cells and culture supernatant with analyzing via BlastP. Despite decreased polyamine
concentrations in the culture supernatant of some species, intracellular polyamine levels did not
increase (e.g., Put concentration in cell and culture supernatant of B. dorei, P. johnsonii, and Eu.
ventriosum). These results suggest that these strains (e.g., B. dorei, P. johnsonii, and Eu. ventriosum)
rapidly metabolized the polyamines, and/or intracellular polyamine levels of these strains were below
the detection limit due to a limited intracellular polyamine pool. On the other hand, some species
exhibited increasing polyamine concentrations in the culture supernatant from growing to stationary
phases, while intracellular polyamine concentrations did not change (e.g., Put concentration in cell
and culture supernatant of B. dorei, B. stercoris, R. torques, A. colihominis, and En. faecalis). It is
possible that these results are due to homeostatic regulation of intracellular polyamine concentration,
which is consistent with how E. coli exports Put to the culture supernatant, while intracellular Put
concentrations remain unchanged (described in SECTION III of CHAPTER II) (41).

73
The above estimation of the presence of novel polyamine biosynthetic and transport proteins
in the tested dominant human gut microbes is summarized in Fig. 7. Thus far, if a microbe synthesizing
or transporting polyamines possessed homolog(s) of polyamine biosynthetic proteins or transporters,
it was inferred that the microbe did
not have novel biosynthetic
proteins or transporters for
polyamines. However, this
criterion is not always appropriate
because some microbes have
redundant proteins possessing the
same functions. For example, E.
coli has four Put transporters
(33,36-38) and two Put
biosynthetic pathways (27,32).
Therefore, the potential presence
of novel polyamine biosynthetic
and transport proteins is
conceivable even in microbes that
do not encode novel proteins
involved in polyamine
biosynthesis or transport.
Furthermore, in BlastP analysis, a
bit score cutoff that was ≥ 100 was
considered as the threshold for the
identification of homologs in the study so far. However, if the threshold value was 200 bits, the number
of homologs identified decreased markedly (Fig. 8). As a result, novel polyamine biosynthetic and
transport proteins that were predicted to exist in the tested dominant human gut microbes markedly
1Bacteroides uniformis
6Bacteroides caccae
8Bacteroides thetaiotaomicron
17Bacteroides vulgatus
23Bacteroides ovatus
27Bacteroides xylanisolvens
32Bacteroides dorei
39Bacteroides stercoris
44Bacteroides finegoldii
51Bacteroides intestinalis
52Bacteroides fragilis
3Parabacteroides merdae
21Parabacteroides distasonis
45Parabacteroides johnsonii
4Dorea longicatena
16Dorea formicigenerans
10Ruminococcus torques
33Ruminococcus obeum
50Ruminococcus gnavus
56Blautia hansenii
18Roseburia intestinalis
28Coprococcus comes
47Clostridium nexile
53Clostridium asparagiforme
55Clostridium scindens
14Ruminococcus lactaris
20Eubacterium siraeum
49Anaerotruncus colihominis
31Eubacterium ventriosum
35Pseudoflavonifractor capillosus
54Enterococcus faecalis
15Collinsella aerofaciens
Put Spd Spm
Fig. 7. Novel polyamine biosynthetic proteins and transporters expected to exist in the tested dominant human gut microbes. The presence of novel polyamine biosynthetic proteins and transporters was predicted from the changes in polyamine concentrations in the culture supernatants and cells and the presence or absence of homologs of known polyamine biosynthetic proteins and transporters. Presence or absence of novel polyamine biosynthetic proteins and transporters is indicated by the color of boxes; gray boxes indicate presence and white boxes indicate absence. The number shown before the species name indicates the order of gut microbial occupancy in a “human gut microbial gene catalog” (15).
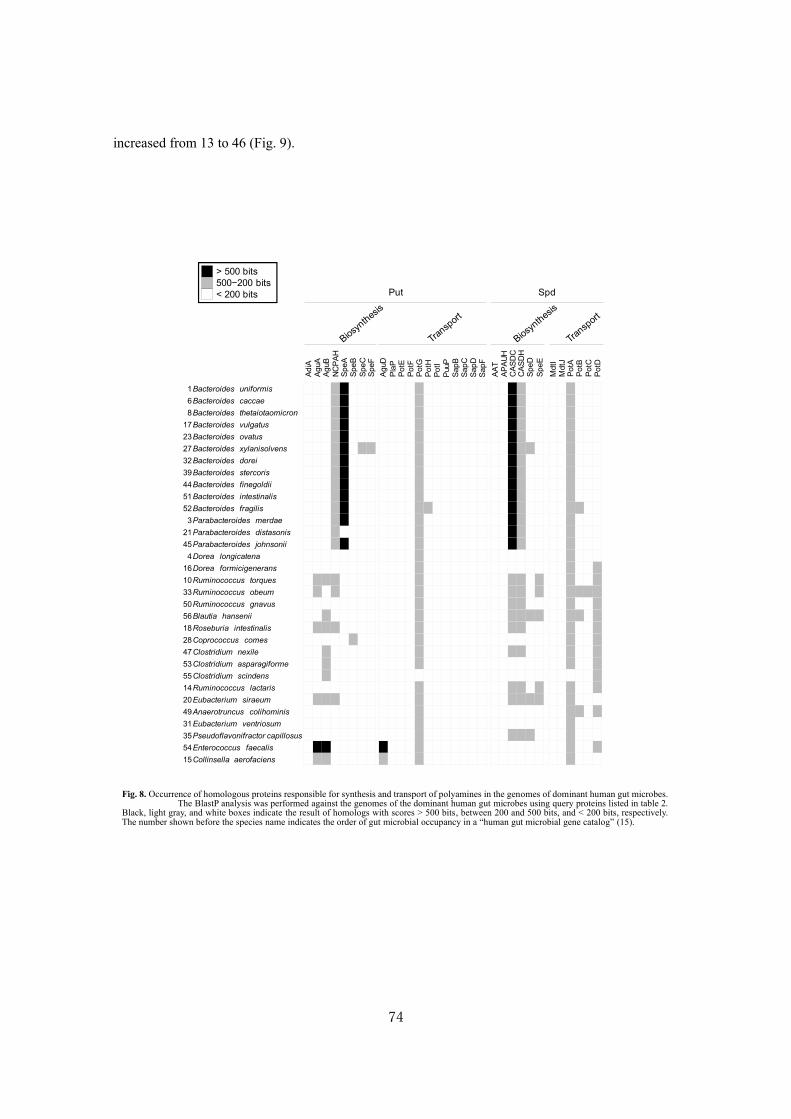
74
increased from 13 to 46 (Fig. 9).
1Bacteroides uniformis
6Bacteroides caccae
8Bacteroides thetaiotaomicron
17Bacteroides vulgatus
23Bacteroides ovatus
27Bacteroides xylanisolvens
32Bacteroides dorei
39Bacteroides stercoris
44Bacteroides finegoldii
51Bacteroides intestinalis
52Bacteroides fragilis
3Parabacteroides merdae
21Parabacteroides distasonis
45Parabacteroides johnsonii
4Dorea longicatena
16Dorea formicigenerans
10Ruminococcus torques
33Ruminococcus obeum
50Ruminococcus gnavus
56Blautia hansenii
18Roseburia intestinalis
28Coprococcus comes
47Clostridium nexile
53Clostridium asparagiforme
55Clostridium scindens
14Ruminococcus lactaris
20Eubacterium siraeum
49Anaerotruncus colihominis
31Eubacterium ventriosum
35Pseudoflavonifractor capillosus
54Enterococcus faecalis
15Collinsella aerofaciens
AguA
AguB
NC
PA
H
SpeB
SpeC
S
peF
Pla
PP
otE
PuuP
PotF
AguD
AdiA
SpeA
AA
TA
PA
UH
CA
SD
HC
AS
DC
SpeD
SpeE
MdtI
MdtJ
PotD
Put Spd
PotG
PotH
PotI
SapB
SapC
SapD
SapF
PotC
PotB
PotA
> 500 bits
500−200 bits
< 200 bits
Fig. 8. Occurrence of homologous proteins responsible for synthesis and transport of polyamines in the genomes of dominant human gut microbes. The BlastP analysis was performed against the genomes of the dominant human gut microbes using query proteins listed in table 2.
Black, light gray, and white boxes indicate the result of homologs with scores > 500 bits, between 200 and 500 bits, and < 200 bits, respectively. The number shown before the species name indicates the order of gut microbial occupancy in a “human gut microbial gene catalog” (15).

75
1Bacteroides uniformis
6Bacteroides caccae
8Bacteroides thetaiotaomicron
17Bacteroides vulgatus
23Bacteroides ovatus
27Bacteroides xylanisolvens
32Bacteroides dorei
39Bacteroides stercoris
44Bacteroides finegoldii
51Bacteroides intestinalis
52Bacteroides fragilis
3Parabacteroides merdae
21Parabacteroides distasonis
45Parabacteroides johnsonii
4Dorea longicatena
16Dorea formicigenerans
10Ruminococcus torques
33Ruminococcus obeum
50Ruminococcus gnavus
56Blautia hansenii
18Roseburia intestinalis
28Coprococcus comes
47Clostridium nexile
53Clostridium asparagiforme
55Clostridium scindens
14Ruminococcus lactaris
20Eubacterium siraeum
49Anaerotruncus colihominis
31Eubacterium ventriosum
35Pseudoflavonifractor capillosus
54Enterococcus faecalis
15Collinsella aerofaciens
Put Spd Spm
Fig. 9. Novel polyamine biosynthetic proteins and transporters expected to exist in the tested dominant human gut microbes. The presence of novel polyamine biosynthetic proteins and transporters was predicted from the changes in polyamine concentrations in the culture supernatants and cells and the presence or absence of homologs of known polyamine biosynthetic proteins and transporters (showed in Fig. 8). Presence or absence of novel polyamine biosynthetic proteins and transporters is indicated by the color of boxes; gray boxes indicate presence and white boxes indicate absence. The number shown before the species name indicates the order of gut microbial occupancy in a “human gut microbial gene catalog” (15).
76
REFERENCES
1. Pegg, A. E. (2009) Mammalian polyamine metabolism and function. IUBMB Life 61, 880-
894
2. Tabor, C. W., and Tabor, H. (1985) Polyamines in microorganisms. Microbiol Rev 49, 81-99
3. Matsumoto, M., Kakizoe, K., and Benno, Y. (2007) Comparison of fecal microbiota and
polyamine concentration in adult patients with intractable atopic dermatitis and healthy
adults. Microbiol Immunol 51, 37-46
4. Matsumoto, M., Kibe, R., Ooga, T., Aiba, Y., Kurihara, S., Sawaki, E., Koga, Y., and Benno,
Y. (2012) Impact of intestinal microbiota on intestinal luminal metabolome. Sci Rep 2, 233
5. Noack, J., Kleessen, B., Proll, J., Dongowski, G., and Blaut, M. (1998) Dietary guar gum
and pectin stimulate intestinal microbial polyamine synthesis in rats. J Nutr 128, 1385-1391
6. Noack, J., Dongowski, G., Hartmann, L., and Blaut, M. (2000) The human gut bacteria
Bacteroides thetaiotaomicron and Fusobacterium varium produce putrescine and
spermidine in cecum of pectin-fed gnotobiotic rats. J Nutr 130, 1225-1231
7. Kibe, R., Kurihara, S., Sakai, Y., Suzuki, H., Ooga, T., Sawaki, E., Muramatsu, K.,
Nakamura, A., Yamashita, A., Kitada, Y., Kakeyama, M., Benno, Y., and Matsumoto, M.
(2014) Upregulation of colonic luminal polyamines produced by intestinal microbiota
delays senescence in mice. Sci Rep 4, 4548
8. Johnson, C. H., Dejea, C. M., Edler, D., Hoang, L. T., Santidrian, A. F., Felding, B. H.,
Ivanisevic, J., Cho, K., Wick, E. C., Hechenbleikner, E. M., Uritboonthai, W., Goetz, L.,
Casero, R. A., Pardoll, D. M., White, J. R., Patti, G. J., Sears, C. L., and Siuzdak, G. (2015)
Metabolism links bacterial biofilms and colon carcinogenesis. Cell Metab 21, 891-897
9. Matsumoto, M., Kurihara, S., Kibe, R., Ashida, H., and Benno, Y. (2011) Longevity in mice
is promoted by probiotic-induced suppression of colonic senescence dependent on
upregulation of gut bacterial polyamine production. PLoS One 6, e23652
10. Lux, G. D., Marton, L. J., and Baylin, S. B. (1980) Ornithine decarboxylase is important in
intestinal mucosal maturation and recovery from injury in rats. Science 210, 195-198
11. Kurihara, S., Oda, S., Kato, K., Kim, H. G., Koyanagi, T., Kumagai, H., and Suzuki, H.
(2005) A novel putrescine utilization pathway involves gamma-glutamylated intermediates
of Escherichia coli K-12. J Biol Chem 280, 4602-4608
12. Michael, A. J. (2016) Biosynthesis of polyamines and polyamine-containing molecules.
Biochem J 473, 2315-2329
13. Michael, A. J. (2016) Polyamines in Eukaryotes, Bacteria, and Archaea. J Biol Chem 291,
14896-14903
14. Michael, A. J. (2015) Biosynthesis of Polyamines in Eukaryotes, Archaea,and Bacteria. in
77
Polyamines, Springer. pp 3-14
15. Qin, J., Li, R., Raes, J., Arumugam, M., Burgdorf, K. S., Manichanh, C., Nielsen, T., Pons,
N., Levenez, F., Yamada, T., Mende, D. R., Li, J., Xu, J., Li, S., Li, D., Cao, J., Wang, B.,
Liang, H., Zheng, H., Xie, Y., Tap, J., Lepage, P., Bertalan, M., Batto, J. M., Hansen, T., Le
Paslier, D., Linneberg, A., Nielsen, H. B., Pelletier, E., Renault, P., Sicheritz-Ponten, T.,
Turner, K., Zhu, H., Yu, C., Jian, M., Zhou, Y., Li, Y., Zhang, X., Qin, N., Yang, H., Wang,
J., Brunak, S., Doré, J., Guarner, F., Kristiansen, K., Pedersen, O., Parkhill, J., Weissenbach,
J., Bork, P., Ehrlich, S. D., and Consortium, M. (2010) A human gut microbial gene
catalogue established by metagenomic sequencing. Nature 464, 59-65
16. Gotoh, A., Nara, M., Sugiyama, Y., Sakanaka, M., Yachi, H., Kitakata, A., Nakagawa, A.,
Minami, H., Okuda, S., Katoh, T., Katayama, T., and Kurihara, S. (2017) Use of Gifu
Anaerobic Medium for culturing 32 dominant species of human gut microbes and its
evaluation based on short-chain fatty acids fermentation profiles. Biosci Biotechnol
Biochem 81, 2009-2017
17. Hamana, K., Itoh, T., Benno, Y., and Hayashi, H. (2008) Polyamine distribution profiles of
new members of the phylum Bacteroidetes. J Gen Appl Microbiol 54, 229-236
18. Hosoya, R., and Hamana, K. (2004) Distribution of two triamines, spermidine and
homospermidine, and an aromatic amine, 2-phenylethylamine, within the phylum
Bacteroidetes. J Gen Appl Microbiol 50, 255-260
19. Hanfrey, C. C., Pearson, B. M., Hazeldine, S., Lee, J., Gaskin, D. J., Woster, P. M., Phillips,
M. A., and Michael, A. J. (2011) Alternative spermidine biosynthetic route is critical for
growth of Campylobacter jejuni and is the dominant polyamine pathway in human gut
microbiota. J Biol Chem 286, 43301-43312
20. Sakanaka, M., Sugiyama, Y., Kitakata, A., Katayama, T., and Kurihara, S. (2016)
Carboxyspermidine decarboxylase of the prominent intestinal microbiota species
Bacteroides thetaiotaomicron is required for spermidine biosynthesis and contributes to
normal growth. Amino Acids 48, 2443-2451
21. Ohnuma, M., Terui, Y., Tamakoshi, M., Mitome, H., Niitsu, M., Samejima, K., Kawashima,
E., and Oshima, T. (2005) N1-aminopropylagmatine, a new polyamine produced as a key
intermediate in polyamine biosynthesis of an extreme thermophile, Thermus thermophilus. J
Biol Chem 280, 30073-30082
22. Moore, R. C., and Boyle, S. M. (1990) Nucleotide sequence and analysis of the speA gene
encoding biosynthetic arginine decarboxylase in Escherichia coli. J Bacteriol 172, 4631-
4640
23. Stim, K. P., and Bennett, G. N. (1993) Nucleotide sequence of the adi gene, which encodes
the biodegradative acid-induced arginine decarboxylase of Escherichia coli. J Bacteriol
78
175, 1221-1234
24. Llácer, J. L., Polo, L. M., Tavárez, S., Alarcón, B., Hilario, R., and Rubio, V. (2007) The
gene cluster for agmatine catabolism of Enterococcus faecalis: study of recombinant
putrescine transcarbamylase and agmatine deiminase and a snapshot of agmatine deiminase
catalyzing its reaction. J Bacteriol 189, 1254-1265
25. Tabor, C. W., and Tabor, H. (1987) The speEspeD operon of Escherichia coli. Formation
and processing of a proenzyme form of S-adenosylmethionine decarboxylase. J Biol Chem
262, 16037-16040
26. Suárez, C., Espariz, M., Blancato, V. S., and Magni, C. (2013) Expression of the agmatine
deiminase pathway in Enterococcus faecalis is activated by the AguR regulator and
repressed by CcpA and PTS(Man) systems. PLoS One 8, e76170
27. Satishchandran, C., and Boyle, S. M. (1986) Purification and properties of agmatine
ureohydrolyase, a putrescine biosynthetic enzyme in Escherichia coli. J Bacteriol 165, 843-
848
28. Lee, J., Sperandio, V., Frantz, D. E., Longgood, J., Camilli, A., Phillips, M. A., and Michael,
A. J. (2009) An alternative polyamine biosynthetic pathway is widespread in bacteria and
essential for biofilm formation in Vibrio cholerae. J Biol Chem 284, 9899-9907
29. Higashi, K., Ishigure, H., Demizu, R., Uemura, T., Nishino, K., Yamaguchi, A., Kashiwagi,
K., and Igarashi, K. (2008) Identification of a spermidine excretion protein complex (MdtJI)
in Escherichia coli. J Bacteriol 190, 872-878
30. Nakada, Y., and Itoh, Y. (2003) Identification of the putrescine biosynthetic genes in
Pseudomonas aeruginosa and characterization of agmatine deiminase and N-
carbamoylputrescine amidohydrolase of the arginine decarboxylase pathway. Microbiology
149, 707-714
31. Kashiwagi, K., Suzuki, T., Suzuki, F., Furuchi, T., Kobayashi, H., and Igarashi, K. (1991)
Coexistence of the genes for putrescine transport protein and ornithine decarboxylase at 16
min on Escherichia coli chromosome. J Biol Chem 266, 20922-20927
32. Morris, D. R., and Pardee, A. B. (1965) A biosynthetic ornithine decarboxylase in
Escherichia coli. Biochem Biophys Res Commun 20, 697-702
33. Kurihara, S., Suzuki, H., Oshida, M., and Benno, Y. (2011) A novel putrescine importer
required for type 1 pili-driven surface motility induced by extracellular putrescine in
Escherichia coli K-12. J Biol Chem 286, 10185-10192
34. Furuchi, T., Kashiwagi, K., Kobayashi, H., and Igarashi, K. (1991) Characteristics of the
gene for a spermidine and putrescine transport system that maps at 15 min on the
Escherichia coli chromosome. J Biol Chem 266, 20928-20933
35. Kashiwagi, K., Miyamoto, S., Suzuki, F., Kobayashi, H., and Igarashi, K. (1992) Excretion

79
of putrescine by the putrescine-ornithine antiporter encoded by the potE gene of Escherichia
coli. Proc Natl Acad Sci U S A 89, 4529-4533
36. Kashiwagi, K., Shibuya, S., Tomitori, H., Kuraishi, A., and Igarashi, K. (1997) Excretion
and uptake of putrescine by the PotE protein in Escherichia coli. J Biol Chem 272, 6318-
6323
37. Pistocchi, R., Kashiwagi, K., Miyamoto, S., Nukui, E., Sadakata, Y., Kobayashi, H., and
Igarashi, K. (1993) Characteristics of the operon for a putrescine transport system that maps
at 19 minutes on the Escherichia coli chromosome. J Biol Chem 268, 146-152
38. Kurihara, S., Tsuboi, Y., Oda, S., Kim, H. G., Kumagai, H., and Suzuki, H. (2009) The
putrescine Importer PuuP of Escherichia coli K-12. J Bacteriol 191, 2776-2782
39. Tabor, C. W., Tabor, H., and Xie, Q. W. (1986) Spermidine synthase of Escherichia coli:
localization of the speE gene. Proc Natl Acad Sci U S A 83, 6040-6044
40. Camacho, C., Coulouris, G., Avagyan, V., Ma, N., Papadopoulos, J., Bealer, K., and
Madden, T. L. (2009) BLAST+: architecture and applications. BMC Bioinformatics 10, 421
41. Sugiyama, Y., Nakamura, A., Matsumoto, M., Kanbe, A., Sakanaka, M., Higashi, K.,
Igarashi, K., Katayama, T., Suzuki, H., and Kurihara, S. (2016) A Novel Putrescine Exporter
SapBCDF of Escherichia coli. J Biol Chem 291, 26343-26351
42. Kim, S. H., Wang, Y., Khomutov, M., Khomutov, A., Fuqua, C., and Michael, A. J. (2016)
The Essential Role of Spermidine in Growth of Agrobacterium tumefaciens Is Determined
by the 1,3-Diaminopropane Moiety. ACS Chem Biol 11, 491-499
43. Kashiwagi, K., Hosokawa, N., Furuchi, T., Kobayashi, H., Sasakawa, C., Yoshikawa, M.,
and Igarashi, K. (1990) Isolation of polyamine transport-deficient mutants of Escherichia
coli and cloning of the genes for polyamine transport proteins. J Biol Chem 265, 20893-
20897
44. Yao, X., and Lu, C. D. (2014) Functional characterization of the potRABCD operon for
spermine and spermidine uptake and regulation in Staphylococcus aureus. Curr Microbiol
69, 75-81

80
SUMMARY
Recent studies have reported that polyamines in the colonic lumen might affect animal
health and these polyamines are thought to be produced by gut microbes. In this SECTION, the author
measured the concentrations of three polyamines (putrescine, spermidine, and spermine) in cells and
culture supernatants of 32 dominant human gut microbial species in their growing and stationary
phases. Combining polyamine concentration analysis in culture supernatant and cells with available
genomic information showed that novel polyamine biosynthetic proteins and transporters were present
in dominant human gut microbes. Based on these findings, the author suggested strategies for
optimizing polyamine concentrations in the human colonic lumen via regulation of genes responsible
for polyamine biosynthesis and transport in the dominant human gut microbes.
81
SECTION II
Polyamine biosynthetic and transport ability of
human indigenous Bifidobacterium species
In animal species that have been analyzed, polyamines are also found in the colonic lumen
at concentrations ranging from hundreds of micromolar to several millimolar (1,2). These colonic
luminal polyamines have been derived from gut bacteria (3-5). In SECTION I of CHAPTER II, the
author evaluated polyamine biosynthetic and transport ability of 32 species of dominant human gut
microbes.
Bifidobacteria are one of the major human indigenous commensal microbes, which are
highly abundant in the healthy adult Japanese gut microbiome (6) and the relative abundance in the
gut microbiome of Asian children reaches several tens of percent (7). It was reported that
bifidobacteria exert beneficial influences on animals, such as allergy suppression (8), cancer
prevention (9,10), and inhibition of pathogen colonization (11). Therefore, several Bifidobacterium
species are used in probiotics which are a live microbial food supplement that beneficially affects the
host animal by modulating its intestinal balance.
Matsumoto et al. reported that oral administration of probiotic Bifidobacterium animalis
subsp. lactis significantly increases intestinal spermine (Spm) concentration in mice (12). Two
possible mechanisms could explain why intestinal Spm concentration is increased by bifidobacteria
administration: (1) bifidobacteria biosynthesize and produce polyamines; (2) polyamines are produced
by enterocytes and/or gut microbes stimulated by bifidobacteria. However, there are no reports
describing polyamine biosynthetic and transport ability of Bifidobacterium species except for one by
Hamana in 1997 that quantified the intracellular polyamine concentrations of stationary phase cells of
Bifidobacterium bifidum, Bifidobacterium breve, Bifidobacterium longum subsp. longum, and B.
longum subsp. infantis (13). It was concluded that these Bifidobacterium species do not have
polyamine biosynthetic ability (13). However, to understand the influence of bifidobacteria on the
environment, i.e., the colonic lumen of their host, the polyamine transport ability of bifidobacteria
needs to be analyzed. Additionally, because polyamine concentrations in cells and culture supernatant
of microbes are different in growing and stationary phase (SECTION I of CHAPTER II), the analysis
should be performed at the different growth phases. Furthermore, recent studies have reported several
novel species of Bifidobacterium isolated from human hosts (14,15). Therefore, detailed re-analysis is
currently required to update our understanding of polyamine biosynthesis and transport by
Bifidobacterium species.
In this SECTION, the author determined polyamine (putrescine [Put], spermidine [Spd], and
Spm) concentrations of both cells and culture supernatants in growing and stationary phases obtained

82
from the culture of 13 species of human indigenous Bifidobacterium (14-16). Furthermore, the author
estimated the possibility of the novel polyamine biosynthetic and transport proteins present in
Bifidobacterium species by using basic local alignment search tool (BLAST) analysis.

83
MATERIALS AND METHODS
Strains and culture condition
Human indigenous Bifidobacterium species used in this study were obtained from the Japan
Collection of Microorganisms (JCM) and are listed in Table 1. It should be noted that there are reports
that Bifidobacterium animalis subsp. lactis was isolated from human samples (16,17). Brain-heart
infusion (BHI) medium and 199 medium were purchased from Sigma-Aldrich (St. Louis, MO, USA).
Preparation of GAM (Nissui Pharmaceutical, Tokyo, Japan) broth and cultivation of
Bifidobacterium species in GAM was performed as described previously (18). Briefly,
Bifidobacterium species were anaerobically pre-cultured in 500 μL of GAM in 96-deep well plates for
24 – 48 h at 37 °C in an anaerobic chamber (INVIVO2 400 [Ruskinn Technologies, UK]). Pre-cultures
were inoculated in 500 μL of GAM in 96-deep well plates using a copy plate stand (Tokken, Chiba,
Japan), and anaerobically cultured for 60 – 96 h. Growth was monitored by measuring optical density
at 600 nm (OD600) on 96 well plate using Multiskan GO (Thermo fisher scientific, Waltham, MA,
USA). Confirmation of the purity of the culture of bacteria other than Bifidobacterium faecale
JCM19861T was performed as described previously (18) using V1-V3 region of 16S rRNA gene (16S
rDNA) sequence. Because V1-V3 region of 16S rDNA of B. faecale JCM19861T is identical to that
of Bifidobacterium adolescentis BBMN23, hsp60 was amplified using primer pair hsp60_1F (5’-
gaagaccgatgacgtcgcag-3’)/hsp60_587R (5’-gtcgccgaagcccggagccttaac-3’) and amplified product was
sequenced using hsp60_68F (5’-gagggtctgaagaacgtcac-3’) for confirmation of the purity of culture of
B. faecale JCM19861T.
Dissolved oxygen in 199 medium was eliminated by incubation of the medium in the
AnaeroPack jar system (Mitsubishi gas chemical, Tokyo, Japan) at 4 °C for 24 h. Bifidobacterium
species were pre-cultured in GAM for 24 - 48 h at 37 °C in the anaerobic chamber, and pre-cultured
cells were washed with 199 medium. Washed cells were inoculated to 500 μL of 199 medium in 96-
deep well plate at initial OD600 0.03. Growth was monitored by measuring OD600 on 96 well plate
using Multiskan GO.
BHI medium and BHI medium containing 0.03 % biogenic amines were prepared as
previously reported by Pugin et al. (19). The final concentration of each biogenic amine in the BHI
medium containing 0.03 % biogenic amines was 2.7 mM histamine, 2.2 mM tyramine, 2.9 mM
cadaverine, 3.4 mM Put, 2.1 mM Spd, and 1.5 mM Spm. Before cultivation, dissolved oxygen in BHI
medium and BHI medium containing 0.03 % biogenic amines was eliminated by incubation of the
medium in the AnaeroPack jar system for 48 h at room temperature. B. adolescentis JCM1275T was
pre-cultured in BHI medium for 24 h at 37 °C in an anaerobic chamber. 2.5 μL of pre-cultured B.
adolescentis JCM1275T was inoculated in 500 μL of each medium in 96-deep well plate, and cultured
for 48 h in an anaerobic chamber at 37 °C.

84
Polyamine quantification
Polyamine content was measured by high-performance liquid chromatography (HPLC).
Polyamines were separated by cation exchange column (#2619PH, 4.6 × 50 mm, Hitachi Co., Ltd.,
Tokyo, Japan) in normal-phase mode. The detailed conditions of HPLC were the same as those
described previously (20). For analyzing the relationship between the growth stages and polyamine
concentrations in cells and culture supernatants, cultures in growing and stationary phases were
obtained at indicated times (Figs. 1 and 6A).
Five hundred μL of cultures were centrifuged (18,700 ×g, 5 min, 4 °C) to separate the cells
and culture supernatant. When GAM was used for culture, cell pellets were washed twice with 500 μL
of phosphate-buffered saline to completely remove polyamines derived from the medium.
HPLC sample preparation and cellular protein quantification were performed as described
previously (20) and intracellular polyamine concentrations were normalized to the amount of cellular
protein and expressed as nmol/mg of cellular protein.
Basic local alignment search tool (BLAST) analysis
Protein BLAST (21) analysis (BlastP) was performed against proteins obtained from
National Center for Biotechnology Information (NCBI) protein database. Query proteins involving
polyamine biosynthesis and transport were the same as described in Table 2 in SECTION I of
CHAPTER II. Additionally, polyamine degradation proteins listed in Table 2 were also analyzed by
BlastP. Because insufficient genomic information of B. faecale JCM19861T was available in the NCBI
database (only nucleotide and/or protein sequence of 16S rDNA, Hsp60, and DnaJ were available in
NCBI database), B. faecale JCM19861T was excluded from BlastP analysis.
Statistics
Values are indicated as mean ± standard deviation (SD). The significant differences were
analyzed by using SPSS software version 21 (IBM, Armonk, NY).
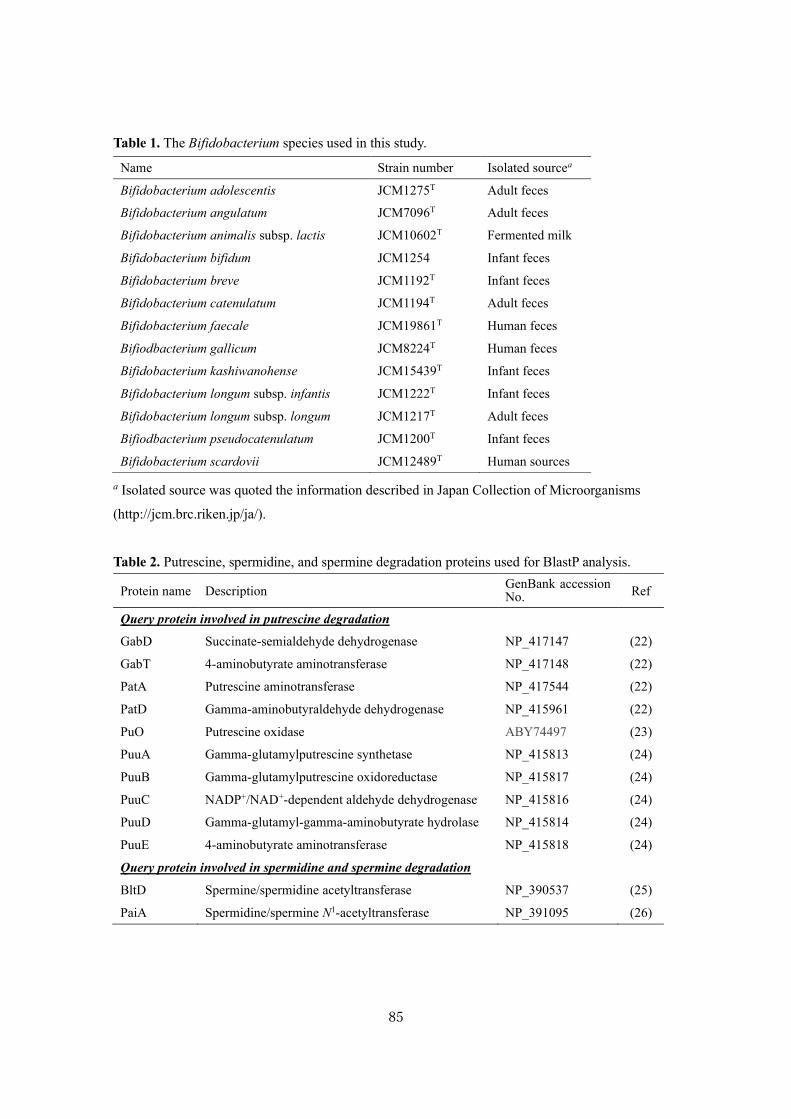
85
Table 1. The Bifidobacterium species used in this study.
a Isolated source was quoted the information described in Japan Collection of Microorganisms
(http://jcm.brc.riken.jp/ja/).
Table 2. Putrescine, spermidine, and spermine degradation proteins used for BlastP analysis.
Protein name Description GenBank accession No. Ref
Query protein involved in putrescine degradation
GabD Succinate-semialdehyde dehydrogenase NP_417147 (22)
GabT 4-aminobutyrate aminotransferase NP_417148 (22)
PatA Putrescine aminotransferase NP_417544 (22)
PatD Gamma-aminobutyraldehyde dehydrogenase NP_415961 (22)
PuO Putrescine oxidase ABY74497 (23)
PuuA Gamma-glutamylputrescine synthetase NP_415813 (24)
PuuB Gamma-glutamylputrescine oxidoreductase NP_415817 (24)
PuuC NADP+/NAD+-dependent aldehyde dehydrogenase NP_415816 (24)
PuuD Gamma-glutamyl-gamma-aminobutyrate hydrolase NP_415814 (24)
PuuE 4-aminobutyrate aminotransferase NP_415818 (24)
Query protein involved in spermidine and spermine degradation
BltD Spermine/spermidine acetyltransferase NP_390537 (25)
PaiA Spermidine/spermine N1-acetyltransferase NP_391095 (26)
Name Strain number Isolated sourcea
Bifidobacterium adolescentis JCM1275T Adult feces
Bifidobacterium angulatum JCM7096T Adult feces
Bifidobacterium animalis subsp. lactis JCM10602T Fermented milk
Bifidobacterium bifidum JCM1254 Infant feces
Bifidobacterium breve JCM1192T Infant feces
Bifidobacterium catenulatum JCM1194T Adult feces
Bifidobacterium faecale JCM19861T Human feces
Bifiodbacterium gallicum JCM8224T Human feces
Bifidobacterium kashiwanohense JCM15439T Infant feces
Bifidobacterium longum subsp. infantis JCM1222T Infant feces
Bifidobacterium longum subsp. longum JCM1217T Adult feces
Bifiodbacterium pseudocatenulatum JCM1200T Infant feces
Bifidobacterium scardovii JCM12489T Human sources

86
0123456
0 1224364860728496
OD
60
0
Cultivation time (h)
0123456
0 1224364860728496
OD
60
0
Cultivation time (h)
0123456
0 1224364860728496
OD
60
0
Cultivation time (h)
0123456
0 1224364860728496
OD
60
0
Cultivation time (h)
0123456
0 1224364860728496
OD
60
0
Cultivation time (h)
0123456
0 1224364860728496
OD
60
0
Cultivation time (h)
02468
10
0 1224364860728496
OD
60
0
Cultivation time (h)
0123456
0 1224364860728496
OD
60
0
Cultivation time (h)
B. adolescentis B. angulatum
B. animalis subsp. lactis B. bifidum
B. breve B. catenulatum
B. faecale B. gallicum
0123456
0 1224364860728496
OD
60
0
Cultivation time (h)
0123456
0 1224364860728496
OD
60
0
Cultivation time (h)
0123456
0 1224364860728496
OD
60
0
Cultivation time (h)
B. longum subsp. longum
0123456
0 1224364860728496
OD
60
0
Cultivation time (h)
B. kashiwanohense
B. pseudocatenulatum
B. scardovii
0123456
0 1224364860728496
OD
60
0
Cultivation time (h)
B. longum subsp. infantis
Fig. 1. Growth curve of the tested human indigenous
Bifidobacterium species in GAM.
Growth of Bifidobacterium species was monitored
by measuring the OD600. The white arrowheads indicate the
sampling point used for the growing phase and the black
arrowheads indicate the sampling point used for the stationary
phase. Data are mean ± SD. (n =3).
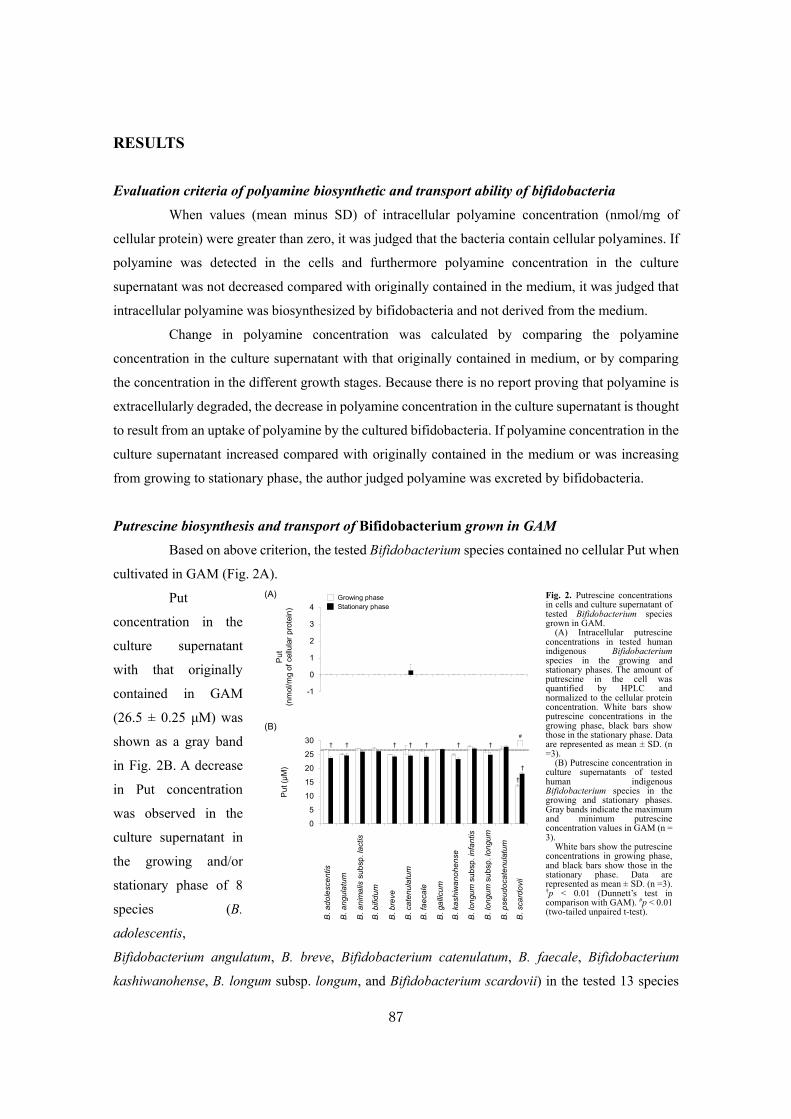
87
RESULTS
Evaluation criteria of polyamine biosynthetic and transport ability of bifidobacteria
When values (mean minus SD) of intracellular polyamine concentration (nmol/mg of
cellular protein) were greater than zero, it was judged that the bacteria contain cellular polyamines. If
polyamine was detected in the cells and furthermore polyamine concentration in the culture
supernatant was not decreased compared with originally contained in the medium, it was judged that
intracellular polyamine was biosynthesized by bifidobacteria and not derived from the medium.
Change in polyamine concentration was calculated by comparing the polyamine
concentration in the culture supernatant with that originally contained in medium, or by comparing
the concentration in the different growth stages. Because there is no report proving that polyamine is
extracellularly degraded, the decrease in polyamine concentration in the culture supernatant is thought
to result from an uptake of polyamine by the cultured bifidobacteria. If polyamine concentration in the
culture supernatant increased compared with originally contained in the medium or was increasing
from growing to stationary phase, the author judged polyamine was excreted by bifidobacteria.
Putrescine biosynthesis and transport of Bifidobacterium grown in GAM
Based on above criterion, the tested Bifidobacterium species contained no cellular Put when
cultivated in GAM (Fig. 2A).
Put
concentration in the
culture supernatant
with that originally
contained in GAM
(26.5 ± 0.25 μM) was
shown as a gray band
in Fig. 2B. A decrease
in Put concentration
was observed in the
culture supernatant in
the growing and/or
stationary phase of 8
species (B.
adolescentis,
Bifidobacterium angulatum, B. breve, Bifidobacterium catenulatum, B. faecale, Bifidobacterium
kashiwanohense, B. longum subsp. longum, and Bifidobacterium scardovii) in the tested 13 species
-1
0
1
2
3
4
0
5
10
15
20
25
30
Pu
t (μ
M)
Pu
t
(nm
ol/m
g o
f cellu
lar
pro
tein
)
B. a
do
lesce
ntis
B. a
ngu
latu
m
B. a
nim
alis
su
bsp
. la
ctis
B. b
ifid
um
B. b
reve
B. ca
ten
ula
tum
B. fa
eca
le
B. ga
llicu
m
B. ka
sh
iwa
no
he
nse
B. lo
ngu
msu
bsp
.lo
ngu
m
B. lo
ngu
msu
bsp
.in
fan
tis
B. p
se
ud
oca
tenu
latu
m
B. sca
rdo
vii
(A)
(B)
Growing phase
Stationary phase
† † † † † † †
†
†
#
Fig. 2. Putrescine concentrations in cells and culture supernatant of tested Bifidobacterium species grown in GAM.
(A) Intracellular putrescine concentrations in tested human indigenous Bifidobacterium species in the growing and stationary phases. The amount of putrescine in the cell was quantified by HPLC and normalized to the cellular protein concentration. White bars show putrescine concentrations in the growing phase, black bars show those in the stationary phase. Data are represented as mean ± SD. (n =3).
(B) Putrescine concentration in culture supernatants of tested human indigenous Bifidobacterium species in the growing and stationary phases. Gray bands indicate the maximum and minimum putrescine concentration values in GAM (n = 3).
White bars show the putrescine concentrations in growing phase, and black bars show those in the stationary phase. Data are represented as mean ± SD. (n =3). †p < 0.01 (Dunnett’s test in comparison with GAM). #p < 0.01 (two-tailed unpaired t-test).

88
(Fig. 2B). Comparing the Put concentrations in the culture supernatant of growing phase to those of
stationary phase, the Put concentration in the culture supernatant of B. scardovii was increased from
growing phase to stationary phase (Fig. 2B).
Spermidine concentrations of Bifidobacterium grown in GAM
Of the 13 tested species, 11 species contained Spd: in particular, Spd concentration in the
cells of B. animalis subsp. lactis (2.5 ± 0.12 nmol/mg of cellular protein), B. kashiwanohense (1.2 ±
0.8 nmol/mg of cellular protein), and Bifidobacterium pseudocatenulatum (1.4 ± 0.18 nmol/mg of
cellular protein) was relatively high (Fig. 3A). No Spd was detected in the cells in both growing and
stationary phase of B. bifidum and Bifidobacterium gallicum (Fig. 3A).
The Spd
concentration in the
culture supernatant
with that originally
contained in GAM
(19.4 ± 0.5 μM) was
shown as a gray band
in Fig. 2B. The
concentrations of Spd
decreased in the
culture supernatant of
5 species (B.
adolescentis, B. breve,
B. catenulatum, B.
kashiwanohense, and
B. scardovii) of the tested 13 species in the growing and/or stationary phase (Fig. 3B).
Spermine concentrations of Bifidobacterium grown in GAM
Of the tested 13 species, 5 species (B. adolescentis, B. angulatum, B. animalis subsp. lactis,
B. faecale, and B. pseudocatenulatum) contained Spm in the cells: in particular, B. animalis subsp.
lactis (1.5 ± 0.03 nmol/mg of cellular protein) and B. pseudocatenulatum (2.8 ± 0.47 nmol/mg)
contained relatively high concentration of Spm in the cells (Fig. 4A).
The Spm concentration in the culture supernatant with that originally contained in GAM
(6.3 ± 0.28 μM) was shown as a gray band in Fig. 4B. Spm concentration decreased in the culture
supernatants of 5 species (B. adolescentis, B. breve, B. kashiwanohense, B. longum subsp. longum,
and B. scardovii) in the growing and/or stationary phase (Fig. 4B). On the other hand, compared with
-1
0
1
2
3
4
0
5
10
15
20
25
30
Sp
d(μ
M)
Sp
d
(nm
ol/m
g o
f cellu
lar
pro
tein
)
B. a
do
lesce
ntis
B. a
ngu
latu
m
B. a
nim
alis
su
bsp
. la
ctis
B. b
ifid
um
B. b
reve
B. ca
ten
ula
tum
B. fa
eca
le
B. ga
llicu
m
B. ka
sh
iwa
no
he
nse
B. lo
ngu
msu
bsp
.lo
ngu
m
B. lo
ngu
msu
bsp
.in
fan
tis
B. p
se
ud
oca
tenu
latu
m
B. sca
rdo
vii
(A)
(B)
† † † † † †
Growing phase
Stationary phase
Fig. 3. Spermidine concentrations in the cells and culture supernatant of tested Bifidobacterium species grown in GAM.
(A) Intracellular spermidine concentrations in tested human indigenous Bifidobacterium species in the growing and stationary phases. The amount of spermidine in the cell was quantified by HPLC and normalized to the cellular protein concentration. White bars show spermidine concentrations in the growing phase, black bars show those in the stationary phase. Data are represented as mean ± SD. (n =3).
(B) Spermidine concentration in culture supernatants of tested human indigenous Bifidobacterium species in the growing and stationary phases. Gray bands indicate the maximum and minimum spermidine concentration values in GAM (n = 3).
White bars show the spermidine concentrations in growing phase, and black bars show those in the stationary phase. Data are represented as mean ± SD. (n =3). †p < 0.01 (Dunnett’s test in comparison with GAM). #p < 0.01 (two-tailed unpaired t-test).

89
GAM, Spm concentration in the culture supernatants in the growing phase of B. animalis subsp. lactis
and B. longum subsp. infantis was increased (Fig. 4B). In B. longum subsp. longum, Spm concentration
in the culture supernatant increased from the growing phase to stationary phase (Fig. 4B).
Intracellular polyamine profile of Bifidobacterium grown in 199 medium
To investigate whether intracellular Spd and Spm was biosynthesized or imported from
medium, Bifidobacterium species were
cultured in 199 medium (polyamine-free
synthetic medium). Of the tested
Bifidobacterium species, 2 species (B.
longum subsp. infantis and B. scardovii),
which presented relatively good growth
(Figs. 5 and 6A), were subjected to the
polyamine analyses. No polyamine was
observed in the cells of B. longum subsp.
infantis and B. scardovii in the growing or
stationary phase when 199 medium was
used for culture (Figs. 7B and 7C).
-1
0
1
2
3
4
0
5
10
15
20
25
30
Sp
m(μ
M)
Sp
m
(nm
ol/m
g o
f cellu
lar
pro
tein
)
B. a
do
lesce
ntis
B. a
ngu
latu
m
B. a
nim
alis
su
bsp
. la
ctis
B. b
ifid
um
B. b
reve
B. ca
ten
ula
tum
B. fa
eca
le
B. ga
llicu
m
B. ka
sh
iwa
no
he
nse
B. lo
ngu
msu
bsp
.lo
ngu
m
B. lo
ngu
msu
bsp
.in
fan
tis
B. p
se
ud
oca
tenu
latu
m
B. sca
rdo
vii
(A)
(B)
Growing phase
Stationary phase
† † † † † † † †
#
Fig. 4. Spermine concentrations in the cells and culture supernatant of tested Bifidobacterium species grown in GAM.
(A) Intracellular spermine concentrations in tested human indigenous Bifidobacterium species in the growing and stationary phases. The amount of spermine in the cell was quantified by HPLC and normalized to the cellular protein concentration. White bars show spermine concentrations in the growing phase, black bars show those in the stationary phase. Data are represented as mean ± SD. (n =3).
(B) Spermine concentration in culture supernatants of tested human indigenous Bifidobacterium species in the growing and stationary phases. Gray bands indicate the maximum and minimum spermine concentration values in GAM (n = 3).
White bars show the spermine concentrations in growing phase, and black bars show those in the stationary phase. Data are represented as mean ± SD. (n =3). †p < 0.01 (Dunnett’s test in comparison with GAM). #p < 0.01 (two-tailed unpaired t-test).
0
0.05
0.1
0.15
0.2
0.25
B. a
do
lesce
ntis
B. a
ngu
latu
m
B. a
nim
alis
su
bsp
. la
ctis
B. b
ifid
um
B. b
reve
B. ca
ten
ula
tum
B. fa
eca
le
B. ga
llicu
m
B. ka
sh
iwa
no
he
nse
B. lo
ngu
msu
bsp
.lo
ngu
m
B. lo
ngu
msu
bsp
.in
fan
tis
B. p
se
ud
oca
tenu
latu
m
B. sca
rdo
vii
OD
60
0
Fig. 5. Growth of the tested human indigenous Bifidobacterium species cultured in 199 medium.
Growth of Bifidobacterium was monitored by measuring the OD600. OD600 value of the tested Bifidobacterium species grown in 199 medium for 72 hours is shown. Data are mean ± SD. (n =3).
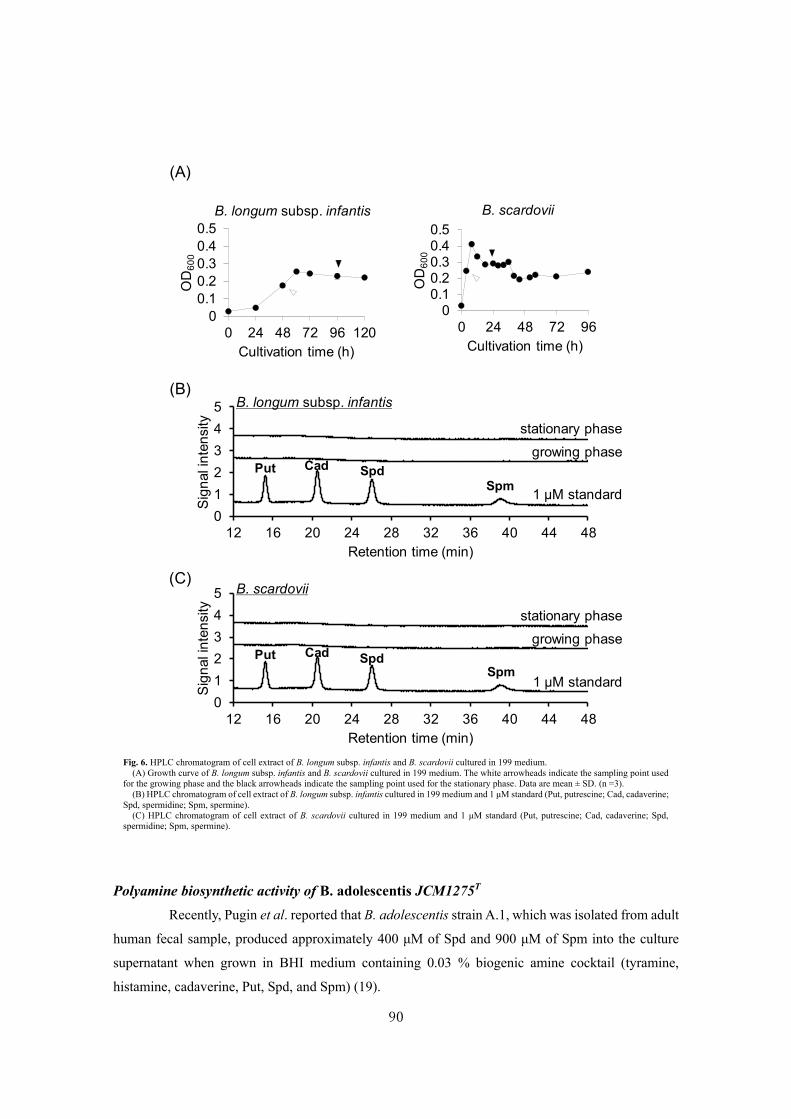
90
Polyamine biosynthetic activity of B. adolescentis JCM1275T
Recently, Pugin et al. reported that B. adolescentis strain A.1, which was isolated from adult
human fecal sample, produced approximately 400 μM of Spd and 900 μM of Spm into the culture
supernatant when grown in BHI medium containing 0.03 % biogenic amine cocktail (tyramine,
histamine, cadaverine, Put, Spd, and Spm) (19).
00.10.20.30.40.5
0 24 48 72 96
OD
60
0
Cultivation time (h)
B. scardovii
0
0.1
0.2
0.3
0.4
0.5
0 24 48 72 96 120
OD
60
0
Cultivation time (h)
B. longum subsp. infantis
(A)
0
1
2
3
4
5
12 16 20 24 28 32 36 40 44 48
Sig
nal in
ten
sity
Retention time (min)
(B)
growing phase
stationary phase
Put Cad SpdSpm
B. longum subsp. infantis
1 μM standard
0
1
2
3
4
5
12 16 20 24 28 32 36 40 44 48
Sig
nal in
ten
sity
Retention time (min)
1 μM standard
growing phase
stationary phase
Put Cad SpdSpm
(C)B. scardovii
Fig. 6. HPLC chromatogram of cell extract of B. longum subsp. infantis and B. scardovii cultured in 199 medium.
(A) Growth curve of B. longum subsp. infantis and B. scardovii cultured in 199 medium. The white arrowheads indicate the sampling point used
for the growing phase and the black arrowheads indicate the sampling point used for the stationary phase. Data are mean ± SD. (n =3).
(B) HPLC chromatogram of cell extract of B. longum subsp. infantis cultured in 199 medium and 1 μM standard (Put, putrescine; Cad, cadaverine;
Spd, spermidine; Spm, spermine).
(C) HPLC chromatogram of cell extract of B. scardovii cultured in 199 medium and 1 μM standard (Put, putrescine; Cad, cadaverine; Spd,
spermidine; Spm, spermine).

91
Because B. adolescentis A.1 is not currently available in any culture collections, the author
measured polyamine concentration in
the culture supernatant of type strain
(JCM1275T) of B. adolescentis grown
in BHI medium containing 0.03 %
biogenic amine cocktail for
comparison of the values of B.
adolescentis A.1 in the literature. The
concentrations of Put, Spd, and Spm
in the culture supernatant of B.
adolescentis JCM1275T in BHI
medium were 101 ± 1.1 μM, 16 ± 0.3
μM, and 7.5 ± 0.3 μM, respectively.
These values were not significantly
different from the concentrations of
polyamines originally found in the
BHI medium (Fig. 7A). Moreover, in
the BHI medium containing 0.03 %
biogenic amine cocktail (Fig. 7B), B.
adolescentis JCM1275T did not
export Spd or Spm. The growth of B.
adolescentis JCM1275T was not
changed by biogenic amine cocktail
supplementation (Fig. 8).
Known polyamine biosynthetic,
degradation, and transport
proteins in tested Bifidobacterium
species
Homologs of AguB
(putrescine carbamoyl transferase), PlaP (low-affinity putrescine importer) and PuuP (high-affinity
putrescine importer) were found in all tested Bifidobacterium species (Fig. 9A) by BlastP analysis. B.
adolescentis encodes an AguD (putrescine-agmatine antiporter) homolog (Fig. 9A). B. breve and B.
longum subsp. longum encode a homolog of NCPAH (N-carbamoylputrescine amidohydrolase) (Fig.
9A). B. catenulatum, B. kashiwanohense, and B. pseudocatenulatum encode an AguA (agmatine
deiminase) homolog (Fig. 9A). Homologs of PuO (putrescine oxidase) and PuuB (gamma-
Con
c.
(μM
)
MediumB. adolescentis JCM1275T
culture supernatant
0
500
1000
1500
2000
2500
3000
3500
4000
Put Spd Spm
Con
c.
(μM
)
0
20
40
60
80
100
120
Put Spd Spm
(A)
(B)
Fig. 7. Polyamine concentrations in the culture supernatant of B. adolescentis JCM1275T grown in BHI medium and BHI medium containing biogenic amines.
(A) Polyamine concentrations in the culture supernatant of B. adolescentis JCM1275T grown in BHI medium.
(B) Polyamine concentrations in the culture supernatant of B. adolescentis JCM1275T grown in BHI medium containing 0.03 % biogenic amine cocktail.
The white bars indicate the polyamine concentrations of the medium after incubation for 48 h at 37 °C in an anaerobic chamber. The black bars indicate the polyamine concentrations of the B. adolescentis JCM1275T culture supernatant grown in BHI medium and in BHI medium containing biogenic amine cocktail for 48 h at 37 °C in an anaerobic chamber. Data are represented as mean ± SD (n = 3).
0
0.1
0.2
0.3
0.4
0.5
BHI BHI+biogenicamine
OD
600
Fig. 8. Growth of B. adolescentis JCM1275T on BHI medium and BHI medium containing 0.03 % biogenic amine cocktail.
Growth of B. adolescentis JCM1275T was monitored by measuring the OD600. OD600 value of B. adolescentis JCM1275T grown in BHI medium and BHI medium containing 0.03 % biogenic amine cocktail for 48 hours is shown. Data are mean ± SD. (n =3).

92
glutamylputrescine oxidoreductase) were not found in the tested Bifidobacterium species (Fig. 9A).
Except for B. bifidum, tested bifidobacteria possess homologs of GabT (4-aminobutyrate
aminotransferase), PatA (putrescine aminotransferase), PuuA (gamma-glutamylputrescine synthetase),
and PuuE (4-aminobutyrate aminotransferase) (Fig. 9A). Homologs of GabD (succinate-semialdehyde
dehydrogenase) and PuuC (NADP/NAD-dependent aldehyde dehydrogenase) were found in 5 species
(B. breve, B. catenulatum, B. gallicum, B. pseudocatenulatum, and B. scardovii) (Fig. 9A). A homolog
of PatD (gamma-aminobutyraldehyde dehydrogenase) was found in 6 species (B. breve, B.
catenulatum, B. gallicum, B. longum subsp. longum, B. pseudocatenulatum, and B. scardovii). B.
gallicum and B. scardovii encode a PuuD (gamma-glutamyl-gamma-aminobutyrate hydrolase)
homolog (Fig. 9A). There is no known Spd biosynthetic and transport protein homolog in analyzed
Bifidobacterium species (Fig. 9B). Only in B. animalis subsp. lactis, a PaiA (spermidine/spermine N1-
acetyltransferase) homolog was found (Fig. 9B).
B. adolescentis
B. angulatum
B. animaslis subsp. lactis
B. bifidum
B. breve
B. catenulatum
B. gallicum
B. kashiwanohense
B. longum subsp. infantis
B. longum subsp. longum
B. pseudocatenulatum
B. scardovii
Ag
uA
Agu
B
NC
PA
H
SpeB
S
peC
S
peF
Pla
PP
otE
PuuP
PotF
Agu
D
AdiA
SpeA
Put
PotG
PotH
PotI
SapB
SapC
SapD
SapF
B. adolescentis
B. angulatum
B. animaslis subsp. lactis
B. bifidum
B. breve
B. catenulatum
B. gallicum
B. kashiwanohense
B. longum subsp. infantis
B. longum subsp. longum
B. pseudocatenulatum
B. scardovii
AA
TA
PA
UH
CA
SD
HC
AS
DC
SpeD
SpeE
Md
tIM
dtJ
PotD
Spd
PotC
PotB
PotA
(A)
(B)
PuuA
PuuB
PuuC
PuuD
PuuE
BltD
PaiA
GabD
GabT
PatA
PatD
PuO
Fig. 9. Occurrence of homologous proteins responsible for the synthesis, degradation, and transport of polyamines in the genomes of tested human indigenous Bifidobacterium species.
(A) Homologous proteins responsible for the biosynthesis, degradation, and transport of putrescine in the tested human indigenous Bifidobacterium species.
(B) Homologous proteins responsible for the biosynthesis, degradation, and tranasport of spermidine in the tested human indigenous Bifidobacterium species. Note that BltD and PaiA were reported to react with both Spd and Spm.
The BlastP analysis was performed against the genomes of the tested human indigenous Bifidobacterium using query proteins involving polyamine biosynthesis, transport, and degradation pathways. Gray boxes indicate the result of homologs with scores > 100 bits and white boxes indicate that there were no homologs.

93
DISCUSSION
Of the tested Bifidobacterium species, Put concentration in the culture supernatant of 8
species (B. adolescentis, B. angulatum, B. breve, B. catenulatum, B. faecale, B. kashiwanohense, B.
longum subsp. longum, and B. scardovii) was significantly decreased (Fig. 2B). All 8 species that
appeared to take up Put from the medium encode a PlaP homolog and a PuuP homolog (Fig. 9A).
Therefore, these results suggest that PlaP and PuuP homologs are involved in the observed Put uptake.
However, the other 5 species (B. animalis subsp. lactis, B. bifidum, B. gallicum, B. longum subsp.
infantis, and B. pseudocatenulatum) possessing the PuuP and PlaP homologs did not show Put uptake
(Figs 2B and 9A). These results suggest that these PuuP and PlaP homologs are not functional or were
not expressed in the culture conditions used in this study. Although 8 species appeared to take up Put
from the media, intracellular Put was not detected in them (Fig. 2A). These 8 species possess the PuuA
and PuuE homologs (Fig. 9A), but the protein homologs to produce gamma-aminobutyric acid from
gamma-glutamylputrescine (PuuB, PuuC, and PuuD) were not completely conserved within the tested
Bifidobacterium species (Fig. 9A). On the other hand, 3 species (B. breve, B. catenulatum, and B.
scardovii), which appeared to take up Put from the medium but did not contain Put in the cell, possess
all the homologs of GabD, GabT, PatA, and PatD, which are responsible for the transaminase pathway
of putrescine degradation (22) (Fig. 9A). This suggests that these 3 species degrade Put via the
transaminase pathway. The other 5 species (B. adolescentis, B. angulatum, B. faecale, B.
kashiwanohense, B. longum subsp. longum) appear to possess a novel putrescine degradation pathway
because these strains possess neither a complete protein set of the transaminase pathway nor the
gamma-glutamylation pathway. Put concentration in the B. scardovii culture supernatant was found to
increase from the growing phase to the stationary phase (Fig. 2B). However, B. scardovii does not
possess homologs of AguD, PotE, or SapBCDF (Fig. 9A). These results suggest that B. scardovii
contains novel Put exporter(s).
Known Spd transporter homologs were not found in the tested Bifidobacterium species (Fig.
9B). Nevertheless, 5 species (B. adolescentis, B. breve, B. catenulatum, B. kashiwanohense, and B.
scardovii) appeared to take up Spd from the medium (Fig. 3B). These observations suggest that an
unknown Spd importer is present in these 5 species. Also, a known Spd biosynthetic protein homolog
was not found in the tested Bifidobacterium species (Fig. 3B). However, 11 species (B. adolescentis,
B. angulatum, B. animalis subsp. lactis, B. breve, B. catenulatum, B. faecale, B. kashiwanohense, B.
longum subsp. infantis, B. longum subsp. longum, B. pseudocatenulatum, and B. scardovii) contained
Spd in the cell when grown in GAM (Fig. 3A). Spd concentrations in the medium were decreased in
the culture supernatant of B. adolescentis, B. breve, B. catenulatum, B. kashiwanohense, and B.
scardovii (Fig. 3B). Furthermore, B. scardovii grown in the 199 medium contains no Spd (Fig. 6C).
These results suggest that intracellular Spd of B. adolescentis, B. breve, B. catenulatum, B.

94
kashiwanohense, and B. scardovii originates from the medium. Although B. scardovii showed the
highest Spd uptake activity in the tested bifidobacteria (Fig. 3B), the Spd concentration in the cells
was low (Fig. 3A). This suggests the presence of the Spd metabolism in the cells of B. scardovii.
However, homologs of BltD and PaiA, which are involved in the Spd metabolism, were not found in
B. scardovii (Fig. 9B). These results suggest that B. scardovii degrades Spd by unknown Spd
degradation protein(s). On the other hand, Spd concentrations in the culture supernatant of 6 species
(B. angulatum, B. animalis subsp. lactis, B. faecale, B. longum subsp. infantis, B. longum subsp.
longum, and B. pseudocatenulatum) were not decreased (Fig. 3B). These observations suggest that
these 6 species biosynthesize Spd using unknown Spd biosynthetic enzymes. However, intracellular
Spd of B. longum subsp. infantis grown in 199 medium was not observed (Fig. 6B). GAM is nutrition
rich medium containing crude extract of animal tissue and plant (18). It was considered that the Spd
biosynthetic pathway of B. longum subsp. infantis was activated by unknown compound(s) contained
in GAM.
Spm concentration in the culture supernatant of 5 species significantly decreased (Fig. 4B).
In bacteria, Spm uptake via PotABCD has been reported (27). However, these 5 species, which
appeared to take up Spm, have no PotABCD homolog (Fig. 9B). These results suggest that a novel
Spm importer(s) is present in these 5 species. On the other hand, compared to medium, Spm
concentration in the culture supernatant of growing phase of B. animalis subsp. lactis and B. longum
subsp. infantis were increased (Fig. 4B). In addition, Spm concentration in the culture supernatant of
B. longum subsp. longum increased from growing phase to stationary phase (Fig. 4B). No Spm
exporter has been reported so far. Therefore, it is conceivable that these 3 species possess a novel Spm
exporter(s). In this study, the author found that 4 species (B. angulatum, B. animalis subsp. lactis, B.
faecale, and B. pseudocatenulatum) contained Spm in the cell (Fig. 4A). A decrease in Spm
concentration in the culture supernatant was not observed with all these species (Fig. 4B), suggesting
that these 4 species biosynthesize Spm using unknown Spm biosynthetic enzymes. However, B.
scardovii did not contain Spm in its cells (Fig. 4A), although the concentration of Spm in the culture
supernatant of B. scardovii was found to decrease (Fig. 4B). Therefore, the possibility of the Spm
metabolism was considered in B. scardovii cells but homologs of BltD and PaiA, which are involved
in Spd metabolism, were not found in B. scardovii (Fig. 9B). These results suggest that B. scardovii
degrades Spm by novel Spm degradation protein(s).
Pugin et al. reported that B. adolescentis A.1, which was isolated by them, exports a large
amount of polyamine into the culture supernatant (19). However, the author could not reproduce this
using B. adolescentis JCM1275T grown in the same medium (BHI medium containing 0.03 % biogenic
amines) used in their study (Fig. 7B). Moreover, B. adolescentis JCM1275T did not produce Spd and
Spm when grown in BHI medium without biogenic amines (Fig. 7A).
To date, it has been thought that Bifidobacterium species have no polyamine biosynthetic

95
ability (13). In the present study, the author suggested that 6 species (B. angulatum, B. animalis subsp.
lactis, B. faecale, B. longum subsp. infantis, B. longum subsp. longum, and B. pseudocatenulatum) of
human indigenous Bifidobacterium has Spd and/or Spm biosynthetic ability. Furthermore, to the best
of my knowledge, polyamine transport ability of human indigenous Bifidobacterium species has not
been reported. My results indicate that 10 species of human indigenous Bifidobacterium possess
polyamine transport ability. In the future, identification of the polyamine biosynthetic and transport
proteins of Bifidobacterium species at the genetic level is necessary for understanding the polyamine
metabolism of Bifidobacterium.
96
REFERENCES
1. Kibe, R., Kurihara, S., Sakai, Y., Suzuki, H., Ooga, T., Sawaki, E., Muramatsu, K.,
Nakamura, A., Yamashita, A., Kitada, Y., Kakeyama, M., Benno, Y., and Matsumoto, M.
(2014) Upregulation of colonic luminal polyamines produced by intestinal microbiota
delays senescence in mice. Sci Rep 4, 4548
2. Matsumoto, M., Kakizoe, K., and Benno, Y. (2007) Comparison of fecal microbiota and
polyamine concentration in adult patients with intractable atopic dermatitis and healthy
adults. Microbiol Immunol 51, 37-46
3. Matsumoto, M., Kibe, R., Ooga, T., Aiba, Y., Kurihara, S., Sawaki, E., Koga, Y., and Benno,
Y. (2012) Impact of intestinal microbiota on intestinal luminal metabolome. Sci Rep 2, 233
4. Noack, J., Kleessen, B., Proll, J., Dongowski, G., and Blaut, M. (1998) Dietary guar gum
and pectin stimulate intestinal microbial polyamine synthesis in rats. J Nutr 128, 1385-1391
5. Noack, J., Dongowski, G., Hartmann, L., and Blaut, M. (2000) The human gut bacteria
Bacteroides thetaiotaomicron and Fusobacterium varium produce putrescine and
spermidine in cecum of pectin-fed gnotobiotic rats. J Nutr 130, 1225-1231
6. Nishijima, S., Suda, W., Oshima, K., Kim, S. W., Hirose, Y., Morita, H., and Hattori, M.
(2016) The gut microbiome of healthy Japanese and its microbial and functional uniqueness.
DNA Res 23, 125-133
7. Nakayama, J., Watanabe, K., Jiang, J., Matsuda, K., Chao, S. H., Haryono, P., La-Ongkham,
O., Sarwoko, M. A., Sujaya, I. N., Zhao, L., Chen, K. T., Chen, Y. P., Chiu, H. H., Hidaka,
T., Huang, N. X., Kiyohara, C., Kurakawa, T., Sakamoto, N., Sonomoto, K., Tashiro, K.,
Tsuji, H., Chen, M. J., Leelavatcharamas, V., Liao, C. C., Nitisinprasert, S., Rahayu, E. S.,
Ren, F. Z., Tsai, Y. C., and Lee, Y. K. (2015) Diversity in gut bacterial community of school-
age children in Asia. Sci Rep 5, 8397
8. Iwabuchi, N., Takahashi, N., Xiao, J. Z., Miyaji, K., and Iwatsuki, K. (2007) In vitro Th1
cytokine-independent Th2 suppressive effects of bifidobacteria. Microbiol Immunol 51, 649-
660
9. Sivan, A., Corrales, L., Hubert, N., Williams, J. B., Aquino-Michaels, K., Earley, Z. M.,
Benyamin, F. W., Lei, Y. M., Jabri, B., Alegre, M. L., Chang, E. B., and Gajewski, T. F.
(2015) Commensal Bifidobacterium promotes antitumor immunity and facilitates anti-PD-
L1 efficacy. Science 350, 1084-1089
10. Kim, S. W., Kim, H. M., Yang, K. M., Kim, S. A., Kim, S. K., An, M. J., Park, J. J., Lee, S.
K., Kim, T. I., Kim, W. H., and Cheon, J. H. (2010) Bifidobacterium lactis inhibits NF-
kappaB in intestinal epithelial cells and prevents acute colitis and colitis-associated colon
cancer in mice. Inflamm Bowel Dis 16, 1514-1525

97
11. Fukuda, S., Toh, H., Hase, K., Oshima, K., Nakanishi, Y., Yoshimura, K., Tobe, T., Clarke, J.
M., Topping, D. L., Suzuki, T., Taylor, T. D., Itoh, K., Kikuchi, J., Morita, H., Hattori, M.,
and Ohno, H. (2011) Bifidobacteria can protect from enteropathogenic infection through
production of acetate. Nature 469, 543-547
12. Matsumoto, M., Kurihara, S., Kibe, R., Ashida, H., and Benno, Y. (2011) Longevity in mice
is promoted by probiotic-induced suppression of colonic senescence dependent on
upregulation of gut bacterial polyamine production. PLoS One 6, e23652
13. Hamana, K. (1997) Polyamine Distribution Patterns in Gram-Positive Eubacteria : The
Absence of Cellular Polyamine Synthesis. Ann. Rep. Coo. Med. Care Technol. Gunma Univ.
17, 137-144
14. Bottacini, F., Ventura, M., van Sinderen, D., and O'Connell Motherway, M. (2014)
Diversity, ecology and intestinal function of bifidobacteria. Microb Cell Fact 13 Suppl 1,
S4
15. Choi, J. H., Lee, K. M., Lee, M. K., Cha, C. J., and Kim, G. B. (2014) Bifidobacterium
faecale sp. nov., isolated from human faeces. Int J Syst Evol Microbiol 64, 3134-3139
16. Yatsunenko, T., Rey, F. E., Manary, M. J., Trehan, I., Dominguez-Bello, M. G., Contreras,
M., Magris, M., Hidalgo, G., Baldassano, R. N., Anokhin, A. P., Heath, A. C., Warner, B.,
Reeder, J., Kuczynski, J., Caporaso, J. G., Lozupone, C. A., Lauber, C., Clemente, J. C.,
Knights, D., Knight, R., and Gordon, J. I. (2012) Human gut microbiome viewed across age
and geography. Nature 486, 222-227
17. Milani, C., Duranti, S., Lugli, G. A., Bottacini, F., Strati, F., Arioli, S., Foroni, E., Turroni,
F., van Sinderen, D., and Ventura, M. (2013) Comparative genomics of Bifidobacterium
animalis subsp. lactis reveals a strict monophyletic bifidobacterial taxon. Appl Environ
Microbiol 79, 4304-4315
18. Gotoh, A., Nara, M., Sugiyama, Y., Sakanaka, M., Yachi, H., Kitakata, A., Nakagawa, A.,
Minami, H., Okuda, S., Katoh, T., Katayama, T., and Kurihara, S. (2017) Use of Gifu
Anaerobic Medium for culturing 32 dominant species of human gut microbes and its
evaluation based on short-chain fatty acids fermentation profiles. Biosci Biotechnol
Biochem 81, 2009-2017
19. Pugin, B., Barcik, W., Westermann, P., Heider, A., Wawrzyniak, M., Hellings, P., Akdis, C.
A., and O'Mahony, L. (2017) A wide diversity of bacteria from the human gut produces and
degrades biogenic amines. Microb Ecol Health Dis 28, 1353881
20. Sakanaka, M., Sugiyama, Y., Kitakata, A., Katayama, T., and Kurihara, S. (2016)
Carboxyspermidine decarboxylase of the prominent intestinal microbiota species
Bacteroides thetaiotaomicron is required for spermidine biosynthesis and contributes to
normal growth. Amino Acids 48, 2443-2451
98
21. Camacho, C., Coulouris, G., Avagyan, V., Ma, N., Papadopoulos, J., Bealer, K., and
Madden, T. L. (2009) BLAST+: architecture and applications. BMC Bioinformatics 10, 421
22. Schneider, B. L., Hernandez, V. J., and Reitzer, L. (2013) Putrescine catabolism is a
metabolic response to several stresses in Escherichia coli. Mol Microbiol 88, 537-550
23. van Hellemond, E. W., van Dijk, M., Heuts, D. P., Janssen, D. B., and Fraaije, M. W. (2008)
Discovery and characterization of a putrescine oxidase from Rhodococcus erythropolis
NCIMB 11540. Appl Microbiol Biotechnol 78, 455-463
24. Kurihara, S., Oda, S., Kato, K., Kim, H. G., Koyanagi, T., Kumagai, H., and Suzuki, H.
(2005) A novel putrescine utilization pathway involves gamma-glutamylated intermediates
of Escherichia coli K-12. J Biol Chem 280, 4602-4608
25. Woolridge, D. P., Martinez, J. D., Stringer, D. E., and Gerner, E. W. (1999) Characterization
of a novel spermidine/spermine acetyltransferase, BltD, from Bacillus subtilis. Biochem J
340 ( Pt 3), 753-758
26. Forouhar, F., Lee, I. S., Vujcic, J., Vujcic, S., Shen, J., Vorobiev, S. M., Xiao, R., Acton, T.
B., Montelione, G. T., Porter, C. W., and Tong, L. (2005) Structural and functional evidence
for Bacillus subtilis PaiA as a novel N1-spermidine/spermine acetyltransferase. J Biol Chem
280, 40328-40336
27. Yao, X., and Lu, C. D. (2014) Functional characterization of the potRABCD operon for
spermine and spermidine uptake and regulation in Staphylococcus aureus. Curr Microbiol
69, 75-81
99
SUMMARY
Bifidobacteria are members of the human intestinal microbiota, being numerically dominant
in the colon of infants, and also being prevalent in the large intestine of adults. In this study, the author
measured the concentrations of major polyamines (putrescine, spermidine, and spermine) in cells and
culture supernatant of 13 species of human indigenous Bifidobacterium at growing and stationary
phase. Except for Bifidobacterium bifidum and Bifidobacterium gallicum, 11 species contained
spermidine and/or spermine when grown in Gifu anaerobic medium (GAM). However,
Bifidobacterium scardovii and Bifidobacterium longum subsp. infantis, which contain spermidine
when grown in GAM, did not contain spermidine when grown in polyamine-free 199 medium. Of the
tested 13 Bifidobacterium species, 10 species showed polyamine transport ability. Combining
polyamine concentration analysis in culture supernatant and in cells, with basic local alignment search
tool analysis suggested that 11 species of tested human indigenous Bifidobacterium, except for B.
bifidum and B. gallicum may possess novel polyamine biosynthetic proteins and/or transporters

100
SECTION III
Analysis of a novel putrescine exporter SapBCDF of Escherichia coli
Polyamines in the colonic lumen are derived from gut microbes and impact the health of
animals either negatively (1-3) or positively (4-6). Briefly, polyamine catabolism contributes to
enterotoxigenic Bacteroides fragilis-induced colon tumorigenesis (1), and levels of rectal mucosal
polyamines are increased colorectal adenoma (3). On the other hand, upregulation of colonic luminal
polyamines produced by the gut microbes delays senescence in mice (4,5). At physiological pH
polyamines are positively charged and hydrophilic, and therefore cannot pass through hydrophobic
cytoplasmic membranes. Consequently, polyamine transporters are required for their uptake and
export in the gut microbes, and the concentration of polyamines in the intestinal tract results from the
balance of uptake by polyamine importers and export by polyamine exporters of the gut microbes.
In Escherichia coli which is a model organism of the gut microbes, putrescine is synthesized
from ornithine by ornithine decarboxylase (SpeC/SpeF) (7,8) or from arginine by the sequential
actions of arginine decarboxylase (SpeA) (9) and agmatine ureohydrolase (SpeB) (10). Putrescine is
converted to spermidine, another polyamine, by the addition of an aminopropyl group derived from
decarboxylated S-adenosylmethionine by spermidine synthase (SpeE) (11).
Five putrescine importers in E. coli have been experimentally identified. PotFGHI has been
identified as an ATP-dependent putrescine transporter of the ATP-binding cassette (ABC) transporter
family (12). PotABCD is a spermidine transporter of the ABC transporter family that takes up
putrescine with lower affinity (13). PuuP was discovered as a putrescine importer dependent on proton
motive force (14) and is indispensable when E. coli grows on putrescine as a sole carbon or nitrogen
source (14). PlaP is a proton-dependent putrescine importer that is important when E. coli exhibits
surface motility (15). PotE is responsible for both excretion and uptake of putrescine (16,17). PotE is
a proton-dependent putrescine importer at neutral pH, but at acidic pH PotE is a putrescine-ornithine
antiporter (17). An acid-inducible ornithine decarboxylase is encoded by speF, which is located in the
same operon as potE (8). SpeF converts ornithine to putrescine with consumption of a proton, and
PotE exports putrescine with uptake of ornithine (16). Through this process E. coli adapts to the acidic
environment. In addition, at neutral pH, E. coli excretes putrescine into environment independently of
PotE (18), suggesting that there are other unidentified putrescine exporters in E. coli.
Considering the importance of gut microbes as the source of polyamines in colon, obtaining
a better understanding of polyamine export is clearly of interest. In this SECTION, the author
performed a genome-wide screening for novel putrescine exporters of E. coli and biochemically
demonstrated that the sapBCDF operon contributes to putrescine export from the cell to the
environment.
101
MATERIALS AND METHODS
Strains and plasmids
Strains used in the present study are listed in Table 1 except that the Keio gene knockout
collection (19) used for initial screening for the putrescine exporter. Strains used for initial screening
for the putrescine exporter are listed in Table 2. P1 transduction (20) was used to transfer the
chromosomal deletion of genes: ΔpuuP (JW1289) in the Keio collection (19), into MG1655 (wild-
type background), generating SK614 (ΔpuuP::FRT-kan+-FRT). Plasmid pCP20 (21) was introduced
to eliminate the kanamycin resistance gene (kan+), generating SK623 (ΔpuuP::FRT). Gene
disruptions of speB, speC, and sapBCDF were performed employing a previously described method
using pKD3 or pKD13 (21). pSK607 (pACYC184-sapB+C+D+F+) was constructed as follows. The
4,142 bp DNA fragment including sapBCDF and 500-bp of the upstream region of sapB on the
chromosome of E. coli MG1655 was amplified by PCR using KOD-plus- polymerase (Toyobo, Osaka,
Japan), "TTT_HindIII_sapBCDF_start_side" and "AAA_SphI_sapBCDF_term_side" as primers, and
genomic DNA of E. coli MG1655 as template. The amplified fragment was cloned into pACYC184
digested by HindIII and SphI, and the cloned region was sequenced to confirm there was no mutation.
Media and Growth conditions
M9 + tryptone medium (M9 minimal medium, except that 1 % Bacto-tryptone was used
instead of 0.2 % glucose) (22) was employed for the bactericidal assay (23) and for analysis of
putrescine concentration of the culture supernatant of strains with a deletion of puuP encoding a
putrescine importer previously described (14). Because puuP is negatively regulated by succinate (24),
0.2 % of sodium succinate was supplemented to the M9 + tryptone in analysis of putrescine
concentration of culture supernatant of strains with puuP+ backgrounds. One millimolar stable isotope-
labeled arginine was supplemented to the M9 + tryptone medium in analysis of stable isotope-labeled
putrescine concentration of the culture supernatant of strains. In screening for putrescine exporters,
strains were grown in 5 mL of M9 + tryptone + succinate medium in 20 mL test tubes at 37 °C, with
reciprocal shaking at 140 rpm for 6 hours. In the other experiments, strains were grown at 37 °C with
reciprocal shaking at 140 rpm in 60 mL of media in a 300 mL Erlenmeyer flask.
Bactericidal assay
To assess the susceptibility of E. coli MG1655 and YS40 (MG1655 except ΔsapBCDF)
strains to an antimicrobial peptide LL-37, the experiment was performed according to Harwig et al.
(23) with some modifications. Briefly, E. coli MG1655 and YS40 (MG1655 except ΔsapBCDF) were
grown in M9 + tryptone medium with 140 rpm at 37 °C for 4 hours. An assay medium was prepared
by adding 100 μL of Luria-Bertani (LB) medium to 6.9 mL of 10 mM sodium phosphate buffer (pH
102
7.4) and warmed to 37 °C prior to use. Cells were washed with ice-cold 10 mM sodium phosphate
buffer (pH 7.4), and resuspended in the same buffer to a concentration of 5 × 10⁶ cells/mL. A reaction
mixture containing 10 μL of cell suspension, 5 μL of LL-37, and 35 μL of assay medium, was
incubated for 2 hours at 37 °C. The reaction was stopped by adding 450 μL of ice-cold 150 mM sodium
chloride to the reaction mixture. After the reaction, the reaction mixture was serially diluted with ice-
cold 10 mM sodium phosphate buffer (pH 7.4) and plated on LB medium. Plates were incubated at
37 °C for 22 hours and the numbers of colonies were counted to quantify cell viability in the reaction
mixture. Cell viability in the reaction mixture was quantified by counting colony formations. Survival
ratios were calculated by dividing the colony forming units of the cells treated with LL-37 by those of
the cells without LL-37 treatment.
Quantification of polyamines
Polyamines concentrations were quantified by high-performance liquid chromatography
(HPLC). HPLC analysis and sample preparation was performed as described previously (25). Briefly,
a normal-phase HPLC system (Chromaster, Hitachi Co., Ltd., Tokyo, Japan) equipped with a cation-
exchange column (#2619PH, 4.6 × 50 mm; Hitachi) was used for separation of polyamines. Eluted
polyamines were derivatized with o-phthalaldehyde using the post-column method and were detected
using a fluorescence detector (λex 340 nm, λem 435 nm). The concentration of each polyamine was
calculated based on a standard curve created using standards of known concentrations. In the
preparation of culture supernatant samples, 500 μL of culture was centrifuged (18,700 ×g, 4 °C, 5 min)
and the supernatant was collected. To remove proteins, 1/10 volume of 100 % (w/v) trichloroacetic
acid was added and mixed using a Vortex machine followed by a centrifugation (18,700 × g, 4 °C, 30
min). After the centrifugation, polyamines in the supernatant were analyzed by HPLC. In the
preparation of whole-cell samples, 500 μL of OD600 = 0.5 (samples cultured for 2 hours) or OD600 = 1
(samples cultured for 4 to 24 hours) culture was centrifuged and the pellet was washed with 1 mL of
ice-cold M9 minimal medium without glucose. The washed pellet was resuspended in 300 μL of 5 %
(w/v) trichloroacetic acid and boiled for 15 min to rupture the cells. The suspension was centrifuged
(21,500 ×g, 4 °C, 15 min), the supernatant was applied to the HPLC column after filtration using
Cosmonice filter W (Nacalai Tesque, Kyoto, Japan), and the precipitated protein was dissolved in 300
μL of 0.1 N NaOH. Protein concentration of the solution was quantified by the Bradford method using
a Bio-Rad protein assay kit (Bio-Rad Laboratories, Hercules, CA, USA). The resulting concentration
of putrescine was expressed as nmol/mg of total cell protein.
Detection of stable isotope-labeled putrescine by gas chromatography-mass spectrometry
The amount of stable isotope-labeled putrescine was determined by gas chromatography-
mass spectrometry (GC-MS) using a modified version of the methods described in Chen et al (26).
103
E. coli strains were cultured for 8 hours in M9 + tryptone medium supplemented with stable isotope-
labeled L-[13C6, 15N4]-arginine (S.I.Arg, Wako Pure Chemicals, Osaka, Japan) at a final concentration
of 1 mM. Culture supernatant of the strain grown in S.I.Arg was mixed with 10 % (v/v) of 100 % (w/v)
trichloroacetic acid to precipitate proteins. The sample was then clarified by centrifugation at 18,700
×g for 35 min at 4 °C, and 600 μL of the supernatant was extracted by vortexing for 1 min in 2 mL
diethyl ether. The emulsion was then separated by centrifugation at 15,000 ×g for 5 min at 4 °C, and
the ether layer containing lipids, carbohydrates, and other potential contaminants was discarded, and
the aqueous layer was extracted in the same manner once more. A 500 μL aliquot was supplemented
with 10 μL 0.01 % (w/v) 1, 6-hexanediamine (Kanto Chemical, Tokyo, Japan) as internal standard,
and adjusted to pH 11.5 ± 0.5 with 5 M NaOH. To carry out the N-ethoxycarbonylation of the amines,
1 mL of diethyl ether containing 50 μL of ethylchloroformate (Kanto Chemical) was added to the
sample solution. The reaction mixture was shaken at room temperature for 30 min, and then
centrifuged at 15,000 ×g for 5 min at 4 °C. The ether layer containing the polyamine N- ethoxycarbonyl
derivatives was transferred to a glass tube with screw cap. This derivatization reaction was repeated
by re-extracting the aqueous phase with 1 mL of diethyl ether containing 50 μL ethylchloroformate.
The ether layers from the two extractions were combined and dried under a dry nitrogen stream. Dried
N-ethoxylcarbonyl polyamine derivatives were taken up in 100 μL of ethyl acetate to which 200 μL
of trifluoroacetic acid anhydride (Sigma-Aldrich, St. Louis, MO, USA) was added. The mixture in
sealed glass tubes were placed on a 75 °C heating block for 60 min to complete the trifluoroacetylation
reaction, and then completely dried under a dry nitrogen stream. Derivatives were reconstituted in 200
μL of ethyl acetate and 2 μL of derivatized samples were injected into a GC-MS. Analysis were carried
on an Equity-5 capillary column (30 m × 0.25 mm, 0.25 μm film thickness, Sigma-Aldrich) using
helium as a carrier gas. Temperatures of injector and source were 260 °C and 150 °C, respectively.
The GC oven was programmed from 140 °C to 190 °C at 8 °C /min followed by a 4-min hold, then to
300 °C at 20 °C /min, followed by a 4 min hold. A final temperature increased to 320 °C at 20 °C /min
was held as bake out for 4 min. Fragment ions were monitored in selected ion monitoring mode, and
the ion with m/z +355 was used as basis fragment for putrescine. Extraction and derivatization rates
were standardized using 1,6-hexanediamine, and putrescine was quantified using external calibration
curves.
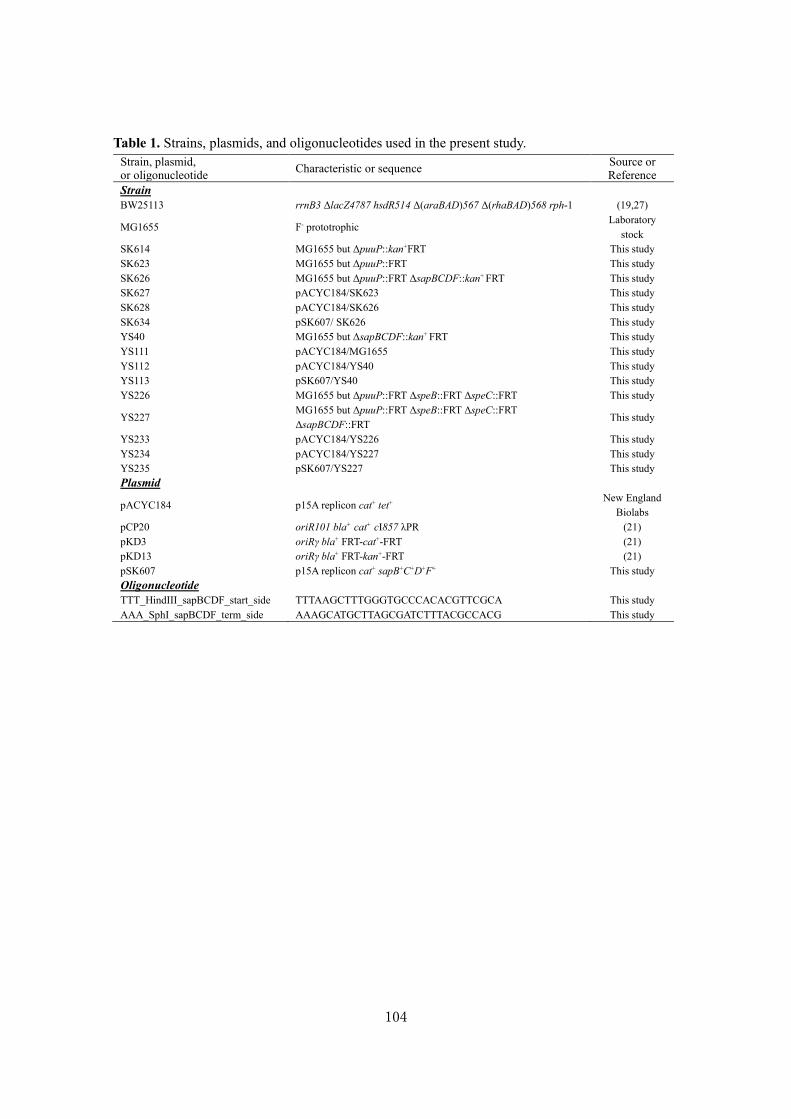
104
Table 1. Strains, plasmids, and oligonucleotides used in the present study.
Strain, plasmid, or oligonucleotide
Characteristic or sequence Source or Reference
Strain
BW25113 rrnB3 ΔlacZ4787 hsdR514 Δ(araBAD)567 Δ(rhaBAD)568 rph-1 (19,27)
MG1655 F- prototrophic Laboratory
stock
SK614 MG1655 but ΔpuuP::kan+FRT This study
SK623 MG1655 but ΔpuuP::FRT This study
SK626 MG1655 but ΔpuuP::FRT ΔsapBCDF::kan+ FRT This study
SK627 pACYC184/SK623 This study
SK628 pACYC184/SK626 This study
SK634 pSK607/ SK626 This study
YS40 MG1655 but ΔsapBCDF::kan+ FRT This study
YS111 pACYC184/MG1655 This study
YS112 pACYC184/YS40 This study
YS113 pSK607/YS40 This study
YS226 MG1655 but ΔpuuP::FRT ΔspeB::FRT ΔspeC::FRT This study
YS227 MG1655 but ΔpuuP::FRT ΔspeB::FRT ΔspeC::FRT
ΔsapBCDF::FRT This study
YS233 pACYC184/YS226 This study
YS234 pACYC184/YS227 This study
YS235 pSK607/YS227 This study
Plasmid
pACYC184 p15A replicon cat+ tet+ New England
Biolabs
pCP20 oriR101 bla+ cat+ cI857 λPR (21)
pKD3 oriRγ bla+ FRT-cat+-FRT (21)
pKD13 oriRγ bla+ FRT-kan+-FRT (21)
pSK607 p15A replicon cat+ sapB+C+D+F+ This study
Oligonucleotide
TTT_HindIII_sapBCDF_start_side TTTAAGCTTTGGGTGCCCACACGTTCGCA This study
AAA_SphI_sapBCDF_term_side AAAGCATGCTTAGCGATCTTTACGCCACG This study

105
Table 2. Strains from Keio collection used for putrescine exporter screening
and the concentration of putrescine (Put) in the culture supernatant.
Keio collection No.
Deleted gene
Put conc. (μM)
Keio collection No.
Deleted gene
Put conc. (μM)
JW0699 ybgH 75.5 JW0779 ybhG 53.8
JW1787 leuE 72.0 JW3236 yhdW 53.5
JW2562 eamB 69.9 JW3313 kefB 53.5
JW0798 rhtA 68.6 JW3423 livK 53.4
JW1052 mdtH 68.5 JW1322 mppA 53.0
JW2062 mdtD 66.7 JW0454 kefA 53.0
JW3209 aaeB 66.3 JW3333 frlA 52.4
JW3087 tdcC 66.2 JW3239 yhdZ 52.1
JW0531 emrE 65.0 JW3434 zntA 51.9
JW2061 mdtC 64.7 JW0563 cusB 51.7
JW1110 potC 64.2 JW0795 glnP 51.6
JW3469 arsB 62.5 JW0753 ybhI 51.5
JW2369 yfdV 62.1 JW0863 macB 51.5
JW1235 oppA 61.8 JW0794 glnQ 51.1
JW0066 thiP 61.2 JW3482 mdtF 50.7
JW3422 livH 60.1 JW2304 hisM 50.6
JW0562 cusF 60.1 JW0046 kefC 50.3
JW3035 ttdT 60.1 JW1111 potB 50.2
JW3508 yhjV 59.5 JW0564 cusA 50.1
JW0565 pheP 58.5 JW3633 setC 49.9
JW1469 yddG 58.1 JW0148 fhuD 49.9
JW3420 livG 56.5 JW3419 livF 49.6
JW0451 acrB 56.3 JW0108 aroP 49.4
JW3210 aaeA 56.3 JW1592 mdtJ 49.4
JW1591 mdtI 56.0 JW2060 mdtB 49.1
JW1109 potD 55.9 JW1902 yecC 49.1
JW0320 yahN 55.9 JW1903 yecS 49.1
JW3421 livM 55.8 JW0561 cusC 49.1
JW3425 livJ 55.4 JW0065 thiQ 49.0
JW0452 acrA 54.6 JW0069 setA 48.5
JW3481 mdtE 54.6 JW0391 brnQ 48.5
JW1487 gadC 54.4 JW1112 potA 48.4
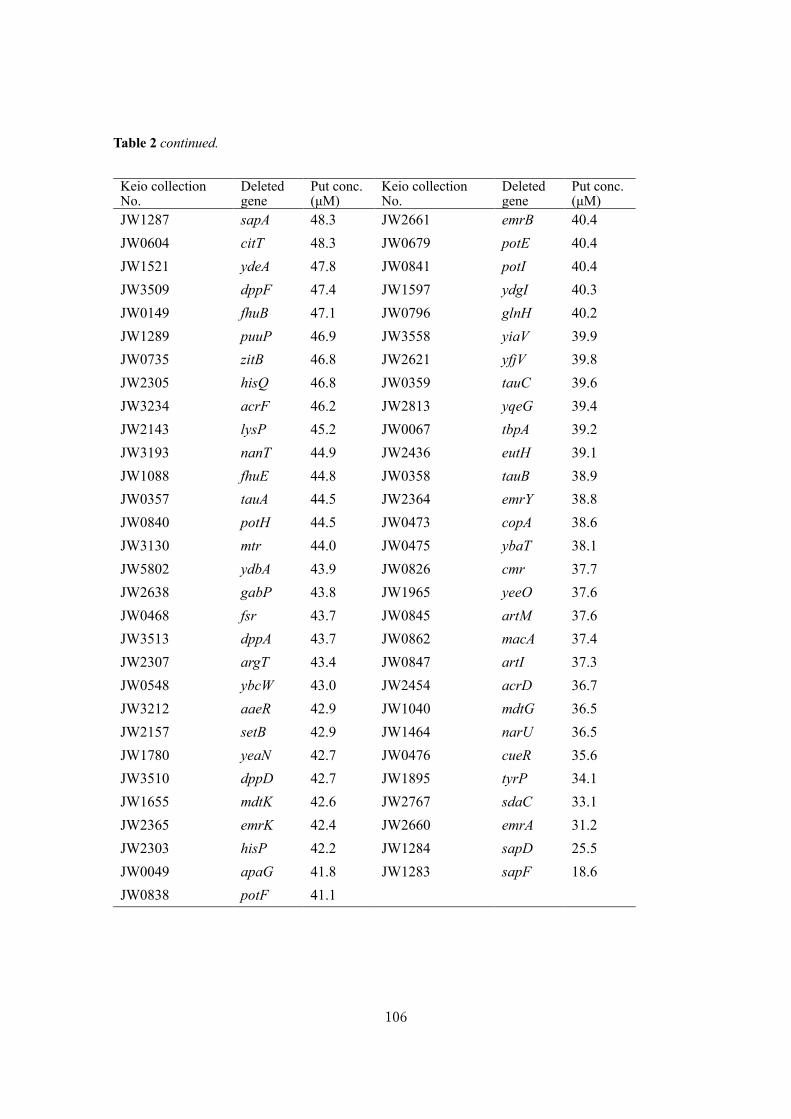
106
Table 2 continued.
Keio collection No.
Deleted gene
Put conc. (μM)
Keio collection No.
Deleted gene
Put conc. (μM)
JW1287 sapA 48.3 JW2661 emrB 40.4
JW0604 citT 48.3 JW0679 potE 40.4
JW1521 ydeA 47.8 JW0841 potI 40.4
JW3509 dppF 47.4 JW1597 ydgI 40.3
JW0149 fhuB 47.1 JW0796 glnH 40.2
JW1289 puuP 46.9 JW3558 yiaV 39.9
JW0735 zitB 46.8 JW2621 yfjV 39.8
JW2305 hisQ 46.8 JW0359 tauC 39.6
JW3234 acrF 46.2 JW2813 yqeG 39.4
JW2143 lysP 45.2 JW0067 tbpA 39.2
JW3193 nanT 44.9 JW2436 eutH 39.1
JW1088 fhuE 44.8 JW0358 tauB 38.9
JW0357 tauA 44.5 JW2364 emrY 38.8
JW0840 potH 44.5 JW0473 copA 38.6
JW3130 mtr 44.0 JW0475 ybaT 38.1
JW5802 ydbA 43.9 JW0826 cmr 37.7
JW2638 gabP 43.8 JW1965 yeeO 37.6
JW0468 fsr 43.7 JW0845 artM 37.6
JW3513 dppA 43.7 JW0862 macA 37.4
JW2307 argT 43.4 JW0847 artI 37.3
JW0548 ybcW 43.0 JW2454 acrD 36.7
JW3212 aaeR 42.9 JW1040 mdtG 36.5
JW2157 setB 42.9 JW1464 narU 36.5
JW1780 yeaN 42.7 JW0476 cueR 35.6
JW3510 dppD 42.7 JW1895 tyrP 34.1
JW1655 mdtK 42.6 JW2767 sdaC 33.1
JW2365 emrK 42.4 JW2660 emrA 31.2
JW2303 hisP 42.2 JW1284 sapD 25.5
JW0049 apaG 41.8 JW1283 sapF 18.6
JW0838 potF 41.1

107
RESULTS
Screening for a putrescine exporter
Based on the hypothesis that the putrescine concentration in the culture supernatant of strains
with a deletion of the gene encoding a putrescine exporter is lower than that of the parental strain, the
putrescine concentration was measured in the culture supernatant of 123 strains with deletions of genes
involved in or annotated as
transport systems (Fig. 1A and
Table 2). The deletion strains
were obtained from the Keio
collection, which is an E. coli
single gene deletion mutant
library that has been previously
described (19). The screening
indicated that the putrescine
concentration of culture
supernatant of E. coli ΔsapF
strain (JW1283) was the lowest
(18.6 μM) of the tested strains,
and the second lowest putrescine
concentration of the culture
supernatant was 25.5 μM
observed in ΔsapD strain
(JW1284). These values were
significantly lower than those of
the parental strain (BW25113,
48.8 μM) or the median (48.7
μM) of the strains tested (Fig.
1A). These results suggested that
sapD and sapF contribute to
putrescine export from the cell.
Putrescine concentration of the culture supernatant is not influenced by ΔsapA but is affect by
ΔsapBCDF
An in silico analysis predicts that sapD and sapF are located in the sapABCDF operon (Fig.
pSK607
ΔsapBCDF
(SK626 and YS40)
sapAsapBsapCsapDsapF
ymjA
A
B
80
70
60
50
40
30
20
10
0
Parental strain
ΔsapD
ΔsapFP
ut (μ
M)
1 kb
puuP
Fig. 1. Putrescine concentrations of culture supernatant of screened strains and depiction of putative sapABCDF operon.
(A) Putrescine concentrations of the culture supernatant of the screened strains. Bacterial strains were grown for 6 hours at 37 oC with reciprocal shaking at 140 rpm in 5 mL of M9 + tryptone + succinate medium in a 20 mL test tube. Culture supernatant was harvested and subjected to HPLC analysis. Dots in the box plot indicate putrescine concentration of culture supernatant of tested mutants. The concentration of putrescine of culture supernatant of parental strain (BW25113), ΔsapD (JW1284), and ΔsapF (JW1283) are indicated as solid dots.
(B) The putative sapABCDF operon and its deleted or subcloned regions in this study. Locations and directions of genes are indicated by arrows and the annotations of genes are indicated below the arrows. Locations of predicted promoters are shown by arrowheads: Gray arrowheads indicate σ54, black arrowheads indicate σ70. The deleted region of the chromosome in the ΔsapBCDF strains and cloned regions in the pACYC184 vector are shown in the illustration.
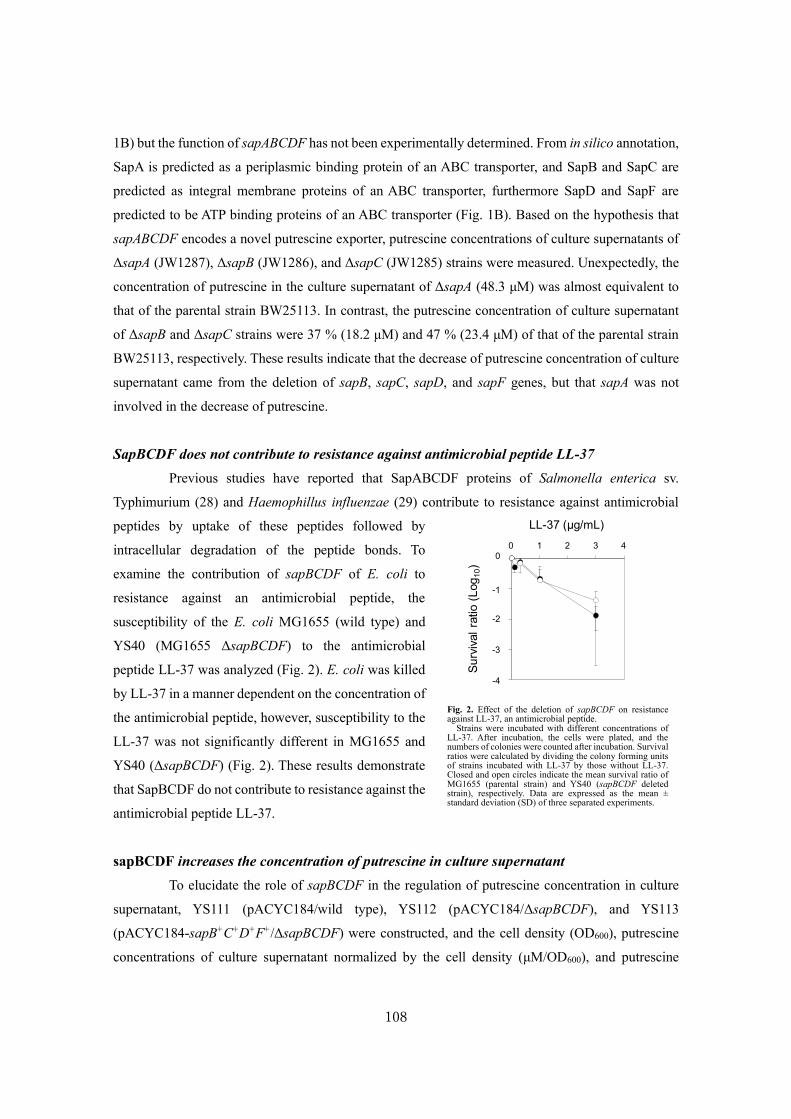
108
1B) but the function of sapABCDF has not been experimentally determined. From in silico annotation,
SapA is predicted as a periplasmic binding protein of an ABC transporter, and SapB and SapC are
predicted as integral membrane proteins of an ABC transporter, furthermore SapD and SapF are
predicted to be ATP binding proteins of an ABC transporter (Fig. 1B). Based on the hypothesis that
sapABCDF encodes a novel putrescine exporter, putrescine concentrations of culture supernatants of
ΔsapA (JW1287), ΔsapB (JW1286), and ΔsapC (JW1285) strains were measured. Unexpectedly, the
concentration of putrescine in the culture supernatant of ΔsapA (48.3 μM) was almost equivalent to
that of the parental strain BW25113. In contrast, the putrescine concentration of culture supernatant
of ΔsapB and ΔsapC strains were 37 % (18.2 μM) and 47 % (23.4 μM) of that of the parental strain
BW25113, respectively. These results indicate that the decrease of putrescine concentration of culture
supernatant came from the deletion of sapB, sapC, sapD, and sapF genes, but that sapA was not
involved in the decrease of putrescine.
SapBCDF does not contribute to resistance against antimicrobial peptide LL-37
Previous studies have reported that SapABCDF proteins of Salmonella enterica sv.
Typhimurium (28) and Haemophillus influenzae (29) contribute to resistance against antimicrobial
peptides by uptake of these peptides followed by
intracellular degradation of the peptide bonds. To
examine the contribution of sapBCDF of E. coli to
resistance against an antimicrobial peptide, the
susceptibility of the E. coli MG1655 (wild type) and
YS40 (MG1655 ΔsapBCDF) to the antimicrobial
peptide LL-37 was analyzed (Fig. 2). E. coli was killed
by LL-37 in a manner dependent on the concentration of
the antimicrobial peptide, however, susceptibility to the
LL-37 was not significantly different in MG1655 and
YS40 (ΔsapBCDF) (Fig. 2). These results demonstrate
that SapBCDF do not contribute to resistance against the
antimicrobial peptide LL-37.
sapBCDF increases the concentration of putrescine in culture supernatant
To elucidate the role of sapBCDF in the regulation of putrescine concentration in culture
supernatant, YS111 (pACYC184/wild type), YS112 (pACYC184/ΔsapBCDF), and YS113
(pACYC184-sapB+C+D+F+/ΔsapBCDF) were constructed, and the cell density (OD600), putrescine
concentrations of culture supernatant normalized by the cell density (μM/OD600), and putrescine
0.0001
0.001
0.01
0.1
10
-1
-2
-3
-4
Su
rviv
al
ratio (
Log
10)
LL-37 (μg/mL)
0 1 2 3 4
Fig. 2. Effect of the deletion of sapBCDF on resistance against LL-37, an antimicrobial peptide.
Strains were incubated with different concentrations of LL-37. After incubation, the cells were plated, and the numbers of colonies were counted after incubation. Survival ratios were calculated by dividing the colony forming units of strains incubated with LL-37 by those without LL-37. Closed and open circles indicate the mean survival ratio of MG1655 (parental strain) and YS40 (sapBCDF deleted strain), respectively. Data are expressed as the mean ± standard deviation (SD) of three separated experiments.

109
concentration in the cells (nmol/mg of protein) were measured (Fig. 3). Cell growth of YS111 (parental
strain) and YS112 (sapBCDF-deleted strain) were not significantly different although that of YS113
(sapBCDF-complemented strain) was slightly increased compared to the YS111 and YS112 (Fig. 3A).
Putrescine concentrations of culture supernatants of YS111 (parental strain) and YS113 (sapBCDF-
complemented strain) peaked at 4 hours after inoculation and reached 41.9 μM/OD600 and 38.4
μM/OD600, respectively (Fig. 3B) and decreased to zero at 12 hours. In contrast, the peak putrescine
concentration of culture supernatant of YS112 (sapBCDF deleted strain) was 26.2 μM/OD600 (63 %
of parental strain) at 4 hours after inoculation (Fig. 3B). The difference in the putrescine concentration
of culture supernatant between sapB+C+D+F+ strains (YS111 and YS113) and ΔsapBCDF (YS112)
was highly statistically significant (p < 0.01, Tukey’s test) at 2 and 4 hours after inoculation (Fig. 3B).
In contrast, putrescine concentration in the cell was not influenced by deletion and complementation
of sapBCDF (Fig. 3C), suggesting that the decrease in putrescine concentration of the culture
supernatant by the deletion of sapBCDF (Fig. 3B) was not caused by decreased production of
0
20
40
60
80
100
120
0 4 8 12 16 20 24 28
Pu
t(n
mol/m
g o
f p
rote
in)
Cultivation time (h)
0.0
1.0
2.0
3.0
4.0
5.0
0 4 8 12 16 20 24 28
OD
60
0
Cultivation time (h)
0
10
20
30
40
50
0 4 8 12 16 20 24 28
Pu
t (μ
M/O
D6
00)
Cultivation time (h)
A B
C
a
a
b
d
cc
Fig. 3. Effect of the deletion of sapBCDF on putrescine concentrations of culture
supernatants.
Bacterial strains were grown in M9 + tryptone + succinate medium supplemented
with 30 μg/mL of chloramphenicol. Data are expressed as the mean ± SD of three
separate experiments.
(A) Growth curves of strains. Closed, open, and grey circles represent the mean
OD600 values of YS111 (parental strain), YS112 (sapBCDF-deleted strain), and YS113
(sapBCDF-complemented strain), respectively.
(B) Changes of putrescine concentration in the culture supernatant of strains.
Cultures were taken at different times after inoculation, and putrescine concentrations
of culture supernatant were measured by HPLC. Putrescine concentrations were
normalized by dividing the values of OD600. Closed, open, and grey circles represent
the mean of normalized putrescine concentrations of culture supernatant of YS111
(parental strain), YS112 (sapBCDF-deleted strain), and YS113 (sapBCDF-
complemented strain), respectively. The means with different or same letters are
significantly different or not significantly different, respectively (a vs b, p < 0.01; c vs
d, p < 0.01 according to Tukey’s test).
(C) Changes of intracellular putrescine concentration of strains.
Cells were harvested at indicated times and putrescine concentrations in the cells were
measured by HPLC and normalized to the amounts of protein in the cells. Closed,
open, and grey circles represent the mean of normalized putrescine concentrations in
the cell of YS111 (parental strain), YS112 (sapBCDF-deleted strain), and YS113
(sapBCDF-complemented strain), respectively.
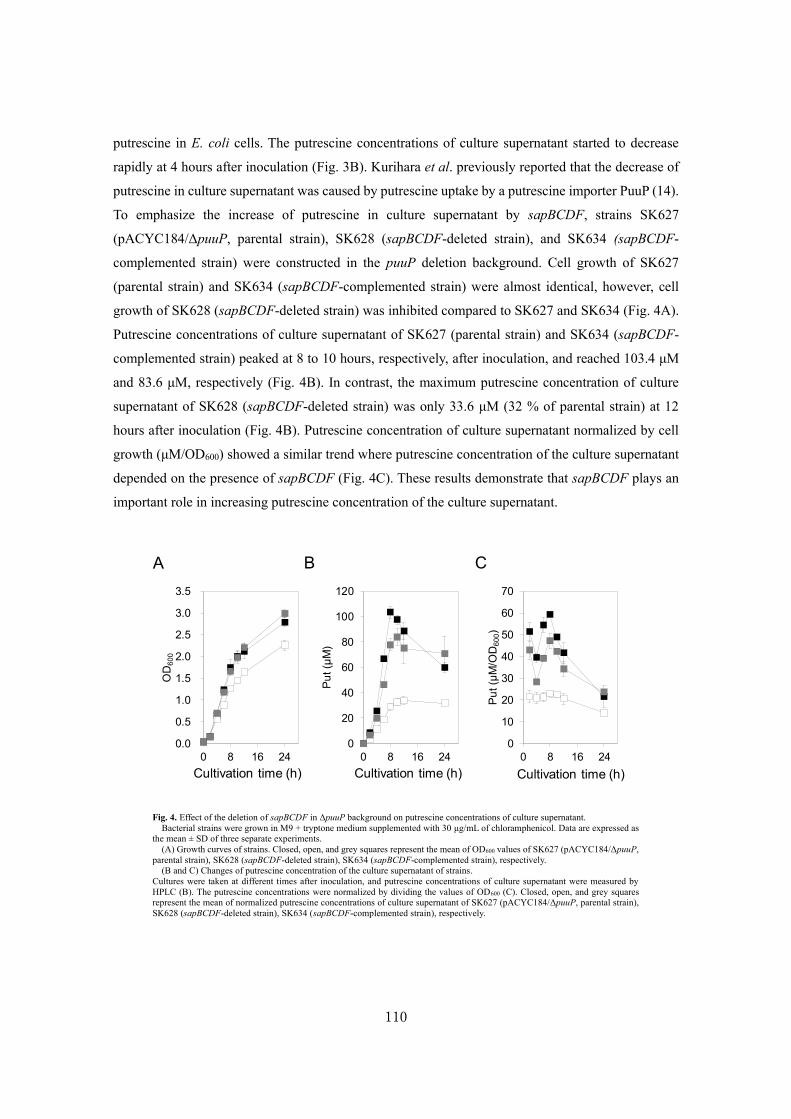
110
putrescine in E. coli cells. The putrescine concentrations of culture supernatant started to decrease
rapidly at 4 hours after inoculation (Fig. 3B). Kurihara et al. previously reported that the decrease of
putrescine in culture supernatant was caused by putrescine uptake by a putrescine importer PuuP (14).
To emphasize the increase of putrescine in culture supernatant by sapBCDF, strains SK627
(pACYC184/ΔpuuP, parental strain), SK628 (sapBCDF-deleted strain), and SK634 (sapBCDF-
complemented strain) were constructed in the puuP deletion background. Cell growth of SK627
(parental strain) and SK634 (sapBCDF-complemented strain) were almost identical, however, cell
growth of SK628 (sapBCDF-deleted strain) was inhibited compared to SK627 and SK634 (Fig. 4A).
Putrescine concentrations of culture supernatant of SK627 (parental strain) and SK634 (sapBCDF-
complemented strain) peaked at 8 to 10 hours, respectively, after inoculation, and reached 103.4 μM
and 83.6 μM, respectively (Fig. 4B). In contrast, the maximum putrescine concentration of culture
supernatant of SK628 (sapBCDF-deleted strain) was only 33.6 μM (32 % of parental strain) at 12
hours after inoculation (Fig. 4B). Putrescine concentration of culture supernatant normalized by cell
growth (μM/OD600) showed a similar trend where putrescine concentration of the culture supernatant
depended on the presence of sapBCDF (Fig. 4C). These results demonstrate that sapBCDF plays an
important role in increasing putrescine concentration of the culture supernatant.
0
20
40
60
80
100
120
0 8 16 24
Pu
t (μ
M)
Cultivation time (h)
0.0
0.5
1.0
1.5
2.0
2.5
3.0
3.5
0 8 16 24
OD
60
0
Cultivation time (h)
0
10
20
30
40
50
60
70
0 8 16 24
Pu
t (μ
M/O
D6
00)
Cultivation time (h)
A B C
Fig. 4. Effect of the deletion of sapBCDF in ΔpuuP background on putrescine concentrations of culture supernatant.
Bacterial strains were grown in M9 + tryptone medium supplemented with 30 μg/mL of chloramphenicol. Data are expressed as
the mean ± SD of three separate experiments.
(A) Growth curves of strains. Closed, open, and grey squares represent the mean of OD600 values of SK627 (pACYC184/ΔpuuP,
parental strain), SK628 (sapBCDF-deleted strain), SK634 (sapBCDF-complemented strain), respectively.
(B and C) Changes of putrescine concentration of the culture supernatant of strains.
Cultures were taken at different times after inoculation, and putrescine concentrations of culture supernatant were measured by
HPLC (B). The putrescine concentrations were normalized by dividing the values of OD600 (C). Closed, open, and grey squares
represent the mean of normalized putrescine concentrations of culture supernatant of SK627 (pACYC184/ΔpuuP, parental strain),
SK628 (sapBCDF-deleted strain), SK634 (sapBCDF-complemented strain), respectively.
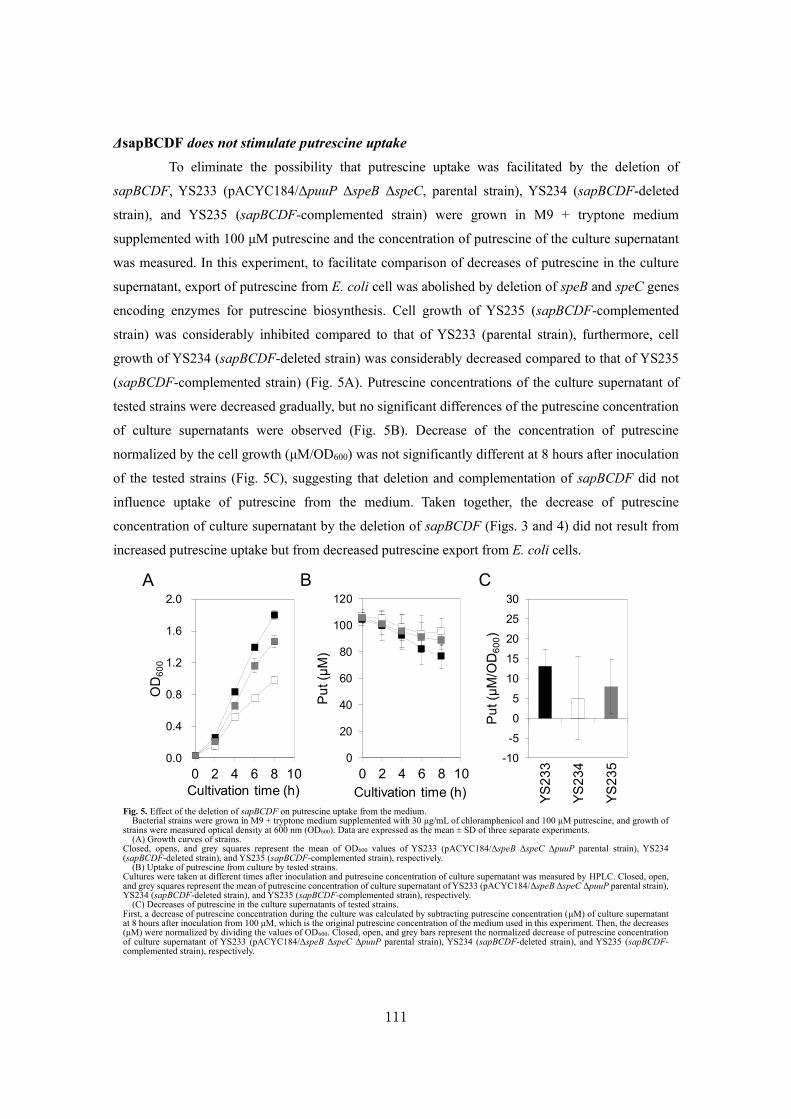
111
ΔsapBCDF does not stimulate putrescine uptake
To eliminate the possibility that putrescine uptake was facilitated by the deletion of
sapBCDF, YS233 (pACYC184/ΔpuuP ΔspeB ΔspeC, parental strain), YS234 (sapBCDF-deleted
strain), and YS235 (sapBCDF-complemented strain) were grown in M9 + tryptone medium
supplemented with 100 μM putrescine and the concentration of putrescine of the culture supernatant
was measured. In this experiment, to facilitate comparison of decreases of putrescine in the culture
supernatant, export of putrescine from E. coli cell was abolished by deletion of speB and speC genes
encoding enzymes for putrescine biosynthesis. Cell growth of YS235 (sapBCDF-complemented
strain) was considerably inhibited compared to that of YS233 (parental strain), furthermore, cell
growth of YS234 (sapBCDF-deleted strain) was considerably decreased compared to that of YS235
(sapBCDF-complemented strain) (Fig. 5A). Putrescine concentrations of the culture supernatant of
tested strains were decreased gradually, but no significant differences of the putrescine concentration
of culture supernatants were observed (Fig. 5B). Decrease of the concentration of putrescine
normalized by the cell growth (μM/OD600) was not significantly different at 8 hours after inoculation
of the tested strains (Fig. 5C), suggesting that deletion and complementation of sapBCDF did not
influence uptake of putrescine from the medium. Taken together, the decrease of putrescine
concentration of culture supernatant by the deletion of sapBCDF (Figs. 3 and 4) did not result from
increased putrescine uptake but from decreased putrescine export from E. coli cells.
0
20
40
60
80
100
120
0 2 4 6 8 10
Pu
t (μ
M)
Cultivation time (h)
0.0
0.4
0.8
1.2
1.6
2.0
0 2 4 6 8 10
OD
60
0
Cultivation time (h)
-10
-5
0
5
10
15
20
25
30
Pu
t (μ
M/O
D6
00)
YS
23
3
A B CY
S2
34
YS
23
5
Fig. 5. Effect of the deletion of sapBCDF on putrescine uptake from the medium. Bacterial strains were grown in M9 + tryptone medium supplemented with 30 μg/mL of chloramphenicol and 100 μM putrescine, and growth of
strains were measured optical density at 600 nm (OD600). Data are expressed as the mean ± SD of three separate experiments. (A) Growth curves of strains.
Closed, opens, and grey squares represent the mean of OD600 values of YS233 (pACYC184/ΔspeB ΔspeC ΔpuuP parental strain), YS234 (sapBCDF-deleted strain), and YS235 (sapBCDF-complemented strain), respectively.
(B) Uptake of putrescine from culture by tested strains. Cultures were taken at different times after inoculation and putrescine concentration of culture supernatant was measured by HPLC. Closed, open, and grey squares represent the mean of putrescine concentration of culture supernatant of YS233 (pACYC184/ΔspeB ΔspeC ΔpuuP parental strain), YS234 (sapBCDF-deleted strain), and YS235 (sapBCDF-complemented strain), respectively.
(C) Decreases of putrescine in the culture supernatants of tested strains. First, a decrease of putrescine concentration during the culture was calculated by subtracting putrescine concentration (μM) of culture supernatant at 8 hours after inoculation from 100 μM, which is the original putrescine concentration of the medium used in this experiment. Then, the decreases (μM) were normalized by dividing the values of OD600. Closed, open, and grey bars represent the normalized decrease of putrescine concentration of culture supernatant of YS233 (pACYC184/ΔspeB ΔspeC ΔpuuP parental strain), YS234 (sapBCDF-deleted strain), and YS235 (sapBCDF-complemented strain), respectively.
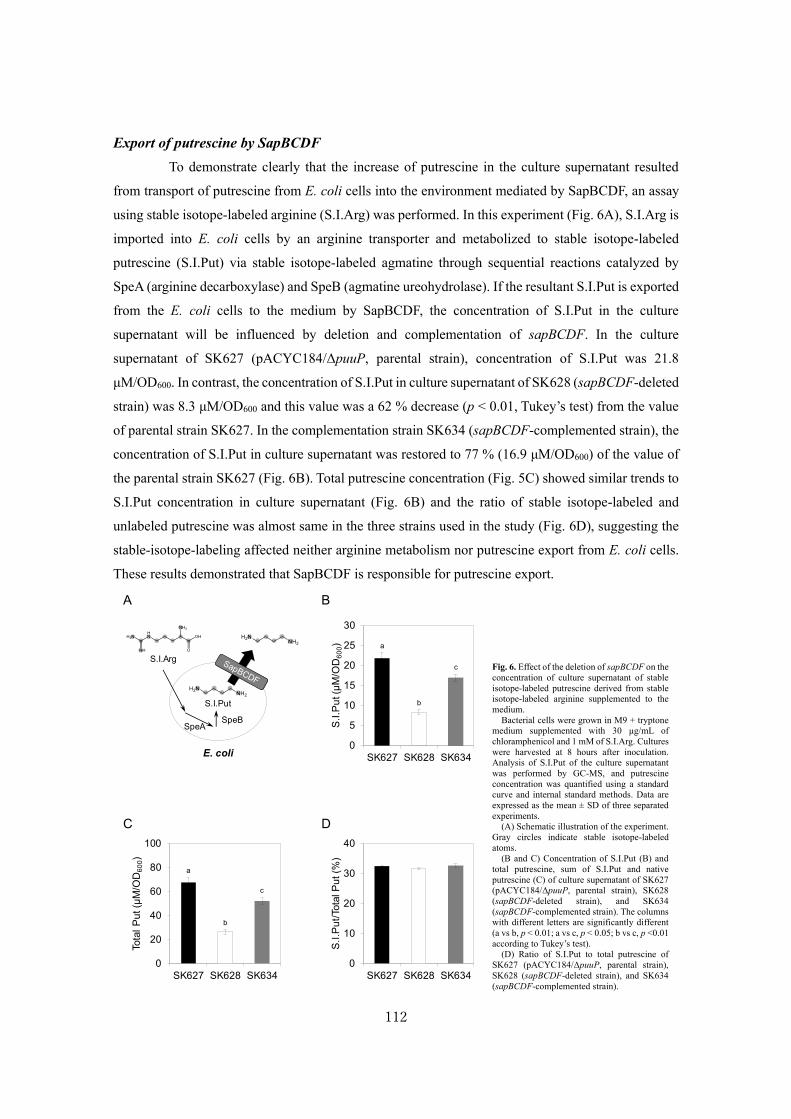
112
Export of putrescine by SapBCDF
To demonstrate clearly that the increase of putrescine in the culture supernatant resulted
from transport of putrescine from E. coli cells into the environment mediated by SapBCDF, an assay
using stable isotope-labeled arginine (S.I.Arg) was performed. In this experiment (Fig. 6A), S.I.Arg is
imported into E. coli cells by an arginine transporter and metabolized to stable isotope-labeled
putrescine (S.I.Put) via stable isotope-labeled agmatine through sequential reactions catalyzed by
SpeA (arginine decarboxylase) and SpeB (agmatine ureohydrolase). If the resultant S.I.Put is exported
from the E. coli cells to the medium by SapBCDF, the concentration of S.I.Put in the culture
supernatant will be influenced by deletion and complementation of sapBCDF. In the culture
supernatant of SK627 (pACYC184/ΔpuuP, parental strain), concentration of S.I.Put was 21.8
μM/OD600. In contrast, the concentration of S.I.Put in culture supernatant of SK628 (sapBCDF-deleted
strain) was 8.3 μM/OD600 and this value was a 62 % decrease (p < 0.01, Tukey’s test) from the value
of parental strain SK627. In the complementation strain SK634 (sapBCDF-complemented strain), the
concentration of S.I.Put in culture supernatant was restored to 77 % (16.9 μM/OD600) of the value of
the parental strain SK627 (Fig. 6B). Total putrescine concentration (Fig. 5C) showed similar trends to
S.I.Put concentration in culture supernatant (Fig. 6B) and the ratio of stable isotope-labeled and
unlabeled putrescine was almost same in the three strains used in the study (Fig. 6D), suggesting the
stable-isotope-labeling affected neither arginine metabolism nor putrescine export from E. coli cells.
These results demonstrated that SapBCDF is responsible for putrescine export.
0
20
40
60
80
100
SK627 SK628 SK634
Tota
l P
ut (μ
M/O
D6
00)
0
5
10
15
20
25
30
SK627 SK628 SK634
S.I
.Pu
t(μ
M/O
D6
00)
0
10
20
30
40
SK627 SK628 SK634
S.I
.Pu
t/To
tal P
ut (%
)
S.I.Arg
S.I.Put
E. coli
SpeASpeB
D
A B
C
a
b
c
a
b
c Fig. 6. Effect of the deletion of sapBCDF on the
concentration of culture supernatant of stable
isotope-labeled putrescine derived from stable
isotope-labeled arginine supplemented to the
medium.
Bacterial cells were grown in M9 + tryptone
medium supplemented with 30 μg/mL of
chloramphenicol and 1 mM of S.I.Arg. Cultures
were harvested at 8 hours after inoculation.
Analysis of S.I.Put of the culture supernatant
was performed by GC-MS, and putrescine
concentration was quantified using a standard
curve and internal standard methods. Data are
expressed as the mean ± SD of three separated
experiments.
(A) Schematic illustration of the experiment.
Gray circles indicate stable isotope-labeled
atoms.
(B and C) Concentration of S.I.Put (B) and
total putrescine, sum of S.I.Put and native
putrescine (C) of culture supernatant of SK627
(pACYC184/ΔpuuP, parental strain), SK628
(sapBCDF-deleted strain), and SK634
(sapBCDF-complemented strain). The columns
with different letters are significantly different
(a vs b, p < 0.01; a vs c, p < 0.05; b vs c, p <0.01
according to Tukey’s test).
(D) Ratio of S.I.Put to total putrescine of
SK627 (pACYC184/ΔpuuP, parental strain),
SK628 (sapBCDF-deleted strain), and SK634
(sapBCDF-complemented strain).

113
DISCUSSION
The present study has revealed that SapBCDF of E. coli export putrescine from cells to the
extracellular environment. In previous studies, MdtJI of E. coli (30) and Blt of Bacillus subtilis (31)
were reported as spermidine exporters. Additionally, in Shigella flexneri it was reported that MdtJI
was a putrescine exporter (32). However, in these three reports strains overexpressing genes of
polyamine exporters were used for assays of polyamine export. Furthermore, none of these previous
studies analyzed the decreased polyamine export activity of the mutant strains with the deletion of
genes encoding polyamine exporters, nor measured the polyamine concentration of the culture
supernatant (30-32). It was previously reported that PotE is a putrescine-ornithine antiporter at acidic
pH (17). Also, it was previously described that at neutral pH, E. coli excretes putrescine into the
environment independently of PotE (18), suggesting that there are other unidentified putrescine
exporters in E. coli. The present study demonstrated that SapBCDF plays a major role in this putrescine
export (Figs. 3 and 4).
For the characterization of metabolite exporters, inside-out membrane vesicles (16) or the
reconstituted proteoliposomes should be used, ideally (33). However, there are many reports where
these methods were not used because of the technical difficulty of the procedure (34). In the present
study, because inside-out membrane vesicles and the reconstituted proteoliposomes were not used, the
kinetic parameters were not determined, however, the present study clearly revealed that S.I.Put
metabolized from S.I.Arg in E. coli cells was exported from cells to the extracellular environment by
SapBCDF (Fig. 6).
SapABCDF is specifically distributed within gamma-proteobacteria. Previous studies
reported that SapABCDF contributes to resistance of bacteria against cationic antimicrobial peptides:
LL-37, β-defensin, and protamine, produced by mammals (28,35). Parra-Lopez et al., reported that S.
enterica sv. Typhimurium ΔsapABCDF strain was more sensitive to protamine than the parental strain
and they hypothesized that S. enterica sv. Typhimurium took up antimicrobial peptides followed by
the degradation in the cell by peptidases (28). This hypothesis was experimentally confirmed in H.
influenzae using LL-37 and β-defensin (35). Furthermore, H. influenzae sapA mutant exhibited
attenuated survival in a chinchilla model of otitis media (29). The amino acid identity of SapABCDF
in E. coli and S. enterica sv. Typhimurium is very high (SapA, 90 %; SapB, 92 %; SapC, 95 %; SapD,
96 %; SapF, 98 %). Nonetheless, to date there has been no study showing that SapABCDF of E. coli
contributes to resistance against antimicrobial peptides. In the present study, it was shown that
SapBCDF of E. coli did not contribute to resistance against an antimicrobial peptide LL-37 (Fig. 2).
In E. coli, there is no report describing experimentally the function of SapA, SapB, SapC, or SapF,
and there has been only one report that SapD (also known as TrkE) of E. coli plays a role as an ATPase
for potassium transporters TrkH and TrkG (36). Similarly to E. coli, it was reported previously that
114
the uptake of potassium by a H. influenzae ΔsapD strain decreased, suggesting that SapD is involved
in the uptake of potassium (37). In the previous reports, it was described that in plants and animals,
intracellular polyamine inhibited the uptake of potassium from the extracellular environment (38-40).
Therefore, it is possible that in E. coli potassium uptake by TrkH and TrkG driven by ATPase activity
of SapD has some relationship to putrescine export by SapBCDF.
Polyamines are important for cell proliferation and therefore the intracellular concentration
of polyamines in bacteria are high at exponential growth phase and lower at stationary phase (41) (Fig.
3C), and both degradation and export of polyamines may consume intracellular pool of polyamines.
The Puu pathway is the putrescine degradation pathway (14,22,24,42-44) expressed at early stationary
phase. If the regulation of sapBCDF, mediating putrescine export, and the puu gene cluster,
responsible for putrescine degradation, is executed in a co-ordinate manner, putrescine level
effectively decreases from exponential growth phase to stationary phase in E. coli. Because the
sapBCDF gene cluster is located immediately adjacent to the puu gene cluster on E. coli chromosome,
it is possible that genes of this region are coordinately regulated. Therefore, it is probable that these
two co-localized gene clusters, sapBCDF and the puu gene cluster function to decrease putrescine
levels at the end of the exponential growth phase.
In the present study, export of putrescine was not inhibited by the deletion of sapA (Table
2). It is logical that SapA is not involved in the export of putrescine from cytosol to the extracellular
environment because SapA is annotated as periplasmic substrate binding protein of an ABC transporter.
Furthermore, it was previously reported that sapABCDF of S. enterica sv. Typhimurium are expressed
polycistronically (28) in E. coli; however, the predicted promotor of sapA is located independently of
that of sapBCDF (Fig. 1B) and the predicted sigma factor for sapA (σ70) is different from that for
sapBCDF (σ54). Therefore, it is quite possible that sapA and sapBCDF are expressed separately,
suggesting that SapBCDF has a function independent of SapA. In the present study, as the first report
identifying the functions of SapB, SapC, and SapF, it was shown that SapBCDF of E. coli exported
putrescine from cells to the extracellular environment (Figs. 3, 4, and 6) but did not contribute to
resistance against an antimicrobial peptide LL-37 (Fig. 2). Therefore, it is very probable that SapBCDF
is a novel putrescine exporter functioning in the neutral environmental conditions. However,
approximately 30 μM of putrescine was detected in the culture supernatant of a ΔpuuP ΔsapBCDF
double mutant (Fig. 4B), suggesting the existence of additional putrescine exporters other than
SapBCDF in E. coli.

115
REFERENCES
1. Goodwin, A. C., Destefano Shields, C. E., Wu, S., Huso, D. L., Wu, X., Murray-Stewart, T.
R., Hacker-Prietz, A., Rabizadeh, S., Woster, P. M., Sears, C. L., and Casero, R. A. (2011)
Polyamine catabolism contributes to enterotoxigenic Bacteroides fragilis-induced colon
tumorigenesis. Proc Natl Acad Sci U S A 108, 15354-15359
2. Dubin, K., Callahan, M. K., Ren, B., Khanin, R., Viale, A., Ling, L., No, D., Gobourne, A.,
Littmann, E., Huttenhower, C., Pamer, E. G., and Wolchok, J. D. (2016) Intestinal
microbiome analyses identify melanoma patients at risk for checkpoint-blockade-induced
colitis. Nat Commun 7, 10391
3. Thompson, P. A., Wertheim, B. C., Zell, J. A., Chen, W. P., McLaren, C. E., LaFleur, B. J.,
Meyskens, F. L., and Gerner, E. W. (2010) Levels of rectal mucosal polyamines and
prostaglandin E2 predict ability of DFMO and sulindac to prevent colorectal adenoma.
Gastroenterology 139, 797-805, 805.e791
4. Kibe, R., Kurihara, S., Sakai, Y., Suzuki, H., Ooga, T., Sawaki, E., Muramatsu, K.,
Nakamura, A., Yamashita, A., Kitada, Y., Kakeyama, M., Benno, Y., and Matsumoto, M.
(2014) Upregulation of colonic luminal polyamines produced by intestinal microbiota
delays senescence in mice. Sci Rep 4, 4548
5. Matsumoto, M., Kurihara, S., Kibe, R., Ashida, H., and Benno, Y. (2011) Longevity in mice
is promoted by probiotic-induced suppression of colonic senescence dependent on
upregulation of gut bacterial polyamine production. PLoS One 6, e23652
6. Soda, K., Dobashi, Y., Kano, Y., Tsujinaka, S., and Konishi, F. (2009) Polyamine-rich food
decreases age-associated pathology and mortality in aged mice. Exp Gerontol 44, 727-732
7. Morris, D. R., and Pardee, A. B. (1965) A biosynthetic ornithine decarboxylase in
Escherichia coli. Biochem Biophys Res Commun 20, 697-702
8. Kashiwagi, K., Suzuki, T., Suzuki, F., Furuchi, T., Kobayashi, H., and Igarashi, K. (1991)
Coexistence of the genes for putrescine transport protein and ornithine decarboxylase at 16
min on Escherichia coli chromosome. J Biol Chem 266, 20922-20927
9. Moore, R. C., and Boyle, S. M. (1990) Nucleotide sequence and analysis of the speA gene
encoding biosynthetic arginine decarboxylase in Escherichia coli. J Bacteriol 172, 4631-
4640
10. Satishchandran, C., and Boyle, S. M. (1986) Purification and properties of agmatine
ureohydrolyase, a putrescine biosynthetic enzyme in Escherichia coli. J Bacteriol 165, 843-
848
11. Tabor, C. W., Tabor, H., and Xie, Q. W. (1986) Spermidine synthase of Escherichia coli:
localization of the speE gene. Proc Natl Acad Sci U S A 83, 6040-6044

116
12. Pistocchi, R., Kashiwagi, K., Miyamoto, S., Nukui, E., Sadakata, Y., Kobayashi, H., and
Igarashi, K. (1993) Characteristics of the operon for a putrescine transport system that maps
at 19 minutes on the Escherichia coli chromosome. J Biol Chem 268, 146-152
13. Furuchi, T., Kashiwagi, K., Kobayashi, H., and Igarashi, K. (1991) Characteristics of the
gene for a spermidine and putrescine transport system that maps at 15 min on the
Escherichia coli chromosome. J Biol Chem 266, 20928-20933
14. Kurihara, S., Tsuboi, Y., Oda, S., Kim, H. G., Kumagai, H., and Suzuki, H. (2009) The
putrescine Importer PuuP of Escherichia coli K-12. J Bacteriol 191, 2776-2782
15. Kurihara, S., Suzuki, H., Oshida, M., and Benno, Y. (2011) A novel putrescine importer
required for type 1 pili-driven surface motility induced by extracellular putrescine in
Escherichia coli K-12. J Biol Chem 286, 10185-10192
16. Kashiwagi, K., Miyamoto, S., Suzuki, F., Kobayashi, H., and Igarashi, K. (1992) Excretion
of putrescine by the putrescine-ornithine antiporter encoded by the potE gene of Escherichia
coli. Proc Natl Acad Sci U S A 89, 4529-4533
17. Kashiwagi, K., Shibuya, S., Tomitori, H., Kuraishi, A., and Igarashi, K. (1997) Excretion
and uptake of putrescine by the PotE protein in Escherichia coli. J Biol Chem 272, 6318-
6323
18. Schiller, D., Kruse, D., Kneifel, H., Krämer, R., and Burkovski, A. (2000) Polyamine
transport and role of potE in response to osmotic stress in Escherichia coli. J Bacteriol 182,
6247-6249
19. Baba, T., Ara, T., Hasegawa, M., Takai, Y., Okumura, Y., Baba, M., Datsenko, K. A., Tomita,
M., Wanner, B. L., and Mori, H. (2006) Construction of Escherichia coli K-12 in-frame,
single-gene knockout mutants: the Keio collection. Mol Syst Biol 2, 2006.0008
20. Miller, J. H. (1972) A Short Course in Bacterial Genetics., Cold Spring Harbor Laboratory
Press, Cold Spring Harbor, NY.
21. Datsenko, K. A., and Wanner, B. L. (2000) One-step inactivation of chromosomal genes in
Escherichia coli K-12 using PCR products. Proc Natl Acad Sci U S A 97, 6640-6645
22. Kurihara, S., Oda, S., Kato, K., Kim, H. G., Koyanagi, T., Kumagai, H., and Suzuki, H.
(2005) A novel putrescine utilization pathway involves gamma-glutamylated intermediates
of Escherichia coli K-12. J Biol Chem 280, 4602-4608
23. Harwig, S. S., Ganz, T., and R.I., L. (1994) Neutrophil defensins: purification,
characterization, and antimicrobial testing. in Methods in Enzymology. pp 160-172
24. Kurihara, S., Kato, K., Asada, K., Kumagai, H., and Suzuki, H. (2010) A putrescine-
inducible pathway comprising PuuE-YneI in which gamma-aminobutyrate is degraded into
succinate in Escherichia coli K-12. J Bacteriol 192, 4582-4591
25. Sakanaka, M., Sugiyama, Y., Kitakata, A., Katayama, T., and Kurihara, S. (2016)

117
Carboxyspermidine decarboxylase of the prominent intestinal microbiota species
Bacteroides thetaiotaomicron is required for spermidine biosynthesis and contributes to
normal growth. Amino Acids 48, 2443-2451
26. Chen, G. G., Turecki, G., and Mamer, O. A. (2009) A quantitative GC-MS method for three
major polyamines in postmortem brain cortex. J Mass Spectrom 44, 1203-1210
27. Grenier, F., Matteau, D., Baby, V., and Rodrigue, S. (2014) Complete Genome Sequence of
Escherichia coli BW25113. Genome Announc 2
28. Parra-Lopez, C., Baer, M. T., and Groisman, E. A. (1993) Molecular genetic analysis of a
locus required for resistance to antimicrobial peptides in Salmonella typhimurium. EMBO J
12, 4053-4062
29. Mason, K. M., Munson, R. S., and Bakaletz, L. O. (2005) A mutation in the sap operon
attenuates survival of nontypeable Haemophilus influenzae in a chinchilla model of otitis
media. Infect Immun 73, 599-608
30. Higashi, K., Ishigure, H., Demizu, R., Uemura, T., Nishino, K., Yamaguchi, A., Kashiwagi,
K., and Igarashi, K. (2008) Identification of a spermidine excretion protein complex (MdtJI)
in Escherichia coli. J Bacteriol 190, 872-878
31. Woolridge, D. P., Vazquez-Laslop, N., Markham, P. N., Chevalier, M. S., Gerner, E. W., and
Neyfakh, A. A. (1997) Efflux of the natural polyamine spermidine facilitated by the Bacillus
subtilis multidrug transporter Blt. J Biol Chem 272, 8864-8866
32. Leuzzi, A., Di Martino, M. L., Campilongo, R., Falconi, M., Barbagallo, M., Marcocci, L.,
Pietrangeli, P., Casalino, M., Grossi, M., Micheli, G., Colonna, B., and Prosseda, G. (2015)
Multifactor Regulation of the MdtJI Polyamine Transporter in Shigella. PLoS One 10,
e0136744
33. Sasahara, A., Nanatani, K., Enomoto, M., Kuwahara, S., and Abe, K. (2011) Substrate
specificity of the aspartate:alanine antiporter (AspT) of Tetragenococcus halophilus in
reconstituted liposomes. J Biol Chem 286, 29044-29052
34. Pathania, A., and Sardesai, A. A. (2015) Distinct Paths for Basic Amino Acid Export in
Escherichia coli: YbjE (LysO) Mediates Export of L-Lysine. J Bacteriol 197, 2036-2047
35. Shelton, C. L., Raffel, F. K., Beatty, W. L., Johnson, S. M., and Mason, K. M. (2011) Sap
transporter mediated import and subsequent degradation of antimicrobial peptides in
Haemophilus. PLoS Pathog 7, e1002360
36. Harms, C., Domoto, Y., Celik, C., Rahe, E., Stumpe, S., Schmid, R., Nakamura, T., and
Bakker, E. P. (2001) Identification of the ABC protein SapD as the subunit that confers ATP
dependence to the K+-uptake systems Trk(H) and Trk(G) from Escherichia coli K-12.
Microbiology 147, 2991-3003
37. Mason, K. M., Bruggeman, M. E., Munson, R. S., and Bakaletz, L. O. (2006) The non-
118
typeable Haemophilus influenzae Sap transporter provides a mechanism of antimicrobial
peptide resistance and SapD-dependent potassium acquisition. Mol Microbiol 62, 1357-
1372
38. Liu, K., Fu, H., Bei, Q., and Luan, S. (2000) Inward potassium channel in guard cells as a
target for polyamine regulation of stomatal movements. Plant Physiol 124, 1315-1326
39. Lopatin, A. N., Makhina, E. N., and Nichols, C. G. (1994) Potassium channel block by
cytoplasmic polyamines as the mechanism of intrinsic rectification. Nature 372, 366-369
40. Vandenberg, C. A. (2008) Integrins step up the pace of cell migration through polyamines
and potassium channels. Proc Natl Acad Sci U S A 105, 7109-7110
41. Igarashi, K., and Kashiwagi, K. (2000) Polyamines: mysterious modulators of cellular
functions. Biochem Biophys Res Commun 271, 559-564
42. Kurihara, S., Oda, S., Kumagai, H., and Suzuki, H. (2006) Gamma-glutamyl-gamma-
aminobutyrate hydrolase in the putrescine utilization pathway of Escherichia coli K-12.
FEMS Microbiol Lett 256, 318-323
43. Kurihara, S., Oda, S., Tsuboi, Y., Kim, H. G., Oshida, M., Kumagai, H., and Suzuki, H.
(2008) gamma-Glutamylputrescine synthetase in the putrescine utilization pathway of
Escherichia coli K-12. J Biol Chem 283, 19981-19990
44. Nemoto, N., Kurihara, S., Kitahara, Y., Asada, K., Kato, K., and Suzuki, H. (2012)
Mechanism for regulation of the putrescine utilization pathway by the transcription factor
PuuR in Escherichia coli K-12. J Bacteriol 194, 3437-3447
119
SUMMARY
Recent research has suggested that polyamines (putrescine, spermidine, and spermine) in
the intestinal tract impact the health of animals either negatively or positively. The concentration of
polyamines in the intestinal tract results from the balance of uptake and export of gut microbes.
However, the mechanism of polyamine export from microbial cells to the intestinal lumen is still
unclear. In Escherichia coli, PotE was previously identified as a transporter responsible for putrescine
excretion in an acidic growth environment. The author observed putrescine concentration in the culture
supernatant was increased from zero to 50 μM during growth of E. coli under a neutral pH environment.
Screening for the unidentified putrescine exporter was performed using a gene knockout collection of
E. coli and deletion of sapBCDF significantly decreased putrescine levels in the culture supernatant.
Complementation of the deletion mutant with the sapBCDF genes restored putrescine levels in the
culture supernatant. Additionally, the ΔsapBCDF strain did not facilitate uptake of putrescine from the
culture supernatant. Taken together, these findings suggested that sapBCDF is responsible for the
putrescine export. Quantification of stable isotope-labeled putrescine derived from stable isotope-
labeled arginine supplemented in the medium revealed that SapBCDF exported putrescine from E.
coli cells to the culture supernatant. It was previously reported that SapABCDF of Salmonella enterica
sv. Typhimurium and Haemophilus influenzae conferred resistance to antimicrobial peptides; however,
the E. coli ΔsapBCDF strain did not affect resistance to antimicrobial peptide LL-37. These results
strongly suggest that the natural function of the SapBCDF proteins is the export of putrescine.

120
CONCLUSION
As described in “GENERAL INTRODUCTION”, host and gut microbes interact, and
unraveling and understanding this interaction is extremely important in managing the health of the
host. To develop a basis for understanding the host-gut microbe interaction from the perspective of
compounds, the author focused on glycans, especially the H-antigen structure as a host-derived factor
and polyamines as gut microbe-derived factors.
In CHAPTER I, the author focused on H-antigen structure and aimed for the efficient
enzymatic synthesis of H-antigen structures. In SECTION I, the author developed highly functional
1,2-α-L-fucosynthase BbAfcAN423H from BbAfcA. BbAfcAN423H synthesized type-1, type-2, type-3,
and type-4 H-antigens, Leb/y antigens, and other H-antigen-containing unnatural oligosaccharides. It
also introduced H-antigens onto O-glycans of porcine gastric mucin. In addition, the author revealed
the structural characteristics that BbAfcAN423H requires to recognize as acceptor. In SECTION II, the
author applied BbAfcAN423H to introduce H-antigen structures on various glycoconjugates.
BbAfcAN423H could introduce H-antigen structures on O- and N-glycans of glycoproteins, glycolipid,
and plant xyloglucan. By virtue of high efficiency, high regio-specificity at the non-reducing end, and
mild reaction conditions, BbAfcAN423H not only provided H-antigen-containing glycoconjugates for
better understanding the host-gut microbe interaction mediated by H-antigen structures, but also
served as a useful tool in the field of glycobiology.
In CHAPTER II, the author focused on polyamine biosynthesis and transport of human gut
microbes. In SECTION I, the author evaluated the biosynthesis and transport abilities of the
polyamines (putrescine, spermidine, and spermine) of 32 species of GAM culturable human dominant
gut microbes. Furthermore, by combining the polyamine concentration determinations in the culture
supernatants and cells with the data from BlastP analysis the author showed that 11 species of tested
human gut microbes may possess novel polyamine biosynthetic proteins and/or transporters. In
SECTION II, the author evaluated the biosynthesis and transport abilities of the polyamines
(putrescine, spermidine, and spermine) of 13 species of human indigenous Bifidobacterium species.
The author showed that 6 species of human indigenous bifidobacteria possessed polyamine
biosynthetic ability and 10 species possessed polyamine transport ability. In addition, by combining
polyamine concentration determinations in culture supernatant and cells with the data from BlastP
analysis the author showed that 11 species of tested human indigenous Bifidobacterium, except for B.

121
bifidum and B. gallicum may possess novel polyamine biosynthetic proteins and/or transporters. In
SECTION III, the author revealed that SapBCDF is a novel putrescine exporter in Escherichia coli, a
model gut microbe. To date, the putrescine exporter which functions under a neutral growth
environment has not been reported in human gut microbes. This is the first report in gut microbes that
shows that SapBCDF exports putrescine under a similar neutral growth environment as that of the
colonic lumen; thus, it is expected to function in the colonic lumen. These results are important
regarding the regulation of polyamine levels in the colonic lumen by controlling gut microbes and
their metabolisms.
In conclusion, the author developed a basis for understanding host-gut microbe interactions
from the perspective of compounds.
122
ACKNOWLEDGEMENTS
The author would like to express his deepest appreciation for Dr. Jun Ogawa, Professor of
the Graduate School of Agriculture, Kyoto University, for his kind instructions, constructive advice,
and warm encouragement.
The author greatly appreciates Dr. Takane Katayama, Professor of the Graduate School of
Biostudies, Kyoto University, for his kind encouragement, insightful comments, and invaluable
support.
The author is deeply indebted to Dr. Shin Kurihara, Lecturer of the Faculty of Biology-
Oriented Science and Technology, Kindai University, for his constructive instructions, warm support,
and continuous encouragement.
The author would like to express his sincere gratitude for Dr. Hidehiko Kumagai, Consultant
of Ishikawa Prefectural University and Emeritus Professor of Kyoto University and Ishikawa
Prefectural University, and Dr. Kenji Yamamoto, Visiting Professor of Wakayama University and
Emeritus Professor of Kyoto University and Ishikawa Prefectural University, for their sincere
encouragement.
The author would like to express thankful appreciation to Dr. Hisashi Ashida, Professor of
the Faculty of Biology-Oriented Science and Technology, Kindai University; Dr. Motomitsu Kitaoka,
Professor of the Faculty of Agriculture, Niigata University; Dr. Kazuei Igarashi, Amine Pharma
Research Institute and Emeritus Professor of Chiba University; Dr. Hideyuki Suzuki, Professor of the
Division of Applied Biology, Kyoto Institute of Technology; Dr. Yuji Honda, Associate Professor of
the Faculty of Bioresources and Environmental Science, Ishikawa Prefectural University; Dr. Shujiro
Okuda, Associate Professor of the Graduate School of Medical and Dental Sciences, Niigata
University; Dr. Mitsuharu Matsumoto, Kyodo Milk Industry Co., Ltd.; Dr. Kyohei Higashi, Lecturer
of the Faculty of Pharmaceutical Science, Tokyo University of Science; Dr. Toshihiko Katoh, Assistant
Professor of the Graduate School of Biostudies, Kyoto University; and Mr. Atsuo Nakamura, Kyodo
Milk Industry Co., Ltd., for their valuable collaboration and insightful comments on this study.
The author is very grateful to Dr. Mikiyasu Sakanaka, National Food Institute of Technical
University of Denmark, and Dr. Aina Gotoh, the Graduate School of Biostudies, Kyoto University, for
their technical cooperation and valuable comments on this study.
The author thanks Dr. Erina Yoshida, Ms. Misaki Nara, and Mrs. Aya Kitakata from Ishikawa
Prefectural University, and Ms. Ayaka Kanbe from Kyoto Institute of Technology, for providing
technical assistance for this study.
The author expresses his gratitude to all the members of the Host-Microbe Interaction
Research laboratory of Ishikawa Prefectural University for their kind support.
Acknowledgements are also made to Dr. Akira Nakagawa, Lecturer of Ishikawa Prefectural
123
University, for his helpful comments and moral support.
The author wishes to express his appreciation to Dr. Shigenobu Kishino, Associate Professor
of the Graduate School of Agriculture, Kyoto University, for his incisive comments and passionate
encouragement.
The author would like to offer special thanks to Dr. Hajime Ohigashi, Emeritus Professor of
Kyoto University and Fukui Prefectural University, for his hearty and continued encouragement, and
valuable advice.
Last, but not least, the author greatly thanks and acknowledges his family who has been
understanding and supporting.
Yuta Sugiyama

124
LIST OF PUBLICATIONS
[I] Yuta Sugiyama, Aina Gotoh, Toshihiko Katoh, Yuji Honda, Erina Yoshida, Shin Kurihara,
Hisashi Ashida, Hidehiko Kumagai, Kenji Yamamoto, Motomitsu Kitaoka, and Takane
Katayama.
Introduction of H-antigens into oligosaccharides and sugar chains of glycoproteins using highly
efficient 1,2-α-L-fucosynthase.
Glycobiology., 26:1235-1247 (2016)
[II] Yuta Sugiyama, Atsuo Nakamura, Mitsuharu Matsumoto, Ayaka Kanbe, Mikiyasu
Sakanaka, Kyohei Higashi, Kazuei Igarashi, Takane Katayama, Hideyuki Suzuki, and
Shin Kurihara.
A Novel Putrescine Exporter SapBCDF of Escherichia coli.
Journal of Biological Chemistry., 291:26343-26351 (2016)
[III] Yuta Sugiyama, Toshihiko Katoh, Yuji Honda, Aina Gotoh, Hisashi Ashida, Shin
Kurihara, Kenji Yamamoto, and Takane Katayama.
Application study of 1,2-α-L-fucosynthase: introduction of Fucα1-2Gal disaccharide structures
on N-glycan, ganglioside, and xyloglucan oligosaccharide.
Bioscience, Biotechnology, and Biochemistry., 81:283-291 (2017)
[IV] Yuta Sugiyama, Misaki Nara, Mikiyasu Sakanaka, Aina Gotoh, Aya Kitakata, Shujiro
Okuda, and Shin Kurihara.
Comprehensive analysis of polyamine transport and biosynthesis in the dominant human gut
bacteria: Potential presence of novel polyamine metabolism and transport genes.
International Journal of Biochemistry & Cell Biology., 93:52-61 (2017)
[V] Yuta Sugiyama, Misaki Nara, Mikiyasu Sakanaka, Aya Kitakata, Shujiro Okuda, and Shin
Kurihara.
Analysis of polyamine biosynthetic- and transport ability of human indigenous Bifidobacterium.
Bioscience, Biotechnology, and Biochemistry., 82:1606-1614 (2018)

125
RELATED ARTICLE
1. Masakazu Takahashi, Yuta Sugiyama, Kyuichi Kawabata, Yu Takahashi, Kazuhiro Irie,
Akira Murakami, Yoshito Kubo, Kyoichi Kobayashi, and Hajime Ohigashi.
1,2-Di-O-α-linolenoyl-3-O-β-galactosyl-sn-glycerol as a Superoxide Generation Inhibitor from
Perilla frutescens var. crispa.
Bioscience, Biotechnology, and Biochemistry., 75:2240-2242 (2011)
2. Kyuichi Kawabata, Yuta Sugiyama, Taiken Sakano, and Hajime Ohigashi.
Flavonols enhanced production of anti-inflammatory substance(s) by Bifidobacterium
adolescentis: prebiotic actions of galangin, quercetin, and fisetin.
Biofactors., 39:422-429 (2013)
3. Aina Gotoh, Toshihiko Katoh, Yuta Sugiyama, Shin Kurihara, Yuji Honda, Haruko
Sakurama, Taiho Kambe, Hisashi Ashida, Motomitsu Kitaoka, Kenji Yamamoto, and
Takane Katayama.
Novel substrate specificities of two lacto-N-biosidases towards β-linked galacto-N-biose-
containing oligosaccharides of globo H, Gb5, and GA1.
Carbohydrate Research., 408:18-24 (2015)
4. Mikiyasu Sakanaka, Yuta Sugiyama, Aya Kitakata, Takane Katayama, and Shin Kurihara.
Carboxyspermidine decarboxylase of the prominent intestinal microbiota species Bacteroides
thetaiotaomicron is required for spermidine biosynthesis and contributes to normal growth.
Amino Acids., 48:2443-2451 (2016)
5. Aina Gotoh, Misaki Nara, Yuta Sugiyama, Mikiyasu Sakanaka, Hiroyuki Yachi, Aya
Kitakata, Akira Nakagawa, Hiromichi Minami, Shujiro Okuda, Toshihiko Katoh, Takane
Katayama, and Shin Kurihara.
Use of Gifu Anaerobic Medium for culturing 32 dominant species of human gut microbes and its
evaluation based on short-chain fatty acids fermentation profiles.
Bioscience, Biotechnology, and Biochemistry., 81:2009-2017 (2017)
6. Mikiyasu Sakanaka, Yuta Sugiyama, Misaki Nara, Aya Kitakata, and Shin Kurihara.
Functional analysis of arginine decarboxylase gene speA of Bacteroides dorei by markerless gene
deletion.
FEMS Microbiology Letters., 365, fny003 (2018)

126
7. Mikiyasu Sakanaka, Morten Ejby Hansen, Aina Gotoh, Toshihiko Katoh, Keisuke Yoshida,
Toshitaka Odamaki, Hiroyuki Yachi, Yuta Sugiyama, Shin Kurihara, Junko Hirose, Tadasu
Urashima, Jin-zhong Xiao, Motomitsu Kitaoka, Satoru Fukiya, Atsushi Yokota, Leila Lo
Leggio, Maher Abou Hachem, and Takane Katayama.
Evolutionary adaptation in fucosyllactose uptake systems supports bifidobacteria-infant
symbiosis.
Science Advances., 5, eaaw7696 (2019)
8. Miki Matsue, Yumiko Mori, Satoshi Nagase, Yuta Sugiyama, Rika Hirano, Kazuhiro Ogai,
Kohei Ogura, Shin Kurihara, and Shigefumi Okamoto.
Measuring the antimicrobial activity of lauric acid against various bacteria in human gut
microbiota by using a new method.
Cell transplantation., 28:1528-1541 (2019)
Related Documents