Osaka University Title Empirical Evidence of Employer Size Wage Differential Author(s) Takeuchi, Mamiko Citation 大阪大学経済学. 58(3) P.20-P.40 Issue Date 2008-12 Text Version publisher URL http://hdl.handle.net/11094/23347 DOI Rights

Welcome message from author
This document is posted to help you gain knowledge. Please leave a comment to let me know what you think about it! Share it to your friends and learn new things together.
Transcript

Osaka University
Title Empirical Evidence of Employer Size Wage Differential
Author(s) Takeuchi, Mamiko
Citation 大阪大学経済学. 58(3) P.20-P.40
Issue Date 2008-12
Text Version publisher
URL http://hdl.handle.net/11094/23347
DOI
Rights

1. Introduction
It is widely recognized that a “dual structure” exists in the Japanese labor market. Generally
speaking, the word structure refers to the quantitative representation of the interrelations among
relevant economic variables. The concept of dual structure was postulated by Arisawa (1957). This
structure has three characteristics: large, medium, and small companies coexist within the
manufacturing sector; (ii) large companies have a high−level (value−added) of productivity per
worker; and (iii) the average wage is relatively high. In terms of structure, the term dual is intended to
highlight the two distinctive factors in one industrial sector.1 Odaka (1984) argues that it is not only
socially unequal but also economically unjustifiable that workers who manufacture the same product
through the same process in the same line of business have to be continually controlled under
* I would like to express my heartfelt gratitude to Yoshiyuki Takeuchi, Junmin Wan, Miki Kohara, Akira Kawaguchi,and Hisakazu Matsushige for their helpful comments while I was writing this paper. This study is a research documenton the two divided examinations of the first part of Chapter 1 of the doctoral thesis that I submitted to the Osaka Schoolof International Public Policy (OSIPP) in 2006. I received instructions from anonymous referee teachers concerningpartial revisions.With regard to my analysis, I am grateful to have been offered specialized data from the Research on the WorkingPersons 2002 by the Works Institute of Recruit Co., Ltd., through the SSJ Data Archive complied by the InformationCenter for Social Science Research on Japan, Institute of Social Science, the University of Tokyo.
† Japan Society for the Promotion of Science (JSPS) Fellow1 According to Odaka (1984), the term dual structure was first introduced in the 1957 White Paper on Economics and,over time, became increasingly common. From the 1950s to the 1960s, the dual structure theory played a major role inacademic circles. The “wage dual structure,” which was particularly prevalent during the 1950s, quickly became lesscommon from the late 1950s to the early 1960s. In the 1970s, however, the structural gap widened. It is conceivablethat the wage growth ratio of small− and medium−sized enterprises fell due to an economic slump coupled with thedecline of economic growth and surge in oil prices.
Empirical Evidence of Employer Size Wage Differential*
Mamiko Takeuchi†
Abstract
This paper reexamines evidence of the positive effect of job seniority and education on wage
by using endogenous switching regression. The analysis reveals that the correlation of seniority
and education with an omitted variable representing such aspects [Note: Please check the change.]
as the quality of the worker, job, or worker−employer match. In addition, the conditional
expectations of this analysis assuming labor mobility confirm the existence of a dual labor
market.
JEL classification: J21, J22, J23
Key Words: Employer size wage differential, dual labor market
Vol.58 No.3 December 2008OSAKA ECONOMIC PAPERS
remarkably vicious working conditions just because their company is small. If the market is
competitive, then their disparities will be resolved because of the law of indifference. From this
viewpoint, Japan’s dual structure can be seen entirely in the wage differentials that result from the
varying sizes of corporations. This structure poses an academic challenge in the sense that it needs to
be explored both theoretically and concretely. Some researchers point out that examining the labor
market’s mechanism and function is necessary to undertake this exploration.
Thus far, many studies have shared the recognition that the dual structure is closely related to
corporate size.2 In one recent study, The Economics of Work, the author Koike (1999) states that wage
differentials based on corporate size are not noticeably wide in Japan in comparison with those in
other countries. Koike also notes that the gaps are shrinking. On the other hand, Harashima and
Tejima (2002) argue that the wage gaps have been gradually widening since the 1980s. Their study
focuses on workers’ age structure and employment years.
In addition to introducing preceding Japanese studies on wage differentials based on corporate size,
Okamura (2002) presents his outlook on the future of the labor market. His primary theories include
the equalized differential hypothesis, the profit distribution hypothesis, the efficient wage hypothesis,
the human capital hypothesis, and the ability gap hypothesis. As the wage dual structure did not
emerge from a single, homogeneous labor market, I need to pay attention to social and cultural factors,
such as Japan’s unique employment practices and labor union system, which may alleviate the market
competition when I analyze the hypotheses. More specifically, pinpointing the social factors that
cannot be adequately explained solely through concrete analyses of economic theories, despite due
consideration to workers’ ages (experience), job fields, and abilities, is essential.
There are numerous concrete studies on the Japanese and European wage differentials based on
corporate size. As a matter of fact, as mentioned above, the wage gaps are shaped by complex,
entwined economic and social factors, and completely clarifying all of these factors is impossible.
However, in Japan the dual structure is changing along with the economic changes.3 Ishikawa (1989)
suggests “there are many people who do not have access to equal income opportunities in spite of their
same level of performance.” Therefore, considering the dual structure formed by wage differentials is
in order. This research paper introduces the main preceding studies on wage gaps as well as conducts
concrete analyses of the disparities based on examinations with relatively new microeconomic data.
The following section focuses on the preceding empirical analyses of wage gaps based on corporate
size and Japanese−style employment practices that comprise the social factors related to the
differentials. Section 3 presents specific demonstrative models, and Section 4 mentions the data that
are used for analysis as well as the descriptive statistics. Section 5 shows the analysis results, and
Section 6 presents the conclusion.
2 Japanese researchers have conducted a large number of studies on the dual structure of the labor market from manydifferent viewpoints. Studies by Kawashima and Tachibanaki (1984) focus on employment concentration in industries;studies by Ishikawa and Dejima (1994) present the segmentation of markets into the primary and secondary sectors;and a study by Nakama (1997) focuses on the prolongation of the working years of long−time employees.
3 Refer to Odaka (1984) for the change in the dual structure.
December 2008 - 21 -Empirical Evidence of Employer Size Wage Differential

2. Preceding studies
The research on wage differentials based on corporate size was triggered by the discovery of
observational facts found in Moore’s (1911; p.164) basis statistics. These findings were followed by
studies undertaken by Masters (1969), Rosen (1970), and Mellow (1982).
Based on an abundant amount of European data, there is a large collection of analytical research on
factors related to wage gaps. Those seeking more information on a comprehensive theory of the
efficient wage hypothesis, one of the more prominent hypotheses that was previously mentioned,
should consult the work of Akerlof and Yellen (1986). The basic idea behind this hypothesis is that
unlike the secondary sector in which wages are ruled by market mechanisms, the wages in the primary
sector are not always consistent. Therefore, the primary sector sets higher wages than those of the
secondary sector to secure a high−quality work force.4 Lazear and Rosen (1981) examined this
hypothesis and found that large companies, which experience difficulties in monitoring their workers’
operations, draw a high−wage curve. On the other hand, studies by Barron et al. (1986) have verified
that in order to lower monitoring costs large companies spend huge amounts of money on the selection
of workers, their on−the−job training, and the technical capital.
In recent years, studies demonstrating the effects of innovation, in terms of computers, on wage
gaps have been conducted. These studies include the research by Krueger (1993) and Dunne and
Schmitz (1992). Based on his examinations, Reilly (1995) argues that workers’ access to computers in
their offices can explain a part of large companies’ assets and that human capital is partly accumulated
through the distinctive characteristics of individual workers. Schmidt and Zimmermann (1991) have
confirmed the detection of wage disparity based on the distinctive characteristics of individual
workers, even through the control of dummy variables related to various personal characteristics and
innovations. Schmidt and Zimmermann also suggest that wage increases based on the seniority system
have been proven effective, despite the control of the aforementioned factors. The researchers
proposed an incentive hypothesis to boost the morale of workers. Abraham and Farber (1987) and
Altonji and Shakotko (1987) have verified that the effects of the years spent working can be explained
by the distinctiveness of individual workers. Doms et al. (1997) clarify that companies that have
introduced technical capital, like computers, show higher trends of employing workers, such as
engineers and managerial personnel, who possess a strong academic background. They also argue that
more companies tend to employ these kinds of people both before and after introducing the new
technologies. Based on the data available in France, Abowd et al. (1999) have found that companies
paying large salaries experience high productivity, have a large amount of capital, and can afford to
employ more skilled workers. In addition, by matching data between the management and employees,
Kenneth (1999) has illustrated that large companies’ wage premiums are supported by technical
capital, such as rent−sharing and computers, and their influences in markets.
4 From this hypothesis, Bulow and Summers (1986) theorized that large companies pay high wages to boost workers’morale due to the difficulty in monitoring their operations. They also theorized that non−spontaneous unemploymentcan emerge in the secondary sector.
- 22 - Vol.58 No.3OSAKA ECONOMIC PAPERS

As Okamura (2002) has introduced, there is a body of concrete, analytical researchs on major
hypotheses that explain Japanese wage gaps based on corporate size. Studies by Genda (1996) and
Okui (2000) are particularly important as examinations of the ability gap hypothesis, which states that
the wage disparity that reflects differences in workers’ performance standards cannot be statistically
observed. Genda (1996) points out that in the case of white−collar workers, especially university
graduates, a large part of their wage differentials result from differences in job training experience.
Okui (2000) has found that the wage gaps can be completely detected even after the distinctive
characteristics of individual workers have been excluded. These wage gaps are still evident due to the
fixed effects based on the model that uses the differences in wage functions for companies where new
employees worked just before switching jobs.
Moreover, there is a predominant tendency toward relating wage gap factors with Japanese
employment practices. Yashiro (2002) argues that generally speaking, “Japanese−style” employment
practices are characterized by lifetime employment, a seniority promotion system, and labor unions
organized on a company basis. The seniority promotion system can be viewed not as a fixed
employment model specific to Japan but as a corporate special training program for workers, i.e., an
economically rational mechanism for developing human capital. As Ono (1997) suggests, the system
can also be considered as a personnel training model for keeping up with technological advances amid
current fast−paced innovations, rather than as a special treatment for skilled workers. In addition, Ono
(1989) paid detailed attention to the fact that a coefficient of determination is higher with a model
focusing on working years and age than with a model focusing on working experiences and years in
other companies. Ono supported a hypothesis on the guarantee of living expenses in relation to the
seniority system. Ohashi (1990) supported an incentive hypothesis stating that wage raises and their
prospects will boost workers’ morale and help increase productivity. Researchers often claim that the
effects of permanent employment and labor unions are strongly linked to this seniority promotion
system. Yashiro (2002) indicates that an economically valid reason for labor unions on a company
basis is employees’ long−term profit sharing with their corporate management. In the seniority system,
employees’ biggest interest is the survival and growth of their company. In a system where they can
receive higher payments, such as retirement bonuses when they reach middle age, workers virtually
form a capital tie−up with their management. Labor unions can play an important role in helping
companies generate profits. Yashiro (2002) also points out that the retirement system is essential to
securing a proper balance between wages and productivity throughout workers’ life cycles. In the
seniority model, lower payments in young days are compensated for by higher payments after workers
reach middle age.
The previously mentioned preceding studies have shown that a complete examination of all
conceivable wage differential factors is difficult to achieve for the purpose of empirical analysis. This
study does not seek to explore these factors themselves. Instead, a common thread in the preceding
studies is their efforts to eliminate factors based on various economic hypotheses and Japan’s unique
employment practices. These studies then examined the difference caused by such attributes as
workers’ ages, years of employment, and educational backgrounds, and how those differences will
December 2008 - 23 -Empirical Evidence of Employer Size Wage Differential
change depending on the size of the corporation. This report intends to analyze these factors (the
distinctiveness of individual workers) and explore the difference in workers’ ages, employment years,
and educational backgrounds between large and smaller companies. This study is conducted with a
focus on the dual structure in the labor market. In addition, the paper obtains the expected wages on
the supposition of workers’ moving within one company or to another company of a different size.
Finally, this study confirms that the labor market forms the dual structure and functions within that
framework.
3. Empirical Model
3.1. Endogenous Switching Regression Model
This study uses the Endogenous Switching Regression Model invented by Poirier and Rudd (1981)
to calculate the wage function of workers. When companies are divided according to size into two
sets, this model enables the calculation of a wage function focusing on endogenicity in relation to
dependence on the sets.5 As the following formulae from (1) to (3) illustrate, this Endogenous
Switching Regression Model facilitates calculating formulae (1) and (2) simultaneously on the
supposition that a multivariate normal distribution exists in a dependent function of determination for
the companies, which are divided by size, and the disturbance term of the wage function within the
sets. This paper divided the companies into two sets using 300 workers as the benchmark. One set
contained companies that employed more than 300 workers and the other set contained those with less
than 300 employees. Only those workers showing signs of relatively limited moves between the two
sets on a provisional basis were considered. Data concerning the moves between the two sets are based
on reports on employment management surveys conducted by the Ministry of Health, Labor, and
Welfare from 1976 to 2003.
In obtaining a likelihood function to conduct the simultaneous calculation of the formulae, the
following section introduces the Probit Model for dependence determination and the Ordinary Least
Square method (OLS) for calculating the wage functions in each set. The next section finally obtains
the likelihood function for the Switching Regression Model.
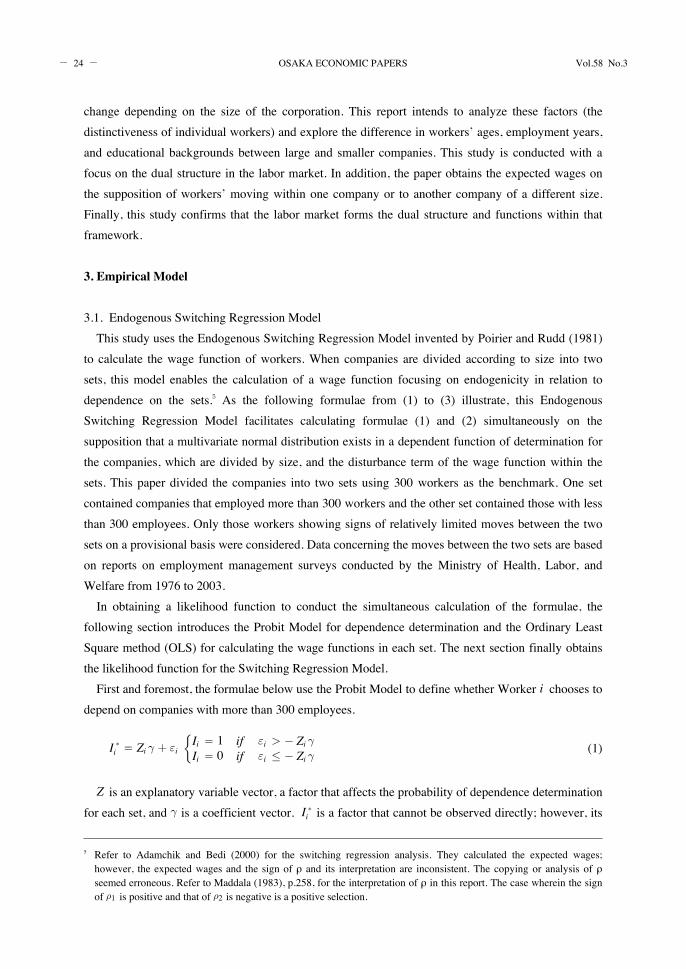
First and foremost, the formulae below use the Probit Model to define whether Worker i chooses to
depend on companies with more than 300 employees.
Ii��Zi���i Ii �1
Ii �0 ifif�i ��Zi��i ��Zi��
(1)
Z is an explanatory variable vector, a factor that affects the probability of dependence determination
for each set, and�is a coefficient vector. Ii�is a factor that cannot be observed directly; however, its5 Refer to Adamchik and Bedi (2000) for the switching regression analysis. They calculated the expected wages;however, the expected wages and the sign of ρ and its interpretation are inconsistent. The copying or analysis of ρseemed erroneous. Refer to Maddala (1983), p.258, for the interpretation of ρ in this report. The case wherein the signof�1 is positive and that of�2 is negative is a positive selection.
- 24 - Vol.58 No.3OSAKA ECONOMIC PAPERS

sign determines its value. Now, suppose that F is the cumulative distribution function of the
disturbance term�i . The probability of Ii �1 is:P Ii �1�Zi� ��F Zi�� �
By the same token, the probability of Ii �0 is:P Ii �0�Zi� ��1�F Zi�� �
For the distribution of �i , assuming that the standard normal distribution is �i �N (0�1) and itscumulative distribution function is�, the probability of Ii �1 is:
F Zi( )�� Zi�� �The maximum likelihood estimate can be obtained by maximizing a logarithmic likelihood based
on the following logarithmic function.
L �( )��Ii�1F Z�� ��
Ii�0 1�F Z�� �� �LogL �( )��
i�1n Ii logF Zi�� �� 1�Ii( ) log 1�F Zi�� �� � The Probit maximum likelihood estimate can be obtained by solving�log L �( )�� �0Next, the following formulae define the model for calculating wage functions in each set by the
OLS method.
logW1i �X1i���1i if �i ��Zi�logW2i �X2i���2i if �i ��Zi� (2)
logW1i and logW2i are the wages of Worker I ; X1 and X2 are explanatory variable vectors that
determine the workers’ wages in each set;�and�are the coefficient vectors of the variables; and thedisturbance terms are supposed to be u1i �N 0�12� �
, u2i �N 0�22� �.
There is no problem in conducting analyses that find that the respective variables for Z , X1 , and X2
in the aforementioned formulae (1) and (2) are different. However, this study conducts a simultaneous
calculation of formulae (1) and (2) to estimate the expected wages in the case of workers moving
between each set and applies variable handling to Z , using the same explanatory variable.
Supposing that the disturbance terms of formulae (1) and (2) follow the multivariate normal
distribution in the Switching Regression Model for the simultaneous calculation, it follows that�1i��2i��i( )�N 0��� � shows the variation and covariance matrixes of a positive−definite symmetric matrix. With
regard to the following formula (3),12 is the standard deviation of�1i ,�2i , and as for the correlation
December 2008 - 25 -Empirical Evidence of Employer Size Wage Differential

coefficient�1�2,�1 �Cov �1i��i( )�1 , �2 �Cov �2i��i( )�2(3)� � �12�21�1�1 �12�22�2�2 �1�1�2�2
1
��� ���The previously mentioned formulae (1), (2), and (3) lead the following logarithmic likelihood
function.6 This calculation pattern known as the complete information maximum likelihood method
requires the strict specification of models in order to obtain the maximum likelihood estimate value.
log L �����1��2��� ��i�1n Ii log
��Zi�f u1i��i( ) d�i� �� 1�Ii( ) logZi�� g u2i��i( ) d�i� � �� �����
i�1n Ii log��Zi�f logw1i �x1i���i�
d�i� �� ��1�Ii( ) log
Zi�� g logw2i �x2i���i�
d�i� ��f , g shows the joint density function of a bivariate normal distribution7 and on the supposition of
u1i �N 0��12� , �i � 0�1�
, it follows that
f u1i��i( )� 1
2�1 1��2� e� 12 1��2� � u1�1� �2
Therefore, in the case of the correlation coefficient �1 �0, the bivariate normal distribution of theaforementioned f is as follows:
f u1i��i( )� 1
2�1 e�12 u1�1� �2This equation is the same as the density function of a single variate normal distribution. In this line
of reasoning, �1 �0 is the sufficient condition of the bivariate being independent.8 In addition, �1 ,�1 , and �2, �2 all equal zero implies that f , g is the same as the density function of the standardnormal distribution, which renders it unnecessary to use the Switching Regression Model. The
simultaneous calculation of the dependent function of determination and the wage function presents
examination results reflecting the covariance structure between workers’ dependence determination
and the disturbance terms of the wage function. More specifically, unless �1 �0, �1 �0 and �2 �0,�2 �0 are premised, the results of the switching regression can reflect the effects of various individual6 Refer to Maddala (1983), p.224, for the logarithmic function.7 Ishikawa and Dejima (1994) adopted the Switching Regression Model for calculating the covariance betweenerroneous terms through successive likelihood maximization. Refer to Iwata (2000) for the structure of the bivariatenormal distribution.
8 Iwata (2000) argues that�1 �0 does not always imply that a bivariate is independent.
- 26 - Vol.58 No.3OSAKA ECONOMIC PAPERS
traits, such as corporation features and workers’ abilities and attributes, on individual calculations.9
These traits cannot be assessed by individual calculations through the Probit Model and the OLS
method.
3. 2. Obtaining conditional expectations through the Switching Regression Model
Using the results of the previously mentioned calculation model, this study obtains the conditional
expectations for logW1i and logW2i by assuming Ii as the conditions with respect to Worker i . This
study also conducts a tentative calculation of conditional expectations in the case of workers moving
within or beyond their set.
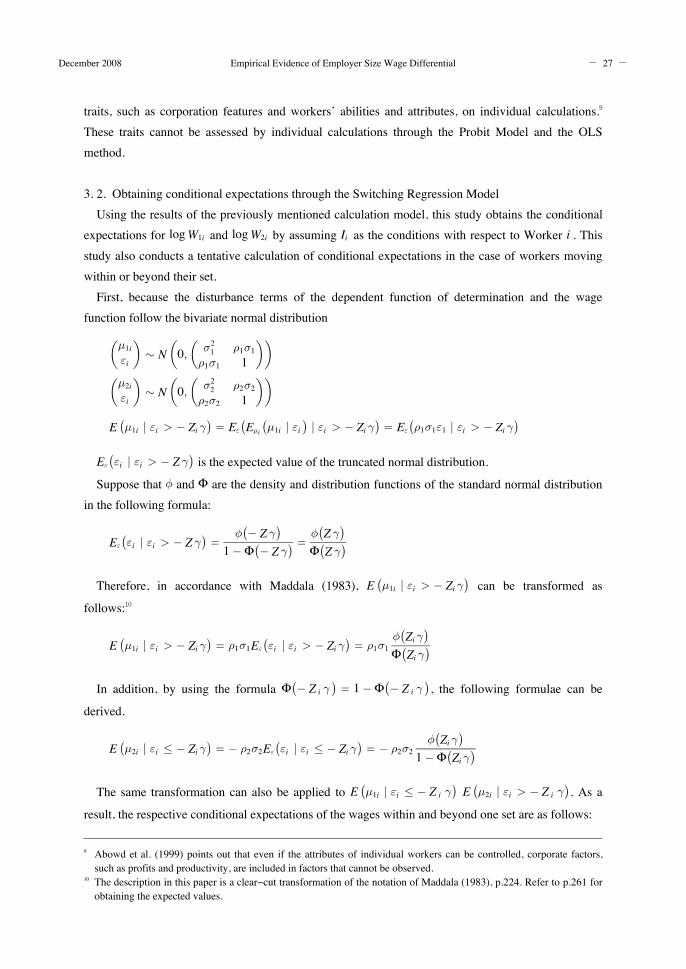
First, because the disturbance terms of the dependent function of determination and the wage
function follow the bivariate normal distribution�1i�i� ��N 0� �12�1�1 �1�11
� �� ��2i�i� ��N 0� �22�2�2 �2�21
� �� �E �1i ��i ��Zi�� ��E�E�i �1i ��i� ���i ��Zi�� ��E��1�1�1 ��i ��Zi�� �
E��i ��i ��Z�� �is the expected value of the truncated normal distribution.
Suppose that�and�are the density and distribution functions of the standard normal distributionin the following formula:
E��i ��i ��Z�� �� ��Z�� �1���Z�� ���Z�� �� Z�� �
Therefore, in accordance with Maddala (1983), E �1i ��i ��Zi�� �can be transformed as
follows:10
E �1i ��i ��Zi�� ���1�1E��i ��i ��Zi�� ���1�1 �Zi�� �� Zi�� �In addition, by using the formula ��Z i�� ��1���Z i�� �
, the following formulae can be
derived.
E �2i ��i ��Zi�� ����2�2E��i ��i ��Zi�� ����2�2 �Zi�� �1�� Zi�� �
The same transformation can also be applied to E �1i ��i ��Z i �� �E �2i ��i ��Z i �� �
. As a
result, the respective conditional expectations of the wages within and beyond one set are as follows:
9 Abowd et al. (1999) points out that even if the attributes of individual workers can be controlled, corporate factors,such as profits and productivity, are included in factors that cannot be observed.
10 The description in this paper is a clear−cut transformation of the notation of Maddala (1983), p.224. Refer to p.261 forobtaining the expected values.
December 2008 - 27 -Empirical Evidence of Employer Size Wage Differential

E logW1i �X1i��i ��Z i �� ��X1i���1�1 �Zi�� �� Zi�� � (4)
E logW2i �X1i��i ��Z i �� ��X1i��2�2 �Zi�� �� Zi�� � (5)
E logW2i �X2i��i ��Z i �� ��X2i��2�2 �Zi�� �1�� Zi�� � (6)
E logW1i �X2i��i ��Z i �� ��X2i���1�1 �Zi�� �1�� Zi�� � (7)
Formulae (4) and (6) respectively indicate the expected wages of workers in companies with more
than 300 employees and companies with less than 300 employees. Formulae (5) and (7) show the
expected wages in the case of workers moving beyond their respective set. The expected wages are
supposed to be relative in each set with the consideration of the effects of sample selections of various
individual traits.
4. Data and Descriptive Statistics
The data used for this study’s analysis were obtained through the Research on the Working Persons
2002 by the Works Institute of Recruit Co., Ltd. This survey was conducted from August to October
2002 with a focus on the Greater Tokyo Metropolitan area (Tokyo, Kanagawa, Chiba, Saitama, and a
part of Ibaraki), the Kansai region (Osaka, Kyoto, and Hyôgo), and the Tôkai region (Aichi and Gifu).
A total of 17,105 samples was collected: 13,085 (including 9,010 males) in Tokyo and adjacent
prefectures; 2,010 (1,423 males) in the Kansai area; and 2,010 (1,427 males) in the Tôkai area. This
paper employed these data for the following three reasons. First, they are new microeconomic data.
Second, they present an adequate sample amount for an appropriate percentage of the population.
Third, the survey questions sought a diverse range of information, such as workers’ employment
styles, industrial sectors, occupational fields, and specific operations in business. This thesis chose to
analyze the samples of full−time male workers from the entire data sample.
The previous section showed that because the Switching Regression Model facilitates the
simultaneous calculation of dependence determination and wage functions in two sets for metrical
analysis, this study evaluated two sets of companies: those with more than 300 employees and those
with fewer. However, this research paper also conducts calculations based on criteria other than
corporate size and interprets the examination results in the later sections.
The descriptive statistics on variables used for the employment function of determination and the
wage function are illustrated in Table 1.11 This thesis seeks to obtain the expected wages on the
11 Since this study sets the “annual income of the previous year” as the explained variable, it excludes the samples ofdummy workers with a working experience of less than one year and adds dummies with a working experience of lessthan two years to the variable. The square terms of the working years are excluded because they do not show a level ofsignificance in any calculations. Managerial positions (store manager, for example) and dummies of managerialpersonnel (division supervisor and other higher positions) are distinguished from each other and both are used as
- 28 - Vol.58 No.3OSAKA ECONOMIC PAPERS

Table 1. Descriptive statistics
Corporate size
300 or more employees Less than 300 employees
Variables Average Standard deviation Average Standard deviation
Annual income (logarithmic values) 6.452 0.414 6.146 0.421
University graduates or higher education and science course 0.559 0.497 0.322 0.467
College, technical college and technical school 0.124 0.330 0.187 0.390
High school graduates 0.299 0.458 0.411 0.492
Junior high school graduates ‹standard› 0.018 0.132 0.080 0.272
University graduates or higher education and science course 0.239 0.426 0.097 0.296
Employment years 15.421 9.941 10.646 9.086
Dummy with less than 2 years in employment 0.039 0.193 0.101 0.301
Age 38.878 9.315 37.064 9.952
Square term of age 1598.264 755.092 1472.786 781.377
Dummy of managerial personnel 0.645 0.479 0.479 0.500
Working experience (month) 140.395 109.366 130.092 106.038
Working hours (hours/week) 49.306 11.207 49.440 12.238
Dummy of the married 0.826 0.379 0.712 0.453
Dummy of people with children 0.734 0.442 0.635 0.482
Construction sector 0.058 0.233 0.144 0.351
Manufacturing sector 0.416 0.493 0.262 0.440
Transportation and communications sectors 0.123 0.328 0.108 0.310
Wholesale and retail 0.097 0.296 0.137 0.344
Finance and insurance 0.094 0.292 0.031 0.172
Service sector 0.176 0.381 0.252 0.434
Others 0.038 0.190 0.066 0.248
Service, security and production operations 0.220 0.414 0.405 0.491
Managerial positions 0.214 0.410 0.113 0.316
General management and sales operations 0.286 0.452 0.226 0.418
Technical operations 0.223 0.416 0.152 0.359
Professional career 0.047 0.212 0.083 0.276
Others 0.011 0.103 0.022 0.147
Tokyo Metropolitan area 0.763 0.425 0.748 0.434
Kansai region 0.132 0.338 0.121 0.326
Tokai region 0.105 0.306 0.130 0.337
Sample weight 1.056 0.568 1.097 0.607
Cohort dummies by university graduation year 0.329 0.470 0.317 0.465
Employment age 23.457 5.962 26.419 8.075
Square term of employment age 585.767 373.443 763.123 517.565
Number of samples 3456 3617
Educational background, industry, job category and urban areas are dummy variables.
December 2008 - 29 -Empirical Evidence of Employer Size Wage Differential
supposition that workers change employment and move to another set. If the labor market is not
divided from within, then the percentage of job transfers should be flat in every aspect of the market.
However, the argument for a dual structure is predicated on the premise that the labor market is
divided into two distinctive groups. Therefore, the explanatory variables used for dependence
determination focus on the tendency of workers to remain in their current groups, though they can
move to others with similar attributes to clarify the decisive factors for the tendency. This study used
the same explanatory variable for dependence determination and wage functions because the
distinctiveness of individual workers affects those factors in the simultaneous calculation. To address
the variable handling of the dependent function of determination, the study selected dummy graduates
before 1971 and from 1989 to 1993. The labor ministry’s report on employment management surveys
estimates that during these periods, more than 55% new university graduates were employed by
companies with more than 300 employees.12
The descriptive statistics show that the attributes of workers employed by companies with more
than 300 employees differ from those of workers employed by companies with less than 300
employees. These statistics suggest that large companies have higher percentages of employees with
strong academic backgrounds (almost 56%), a high worker retention rate, and people engaged in the
manufacturing sector. By and large, this finding is in accordance with those of preceding studies.
These results are suggestive of the effects that differences in workers’ attributes have on wage
differentials.
5. Results
5.1. Calculation results of the Switching Regression Model and OLS method
In Table 2, the case of working in a large company is categorized as “1” and other cases are
categorized as “0.” This categorization follows the Probit Model of the binary function of
determination and the Switching Regression Model based on simultaneous calculations. Table 3 shows
the results of the OLS method and the Switching Regression Model of the wage function. The results
of the simultaneous calculations reveal that the sign�2 is positive and achieves a level of significance.This finding is suggestive of the potential negative selections of employees in relation to companies
with less than 300 employees. The negative selection implies that companies with more than 300
employees secure human resources with high wages based on their operational characteristics
(workers with higher levels of productivity, for example) and that companies with less than 300
distinctive terms. Dummies of corporate scale in each set are excluded because they present limitations in searching forpredictive values. However, including them does not affect the exploration of this research at all.
12 The inaugural years of new graduates were calculated on the basis of the most common graduation age (22 years in thecase of university graduates). The calculations do not consider the cases of people who stayed at a university foradditional years and people who spent additional years studying for university entrance examinations. Genda (1997)points out that this grouping of new graduates by their inaugural year can affect their wages as generational effects.This paper has confirmed that the cohort dummies it used do not show a level of significance with wage functions bythe OLS method. This paper also examined the validity of variable handling within every range possible, as it describeslater.
- 30 - Vol.58 No.3OSAKA ECONOMIC PAPERS

employees choose other people who fall outside that category. At the same time, �1 does not show alevel of significance in terms of statistics. �1 �0 is the sufficient condition for the bivariate beingindependent, and the disturbance terms are not always independent. However, supposing that the
disturbance terms of the dependent function of determination and the wage function are independent
(in other words, assuming that there exists no relevance between the employment probability and
wage levels based on factors that can not be observed), the results of the condition �1 �0 and �2 �0reflect the demand factors on part of large companies. The results also reflect a specific internal
structure of the labor market where large companies focus more attention on operational competition
Table 2. Results of Probit and Swithicng Regression
Probit Switching
Explanatory variables Marginal Effect Marginal Effect
Constant term −1.358*** −1.218***
(0.296) (0.309)
University graduation or higher 0.962*** 0.880***
(0.081) (0.082)
College, technical college and technical school 0.610*** 0.551***
(0.080) (0.082)
High school graduates 0.533*** 0.470***
(0.071) (0.074)
University graduates and higer education and science course 0.268*** 0.279***
(0.060) (0.058)
Employment years 0.053*** 0.052***
(2.9E−03) (2.4E−03)
Dummy with less than 2 years in employment −0.030 −0.111*
(0.072) (0.066)
Age −4.4E−03 −5.2E−03
(0.015) (0.015)
Square term of age −3.0E−04* −3.3E−04*
(1.8E−04) (1.8E−04)
Dummy of managerial personnel 0.050 0.059
(0.039) (0.041)
Career −1.14E−03*** −9.6E−04***
(2.1E−04) (1.9E−04)
Working hours 1.0E−04 −2.4E−04
(1.3E−03) (1.4E−03)
Dummy of the married 0.209*** 0.193***
(0.065) (0.064)
Dummy of people with children 0.022 0.039
(0.060) (0.060)
Cohort dummy by university graduation year 0.113*** 0.089***
(0.035) (0.032)
log likelihood −4072.286 −4932.711
Number of samples 7073 7073
The marked parts ***1%, **5%, *10% are significant. The parenthesized figures are standard error gaps.
Calculations are based on sample weight with the addition of industrial, job category and city dummies.
December 2008 - 31 -Empirical Evidence of Employer Size Wage Differential
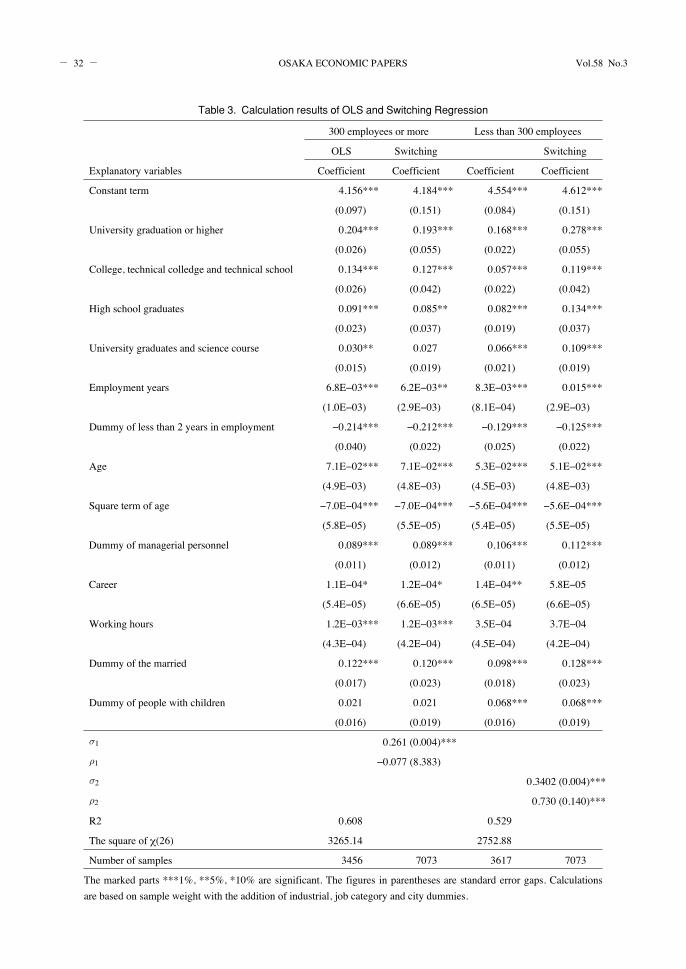
Table 3. Calculation results of OLS and Switching Regression
300 employees or more Less than 300 employees
OLS Switching Switching
Explanatory variables Coefficient Coefficient Coefficient Coefficient
Constant term 4.156*** 4.184*** 4.554*** 4.612***
(0.097) (0.151) (0.084) (0.151)
University graduation or higher 0.204*** 0.193*** 0.168*** 0.278***
(0.026) (0.055) (0.022) (0.055)
College, technical colledge and technical school 0.134*** 0.127*** 0.057*** 0.119***
(0.026) (0.042) (0.022) (0.042)
High school graduates 0.091*** 0.085** 0.082*** 0.134***
(0.023) (0.037) (0.019) (0.037)
University graduates and science course 0.030** 0.027 0.066*** 0.109***
(0.015) (0.019) (0.021) (0.019)
Employment years 6.8E−03*** 6.2E−03** 8.3E−03*** 0.015***
(1.0E−03) (2.9E−03) (8.1E−04) (2.9E−03)
Dummy of less than 2 years in employment −0.214*** −0.212*** −0.129*** −0.125***
(0.040) (0.022) (0.025) (0.022)
Age 7.1E−02*** 7.1E−02*** 5.3E−02*** 5.1E−02***
(4.9E−03) (4.8E−03) (4.5E−03) (4.8E−03)
Square term of age −7.0E−04*** −7.0E−04*** −5.6E−04*** −5.6E−04***
(5.8E−05) (5.5E−05) (5.4E−05) (5.5E−05)
Dummy of managerial personnel 0.089*** 0.089*** 0.106*** 0.112***
(0.011) (0.012) (0.011) (0.012)
Career 1.1E−04* 1.2E−04* 1.4E−04** 5.8E−05
(5.4E−05) (6.6E−05) (6.5E−05) (6.6E−05)
Working hours 1.2E−03*** 1.2E−03*** 3.5E−04 3.7E−04
(4.3E−04) (4.2E−04) (4.5E−04) (4.2E−04)
Dummy of the married 0.122*** 0.120*** 0.098*** 0.128***
(0.017) (0.023) (0.018) (0.023)
Dummy of people with children 0.021 0.021 0.068*** 0.068***
(0.016) (0.019) (0.016) (0.019)�1 0.261 (0.004)***�1 −0.077 (8.383)�2 0.3402 (0.004)***�2 0.730 (0.140)***
R2 0.608 0.529
The square of χ(26) 3265.14 2752.88
Number of samples 3456 7073 3617 7073
The marked parts ***1%, **5%, *10% are significant. The figures in parentheses are standard error gaps. Calculations
are based on sample weight with the addition of industrial, job category and city dummies.
- 32 - Vol.58 No.3OSAKA ECONOMIC PAPERS
among individual workers throughout the duration of their employment than on the selection of
workers at the time of hiring.13 At the same time, this finding suggests that, statistically speaking,
workers in smaller companies do not have any opportunity for self−selection.14 The result �2 �0implies that there exist positive correlations between the disturbance terms of the dependent function
of determination and the wage function. Based on the explanatory variables, in terms of the
employment probabilities of small and medium−sized enterprises, people with high employment
probabilities with smaller companies (for example, people with longer years of employment and
stronger academic backgrounds) will be given lower wages than those given to workers at large
companies from the perspective of the whole market. Since the Switching Regression Model is
considered more valid, the calculation results based on the Probit Model and OLS method do not
attain coincidence estimates. However, they are supportive findings for the results of workers’
expected wages measured in the next section.
With an emphasis on the comparison between the calculation results of the Switching Regression
Model and those of the OLS method, this research briefly examines the educational background and
years of employment coefficients and studies the differences between these coefficients for larger and
smaller companies. These differences are closely linked with the human capital theory. When the
educational background and years of employment coefficients are compared across companies, the
figures are smaller for companies with more than 300 employees. For university graduates, the
coefficient shrinks from 0.204 to 0.193, and for employment years, the coefficient declines from 6.8
E−03 to 6.2E−03. However, these figures are larger in the case of companies with less than 300
employees. For university graduates, the coefficient increases from 0.168 to 9.278, and for
employment years, it increases from 8.3E−03 to 0.015. Controlling the distinct characteristics of
individual workers based on simultaneous calculations suggests that large companies show a tendency
toward lower returns on their workers’ attributes than do smaller companies. A comparison of the
coefficients of educational backgrounds based on the Switching Regression Model reveals that the
figures narrow in the case of large companies. The gaps between university graduates and high school
graduates range from 0.113 to 0.108. The figures widen in the case of smaller firms. The gaps between
university graduates and high school graduates range from 0.086 to 0.144. This finding indicates that,
according to the Switching Regression Model, longer years of employment can have an adverse effect.
More specifically, one distinctive characteristic of individual workers is the years of employment. The
years of employment narrow the wage gaps that are caused by different educational backgrounds,
along with the operational improvement of workers. In contrast, wage gaps due to educational
backgrounds tend to widen in the case of small and medium−sized enterprises because these
13 Okamura (1999) has illustrated that if operational competition among individual workers replaces competition based ontheir educational backgrounds at the time of employment, wage gaps due to differences in educational backgroundswill shrink. This shrinking of wage gaps is in accordance with the theory of Okamura (1999) that the results of theSwitching Regression Model show that coefficients based on academic backgrounds decrease in comparison with theresults of the OLS method.
14 This study did not use variables indicating self−selection for analysis, and its interpretation is based on corporatedemand factors.
December 2008 - 33 -Empirical Evidence of Employer Size Wage Differential

companies do not possess a large accumulation of individual workers’ expertise or the seniority
promotion system.15
5. 2. Validity of variable handling
Table 4 shows �values in the case of adding age at the time of hiring and its square terms tovariable handling instead of age and its square terms to explore the validity of dummy university
graduates before 1971 and from 1989 to 1993 for variable handling. The chart also includes�valuesbased on calculations by four different criteria for the categorization of corporations by size. (1) Even
if age at the time of hiring is added for variable handling, the signs and levels of significance of�1 and�2 do not change remarkably. Therefore, using cohort dummies for variable handling can be
considered with some degree of validity. The number of company employees ranges from 5,000 to
1,000. The chart pays attention to individual �values by using the following three different
benchmarks to divide the companies: (2) 1,000 employees, (3) 100 employees, and (4) 30 employees.
The chart illustrates that �1 does not show a level of significance in any case and that �2 valuesgradually climb from 0.659 with 1,000 employees to 0.804 with 30 employees. These values suggest
that the gaps in the negative selection described in the previous section become wider as the
corporation size becomes smaller.
5. 3. Analysis results of expected wages
Table 5 presents workers’ expected wages measured by the calculation method specified in Section
3. The upper part of the chart shows the figures representing workers with the academic background
of a university undergraduate degree or higher. The lower part of the chart presents the figures of
those without a university degree. Retirees are excluded from the calculations for stricter exploration
of the effects of employment years that are closely connected with the human capital theory.16 This
15 However, with regard to the effects of age, the coefficients decrease in the case of smaller firms. However, the figuresdo not show any particular changes in the case of large companies. A major conceivable reason for this difference isthat they are multi−collinear with employment years. However, stricter examinations are necessary with variablehandling.
Table 4. Examination of ρ
Alteration of variable handling and criteria for categorization of corporate size �1 �21) Case of adding employment age for variable handling −0.073 0.702***
(2.019) (0.145)
2) Companies with 1000 or more employees, or less than 1000 emplyees −0.544 0.659***
(0.503) (0.111)
3) Companies with 100 or more employees, or less than 100 employees −0.053 0.769***
(3.578) (0.176)
4) Companies with 30 or more employees, or less than 30 employees −0.022 0.804***
(2.341) (0.278)
The marked parts ***1% are significant. The parenthesized figures are standard error gaps.
- 34 - Vol.58 No.3OSAKA ECONOMIC PAPERS
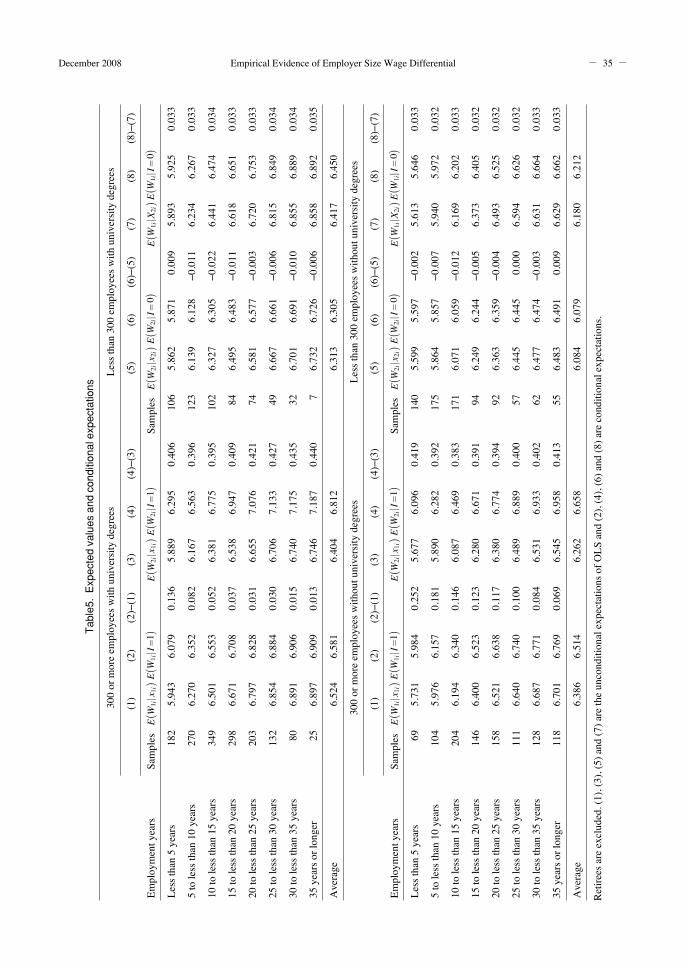
Table5.Expectedvaluesandconditionalexpectations
300ormoreemployeeswithuniversitydegrees
Lessthan300employeeswithuniversitydegrees
(1)
(2)
(2)−(1)
(3)
(4)
(4)−(3)
(5)
(6)
(6)−(5)
(7)
(8)
(8)−(7)
Employmentyears
Samples
EW1 i� x 1 i�� E
W1 i� I�1��
EW2 i� x 1 i�� E
W2 i� I�1��
Samples
EW2 i� x 2 i�� E
W2 i� I�0��
EW1 i� X 2 i�� E
W1 i� I�0��
Lessthan5years
182
5.943
6.079
0.136
5.889
6.295
0.406
106
5.862
5.871
0.009
5.893
5.925
0.033
5tolessthan10years
270
6.270
6.352
0.082
6.167
6.563
0.396
123
6.139
6.128
−0.011
6.234
6.267
0.033
10tolessthan15years
349
6.501
6.553
0.052
6.381
6.775
0.395
102
6.327
6.305
−0.022
6.441
6.474
0.034
15tolessthan20years
298
6.671
6.708
0.037
6.538
6.947
0.409
846.495
6.483
−0.011
6.618
6.651
0.033
20tolessthan25years
203
6.797
6.828
0.031
6.655
7.076
0.421
746.581
6.577
−0.003
6.720
6.753
0.033
25tolessthan30years
132
6.854
6.884
0.030
6.706
7.133
0.427
496.667
6.661
−0.006
6.815
6.849
0.034
30tolessthan35years
806.891
6.906
0.015
6.740
7.175
0.435
326.701
6.691
−0.010
6.855
6.889
0.034
35yearsorlonger
256.897
6.909
0.013
6.746
7.187
0.440
76.732
6.726
−0.006
6.858
6.892
0.035
Average
6.524
6.581
6.404
6.812
6.313
6.305
6.417
6.450
300ormoreemployeeswithoutuniversitydegrees
Lessthan300employeeswithoutuniversitydegrees
(1)
(2)
(2)−(1)
(3)
(4)
(4)−(3)
(5)
(6)
(6)−(5)
(7)
(8)
(8)−(7)
Employmentyears
Samples
EW1 i� x 1 i�� E
W1 i� I�1��
EW2 i� x 1 i�� E
W2 i� I�1��
Samples
EW2 i� x 2 i�� E
W2 i� I�0��
EW1 i� X 2 i�� E
W1 i� I�0��
Lessthan5years
695.731
5.984
0.252
5.677
6.096
0.419
140
5.599
5.597
−0.002
5.613
5.646
0.033
5tolessthan10years
104
5.976
6.157
0.181
5.890
6.282
0.392
175
5.864
5.857
−0.007
5.940
5.972
0.032
10tolessthan15years
204
6.194
6.340
0.146
6.087
6.469
0.383
171
6.071
6.059
−0.012
6.169
6.202
0.033
15tolessthan20years
146
6.400
6.523
0.123
6.280
6.671
0.391
946.249
6.244
−0.005
6.373
6.405
0.032
20tolessthan25years
158
6.521
6.638
0.117
6.380
6.774
0.394
926.363
6.359
−0.004
6.493
6.525
0.032
25tolessthan30years
111
6.640
6.740
0.100
6.489
6.889
0.400
576.445
6.445
0.000
6.594
6.626
0.032
30tolessthan35years
128
6.687
6.771
0.084
6.531
6.933
0.402
626.477
6.474
−0.003
6.631
6.664
0.033
35yearsorlonger
118
6.701
6.769
0.069
6.545
6.958
0.413
556.483
6.491
0.009
6.629
6.662
0.033
Average
6.386
6.514
6.262
6.658
6.084
6.079
6.180
6.212
Retireesareexcluded.(1),(3),(5)and(7)aretheunconditionalexpectationsofOLSand(2),(4),(6)and(8)areconditionalexpectations.
December 2008 - 35 -Empirical Evidence of Employer Size Wage Differential

section explores both wage differentials and the dual structure in the labor market and considers the
theoretical backgrounds of the preceding studies introduced in Section 2.
Column (1) of the chart shows predictive values that are calculated based on the examination of
workers in companies with more than 300 employees. These values were computed using the OLS
method. Column (5) shows predictive values based on the examinations of workers in companies with
less than 300 employees. These values were also computed using the OLS method. Columns (3) and
(7) line up OLS predictive values in the cases when workers moves across their sets based on the
coefficients obtained in Columns (1) and (5). On the supposition of controlling the effects of
disturbance terms, these figures comprise the averages of the wages that companies actually pay in the
market.17
The conditional expectations are shown in Columns (2), (4), (6), and (8). Columns (2) and (6)
present workers’ conditional expectations in their set, and Columns (4) and (8) show the workers’
conditional expectations if they move beyond their set.18
This thesis now examines the calculation results that use the figures of workers with the academic
background of a university degree or higher. These figures are displayed in the upper half of the chart.
A comparison of Columns (1) and (3) with Columns (5) and (7) shows that since large companies lay
greater emphasis on workers’ attributes than do small and medium−sized enterprises, the predictive
values of the former, which are obtained by the OLS method, are higher.
The effects of negative selection based on the distinct qualities of individual workers can be
highlighted by a comparison between the following two wages: (3) the proposed wages that are
offered to workers when they move from companies with more than 300 employees to smaller
companies and (4) the expected wages when workers’ attributes that cannot be observed are
considered. (4)−(3) signifies the numerical gaps between these two wages.
The comparison between (3) and (4) indicates that conditional expectations are higher than the
proposed wages when people move from large corporations to smaller companies. In other words, if
workers in large companies move down to a lower group within the dual structure, their productivity
is likely to be perceived as more valuable than it really is in terms of proposed wages. According to
the results of this study, the value of proposed wages is higher than (1), the actual wages in large
companies. Since �1 and �2 are interpreted from the perspective of labor demands, workers in large
companies are not motivated to move to smaller companies unless those companies offer their (4),
expected wages. The expected wages of smaller companies are higher than (1), the actual proposed
wages of large companies, which conduct employment practices primarily through the national
pension program. This finding suggests that workers’ expertise accumulated in large companies
16 The order of these figures becomes more apparent by age, including that of retirees.17 Two predictive values can be obtained from the calculations performed by the Switching Regression Model. One valuerepresents the unconditional expectations of the Switching Regression Model and the other represents the conditionalexpectations.
18 Though�1 is not significant, the figures in Columns (2) and (8) are directly based on �1 and �1 . The expected wagescan be calculated by the inverse Mills’ ratio (λ) based on Heckman’s two−step method; however, simultaneouscalculations facilitate measurement using a great deal of information.
- 36 - Vol.58 No.3OSAKA ECONOMIC PAPERS

should be evaluated more extensively in smaller companies.
This paper compares (4)−(3) of workers with at least a university degree with (4)−(3) of those
without a degree, in order to study the effects of educational background. The results reveal are that
the figures are larger in the case of workers with a university degree. 0.421 is the result for university
graduates with 20 years of employment, and 0.394 is the result for those without a degree. This
finding implies that university graduates are more likely to be highly evaluated by smaller companies.
By the same token, for employment years, the gaps of (4)−(3) show increases for more than 15 years
of employment (0.409 with university graduates). In the meantime, the gaps of (2)−(1) and a
comparison of (1) and (3) suggest that the proposed wages of large corporations are higher that those
of smaller companies and match (2), workers’ expected wages, better. As a result, workers in large
companies are prevented from moving to smaller firms. In addition, a comparison of Column (5) with
Column (8) shows that workers in smaller companies can gain higher praise for their attributes by
moving to large corporations. However, the interpretation of �1 and �2 from the viewpoint of labor
demands shows that such workers encounter difficulties when attempting to secure employment with
large companies that have undergone a selection of workers. These interpretations may be left with
reservations, including problems in calculation. This study employs workers’ attributes that are
generally used to calculate the wage function for variables. This study has also presented
interpretations on the disparity between the obtained expected wages and conditional expectations
based on the OLS method and �values based on the Switching Regression Model. However, the �values depend heavily on variable handling. If different �values are obtained by conducting a newvariable handling that is not correlated with the distinct characteristics of individual workers, the
previously mentioned interpretations are likely to become invalid.
6. Conclusion
By conducting empirical analyses using microeconomic data, this study has explored the dual
structure and wage differentials based on company size. The research study divided companies into
two categories: companies with more than 300 employees and those with less than 300 employees.
This study has also performed simultaneous calculations on the determination of dependence on
companies and the wage function. As a result, it shed light on the possibility that smaller companies
conduct negative selection while large companies select and secure workers that exhibit relatively high
productivity levels. With much consideration to these distinct characteristics of individual workers,
this study determined that the appeal of workers’ educational backgrounds and employment years is
reduced in large companies. Moreover, the study focused on workers’ expected wages in each set and
examined wage gaps and the dual structure in the labor market. The upshot is that the proposed wage
in the market discourages workers from moving to different groups.
By considering the theoretical backgrounds of many preceding studies and using relatively new
microeconomic data, this report has confirmed the existence of the dual wage structure in the market.
Examining the mechanism more closely constitutes a future academic challenge.
December 2008 - 37 -Empirical Evidence of Employer Size Wage Differential

References
Abraham Katharine G., and Henry S. Faber (1987) “Job Duration, Seniority and Earnings,” American
Economic Review, Vol.77.
Francis Kramarz, and David N. Margolis (1999) “High Wage Workers and High Wage Firms,”
Econometrica, Vol.67.No.2.
Adamchik Vera A., and Arjun S. Bedi (2000) “Wage Differentials between the Public and the Private
Sectors: Evidence from an Economy in Transition,” Labour Economics, Vol.7.
Akerlof G, and Yellen (ed.) (1986) Efficiency Wage Models of Labor Market, Cambridge University
Press.
Altonji Joseph, and R.A. Shakotko (1987) “Do Wages Rise with Job Seniority?” Review of Economic
Studies, Vol.54.
Arisawa Hiromi (1957) “Can Economic Expansion Solve Employment Problems?” Sekai, Vol.135.
Barron Joth, Dan A. Black, and Mark A. Loewenstein (1986) “Employer Size: The Implications for
Search, Training, Capital Investment, Starting Wages and Wage Growth,” Journal of Labor
Economics, Vol.5.
Bulow J.I., and Summers L.H. (1986) “A Theory of Dual Labor Markets with Application to
Industrial Policy, Discrimination and Keynesian Unemployment,” Journal of Labor Economics,
Vol.4.No.3.
Doeringer Peter B., and Michael J. Piore (1971) Internal Labor Markets and Manpower Analysis,
Lexington, MA: D.C. Heath and Co.
Doms Mark, Timothy Dunne, and Kenneth R. Troske (1997) “Workers, Wages and Technology,”
Quarterly Journal of Economics, Vol.112.
Dunne Timothy, and James A. Schmitz (1992) “Wages,Employment Structure and Employer Size−
Wage Premia: Their Relationship to Advanced Technology Usage at U.S. Manufacturing
Establishments,” Discussion Paper No.92−15, Washington D.C.
Genda, Yuji (1996) “‘Nature’ or ‘Nurture’? The Ability Gap Theory on Wage Differentials,” Journal
of Japanese Labor Study, Vol.430.
Genda Yuji (1997) “Only One Chance: Generations and Wage Differentials,” Journal of Japanese
Labor Study, Vol.449.
Harashima Taiji, Hisao Tejima, and Hiroshi Miyajima (2002) (eds.) “The Reality of Wage
Differentials,” Japan’s Income Distribution and Disparity, Chapter II, Tôyô Keizai Shimpôsha.
Ishikawa Tsuneo (2000) “The Dual Structure of the Labor Market,” The Economics of Distribution,
Chapter IV, Section III, University of Tokyo Press.
Ishikawa Tsuneo, and Noriyuki Dejima (1994) (eds.) “The Dual Structure of the Labor Market,” The
Japanese Distribution of Income and Wealth, Chapter VI, University of Tokyo Press.
Ishikawa Tsuneo, Moriaki Tsuchiya, and Yoshirô Miwa (1989) (eds.) “The Theoretical Examination
of the Wage Dual Structure,” Japanese Small and Medium−Sized Enterprises, University of
Tokyo Press.
- 38 - Vol.58 No.3OSAKA ECONOMIC PAPERS

Iwata Gyôichi (2000) “Correlations,” The Statistical Methodology for Economic Analysis, Chapter X,
Tôyô Keizai Shimpôsha.
Kawashima Yoko, and Toshiaki Tachibanaki (1986) “The Effect of Discrimination and of Industry
Segmentation on Japanese Wage Differentials in Relation to Education,” International Journal of
Industrial Organization, Vol.4.
Kenneth R. Troske (1999) “Evidence on the Employer Size−Wage Premium from Worker−
Establishment Matched Data,” Review of Economics and Statistics, Vol.81. No.1.
Kim Chang−Jim, Jeremy Piger, and Richard Startz (2004) “Estimation of Markov Regime−Switching
Regression Models with Endogenous Switching,” Federal Reserve Bank of St.Louis Working
Paper, 2003−015B.
Koike Kazuo (1999) The Economics of Work, Tôyô Keizai Shimpôsha.
Krueger Alan (1993) “How Computers Changed the Wage Structure: Evidence from Micro data,
1984−89,” Quarterly Journal of Economics, Vol.108.
Maddala G.S. (1983) “Limited−Dependent and Qualitative Variables in Econometrics,” Cambridge
University Press.
Mellow Wesley (1982) “Employer Size and Wages,” Review of Economics and Statistics, Vol.64
Moore H.L. (1911) “Law of Wages: An Essay in Statistical Economics, “Chapter VI, New York Press.
Muramatsu Kuramitsu (1984) “Income Distribution and the Labor Market in America,” The Analysis
of Japan’s Labor Market: From the Perspective of Internalized Labor, Chapter I, Iwanami
Shoten.
Nakama Hiroyuki, and Terukazu Suruga (1997) (eds.) “The Change of Economic Environment and
Prolongation of Middle−Age Generation Employment,” The Change of Employment Practices
and Female Labor, Chapter II, University of Tokyo Press.
Odaka Kônosuke (1984) Labor Market Analysis, Iwanami Shoten.
Ohashi Isao (1990) The Theory of the Labor Market, Tôyô Keizai Shimpôsha.
Okamura Kazuaki (2002) “Education, Employment, and Income Distribution,” Journal of Japanese
Labor Study, Vol.471.
Okamura Kazuaki (2002) “The Status Quo and Future Tasks of Analysis on ‘Wage Differentials in
Corporate Scale,’” Journal of Japanese Labor Study, Vol.501.
Okui Megumi (2000) “Empirical Analysis of Wage Differentials by Gender Based on Panel Data,”
Journal of Japanese Labor Study, Vol.485.
Ono Akira (1981) “High−Speed Economic Growth and the Labor Market Structure,” Japan’s Labor
Market: The Functions and Structure of External Markets, Chapter VII, Tôyô Keizai Shimpôsha.
Ono Akira (1997) “The Internal Training and External Procurement of Labor Forces,” Japan’s
Employment Practices in Transformation, Chapter X, The Japan Institute for Labor Policy and
Training.
Poirier J. Dale, and Paul A. Ruud (1981) “On the Appropriateness of Endogenous Switching,” Journal
of Econometrics, Vol.16.
Reilly Kevin T. (1995) “Human Capital and Information,” Journal of Human Resources, Vol.30.
December 2008 - 39 -Empirical Evidence of Employer Size Wage Differential

Schmidt Christoph M., and Klaus F. Zimmermann (1991) “Work Characteristics, Firm Size and
Wages,” Review of Economics and Statistics.
Yashiro Naohiro (1997) The Economics of Japanese Employment Practices: The Fluidization of the
Labor Market and the Japanese Economy, The Nihon Keizai Shimbun.
- 40 - Vol.58 No.3OSAKA ECONOMIC PAPERS
Related Documents