Instructions for use Title Significance of radical oxygen production in sorus development and zoospore germination in Saccharina japonica (Phaeophyceae) Author(s) Mizuta, Hiroyuki; Yasui, Hajime Citation Botanica Marina, 53(5): 409-416 Issue Date 2010-10 Doc URL http://hdl.handle.net/2115/47108 Type article (author version) File Information BM53-5_409-416.pdf Hokkaido University Collection of Scholarly and Academic Papers : HUSCAP

Welcome message from author
This document is posted to help you gain knowledge. Please leave a comment to let me know what you think about it! Share it to your friends and learn new things together.
Transcript

Instructions for use
Title Significance of radical oxygen production in sorus development and zoospore germination in Saccharina japonica(Phaeophyceae)
Author(s) Mizuta, Hiroyuki; Yasui, Hajime
Citation Botanica Marina, 53(5): 409-416
Issue Date 2010-10
Doc URL http://hdl.handle.net/2115/47108
Type article (author version)
File Information BM53-5_409-416.pdf
Hokkaido University Collection of Scholarly and Academic Papers : HUSCAP

Significance of radical oxygen production in sorus development and zoospore germination
in Saccharina japonica (Phaeophyceae)
Hiroyuki Mizuta1,* and Hajime Yasui2 1Laboratory of Aquaculture Genetics and Genomics, Faculty of Fisheries Sciences, Hokkaido
University, Minato 3-1-1, Hakodate, Hokkaido 041-8611, Japan, e-mail:
[email protected] 2Laboratory of Marine Industrial Science and Technology, Faculty of Fisheries Sciences,
Hokkaido University, Minato 3-1-1, Hakodate, Hokkaido 041-8611, Japan.
*Correspondence author
Running title: ROS production in sorus formation of Saccharina japonica

2
Abstract
We investigated production of radical oxygen species (ROS) in sorus development of
sporophyte discs and during zoospore germination of Saccharina japonica (Phaeophyceae)
using the fluorescent dye 2’,7’-dichlorofluorescein diacetate (DCFH-DA). Quantitative analysis
of ROS showed high intracellular production during the stages of zoosporangium formation
when paraphyses elongated. In this same stage, remarkable ROS release was observed. ROS
production was also observed histologically (under a fluorescence microscope) in the elongating
paraphyses and the sorus zoosporangia of the sorus. The sorus had significantly higher phenol
content, anti-oxidant capacity and ROS scavenging enzyme activities (ascorbate peroxidase,
catalase, glutathione reductase and superoxide dismutase) than adjacent non-sorus blade sectors.
Thus, intracellular ROS scavenging mechanisms are active during ROS production in sorus
formation. In contrast, iodine content was lower in the sorus than in the adjacent non-sorus
tissues, suggesting the existence of an anti-oxidant defense mechanism based on iodine efflux.
We demonstrated that ROS production is an important phenomenon in the reproduction of the
sporophyte in S. japonica. Furthermore, ROS were also observed in the zoospore germination
processes. We discuss the physiological and ecological roles of ROS production in sorus
formation and zoospore germination.
Key words: antioxidant; Saccharina; reactive oxygen; sorus; zoospore germination

3
Introduction
The life cycle of kelps involves the alternation of macroscopic sporophyte and microscopic
gametophyte generations. A better understanding of the reproduction mechanism is critical for
the overall knowledge of kelp ecology and for the maintenance of kelp forests, which are key
components of coastal ecosystems in cold and cold-temperate seas other than those off
Antarctica.
There have been many reports on the development of sporangia in Laminaria spp.
examining environmental influences on sporogenesis and reproductive effort (reviewed by
Bartsch et al. 2008). Several physiological changes, including a decrease in photosynthesis, an
increase in respiration (Matsuyama 1983, Aruga et al. 1990, Sakanishi et al. 1991, Nimura and
Mizuta 2001), phlorotannin accumulation (Van Alstyne et al. 1999) and an increase in
RNA/DNA ratio (Nimura and Mizuta 2001), occur in the process of sorus development.
Sporulation inhibitors are thought to be involved in the mechanism of sorus formation
(Buchholz and Lüning 1999, Lüning et al. 2000). Recently, it was reported that sorus formation
in Saccharina japonica (J.E.Areschoug) C.E.Lane, C.Mayes, Druehl et G.W.Saunders (=
Laminaria japopnica Areshoug) was regulated by internal auxin level (Kai et al. 2006). In
contrast, sorus formation is promoted by abscisic acid (Nimura and Mizuta 2002).
Sorus development in Laminaria involves the formation of zoosporangia and paraphyses
originating from the epidermal cells (Abe 1939). These structures are characterized by the
elongation of epidermal cells, which is promoted by cell wall loosening. Furthermore, it has
been suggested that ROS are related to the cell wall strengthening (Fry 1998), and it has been
shown that they play an important role in higher plant growth and development (Foreman et al.
2003, Gapper and Dolan 2006, Carol and Dolan 2006). Among seaweeds, ROS are
physiologically produced in the germination of zygotes of the brown algae Fucus (Coelho et al.
2002, 2008). ROS also control more specialized processes such as plant growth, defence,
hormonal signalling, and development as signalling molecules (Mittler et al. 2004). Hence ROS
play roles in several growth stages of kelps.
Thus, this study was conducted to confirm the occurrence of ROS production in the
reproductive stage of the sporophyte in brown seaweed, Saccharina japonica. In addition, we
discuss the significance of ROS in sorus formation and in the germination of zoospores in this
species.
Materials and methods

4
Preparation of materials Mature sporophytes of Saccharina japonica were collected from a coastal area near Hakodate,
Hokkaido, Japan, and transported to the laboratory. The sporophyte was divided into
vegetative and sorus parts. From the vegetative part, discs (2 cm in diameter) were cut and
cultured in a polyethylene terephthalate bottle (1 l) with Provasoli’s enriched seawater
(Provasoli 1968) without vitamins under aeration for 3−5 months. The culture conditions were
set at 10°C, 60 μmol photons m−2 s−1 (12-h light: 12-h dark cycle). The medium was renewed
every week. The seawater used as a medium was filtered through a glass fibre filter (GA-100,
Toyo Roshi Kaisha, Ltd., Tokyo, Japan) and autoclaved at 121°C for 20 min (ASV-2401,
Tiyoda Manufacturing Co., Ltd., Tokyo, Japan). After disc surfaces began to rise, showing that
the sori had begun to develop, discs were collected as required. Based on the report of Nimura
and Mizuta (2001), they were divided into four stages, Stage I (vegetative stage), Stage II
(early stage of paraphysis elongation), Stage III (zoosporangium formation stage with
paraphysis elongation) and Stage IV (zoospore release stage). These discs were used for the
analytical and histological detection of ROS production.
Other discs (2 cm in diameter) collected from other sorus parts and adjacent non-sorus
blade portions were used directly to measure the activity of ROS-scavenging enzymes,
including ascorbate peroxidase (APX), catalase (CAT), glutathione reductase (GR) and
superoxide dismutase (SOD), as well as the anti-oxidant activity, phenol and iodine content.
A portion of the sorus was cut from the mature sporophyte with a scalpel to obtain
zoospores. These portions were wiped with a paper towel, wrapped in newspaper and stored
overnight at 4°C in a refrigerator. After 24 h, the sorus was then placed in 200 ml of seawater
to release zoospores. The seawater containing zoospores was poured into a polystyrene vessel
(square type, 8.5cm × 17.5cm × 3.5cm) containing a glass slide fragment (ca. 2 × 2cm) on the bottom. To allow zoospores to settle onto the glass slide fragement, the vessel was placed in an
incubator set at 5°C , 60 μmol photons m-2 s-1 on a 12-h light: 12-h dark cycle. After the
zoospores had settled, the seawater was exchanged with Provasoli’s enriched seawater without
vitamins. Some of the glass slides were used the histological detection of ROS in the
germination process.
Analytical and histological detection of ROS production Sporophyte discs (2 cm in diameter) at different stages of sorus formation were incubated in
seawater (2 ml) containing 2’,7’-dichlorofluorescein diacetate (DCFH-DA, Wako chemicals,
Osaka, Japan, final concentration 50 μM) for 1 h. The incubated discs were ground in a mill with

5
liquid N2 and extracted in 1ml of Tris-HCl buffer (40 mM, pH 7.0). After agitation for 5 min and
centrifugation at 10,000×g for 5 min, 500 μl of the supernatant was diluted to 2.5 ml with
Tris-HCl buffer and was used to measure fluorescence at 488 nm (excitation wavelength) and at
525 nm (emission wavelength) with a spectrofluorometer (FB-750, Jasco, Tokyo, Japan). The
production of ROS was calculated with a standard curve for dichlorofluorescein (DCF, Wako
chemicals, Osaka, Japan) and expressed in units of μg DCF per single-side area of disc. Other
discs were also cultured in 2 ml of medium with 10 μM DCFH-DA for 1 h. The media at the
start and the end of culturing were subjected to ROS analysis using a similar
spectrofluorometrical procedure. ROS release was calculated as the amount of DCF produced
during the culture period.
The discs at different stages of sorus formation were also cultured in seawater with 50 μM
DCFH-DA for 15 min. After culturing, the discs were taken out and rinsed with sterilized
seawater to remove the DCFH-DA on the surfaces. The discs and their hand-cut sections were
observed using a fluorescence microscope (AH2, Olympus, Tokyo, Japan) at an excitation of
380–490 nm.
Zoospores, which were attached glass slide segments, were used for ROS histological
detection. The culture for the germination of zoospores was maintained at 10°C, 22.5 μmol
photons m−2 s−1 (12-h light: 12-h dark cycle) for 1–2 days after release. Embryospores
(germinating zoospores) were placed into 1 ml of seawater containing 50 μM DCFH-DA
solution and incubated in the dark for 15 min. Glass slide segments were washed with seawater
lacking DCFH-DA to remove the incubation medium. The glass slide segments with
embryospores attached were placed on another slide glass for observation using a fluorescence
microscope, as described above.
Measurement of anti-oxidant activity and ROS scavenging enzymes Discs were powdered in liquid N2, and the powdered samples were extracted with 50 mM
phosphate buffer (pH 7.0) containing 5% (w/v) polyclar AT for CAT, GR and SOD. For APX,
the extraction was carried out in 50 mM phosphate buffer (pH 7.0) containing 0.5 mM ascorbate,
and 5% (w/v) Polyclar AT.
Anti-oxidant capacity was assayed with 1,1-diphenyl-2-picrylhydrazyl (DPPH, Wako
chemicals, Osaka, Japan) according to the method of Heo et al. (2005). Powdered samples were
prepared in the manner as described earlier and placed in 2 ml of ethanol. The supernatants of
the ethanol extracts (0.1 ml) were mixed with 2.9 ml of DPPH solution (400 μM) and incubated
at room temperature for 30 min in the dark. The absorbance of the mixture was measured at 516
nm with a UV-VIS spectrometer (V-530, JASCO, Tokyo, Japan). ROS-scavenging activity was

6
expressed in units of mM Trolox equivalent (TE) per gram fresh weight.
The activities of CAT, GR and SOD were assayed following Aguilera et al. (2002).
Decreases of 1 μmol H2O2 and NADPH for 1 min were used as units of CAT and GR activities,
respectively. One unit of SOD was defined as the amount of enzyme required to inhibit the rate
of cytochrome c reduction by 50%.
Ascorbate peroxidase activity was assayed following Chen and Asada (1989). Decrease in
absorbance at 290 nm was followed for 1 min after the addition of 50 μl of extract to 950 μl of
50 mM phosphate buffer (pH 7.0) containing 0.1 mM H2O2 and 0.5 mM ascorbate. A decrease of
1 μmol ascorbate for 1 min was used as the unit of ascorbate peroxidase activity.
Total soluble protein (TSP) content was assayed by the Coomassie Blue G method.
Coomassie Blue G staining solution (0.01%, 950 μl) was added to 50 μl of enzyme extract. The
absorbance was recorded at 595 nm. The total soluble content was corrected using serum
albumin solution.
Measurement of phenolic and iodine contents The content of phenolics was determined following the method of Senevirathne et al. (2006).
Discs were powdered in liquid N2, and the fine powder was placed in vials (10 ml) with 1 ml of
95% ethanol, 5 ml of distilled water and 0.5 ml of 50% Folin-Ciocalteu reagent. The resultant
mixture was allowed to react for 5 min, after which 1 ml of 5% Na2CO3 was added, followed by
thorough mixing and storage in darkness for 1 h. Subsequently, the mixture was centrifuged at
ca. 7000×g and the absorbance of the supernatant was recorded at 725 nm by UV-VIS
spectrometry. To calculate phenolic contents, a gallic acid standard curve was used as the
standard, and the content was expressed as gallic acid equivalents (GAE) per gram fresh weight.
Iodine content was determined following the method of Yasui et al. (1980). The disc was
dried in a nickel crucible for 2 h at 110°C. Dry matter was cooled at room temperature. After
the dry weight had been determined, the dry matter was fused completely for 5 h at 450°C in a
muffle furnace. The ash sample was extracted in boiling water and the extract was collected
through a glass fibre filter (Whatman GF/C). The extract was agitated with 0.5 ml of 36 N
sulphate and 5 ml of 3% hydrogen oxide for 10 min in a separating funnel. After 10 ml of
toluene had been added, the separating funnel was agitated again for 2 min. The lower layer
was discarded and the upper toluene layer was added to a test tube with 1g of anhydrous
potassium sulphate. After the dehydration, the absorbance of the toluene layer was measured
at 535 nm. The iodine concentration was measured using a standard curve of potassium
iodide.

7
Statistical analysis Data were expressed as mean + standard deviation. Bartlett's test was used to test the
homogeneity of variance. If homogeneous, the data were analyzed by one-way analysis of
variance (ANOVA) with Dunnett’ multiple comparison test. If the variances were heterogeneous,
comparison was analyzed by the Kruskal-Wallis test followed by Steel’s multiple comparison
test. Significant difference of ROS scavenging activities and antioxidant contents between sorus
and adjacent non-sorus sectors was analyzed by one-tailed paired Student's t test. All calculations
were performed using statistical software (Exel Tokei 2006, SSRI, Tokyo, Japan) . The levels of
significance were set at p< 0.05.
Results
Analytical detection of ROS production ROS production and release at different stages of sorus formation in Saccharina japonica are
shown in Fig. 1A. Discs without sori (Stage I) had low ROS production of 0.13 ± 0.06 (mean ±
SD) μg cm−2 h−1. When the paraphyses started to elongate (Stage II), mean ROS production
increased, but the production was not significantly different from that in Stage I. During
zoosporangium formation with paraphysis elongation (Stage III), highest ROS production (0.45
± 0.23μg cm−2 h−1) was observed; values were five times higher than in Stage I,. Production of
ROS in Stage IV was not significantly different from the level in Stage I.
Release of ROS by discs at different stages of sorus formation is shown in Fig. 1B. ROS
release was significantly higher in Stage II than in Stage I. Release was the highest (0.28 + 0.4μg
cm−2 h−1) in Stage III and 2.6 times higher than in Stage I. In Stage IV, ROS release decreased to
the non-significant level in the undeveloped sorus stage.
Histological detection of ROS production The sorus part of the sporophyte disc had a strong green DCF fluorescence (Fig. 2A, B). The
non-sorus part distant from the sorus, had only a red chlorophyll fluorescence; the transitional
area between sorus and non-sorus sectors was scattered with weak fluorescence. Strong green
DCF fluorescence was observed in the elongating paraphysis (Fig. 2C); the fluorescence was
located in the peripheral regions of the cytoplasm of paraphyses around the cell walls,
particularly in the apical and central parts of the paraphyses. DCF fluorescence also occurred in
zoosporangia (Fig. 2D). However, the mucilage cap, which is located on the tip of the
paraphyses, did not have green fluorescence (Fig. 2E and 2E’).
During germination of attached zoospores, DCF fluorescence was localized in the germ tube
in the early stage of its elongation (Fig. 3A, B). ROS were also located at the opposite end of the
8
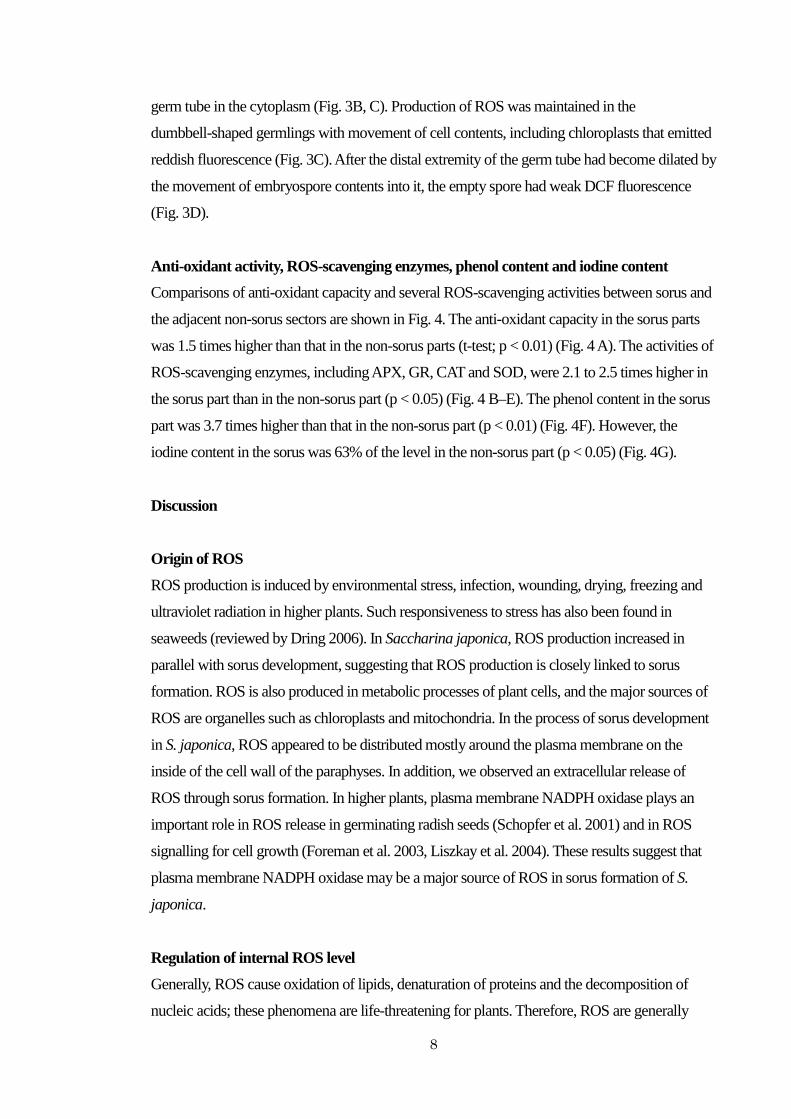
germ tube in the cytoplasm (Fig. 3B, C). Production of ROS was maintained in the
dumbbell-shaped germlings with movement of cell contents, including chloroplasts that emitted
reddish fluorescence (Fig. 3C). After the distal extremity of the germ tube had become dilated by
the movement of embryospore contents into it, the empty spore had weak DCF fluorescence
(Fig. 3D).
Anti-oxidant activity, ROS-scavenging enzymes, phenol content and iodine content Comparisons of anti-oxidant capacity and several ROS-scavenging activities between sorus and
the adjacent non-sorus sectors are shown in Fig. 4. The anti-oxidant capacity in the sorus parts
was 1.5 times higher than that in the non-sorus parts (t-test; p < 0.01) (Fig. 4 A). The activities of
ROS-scavenging enzymes, including APX, GR, CAT and SOD, were 2.1 to 2.5 times higher in
the sorus part than in the non-sorus part (p < 0.05) (Fig. 4 B–E). The phenol content in the sorus
part was 3.7 times higher than that in the non-sorus part (p < 0.01) (Fig. 4F). However, the
iodine content in the sorus was 63% of the level in the non-sorus part (p < 0.05) (Fig. 4G).
Discussion
Origin of ROS
ROS production is induced by environmental stress, infection, wounding, drying, freezing and
ultraviolet radiation in higher plants. Such responsiveness to stress has also been found in
seaweeds (reviewed by Dring 2006). In Saccharina japonica, ROS production increased in
parallel with sorus development, suggesting that ROS production is closely linked to sorus
formation. ROS is also produced in metabolic processes of plant cells, and the major sources of
ROS are organelles such as chloroplasts and mitochondria. In the process of sorus development
in S. japonica, ROS appeared to be distributed mostly around the plasma membrane on the
inside of the cell wall of the paraphyses. In addition, we observed an extracellular release of
ROS through sorus formation. In higher plants, plasma membrane NADPH oxidase plays an
important role in ROS release in germinating radish seeds (Schopfer et al. 2001) and in ROS
signalling for cell growth (Foreman et al. 2003, Liszkay et al. 2004). These results suggest that
plasma membrane NADPH oxidase may be a major source of ROS in sorus formation of S.
japonica.
Regulation of internal ROS level Generally, ROS cause oxidation of lipids, denaturation of proteins and the decomposition of
nucleic acids; these phenomena are life-threatening for plants. Therefore, ROS are generally

9
maintained at a low level in plant cells by ROS-scavenging enzymes and anti-oxidants. During
sorus formation, ROS-scavenging enzymes were more active. High anti-oxidant capacity and
high phenolics content was also observed. Plant phenolics are known to be important groups of
natural anti-oxidants. Electron microscopic observations have revealed that many Golgi vesicles
and physodes appear in paraphyses and zoosporangia of Saccharina angustata (Kjellman)
C.E.Lane, C.Mayes, Druehl et G.W.Saunders (Motomura 1993). Physodes accumulated a
large amounts of phenolic substances, suggesting that the synthesis and accumulation of
phenolics occur actively in the cytoplasm of paraphyses and zoosporangia. Hence, phenolic
anti-oxidants likely play an important role in the regulation of intracellular ROS levels.
Extracellular release of ROS was also observed in the sorus developmental process in
Saccharina japonica. This release probably plays an important role in regulating intracellular
ROS level in conjunction with anti-oxidant substances and ROS-scavenging enzymes. In
addition, iodine, which is stored largely as iodide ion in the apoplast, functions as an inorganic
anti-oxidant (Küpper et al., 2008). Iodine release by macroalgae is thought to occur in response
to oxidative stress (Küpper et al., 2001; 2008). Therefore, iodine probably contributes in
controlling the intracellular ROS levels when it is released. In S. japonica, lower iodine content
in sorus than adjacent non-sorus sectors suggests that low levels of iodine are present because it
is released in the ROS-producing process of sorus formation. However, non-sorus sectors
released 80% of the ROS produced; 44–61% of these were released in Stages III and IV. The
low ratio of ROS released to ROS produced in these stages suggests that a substantial part of the
ROS produced is scavenged by iodine. Therefore, the contribution of iodine to scavenging ROS
is likely to be greater during the sorus-formation process than in the vegetative stage.
Physiological Functions of ROS The function of ROS as important regulators of cell development has been elucidated in higher
plants. For example, ROS play an important role in the loosening of the cell wall in growing
tissues (Fry 1998, Potikha et al. 1999, Liszkay et al. 2004) and in the lignification of xylem cell
walls (Ros Barceló 1998). The loosening of the cell wall by ROS induces cell growth. In the
sporophyte of Saccharina japonica, ROS are also normally produced in the development of the
reproductive organs. In particular, ROS production seems to be active in the elongation of the
paraphyses and zoosporangia. Therefore, we suggest that ROS contribute to loosening of the cell
walls and to the elongation of epidermal cells in sorus formation.
ROS have also been observed in the zoospore germination process . Coelho et al. (2008)
reported the existence of a tip-high ROS gradient in germinating Fucus serratus L. zygotes.
They also observed that suppression of the ROS gradient inhibits polarized zygotic growth.

10
Their observation indicate that embryonic polarization in this species occurs through a ROS
signalling pathway. In Saccharina japonica, ROS were locally produced in embryospores
before germination, and ROS production was remarkable in the germ tubes. Therefore, the ROS
are considered to play an important role in polarization and cell wall loosening in the
germination process of zoospores of S. japonica. In addition, excess ROS production leads to
necrotic cell death and programmed cell death in plant cells (Van Breusegem and Dat 2006).
The accumulation of ROS in empty spores, the contents of which had already moved into the
germ tubes, therefore seemed to be closely linked to the necrotic process of the spores.
Ecological functions of ROS
ROS production in sorus formation is considered to have ecological functions in addition to the
physiological function described above. For example, correlations between the efficiency of
ROS metabolism and stress tolerance have been reported in some brown and red algal species
(Collén and Davison 1999a, b, c, Choo et al. 2004). The correlations are due to ROS functioning
as a signalling substance for biotic and abiotic stresses (Mittler et al. 2004). The function of ROS
in plants is also often discussed in terms of the resistance that occurs in plant-pathogen
interactions. ROS exhibit anti-bacterial and sterilizing activities because of their strong oxidizing
power. This suggests that the release of ROS plays an ecological role by inhibiting the growth of
pathogenic bacteria on the surface of the sorus. Similarly, Küpper et al. (2001, 2002) showed
that in Laminaria digitata (Hudson) J.V. Lamour. the oxidative burst controls growth of
epiphytic and pathogenic bacteria.
Production of ROS in kelp results in the accumulation of chemical components that play a
role in defence responses. Phenolic substances have several functions such as cellular support
materials and the protection of plants against predators (Strack 1997). In Saccharina japonica, a
high production of phenolics occurred during sorus formation. Van Alstyne et al. (1999) also
reported that phlorotannin levels in the reproductive tissues of kelp were higher than in the
vegetative tissues. In addition to the role of phenolics in scavenging ROS, as discussed above,
the accumulation of phenolics can be considered to be an additional function related to the
ecological success of reproduction of this seaweed. Ar Gall et al. (2004) proposed that iodine
levels in kelps may reflect the antecedents of biotic and abiotic stress responses. It has also been
proposed that both the oxidative burst and the concomitant iodine release participate in the early
defence response to pathogenic micro-organisms (Leblanc et al. 2006). Iodine release, which is
determined by lower content in the sorus than in the adjacent vegetative parts in S. japonica, is
likely to contribute to chemical defence against microbial attack.

11
Conclusion ROS were produced in the process of sorus formation in Saccharina japonica. ROS production
is hypothesized to play a significant role in cell elongation in the paraphyses and zoosporangia.
Additionally, several metabolic processes, including ROS release, anti-oxidant production and
active ROS-scavenging activities, are activated to control the internal ROS level. These
phenomena are additionally considered to function as a defence against herbivores and
pathogens in the alternation from the sporophyte to the gametophyte generations. In contrast, the
functional role of ROS in cell elongation is considered to contribute to the formation of the germ
tube in the zoospore. During germination, ROS may be related to the necrosis of the empty
spore after its contents have moved to the germ tube.
Acknowledgement This work was supported in part by a Grant-in-Aid for Scientific Research from the Japan
Society for the promotion of Science (no.22580195).
References
Abe, K. 1939. Mitosen in sporangium von Laminaria japonica Aresh. Sci. Rep. Tohoku Imp.
Univ. Biol. 14: 327-329.
Aguilera, J., K. Bischof, U. Karsten, D. Hanelt and C. Wiencke. 2002. Seasonal variation in
ecophysiological patterns in macroalgae from an Arctic fjord. II. Pigment accumulation and
biochemical defence systems against high light stress. Mar. Biol. 140: 1087-1095.
Ar Gall, E., F. C. Küpper and B. Kloareg. 2004. A survey of iodine content in Laminaria digitata.
Bot. Mar. 47: 30-37.
Aruga, Y., M. Toyoshima and Y. Yokohama. 1990. Comparative photosynthetic studies of
Ecklonia cava bladelets with and without zoosporangial sori. Jpn. J. Phycol. 38: 223-228.
Bartsch, I., C. Wiencke, K. Bischof, C. M. Buchhloz, B. H. Buck, A. Eggert, P. Feuerpfeil, D.
Hanelt, S. Jacobsen, R. Karez, U. Karsten, M. Molis, M. Y. Roleda, H. Schubert, R.
Schumann, K. Valentin, F. Weinberger and J. Wiese. 2008. The genus Laminaria sensu lato:
recent insights and developments. Eur. J. Phycol. 43: 1-86.
Buchholz, C. and K. Lüning. 1999. Isolated, distal blade discs of the brown algae Laminaria
digitata from sorus, but not discs, near to the meristematic transition zone. J. Appl. Phycol. 16:
579-584.
Carol, R. J. and L. Dolan. 2006. The role of reactive oxygen species in cell growth: lessons from
root hairs. J. Exp. Bot. 57: 1829-1834.

12
Chen, G. X. and K. Asada. 1989. Ascorbate peroxidase in tea leaves: occurrence of two
isozymes and the differences in their enzymatic and molecular properties. Plant Cell Physiol.
30: 987-998.
Choo, K., P. Snoeijs and M. Pedersén. 2004. Oxidative stress tolerance in the filamentous green
algae Cladophora glomerata and Enteromorpha ahlneriana. J. Exp. Mar. Biol. Ecol. 298:
111-123.
Coelho, S. M. B., A. R. Taylor, K. P. Ryan, I. Sousa-Pinto, M. T. Brown and C. Brownlee. 2002.
Spatiotemporal patterning of reactive oxygen production and Ca2+ wave propagation in Fucus
rhizoid cells. Plant Cell. 14: 2369-2381.
Coelho, S. M. B., C. Brownlee and J. H. F. Bothwell. 2008. A tip-high, Ca2+-interdependent,
reactive oxygen species gradient is associated with polarized growth in Fucus serratus
zygotes. Planta 227: 1037-1046.
Collén, J. and I. R. Davison. 1999a. Reactive oxygen metabolism in intertidal Fucus spp.
(Phaeophyceae). J. Phycol. 35: 62-69.
Collén, J. and I. R. Davison. 1999b. Reactive oxygen production and damage in intertidal Fucus
spp. (Phaeophyceae). J. Phycol. 35: 54-61.
Collén, J. and I. R. Davison. 1999c. Stress tolerance and reactive oxygen metabolism in the
intertidal red seaweed Mastocarpus stellatus and Chondrus crispus. Plant Cell Environ. 22:
1143-1151.
Dring, M. J. 2006. Stress resistance and disease resistance in seaweeds: The role of reactive
oxygen metabolism. Adv. Bot. Res. 43: 175-207.
Foreman, J., V. Demidchik, J. H. F. Bothwell, P. Mylona, H. Miedema, M. A. Torres, P. Linstead,
S. Costa, C. Brownlee, J. D. G. Jones, J. M. Davies and L. Dolan. 2003. Reactive oxygen
species produced by NADPH oxidase regulate plant cell growth. Nature 422: 442-446.
Fry, S. C. 1998. Oxidative scission of plant cell wall polysaccharides by ascorbate-induced
hydroxyl radicals. Biochem J. 332: 507-515.
Gapper, C. and L. Dolan. 2006. Control of plant development by reactive oxygen species. Plant
Physiol. 141: 341-345.
Heo, S. –J., E. –J. Park, K. –W. Lee and Y. –J. Jeon. 2005. Antioxidant activities of enzymatic
extracts from brown seaweeds. Bioresource Technol. 96: 1613-1623.
Kai., T., K. Nimura, H. Yasui and H. Mizuta. 2006. Regulation of sorus formation by auxin in
Laminaria sporophyte. J. Appl. Phycol. 18: 95-101.
Küpper, F. C., B. Kloareg, J. Guern and P. Potin. 2001. Oligoguluronates elicit an oxidative burst
in the brown algal kelp Laminaria digitata. Plant Physiol. 125: 278-291.
Küpper, F. C., D. G. Müller, A. F. Peters, B. Kloareg and P. Potin. 2002. Oligoalginate

13
recognition and oxidative burst play a key role in natural and induced resistance of
sporophytes of Laminariales. J. Chem. Ecol. 28: 2057-2081.
Küpper, F. C., L. J. Carpenter, G. B. McFiggans, C. J. Palmer, T. J. Waite, E. Boneberg, S.
Woitsch, M. Weiller, R. Abela, D. Grolimund, P. Potin, A. Butler, G. W. Luther III, P. M. H.
Kroneck, W. Meyer-Klauche and M. C. Feiters. 2008. Iodide accumulation provides kelp
with an inorganic antioxidant impacting atmospheric chemistry. Proc. Natl. Acad. Sci. USA
105: 6954-6958.
Leblanc, C., C. Colin, A. Cosse, L. Delage, S. L. Barre, P. Morin, B. Fiévet, C. Voiseux, Y.
Ambroise, E. Verhaeghe, D. Amouroux, O. Donard, E. Tessier and P. Potin. 2006. Iodine
transfers in the coastal marine environment: the key role of brown algae and of their
vanadium-dependent haloperoxidases. Biochimie 88: 1773-1785.
Liszkay, A., E. van der Zalm and P. Schopfer. 2004. Production of reactive oxygen intermediates
(O2·-, H2O2, and ·OH) by maize roots and their role in wall loosening and elongation growth.
Plant Physiol. 136: 3114-3123.
Lüning, K., A. Wagner and C. Buchholz. 2000. Evidence for inhibitors of sporangium formation
in Laminaria digitata (Phaeophyceae) during the season of rapid growth. J. Phycol. 36:
1129-1134.
Matsuyama, K. 1983. Photosynthesis of Undaria pinnatifida Suringar f. distans Miyabe et
Okamura (Phaeophyceae) from Oshoro bay. II. Photosynthetic in several portions of the
thallus. Sci. Rep. Hokkaido Fish. Exp. Stn. 25: 195-200. (in Japanese)
Mittler R., S. Vanderauwera, M. Gollery and F. van Breusegem. 2004. Reactive oxygen gene
network of plants. Trends in Plant Sci. 9: 490-498.
Motomura, T. 1993. Ultrastructural and immunofluorescence studies on zoosporogenesis in
Laminaria angustata. Sci. Pap. Inst. Alg. Res. Hokkaido Univ. 9: 1-32.
Nimura, K. and H. Mizuta. 2001. Differences in photosynthesis and nucleic acid content
between sterile and fertile parts of the sporophyte of Laminaria japonica (Phaeophyceae).
Algae 16: 151-155.
Nimura, K. and H. Mizuta. 2002. Inducible effects of abscisic acid on sporophyte discs from
Laminaria japonica Areshoug (Laminariales, Phaeophyceae). J. Appl. Phycol. 14: 159-163.
Potikha, T. S., C. C. Collins, D. I. Johnson, D. P. Delmer and A. Levine. 1999. The involvement
of hydrogen peroxide in the differentiation of secondary walls in cotton fibers. Plant Physiol.
119: 849-858.
Provasoli, L. 1968. Media and prospects for the cultivation of marine algae. Culture and
collections of algae. Procedings U S -Japan Conference Hakone, September 1968. Japanese
Society of Plant Physiology, Tokyo. pp. 63-75.

14
Ros Barceló, A. 1998. The generation of H2O2 in the xylem of Zinnia elegans is mediated by an
NADPH-oxidase-like enzyme. Planta 207: 207-216.
Sakanishi, Y., Y. Yokohama and Y. Aruga. 1991. Photosynthetic capacity of various parts of the
blade of Laminaria longissima Miyabe (Phaeophyceae). Jpn. J. Phycol. 39: 239-243.
Senevirathne, M., S. –H. Kim, N. Siriwardhana, J. –H. Ha, K.-W. Lee and Y. –Y. Jeon. 2006.
Antioxidant potential of Ecklonia cava on reactive oxygen species scavenging, metal
chelating, reducing power and lipid peroxidation inhibition. Food Sci. Tech. Int. 12: 27-28.
Schopfer, P., C. Plachy and G. Frahry. 2001. Release of reactive oxygen intermediates
(superoxide radicals, hydrogen peroxide, and hydroxyl radicals) and peroxidase in
germinating radish seeds controlled by light, gibberellin, and abscisic acid. Plant Physiol.
125: 1591-1602.
Strack, D. 1997. Phenolic metabolism. In: (P. M. Dey and J. B. Harborne, eds) Plant
biochemistry. Academic Press Ltd., San Diego, USA. pp. 387-416.
Van Alstyne, K. L., J. J. McCarthy III, C. L. Hustead and L. J. Kearns. 1999. Phlorotannin
allocation among tissues of northeastern pacific kelps and rockweeds. J. Phycol. 35: 483-192.
Van Breusegem, F. and J. F. Dat. 2006. Reactive oxygen species in plant cell death. Plant
Physiol. 141: 384-390.
Yasui, A., H. Koizumi, H. and C. Tsutsumi. 1980. Composition of inorganic elements in the
edible algae. Rept. Natl. Food Res. Inst. 37: 163-73 (in Japanese).

15
Figure legends
Figure 1. Saccharina japonica: ROS production (A) and release (B) at different developmental
stages of the sorus .
Stage I: Vegetative stage, Stage II: Early elongation stage of paraphysis, Stage III:
Zoosporangium developmental stage with paraphysis elongation, Stage IV: Zoospore release
stage. Values are means + SD ( for A: n=5; for B: n=6-8). (A) Kruskal-Wallis ANOVA: H=13.6,
p<0.01; * p<0.05, compared with Stage I (Steel's test). (B) ANOVA : F3, 22 = 20.508, p < 0.01; *
p<0.05, compared with Stage I (Dunnett's test).
Figure 2. Saccharina japonica: ROS production in the sorus of a sporophyte disc loaded with
DCFH-DA.
(A) Bright field visual image of a sporophyte disc with vegetative (v) and sorus (s) sectors. (B)
Microscopic fluorescence image of the surface view of a transitional area between non-sorus (v)
and sorus (s) sectors, showing green and red fluorescence due to DCF and chlorophyll,
respectively. (C) Fluorescence image of a section of sorus, showing strong green DCF
fluorescence located in the paraphyses (arrows). (D) Fluorescence image of a section of the
sorus showing DCF fluorescence in zoosporangia (arrows). (E and E’) Bright field (E) and
fluorescence (E’) images of separated paraphyses (p) with mucilage cup (mc). Scale bars: 1 cm
in (A), 100 μm in (B), and 50 μm in (C) - (E).
Figure 3. Saccharina japonica: Bright field (left) and fluorescence (right) images during ROS
production in different germination stages loaded with DCFH-DA.
(A) First stage in germination of zoospores with germ tubes (arrows), showing green and red
fluorescence due to DCF and chlorophyll, respectively. (B) Germ tube elongation stage in the
germination of zoospore, showing DCF fluorescence distributed in the germ tube and in the
cytoplasm of the opposite end of the germ tube. (C) Dumbbell-shaped germlings, showing
movement of cell contents into the apical part and red fluorescence located in germ tube
cytoplasm. (D) Later stage in germination, showing that cell contents have become separated by
a septum (arrowhead), with weak DCF fluorescence in the empty spore (ep). Scale bars: 50 μm.
Figure 4. Saccharina japonica: Comparison between sorus and adjacent non-sorus sectors for
anti-oxidant activity (A), four radical oxygen scavenging enzyme activities (B–E), phenol
content (F) and iodine content (G) .
(B) Ascorbate peroxidase activity (APX); (C) Glutathione reductase activity (GR); (D) Catalase

16
activity (CAT); (E) Superoxide dismutase activity (SOD). Values are means + SD (n = 4).
Asterisks represent significantly different means (**p<0.01; *p<0.05, compared to non-sorus
sector). TE, trolox equivalent; TSP, total soluble protein.

0.00.10.20.30.40.50.60.70.8
Stage I Stage II Stage III Stage IV
Developmental stage of sorus
RO
S pr
oduc
tion(
μgD
CF
cm-2
h-1
)
0.000.050.100.150.200.250.300.35
Stage I Stage II Stage III Stage IVDevelopmental stage of sorus
RO
S re
leas
e (μ
g cm
-2 h
-1)
Figure 1
A
B
*
**
**

B
s
v
A
sv
C Emc
D E’ mc
p
Figure 2

Figure 3
C
D
B
A
ep

050
100150200
250300
Non-Sorus Sorus
SOD
(U m
g-1
TSP
)
012345678
Non-sorus Sorus
Ant
i-oxi
dant
act
ivity
(mM
TE
g-1 F
W)
0
20
40
60
80
100
Non-Sorus Sorus
APX
(U m
g-1 T
SP)
0
2
4
6
8
Non-Sorus Sorus
GR
(U
mg
-1 T
SP)
010203040506070
Non-Sorus Sorus
CA
T (
U m
g-1
TSP
)
0.0
0.2
0.4
0.6
0.8
1.0
Non-sorus Sorus
Iodi
ne c
onte
nt (
% d
w)
Figure 4
G
E
C D
A B
*
*
** **
** **
0
100
200
300
400
500
Non-sorus Sorus
Phe
nol c
onte
nt(μ
g G
AE
g-1
FW
) F **
Related Documents


![-{GO}--[Libros]- Hajime Yasunaga](https://static.cupdf.com/doc/110x72/577dac1f1a28ab223f8d6f6d/-go-libros-hajime-yasunaga.jpg)