Electrochemical arc micro-drilling of Nickel- Titanium SMAs utilizing GRA-based AHP and RSM NITISH KUMAR ( [email protected] ) National Institute of Technology Jamshedpur https://orcid.org/0000-0001-7602-4883 Amaresh Kumar Research Article Keywords: Nickel-Titanium, Shape Memory Alloys (SMAs); drilling, GRA, electrochemical, RSM, AHP Posted Date: June 29th, 2022 DOI: https://doi.org/10.21203/rs.3.rs-1770408/v1 License: This work is licensed under a Creative Commons Attribution 4.0 International License. Read Full License

Welcome message from author
This document is posted to help you gain knowledge. Please leave a comment to let me know what you think about it! Share it to your friends and learn new things together.
Transcript

Electrochemical arc micro-drilling of Nickel-Titanium SMAs utilizing GRA-based AHP and RSMNITISH KUMAR ( [email protected] )
National Institute of Technology Jamshedpur https://orcid.org/0000-0001-7602-4883Amaresh Kumar
Research Article
Keywords: Nickel-Titanium, Shape Memory Alloys (SMAs); drilling, GRA, electrochemical, RSM, AHP
Posted Date: June 29th, 2022
DOI: https://doi.org/10.21203/rs.3.rs-1770408/v1
License: This work is licensed under a Creative Commons Attribution 4.0 International License. Read Full License

Electrochemical arc micro-drilling of Nickel-
Titanium SMAs utilizing GRA-based AHP and RSM
Nitish Kumar1,*, and Amaresh Kumar1
1Department of Production & Industrial Engineering, National Institute of Technology Jamshedpur, Jharkhand-
831014, India
*Corresponding author: [email protected]
ABSTRACT
Electrochemical arc machining (ECAM) is a hybrid technique which is discovered by the further development of
ECDM. As Nickel-Titanium is a hard-to-cut shape memory alloy, therefore ECAM has been utilized. For any
manufacturing industry, the machining characteristics are an essential component of the process for the production
of NiTi-based things, therefore in this study, MRR, TWR, over cut, and delamination have been chosen as
performance parameters whereas voltage, electrolyte concentration (ethanol with ethylene glycol and NaCl), and
tool rotation has been selected as variable parameters. The molybdenum has a low tendency to react chemically,
therefore it was chosen as a tool for drilling NiTi. The optimum drilling condition has been detected as 20 v/v% of
electrolyte concentration, 0 rpm of tool rotation, and 80V of voltage with help of the GRA-based AHP technique,
and further, the GRG was optimized by RSM. The optimum value of the performance parameter has been
observed as 101.19 mg/min, 0.006 mg/min, 0.111, and 1.16 for MRR, TWR, OC, and delamination respectively.
The SEM analysis revealed HAZ, a white layer, melted droplet, number of cavities, craters, and microvoids near
the drilled hole. Furthermore, EDX analysis proved that the work surface can be free of Mo after machining
Nitinol by electrochemical arc machining. Also, the XRD analysis revealed the development of carbides like TiC
in the melting zone of a drilled hole, where that carbide can vanish the shape memory properties in HAZ. As the
electrolyte used is a water-free electrolyte, therefore no formation of oxides was observed.
Keywords: Nickel-Titanium, Shape Memory Alloys (SMAs); drilling, GRA, electrochemical, RSM, AHP
Nomenclatures:
DH, d: Diameter of hole
DT: Diameter of tool
D: Maximum diameter
MRR: Material removal rate
SV: Servo voltage
WLT: White layer thickness
WL: White layer
SI: Surface integrity
NiTi: Nickel-titanium
MS: Machined surface
DE: Discharge energy
TWR: Tool wear rate
NCM: NCM
SMAs: Shape memory alloys
TW: Tool wear
SME: Shape memory effect
MS: Machined surface
RSM: Response surface methodology
AHP: Analytic hierarchy process
GRA: Grey relational analysis
TR: Tool rotation
DoE: Design of experiments
GRC: Grey relational coefficient

1 Introduction
The NiTi SMAs or Nitinol became popular because of their many applications in various fields like
telecommunication, automotive industries, medical and aerospace, etc. [1] including civil industry [2]. The NiTi
SMAs have broad application in electromechanical system (MEMS) devices [3], a thermomechanical system for
actuators and sensors [4], stent delivery [5], neurology implants [6,7], self-expandable stents [8], orthopedics and
cardiology [9], drug delivery systems and implantable devices [10], and eyeglass frames [11] including
compatibility for MRI [12]. The NiTi has unique properties like corrosion resistance [13] and shape memory
effect including high ductility and strong adhesion property [14] which provide difficulty for conventional
machining. Furthermore, the NiTi SMAs have poor thermal conductivity leading to the concentration of heat on
the tooltip exhibiting higher toughness, providing higher TW and extreme strain hardening promotes difficulty in
conventional machining [15] and [16]. Therefore, unconventional machining processes are preferable for the
machining of SMAs [17].
The drilling of micro-holes in NiTi alloy can be done by EDM, ECM, and ECAM. The drilling of a 5
mm blind square hole in NiTi alloy has been done with the help of the EDM process with a copper tool. The
variable parameters were considered as gap current, POFF, gap current, and the electrical conductivity of the
workpiece and PON. The author found that the MRR was inversely proportional to gap voltage i.e. higher MRR
was achieved at lower gap voltage. Also, the TWR increased with an increase in gap current [18]. Abidi et al. also
performed drilling of micro-holes in NiTi SMA by micro-electrical discharge machining. The various parameters
were voltage, capacitance, and tool electrode material whereas the performance parameters were TWR, overcut,
circularity, MRR, taper angle, and SR. It has been concluded that the quality of micro-holes was good at lower
voltage whereas the overcut was mostly affected by the material of the electrode [19]. Also, the performance
parameters like SR, taper angle, and overcut were strongly affected by the electrode material followed by voltage
during drilling of NiTi alloy by micro-electrical discharge machining [20]. Furthermore, the drilling of NiTi SMA
by micro-EDM described the migration of tool electrodes to the MS including the development of NiTiO3 and
TiO3 which might act as protecting layers for NiTi. A stable oxide layer has also been generated on the MS which
may well provide the utilization of conventional TiO2 coating for biomedical implants [21].
The previous works of literature mainly deal the machining like cutting, grooving, etc. by NCM process
including drilling by EDM process. In EDM, the metallurgical damage to the MS due to the drawbacks of using a
liquid dielectric medium for sparking provided a lesser surface quality finish while maintaining a reasonable
machining rate. Furthermore, in ECM, several limitations like cavitation, spark damage, and electrolyte boiling
has been reported. The MRR can be as much as five and forty times greater than respectively EDM and ECM
when thermal electrical discharges in the machining gap aid the ECM process and this process has been termed
electrochemical arc machining (ECAM) [22]. Furthermore, the supervision of radial overcut and delamination are
tiring assignments in ECM [23]. A hybrid NCM process like ECAM can be utilized for machining NiTi SMAs
because more work should be done on the ECAM.
The micro-holes have been drilled on electrically conductive material by utilizing ECAM or SAEM
(Sparc-assisted electrochemical machining). Using the SAEM process, drilling and electrochemically finishing a
micro-hole can be done with the same machining equipment with the same parameters [24,25]. For
electrochemical micromachining of NiTi alloy, 20 vol. % of ethanol electrolyte solutions are preferable. The
electrolyte solution of 40 g/L has been prepared by mixing Ethanol with Ethylene glycol at different
concentrations with the further addition of NaCl to improve surface quality. Ethanol is capable of dissolving TiCl4
into the workpiece and can diminish the development of oxide films [26].
For the current research work, electrochemical arc machining (ECAM) has been utilized to drill micro
blind holes on Ni55.7Ti SMA because no study has been published exploring the machinability of NiTi SMAs by

ECAM to the author’s knowledge. The process parameters such as tool rotation, voltage, and electrolyte
concentration including performance parameters such as MRR, OC, delamination, and SR have been considered
for drilling micro blind holes after reviewing past works of literature. Multiple objective optimization techniques,
GRA-based AHP, and further, the GRG optimized by RSM have been implemented in the current study. That
technique was employed to attain the optimum settings for supporting the applications of NiTi SMAs. Most of the
studies have distributed equal weight to the variable parameters during optimization but few studies based on
conventional machining like turning of Ti6Al4V alloy [27] utilized different weights according to the relative
importance of variables. As, the AHP technique promised improved outcomes compared to equal weights,
therefore, in this non-conventional machining study, GRA-based AHP and RSM provided truthful tactics to
enhance the performance parameters.
2 Research motivation
The center of attention of the current research is multiple responses for optimization of the performance
parameters during drilling of Ni55.7Ti SMA. The performance parameters were enhanced by utilizing RSM
together with GRA-based AHP. The utilized AHP showed the capability of productivity enhancement
(maximizing MRR and minimizing TWR, OC, and delamination). The input parameters (electrolyte
concentration, voltage, and tool rotation on TW) affect the productivity level of the drilled hole, therefore, the
insertion of MRR in the factorial analysis is essential to integrate the productivity level. Otherwise, the necessity
for the enhancement in productivity of drilled holes can not be noticed due to the outcome of varying MRR with
the varying input parameters.
3 Electrochemical arc machining (ECAM)
An upgraded hybrid non-conventional machining process has been discovered by the further development of
ECDM. ECDM is developed by combining ECM and EDM. In the ECM process, the workpiece acts as an anode
and the tool electrode acts as a cathode and also an electrolyte has been used as a conductive medium to prepare
electrolyte cells together with the tool electrode and workpiece. In the EDM process, the material is removed
utilizing electrical sparks (discharges) when a rapidly recurring current is utilized between the workpiece and tool
electrode which are separated by dielectric fluid. In ECDM, both cathode and anode, where the tool electrode has
been connected to the cathode and inert material used as an anode, have been immersed into an electrolyte to
develop an electrolyte cell-like ECM.
The connections of cathode and anode differentiate ECDM and ECAM processes. The anode acts as a non-
machining electrode in ECDM and if this anode is removed for further connection with the workpiece, then
machining of electrically conductive materials is achievable and its terms as ECAM process. The discharges
developed between electrolytes and tools in ECDM but in ECAM discharges developed between workpiece and
tool. ECAM is an amendment of EDM because the electrolyte is used instead of a dielectric medium. As it has
been known that EDM is used to machine micro holes, but there are limited works of literature where machining
of micro-holes has been done on electrically conductive materials by using ECAM. ECAM can be employed by
constant or pulse voltage. The machining of metallic materials like hole drilling, wire cutting, turning, and
smoothing surfaces can be done by ECAM [28].

Fig. 1 Experimental setup of micro-drilling with ECAM
In the ECAM process, the electrolyte has been filled between the workpiece (anode) and tool electrode to
form an electrolyte cell where the workpiece (anode) has been almost covered with electrolyte and is separated
from the tool electrode as shown in Fig.1. Electrolysis has been occurred after applying a voltage across the
electrolyte cell and due to this, hydrogen gas is produced across the cathode, and oxygen gas is formed across the
anode. More gas is formed due to an increase in voltage. It has been known that the shape of the tool electrode is
smaller than the workpiece; therefore, gas covers the tool electrode at a faster rate than the workpiece. Due to the
development of the gas layer, resistance has been developed between the boundary of the electrolyte and the tool
electrode. After covering the tool electrode with gas with adequate voltage, gas has been ionized because of the
Townsend mechanism [29] and by this, an ohmnic region developed which represents ohmnic behavior limited to
a voltage (Ulim). When more Ulim has been applied, the limiting current region developed according to the
development of united gas bubbles on the electrode surfaces and this limiting current region ends after reaching
the critical voltage (Ucrit). If the applied voltage increases to Ucrit, a transition region has been formed with
compact gas films around the electrode. It has been stated that electrochemical discharge takes place only if the
potential drop across the gas layer is higher than a critical value. Therefore, by increasing the applied voltage
higher than Ucrit, an arc region has been developed where the spark takes place.
The setup of ECDM has been developed in the Department of Production & Industrial Engineering, National
Institute of Technology, Jamshedpur by the research scholar Dr. Pravin Pawar under the guidance of Prof.
Amaresh Kumar. This setup of ECDM has been modified to ECAM.
4 Experiment details
A rectangular Ni55.7Ti SMA workpiece of 150mm×120mm×1.5mm was considered for machining by
ECAM. The mechanical properties and chemical compositions of the same material have been described in Table
1 and Table 2 respectively. The three levels of parameters (electrolyte concentration, tool rotation, and voltage)
were chosen based on previous studies and the same is presented in Table 3.
Table 1. The chemical compositions of Ni55.7Ti SMA
Element Ti Ni Co Cu Cr Fe Nb C H O N

Wt.% Remainder 55.7 0.005 0.005 0.003 0.015 0.005 0.04 <0.001 0.036 0.001
Table 2. The mechanical properties of Ni55.7Ti SMA
Tensile Strength (MPa) Yield Strength (MPa) Elongation (%) Bend Test (α>130) 645 190 18 qualified
Table 3: The machining variables with levels
Factors Levels Values
Electrolyte concentration (v/v %) 3 0, 10, 20
Tool rotation (rpm) 3 0, 50, 100
Voltage (V) 3 60, 70, 80
4.1 Machining process
This work consists of four performance parameters overcut, TWR, delamination factor, and MRR of the
workpiece material. A molybdenum tool electrode of 3mm diameter has been utilized as a cathode. The anodic
workpiece and the tip of the tool electrode have been maintained at a small distance and this distance is filled by
the ethylene glycol electrolyte solution where a thin layer of electrolyte slightly covered the surface of the
workpiece. The ethylene glycol has been mixed with NaCl to prepare a 1M solution and the same has been
considered as zero concentration of electrolyte. The electrolyte concentration of 10 v/v % and 20 v/v % has been
prepared by further addition of ethanol in that 1 M solution.
The MRR has been calculated by using the following equation:
MRR �mgmin� =Weight of workpiece before machining−Weight of workpiece after machiningMachining time (1)
The TWR has been calculated by using the following equation:
TWR �mgmin� =Weight of tool before machining−Weight of tool after machiningMachining time (2)
The subtraction of the diameter of a tool with the diameter of drilled micro-hole provided the Overcut
(OC) of the drilled micro-hole as given in Eqs (3).
OC = DH-DT (3)
An essential parameter like delamination factor (Fd) is needed to scrutinize the condition of the drilled
hole and that can be evaluated as follows [30]:
Fd =D𝑑𝑑 (4)
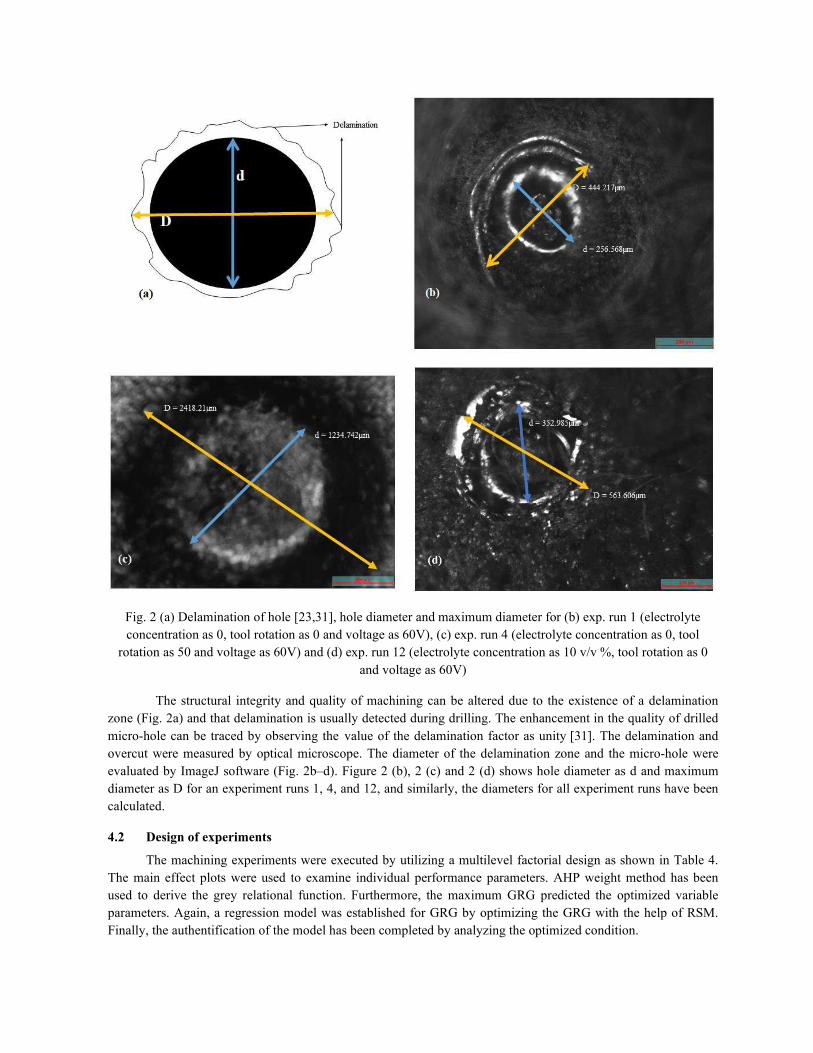
Fig. 2 (a) Delamination of hole [23,31], hole diameter and maximum diameter for (b) exp. run 1 (electrolyte
concentration as 0, tool rotation as 0 and voltage as 60V), (c) exp. run 4 (electrolyte concentration as 0, tool
rotation as 50 and voltage as 60V) and (d) exp. run 12 (electrolyte concentration as 10 v/v %, tool rotation as 0
and voltage as 60V)
The structural integrity and quality of machining can be altered due to the existence of a delamination
zone (Fig. 2a) and that delamination is usually detected during drilling. The enhancement in the quality of drilled
micro-hole can be traced by observing the value of the delamination factor as unity [31]. The delamination and
overcut were measured by optical microscope. The diameter of the delamination zone and the micro-hole were
evaluated by ImageJ software (Fig. 2b–d). Figure 2 (b), 2 (c) and 2 (d) shows hole diameter as d and maximum
diameter as D for an experiment runs 1, 4, and 12, and similarly, the diameters for all experiment runs have been
calculated.
4.2 Design of experiments
The machining experiments were executed by utilizing a multilevel factorial design as shown in Table 4.
The main effect plots were used to examine individual performance parameters. AHP weight method has been
used to derive the grey relational function. Furthermore, the maximum GRG predicted the optimized variable
parameters. Again, a regression model was established for GRG by optimizing the GRG with the help of RSM.
Finally, the authentification of the model has been completed by analyzing the optimized condition.

Table 4: DoE using multilevel factorial design
Run
Electrolyte
concentration
(v/v%)
Tool
rotation
(rpm)
Voltage
(V)
MRR
(mg/min)
Tool wear rate
(mg/min) OC Delamination
1 0 0 60 30.15 0.1 0.0855 1.731
2 0 0 70 50 0.03 0.498 1.442
3 0 0 80 70.24 0.12 0.658 1.285
4 0 50 60 40.33 0 0.411 1.958
5 0 50 70 60 0.25 0.371 1.509
6 0 50 80 80.46 0 0.436 1.165
7 0 100 60 41 0.1133 0.446 1.651
8 0 100 70 61.86 0.1233 0.429 1.163
9 0 100 80 85.33 0.24 0.474 1.272
10 10 0 60 40.01 0.00136 0.146 1.743
11 10 0 70 60.35 0.003 0.499 1.191
12 10 0 80 80.87 0.0067 0.117 1.596
13 10 50 60 52.62 0.105 0.54 1.646
14 10 50 70 73 0.467 0.61 1.309
15 10 50 80 95.38 0.536 0.418 1.344
16 10 100 60 50.5 0.1333 0.418 1.346
17 10 100 70 61.33 0.3 0.511 1.188
18 10 100 80 71.33 0.5 0.529 1.416
19 20 0 60 60 0 0.618 1.234
20 20 0 70 81.96 0.0025 0.35 1.627
21 20 0 80 101.19 0.006 0.111 1.16
22 20 50 60 71.41 0.0133 0.644 1.195
23 20 50 70 91 0.014 0.566 1.266
24 20 50 80 99.47 0.01533 0.409 1.821
25 20 100 60 51.61 0.36 0.547 1.299
26 20 100 70 79.23 0.57 0.598 1.272
27 20 100 80 93.33 0.933 0.455 1.187
4.3 Experimental data analysis
The effect of micro-drilling conditions (electrolyte concentration, tool rotation, and voltage) on the
performance parameters (OC, TWR, delamination, and MRR) was analyzed by the obtained data of response
parameters. The main effect plot revealed the tendency of each performance parameter in Fig. 3 (a–d), where it
can be spotted that MRR increases with the rise in voltage and electrolyte concentration whereas MRR first
increases and then decreases in the case of tool rotation. The enhancement in MRR with voltage is due to an
increase in arc generation. Similar behavior of voltage on MRR was reported by Magabe et al. [32] during

WEDM of Ni55.8Ti and by Antil et al. [31] during ECDM of hybrid polymer matrix composites. Furthermore, the
TWR and OC were increased with the increase of tool rotation but delamination decreased. Again, the growth of
voltage provided enhancement in TWR whereas OC first increased and then decreased. The overcut surged with a
surge in the concentration of electrolytic but at the intermediate level, decrement in over cut spotted [31].
Therefore, from figure 3, it can be concluded that higher MRR can be achieved by applying higher electrolyte
concentration and higher voltage. Furthermore, lower TWR can be achieved by applying lower voltage and tool
rotation whereas lower OC and delamination can be achieved by applying lower tool rotation and higher tool
rotation respectively.
Fig. 3 Main effect plots of performance parameters (a) MRR, (b) TWR, (c) OC, and (d) Delamination
The top response for MRR was attained at higher voltage including at higher electrolyte concentration
whereas, for TWR and delamination, the best responses were attained at higher electrolyte concentration, lower
tool rotation, and lower voltage. Furthermore, the best value of OC was attained at a lower value of all input
parameters. The higher voltage provided higher MRR, TWR, and OC. The highest and lowest responses for all the
experimental runs are shown in Table 5. It has been clear that decision-making utilizing multi-objective
optimization is required for these responses because the best responses have been constructed by dissimilar
settings.
Table 5 The highest and lowest responses attained from micro-drilling settings
Responses
Micro-drilling settings and their levels
Attained
value
Electrolyte
concentration
(v/v%)
Tool
rotation
(rpm)
Voltage
(V)

MRR (mg/min) Highest 101.19 20 0 80
Lowest 30.15 0 0 60
Tool wear rate
(mg/min)
Highest 0 20 0 60
Lowest 0.933 20 100 80
OC Highest 0.0855 0 0 60
Lowest 0.658 0 0 80
Delamination Highest 1.16 20 0 60
Lowest 1.958 0 50 60
4.4 GRA for multi-objective optimization
It is very difficult to get an enhancement of a specific response without allaying the other in NCM. This
research intends to set up the optimal variables corresponding to GRA. The normalization of each response of
performance parameters of all experimental runs has been completed by using Eqs. (5) and (6), respectively
within the 0-1 range and also, the same equations provided the higher, the better, and smaller the better feature
[33]. The methodology of multi-objective optimization for the performance parameters during drilling of NiTi
alloy has been similar to the earlier research [27,34]. The optimization of performance parameters utilizing GRA
together with AHP based on multilevel factorial design converts a multiple response challenge into a single
function [35]. The several procedures required for the accomplishment of GRA are stated as follows:
4.4.1 Data preprocessing
The first step of GRA is Normalization which is done by transforming each response of performance
parameters of all experimental runs to a common scale (0–1). The specific objective like minimization of TWR,
overcut, delamination, and maximization of MRR was maintained for the normalization of responses. Hence, the
output value of all tests for four performance parameters (TWR, MRR, overcut, and delamination) were
normalized for the target value revealed in Table 6. The values for TWR, overcut, and delamination are evaluated
as “smaller the better” using Eq. 5, but for MRR, the motive was “larger the better” and the arrangement is
normalized using Eq. 6 and which is revealed in Table 6.
For the larger-the-better feature 𝑥𝑥𝑡𝑡∗(𝑘𝑘) = 𝑥𝑥𝑡𝑡0(𝑘𝑘)−𝑚𝑚𝑚𝑚𝑛𝑛.𝑥𝑥𝑡𝑡0(𝑘𝑘)𝑚𝑚𝑚𝑚𝑥𝑥.𝑥𝑥𝑡𝑡0(𝑘𝑘)−𝑚𝑚𝑚𝑚𝑛𝑛.𝑥𝑥𝑡𝑡0(𝑘𝑘)
(5)
Where 𝑥𝑥𝑡𝑡°(𝑘𝑘) is the existing pattern, 𝑥𝑥𝑡𝑡∗(𝑘𝑘) the pattern after the data pre-processing, 𝑚𝑚𝑚𝑚𝑥𝑥 𝑥𝑥𝑡𝑡°(𝑘𝑘) the biggest value
of 𝑥𝑥𝑡𝑡°(𝑘𝑘) and 𝑚𝑚𝑚𝑚𝑚𝑚 𝑥𝑥𝑡𝑡°(𝑘𝑘) imply the lowest value of 𝑥𝑥𝑡𝑡°(𝑘𝑘) .
For lower the better feature 𝑥𝑥𝑡𝑡∗(𝑘𝑘) = 𝑚𝑚𝑚𝑚𝑥𝑥 𝑥𝑥0(𝑘𝑘)−𝑥𝑥0(𝑘𝑘)𝑚𝑚𝑚𝑚𝑥𝑥 𝑥𝑥𝑡𝑡0(𝑘𝑘)−𝑚𝑚𝑚𝑚𝑛𝑛 𝑥𝑥𝑡𝑡0(𝑘𝑘)
(6)
Table 6 Normalizing sequence and deviation sequence
Normalizing the sequence of data preprocessing Deviation sequence

MRR TWR OC Delamination MRR TWR OC Delamination
0 0.8928189 1 0.2844612 1 0.1071811 0 0.7155388
0.27942 0.9678457 0.279476 0.6466165 0.72058 0.0321543 0.720524 0.3533835
0.56433 0.8713826 0 0.8433584 0.43567 0.1286174 1 0.1566416
0.1432995 1 0.431441 0 0.8567005 0 0.568559 1
0.4201858 0.7320472 0.50131 0.5626566 0.5798142 0.2679528 0.49869 0.4373434
0.7081926 1 0.3877729 0.9937343 0.2918074 0 0.6122271 0.0062657
0.1527309 0.8785638 0.3703057 0.3847118 0.8472691 0.1214362 0.6296943 0.6152882
0.4463682 0.8678457 0.4 0.9962406 0.5536318 0.1321543 0.6 0.0037594
0.7767455 0.7427653 0.3213974 0.8596491 0.2232545 0.2572347 0.6786026 0.1403509
0.138795 0.9985423 0.8943231 0.2694236 0.861205 0.0014577 0.1056769 0.7305764
0.4251126 0.9967846 0.2777293 0.9611529 0.5748874 0.0032154 0.7222707 0.0388471
0.713964 0.9928189 0.9449782 0.4536341 0.286036 0.0071811 0.0550218 0.5463659
0.3163007 0.8874598 0.2061135 0.3909774 0.6836993 0.1125402 0.7938865 0.6090226
0.6031813 0.4994641 0.0838428 0.8132832 0.3968187 0.5005359 0.9161572 0.1867168
0.9182151 0.4255091 0.419214 0.7694236 0.0817849 0.5744909 0.580786 0.2305764
0.2864583 0.8571275 0.419214 0.7669173 0.7135417 0.1428725 0.580786 0.2330827
0.4389077 0.6784566 0.2567686 0.9649123 0.5610923 0.3215434 0.7432314 0.0350877
0.5796734 0.4640943 0.2253275 0.679198 0.4203266 0.5359057 0.7746725 0.320802
0.4201858 1 0.069869 0.9072682 0.5798142 0 0.930131 0.0927318
0.7293074 0.9973205 0.5379913 0.414787 0.2706926 0.0026795 0.4620087 0.585213
1 0.9935691 0.9554585 1 0 0.0064309 0.0445415 0
0.5807995 0.9857449 0.0244541 0.9561404 0.4192005 0.0142551 0.9755459 0.0438596
0.8565597 0.9849946 0.1606987 0.8671679 0.1434403 0.0150054 0.8393013 0.1328321
0.9757883 0.9835691 0.4349345 0.1716792 0.0242117 0.0164309 0.5650655 0.8283208
0.3020833 0.6141479 0.1938865 0.8258145 0.6979167 0.3858521 0.8061135 0.1741855
0.6908784 0.3890675 0.1048035 0.8596491 0.3091216 0.6109325 0.8951965 0.1403509
0.8893581 0 0.3545852 0.9661654 0.1106419 1 0.6454148 0.0338346
4.4.2 Computation of GRC
The calculation of GRC has been completed by utilizing the normalized values with the help of Eq. 7.
The ideal value of the response is related to the experimental values by GRC.
Following pre-processing of the data, the correlation between the ideal and real normalized test results is
determined to be denoted by a GRC or €𝑡𝑡(𝑘𝑘).
The GRC can therefore be denoted as,
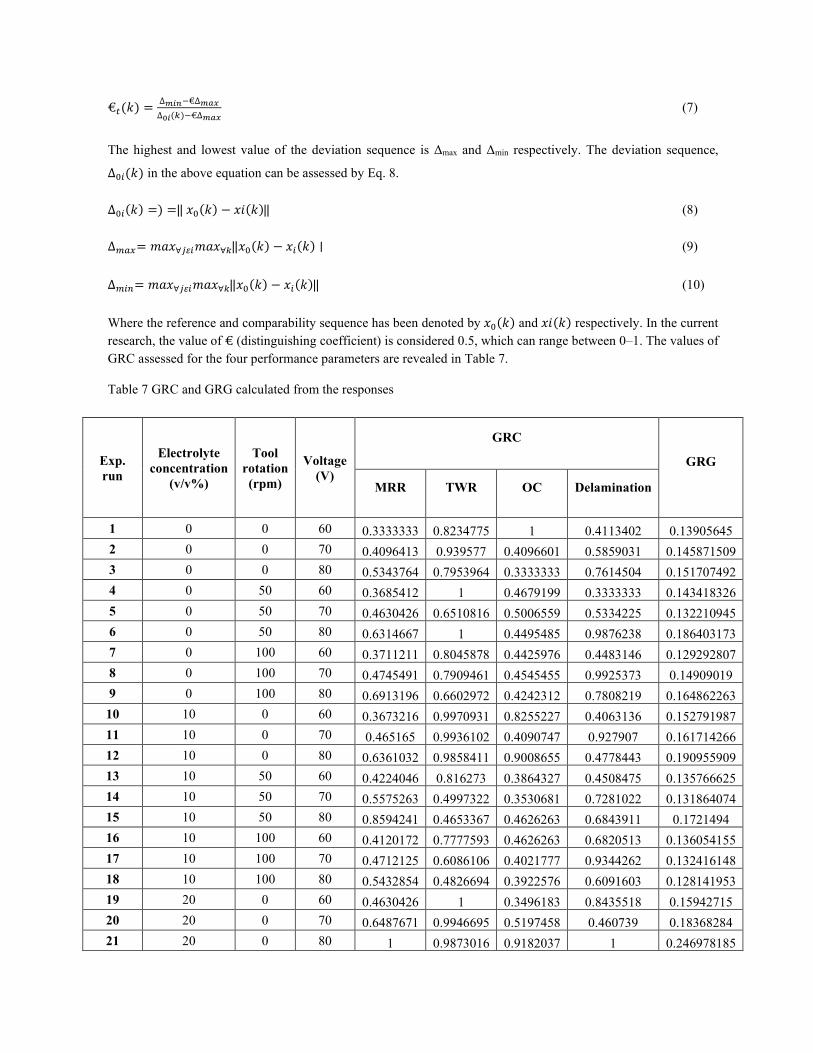
€𝑡𝑡(𝑘𝑘) =∆𝑚𝑚𝑚𝑚𝑚𝑚−€∆𝑚𝑚𝑚𝑚𝑚𝑚∆0𝑚𝑚(𝑘𝑘)−€∆𝑚𝑚𝑚𝑚𝑚𝑚 (7)
The highest and lowest value of the deviation sequence is Δmax and Δmin respectively. The deviation sequence, ∆0𝑚𝑚(𝑘𝑘) in the above equation can be assessed by Eq. 8. ∆0𝑚𝑚(𝑘𝑘) =) = ⃦ 𝑥𝑥0(𝑘𝑘) − 𝑥𝑥𝑚𝑚(𝑘𝑘) ⃦ (8) ∆𝑚𝑚𝑚𝑚𝑥𝑥= 𝑚𝑚𝑚𝑚𝑥𝑥∀𝑗𝑗𝑗𝑗𝑚𝑚𝑚𝑚𝑚𝑚𝑥𝑥∀𝑘𝑘 ⃦𝑥𝑥0(𝑘𝑘) − 𝑥𝑥𝑚𝑚(𝑘𝑘) ∣ (9)
∆𝑚𝑚𝑚𝑚𝑛𝑛= 𝑚𝑚𝑚𝑚𝑥𝑥∀𝑗𝑗𝑗𝑗𝑚𝑚𝑚𝑚𝑚𝑚𝑥𝑥∀𝑘𝑘 ⃦𝑥𝑥0(𝑘𝑘) − 𝑥𝑥𝑚𝑚(𝑘𝑘) ⃦ (10)
Where the reference and comparability sequence has been denoted by 𝑥𝑥0(𝑘𝑘) and 𝑥𝑥𝑚𝑚(𝑘𝑘) respectively. In the current
research, the value of € (distinguishing coefficient) is considered 0.5, which can range between 0–1. The values of
GRC assessed for the four performance parameters are revealed in Table 7.
Table 7 GRC and GRG calculated from the responses
Exp.
run
Electrolyte
concentration
(v/v%)
Tool
rotation
(rpm)
Voltage
(V)
GRC
GRG
MRR TWR OC Delamination
1 0 0 60 0.3333333 0.8234775 1 0.4113402 0.13905645
2 0 0 70 0.4096413 0.939577 0.4096601 0.5859031 0.145871509
3 0 0 80 0.5343764 0.7953964 0.3333333 0.7614504 0.151707492
4 0 50 60 0.3685412 1 0.4679199 0.3333333 0.143418326
5 0 50 70 0.4630426 0.6510816 0.5006559 0.5334225 0.132210945
6 0 50 80 0.6314667 1 0.4495485 0.9876238 0.186403173
7 0 100 60 0.3711211 0.8045878 0.4425976 0.4483146 0.129292807
8 0 100 70 0.4745491 0.7909461 0.4545455 0.9925373 0.14909019
9 0 100 80 0.6913196 0.6602972 0.4242312 0.7808219 0.164862263
10 10 0 60 0.3673216 0.9970931 0.8255227 0.4063136 0.152791987
11 10 0 70 0.465165 0.9936102 0.4090747 0.927907 0.161714266
12 10 0 80 0.6361032 0.9858411 0.9008655 0.4778443 0.190955909
13 10 50 60 0.4224046 0.816273 0.3864327 0.4508475 0.135766625
14 10 50 70 0.5575263 0.4997322 0.3530681 0.7281022 0.131864074
15 10 50 80 0.8594241 0.4653367 0.4626263 0.6843911 0.1721494
16 10 100 60 0.4120172 0.7777593 0.4626263 0.6820513 0.136054155
17 10 100 70 0.4712125 0.6086106 0.4021777 0.9344262 0.132416148
18 10 100 80 0.5432854 0.4826694 0.3922576 0.6091603 0.128141953
19 20 0 60 0.4630426 1 0.3496183 0.8435518 0.15942715
20 20 0 70 0.6487671 0.9946695 0.5197458 0.460739 0.18368284
21 20 0 80 1 0.9873016 0.9182037 1 0.246978185

22 20 50 60 0.543951 0.9722801 0.3388577 0.9193548 0.168844908
23 20 50 70 0.7770729 0.9708637 0.373329 0.790099 0.199511294
24 20 50 80 0.9538131 0.9681838 0.4694547 0.3764151 0.220548357
25 20 100 60 0.4173913 0.5644283 0.3828151 0.7416357 0.118884262
26 20 100 70 0.6179541 0.4500724 0.3583725 0.7808219 0.136923922
27 20 100 80 0.8188105 0.3333333 0.4365231 0.9366197 0.158778283
4.4.3 Calculation of GRG
The assigned weight value of each response has been utilized during the conversion of the multiple GRC
into a combined factor by GRG. The weighted GRG was evaluated by Eq. 11. Furthermore, the weight
assignment for four responses was developed by the AHP method.
(𝛾𝛾𝑚𝑚) = ∑ 𝜔𝜔𝑘𝑘𝑛𝑛𝑘𝑘=1 €𝑡𝑡(𝑘𝑘) (11) ∑ 𝜔𝜔𝑘𝑘𝑛𝑛𝑘𝑘=1 = 1 (12)
4.5 Weight factors using the AHP
The several steps required for assigning the weights to the responses by AHP are represented below.
a) The weight of each response is evaluated by the decision-maker utilizing the AHP method. The
establishment of a pairwise matrix (Am×m) [27] with m attributes is completed in the first step as revealed
in Eq. 13, where the comparative rank of each attribute concerning the target is established by using
Saaty’s 9-point scale (Table 8). According to the relative importance, the respective standing of each
attribute relevant to the goal is determined and then arranged in the pairwise matrix as revealed in Table
9. During the determination of the respective standing, the values of attributes in the row are compared
with the values of attributes in the column. If an attribute is compared with the other, then a reciprocal
value of the corresponding attribute is allotted (A12 = 1/A21) and if compared with itself (Aij = 1 for i=j),
then a value of 1 is allotted.
Table 8 Nine-point Saaty’s scale
Scale Definition Explanation
1 Equally important Indifferent
3 Weakly important Slightly better
5 Strongly important Better
7 Very strongly important Much better
9 Extremely important Much better
2,4,6,8 Intermediate value When compromise needed
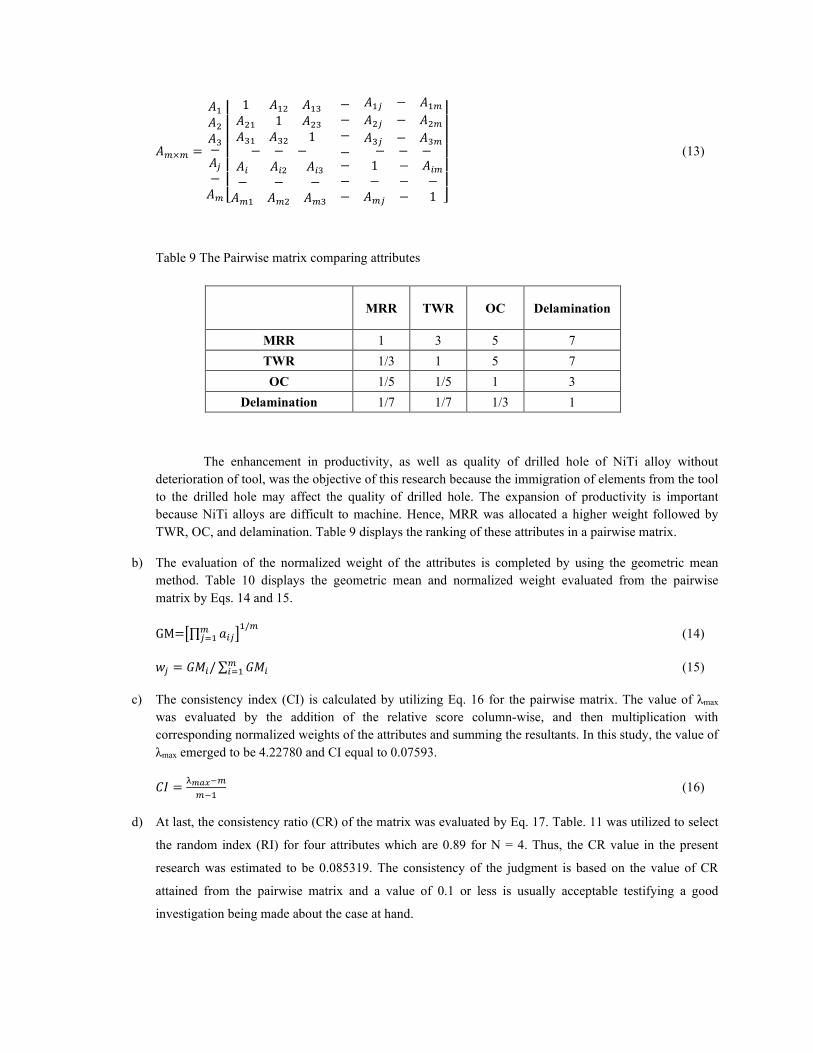
𝐴𝐴𝑚𝑚×𝑚𝑚 =
𝐴𝐴1𝐴𝐴2𝐴𝐴3−𝐴𝐴𝑗𝑗−𝐴𝐴𝑚𝑚 ⎣⎢⎢⎢⎢⎢⎢ 1 𝐴𝐴12 𝐴𝐴13𝐴𝐴21 1 𝐴𝐴23𝐴𝐴31 𝐴𝐴32 1
−−− 𝐴𝐴1𝑗𝑗 − 𝐴𝐴1𝑚𝑚𝐴𝐴2𝑗𝑗 − 𝐴𝐴2𝑚𝑚𝐴𝐴3𝑗𝑗 − 𝐴𝐴3𝑚𝑚− − − − − − −𝐴𝐴𝑚𝑚 𝐴𝐴𝑚𝑚2 𝐴𝐴𝑚𝑚3− − −𝐴𝐴𝑚𝑚1 𝐴𝐴𝑚𝑚2 𝐴𝐴𝑚𝑚3 −−− 1 − 𝐴𝐴𝑚𝑚𝑚𝑚− − −𝐴𝐴𝑚𝑚𝑗𝑗 − 1 ⎦⎥⎥⎥⎥⎥⎥ (13)
Table 9 The Pairwise matrix comparing attributes
MRR TWR OC Delamination
MRR 1 3 5 7
TWR 1/3 1 5 7
OC 1/5 1/5 1 3
Delamination 1/7 1/7 1/3 1
The enhancement in productivity, as well as quality of drilled hole of NiTi alloy without
deterioration of tool, was the objective of this research because the immigration of elements from the tool
to the drilled hole may affect the quality of drilled hole. The expansion of productivity is important
because NiTi alloys are difficult to machine. Hence, MRR was allocated a higher weight followed by
TWR, OC, and delamination. Table 9 displays the ranking of these attributes in a pairwise matrix.
b) The evaluation of the normalized weight of the attributes is completed by using the geometric mean
method. Table 10 displays the geometric mean and normalized weight evaluated from the pairwise
matrix by Eqs. 14 and 15.
GM=�∏ 𝑚𝑚𝑚𝑚𝑗𝑗𝑚𝑚𝑗𝑗=1 �1/𝑚𝑚 (14) 𝑤𝑤𝑗𝑗 = 𝐺𝐺𝐺𝐺𝑚𝑚/∑ 𝐺𝐺𝐺𝐺𝑚𝑚𝑚𝑚𝑚𝑚=1 (15)
c) The consistency index (CI) is calculated by utilizing Eq. 16 for the pairwise matrix. The value of λmax
was evaluated by the addition of the relative score column-wise, and then multiplication with
corresponding normalized weights of the attributes and summing the resultants. In this study, the value of
λmax emerged to be 4.22780 and CI equal to 0.07593. 𝐶𝐶𝐶𝐶 =λ𝑚𝑚𝑚𝑚𝑚𝑚−𝑚𝑚𝑚𝑚−1 (16)
d) At last, the consistency ratio (CR) of the matrix was evaluated by Eq. 17. Table. 11 was utilized to select
the random index (RI) for four attributes which are 0.89 for N = 4. Thus, the CR value in the present
research was estimated to be 0.085319. The consistency of the judgment is based on the value of CR
attained from the pairwise matrix and a value of 0.1 or less is usually acceptable testifying a good
investigation being made about the case at hand.
𝐶𝐶𝐶𝐶 =𝐶𝐶𝐶𝐶𝑅𝑅𝐶𝐶 (17)
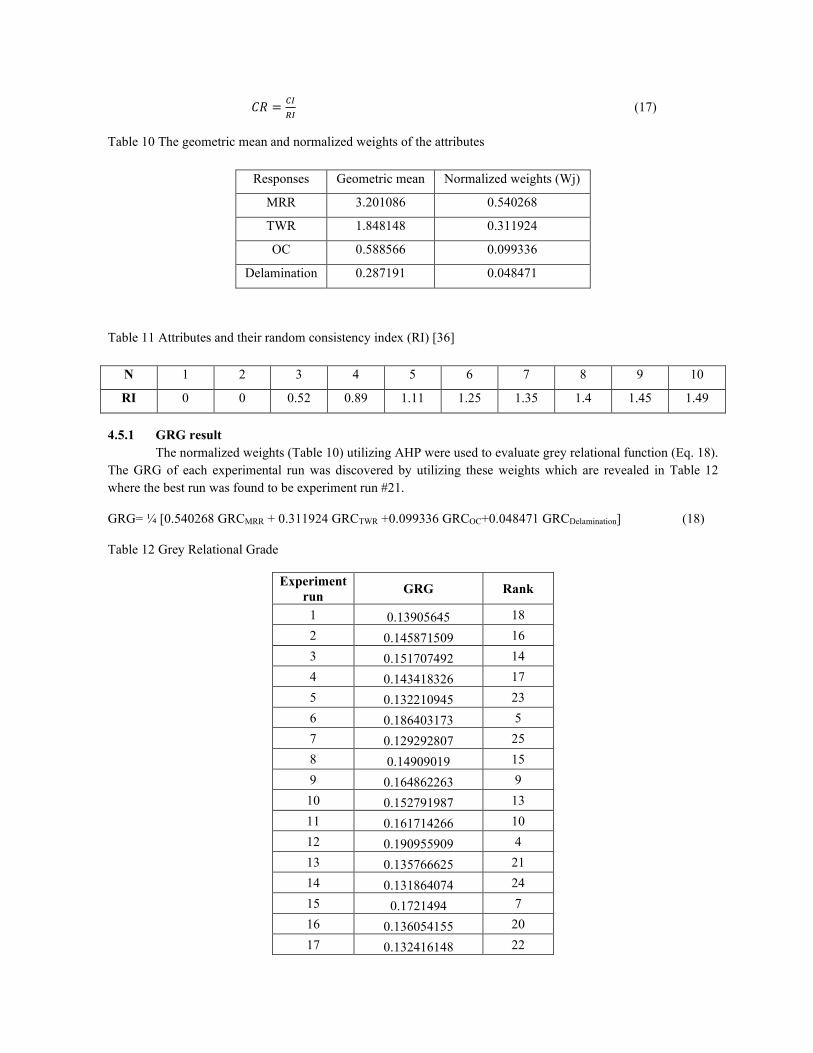
Table 10 The geometric mean and normalized weights of the attributes
Responses Geometric mean Normalized weights (Wj)
MRR 3.201086 0.540268
TWR 1.848148 0.311924
OC 0.588566 0.099336
Delamination 0.287191 0.048471
Table 11 Attributes and their random consistency index (RI) [36]
N 1 2 3 4 5 6 7 8 9 10
RI 0 0 0.52 0.89 1.11 1.25 1.35 1.4 1.45 1.49
4.5.1 GRG result
The normalized weights (Table 10) utilizing AHP were used to evaluate grey relational function (Eq. 18).
The GRG of each experimental run was discovered by utilizing these weights which are revealed in Table 12
where the best run was found to be experiment run #21.
GRG= ¼ [0.540268 GRCMRR + 0.311924 GRCTWR +0.099336 GRCOC+0.048471 GRCDelamination] (18)
Table 12 Grey Relational Grade
Experiment
run GRG Rank
1 0.13905645 18
2 0.145871509 16
3 0.151707492 14
4 0.143418326 17
5 0.132210945 23
6 0.186403173 5
7 0.129292807 25
8 0.14909019 15
9 0.164862263 9
10 0.152791987 13
11 0.161714266 10
12 0.190955909 4
13 0.135766625 21
14 0.131864074 24
15 0.1721494 7
16 0.136054155 20
17 0.132416148 22
18 0.128141953 26
19 0.15942715 11
20 0.18368284 6
21 0.246978185 1
22 0.168844908 8
23 0.199511294 3
24 0.220548357 2
25 0.118884262 27
26 0.136923922 19
27 0.158778283 12
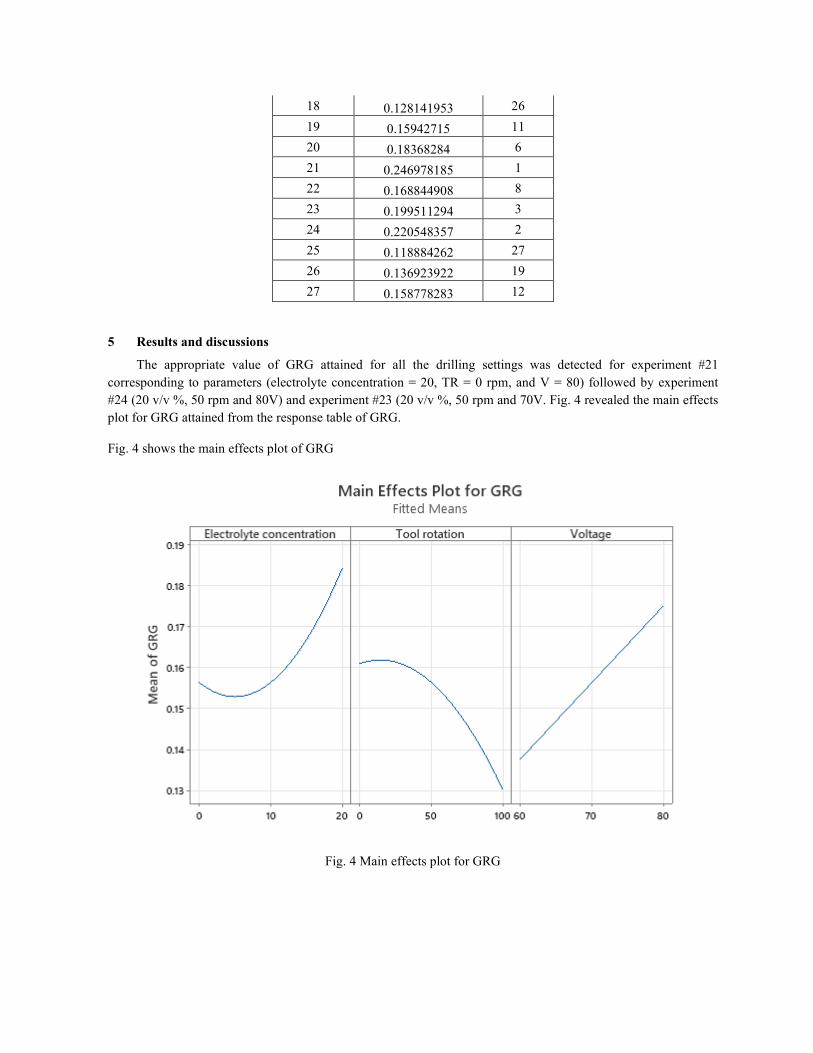
5 Results and discussions
The appropriate value of GRG attained for all the drilling settings was detected for experiment #21
corresponding to parameters (electrolyte concentration = 20, TR = 0 rpm, and V = 80) followed by experiment
#24 (20 v/v %, 50 rpm and 80V) and experiment #23 (20 v/v %, 50 rpm and 70V. Fig. 4 revealed the main effects
plot for GRG attained from the response table of GRG.
Fig. 4 shows the main effects plot of GRG
Fig. 4 Main effects plot for GRG

5.1 Regression model for GRG function
A full quadratic model of RSM was utilized to establish multiple objective functions for GRG, which is
completely suitable for the GRG attained from the experimental outcomes. The model equation is revealed in Eq.
(19). 𝐺𝐺𝐶𝐶𝐺𝐺 = 0.00660 − 0.00501 𝐸𝐸𝐸𝐸𝐸𝐸𝐸𝐸𝐸𝐸𝐸𝐸𝐸𝐸𝐸𝐸𝐸𝐸𝐸𝐸𝐸𝐸 𝐸𝐸𝐸𝐸𝑚𝑚𝐸𝐸𝐸𝐸𝑚𝑚𝐸𝐸𝐸𝐸𝑚𝑚𝐸𝐸𝑚𝑚𝐸𝐸𝑚𝑚 + 0.000428 𝑇𝑇𝐸𝐸𝐸𝐸𝐸𝐸 𝐸𝐸𝐸𝐸𝐸𝐸𝑚𝑚𝐸𝐸𝑚𝑚𝐸𝐸𝑚𝑚 +
0.001139 𝑉𝑉𝐸𝐸𝐸𝐸𝐸𝐸𝑚𝑚𝑙𝑙𝐸𝐸 + 0.000140 𝐸𝐸𝐸𝐸𝐸𝐸𝐸𝐸𝐸𝐸𝐸𝐸𝐸𝐸𝐸𝐸𝐸𝐸𝐸𝐸𝐸𝐸 𝐸𝐸𝐸𝐸𝑚𝑚𝐸𝐸𝐸𝐸𝑚𝑚𝐸𝐸𝐸𝐸𝑚𝑚𝐸𝐸𝑚𝑚𝐸𝐸𝑚𝑚 × 𝐸𝐸𝐸𝐸𝐸𝐸𝐸𝐸𝐸𝐸𝐸𝐸𝐸𝐸𝐸𝐸𝐸𝐸𝐸𝐸𝐸𝐸 𝐸𝐸𝐸𝐸𝑚𝑚𝐸𝐸𝐸𝐸𝑚𝑚𝐸𝐸𝐸𝐸𝑚𝑚𝐸𝐸𝑚𝑚𝐸𝐸𝑚𝑚 −0.000004 𝑇𝑇𝐸𝐸𝐸𝐸𝐸𝐸 𝐸𝐸𝐸𝐸𝐸𝐸𝑚𝑚𝐸𝐸𝑚𝑚𝐸𝐸𝑚𝑚 × 𝑇𝑇𝐸𝐸𝐸𝐸𝐸𝐸 𝐸𝐸𝐸𝐸𝐸𝐸𝑚𝑚𝐸𝐸𝑚𝑚𝐸𝐸𝑚𝑚 − 0.000030 𝐸𝐸𝐸𝐸𝐸𝐸𝐸𝐸𝐸𝐸𝐸𝐸𝐸𝐸𝐸𝐸𝐸𝐸𝐸𝐸𝐸𝐸 𝐸𝐸𝐸𝐸𝑚𝑚𝐸𝐸𝐸𝐸𝑚𝑚𝐸𝐸𝐸𝐸𝑚𝑚𝐸𝐸𝑚𝑚𝐸𝐸𝑚𝑚 × 𝑇𝑇𝐸𝐸𝐸𝐸𝐸𝐸 𝐸𝐸𝐸𝐸𝐸𝐸𝑚𝑚𝐸𝐸𝑚𝑚𝐸𝐸𝑚𝑚 +
0.000073 𝐸𝐸𝐸𝐸𝐸𝐸𝐸𝐸𝐸𝐸𝐸𝐸𝐸𝐸𝐸𝐸𝐸𝐸𝐸𝐸𝐸𝐸 𝐸𝐸𝐸𝐸𝑚𝑚𝐸𝐸𝐸𝐸𝑚𝑚𝐸𝐸𝐸𝐸𝑚𝑚𝐸𝐸𝑚𝑚𝐸𝐸𝑚𝑚 × 𝑉𝑉𝐸𝐸𝐸𝐸𝐸𝐸𝑚𝑚𝑙𝑙𝐸𝐸 ……... (19)
The suitability of the established model is only inadequate for drilling Ni55.7Ti SMA; using the
molybdenum tool, within the settings (60V ≤ Voltage ≤ 80V), (50 rpm ≤ tool rotation ≤ 100 rpm), and (0 v/v % ≤ electrolyte concentration ≤ 20 v/v %).
The surface and contour plots of GRG are revealed in Fig. 5. The interaction of the drilling settings for
the attained value of GRG is revealed by surface plots. The attained value of GRG is maximum at higher
electrolyte concentration and higher voltage.
Figure 6 displays the calculation of the GRG attained from experiments and evaluated from the
regression model. The maximum value of GRG for experiment #21 is because of the higher electrolyte
concentration at a higher voltage that helped to improve MRR.
Fig. 5 Surface and contour plots for GRG

Fig. 6 Calculation of the GRG attained from experiments and evaluated from the regression model
From figure 7, it can be concluded that the GRG has been mostly affected by voltage. The combined
effect of electrolyte concentration and tool rotation followed by electrolyte concentration and voltage can also be
observed.
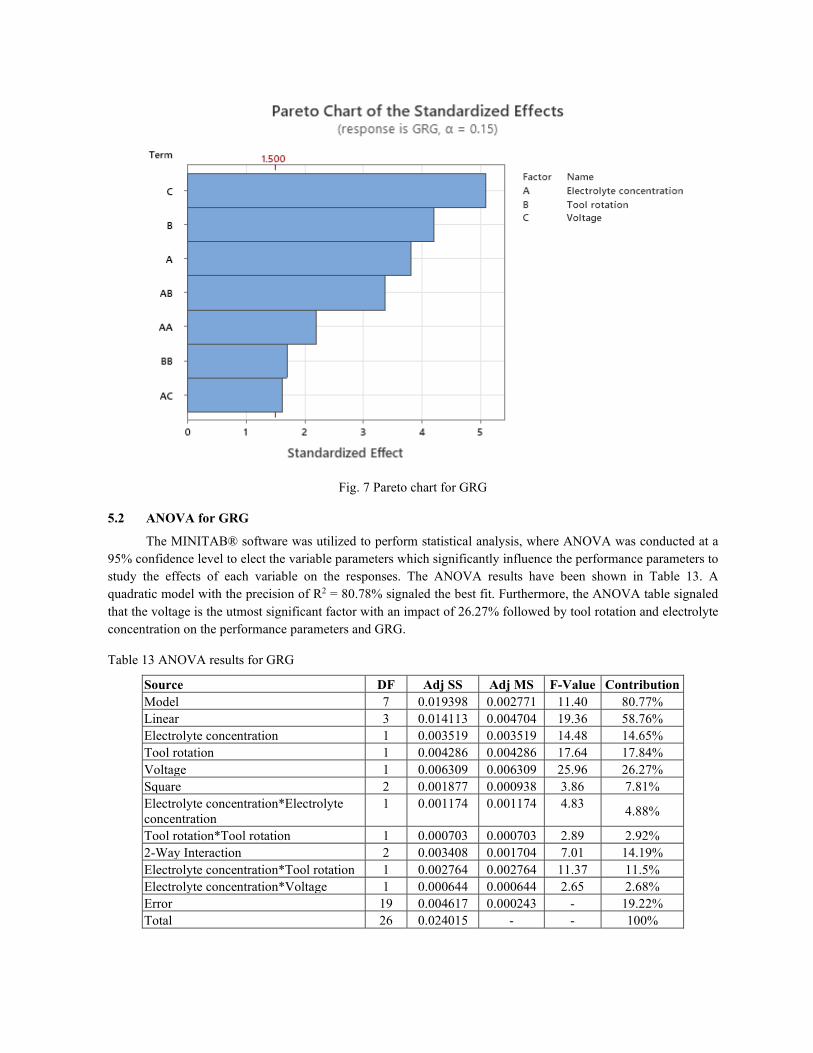
Fig. 7 Pareto chart for GRG
5.2 ANOVA for GRG
The MINITAB® software was utilized to perform statistical analysis, where ANOVA was conducted at a
95% confidence level to elect the variable parameters which significantly influence the performance parameters to
study the effects of each variable on the responses. The ANOVA results have been shown in Table 13. A
quadratic model with the precision of R2 = 80.78% signaled the best fit. Furthermore, the ANOVA table signaled
that the voltage is the utmost significant factor with an impact of 26.27% followed by tool rotation and electrolyte
concentration on the performance parameters and GRG.
Table 13 ANOVA results for GRG
Source DF Adj SS Adj MS F-Value Contribution
Model 7 0.019398 0.002771 11.40 80.77%
Linear 3 0.014113 0.004704 19.36 58.76%
Electrolyte concentration 1 0.003519 0.003519 14.48 14.65%
Tool rotation 1 0.004286 0.004286 17.64 17.84%
Voltage 1 0.006309 0.006309 25.96 26.27%
Square 2 0.001877 0.000938 3.86 7.81%
Electrolyte concentration*Electrolyte
concentration
1 0.001174 0.001174 4.83 4.88%
Tool rotation*Tool rotation 1 0.000703 0.000703 2.89 2.92%
2-Way Interaction 2 0.003408 0.001704 7.01 14.19%
Electrolyte concentration*Tool rotation 1 0.002764 0.002764 11.37 11.5%
Electrolyte concentration*Voltage 1 0.000644 0.000644 2.65 2.68%
Error 19 0.004617 0.000243 - 19.22%
Total 26 0.024015 - - 100%
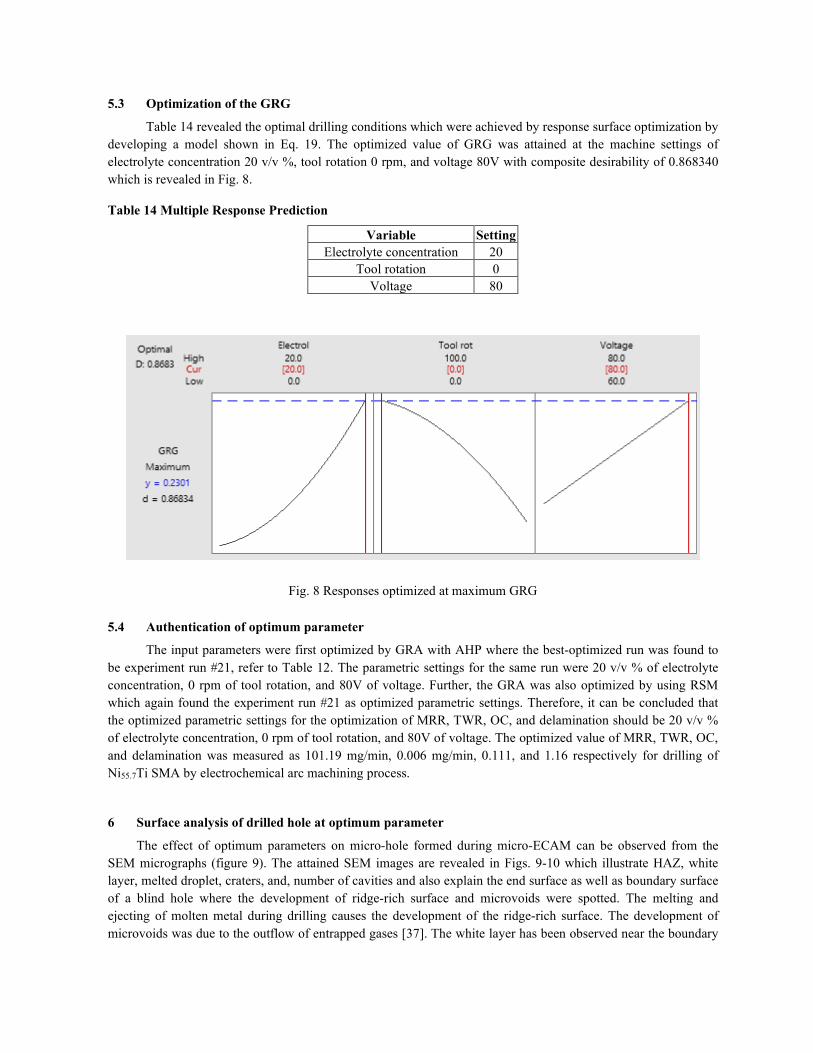
5.3 Optimization of the GRG
Table 14 revealed the optimal drilling conditions which were achieved by response surface optimization by
developing a model shown in Eq. 19. The optimized value of GRG was attained at the machine settings of
electrolyte concentration 20 v/v %, tool rotation 0 rpm, and voltage 80V with composite desirability of 0.868340
which is revealed in Fig. 8.
Table 14 Multiple Response Prediction
Variable Setting
Electrolyte concentration 20
Tool rotation 0
Voltage 80
Fig. 8 Responses optimized at maximum GRG
5.4 Authentication of optimum parameter
The input parameters were first optimized by GRA with AHP where the best-optimized run was found to
be experiment run #21, refer to Table 12. The parametric settings for the same run were 20 v/v % of electrolyte
concentration, 0 rpm of tool rotation, and 80V of voltage. Further, the GRA was also optimized by using RSM
which again found the experiment run #21 as optimized parametric settings. Therefore, it can be concluded that
the optimized parametric settings for the optimization of MRR, TWR, OC, and delamination should be 20 v/v %
of electrolyte concentration, 0 rpm of tool rotation, and 80V of voltage. The optimized value of MRR, TWR, OC,
and delamination was measured as 101.19 mg/min, 0.006 mg/min, 0.111, and 1.16 respectively for drilling of
Ni55.7Ti SMA by electrochemical arc machining process.
6 Surface analysis of drilled hole at optimum parameter
The effect of optimum parameters on micro-hole formed during micro-ECAM can be observed from the
SEM micrographs (figure 9). The attained SEM images are revealed in Figs. 9-10 which illustrate HAZ, white
layer, melted droplet, craters, and, number of cavities and also explain the end surface as well as boundary surface
of a blind hole where the development of ridge-rich surface and microvoids were spotted. The melting and
ejecting of molten metal during drilling causes the development of the ridge-rich surface. The development of
microvoids was due to the outflow of entrapped gases [37]. The white layer has been observed near the boundary

of the hole which is formed due to higher voltage [38]. It has also been found craters in the white layer [39]. The
discontinuous machining provided electrochemical debris and uneven disintegration of the surface around the hole
[23]. The wide craters on the MS were also spotted due to high DE [40]. The higher DE provided more globules,
micropores, and microcracks on the MS [41]. Therefore, it can be said that the increasing DE led to the
resolidification and melting of materials on the MS [32,42–45]. Also, the development of a WL on the MS
because of thermal effects might depreciate the standard of SME of the material [46].
Fig. 9 SEM analysis of blind hole at optimum parameter
Fig. 10 Large number of microvoids
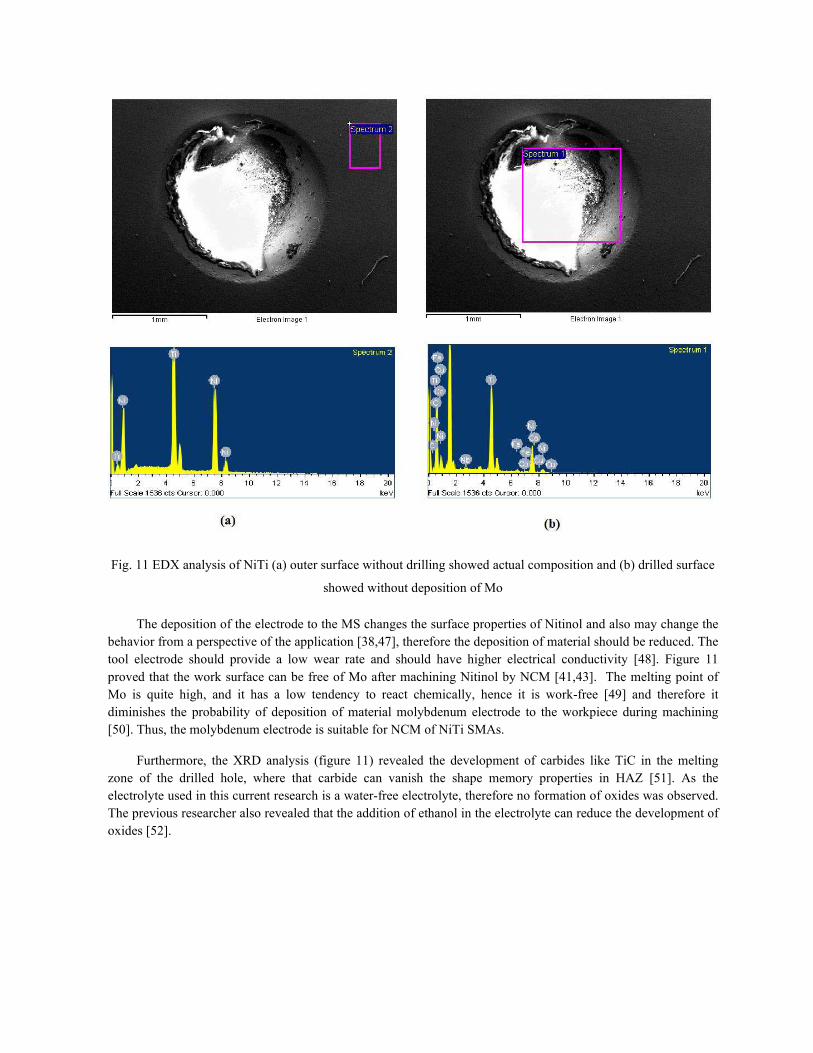
Fig. 11 EDX analysis of NiTi (a) outer surface without drilling showed actual composition and (b) drilled surface
showed without deposition of Mo
The deposition of the electrode to the MS changes the surface properties of Nitinol and also may change the
behavior from a perspective of the application [38,47], therefore the deposition of material should be reduced. The
tool electrode should provide a low wear rate and should have higher electrical conductivity [48]. Figure 11
proved that the work surface can be free of Mo after machining Nitinol by NCM [41,43]. The melting point of
Mo is quite high, and it has a low tendency to react chemically, hence it is work-free [49] and therefore it
diminishes the probability of deposition of material molybdenum electrode to the workpiece during machining
[50]. Thus, the molybdenum electrode is suitable for NCM of NiTi SMAs.
Furthermore, the XRD analysis (figure 11) revealed the development of carbides like TiC in the melting
zone of the drilled hole, where that carbide can vanish the shape memory properties in HAZ [51]. As the
electrolyte used in this current research is a water-free electrolyte, therefore no formation of oxides was observed.
The previous researcher also revealed that the addition of ethanol in the electrolyte can reduce the development of
oxides [52].

Fig. 11 XRD analysis of drilled hole found TiC
7 Conclusion
The experimental exploration was reflected for drilling NiTi SMAs utilizing ECAM. The optimum
parameter was accomplished with the help of multi-objective optimization. The following involvement can be
attained from the analysis:
1 AHP weight method was utilized in GRG to obtain the optimal solution for analyzing multiple
objectives. Again, RSM has been applied for obtaining optimum GRG. The same optimum input
parameter as 20 v/v % of electrolyte concentration, 0 rpm of tool rotation, and 80V of voltage was
obtained by optimization of the response parameters only by GRG and optimization of GRG by
RSM. The optimized value of MRR, TWR, OC, and delamination was measured as 101.19 mg/min,
0.006 mg/min, 0.111, and 1.16 respectively for drilling of Ni55.7Ti SMA by electrochemical arc
machining process.
2 ANOVA results discovered that the individual parameter (voltage followed by electrolyte
concentration) as well as 2- the way interaction parameter (electrolyte concentration × tool rotation)
affected the drilling conditions for hard-to-cut NiTi alloy.
3 The SEM photographs of the blind hole observed equal hole radius all over the periphery including
HAZ, white layer, melted droplet, craters, and, number of cavities and also the development of
ridge-rich surface and microvoids around the end surface as well as boundary surface of a blind hole.
The white layer has been observed near the boundary of the hole which is formed due to higher
voltage. EDX analysis proved that the work surface can be free of Mo after machining Nitinol by
electrochemical arc machining.
4 The XRD analysis revealed the development of carbide like TiC in the melting zone of the drilled
hole, where that carbide can vanish the shape memory properties in HAZ. As the electrolyte used is
a water-free electrolyte, therefore no formation of oxides was observed.

REFERENCES
[1] Kedare, R., Nanavare, V., Sharma, S., Midathada, A., and Ravella, U. K., 2018, “Review on WEDM of
Shape Memory Alloy,” Mater. Today Proc., 5(14), pp. 28313–28319.
[2] Song, G., Ma, N., and Li, H., 2006, “Applications of Shape Memory Alloys in Civil Structures,” Eng.
Struct., 28(9), pp. 1266–1274.
[3] Huang, W., 2002, “On the Selection of Shape Memory Alloys for Actuators,” Mater. Des., 23(1), pp. 11–19.
[4] Kumar, S. M., and Lakshi, M. V., 2013, “Applications of Shape Memory Alloys in MEMS Devices,” Int. J.
Adv. Res. Comput. Commun. Eng., 2(2), pp. 1122–1127.
[5] Duerig, T., Pelton, A., and Stöckel, D., 1999, “An Overview of Nitinol Medical Applications,” Mater. Sci.
Eng. A, 273–275, pp. 149–160.
[6] Thompson, S. A., 2000, “An Overview of Nickel-Titanium Alloys Used in Dentistry,” Int. Endod. J., 33(4),
pp. 297–310.
[7] Gil, F. J., and Planell, J. A., 1998, “Shape Memory Alloys for Medical Applications,” Proc. Inst. Mech. Eng.
Part H J. Eng. Med., 212(6), pp. 473–488.
[8] Marchand, C., Heim, F., Durand, B., and Chafke, N., 2011, “Nitinol Stent for Percutaneous Heart Valve
Implantation: Material Shape Setting,” Mater. Manuf. Process., 26(2), pp. 181–187.
[9] Morgan, N. B., 2004, “Medical Shape Memory Alloy Applications — the Market and Its Products,” Mater.
Sci. Eng. A, 378(1–2), pp. 16–23.
[10] LAGOUDAS, D. C., REDINIOTIS, O. K., and KHAN, M. M., 2000, “APPLICATIONS OF SHAPE
MEMORY ALLOYS TO BIOENGINEERING AND BIOMEDICAL TECHNOLOGY,” Scattering Theory
and Biomedical Engineering Modelling and Applications, WORLD SCIENTIFIC, pp. 195–207.
[11] Sutapun, B., Tabib-azar, M., and Huff, M. A., 1998, “Applications of Shape Memory Alloys in Optics,”
Appl. Opt., 37(28), pp. 6811–6815.
[12] Miyazaki, S., and Sachdeva, R. L., 2008, “Shape Memory Effect and Superelasticity in Ti-Ni Alloys,”
Shape Mem. Alloy. Biomed. Appl., pp. 3–19.
[13] Bogue, R., 2009, “Shape-Memory Materials : A Review of Technology and Applications,” Assem. Autom., 29/3, pp. 214–219.
[14] Weinert, K., and Petzoldt, V., 2008, “Machining NiTi Micro-Parts by Micro-Milling,” Mater. Sci. Eng. A,
481–482(1-2 C), pp. 672–675.
[15] Weinert, K., and Petzoldt, V., 2004, “Machining of NiTi Based Shape Memory Alloys,” Mater. Sci. Eng. A,
378(1-2 SPEC. ISS.), pp. 180–184.
[16] Lin, H. C., Lin, K. M., and Chen, Y. C., 1999, “The Laser Machining Characteristics of TiNi Shape Memory
Alloys,” High Temp. Mater. Process., 3(4), pp. 409–420.
[17] Majumder, H., and Maity, K., 2018, “Prediction and Optimization of Surface Roughness and Micro-
Hardness Using Grnn and MOORA-Fuzzy-a MCDM Approach for Nitinol in WEDM,” Measurement, 118,
pp. 1–13.
[18] Jatti, V. S., 2018, “Multi-Characteristics Optimization in EDM of NiTi Alloy, NiCu Alloy and BeCu Alloy
Using Taguchi’s Approach and Utility Concept,” Alexandria Eng. J., 57(4), pp. 2807–2817.
[19] Abidi, M. H., Al-Ahmari, A. M., Umer, U., and Rasheed, M. S., 2018, “Multi-Objective Optimization of
Micro-Electrical Discharge Machining of Nickel-Titanium-Based Shape Memory Alloy Using MOGA-II,”
Meas. J. Int. Meas. Confed., 125(May), pp. 336–349.
[20] Abidi, M., Al-Ahmari, A., Siddiquee, A., Mian, S., Mohammed, M., and Rasheed, M., 2017, “An
Investigation of the Micro-Electrical Discharge Machining of Nickel-Titanium Shape Memory Alloy Using
Grey Relations Coupled with Principal Component Analysis,” Metals (Basel)., 7(11), p. 486.
[21] Jahan, M. P., Kakavand, P., and Alavi, F., 2017, “A Comparative Study on Micro-Electro-Discharge-
Machined Surface Characteristics of Ni-Ti and Ti-6Al-4V with Respect to Biocompatibility,” Procedia
Manuf., 10, pp. 232–242.
[22] McGeough, J. A., Khayry, A. B. M., Munro, W., and Crookall, J. R., 1983, “Theoretical and Experimental
Investigation of the Relative Effects of Spark Erosion and Electrochemical Dissolution in Electrochemical
ARC Machining,” CIRP Ann. - Manuf. Technol., 32(1), pp. 113–118.
[23] Chandrasekhar, S., and Prasad, N. B. V., 2020, “Multi-Response Optimization of Electrochemical
Machining Parameters in the Micro-Drilling of AA6061-TiB2in Situ Composites Using the Entropy–
VIKOR Method,” Proc. Inst. Mech. Eng. Part B J. Eng. Manuf.
[24] Krötz, H., Roth, R., and Wegener, K., 2013, “Experimental Investigation and Simulation of Heat Flux into
Metallic Surfaces Due to Single Discharges in Micro-Electrochemical Arc Machining (Micro-ECAM),” Int.
J. Adv. Manuf. Technol., 68(5–8), pp. 1267–1275.
[25] Krötz, H., and Wegener, K., 2015, “Sparc Assisted Electrochemical Machining: A Novel Possibility for
Microdrilling into Electrical Conductive Materials Using the Electrochemical Discharge Phenomenon,” Int.
J. Adv. Manuf. Technol., 79(9–12), pp. 1633–1643.
[26] Ao, S., Li, K., Liu, W., Qin, X., Wang, T., Dai, Y., and Luo, Z., 2020, “Electrochemical Micromachining of
NiTi Shape Memory Alloy with Ethylene Glycol–NaCl Electrolyte Containing Ethanol,” J. Manuf. Process.,
53(September 2019), pp. 223–228.
[27] Younas, M., Jaffery, S. H. I., Khan, M., Khan, M. A., Ahmad, R., Mubashar, A., and Ali, L., 2019, “Multi-
Objective Optimization for Sustainable Turning Ti6Al4V Alloy Using Grey Relational Analysis (GRA)
Based on Analytic Hierarchy Process (AHP),” Int. J. Adv. Manuf. Technol., 105(1–4), pp. 1175–1188.
[28] Mcgeough, J. A., and Rasmussen, H., 1990, “A Theoretical Analysis of Electrochemical Arc Machining,”
Proc. R. Soc. London. A. Math. Phys. Sci., 429(1877), pp. 429–447.
[29] Basak, I., and Ghosh, A., 1996, “Mechanism of Spark Generation during Electrochemical Discharge
Machining: A Theoretical Model and Experimental Verification,” J. Mater. Process. Technol., 62(1–3), pp.
46–53.
[30] Davim, J. P., Rubio, J. C., and Abrão, A. M., 2007, “Delamination Assessment after Drilling Medium-
Density Fibreboard (MDF) by Digital Image Analysis,” Holzforschung, 61(3), pp. 294–300.
[31] Antil, P., Singh, S., and Manna, A., 2020, “Experimental Investigation During Electrochemical Discharge
Machining (ECDM) of Hybrid Polymer Matrix Composites,” Iran. J. Sci. Technol. - Trans. Mech. Eng.,
44(3), pp. 813–824.
[32] Magabe, R., Sharma, N., Gupta, K., and Paulo Davim, J., 2019, “Modeling and Optimization of Wire-EDM
Parameters for Machining of Ni55.8Ti Shape Memory Alloy Using Hybrid Approach of Taguchi and
NSGA-II,” Int. J. Adv. Manuf. Technol., 102(5–8), pp. 1703–1717.
[33] Kibria, G., Doloi, B., and Bhattacharyya, B., 2013, “Experimental Investigation and Multi-Objective
Optimization of Nd:YAG Laser Micro-Turning Process of Alumina Ceramic Using Orthogonal Array and
Grey Relational Analysis,” Opt. Laser Technol., 48, pp. 16–27.
[34] Razak Kaladgi, A., Afzal, A., Manokar, A. M., Thakur, D., Agbulut, U., Alshahrani, S., Saleel C, A., and
Subbiah, R., 2021, “Integrated Taguchi-GRA-RSM Optimization and ANN Modelling of Thermal
Performance of Zinc Oxide Nanofluids in an Automobile Radiator,” Case Stud. Therm. Eng., 26(May), p.
101068.
[35] Kuo, Y., Yang, T., and Huang, G. W., 2008, “The Use of a Grey-Based Taguchi Method for Optimizing
Multi-Response Simulation Problems,” Eng. Optim., 40(6), pp. 517–528.
[36] Zhou, Z., Chen, D., and Xie, S. (Shengquan), 2007, Springer Series in Advanced Manufacturing.
[37] Pujari, S. R., Koona, R., and Beela, S., 2018, “Surface Integrity of Wire EDMed Aluminum Alloy: A
Comprehensive Experimental Investigation,” J. King Saud Univ. - Eng. Sci., 30(4), pp. 368–376.
[38] Gaikwad, M. U., Krishnamoorthy, A., and Jatti, V. S., 2019, “Investigation and Optimization of Process
Parameters in Electrical Discharge Machining (EDM) Process for NiTi 60,” Mater. Res. Express, 6(6).
[39] Pradhan, B. B., Masanta, M., Sarkar, B. R., and Bhattacharyya, B., 2009, “Investigation of Electro-
Discharge Micro-Machining of Titanium Super Alloy,” Int. J. Adv. Manuf. Technol., 41(11–12), pp. 1094–
1106.
[40] Goyal, A., UR Rahman, H., and Ghani, S. A. C., 2021, “Experimental Investigation & Optimisation of Wire
Electrical Discharge Machining Process Parameters for Ni49Ti51 Shape Memory Alloy,” J. King Saud
Univ. - Eng. Sci., 33(2), pp. 129–135.
[41] Chaudhari, R., Vora, J. J., Patel, V., Lacalle, L. N. L. de, and Parikh, D. M., 2020, “Effect of WEDM
Process Parameters on Surface Morphology of Nitinol Shape Memory Alloy,” Materials (Basel)., 13(21), p.
4943.
[42] Gupta, D. K., and Dubey, A. K., 2021, “Multi Process Parameters Optimization of Wire-EDM on Shape
Memory Alloy (Ni54.1Ti) Using Taguchi Approach,” Mater. Today Proc., (xxxx), pp. 1–5.
[43] Chaudhari, R., Vora, J. J., Patel, V., López de Lacalle, L. N., and Parikh, D. M., 2020, “Surface Analysis of
Wire-Electrical-Discharge-Machining-Processed Shape-Memory Alloys,” Materials (Basel)., 13(3), p. 530.
[44] Soni, H., Narendranath, S., and Ramesh, M. R., 2018, “Effect of Machining Process Parameters on
Productivity Rate and Surface Roughness of Machined TiNiCo Alloy,” Mater. Today Proc., 5(9), pp.
19166–19171.
[45] Bisaria, H., and Shandilya, P., 2019, “Study on Crater Depth during Material Removal in WEDC of Ni-Rich
Nickel–Titanium Shape Memory Alloy,” J. Brazilian Soc. Mech. Sci. Eng., 41(3), p. 157.

[46] Dash, B., Das, M., Das, M., Mahapatra, T. R., and Mishra, D., 2019, “A Concise Review on Machinability
of Niti Shape Memory Alloys,” Mater. Today Proc., 18, pp. 5141–5150.
[47] Kulkarni, V. N., Gaitonde, V. N., Kadadevaru, S. G., and Karnik, S. R., 2019, “Simultaneous Optimization
of Material Removal Rate and Tool Wear Rate during Wire Electric Discharge Machining of Nitinol Smart
Alloy,” AIP Conference Proceedings, p. 020034.
[48] Hasçalik, A., and Çaydaş, U., 2007, “Electrical Discharge Machining of Titanium Alloy (Ti-6Al-4V),”
Appl. Surf. Sci., 253(22), pp. 9007–9016.
[49] Azam, M., Jahanzaib, M., Abbasi, J. A., Abbas, M., Wasim, A., and Hussain, S., 2016, “Parametric Analysis
of Recast Layer Formation in Wire-Cut EDM of HSLA Steel,” Int. J. Adv. Manuf. Technol., 87(1–4), pp.
713–722.
[50] Newton, T. R., Melkote, S. N., Watkins, T. R., Trejo, R. M., and Reister, L., 2009, “Investigation of the
Effect of Process Parameters on the Formation and Characteristics of Recast Layer in Wire-EDM of Inconel
718,” Mater. Sci. Eng. A, 513–514(C), pp. 208–215.
[51] Theisen, W., and Schuermann, A., 2004, “Electro Discharge Machining of Nickel-Titanium Shape Memory
Alloys,” Mater. Sci. Eng. A, 378(1-2 SPEC. ISS.), pp. 200–204.
[52] Kim, D., Son, K., Sung, D., Kim, Y., and Chung, W., 2015, “Effect of Added Ethanol in Ethylene Glycol-
NaCl Electrolyte on Titanium Electropolishing,” Corros. Sci., 98, pp. 494–499.

Statements & Declarations
Funding: The authors declare that no funds, grants, or other support were received during the preparation of this
manuscript.
Competing Interests: The authors have no relevant financial or non-financial interests to disclose.
Author Contributions: All authors contributed to the study conception and design. Material preparation, data
collection and analysis were performed by Nitish Kumar and Prof. Amaresh Kumar. The first draft of the manuscript
was written by Nitish Kumar and all authors commented on previous versions of the manuscript. All authors read
and approved the final manuscript.
Related Documents