TIMSS 2015 GRADE 9 National Report Understanding mathematics and science achievement amongst Grade 9 learners in South Africa Linda Zuze, Vijay Reddy, Mariette Visser, Lolita Winnaar, Ashika Govender

Welcome message from author
This document is posted to help you gain knowledge. Please leave a comment to let me know what you think about it! Share it to your friends and learn new things together.
Transcript
TIMSS 2015 GRADE 9 National Report
Understanding mathematics and science achievement amongst Grade 9 learners
in South Africa
Linda Zuze, Vijay Reddy, Mariette Visser, Lolita Winnaar, Ashika Govender
Published by HSRC Press
Private Bag X9182, Cape Town, 8000, South Africa
www.hsrcpress.ac.za
First published 2017
ISBN (soft cover) 978-0-7969-2502-2
ISBN (pdf) 978-0-7969-2491-9
© 2017 Human Sciences Research Council
The publishers have no responsibility for the continued existence or accuracy of URLs for external or third-party
Internet websites referred to in this book and do not guarantee that any content on such websites is, or will
remain, accurate or appropriate.
Copy-edited by Purple Frog Communications
Typeset by Purple Frog Communications
Cover design by Purple Frog Communications
Printed by CAPiTiLPRESS, Cape Town, South Africa
Distributed in Africa by Blue Weaver
Tel: +27 (0)21 701 4477; Fax Local: (0)21 701 7302; Fax International: 0927865242139
www.blueweaver.co.za
Distributed in Europe and the United Kingdom by Eurospan Distribution Services (EDS)
Tel: +44 (0)17 6760 4972; Fax: +44 (0)17 6760 1640
www.eurospanbookstore.com
Distributed in North America by River North Editions, from IPG
Call toll-free: (800) 888 4741; Fax: +1 (312) 337 5985
www.ipgbook.com
No part of this publication may be reproduced, stored in a retrieval system, or transmitted in any form or by any
means, electronic, mechanical, photocopying, recording or otherwise, without prior permission from the copyright
owner.
To copy any part of this publication, you may contact DALRO for information and copyright clearance.
Tel: 086 12 DALRO (or 086 12 3256 from within South Africa); +27 (0)11 712-8000
Fax: +27 (0)11 403-9094
Postal address: P O Box 31627, Braamfontein, 2017, South Africa
www.dalro.co.za
Any unauthorised copying could lead to civil liability and/or criminal sanctions.
Understanding mathematics and science achievement amongst Grade 9 learners in South Africa 1
TIMSS 2015 Grade 9 National Report
The Trends in International Mathematics and Science Study (TIMSS) is a four-year project. There were numerous
components to the TIMSS project that many people contributed towards in order to complete this project. We
acknowledge the efforts of these individuals and institutions.
• The Department of Basic Education (DBE) for the funding and support for the successful implementation of
this research study;
• The provincial coordinators who facilitated access to schools;
• The school principals, educators and learners who participated in the study;
• The Human Sciences Research Council (HSRC) research team: Vijay Reddy, Fabian Arends, Cas Prinsloo,
Mariette Visser, Lolita Winnaar, Andrea Juan and Shawn Rogers;
• The Education and Skills Development administrative team: Matselane Maja, Elmi de Koning, Erika Masser
and Maria Ngema for their work in organising the massive surveys and providing support to all aspects of the
project;
• Pontsho Wiseman Thaba for assistance with the Cross-Country Scoring Reliability and the Trend Scoring
Reliability activities;
• Pearson South Africa, the data collection agency;
• Quality assurance of the data collection process: Azinga Tele, Catherine Namome, Genevieve Haupt,
Kholofelo Motha, Lisa Wiebesiek, Maglin Moodley, Matthews Makgamatha, Mogege Mosimege, Nosisi Feza,
Sylvia Hannan, Tamlynne Meyer and Shawn Rogers;
• Jaqueline Harvey and Unathi Beku for research assistance on the project;
• Short-term contract staff who assisted with administrative tasks and assessment scoring;
• Vanessa Scherman, Caroline Long, Corene Coetzee and Amelia Abrie for contributing by using TIMSS
performance data to create relevant benchmarks for South Africa; and
• Surette van Staden and Martin Gustaffson for critical review of the report.
Dr Vijay Reddy
TIMSS National Research CoordinatorHuman Sciences Research Council
Acknowledgements
2 Understanding mathematics and science achievement amongst Grade 9 learners in South Africa
Page
Acknowledgements 1
List of figures 4
List of tables 6
List of acronyms 7
Executive summary 8
PART A: MATHEMATICS AND SCIENCE ACHIEVEMENT IN SOUTH AFRICA 13
1. Introduction 14
1.1. Why mathematics and science are so important in the South African context? 15
1.2 National educational policies and practices 17
2. Analytical approach 19
3. Trends in TIMSS results 20
3.1 Trends in performance percentiles 21
3.2 Change in performance from 2003 to 2015 22
3.3 Provincial performance 24
3.4 Performance by school type 25
Section summary 26
PART B: LEARNERS AND THE HOME ENVIRONMENT 27
4. A profile of Grade 9 learners in 2015 28
4.1 Gender, age and achievement 28
4.2 Language of learning and teaching (LoLT) 29
5. Home resources 30
6. Socioeconomic status (SES) 31
6.1 Socioeconomic status (SES) asset quintiles 32
6.2 Parental education 33
6.3 Learner attitudes about mathematics and science 34
6.4 Learner academic aspirations 35
Section summary 36
PART C: SUPPORT FOR LEARNING OUTSIDE OF SCHOOL 37
7. Homework and homework checking 38
8. Extra lessons 41
Section summary 42
PART D: A COMPARISON OF THE SCHOOLING ENVIRONMENT 43
9. School resources 44
9.1. Textbook provision 44
9.2 Computer resources 47
9.3 Library and laboratory facilities 48
9.4 School meals 50
Contents
Understanding mathematics and science achievement amongst Grade 9 learners in South Africa 3
TIMSS 2015 Grade 9 National Report
Page
10. School climate 50
10.1 An overview of school climate across South African schools 50
10.2 Emphasis placed on academic success 51
10.3 Challenges facing teachers 52
10.4 School discipline 53
11. Teachers and classroom instruction 56
11.1 Teacher interaction 56
11.2 Teacher vacancies 57
11.3 Teacher absenteeism and arriving late 59
Section summary 60
PART E: THE SCHOOL’S INFLUENCE ON MATHEMATICS ACHIEVEMENT 61
12. School effectiveness in South Africa 62
12.1 Why focus on school effectiveness in South African educational policy? 62
12.2 Which questions are to be addressed for the TIMSS 2015 Grade 9 study? 63
12.3 What method was used to answer the research questions? 64
12.4 What do these results mean? 65
Section summary 68
PART F: SCIENCE CURRICULUM INSIGHTS FROM NATIONAL AND INTERNATIONAL
BENCHMARKS 69
13. Science curriculum and national benchmarks 70
13.1 International science curriculum analysis 70
13.2 National science curriculum analysis 71
13.3 Developing national benchmarks and proficiency label descriptors 72
Section summary 74
PART G: KEY FINDINGS, POLICY IMPLICATIONS AND RECOMMENDATIONS 75
Policy recommendations for different role players 79
APPENDIX A: SUMMARY OF RESULTS: TIMSS 2015 82
APPENDIX B: TIMSS 2015 DESIGN AND METHODOLOGY 83
APPENDIX C: SUMMARY OF SOUTH AFRICA’S MATHEMATICS CURRICULUM 89
APPENDIX D: SUMMARY OF SOUTH AFRICA’S SCIENCE CURRICULUM 93
References 96
Index 101
4 Understanding mathematics and science achievement amongst Grade 9 learners in South Africa
Page
Figure 1.1: Minimum mathematics requirements for post-school programmes 16
Figure 1.2: Percentage of candidates achieving 40 per cent and above in a selection of NSC
subjects, 2015 and 2016 17
Figure 3.1: National trends in Grade 9 mathematics and science achievement, 2003, 2011
and 2015 (with SEs) 21
Figure 3.2: Change in average mathematics and science scores of selected countries, 2003
and 2015 22
Figure 3.3: Percentage of learners performing at the TIMSS international benchmarks, 2003,
2011 and 2015 24
Figure 3.4: Provincial mathematics and science performance with 95 per cent confidence
intervals, 2015 24
Figure 3.5: Difference in provincial performance in mathematics and science, 2003 and 2015 25
Figure 3.6: Average performance by school type, 2011 and 2015 26
Figure 4.1: Age distribution by school type, 2015 28
Figure 4.2: Average achievement scores by age and gender, 2015 29
Figure 5.1: Percentage of learners with home resources in 2003, 2011 and 2015 31
Figure 6.1: Percentage of learners by SES quintile and school type, 2015 32
Figure 6.2: Changes in parental education levels by school type, 2011 and 2015 33
Figure 6.3: Changes in enjoyment of, value attached to and confidence in mathematics and
science, 2011 and 2015 34
Figure 6.4: Learners’ educational aspirations by school type, 2015 36
Figure 7.1: Frequency of receiving mathematics homework by school type, 2015 38
Figure 7.2: Frequency of receiving science homework by school type, 2015 39
Figure 7.3: Schoolwork is in a language that parents/caregivers don’t understand by
school type, 2015 40
Figure 7.4: Schoolwork is so difficult that parents/caregivers are not able to help by
school type, 2015 40
Figure 8.1: Percentage of learners by reason for extra lessons and school type, 2015 42
Figure 9.1: Percentage of learners who own a textbook by school type, 2015 45
Figure 9.2: Percentage of learners who own a mathematics textbook by province, 2015 46
Figure 9.3: Percentage of learners who own a science textbook by province, 2015 46
Figure 9.4: Percentage of learners with access to school computer facilities by school type,
2015 48
List of figures
Understanding mathematics and science achievement amongst Grade 9 learners in South Africa 5
TIMSS 2015 Grade 9 National Report
Page
Figure 9.5: Percentage of learners with access to school library facilities by school type, 2015 49
Figure 9.6: Percentage of learners with access to science laboratory by school type, 2015 49
Figure 9.7: Availability of school meals by school type, 2015 50
Figure 10.1: A summary of school climate in South African schools by school type, 2015 51
Figure 10.2: Percentage of learners attending schools that place emphasis on academic
success by school type, 2015 52
Figure 10.3: Percentage of learners affected based on mathematics and science teachers ‘agree
a lot’ with the statement, 2015 53
Figure 10.4: Percentage of learners attending schools with discipline problems by school type,
2015 54
Figure 10.5: Percentage of learners who were bullied at least once a week by forms of bullying
and school type, 2015 54
Figure 10.6: Percentage of learners who were perpetrators at least once a week by forms of
bullying and school type, 2015 55
Figure 11.1: Percentage of learners taught by mathematics teachers who interacted ‘very often’
by school type, 2015 56
Figure 11.2: Percentage of learners taught by science teachers who interacted ‘very often’
by school type, 2015 57
Figure 11.3: Percentage of learners attending schools that have difficulty filling mathematics
positions by school type, 2015 58
Figure 11.4: Percentage of learners attending schools that have difficulty filling science
positions by school type, 2015 58
Figure 11.5: Percentage of learners attending schools with teacher absenteeism problems
by school type, 2015 59
Figure 11.6: Percentage of learners attending schools where teachers arrive late
by school type, 2015 59
Figure 11.7: Learner absenteeism by school type, 2015 60
Figure 12.1: A conceptual framework for school effectiveness 62
Figure 12.2: The number of learners and schools in TIMSS, 2015 64
Figure 12.3: The ICC for Grade 9 mathematics, 2015 66
6 Understanding mathematics and science achievement amongst Grade 9 learners in South Africa
Page
Table 3.1: Description of TIMSS international benchmarks, 2015 23
Table 4.1: Average achievement by frequency of speaking the test language, 2003, 2011 and 2015 30
Table 4.2: Average achievement by frequency of speaking the test language and school type, 2015 30
Table 6.1: Average achievement by parental education levels, 2003, 2011 and 2015 33
Table 6.2: Average achievement by learner attitudes towards mathematics and science and school
type, 2015 35
Table 7.1: Average achievement by frequency of checking homework by school type, 2015 41
Table 9.1: Average achievement by textbook ownership and school type, 2015 45
Table 9.2: Percentage of learners whose teachers use each resource type, 2003, 2011 and 2015 47
Table 10.1: Percentage of learners taught by mathematics and science teachers who experienced
challenges by school type, 2015 52
Table 12.1: Learner contextual factors and TIMSS mathematics achievement, 2015 66
Table 12.2: School factors and TIMSS mathematics achievement, 2015 68
Table 13.1: Match between TIMSS and South African curriculum and achievement scores by
content and cognitive domains, 2015 71
Table 13.2: Proficiency level descriptors for the South African benchmark exercise, 2015 72
Table 13.3: Cognitive categories per proficiency benchmark for all science content areas, 2015 73
Table 13.4: Science proficiency descriptions, 2015 74
List of tables
Understanding mathematics and science achievement amongst Grade 9 learners in South Africa 7
TIMSS 2015 Grade 9 National Report
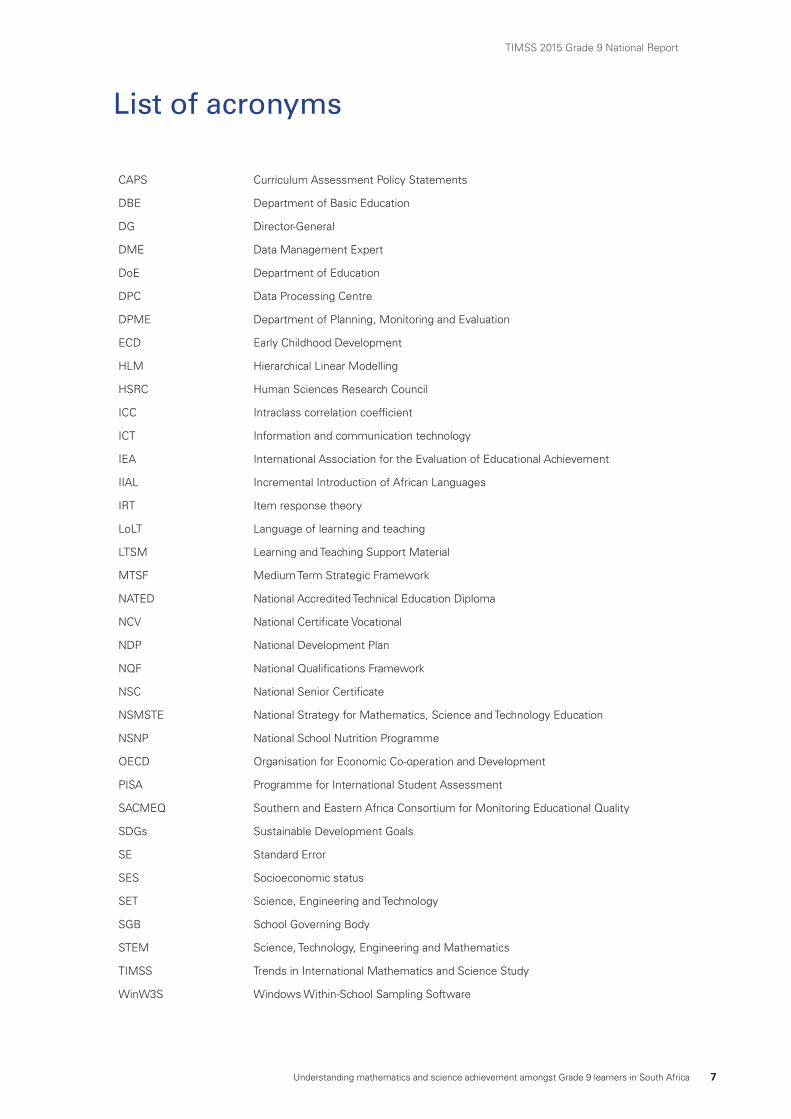
List of acronyms
CAPS Curriculum Assessment Policy Statements
DBE Department of Basic Education
DG Director-General
DME Data Management Expert
DoE Department of Education
DPC Data Processing Centre
DPME Department of Planning, Monitoring and Evaluation
ECD Early Childhood Development
HLM Hierarchical Linear Modelling
HSRC Human Sciences Research Council
ICC Intraclass correlation coefficient
ICT Information and communication technology
IEA International Association for the Evaluation of Educational Achievement
IIAL Incremental Introduction of African Languages
IRT Item response theory
LoLT Language of learning and teaching
LTSM Learning and Teaching Support Material
MTSF Medium Term Strategic Framework
NATED National Accredited Technical Education Diploma
NCV National Certificate Vocational
NDP National Development Plan
NQF National Qualifications Framework
NSC National Senior Certificate
NSMSTE National Strategy for Mathematics, Science and Technology Education
NSNP National School Nutrition Programme
OECD Organisation for Economic Co-operation and Development
PISA Programme for International Student Assessment
SACMEQ Southern and Eastern Africa Consortium for Monitoring Educational Quality
SDGs Sustainable Development Goals
SE Standard Error
SES Socioeconomic status
SET Science, Engineering and Technology
SGB School Governing Body
STEM Science, Technology, Engineering and Mathematics
TIMSS Trends in International Mathematics and Science Study
WinW3S Windows Within-School Sampling Software
8 Understanding mathematics and science achievement amongst Grade 9 learners in South Africa
Executive summary
South Africa has participated in five cycles of the Trends in International Mathematics and Science Study (TIMSS), beginning in 1995. The 2015 TIMSS Grade 9 study was administered in August 2015 by a team of researchers at the Human Sciences Research Council (HSRC) in collaboration with the Department of Basic Education (DBE) and the International Association for the Evaluation of Educational Achievement (IEA). Results of the 2015 TIMSS Grade 9 study are presented in this report. The focus areas for TIMSS are mathematics and science. This report also takes stock of past results in an effort to improve our understanding of what is required to improve academic performance in mathematics and science.
TIMSS follows a two-stage stratified cluster sampling design. The TIMSS 2015 sample was explicitly stratified by province, type of school (public and independent schools) and language of learning and teaching (LoLT) (English, Afrikaans and dual medium). The realised sample included 292 principals, 331 science teachers, 334 mathematics teachers and 12 514 learners. In addition to the learner assessment data, the study also collected contextual information from learners, teachers and school principals, making it possible to explore the factors that are related to Grade 9 mathematics and science achievement.
Three analytical approaches are used in this report in order to maximise the value of the TIMSS study for policy and practice. The first approach is descriptive in nature and provides an overview of achievement in mathematics and science based on where learners live and learn. The second approach is inferential and employs multilevel modelling techniques to explore contextual factors associated with learner achievement. The final approach uses item response theory (IRT) to compare what learners know to what they are expected to know based on the local curriculum. National proficiency benchmarks have been developed that are more closely aligned to the South African educational system. This is the first time that the TIMSS national report has constructed and reported on national proficiency benchmarks based on the TIMSS data. The findings that follow will be summarised based on
the three analytical approaches.
Results of descriptive analysis of trends (2003 to 2015) Between TIMSS 2003 and 2011, the mathematics and science scores improved by 67 and 64 points respectively. Between 2011 and 2015, the mathematics and science scores improved by a further 20 and 26 points respectively. The highest gains were achieved at the lower end of the achievement distribution, which is indicative of reduced inequality. The results also show that when compared to other countries who participated in both the 2003 and 2015 cycles, South Africa has shown the largest change in performance, although it is acknowledged that South Africa started from a very low base.
The number of schools and learners in the TIMSS sample permits reliable estimates of provincial performance. Looking at the provincial results, Gauteng and the Western Cape were the top performing provinces in 2015 and had mean scores above the national average of 372 and 358 in mathematics and science respectively. The Eastern Cape together with North West and Limpopo were the three lowest-achieving provinces. However, Limpopo showed the largest positive change, followed by Gauteng and the Eastern Cape. In 2003 the score difference between the highest- and lowest-performing provinces was 205 points. This provincial gap has narrowed considerably to 77 points in 2015, which is another indication of improved equity in the education system.
As part of the government’s pro-poor strategy to support education, schools in quintiles 1, 2 and 3 receive subsidies that make it possible to exempt learners from paying fees. Thus, public schools are categorised into no-fee (quintiles 1, 2 and 3) and fee-paying schools (quintiles 4 and 5). Of the learners who participated in TIMSS 2015, 65 per cent attended no-fee schools, 31 per cent fee-paying schools and four per cent were from independent schools. The average mathematics and science scores for each of the school types are significantly different, with no-fee schools recording the lowest performance. The results, however, show how the increases in TIMSS scores from 2011 to 2015 play out differently across the different school types, with learners in public schools achieving the largest gains. The achievement scores of learners who attended no-fee schools increased by 17 and 23 points for mathematics and science, respectively. Learners who attended fee-paying schools increased their average scores by 26 and 31 points for mathematics and science, respectively. Learners who attended independent schools increased their scores by 4 and 6 points for mathematics and science, respectively. Average scores in each
school type were still below the TIMSS centre point of 500 in 2015.
Understanding mathematics and science achievement amongst Grade 9 learners in South Africa 9
TIMSS 2015 Grade 9 National ReportEXECU
TIVE SU
MM
ARY
A learner’s background and home environment can influence academic outcomes. Nationally, 51 per cent of learners are the appropriate age for the grade, but the picture looks very different when the results are disaggregated by school type. In 2015, 43 per cent of Grade 9 learners in no-fee schools were age-appropriate compared to the 64 per cent and 73 per cent in fee-paying and independent schools, respectively. Language of learning and teaching (LoLT) is an important and complex aspect of mathematics and science education and the TIMSS results lend further support to the need to understand the role that language plays. Learners whose home language and LoLT are the same achieved higher mathematics and science scores than learners whose home language and LoLT differ. These gaps were wider for science because the curriculum relies more on reading and writing in science than in mathematics, where problem solving can be expressed in non-written formats.
There have been steady improvements in learner access to basic amenities but the gap in home resources between learners in the no-fee and fee-paying components of the education system remains wide. Ninety-four per cent of learners in independent schools had access to water-flush toilets at home in 2015 compared to 90 per cent of learners in fee-paying schools and only 44 per cent of learners in no-fee schools. Responses to questions about attitudes towards mathematics and science showed that learners attached a higher value to mathematics than to science, but confidence levels were low in both subjects. Only 10 per cent of Grade 9 learners expressed high levels of confidence in mathematics and science, and there was a decline in confidence levels between 2011 and 2015.
The report also looked at the support for learning that is available outside of school and included analysis of how often learners received homework, how often parents checked homework and whether parents were able to assist learners with homework. Learners who attended public schools received mathematics and science homework more often than learners attending independent schools. Learners received mathematics homework more often than science homework. Sixty-eight per cent of learners received mathematics homework every day compared to 23 per cent who received science homework. A higher percentage of learners in no-fee schools felt that their parents had difficulty assisting them with homework as a result of either the complexity of the homework or the language used to present the homework.
The report also focused on the schooling environment in terms of how school resources and school climate are related to performance. Access to adequate resources is of course necessary for teaching and learning, but the results showed that the school climate played a crucial role. In no-fee schools, a higher percentage of learners were exposed to a lower emphasis on academic success, teachers who were less satisfied with their jobs and principals who reported more widespread discipline and safety problems. It is also within these schools that being bullied was more common. Bullying was also prevalent in fee-paying and independent schools but the rates were considerably lower. Grade 9 learners in the South African study were also asked how often they were instigators of bullying. National results showed that at least 25 per cent of learners were perpetrators of different forms of bullying on a weekly basis. Filling teacher vacancies for both subjects was more difficult in no-fee schools than in fee-paying and independent schools. Thirty-one per cent of learners attended no-fee schools where it was difficult to fill mathematics vacancies compared to 16 per cent of learners in fee-paying schools and only three per cent of learners in independent schools. Schools faced similar challenges in filling science vacancies although it was more
difficult to fill science vacancies than mathematics vacancies in independent schools.
There have been steady improvements in learner access to basic amenities but the gap in home resources between learners in the no-fee and fee-paying components of the education system remains wide.
10 Understanding mathematics and science achievement amongst Grade 9 learners in South Africa
Results of school effectiveness analysisThe second analytical approach that was used in this report was inferential in nature. It was concerned with
why and how school characteristics are associated with mathematics achievement. Because of the nested or
hierarchical nature of TIMSS data (Grade 9 learners within schools) and the nature of the research questions, a
multilevel analytical approach was used. The benefit of this type of analysis is that it is possible to take into account
learner background factors and isolate which school characteristics are associated with achievement. This type of
inquiry also falls within a broader category of educational research called school effectiveness studies.
The ideal situation is for school quality to be high and for the differences between schools to be minimal. The
2015 results of the multilevel analysis showed that 61 per cent of the total variation in Grade 9 mathematics
performance occurred between schools, which was an improvement from 64 per cent reported in TIMSS 2011.
Although achievement differences between schools in developing countries can be large, the results for South
Africa point to a particularly high level of inequality across schools in the education system. Schools with more
resources to draw upon and better facilities devoted to education were at an advantage but the climate of learning
played a unique and significant role in TIMSS Grade 9 achievement that went beyond access to resources. Because
the analyses made use of cross-sectional data the ability to draw strong causal inferences was limited.
Results of item analysisThis section described science achievement for Grade 9 learners using mean scores for the different content areas
tested in TIMSS. National benchmarks and performance level descriptors were derived from a Rasch analysis of the
South African science results. This process provided information about what South African learners know and can
do at different points on the achievement scale. The descriptions of what learners can do in the different proficiency
bands can help curriculum planners in designing appropriate interventions. Although the science results were
used to demonstrate this method in this report, a full report containing both mathematics and science analyses is
available separately. The TIMSS achievement instrument is designed to respond to the curricula of 39 countries.
Further analysis showed that there is a high level of overlap with the South African Curriculum Assessment Policy
Statements (CAPS), with 91 per cent of topic overlap and 81 per cent of item overlap. Compared to the overall
average, performance was higher in the chemistry section and lower in the earth science section. Unlike their
international counterparts, South African learners scored far lower than the overall average in knowledge items.
Key findings1. The value in participating in international assessments is increased when the results are used for
understanding national conditions. South Africa’s participation in TIMSS over the last twenty years
has enriched our understanding of learner performance and how the country is ranked relative to other
Executive summary
Schools with more resources to draw upon and better facilities devoted to education were at an advantage but the climate of learning played a unique and significant role in TIMSS Grade 9 achievement that went beyond access to resources. Because the analyses made use of cross-sectional data the ability to draw strong causal inferences was limited.
Understanding mathematics and science achievement amongst Grade 9 learners in South Africa 11
TIMSS 2015 Grade 9 National ReportEXECU
TIVE SU
MM
ARYeducation systems around the world. Raising performance standards can improve a country’s economic
competitiveness; the global perspective is therefore an important one. South Africa’s membership in the
TIMSS community has also helped to develop the capacity of local researchers and increased the technical
rigour of our large-scale assessments. The global perspective was supplemented by a national one. The
South African analysis included the identification of a group of potential learners. These are learners who are
close to the minimum competency benchmarks as defined by TIMSS. Additional Rasch analysis of the South
African results can better inform policy makers about what mathematics and science skills Grade 9 learners
have acquired.
2. South African mathematics and science achievement scores have improved from a ‘very low’ (1995, 1999, 2003) to a ‘low’ (2011, 2015) national average. South Africa is still one of the lower-performing countries in
mathematics and science in comparison to other TIMSS participating countries. However, from 2003 to 2015
the country has shown the biggest positive improvement of all participating countries in both mathematics
(by 90 points) and science (by 87 points), which is equivalent to an improvement in achievement by two
grade levels. Average performance in the public school system and among historically weaker provinces
has clearly improved, but most Grade 9 learners are yet to achieve a minimum level of competency in
mathematics and science, based on the TIMSS international perspective.
3. South African achievement continues to remain highly unequal but there has been a slight decline in inequality between schools over time. Like other low-performing countries, only one-third of South African
learners achieved a mathematics and science score above the benchmark of 400 points, a score denoting
the minimum level of competence. When the achievement scores are broken down by school type, the
patterns reveal vast inequalities. Approximately 80 per cent of learners attending independent schools,
60 per cent of learners at fee-paying and 20 per cent of learners at no-fee schools achieved mathematics
scores above the minimum level of competency. Within this unequal performance, it is also worth noting
that 3.2 per cent of South African mathematics learners and 4.9 per cent of science learners achieved
mathematics and science scores at the high level of achievement (above 550 points).
4. Almost half the Grade 9 learners in the school system are over-age. The pattern is different based on school
types, with 43 per cent of learners in no-fee schools, 64 per cent in fee-paying and 73 per cent in independent
schools at the appropriate age. The achievement scores of over-age learners are much lower than those of
age-grade appropriate learners, suggesting that simply spending an extra year in a grade is not leading to
more learning. For grade repetition to lead to improved learning outcomes, repeat learners must receive
extra learning support. This must start at the foundation phase, otherwise the performance levels will widen
as learners progress through the education system.
5. The importance of LoLT for mathematics and science goes further than previously considered in TIMSS. The
influence of language was evident throughout this study. The national benchmarking exercise emphasised
that language skills were important for answering any item on the test regardless of the level of difficulty. At
home, parents who were not fluent in the language of instruction struggled to provide homework support for
their children. At school, less fluency in the language of the test (either English or Afrikaans) was related to
lower test scores. Learners who spoke the language of the test more frequently, achieved better results and
this was over and above the effect of socioeconomic status (SES). This implies that all learners, regardless of
their SES, are disadvantaged by lack of language fluency. Moreover, fluency in the LoLT does not guarantee
academic success. The language of mathematics and science in the classroom may present a completely
different set of challenges if words that learners are familiar with take on a different meaning in the classroom
context. Addressing the role of language is not easy nor is it quick. The goal is not to make learners more
capable in the use of language simply for testing purposes but to ensure that they are better equipped to
understand the nuances of the materials covered in mathematics and science.
12 Understanding mathematics and science achievement amongst Grade 9 learners in South Africa
6. Resources matter but educational success goes beyond improving resource access. There has been some
improvement in terms of equalising home access to running tap water, water-flush toilets and electricity but
learners from no-fee schools had the most limited access to home resources, with access to technology
remaining exclusive to wealthier learners. The evidence on school resources was both heartening and
disappointing. It was encouraging that physical resources had an independent and positive association with
average school achievement as this means that policies that have worked to improve access to school
resources can continue to play a positive role in improving educational quality. However, narrowing the
achievement gap between no-fee, fee-paying and independent schools is not as simple as just improving
resource access. Forty per cent of learners in fee-paying schools and 20 per cent of learners in independent
schools failed to meet the minimum level of competency set by TIMSS. Maintaining the momentum around
resource accessibility and efficient utility must continue but that this is only part of the solution for improving
performance and equity between schools. Human resource challenges were greater in public schools and it
was more difficult to fill vacancies in these environments. Strategies to recruit and retain the best subject-
specific teaching professionals into public schools needs to continue.
7. The climate of the school counts. Schools with a healthier school climate (emphasis on academic success,
safety and order, fewer disciplinary problems, fewer incidences of bullying and fewer challenges faced by
teachers) had higher average achievement scores. A significant part of the achievement gaps between
no-fee, fee-paying and independent schools was explained by the type of climate in the school. Also worth
noting was that many different dimensions of school climate made a difference. In as much as improving
school climate needs to be prioritised, a broad view needs to be adopted when studying the climate of the
school. The goal should be to understand how the organisational and professional conditions of the school
can support learning. Because the climate of the school will reflect the climate of the community in which it
is based, a healthy school climate requires the input and support of school management and the community
at large.
8. Greater expectations endure in spite of the academic difficulties faced by many learners. While some
learners from no-fee schools did not plan to further their education beyond secondary school, there was a
high percentage of learners with a low socioeconomic profile who aspired to obtaining an advanced degree.
Learners from public schools were also more likely to attend extra lessons, either to excel in class or keep
up in class. Further research is needed to understand how extra lessons fit into teaching and learning. It
is unclear whether learners attended extra lessons by choice, and whether these lessons were paid for
or offered as a service by the community. Because learner support programmes may take many different
forms, it is crucial that their quality be regulated and that, wherever possible, learners receive support from
accredited organisations. Some would suggest that ambitions for further study are unrealistic, given the
many hurdles that these learners will face just to complete secondary school. We take a different view.
We would like to believe that an enduring faith in the transformative power of education remains. It is the
responsibility of educational leaders to ensure that these hopes are fulfilled.
9. Continued analyses using local benchmarks should be encouraged to more effectively inform curriculum reform. We identified 35 per cent of mathematics learners and 28 per cent of science learners in the group
of potential learners (scoring between 325 and 400 TIMSS points). With a greater investment, especially
in no-fee schools, this group could improve their scores to over 400. The Rasch analysis created national
proficiency benchmarks based on South Africa’s learner performance. This provided a better sense of the
specific competency levels that exist in South Africa and what learners knew relative to the local curriculum
requirements. Most importantly, this process revealed in practical terms what teachers needed to cover to
help learners move from one benchmark to another. Policy makers, researchers and practitioners would do
well to build on this exercise so that local and international assessments can be better integrated. This is
not an easy undertaking, but building the links between local and international studies is crucial for future
monitoring purposes.
Executive summary
PAR
TAAPART
MATHEMATICS AND SCIENCE ACHIEVEMENT IN SOUTH AFRICA
Understanding mathematics and science achievement amongst Grade 9 learners in South Africa 13
TIMSS 2015 Grade 9 National Report
14 Understanding mathematics and science achievement amongst Grade 9 learners in South Africa
1. IntroductionTIMSS assesses the quality of mathematics and science education globally. This report presents the findings of
the TIMSS 2015 for South Africa with a particular focus on the Grade 9 results. A separate report will discuss the
Grade 5 study, which was conducted for the first time in South Africa in 2015. TIMSS is one of the most established
studies of educational quality worldwide, providing information on learners and the schooling environment and
how these characteristics relate to achievement in mathematics and science. South Africa has taken part in TIMSS
since 19951. The purpose of this introduction is to explain the role that international assessments play in educational
planning. We will also discuss why mathematics and science education are so important in South Africa’s present
context before presenting the analytical approach that is used in the remainder of the report.
Apartheid education was devastating for black South Africans. Twenty years ago, efforts to reform the curriculum
were a priority. Because the quality of education available to African learners was kept deliberately low, it made
sense to ensure that all learners had strong foundations in mathematics and science. It was understood that
building from this low base would take time; recent indications are that progress has been made but much more
needs to be achieved. At the low end of performance, the percentage of learners achieving above a minimum
threshold has slowly risen, but overall performance is still low. At the upper reaches, less than two per cent of
South African learners achieve results that are comparable with the highest achievers internationally. This is in spite
of access to world-class facilities in some of South Africa’s wealthier schools.
One of the major challenges facing the South African education system during the past two decades has been
how to raise educational standards while closing gaps in student achievement between historically privileged
and disadvantaged groups. Progress has been tracked through local and international assessments. The
perspective of the two is quite different. Schools, district, provincial and national departments collect information
periodically to check that children in different learning environments are reaching a locally based definition of
proficient performance. International assessments, like TIMSS, tend to focus on the strengths and weaknesses
of education systems as a whole and to monitor changes over time. Global education rankings have become
a popular by-product of international assessments. At times a fixation about which countries are at the
top and the tail of the league tables has distracted policy makers from evaluating the successes and challenges
of individual systems. Moreover, we have often overlooked how the local and international perspectives can
complement one another for maximum benefit to policy makers.
There are many valid explanations for why educational quality has not improved more rapidly across the board.
Most can be summarised by the following observations: improvements in access to education have not been
matched by improvements in quality. Learners come from different home environments and attend schools of
varying quality. Learners with fewer socioeconomic resources attend the least-resourced schools and these
schools also face organisational challenges. These factors jointly influence the quality of learner outcomes and
make it difficult for many learners to achieve even minimum levels of proficiency.
In spite of the past, or perhaps because of it, there is a pressing need to shift the focus away from minimum
proficiency and towards raising academic standards in a systematic way. To be sure, a basic understanding of the
curriculum remains an important reference point given the country’s educational history; but without greater clarity
about how to achieve substantial improvements, quality remains low and inequalities persist.
Mathematics and science achievement in South Africa
1 South Africa has participated in TIMSS 1995, 1999, 2003, 2011 and 2015.
Understanding mathematics and science achievement amongst Grade 9 learners in South Africa 15
TIMSS 2015 Grade 9 National Report
PAR
TA
2 A three-year qualification that is offered at levels 2, 3 and 4 of the National Qualifications Framework (NQF). It is equivalent to Grades 10, 11 and 12.
3 National Accredited Technical Education Diploma (NATED) programmes that consist of a combination of theoretical study and practical workplace experience.
4 The National Senior Certificate (NSC) is South Africa’s secondary school-leaving examination.
1.1. Why mathematics and science are so important in the South African context
Training in mathematics and science is increasingly rewarded in the world of work (CHEC, 2013; Mouton, Boshoff,
James & Treptow, 2010; Reddy, Bhorat, Powell, Visser & Arends, 2016b) as the demand for low-skilled labour is
rapidly declining (Banerjee, Galiani, Levinsohn, McLaren & Woolard, 2009). High performance standards can also
improve the country’s global competitiveness (Hanushek & Woessmann, 2015). While we recognise that some
learners have a greater innate ability to learn mathematics and science, we also maintain that all learners can
benefit from learning these subjects to the best of their ability (PISA, 2016). Exposure to mathematics and science
has significant benefits beyond employment opportunities. Mathematics and science improve critical thinking,
refine problem-solving abilities and develop abstract reasoning.
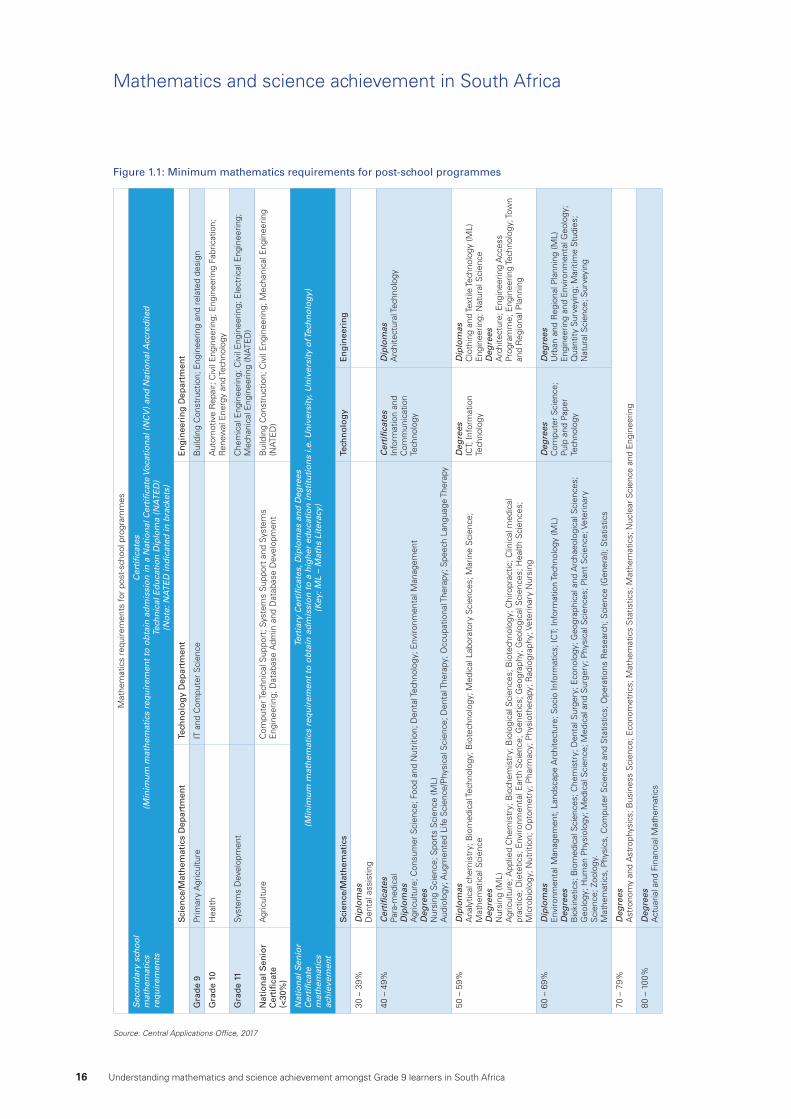
A decision about whether to study mathematics and science, and to what level, will have a long-term effect
on a learner’s life. This makes it all the more important to develop the talents of every learner in these subject
areas, regardless of background. To illustrate the extent to which proficiency in mathematics determines future
career choices, Figure 1.1 summarises the minimum mathematics entry requirements for entry into a range of
science, technology, engineering and mathematics (STEM) degree and diploma programmes offered at South
African institutions. The figure summarises the secondary school mathematics requirements to obtain a National
Certificate Vocational (NCV)2 and National Accredited Technical Education Diploma (NATED)3. Also shown are
National Senior Certificate (NSC)4 mathematics results required for admission to tertiary certificates, diplomas and
degrees. Many certificates, diplomas and degrees at universities and universities of technology require learners to
pass mathematics with marks ranging from 30 per cent to 70 per cent, with some degrees needing higher pass
rates in mathematics. This list includes interdisciplinary subjects such as agriculture, business science, nursing
and architecture that are not traditionally viewed as STEM careers. The point here is that learners should be given
the opportunity to develop to their full academic potential, particularly in gatekeeper subjects like mathematics
and science.
One of the major challenges facing the South African education system during the past two decades has been how to raise educational standards while closing gaps in student achievement between historically privileged and disadvantaged groups.
16 Understanding mathematics and science achievement amongst Grade 9 learners in South Africa
Mathematics and science achievement in South Africa
Figure 1.1: Minimum mathematics requirements for post-school programmes
Source: Central Applications Office, 2017
Mat
hem
atic
s re
quire
men
ts fo
r po
st-s
choo
l pro
gram
mes
Sec
on
dar
y sc
ho
ol
mat
hem
atic
s re
qu
irem
ents
Cer
tifi
cate
s(M
inim
um
mat
hem
atic
s re
qu
irem
ent
to o
bta
in a
dm
issi
on
in a
Nat
ion
al C
erti
fica
te V
oca
tio
nal
(N
CV
) an
d N
atio
nal
Acc
red
ited
Te
chn
ical
Ed
uca
tio
n D
iplo
ma
(NA
TE
D)
(No
te: N
AT
ED
ind
icat
ed in
bra
cket
s)
Sci
ence
/Mat
hem
atic
s D
epar
tmen
tTe
chn
olo
gy
Dep
artm
ent
En
gin
eeri
ng
Dep
artm
ent
Gra
de
9Pr
imar
y A
gric
ultu
reIT
and
Com
pute
r S
cien
ceB
uild
ing
Con
stru
ctio
n; E
ngin
eerin
g an
d re
late
d de
sign
Gra
de
10H
ealth
Aut
omot
ive
Rep
air;
Civ
il E
ngin
eerin
g; E
ngin
eerin
g Fa
bric
atio
n;
Ren
ewal
Ene
rgy
and
Tech
nolo
gy
Gra
de
11Sy
stem
s D
evel
opm
ent
Che
mic
al E
ngin
eerin
g; C
ivil
Eng
inee
ring;
Ele
ctric
al E
ngin
eerin
g;
Mec
hani
cal E
ngin
eerin
g (N
ATE
D)
Nat
ion
al S
enio
r C
erti
fica
te(<
30%
)
Agr
icul
ture
Com
pute
r Tec
hnic
al S
uppo
rt; S
yste
ms
Sup
port
and
Sys
tem
s E
ngin
eerin
g; D
atab
ase
Adm
in a
nd D
atab
ase
Dev
elop
men
tB
uild
ing
Con
stru
ctio
n; C
ivil
Eng
inee
ring;
Mec
hani
cal E
ngin
eerin
g (N
ATE
D)
Nat
ion
al S
enio
r C
erti
fica
te
mat
hem
atic
s ac
hie
vem
ent
Tert
iary
Cer
tifi
cate
s, D
iplo
mas
an
d D
egre
es(M
inim
um
mat
hem
atic
s re
qu
irem
ent
to o
bta
in a
dm
issi
on
to
a h
igh
er e
du
cati
on
inst
itu
tio
ns
i.e. U
niv
ersi
ty, U
niv
ersi
ty o
f Tec
hn
olo
gy)
(K
ey: M
L –
Mat
hs
Lite
racy
)
Sci
ence
/Mat
hem
atic
sTe
chn
olo
gy
En
gin
eeri
ng
30 –
39%
Dip
lom
asD
enta
l ass
istin
g
40 –
49%
Cer
tifi
cate
sPa
ra-m
edic
alD
iplo
mas
Agr
icul
ture
; Con
sum
er S
cien
ce; F
ood
and
Nut
ritio
n; D
enta
l Tec
hnol
ogy;
Env
ironm
enta
l Man
agem
ent
Deg
rees
Nur
sing
Sci
ence
; Spo
rts
Sci
ence
(ML)
Aud
iolo
gy; A
ugm
ente
d Li
fe S
cien
ce/P
hysi
cal S
cien
ce; D
enta
l The
rapy
; Occ
upat
iona
l The
rapy
; Spe
ech
Lang
uage
The
rapy
Cer
tifi
cate
sIn
form
atio
n an
d C
omm
unic
atio
n Te
chno
logy
Dip
lom
asA
rchi
tect
ural
Tech
nolo
gy
50 –
59%
Dip
lom
asA
naly
tical
che
mis
try;
Bio
med
ical
Tech
nolo
gy; B
iote
chno
logy
; Med
ical
Lab
orat
ory
Sci
ence
s; M
arin
e S
cien
ce;
Mat
hem
atic
al S
cien
ceD
egre
esN
ursi
ng (M
L)A
gric
ultu
re; A
pplie
d C
hem
istr
y; B
ioch
emis
try;
Bio
logi
cal S
cien
ces;
Bio
tech
nolo
gy; C
hiro
prac
tic; C
linic
al m
edic
al
prac
tice;
Die
tetic
s; E
nviro
nmen
tal E
arth
Sci
ence
; Gen
etic
s; G
eogr
aphy
; Geo
logi
cal S
cien
ces;
Hea
lth S
cien
ces;
M
icro
biol
ogy;
Nut
ritio
n; O
ptom
etry
; Pha
rmac
y; P
hysi
othe
rapy
; Rad
iogr
aphy
; Vet
erin
ary
Nur
sing
Deg
rees
ICT;
Info
rmat
ion
Tech
nolo
gy
Dip
lom
asC
loth
ing
and
Text
ile Te
chno
logy
(ML)
Eng
inee
ring;
Nat
ural
Sci
ence
Deg
rees
Arc
hite
ctur
e; E
ngin
eerin
g A
cces
s Pr
ogra
mm
e; E
ngin
eerin
g Te
chno
logy
; Tow
n an
d R
egio
nal P
lann
ing
60 –
69%
Dip
lom
asE
nviro
nmen
tal M
anag
emen
t; L
ands
cape
Arc
hite
ctur
e; S
ocio
Info
rmat
ics;
ICT;
Info
rmat
ion
Tech
nolo
gy (M
L)D
egre
esB
ioki
netic
s; B
iom
edic
al S
cien
ces;
Che
mis
try;
Den
tal S
urge
ry; E
cono
logy
; Geo
grap
hica
l and
Arc
haeo
logi
cal S
cien
ces;
G
eolo
gy; H
uman
Phy
siol
ogy;
Med
ical
Sci
ence
; Med
ical
and
Sur
gery
; Phy
sica
l Sci
ence
s; P
lant
Sci
ence
; Vet
erin
ary
Sci
ence
; Zoo
logy
.M
athe
mat
ics,
Phy
sics
, Com
pute
r S
cien
ce a
nd S
tatis
tics;
Ope
ratio
ns R
esea
rch;
Sci
ence
(Gen
eral
); S
tatis
tics
Deg
rees
Com
pute
r S
cien
ce;
Pulp
and
Pap
er
Tech
nolo
gy
Deg
rees
Urb
an a
nd R
egio
nal P
lann
ing
(ML)
Eng
inee
ring
and
Env
ironm
enta
l Geo
logy
; Q
uant
ity S
urve
ying
; Mar
itim
e S
tudi
es;
Nat
ural
Sci
ence
; Sur
veyi
ng
70 –
79%
Deg
rees
Ast
rono
my
and
Ast
roph
ysic
s; B
usin
ess
Sci
ence
; Eco
nom
etric
s; M
athe
mat
ics
Sta
tistic
s; M
athe
mat
ics;
Nuc
lear
Sci
ence
and
Eng
inee
ring
80 –
100
%D
egre
esA
ctua
rial a
nd F
inan
cial
Mat
hem
atic
s
TIMSS 2015 Grade 9 National Report
PAR
TA PAR
TA
Understanding Mathematics and Science Achievement of Grade 9 South African Learners 17
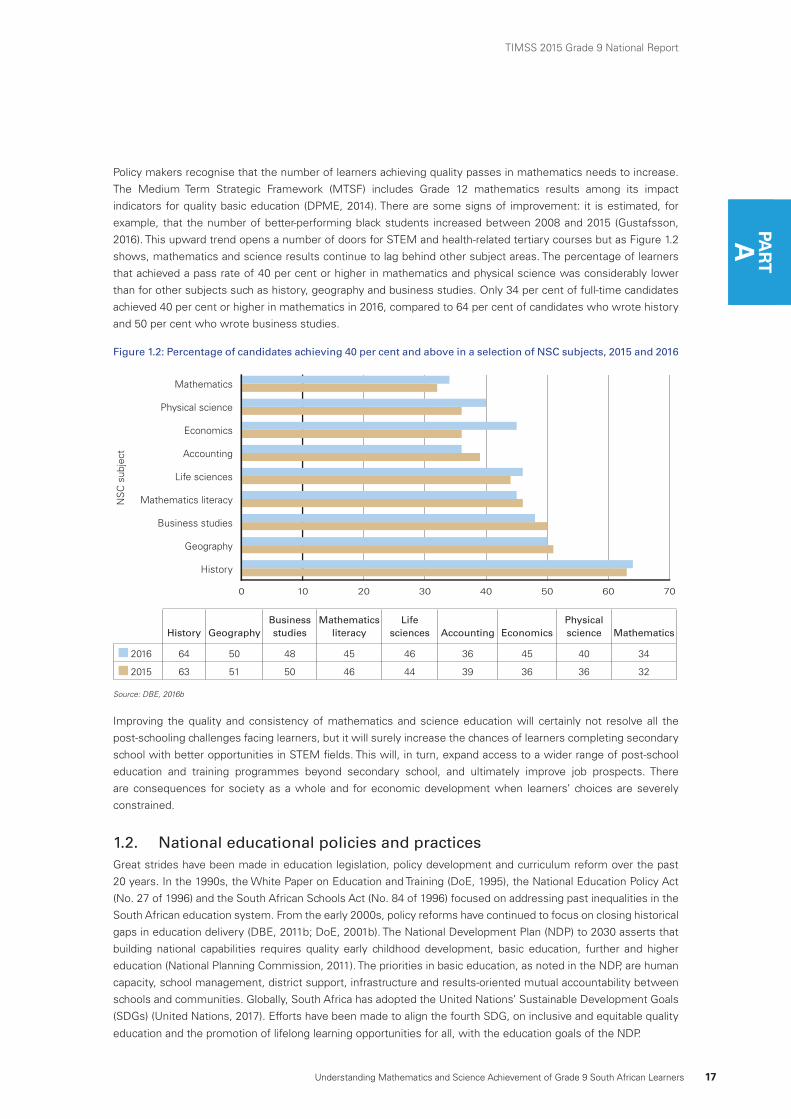
Policy makers recognise that the number of learners achieving quality passes in mathematics needs to increase.
The Medium Term Strategic Framework (MTSF) includes Grade 12 mathematics results among its impact
indicators for quality basic education (DPME, 2014). There are some signs of improvement: it is estimated, for
example, that the number of better-performing black students increased between 2008 and 2015 (Gustafsson,
2016). This upward trend opens a number of doors for STEM and health-related tertiary courses but as Figure 1.2
shows, mathematics and science results continue to lag behind other subject areas. The percentage of learners
that achieved a pass rate of 40 per cent or higher in mathematics and physical science was considerably lower
than for other subjects such as history, geography and business studies. Only 34 per cent of full-time candidates
achieved 40 per cent or higher in mathematics in 2016, compared to 64 per cent of candidates who wrote history
and 50 per cent who wrote business studies.
Figure 1.2: Percentage of candidates achieving 40 per cent and above in a selection of NSC subjects, 2015 and 2016
0 10 20 30 40 50 60 70
Mathematics
Physical science
Economics
Accounting
Life sciences
Mathematics literacy
Business studies
Geography
History
NS
C s
ubje
ct
History GeographyBusiness studies
Mathematics literacy
Lifesciences Accounting Economics
Physical science Mathematics
2016 64 50 48 45 46 36 45 40 34
2015 63 51 50 46 44 39 36 36 32
Source: DBE, 2016b
Improving the quality and consistency of mathematics and science education will certainly not resolve all the
post-schooling challenges facing learners, but it will surely increase the chances of learners completing secondary
school with better opportunities in STEM fields. This will, in turn, expand access to a wider range of post-school
education and training programmes beyond secondary school, and ultimately improve job prospects. There
are consequences for society as a whole and for economic development when learners’ choices are severely
constrained.
1.2. National educational policies and practices Great strides have been made in education legislation, policy development and curriculum reform over the past
20 years. In the 1990s, the White Paper on Education and Training (DoE, 1995), the National Education Policy Act
(No. 27 of 1996) and the South African Schools Act (No. 84 of 1996) focused on addressing past inequalities in the
South African education system. From the early 2000s, policy reforms have continued to focus on closing historical
gaps in education delivery (DBE, 2011b; DoE, 2001b). The National Development Plan (NDP) to 2030 asserts that
building national capabilities requires quality early childhood development, basic education, further and higher
education (National Planning Commission, 2011). The priorities in basic education, as noted in the NDP, are human
capacity, school management, district support, infrastructure and results-oriented mutual accountability between
schools and communities. Globally, South Africa has adopted the United Nations’ Sustainable Development Goals
(SDGs) (United Nations, 2017). Efforts have been made to align the fourth SDG, on inclusive and equitable quality
education and the promotion of lifelong learning opportunities for all, with the education goals of the NDP.
18 Understanding mathematics and science achievement amongst Grade 9 learners in South Africa
Mathematics and science achievement in South Africa
Certain policies, such as the National Strategy for Mathematics, Science and Technology Education (NSMSTE),
have specifically targeted improvements in mathematics, science and technology education (DoE, 2001a). National
policies have sometimes referred to pass rates in mathematics and science and to South Africa’s performance
in international assessments (DPME, 2014). The TIMSS results are mentioned in the Action Plan to 2014, with a
target set at 420 average score points in TIMSS mathematics by 2023 (DBE, 2011a). Below, we provide a brief
synopsis of policies and structures that are most relevant to the framework of this report.
Gender
The purpose of the Gender Equity unit within the DBE is to advise the Director-General (DG) on different aspects
of gender equity in the education system. Advice to the DG includes: the correction of gender imbalances in
enrolment, dropouts, subject choice, career paths and performance; guidelines to address sexism in curricula,
textbooks, teaching and guidance; and a strategy to counter and eliminate sexism, sexual harassment and gender
violence throughout the education system (Commission for Gender Equality, 2007; DBE, 2017a).
Language of learning and teaching (LoLT)
South African policy documents state that learners have the right to education in their home language, but the
school language policy is determined by the School Governing Body (SGB) of the school (Basic Education Laws
Amendment Act [No. 15 of 2011]; South African Constitution, 1998). When the home and teaching language are
not the same, then the academic development of learners can be affected. The Incremental Introduction of African
Languages (IIAL) policy is intended to promote and develop the use of previously marginalised African languages
in schools so that learners can access languages other than English and Afrikaans (DBE, 2013b). The IIAL policy will
be introduced in phases, commencing in Grade 1 in 2015 and continuing until 2026 when it will be implemented
in Grade 12.
Learning and teaching support material (LTSM)
The Draft National Policy for the Provision and Management of Learning and Teaching Support Material (LTSM)
provides guidelines for the development, selection, procurement and utilisation of quality LTSM, which includes
stationery and supplies, learning material, teaching aids and science, technology, mathematics and biology
apparatus (DBE, 2014). Every learner and teacher should have access to the minimum set of core materials
required to implement the curriculum. Textbooks, workbooks and teacher guides are considered as core LTSMs
because they are considered essential for covering the curriculum as stated in the Action Plan to 2019, Goal 19
(DBE, 2015a).
School infrastructure
Perhaps the most obvious forms of inequality are those that relate to infrastructure, basic services, equipment
and furniture. In addressing these discrepancies, the DBE published the National Policy for an Equitable Provision
of an Enabling School Physical Teaching and Learning Environment (DBE, 2010); Guidelines Relating to Planning
for Public School Infrastructure (DBE, 2012a); and the School Infrastructure Safety and Security Guidelines
(DBE, 2017b). Based on the Guidelines Relating to Planning for Public School Infrastructure, the environment of
a school is graded according to: basic safety, minimum functionality, optimum functionality, and enrichment. The
DBE established the Accelerated Schools Infrastructure Development Initiative, which is a programme to build
schools across the country, with a large focus on addressing backlogs in school infrastructure and providing basic
services to schools.
Understanding mathematics and science achievement amongst Grade 9 learners in South Africa 19
TIMSS 2015 Grade 9 National Report
PAR
TA
Libraries and information services
It is crucial to provide access to credible and high-quality library and information services in support of curriculum
implementation. The DBE therefore developed the National Guidelines for School Library and Information Services
in 2012 (DBE, 2012b). The School Library and Information Services at the provincial Departments of Education are
expected to collaborate with the DBE for guidance and support regarding infrastructure, staffing, information and
communications technology (ICT) usage, basic library management and budgeting, including advice on using a
percentage of the LTSM budget for library resources based on the schools’ needs. The DBE proposes a wide range
of alternatives in providing library and information services, which includes the provision of classroom libraries,
cluster, mobile and school community libraries, to a fully-fledged library and information service in all schools
(DBE, 2012b).
School safety, bullying, violence
School violence affects all schools, irrespective of location, and therefore all schools are required to develop a
school safety policy, with plans and data collection tools to enable them to proactively deal with and better manage
threats to school safety (GDE, 2012). The DBE developed a National School Safety Framework to serve as a
management tool for provincial and district officials responsible for school safety, principals, senior management
team members, SGB members, teachers and learners to identify and manage risk and threats of violence in
and around schools, including cyber bullying. The framework is critical to empowering all responsible officials in
understanding their responsibilities regarding school safety (DBE, 2015c).
The DBE has furthermore developed a national strategy for the prevention and management of alcohol and drug
use among learners in schools; and schools have been provided with a Guide to Drug Testing in South African
Schools (DBE, 2013a). In terms of the Regulations for Safety Measures at all Public Schools in the South African
Schools Act, the Minister has declared all public schools as drug-free and dangerous weapon-free zones. The DBE
has proposed plans to address violence in schools that are intended to train teachers to deal with aggression in the
classroom, strengthen relationships between schools and communities and hold school management accountable
(DBE, 2015d).
2. Analytical approachA considerable amount of thought and effort has gone into resourcing schools, training teachers and improving
school leadership in South African schools. However, the impact of interventions and policies has varied. Previous
TIMSS reports have confirmed that improvements in mathematics and science outcomes have occurred and
achievement gaps have to some extent narrowed. Nonetheless, educational inputs and outputs still remain highly
unequal across South African schools (Reddy, Kanjee, Diedericks & Winnaar, 2006; Reddy et al., 2015). Based on
the TIMSS international benchmarks, the majority of South African learners were yet to achieve a minimum level of
competency as defined by the international component of the study (Mullis, Martin, Foy & Hooper, 2016).
There is another way to look at these results. TIMSS 2015 is the fifth time that South Africa has participated
in the Grade 9 study. The current report provides an opportunity to take stock of past results and to reframe
our understanding of what is required to raise academic standards. This report builds on the successful use
of international studies by using the results to inform local realities in 2015. While rankings and standards will
continue to add value to the policy discussion, the complexity of South African learning environments requires
thinking differently about these results.
20 Understanding mathematics and science achievement amongst Grade 9 learners in South Africa
To maximise the benefit of the TIMSS study for policy makers and practitioners, three approaches will be used
to present the 2015 results for South Africa in this report. The first is descriptive. Parts A, B, C and D provide an
overview of performance based on where learners lived and learned. This is the traditional approach that we have
used in previous reports and it continues to provide valuable insights. We compare mean scores and percentiles
among different groups of learners and schooling environments. We also discuss interesting and important
developments in non-cognitive factors that are related to achievement, such as learner aspirations, exposure to
bullying and the level of academic support outside of school.
Using the data to full potential relies on an understanding of learning conditions within South Africa. One of
the innovations of this report is that we include two additional methodological approaches to improve our
understanding of what these results mean locally. The second methodological approach is inferential. In Part E, we
use multilevel analysis to investigate which combination of factors is associated with TIMSS learner achievement.
This requires an analysis of learner characteristics alongside enabling inputs within the school. The third approach
is psychometric and is discussed in Part F. National proficiency benchmarks have been developed that are more
closely aligned to the South African educational context. IRT is used to compare what learners know to what they
are expected to know based on the local curriculum. The process also describes what is needed for learners to
reach the next level of proficiency. This new direction will deepen our interpretation of the TIMSS results and what
is realistically required for learners to make incremental progress in these crucial subject areas. We present both
the mathematics and science results in the descriptive discussions. However, we focus on one of the two subjects
in discussing the psychometric and multilevel results and refer readers to full-length reports for additional details.
We demonstrate the psychometric approach to developing national benchmarks using the science results and
multilevel analysis is based on the mathematics results.
Many South African learners face serious obstacles to learning mathematics and science and the causes are
complex. Including a local interpretation of the data in our presentation of the 2015 study permits clearer policy
interpretations of how to support specific groups of learners, their teachers and their educational environments.
As we will show in this report, poor performance is related to the school, to the learners themselves and to their
out-of-school environment. Whatever the root cause, the impact is clear at every educational phase and as young
adults transition from school into the workplace. All too often, South African learners face diverging destinies.
The key predictor of academic success, particularly in technical subjects, remains where learners happen to live
and learn. It is hoped that this report will provide insights that will shift the current path and help to generate new
pathways to support higher achievement.
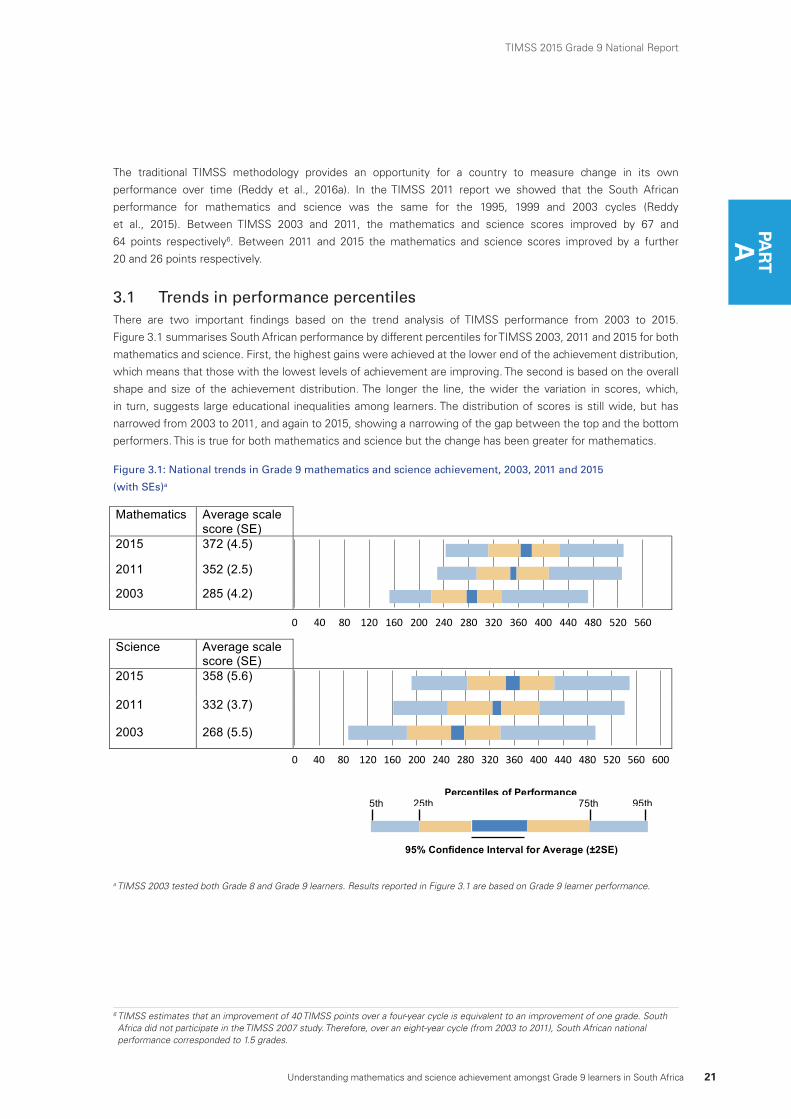
3. Trends in TIMSS results5 The TIMSS 2015 sample for South Africa was drawn from the 2013 DBE master list of all schools in South Africa,
which comprised 10 009 schools (9 099 public and 910 independent schools) that offered Grade 9 classes. Statistics
Canada drew the South African sample by using the province, school type (public and independent) and LoLT
(Afrikaans, English and dual medium) as stratification variables. A total of 300 schools were sampled, of which
292 participated in the study. A total of 12 514 learners, 334 mathematics and 331 science teachers participated
in the study. Data from the principal, teacher and learner questionnaires, as well as learner achievement data are
used in this report. A full description of the TIMSS 2015 design and methodology is available in Appendix 1. The
appendix also explains how the TIMSS conceptual framework guides the study design.
Mathematics and science achievement in South Africa
5 The results presented in this section build on the findings that were published in: Highlights of Mathematics and Science Achievement of Grade 9 South African learners (Reddy et al., 2016a).
Understanding mathematics and science achievement amongst Grade 9 learners in South Africa 21
TIMSS 2015 Grade 9 National Report
PAR
TA
The traditional TIMSS methodology provides an opportunity for a country to measure change in its own
performance over time (Reddy et al., 2016a). In the TIMSS 2011 report we showed that the South African
performance for mathematics and science was the same for the 1995, 1999 and 2003 cycles (Reddy
et al., 2015). Between TIMSS 2003 and 2011, the mathematics and science scores improved by 67 and
64 points respectively6. Between 2011 and 2015 the mathematics and science scores improved by a further
20 and 26 points respectively.
3.1 Trends in performance percentilesThere are two important findings based on the trend analysis of TIMSS performance from 2003 to 2015.
Figure 3.1 summarises South African performance by different percentiles for TIMSS 2003, 2011 and 2015 for both
mathematics and science. First, the highest gains were achieved at the lower end of the achievement distribution,
which means that those with the lowest levels of achievement are improving. The second is based on the overall
shape and size of the achievement distribution. The longer the line, the wider the variation in scores, which,
in turn, suggests large educational inequalities among learners. The distribution of scores is still wide, but has
narrowed from 2003 to 2011, and again to 2015, showing a narrowing of the gap between the top and the bottom
performers. This is true for both mathematics and science but the change has been greater for mathematics.
Figure 3.1: National trends in Grade 9 mathematics and science achievement, 2003, 2011 and 2015
(with SEs)a
a TIMSS 2003 tested both Grade 8 and Grade 9 learners. Results reported in Figure 3.1 are based on Grade 9 learner performance.
6 TIMSS estimates that an improvement of 40 TIMSS points over a four-year cycle is equivalent to an improvement of one grade. South Africa did not participate in the TIMSS 2007 study. Therefore, over an eight-year cycle (from 2003 to 2011), South African national performance corresponded to 1.5 grades.
0 40 80 120 160 200 240 280 320 360 400 440 480 520 560
0 40 80 120 160 200 240 280 320 360 400 440 480 520 560 600
Mathematics Average scale score (SE)
2015 372 (4.5)
2011 352 (2.5)
2003 285 (4.2)
Science Average scale score (SE)
2015 358 (5.6)
2011 332 (3.7)
2003 268 (5.5)
95% Confidence Interval for Average (±2SE)
Percentiles of Performance 5th 25th 75th 95th
22 Understanding mathematics and science achievement amongst Grade 9 learners in South Africa
Mathematics and science achievement in South Africa
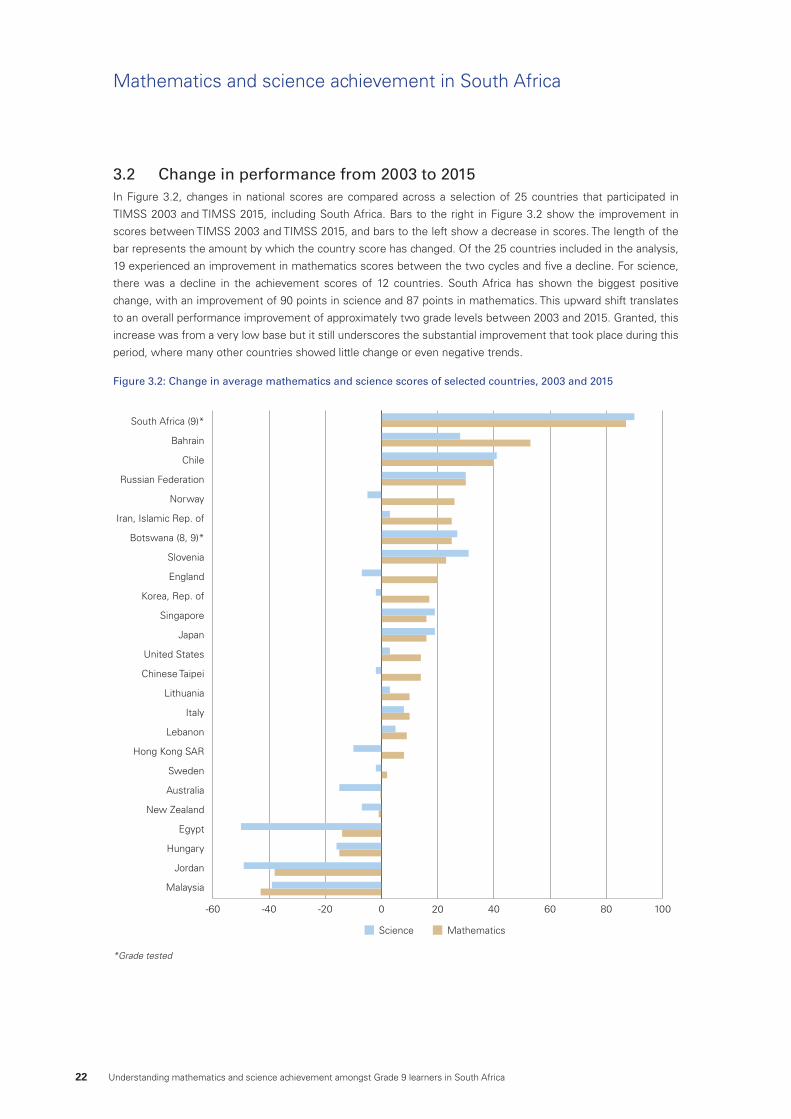
3.2 Change in performance from 2003 to 2015In Figure 3.2, changes in national scores are compared across a selection of 25 countries that participated in
TIMSS 2003 and TIMSS 2015, including South Africa. Bars to the right in Figure 3.2 show the improvement in
scores between TIMSS 2003 and TIMSS 2015, and bars to the left show a decrease in scores. The length of the
bar represents the amount by which the country score has changed. Of the 25 countries included in the analysis,
19 experienced an improvement in mathematics scores between the two cycles and five a decline. For science,
there was a decline in the achievement scores of 12 countries. South Africa has shown the biggest positive
change, with an improvement of 90 points in science and 87 points in mathematics. This upward shift translates
to an overall performance improvement of approximately two grade levels between 2003 and 2015. Granted, this
increase was from a very low base but it still underscores the substantial improvement that took place during this
period, where many other countries showed little change or even negative trends.
Figure 3.2: Change in average mathematics and science scores of selected countries, 2003 and 2015
-60 -40 -20 0 20 40 60 80 100
South Africa (9)*
Bahrain
Chile
Russian Federation
Norway
Iran, Islamic Rep. of
Botswana (8, 9)*
Slovenia
England
Korea, Rep. of
Singapore
Japan
United States
Chinese Taipei
Lithuania
Italy
Lebanon
Hong Kong SAR
Sweden
Australia
New Zealand
Egypt
Hungary
Jordan
Malaysia
Science Mathematics
*Grade tested
Understanding mathematics and science achievement amongst Grade 9 learners in South Africa 23
TIMSS 2015 Grade 9 National Report
PAR
TA
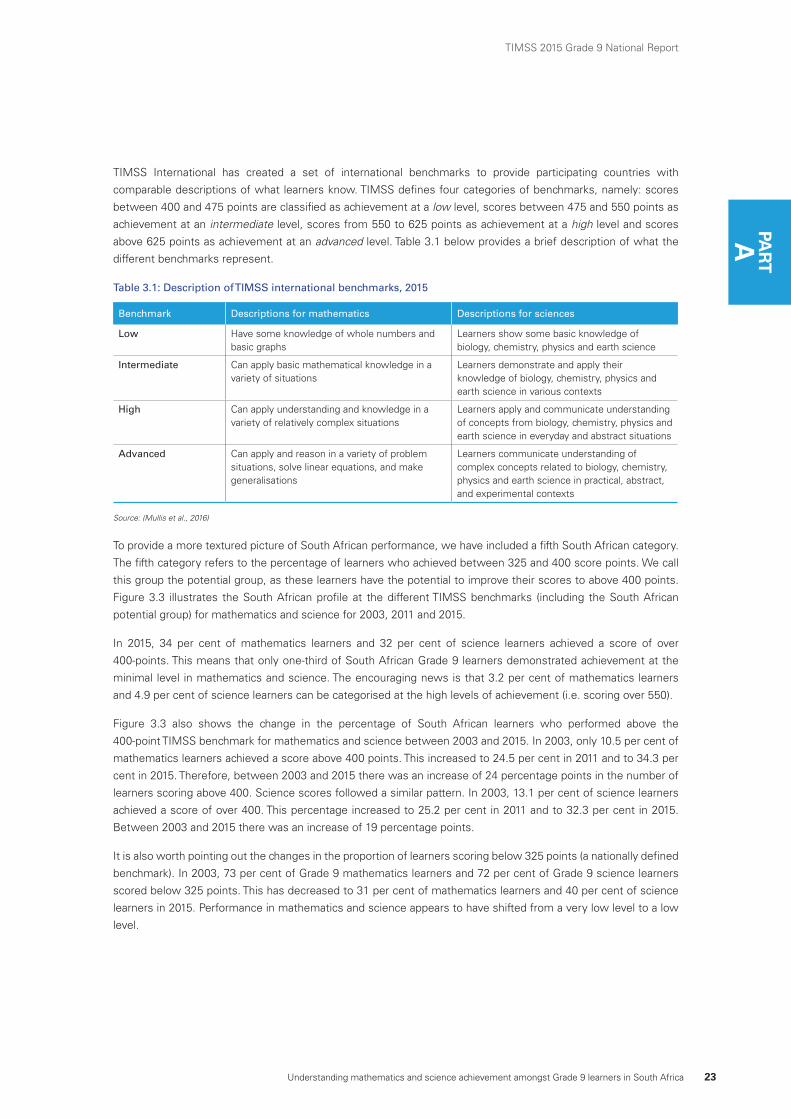
TIMSS International has created a set of international benchmarks to provide participating countries with
comparable descriptions of what learners know. TIMSS defines four categories of benchmarks, namely: scores
between 400 and 475 points are classified as achievement at a low level, scores between 475 and 550 points as
achievement at an intermediate level, scores from 550 to 625 points as achievement at a high level and scores
above 625 points as achievement at an advanced level. Table 3.1 below provides a brief description of what the
different benchmarks represent.
Table 3.1: Description of TIMSS international benchmarks, 2015
Benchmark Descriptions for mathematics Descriptions for sciences
Low Have some knowledge of whole numbers and basic graphs
Learners show some basic knowledge of biology, chemistry, physics and earth science
Intermediate Can apply basic mathematical knowledge in a variety of situations
Learners demonstrate and apply their knowledge of biology, chemistry, physics and earth science in various contexts
High Can apply understanding and knowledge in a variety of relatively complex situations
Learners apply and communicate understanding of concepts from biology, chemistry, physics and earth science in everyday and abstract situations
Advanced Can apply and reason in a variety of problem situations, solve linear equations, and make generalisations
Learners communicate understanding of complex concepts related to biology, chemistry, physics and earth science in practical, abstract, and experimental contexts
Source: (Mullis et al., 2016)
To provide a more textured picture of South African performance, we have included a fifth South African category.
The fifth category refers to the percentage of learners who achieved between 325 and 400 score points. We call
this group the potential group, as these learners have the potential to improve their scores to above 400 points.
Figure 3.3 illustrates the South African profile at the different TIMSS benchmarks (including the South African
potential group) for mathematics and science for 2003, 2011 and 2015.
In 2015, 34 per cent of mathematics learners and 32 per cent of science learners achieved a score of over
400-points. This means that only one-third of South African Grade 9 learners demonstrated achievement at the
minimal level in mathematics and science. The encouraging news is that 3.2 per cent of mathematics learners
and 4.9 per cent of science learners can be categorised at the high levels of achievement (i.e. scoring over 550).
Figure 3.3 also shows the change in the percentage of South African learners who performed above the
400-point TIMSS benchmark for mathematics and science between 2003 and 2015. In 2003, only 10.5 per cent of
mathematics learners achieved a score above 400 points. This increased to 24.5 per cent in 2011 and to 34.3 per
cent in 2015. Therefore, between 2003 and 2015 there was an increase of 24 percentage points in the number of
learners scoring above 400. Science scores followed a similar pattern. In 2003, 13.1 per cent of science learners
achieved a score of over 400. This percentage increased to 25.2 per cent in 2011 and to 32.3 per cent in 2015.
Between 2003 and 2015 there was an increase of 19 percentage points.
It is also worth pointing out the changes in the proportion of learners scoring below 325 points (a nationally defined
benchmark). In 2003, 73 per cent of Grade 9 mathematics learners and 72 per cent of Grade 9 science learners
scored below 325 points. This has decreased to 31 per cent of mathematics learners and 40 per cent of science
learners in 2015. Performance in mathematics and science appears to have shifted from a very low level to a low
level.
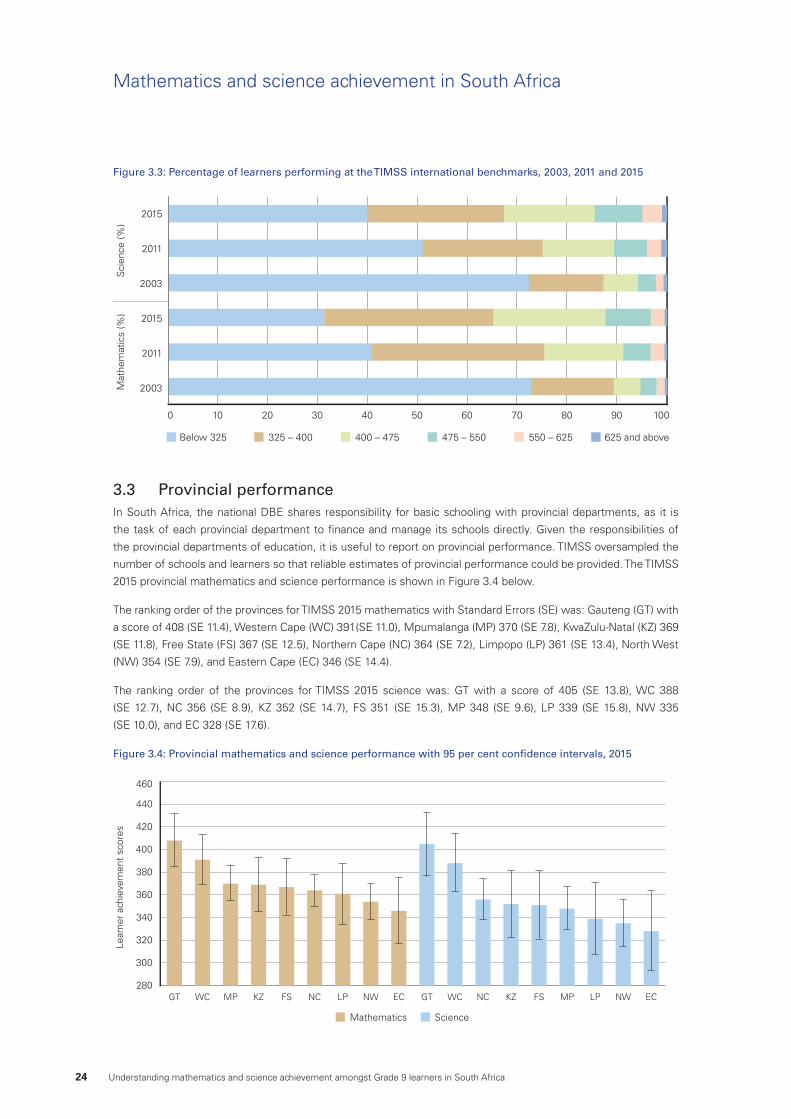
24 Understanding mathematics and science achievement amongst Grade 9 learners in South Africa
Mathematics and science achievement in South Africa
Figure 3.3: Percentage of learners performing at the TIMSS international benchmarks, 2003, 2011 and 2015
0 10 20 30 40 50 60 70 80 90 100
2015
2011
2003
2015
2011
2003Mat
hem
atic
s (%
)
Below 325 325 – 400 400 – 475 475 – 550 550 – 625 625 and above
Sci
ence
(%)
3.3 Provincial performance In South Africa, the national DBE shares responsibility for basic schooling with provincial departments, as it is
the task of each provincial department to finance and manage its schools directly. Given the responsibilities of
the provincial departments of education, it is useful to report on provincial performance. TIMSS oversampled the
number of schools and learners so that reliable estimates of provincial performance could be provided. The TIMSS
2015 provincial mathematics and science performance is shown in Figure 3.4 below.
The ranking order of the provinces for TIMSS 2015 mathematics with Standard Errors (SE) was: Gauteng (GT) with
a score of 408 (SE 11.4), Western Cape (WC) 391(SE 11.0), Mpumalanga (MP) 370 (SE 7.8), KwaZulu-Natal (KZ) 369
(SE 11.8), Free State (FS) 367 (SE 12.5), Northern Cape (NC) 364 (SE 7.2), Limpopo (LP) 361 (SE 13.4), North West
(NW) 354 (SE 7.9), and Eastern Cape (EC) 346 (SE 14.4).
The ranking order of the provinces for TIMSS 2015 science was: GT with a score of 405 (SE 13.8), WC 388
(SE 12.7), NC 356 (SE 8.9), KZ 352 (SE 14.7), FS 351 (SE 15.3), MP 348 (SE 9.6), LP 339 (SE 15.8), NW 335
(SE 10.0), and EC 328 (SE 17.6).
Figure 3.4: Provincial mathematics and science performance with 95 per cent confidence intervals, 2015
280
300
320
340
360
380
400
420
440
460
ECNWLPMPFSKZNCWCGTECNWLPNCFSKZMPWCGT
ScienceMathematics
Leam
er a
chie
vem
ent
scor
es
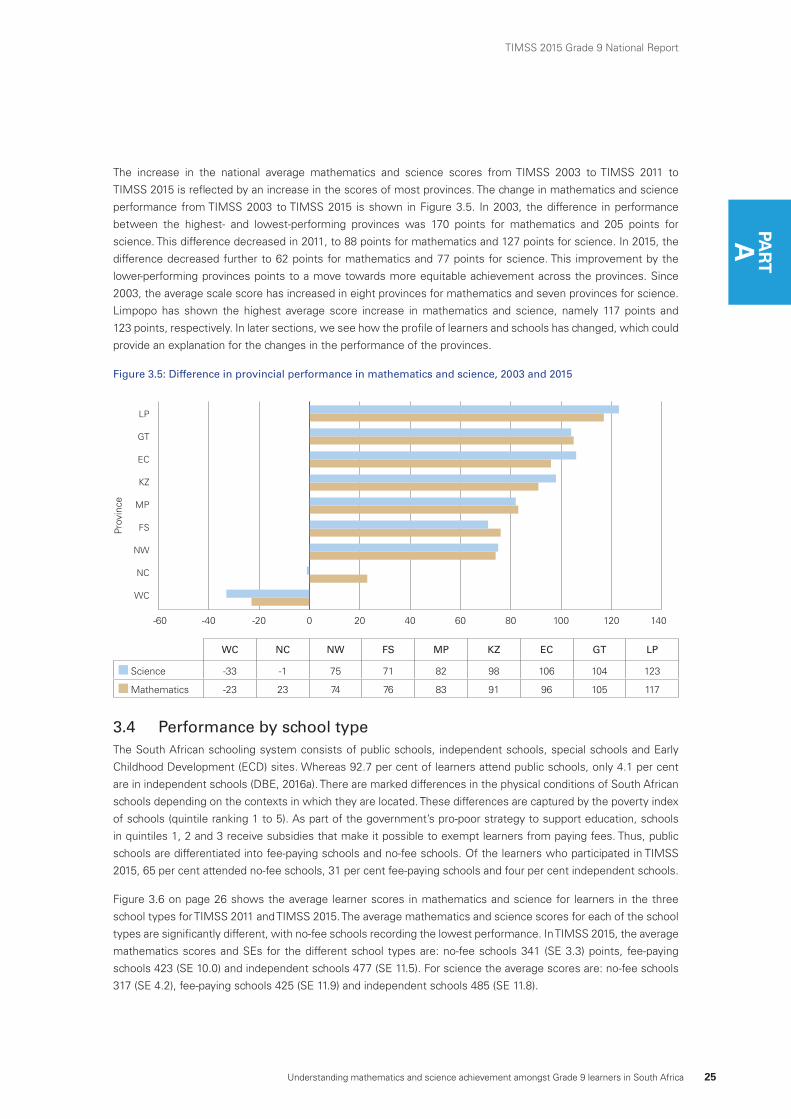
Understanding mathematics and science achievement amongst Grade 9 learners in South Africa 25
TIMSS 2015 Grade 9 National Report
PAR
TA
The increase in the national average mathematics and science scores from TIMSS 2003 to TIMSS 2011 to
TIMSS 2015 is reflected by an increase in the scores of most provinces. The change in mathematics and science
performance from TIMSS 2003 to TIMSS 2015 is shown in Figure 3.5. In 2003, the difference in performance
between the highest- and lowest-performing provinces was 170 points for mathematics and 205 points for
science. This difference decreased in 2011, to 88 points for mathematics and 127 points for science. In 2015, the
difference decreased further to 62 points for mathematics and 77 points for science. This improvement by the
lower-performing provinces points to a move towards more equitable achievement across the provinces. Since
2003, the average scale score has increased in eight provinces for mathematics and seven provinces for science.
Limpopo has shown the highest average score increase in mathematics and science, namely 117 points and
123 points, respectively. In later sections, we see how the profile of learners and schools has changed, which could
provide an explanation for the changes in the performance of the provinces.
Figure 3.5: Difference in provincial performance in mathematics and science, 2003 and 2015
-60 -40 -20 0 20 40 60 80 100 120 140
LP
GT
EC
KZ
MP
FS
NW
NC
WC
Prov
ince
WC NC NW FS MP KZ EC GT LP
Science -33 -1 75 71 82 98 106 104 123
Mathematics -23 23 74 76 83 91 96 105 117
3.4 Performance by school type The South African schooling system consists of public schools, independent schools, special schools and Early
Childhood Development (ECD) sites. Whereas 92.7 per cent of learners attend public schools, only 4.1 per cent
are in independent schools (DBE, 2016a). There are marked differences in the physical conditions of South African
schools depending on the contexts in which they are located. These differences are captured by the poverty index
of schools (quintile ranking 1 to 5). As part of the government’s pro-poor strategy to support education, schools
in quintiles 1, 2 and 3 receive subsidies that make it possible to exempt learners from paying fees. Thus, public
schools are differentiated into fee-paying schools and no-fee schools. Of the learners who participated in TIMSS
2015, 65 per cent attended no-fee schools, 31 per cent fee-paying schools and four per cent independent schools.
Figure 3.6 on page 26 shows the average learner scores in mathematics and science for learners in the three
school types for TIMSS 2011 and TIMSS 2015. The average mathematics and science scores for each of the school
types are significantly different, with no-fee schools recording the lowest performance. In TIMSS 2015, the average
mathematics scores and SEs for the different school types are: no-fee schools 341 (SE 3.3) points, fee-paying
schools 423 (SE 10.0) and independent schools 477 (SE 11.5). For science the average scores are: no-fee schools
317 (SE 4.2), fee-paying schools 425 (SE 11.9) and independent schools 485 (SE 11.8).
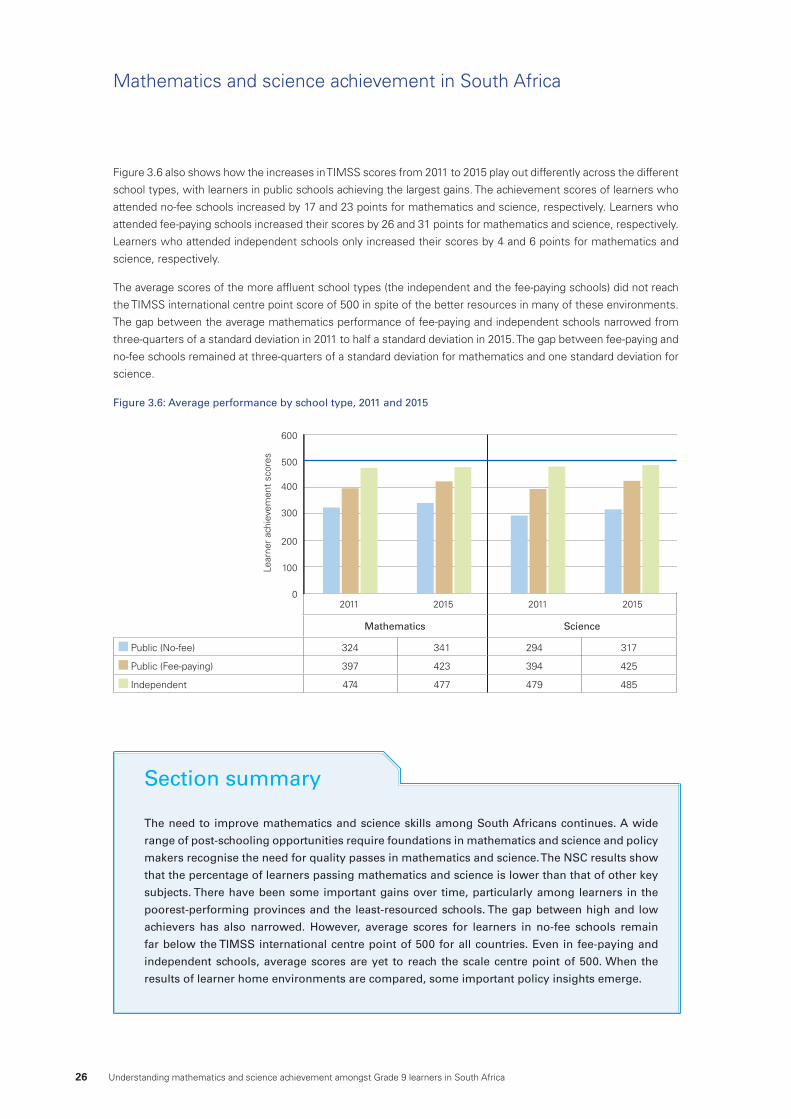
26 Understanding mathematics and science achievement amongst Grade 9 learners in South Africa
Mathematics and science achievement in South Africa
Figure 3.6 also shows how the increases in TIMSS scores from 2011 to 2015 play out differently across the different
school types, with learners in public schools achieving the largest gains. The achievement scores of learners who
attended no-fee schools increased by 17 and 23 points for mathematics and science, respectively. Learners who
attended fee-paying schools increased their scores by 26 and 31 points for mathematics and science, respectively.
Learners who attended independent schools only increased their scores by 4 and 6 points for mathematics and
science, respectively.
The average scores of the more affluent school types (the independent and the fee-paying schools) did not reach
the TIMSS international centre point score of 500 in spite of the better resources in many of these environments.
The gap between the average mathematics performance of fee-paying and independent schools narrowed from
three-quarters of a standard deviation in 2011 to half a standard deviation in 2015. The gap between fee-paying and
no-fee schools remained at three-quarters of a standard deviation for mathematics and one standard deviation for
science.
Figure 3.6: Average performance by school type, 2011 and 2015
0
100
200
300
400
500
600
2015201120152011
Lear
ner
achi
evem
ent
scor
es
Mathematics Science
Public (No-fee) 324 341 294 317
Public (Fee-paying) 397 423 394 425
Independent 474 477 479 485
The need to improve mathematics and science skills among South Africans continues. A wide
range of post-schooling opportunities require foundations in mathematics and science and policy
makers recognise the need for quality passes in mathematics and science. The NSC results show
that the percentage of learners passing mathematics and science is lower than that of other key
subjects. There have been some important gains over time, particularly among learners in the
poorest-performing provinces and the least-resourced schools. The gap between high and low
achievers has also narrowed. However, average scores for learners in no-fee schools remain
far below the TIMSS international centre point of 500 for all countries. Even in fee-paying and
independent schools, average scores are yet to reach the scale centre point of 500. When the
results of learner home environments are compared, some important policy insights emerge.
Section summary
PAR
TC
BPART
LEARNERS AND THE HOME ENVIRONMENT
Understanding mathematics and science achievement amongst Grade 9 learners in South Africa 27
TIMSS 2015 Grade 9 National Report
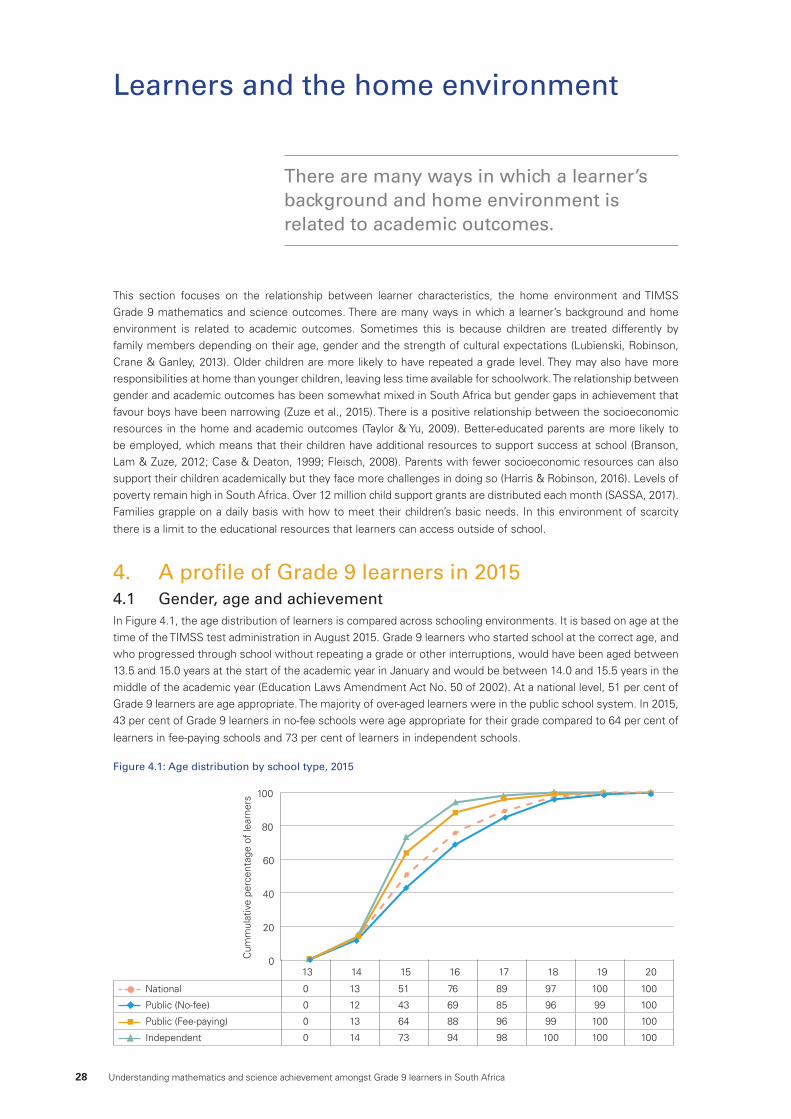
28 Understanding mathematics and science achievement amongst Grade 9 learners in South Africa
This section focuses on the relationship between learner characteristics, the home environment and TIMSS Grade 9 mathematics and science outcomes. There are many ways in which a learner’s background and home environment is related to academic outcomes. Sometimes this is because children are treated differently by family members depending on their age, gender and the strength of cultural expectations (Lubienski, Robinson, Crane & Ganley, 2013). Older children are more likely to have repeated a grade level. They may also have more responsibilities at home than younger children, leaving less time available for schoolwork. The relationship between gender and academic outcomes has been somewhat mixed in South Africa but gender gaps in achievement that favour boys have been narrowing (Zuze et al., 2015). There is a positive relationship between the socioeconomic resources in the home and academic outcomes (Taylor & Yu, 2009). Better-educated parents are more likely to be employed, which means that their children have additional resources to support success at school (Branson, Lam & Zuze, 2012; Case & Deaton, 1999; Fleisch, 2008). Parents with fewer socioeconomic resources can also support their children academically but they face more challenges in doing so (Harris & Robinson, 2016). Levels of poverty remain high in South Africa. Over 12 million child support grants are distributed each month (SASSA, 2017). Families grapple on a daily basis with how to meet their children’s basic needs. In this environment of scarcity
there is a limit to the educational resources that learners can access outside of school.
4. A profile of Grade 9 learners in 20154.1 Gender, age and achievementIn Figure 4.1, the age distribution of learners is compared across schooling environments. It is based on age at the time of the TIMSS test administration in August 2015. Grade 9 learners who started school at the correct age, and who progressed through school without repeating a grade or other interruptions, would have been aged between 13.5 and 15.0 years at the start of the academic year in January and would be between 14.0 and 15.5 years in the middle of the academic year (Education Laws Amendment Act No. 50 of 2002). At a national level, 51 per cent of Grade 9 learners are age appropriate. The majority of over-aged learners were in the public school system. In 2015, 43 per cent of Grade 9 learners in no-fee schools were age appropriate for their grade compared to 64 per cent of
learners in fee-paying schools and 73 per cent of learners in independent schools.
Figure 4.1: Age distribution by school type, 2015
0
20
40
60
80
100
Cum
mul
ativ
e pe
rcen
tage
of
lear
ners
13 14 15 16 17 18 19 20
National 0 13 51 76 89 97 100 100
Public (No-fee) 0 12 43 69 85 96 99 100
Public (Fee-paying) 0 13 64 88 96 99 100 100
Independent 0 14 73 94 98 100 100 100
Learners and the home environment
There are many ways in which a learner’s background and home environment is related to academic outcomes.
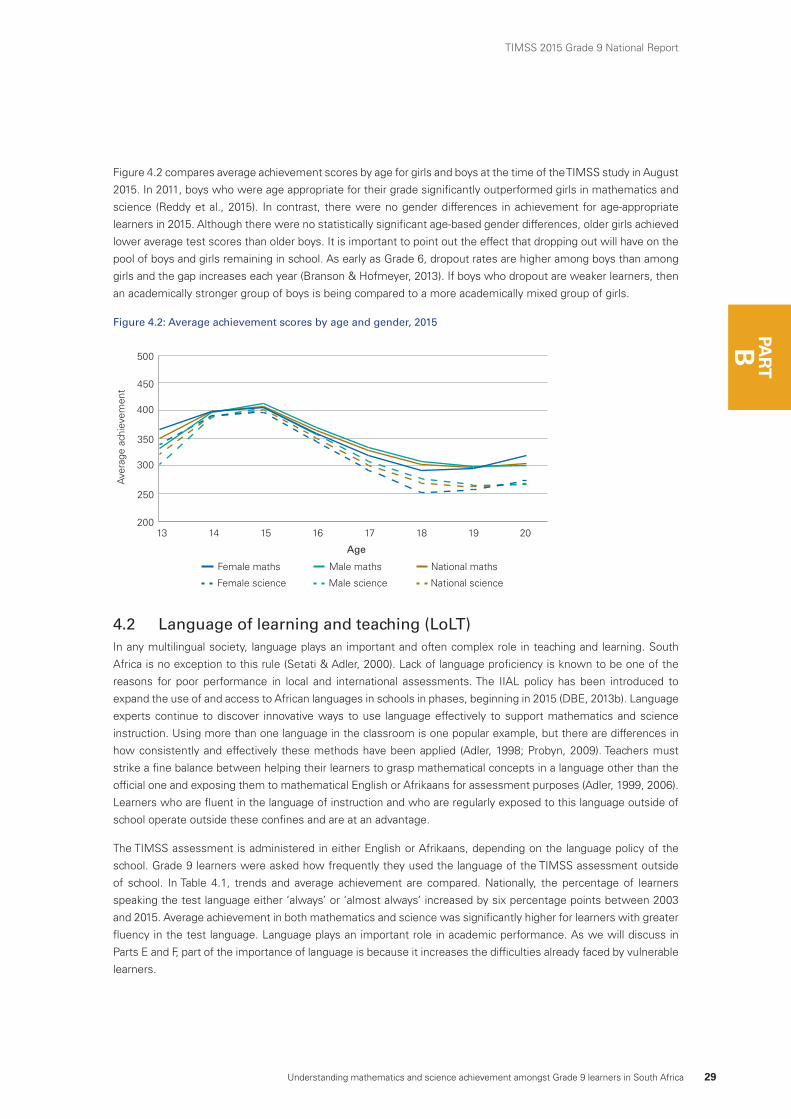
Understanding mathematics and science achievement amongst Grade 9 learners in South Africa 29
TIMSS 2015 Grade 9 National Report
PAR
TB PAR
TB
Figure 4.2 compares average achievement scores by age for girls and boys at the time of the TIMSS study in August
2015. In 2011, boys who were age appropriate for their grade significantly outperformed girls in mathematics and
science (Reddy et al., 2015). In contrast, there were no gender differences in achievement for age-appropriate
learners in 2015. Although there were no statistically significant age-based gender differences, older girls achieved
lower average test scores than older boys. It is important to point out the effect that dropping out will have on the
pool of boys and girls remaining in school. As early as Grade 6, dropout rates are higher among boys than among
girls and the gap increases each year (Branson & Hofmeyer, 2013). If boys who dropout are weaker learners, then
an academically stronger group of boys is being compared to a more academically mixed group of girls.
Figure 4.2: Average achievement scores by age and gender, 2015
200
250
300
350
400
450
500
Ave
rage
ach
ieve
men
t
13 14 15 16 17 18 19 20
Female maths Male maths National maths
Female science Male science National science
Age
4.2 Language of learning and teaching (LoLT)In any multilingual society, language plays an important and often complex role in teaching and learning. South
Africa is no exception to this rule (Setati & Adler, 2000). Lack of language proficiency is known to be one of the
reasons for poor performance in local and international assessments. The IIAL policy has been introduced to
expand the use of and access to African languages in schools in phases, beginning in 2015 (DBE, 2013b). Language
experts continue to discover innovative ways to use language effectively to support mathematics and science
instruction. Using more than one language in the classroom is one popular example, but there are differences in
how consistently and effectively these methods have been applied (Adler, 1998; Probyn, 2009). Teachers must
strike a fine balance between helping their learners to grasp mathematical concepts in a language other than the
official one and exposing them to mathematical English or Afrikaans for assessment purposes (Adler, 1999, 2006).
Learners who are fluent in the language of instruction and who are regularly exposed to this language outside of
school operate outside these confines and are at an advantage.
The TIMSS assessment is administered in either English or Afrikaans, depending on the language policy of the
school. Grade 9 learners were asked how frequently they used the language of the TIMSS assessment outside
of school. In Table 4.1, trends and average achievement are compared. Nationally, the percentage of learners
speaking the test language either ‘always’ or ‘almost always’ increased by six percentage points between 2003
and 2015. Average achievement in both mathematics and science was significantly higher for learners with greater
fluency in the test language. Language plays an important role in academic performance. As we will discuss in
Parts E and F, part of the importance of language is because it increases the difficulties already faced by vulnerable
learners.
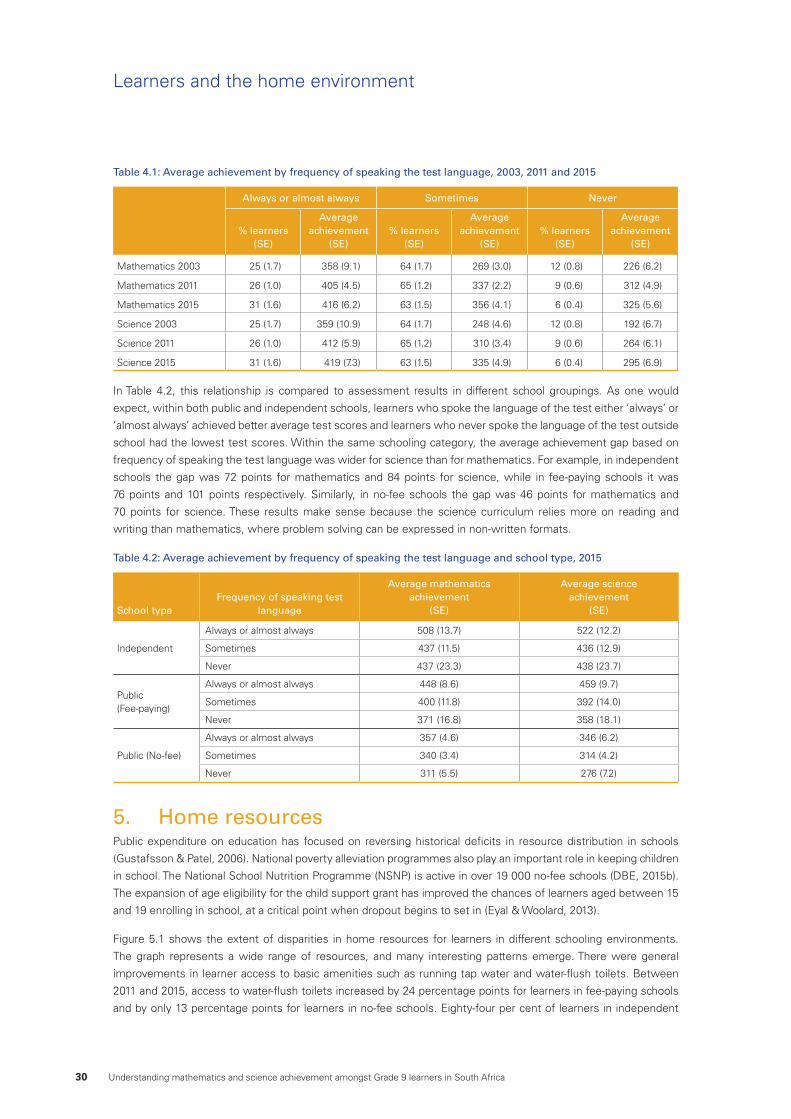
30 Understanding mathematics and science achievement amongst Grade 9 learners in South Africa
Table 4.1: Average achievement by frequency of speaking the test language, 2003, 2011 and 2015
Always or almost always Sometimes Never
% learners(SE)
Average achievement
(SE)% learners
(SE)
Average achievement
(SE)% learners
(SE)
Average achievement
(SE)
Mathematics 2003 25 (1.7) 358 (9.1) 64 (1.7) 269 (3.0) 12 (0.8) 226 (6.2)
Mathematics 2011 26 (1.0) 405 (4.5) 65 (1.2) 337 (2.2) 9 (0.6) 312 (4.9)
Mathematics 2015 31 (1.6) 416 (6.2) 63 (1.5) 356 (4.1) 6 (0.4) 325 (5.6)
Science 2003 25 (1.7) 359 (10.9) 64 (1.7) 248 (4.6) 12 (0.8) 192 (6.7)
Science 2011 26 (1.0) 412 (5.9) 65 (1.2) 310 (3.4) 9 (0.6) 264 (6.1)
Science 2015 31 (1.6) 419 (7.3) 63 (1.5) 335 (4.9) 6 (0.4) 295 (6.9)
In Table 4.2, this relationship is compared to assessment results in different school groupings. As one would
expect, within both public and independent schools, learners who spoke the language of the test either ‘always’ or
‘almost always’ achieved better average test scores and learners who never spoke the language of the test outside
school had the lowest test scores. Within the same schooling category, the average achievement gap based on
frequency of speaking the test language was wider for science than for mathematics. For example, in independent
schools the gap was 72 points for mathematics and 84 points for science, while in fee-paying schools it was
76 points and 101 points respectively. Similarly, in no-fee schools the gap was 46 points for mathematics and
70 points for science. These results make sense because the science curriculum relies more on reading and
writing than mathematics, where problem solving can be expressed in non-written formats.
Table 4.2: Average achievement by frequency of speaking the test language and school type, 2015
School typeFrequency of speaking test
language
Average mathematics achievement
(SE)
Average science achievement
(SE)
Independent
Always or almost always 508 (13.7) 522 (12.2)
Sometimes 437 (11.5) 436 (12.9)
Never 437 (23.3) 438 (23.7)
Public (Fee-paying)
Always or almost always 448 (8.6) 459 (9.7)
Sometimes 400 (11.8) 392 (14.0)
Never 371 (16.8) 358 (18.1)
Public (No-fee)
Always or almost always 357 (4.6) 346 (6.2)
Sometimes 340 (3.4) 314 (4.2)
Never 311 (5.5) 276 (7.2)
5. Home resources Public expenditure on education has focused on reversing historical deficits in resource distribution in schools
(Gustafsson & Patel, 2006). National poverty alleviation programmes also play an important role in keeping children
in school. The National School Nutrition Programme (NSNP) is active in over 19 000 no-fee schools (DBE, 2015b).
The expansion of age eligibility for the child support grant has improved the chances of learners aged between 15
and 19 enrolling in school, at a critical point when dropout begins to set in (Eyal & Woolard, 2013).
Figure 5.1 shows the extent of disparities in home resources for learners in different schooling environments.
The graph represents a wide range of resources, and many interesting patterns emerge. There were general
improvements in learner access to basic amenities such as running tap water and water-flush toilets. Between
2011 and 2015, access to water-flush toilets increased by 24 percentage points for learners in fee-paying schools
and by only 13 percentage points for learners in no-fee schools. Eighty-four per cent of learners in independent
Learners and the home environment
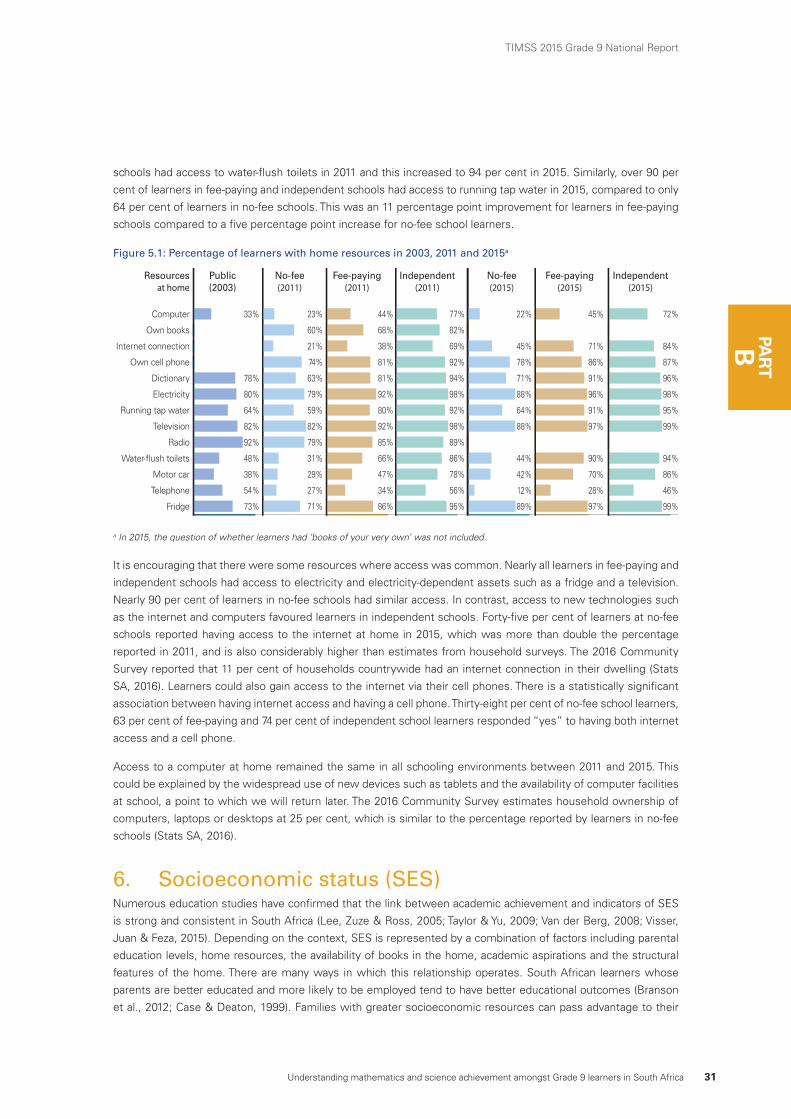
Understanding mathematics and science achievement amongst Grade 9 learners in South Africa 31
TIMSS 2015 Grade 9 National Report
PAR
TB PAR
TB
schools had access to water-flush toilets in 2011 and this increased to 94 per cent in 2015. Similarly, over 90 per
cent of learners in fee-paying and independent schools had access to running tap water in 2015, compared to only
64 per cent of learners in no-fee schools. This was an 11 percentage point improvement for learners in fee-paying
schools compared to a five percentage point increase for no-fee school learners.
Figure 5.1: Percentage of learners with home resources in 2003, 2011 and 2015a
Computer
Own books
Internet connection
Own cell phone
Dictionary
Electricity
Running tap water
Television
Radio
Water-flush toilets
Motor car
Telephone
Fridge
20
33%
78%
80%
64%
82%
92%
48%
38%
54%
73%
23%
60%
21%
74%
63%
79%
59%
82%
79%
31%
29%
27%
71%
20
44%
68%
38%
81%
81%
92%
80%
92%
85%
66%
47%
34%
86%
77%
82%
69%
92%
94%
98%
92%
98%
89%
86%
78%
56%
95%
22%
45%
78%
71%
88%
64%
88%
44%
42%
12%
89%
0 20 40 60 80 100
45%
71%
86%
91%
96%
91%
97%
90%
70%
28%
97%
20 40
72%
84%
87%
96%
98%
95%
99%
94%
86%
46%
99%
Resources Public No-fee Fee-paying Independent No-fee Fee-paying Independent at home (2003) (2011) (2011) (2011) (2015) (2015) (2015)
a In 2015, the question of whether learners had ‘books of your very own’ was not included.
It is encouraging that there were some resources where access was common. Nearly all learners in fee-paying and
independent schools had access to electricity and electricity-dependent assets such as a fridge and a television.
Nearly 90 per cent of learners in no-fee schools had similar access. In contrast, access to new technologies such
as the internet and computers favoured learners in independent schools. Forty-five per cent of learners at no-fee
schools reported having access to the internet at home in 2015, which was more than double the percentage
reported in 2011, and is also considerably higher than estimates from household surveys. The 2016 Community
Survey reported that 11 per cent of households countrywide had an internet connection in their dwelling (Stats
SA, 2016). Learners could also gain access to the internet via their cell phones. There is a statistically significant
association between having internet access and having a cell phone. Thirty-eight per cent of no-fee school learners,
63 per cent of fee-paying and 74 per cent of independent school learners responded “yes” to having both internet
access and a cell phone.
Access to a computer at home remained the same in all schooling environments between 2011 and 2015. This
could be explained by the widespread use of new devices such as tablets and the availability of computer facilities
at school, a point to which we will return later. The 2016 Community Survey estimates household ownership of
computers, laptops or desktops at 25 per cent, which is similar to the percentage reported by learners in no-fee
schools (Stats SA, 2016).
6. Socioeconomic status (SES) Numerous education studies have confirmed that the link between academic achievement and indicators of SES
is strong and consistent in South Africa (Lee, Zuze & Ross, 2005; Taylor & Yu, 2009; Van der Berg, 2008; Visser,
Juan & Feza, 2015). Depending on the context, SES is represented by a combination of factors including parental
education levels, home resources, the availability of books in the home, academic aspirations and the structural
features of the home. There are many ways in which this relationship operates. South African learners whose
parents are better educated and more likely to be employed tend to have better educational outcomes (Branson
et al., 2012; Case & Deaton, 1999). Families with greater socioeconomic resources can pass advantage to their
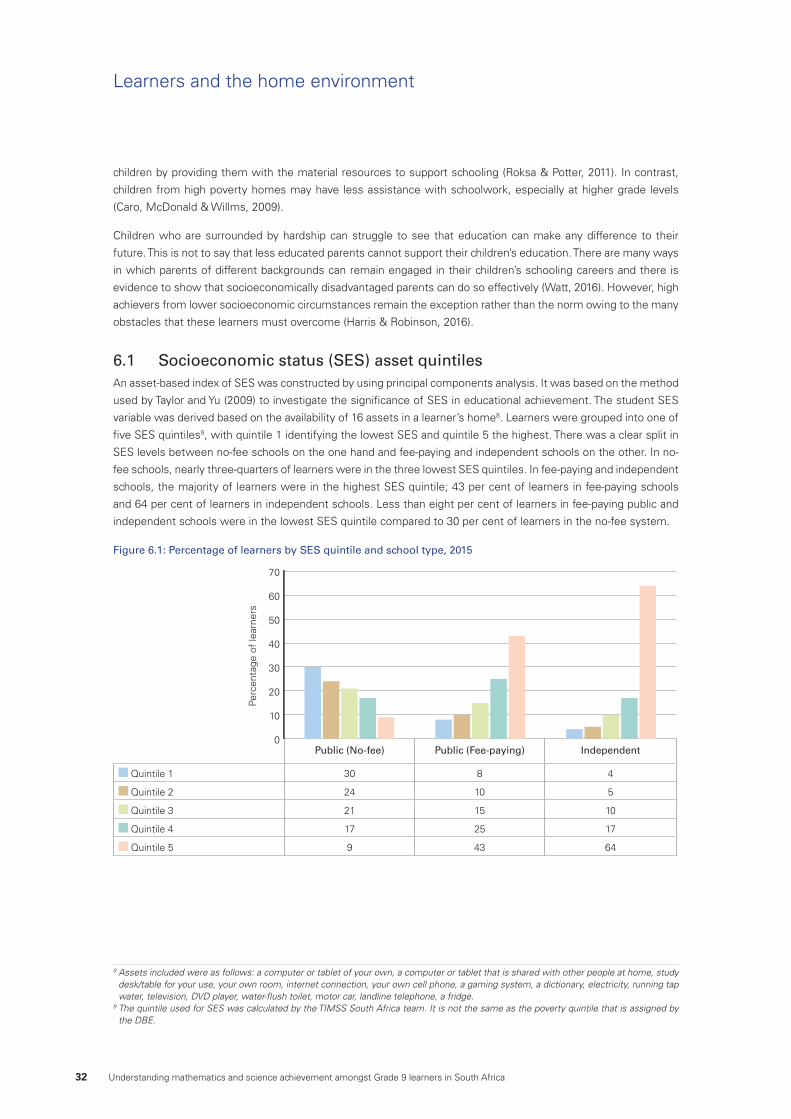
32 Understanding mathematics and science achievement amongst Grade 9 learners in South Africa
children by providing them with the material resources to support schooling (Roksa & Potter, 2011). In contrast,
children from high poverty homes may have less assistance with schoolwork, especially at higher grade levels
(Caro, McDonald & Willms, 2009).
Children who are surrounded by hardship can struggle to see that education can make any difference to their
future. This is not to say that less educated parents cannot support their children’s education. There are many ways
in which parents of different backgrounds can remain engaged in their children’s schooling careers and there is
evidence to show that socioeconomically disadvantaged parents can do so effectively (Watt, 2016). However, high
achievers from lower socioeconomic circumstances remain the exception rather than the norm owing to the many
obstacles that these learners must overcome (Harris & Robinson, 2016).
6.1 Socioeconomic status (SES) asset quintilesAn asset-based index of SES was constructed by using principal components analysis. It was based on the method
used by Taylor and Yu (2009) to investigate the significance of SES in educational achievement. The student SES
variable was derived based on the availability of 16 assets in a learner’s home8. Learners were grouped into one of
five SES quintiles9, with quintile 1 identifying the lowest SES and quintile 5 the highest. There was a clear split in
SES levels between no-fee schools on the one hand and fee-paying and independent schools on the other. In no-
fee schools, nearly three-quarters of learners were in the three lowest SES quintiles. In fee-paying and independent
schools, the majority of learners were in the highest SES quintile; 43 per cent of learners in fee-paying schools
and 64 per cent of learners in independent schools. Less than eight per cent of learners in fee-paying public and
independent schools were in the lowest SES quintile compared to 30 per cent of learners in the no-fee system.
Figure 6.1: Percentage of learners by SES quintile and school type, 2015
0
10
20
30
40
50
60
70
Perc
enta
ge o
f le
arne
rs
Public (No-fee) Public (Fee-paying) Independent
Quintile 1 30 8 4
Quintile 2 24 10 5
Quintile 3 21 15 10
Quintile 4 17 25 17
Quintile 5 9 43 64
Learners and the home environment
8 Assets included were as follows: a computer or tablet of your own, a computer or tablet that is shared with other people at home, study desk/table for your use, your own room, internet connection, your own cell phone, a gaming system, a dictionary, electricity, running tap water, television, DVD player, water-flush toilet, motor car, landline telephone, a fridge.
9 The quintile used for SES was calculated by the TIMSS South Africa team. It is not the same as the poverty quintile that is assigned by the DBE.
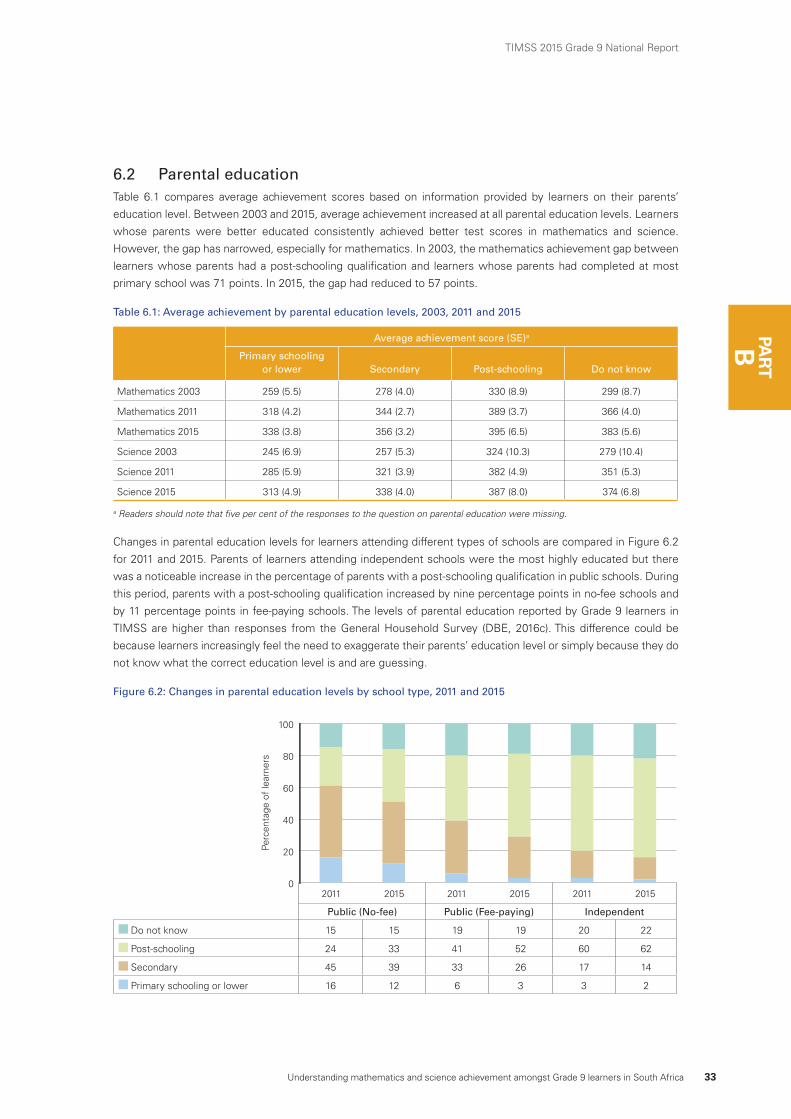
Understanding mathematics and science achievement amongst Grade 9 learners in South Africa 33
TIMSS 2015 Grade 9 National Report
PAR
TB
6.2 Parental educationTable 6.1 compares average achievement scores based on information provided by learners on their parents’
education level. Between 2003 and 2015, average achievement increased at all parental education levels. Learners
whose parents were better educated consistently achieved better test scores in mathematics and science.
However, the gap has narrowed, especially for mathematics. In 2003, the mathematics achievement gap between
learners whose parents had a post-schooling qualification and learners whose parents had completed at most
primary school was 71 points. In 2015, the gap had reduced to 57 points.
Table 6.1: Average achievement by parental education levels, 2003, 2011 and 2015
Average achievement score (SE)a
Primary schooling
or lower Secondary Post-schooling Do not know
Mathematics 2003 259 (5.5) 278 (4.0) 330 (8.9) 299 (8.7)
Mathematics 2011 318 (4.2) 344 (2.7) 389 (3.7) 366 (4.0)
Mathematics 2015 338 (3.8) 356 (3.2) 395 (6.5) 383 (5.6)
Science 2003 245 (6.9) 257 (5.3) 324 (10.3) 279 (10.4)
Science 2011 285 (5.9) 321 (3.9) 382 (4.9) 351 (5.3)
Science 2015 313 (4.9) 338 (4.0) 387 (8.0) 374 (6.8)
a Readers should note that five per cent of the responses to the question on parental education were missing.
Changes in parental education levels for learners attending different types of schools are compared in Figure 6.2
for 2011 and 2015. Parents of learners attending independent schools were the most highly educated but there
was a noticeable increase in the percentage of parents with a post-schooling qualification in public schools. During
this period, parents with a post-schooling qualification increased by nine percentage points in no-fee schools and
by 11 percentage points in fee-paying schools. The levels of parental education reported by Grade 9 learners in
TIMSS are higher than responses from the General Household Survey (DBE, 2016c). This difference could be
because learners increasingly feel the need to exaggerate their parents’ education level or simply because they do
not know what the correct education level is and are guessing.
Figure 6.2: Changes in parental education levels by school type, 2011 and 2015
Public (No-fee) Public (Fee-paying) Independent
Do not know 15 15 19 19 20 22
Post-schooling 24 33 41 52 60 62
Secondary 45 39 33 26 17 14
Primary schooling or lower 16 12 6 3 3 2
0
20
40
60
80
100
20152011 20152011 20152011
Perc
enta
ge o
f le
arne
rs
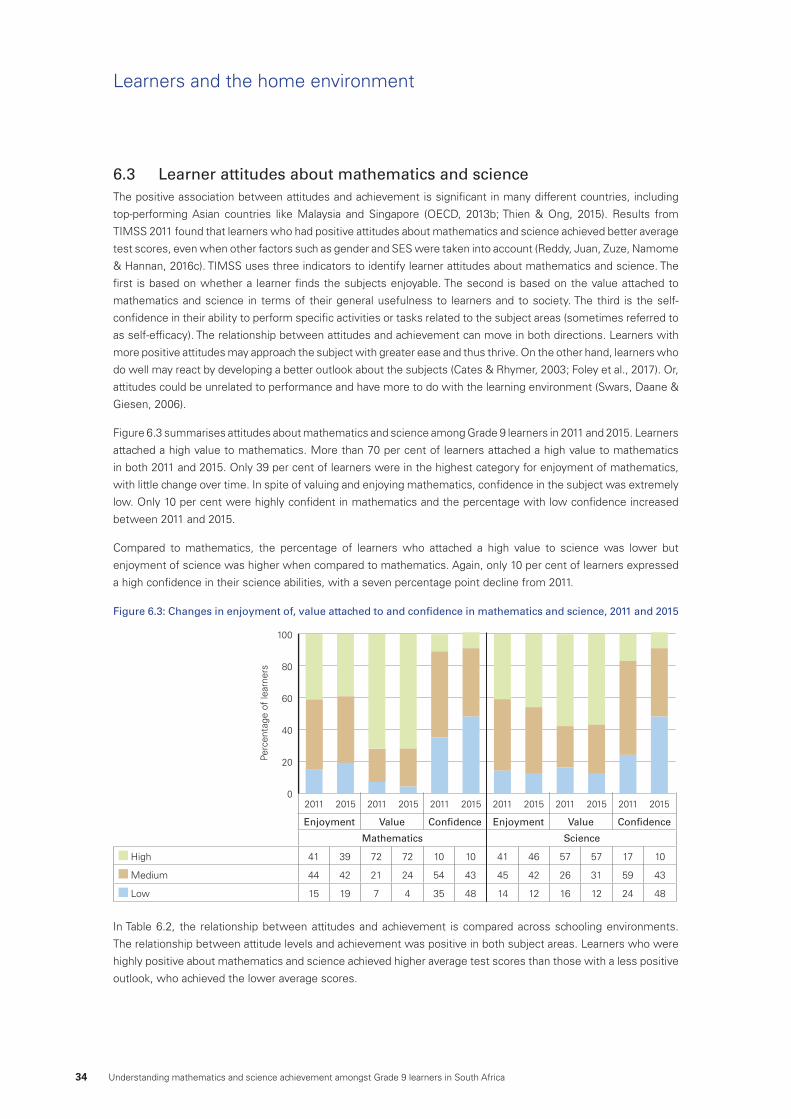
34 Understanding mathematics and science achievement amongst Grade 9 learners in South Africa
6.3 Learner attitudes about mathematics and scienceThe positive association between attitudes and achievement is significant in many different countries, including
top-performing Asian countries like Malaysia and Singapore (OECD, 2013b; Thien & Ong, 2015). Results from
TIMSS 2011 found that learners who had positive attitudes about mathematics and science achieved better average
test scores, even when other factors such as gender and SES were taken into account (Reddy, Juan, Zuze, Namome
& Hannan, 2016c). TIMSS uses three indicators to identify learner attitudes about mathematics and science. The
first is based on whether a learner finds the subjects enjoyable. The second is based on the value attached to
mathematics and science in terms of their general usefulness to learners and to society. The third is the self-
confidence in their ability to perform specific activities or tasks related to the subject areas (sometimes referred to
as self-efficacy). The relationship between attitudes and achievement can move in both directions. Learners with
more positive attitudes may approach the subject with greater ease and thus thrive. On the other hand, learners who
do well may react by developing a better outlook about the subjects (Cates & Rhymer, 2003; Foley et al., 2017). Or,
attitudes could be unrelated to performance and have more to do with the learning environment (Swars, Daane &
Giesen, 2006).
Figure 6.3 summarises attitudes about mathematics and science among Grade 9 learners in 2011 and 2015. Learners
attached a high value to mathematics. More than 70 per cent of learners attached a high value to mathematics
in both 2011 and 2015. Only 39 per cent of learners were in the highest category for enjoyment of mathematics,
with little change over time. In spite of valuing and enjoying mathematics, confidence in the subject was extremely
low. Only 10 per cent were highly confident in mathematics and the percentage with low confidence increased
between 2011 and 2015.
Compared to mathematics, the percentage of learners who attached a high value to science was lower but
enjoyment of science was higher when compared to mathematics. Again, only 10 per cent of learners expressed
a high confidence in their science abilities, with a seven percentage point decline from 2011.
Figure 6.3: Changes in enjoyment of, value attached to and confidence in mathematics and science, 2011 and 2015
0
20
40
60
80
100
20152011 20152011 20152011 20152011 20152011 20152011
Perc
enta
ge o
f le
arne
rs
Enjoyment Value Confidence Enjoyment Value Confidence
Mathematics Science
High 41 39 72 72 10 10 41 46 57 57 17 10
Medium 44 42 21 24 54 43 45 42 26 31 59 43
Low 15 19 7 4 35 48 14 12 16 12 24 48
In Table 6.2, the relationship between attitudes and achievement is compared across schooling environments.
The relationship between attitude levels and achievement was positive in both subject areas. Learners who were
highly positive about mathematics and science achieved higher average test scores than those with a less positive
outlook, who achieved the lower average scores.
Learners and the home environment
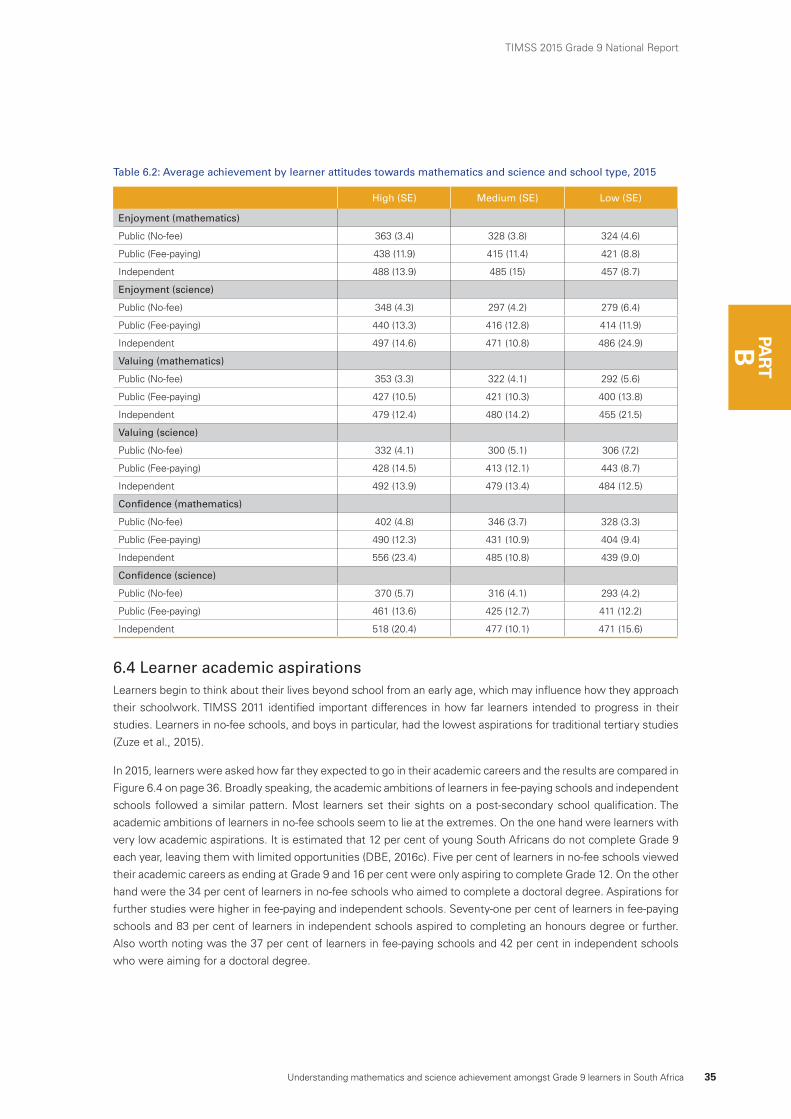
Understanding mathematics and science achievement amongst Grade 9 learners in South Africa 35
TIMSS 2015 Grade 9 National Report
PAR
TB
Table 6.2: Average achievement by learner attitudes towards mathematics and science and school type, 2015
High (SE) Medium (SE) Low (SE)
Enjoyment (mathematics)
Public (No-fee) 363 (3.4) 328 (3.8) 324 (4.6)
Public (Fee-paying) 438 (11.9) 415 (11.4) 421 (8.8)
Independent 488 (13.9) 485 (15) 457 (8.7)
Enjoyment (science)
Public (No-fee) 348 (4.3) 297 (4.2) 279 (6.4)
Public (Fee-paying) 440 (13.3) 416 (12.8) 414 (11.9)
Independent 497 (14.6) 471 (10.8) 486 (24.9)
Valuing (mathematics)
Public (No-fee) 353 (3.3) 322 (4.1) 292 (5.6)
Public (Fee-paying) 427 (10.5) 421 (10.3) 400 (13.8)
Independent 479 (12.4) 480 (14.2) 455 (21.5)
Valuing (science)
Public (No-fee) 332 (4.1) 300 (5.1) 306 (7.2)
Public (Fee-paying) 428 (14.5) 413 (12.1) 443 (8.7)
Independent 492 (13.9) 479 (13.4) 484 (12.5)
Confidence (mathematics)
Public (No-fee) 402 (4.8) 346 (3.7) 328 (3.3)
Public (Fee-paying) 490 (12.3) 431 (10.9) 404 (9.4)
Independent 556 (23.4) 485 (10.8) 439 (9.0)
Confidence (science)
Public (No-fee) 370 (5.7) 316 (4.1) 293 (4.2)
Public (Fee-paying) 461 (13.6) 425 (12.7) 411 (12.2)
Independent 518 (20.4) 477 (10.1) 471 (15.6)
6.4 Learner academic aspirations Learners begin to think about their lives beyond school from an early age, which may influence how they approach
their schoolwork. TIMSS 2011 identified important differences in how far learners intended to progress in their
studies. Learners in no-fee schools, and boys in particular, had the lowest aspirations for traditional tertiary studies
(Zuze et al., 2015).
In 2015, learners were asked how far they expected to go in their academic careers and the results are compared in
Figure 6.4 on page 36. Broadly speaking, the academic ambitions of learners in fee-paying schools and independent
schools followed a similar pattern. Most learners set their sights on a post-secondary school qualification. The
academic ambitions of learners in no-fee schools seem to lie at the extremes. On the one hand were learners with
very low academic aspirations. It is estimated that 12 per cent of young South Africans do not complete Grade 9
each year, leaving them with limited opportunities (DBE, 2016c). Five per cent of learners in no-fee schools viewed
their academic careers as ending at Grade 9 and 16 per cent were only aspiring to complete Grade 12. On the other
hand were the 34 per cent of learners in no-fee schools who aimed to complete a doctoral degree. Aspirations for
further studies were higher in fee-paying and independent schools. Seventy-one per cent of learners in fee-paying
schools and 83 per cent of learners in independent schools aspired to completing an honours degree or further.
Also worth noting was the 37 per cent of learners in fee-paying schools and 42 per cent in independent schools
who were aiming for a doctoral degree.
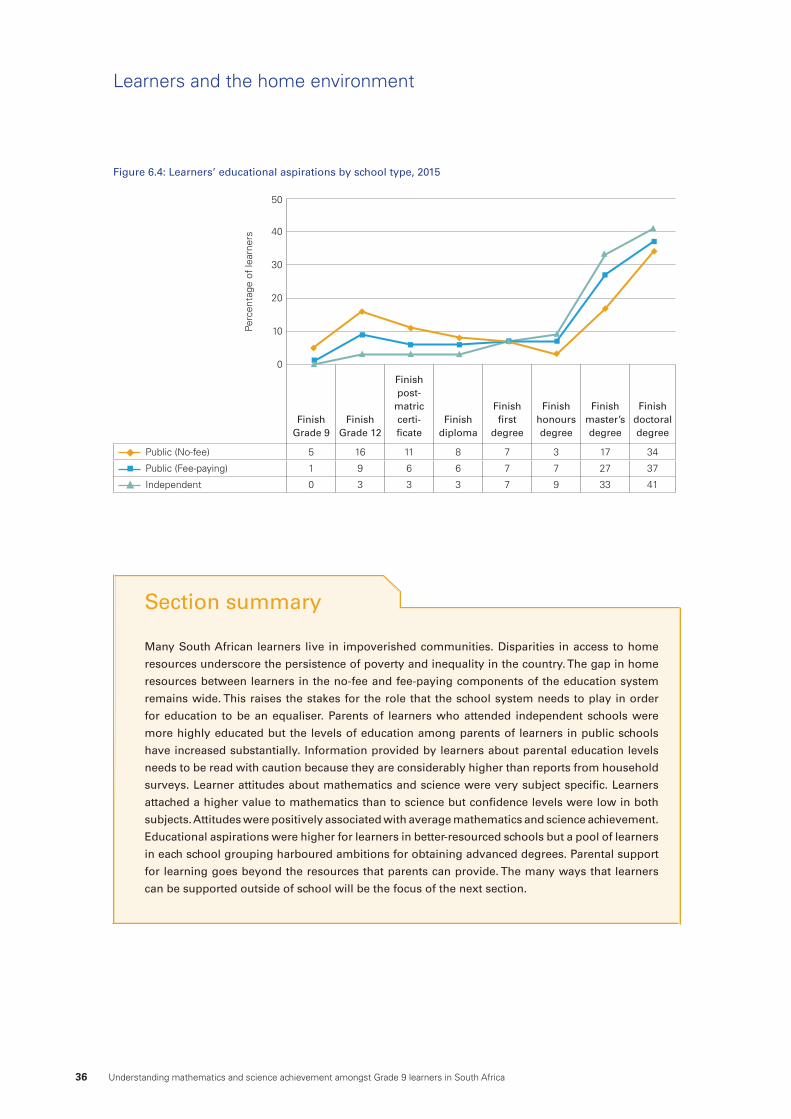
36 Understanding mathematics and science achievement amongst Grade 9 learners in South Africa
Many South African learners live in impoverished communities. Disparities in access to home
resources underscore the persistence of poverty and inequality in the country. The gap in home
resources between learners in the no-fee and fee-paying components of the education system
remains wide. This raises the stakes for the role that the school system needs to play in order
for education to be an equaliser. Parents of learners who attended independent schools were
more highly educated but the levels of education among parents of learners in public schools
have increased substantially. Information provided by learners about parental education levels
needs to be read with caution because they are considerably higher than reports from household
surveys. Learner attitudes about mathematics and science were very subject specific. Learners
attached a higher value to mathematics than to science but confidence levels were low in both
subjects. Attitudes were positively associated with average mathematics and science achievement.
Educational aspirations were higher for learners in better-resourced schools but a pool of learners
in each school grouping harboured ambitions for obtaining advanced degrees. Parental support
for learning goes beyond the resources that parents can provide. The many ways that learners
can be supported outside of school will be the focus of the next section.
Section summary
Figure 6.4: Learners’ educational aspirations by school type, 2015
0
10
20
30
40
50
Perc
enta
ge o
f le
arne
rs
FinishGrade 9
FinishGrade 12
Finishpost-
matriccerti-ficate
Finishdiploma
Finishfirst
degree
Finishhonoursdegree
Finishmaster’sdegree
Finishdoctoraldegree
Public (No-fee) 5 16 11 8 7 3 17 34
Public (Fee-paying) 1 9 6 6 7 7 27 37
Independent 0 3 3 3 7 9 33 41
Learners and the home environment
PAR
TACSUPPORT FOR LEARNING OUTSIDE OF SCHOOL
TIMSS 2015 Grade 9 National Report
Understanding mathematics and science achievement amongst Grade 9 learners in South Africa 37
PART
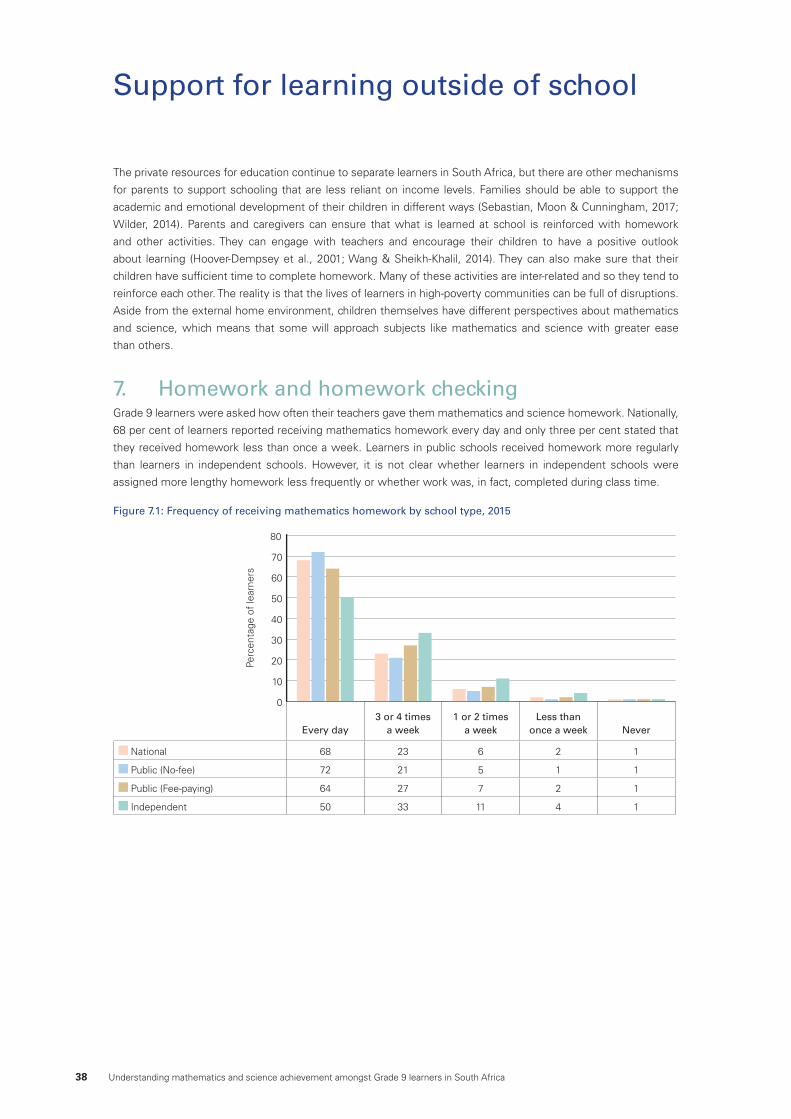
38 Understanding mathematics and science achievement amongst Grade 9 learners in South Africa
The private resources for education continue to separate learners in South Africa, but there are other mechanisms
for parents to support schooling that are less reliant on income levels. Families should be able to support the
academic and emotional development of their children in different ways (Sebastian, Moon & Cunningham, 2017;
Wilder, 2014). Parents and caregivers can ensure that what is learned at school is reinforced with homework
and other activities. They can engage with teachers and encourage their children to have a positive outlook
about learning (Hoover-Dempsey et al., 2001; Wang & Sheikh-Khalil, 2014). They can also make sure that their
children have sufficient time to complete homework. Many of these activities are inter-related and so they tend to
reinforce each other. The reality is that the lives of learners in high-poverty communities can be full of disruptions.
Aside from the external home environment, children themselves have different perspectives about mathematics
and science, which means that some will approach subjects like mathematics and science with greater ease
than others.
7. Homework and homework checkingGrade 9 learners were asked how often their teachers gave them mathematics and science homework. Nationally,
68 per cent of learners reported receiving mathematics homework every day and only three per cent stated that
they received homework less than once a week. Learners in public schools received homework more regularly
than learners in independent schools. However, it is not clear whether learners in independent schools were
assigned more lengthy homework less frequently or whether work was, in fact, completed during class time.
Figure 7.1: Frequency of receiving mathematics homework by school type, 2015
0
10
20
30
40
50
60
70
80
Perc
enta
ge o
f le
arne
rs
Every day3 or 4 times
a week1 or 2 times
a weekLess than
once a week Never
National 68 23 6 2 1
Public (No-fee) 72 21 5 1 1
Public (Fee-paying) 64 27 7 2 1
Independent 50 33 11 4 1
Support for learning outside of school
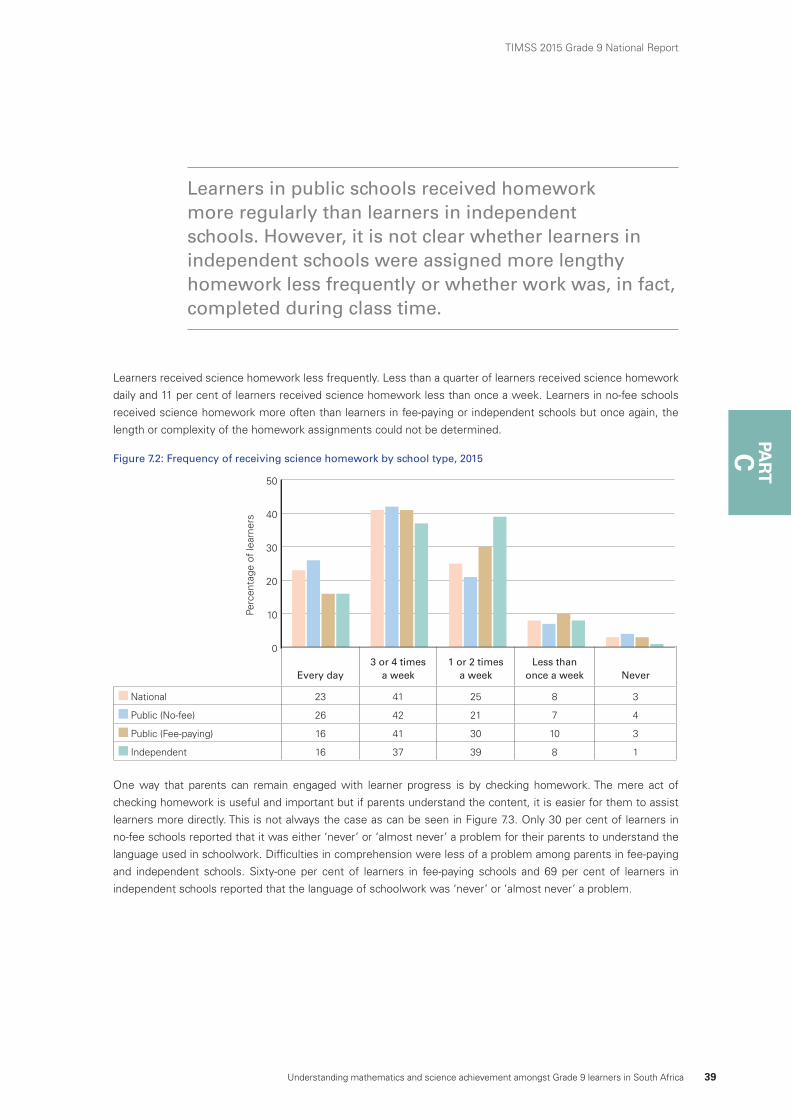
Understanding mathematics and science achievement amongst Grade 9 learners in South Africa 39
TIMSS 2015 Grade 9 National Report
PAR
TC
Learners received science homework less frequently. Less than a quarter of learners received science homework
daily and 11 per cent of learners received science homework less than once a week. Learners in no-fee schools
received science homework more often than learners in fee-paying or independent schools but once again, the
length or complexity of the homework assignments could not be determined.
Figure 7.2: Frequency of receiving science homework by school type, 2015
0
10
20
30
40
50
Perc
enta
ge o
f le
arne
rs
Every day3 or 4 times
a week1 or 2 times
a weekLess than
once a week Never
National 23 41 25 8 3
Public (No-fee) 26 42 21 7 4
Public (Fee-paying) 16 41 30 10 3
Independent 16 37 39 8 1
One way that parents can remain engaged with learner progress is by checking homework. The mere act of
checking homework is useful and important but if parents understand the content, it is easier for them to assist
learners more directly. This is not always the case as can be seen in Figure 7.3. Only 30 per cent of learners in
no-fee schools reported that it was either ‘never’ or ‘almost never’ a problem for their parents to understand the
language used in schoolwork. Difficulties in comprehension were less of a problem among parents in fee-paying
and independent schools. Sixty-one per cent of learners in fee-paying schools and 69 per cent of learners in
independent schools reported that the language of schoolwork was ‘never’ or ‘almost never’ a problem.
Learners in public schools received homework more regularly than learners in independent schools. However, it is not clear whether learners in independent schools were assigned more lengthy homework less frequently or whether work was, in fact, completed during class time.
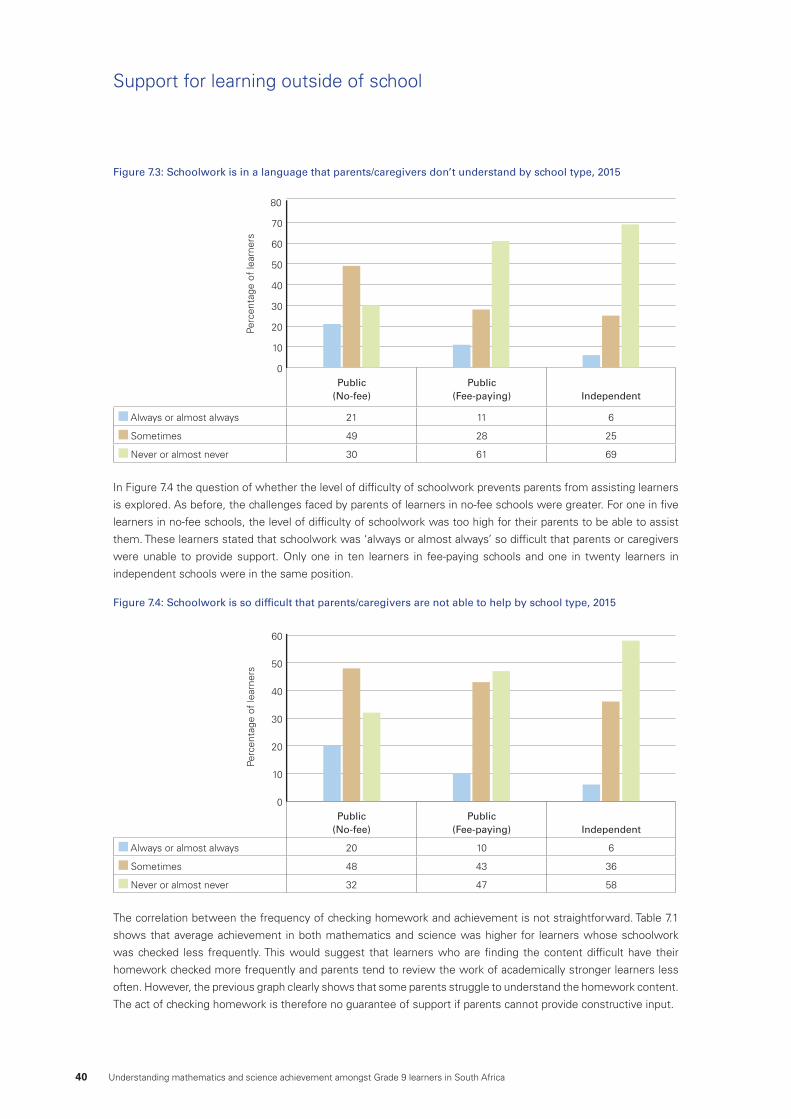
40 Understanding mathematics and science achievement amongst Grade 9 learners in South Africa
Figure 7.3: Schoolwork is in a language that parents/caregivers don’t understand by school type, 2015
0
10
20
30
40
50
60
70
80
Perc
enta
ge o
f le
arne
rs
Public (No-fee)
Public (Fee-paying) Independent
Always or almost always 21 11 6
Sometimes 49 28 25
Never or almost never 30 61 69
In Figure 7.4 the question of whether the level of difficulty of schoolwork prevents parents from assisting learners
is explored. As before, the challenges faced by parents of learners in no-fee schools were greater. For one in five
learners in no-fee schools, the level of difficulty of schoolwork was too high for their parents to be able to assist
them. These learners stated that schoolwork was ‘always or almost always’ so difficult that parents or caregivers
were unable to provide support. Only one in ten learners in fee-paying schools and one in twenty learners in
independent schools were in the same position.
Figure 7.4: Schoolwork is so difficult that parents/caregivers are not able to help by school type, 2015
Public (No-fee)
Public (Fee-paying) Independent
Always or almost always 20 10 6
Sometimes 48 43 36
Never or almost never 32 47 58
0
10
20
30
40
50
60
Perc
enta
ge o
f le
arne
rs
The correlation between the frequency of checking homework and achievement is not straightforward. Table 7.1
shows that average achievement in both mathematics and science was higher for learners whose schoolwork
was checked less frequently. This would suggest that learners who are finding the content difficult have their
homework checked more frequently and parents tend to review the work of academically stronger learners less
often. However, the previous graph clearly shows that some parents struggle to understand the homework content.
The act of checking homework is therefore no guarantee of support if parents cannot provide constructive input.
Support for learning outside of school
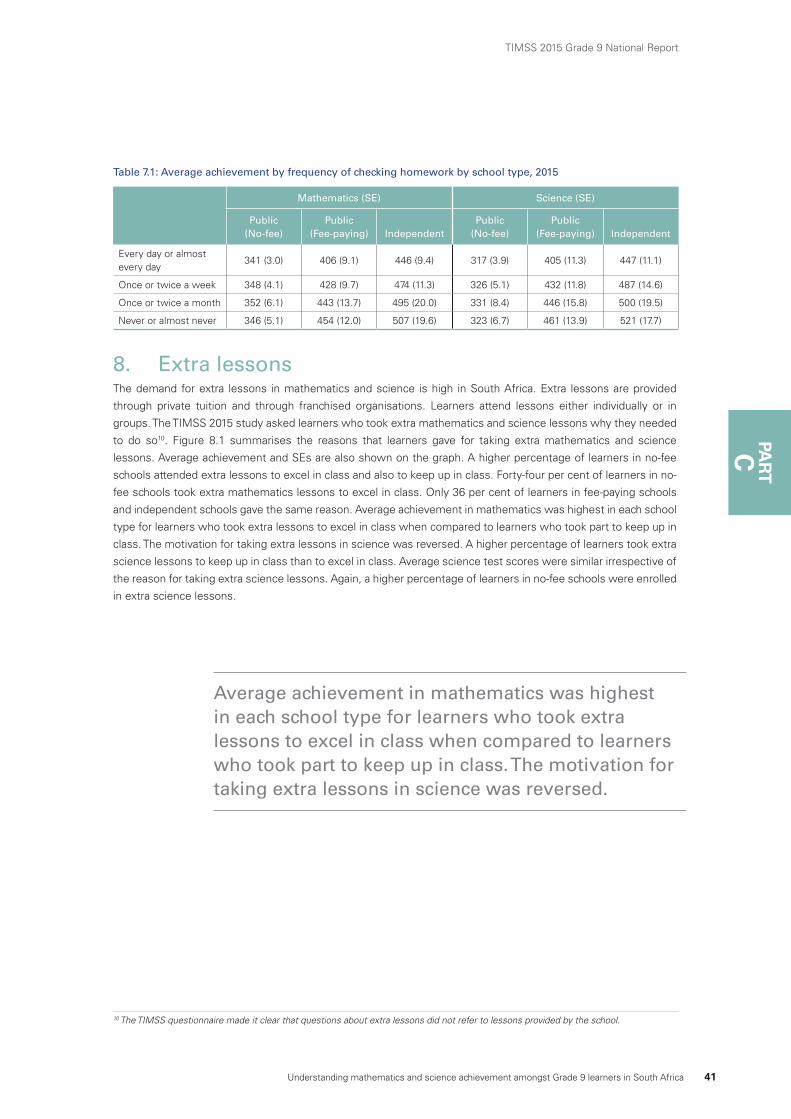
Understanding mathematics and science achievement amongst Grade 9 learners in South Africa 41
TIMSS 2015 Grade 9 National Report
PAR
TC
10 The TIMSS questionnaire made it clear that questions about extra lessons did not refer to lessons provided by the school.
Table 7.1: Average achievement by frequency of checking homework by school type, 2015
Mathematics (SE) Science (SE)
Public (No-fee)
Public (Fee-paying) Independent
Public (No-fee)
Public (Fee-paying) Independent
Every day or almost every day
341 (3.0) 406 (9.1) 446 (9.4) 317 (3.9) 405 (11.3) 447 (11.1)
Once or twice a week 348 (4.1) 428 (9.7) 474 (11.3) 326 (5.1) 432 (11.8) 487 (14.6)
Once or twice a month 352 (6.1) 443 (13.7) 495 (20.0) 331 (8.4) 446 (15.8) 500 (19.5)
Never or almost never 346 (5.1) 454 (12.0) 507 (19.6) 323 (6.7) 461 (13.9) 521 (17.7)
8. Extra lessonsThe demand for extra lessons in mathematics and science is high in South Africa. Extra lessons are provided
through private tuition and through franchised organisations. Learners attend lessons either individually or in
groups. The TIMSS 2015 study asked learners who took extra mathematics and science lessons why they needed
to do so10. Figure 8.1 summarises the reasons that learners gave for taking extra mathematics and science
lessons. Average achievement and SEs are also shown on the graph. A higher percentage of learners in no-fee
schools attended extra lessons to excel in class and also to keep up in class. Forty-four per cent of learners in no-
fee schools took extra mathematics lessons to excel in class. Only 36 per cent of learners in fee-paying schools
and independent schools gave the same reason. Average achievement in mathematics was highest in each school
type for learners who took extra lessons to excel in class when compared to learners who took part to keep up in
class. The motivation for taking extra lessons in science was reversed. A higher percentage of learners took extra
science lessons to keep up in class than to excel in class. Average science test scores were similar irrespective of
the reason for taking extra science lessons. Again, a higher percentage of learners in no-fee schools were enrolled
in extra science lessons.
Average achievement in mathematics was highest in each school type for learners who took extra lessons to excel in class when compared to learners who took part to keep up in class. The motivation for taking extra lessons in science was reversed.
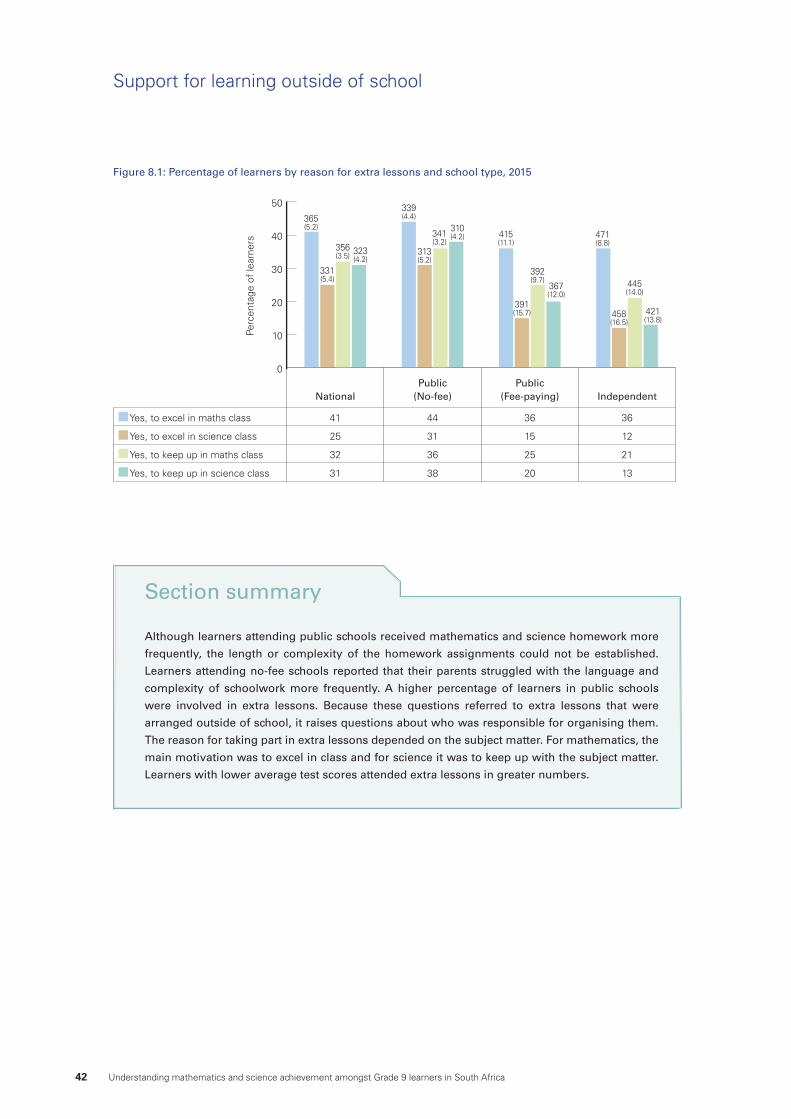
42 Understanding mathematics and science achievement amongst Grade 9 learners in South Africa
Although learners attending public schools received mathematics and science homework more
frequently, the length or complexity of the homework assignments could not be established.
Learners attending no-fee schools reported that their parents struggled with the language and
complexity of schoolwork more frequently. A higher percentage of learners in public schools
were involved in extra lessons. Because these questions referred to extra lessons that were
arranged outside of school, it raises questions about who was responsible for organising them.
The reason for taking part in extra lessons depended on the subject matter. For mathematics, the
main motivation was to excel in class and for science it was to keep up with the subject matter.
Learners with lower average test scores attended extra lessons in greater numbers.
Section summary
Figure 8.1: Percentage of learners by reason for extra lessons and school type, 2015
NationalPublic
(No-fee)Public
(Fee-paying) Independent
Yes, to excel in maths class 41 44 36 36
Yes, to excel in science class 25 31 15 12
Yes, to keep up in maths class 32 36 25 21
Yes, to keep up in science class 31 38 20 13
0
10
20
30
40
50
Perc
enta
ge o
f le
arne
rs
365(5.2)
331(5.4)
356(3.5) 323
(4.2)
339(4.4)
313(5.2)
341(3.2)
310(4.2) 415
(11.1)
391(15.7)
392(9.7)
367(12.0)
471(8.8)
458(16.5)
445(14.0)
421(13.8)
Support for learning outside of school
DPART
A COMPARISON OF THE SCHOOLING ENVIRONMENT
TIMSS 2015 Grade 9 National Report
Understanding mathematics and science achievement amongst Grade 9 learners in South Africa 43
44 Understanding mathematics and science achievement amongst Grade 9 learners in South Africa
Previous sections of this report showed that learners from public schools, particularly no-fee schools, come from
homes that have fewer physical resources at home, and have less-educated parents who are also more likely to
struggle to understand the content of a learner’s schoolwork. Learners from public schools seek support for their
studies through external support programmes in far greater numbers than learners in other schooling environments.
The multiple disadvantages faced by learners from poor homes make the role of schools all the more important.
The following section focuses on access to key physical resources across schooling environments. We considered
specific school resources that have been the focal point of recent DBE policy (textbooks, libraries, laboratories and
computer resources) and that have a known positive relationship with achievement. We also discuss the results
related to the climate11 of the school as well as important aspects of the teaching and learning environment.
9. School resources9.1. Textbook provisionThere is general agreement that textbooks are an important resource to support teaching and learning, especially
when used effectively. Textbook availability has improved. It has been found to have a significant relationship to
academic achievement in many education systems, including South Africa (SACMEQ, 2010; Zuze & Reddy, 2014).
The Draft National Policy for the Provision and Management of Learning and Teaching Support Material (LTSM)
provides guidelines for the production and distribution of quality textbooks and workbooks (DBE, 2014). Textbooks,
workbooks and teacher guides are core LTSMs because they are considered essential for covering the curriculum.
The provision of textbooks in South African public schools has been the focus of attention not only because of
efforts by public interest organisations12 but also because government made ambitious promises about book
provisioning – for example the national workbooks programme. Figure 9.1 summarises learner responses to a
question about whether or not they have their own mathematics and science textbooks. Nationally, 82 per cent of
Grade 9 learners had access to their own mathematics textbook and 69 per cent had access to their own science
textbook. However textbook availability was lower in no-fee schools. Seventy-eight per cent of learners in no-
fee schools had their own mathematics text book in 2015, compared with 88 per cent in fee-paying schools and
85 per cent in independent schools. The gap in science textbook ownership between public and independent
schools was wider than for mathematics. Sixty-six per cent of Grade 9 learners in no-fee schools had their own
science textbook compared to 74 and 82 per cent in fee-paying and independent schools, respectively.
A comparison of the schooling environment
11 The terms ‘school culture’, ‘school climate’ and ‘school environment’ are often used interchangeably but the general meaning of these terms are learners’, parents’ and school personnel’s experience of school life and its associated norms, goals, values, interpersonal relationships, teaching and learning practices, and organisational structures (Rodwell, 2015).
12 A Supreme Court ruling in 2012 guaranteed learners in public schools the right to prescribed textbooks at the beginning of the academic year. Some would argue that turning the spotlight on textbook delivery has been instrumental to raising national awareness on the issue (Veriava, 2013). Others maintain that the textbook crisis is a reflection of decades of corruption and financial mismanagement that need to be addressed for any lasting improvements to take root (Chisholm, 2013).
Learners from public schools seek support for their studies through external support programmes in far greater numbers than learners in other schooling environments.
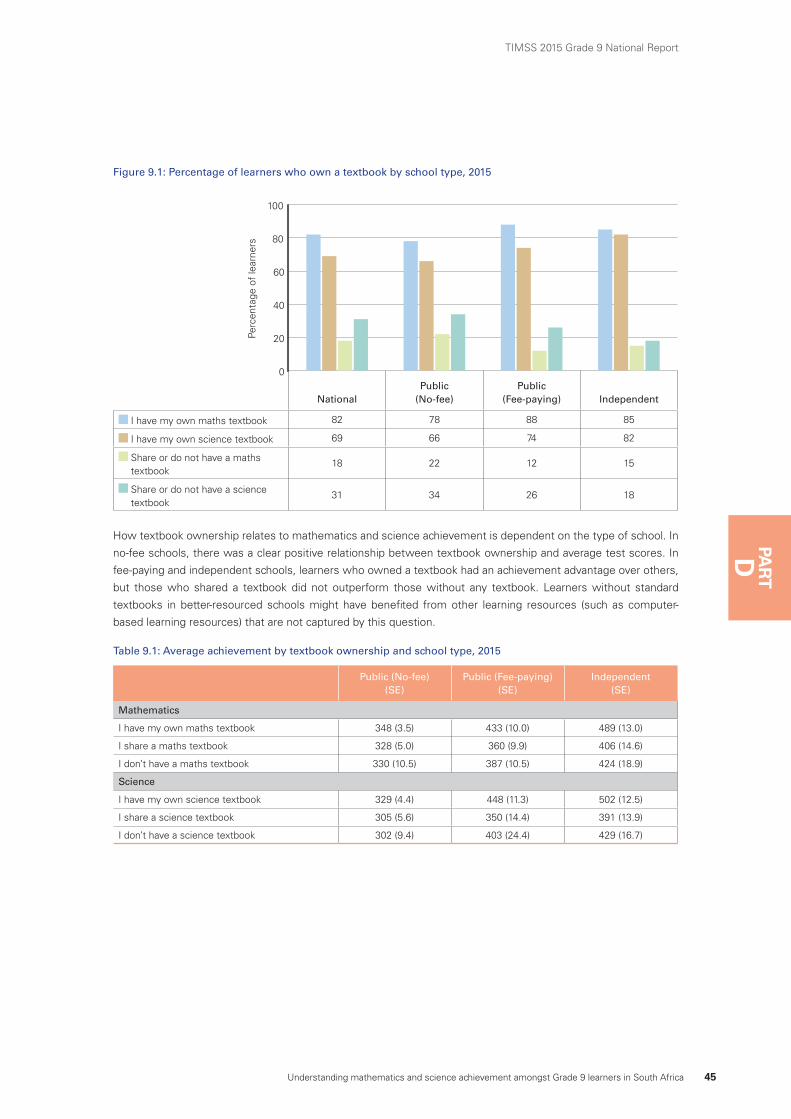
Understanding mathematics and science achievement amongst Grade 9 learners in South Africa 45
TIMSS 2015 Grade 9 National Report
PAR
TD
Figure 9.1: Percentage of learners who own a textbook by school type, 2015
NationalPublic
(No-fee)Public
(Fee-paying) Independent
I have my own maths textbook 82 78 88 85
I have my own science textbook 69 66 74 82
Share or do not have a maths textbook
18 22 12 15
Share or do not have a science textbook
31 34 26 18
0
20
40
60
80
100
Perc
enta
ge o
f le
arne
rs
How textbook ownership relates to mathematics and science achievement is dependent on the type of school. In
no-fee schools, there was a clear positive relationship between textbook ownership and average test scores. In
fee-paying and independent schools, learners who owned a textbook had an achievement advantage over others,
but those who shared a textbook did not outperform those without any textbook. Learners without standard
textbooks in better-resourced schools might have benefited from other learning resources (such as computer-
based learning resources) that are not captured by this question.
Table 9.1: Average achievement by textbook ownership and school type, 2015
Public (No-fee) (SE)
Public (Fee-paying) (SE)
Independent (SE)
Mathematics
I have my own maths textbook 348 (3.5) 433 (10.0) 489 (13.0)
I share a maths textbook 328 (5.0) 360 (9.9) 406 (14.6)
I don’t have a maths textbook 330 (10.5) 387 (10.5) 424 (18.9)
Science
I have my own science textbook 329 (4.4) 448 (11.3) 502 (12.5)
I share a science textbook 305 (5.6) 350 (14.4) 391 (13.9)
I don’t have a science textbook 302 (9.4) 403 (24.4) 429 (16.7)
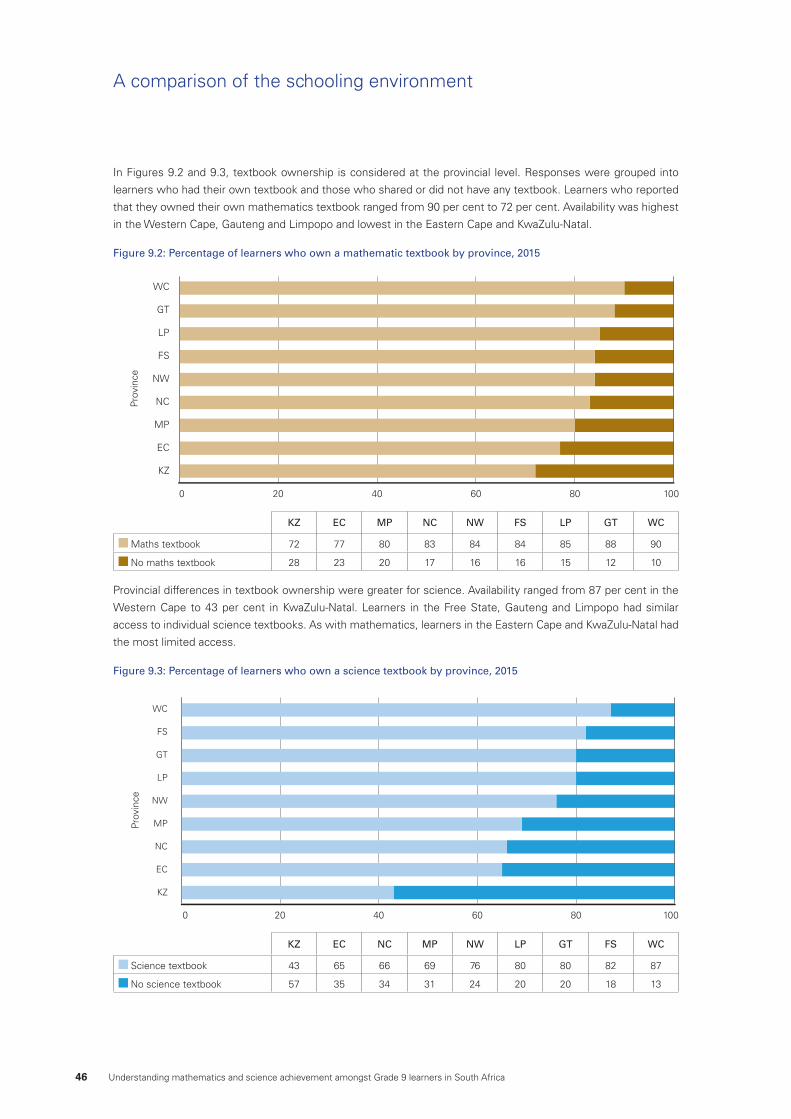
46 Understanding mathematics and science achievement amongst Grade 9 learners in South Africa
In Figures 9.2 and 9.3, textbook ownership is considered at the provincial level. Responses were grouped into
learners who had their own textbook and those who shared or did not have any textbook. Learners who reported
that they owned their own mathematics textbook ranged from 90 per cent to 72 per cent. Availability was highest
in the Western Cape, Gauteng and Limpopo and lowest in the Eastern Cape and KwaZulu-Natal.
Figure 9.2: Percentage of learners who own a mathematic textbook by province, 2015
WC
GT
LP
FS
NW
NC
MP
EC
KZ
0 20 40 60 80 100
Prov
ince
KZ EC MP NC NW FS LP GT WC
Maths textbook 72 77 80 83 84 84 85 88 90
No maths textbook 28 23 20 17 16 16 15 12 10
Provincial differences in textbook ownership were greater for science. Availability ranged from 87 per cent in the
Western Cape to 43 per cent in KwaZulu-Natal. Learners in the Free State, Gauteng and Limpopo had similar
access to individual science textbooks. As with mathematics, learners in the Eastern Cape and KwaZulu-Natal had
the most limited access.
Figure 9.3: Percentage of learners who own a science textbook by province, 2015
WC
FS
GT
LP
NW
MP
NC
EC
KZ
0 20 40 60 80 100
Prov
ince
KZ EC NC MP NW LP GT FS WC
Science textbook 43 65 66 69 76 80 80 82 87
No science textbook 57 35 34 31 24 20 20 18 13
A comparison of the schooling environment
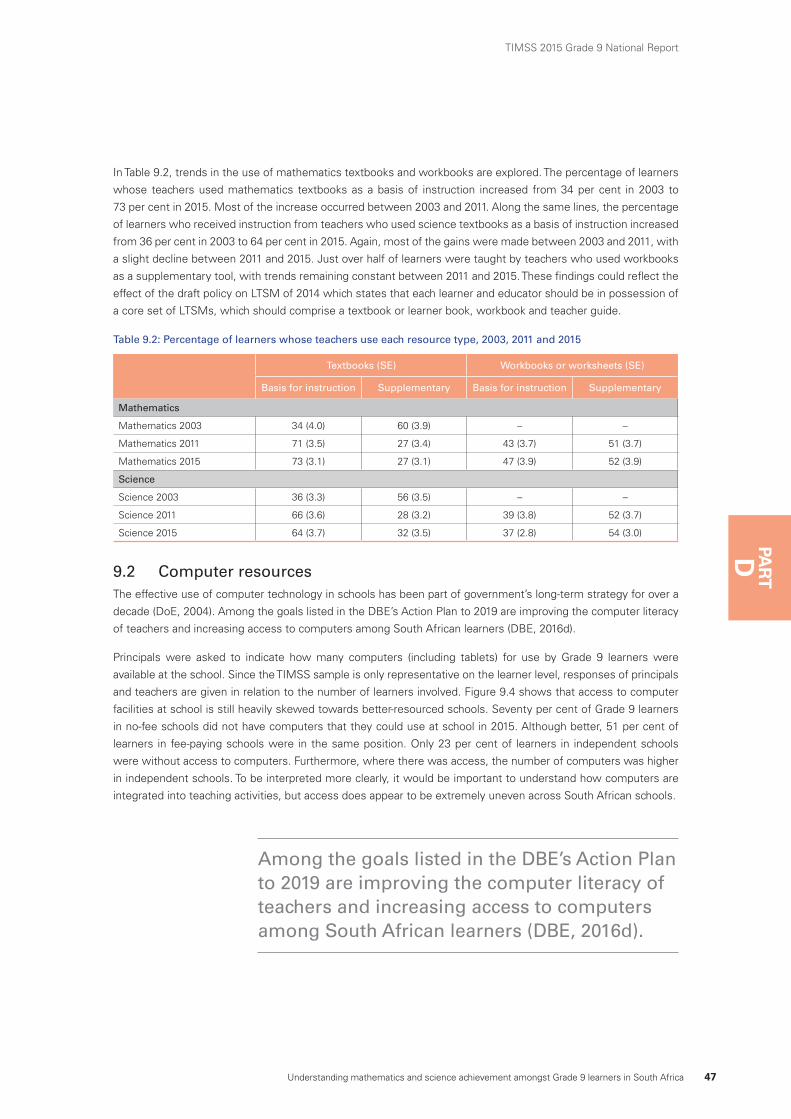
Understanding mathematics and science achievement amongst Grade 9 learners in South Africa 47
TIMSS 2015 Grade 9 National Report
PAR
TD
In Table 9.2, trends in the use of mathematics textbooks and workbooks are explored. The percentage of learners
whose teachers used mathematics textbooks as a basis of instruction increased from 34 per cent in 2003 to
73 per cent in 2015. Most of the increase occurred between 2003 and 2011. Along the same lines, the percentage
of learners who received instruction from teachers who used science textbooks as a basis of instruction increased
from 36 per cent in 2003 to 64 per cent in 2015. Again, most of the gains were made between 2003 and 2011, with
a slight decline between 2011 and 2015. Just over half of learners were taught by teachers who used workbooks
as a supplementary tool, with trends remaining constant between 2011 and 2015. These findings could reflect the
effect of the draft policy on LTSM of 2014 which states that each learner and educator should be in possession of
a core set of LTSMs, which should comprise a textbook or learner book, workbook and teacher guide.
Table 9.2: Percentage of learners whose teachers use each resource type, 2003, 2011 and 2015
Textbooks (SE) Workbooks or worksheets (SE)
Basis for instruction Supplementary Basis for instruction Supplementary
Mathematics
Mathematics 2003 34 (4.0) 60 (3.9) – –
Mathematics 2011 71 (3.5) 27 (3.4) 43 (3.7) 51 (3.7)
Mathematics 2015 73 (3.1) 27 (3.1) 47 (3.9) 52 (3.9)
Science
Science 2003 36 (3.3) 56 (3.5) – –
Science 2011 66 (3.6) 28 (3.2) 39 (3.8) 52 (3.7)
Science 2015 64 (3.7) 32 (3.5) 37 (2.8) 54 (3.0)
9.2 Computer resourcesThe effective use of computer technology in schools has been part of government’s long-term strategy for over a
decade (DoE, 2004). Among the goals listed in the DBE’s Action Plan to 2019 are improving the computer literacy
of teachers and increasing access to computers among South African learners (DBE, 2016d).
Principals were asked to indicate how many computers (including tablets) for use by Grade 9 learners were
available at the school. Since the TIMSS sample is only representative on the learner level, responses of principals
and teachers are given in relation to the number of learners involved. Figure 9.4 shows that access to computer
facilities at school is still heavily skewed towards better-resourced schools. Seventy per cent of Grade 9 learners
in no-fee schools did not have computers that they could use at school in 2015. Although better, 51 per cent of
learners in fee-paying schools were in the same position. Only 23 per cent of learners in independent schools
were without access to computers. Furthermore, where there was access, the number of computers was higher
in independent schools. To be interpreted more clearly, it would be important to understand how computers are
integrated into teaching activities, but access does appear to be extremely uneven across South African schools.
Among the goals listed in the DBE’s Action Plan to 2019 are improving the computer literacy of teachers and increasing access to computers among South African learners (DBE, 2016d).
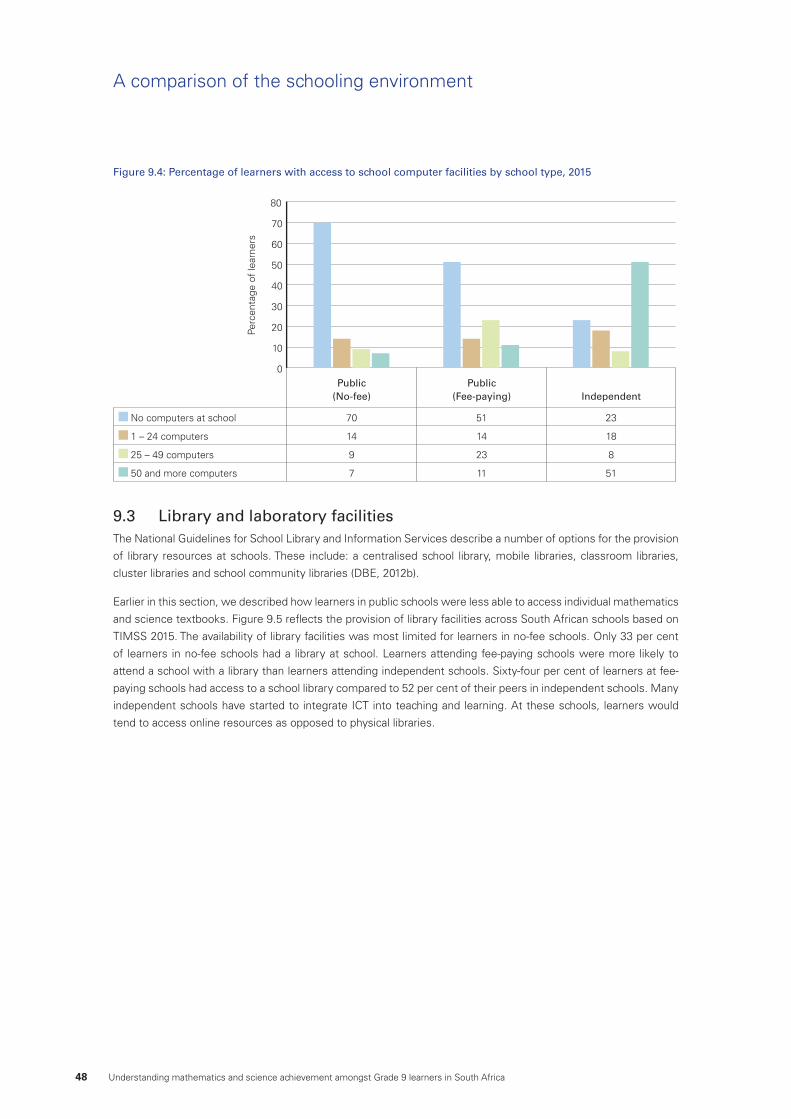
48 Understanding mathematics and science achievement amongst Grade 9 learners in South Africa
Figure 9.4: Percentage of learners with access to school computer facilities by school type, 2015
0
10
20
30
40
50
60
70
80
Perc
enta
ge o
f le
arne
rs
Public (No-fee)
Public(Fee-paying) Independent
No computers at school 70 51 23
1 – 24 computers 14 14 18
25 – 49 computers 9 23 8
50 and more computers 7 11 51
9.3 Library and laboratory facilitiesThe National Guidelines for School Library and Information Services describe a number of options for the provision
of library resources at schools. These include: a centralised school library, mobile libraries, classroom libraries,
cluster libraries and school community libraries (DBE, 2012b).
Earlier in this section, we described how learners in public schools were less able to access individual mathematics
and science textbooks. Figure 9.5 reflects the provision of library facilities across South African schools based on
TIMSS 2015. The availability of library facilities was most limited for learners in no-fee schools. Only 33 per cent
of learners in no-fee schools had a library at school. Learners attending fee-paying schools were more likely to
attend a school with a library than learners attending independent schools. Sixty-four per cent of learners at fee-
paying schools had access to a school library compared to 52 per cent of their peers in independent schools. Many
independent schools have started to integrate ICT into teaching and learning. At these schools, learners would
tend to access online resources as opposed to physical libraries.
A comparison of the schooling environment
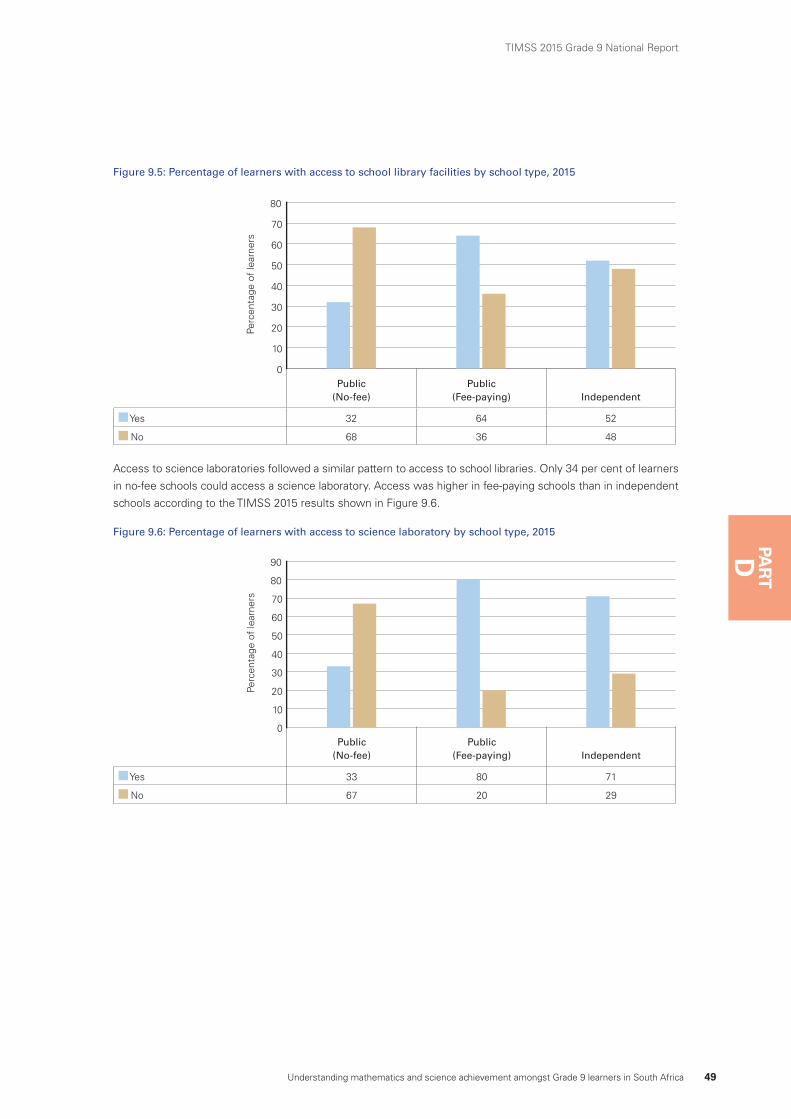
Understanding mathematics and science achievement amongst Grade 9 learners in South Africa 49
TIMSS 2015 Grade 9 National Report
PAR
TD
Figure 9.5: Percentage of learners with access to school library facilities by school type, 2015
Public (No-fee)
Public(Fee-paying) Independent
Yes 32 64 52
No 68 36 48
0
10
20
30
40
50
60
70
80
Perc
enta
ge o
f le
arne
rs
Access to science laboratories followed a similar pattern to access to school libraries. Only 34 per cent of learners
in no-fee schools could access a science laboratory. Access was higher in fee-paying schools than in independent
schools according to the TIMSS 2015 results shown in Figure 9.6.
Figure 9.6: Percentage of learners with access to science laboratory by school type, 2015
Public (No-fee)
Public(Fee-paying) Independent
Yes 33 80 71
No 67 20 29
0
10
20
30
40
50
60
70
80
90
Perc
enta
ge o
f le
arne
rs
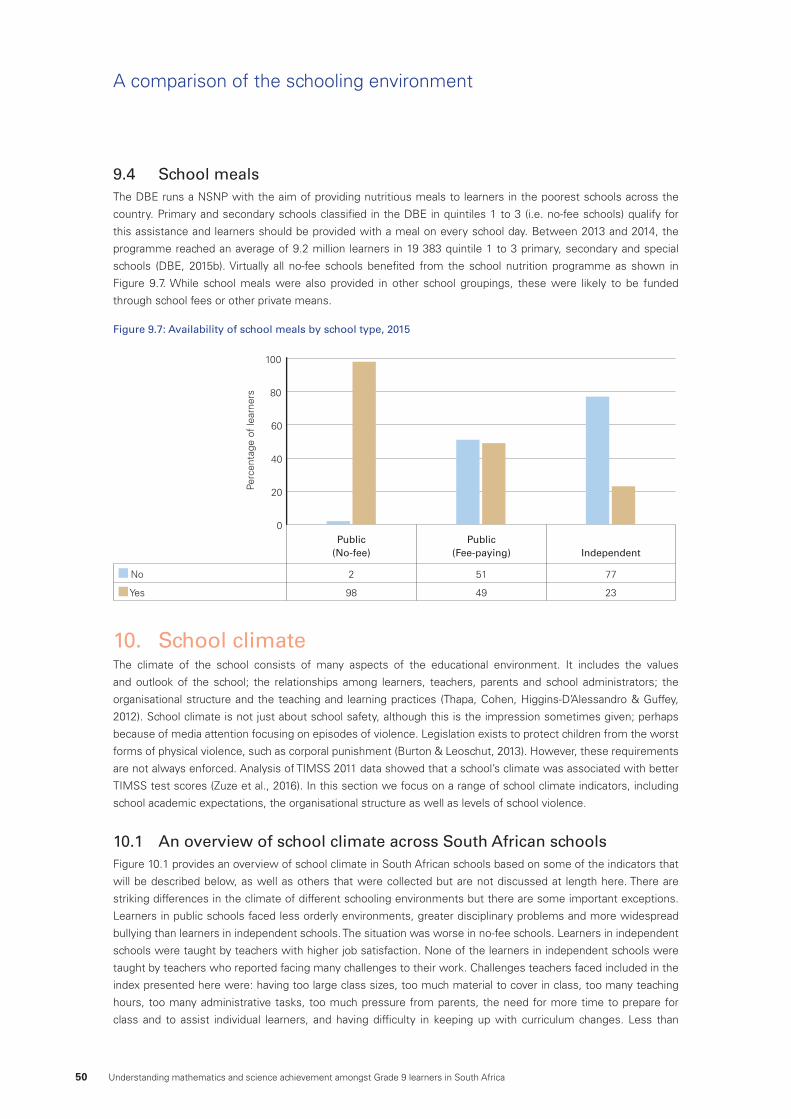
50 Understanding mathematics and science achievement amongst Grade 9 learners in South Africa
9.4 School mealsThe DBE runs a NSNP with the aim of providing nutritious meals to learners in the poorest schools across the
country. Primary and secondary schools classified in the DBE in quintiles 1 to 3 (i.e. no-fee schools) qualify for
this assistance and learners should be provided with a meal on every school day. Between 2013 and 2014, the
programme reached an average of 9.2 million learners in 19 383 quintile 1 to 3 primary, secondary and special
schools (DBE, 2015b). Virtually all no-fee schools benefited from the school nutrition programme as shown in
Figure 9.7. While school meals were also provided in other school groupings, these were likely to be funded
through school fees or other private means.
Figure 9.7: Availability of school meals by school type, 2015
Public (No-fee)
Public(Fee-paying) Independent
No 2 51 77
Yes 98 49 23
0
20
40
60
80
100
Perc
enta
ge o
f le
arne
rs
10. School climateThe climate of the school consists of many aspects of the educational environment. It includes the values
and outlook of the school; the relationships among learners, teachers, parents and school administrators; the
organisational structure and the teaching and learning practices (Thapa, Cohen, Higgins-D’Alessandro & Guffey,
2012). School climate is not just about school safety, although this is the impression sometimes given; perhaps
because of media attention focusing on episodes of violence. Legislation exists to protect children from the worst
forms of physical violence, such as corporal punishment (Burton & Leoschut, 2013). However, these requirements
are not always enforced. Analysis of TIMSS 2011 data showed that a school’s climate was associated with better
TIMSS test scores (Zuze et al., 2016). In this section we focus on a range of school climate indicators, including
school academic expectations, the organisational structure as well as levels of school violence.
10.1 An overview of school climate across South African schoolsFigure 10.1 provides an overview of school climate in South African schools based on some of the indicators that
will be described below, as well as others that were collected but are not discussed at length here. There are
striking differences in the climate of different schooling environments but there are some important exceptions.
Learners in public schools faced less orderly environments, greater disciplinary problems and more widespread
bullying than learners in independent schools. The situation was worse in no-fee schools. Learners in independent
schools were taught by teachers with higher job satisfaction. None of the learners in independent schools were
taught by teachers who reported facing many challenges to their work. Challenges teachers faced included in the
index presented here were: having too large class sizes, too much material to cover in class, too many teaching
hours, too many administrative tasks, too much pressure from parents, the need for more time to prepare for
class and to assist individual learners, and having difficulty in keeping up with curriculum changes. Less than
A comparison of the schooling environment
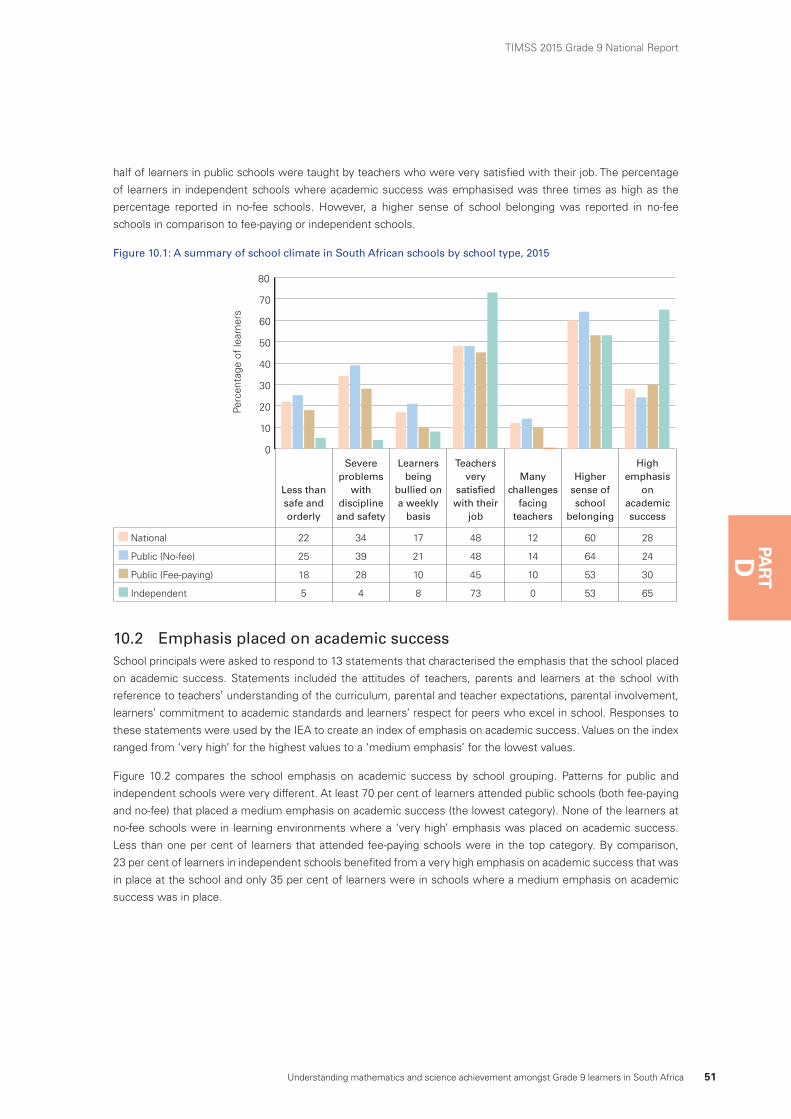
Understanding mathematics and science achievement amongst Grade 9 learners in South Africa 51
TIMSS 2015 Grade 9 National Report
PAR
TD
half of learners in public schools were taught by teachers who were very satisfied with their job. The percentage
of learners in independent schools where academic success was emphasised was three times as high as the
percentage reported in no-fee schools. However, a higher sense of school belonging was reported in no-fee
schools in comparison to fee-paying or independent schools.
Figure 10.1: A summary of school climate in South African schools by school type, 2015
Less than safe and orderly
Severe problems
with discipline and safety
Learners being
bullied on a weekly
basis
Teachers very
satisfied with their
job
Many challenges
facing teachers
Higher sense of school
belonging
High emphasis
on academic success
National 22 34 17 48 12 60 28
Public (No-fee) 25 39 21 48 14 64 24
Public (Fee-paying) 18 28 10 45 10 53 30
Independent 5 4 8 73 0 53 65
0
10
20
30
40
50
60
70
80
Perc
enta
ge o
f le
arne
rs
10.2 Emphasis placed on academic successSchool principals were asked to respond to 13 statements that characterised the emphasis that the school placed
on academic success. Statements included the attitudes of teachers, parents and learners at the school with
reference to teachers’ understanding of the curriculum, parental and teacher expectations, parental involvement,
learners’ commitment to academic standards and learners’ respect for peers who excel in school. Responses to
these statements were used by the IEA to create an index of emphasis on academic success. Values on the index
ranged from ‘very high’ for the highest values to a ‘medium emphasis’ for the lowest values.
Figure 10.2 compares the school emphasis on academic success by school grouping. Patterns for public and
independent schools were very different. At least 70 per cent of learners attended public schools (both fee-paying
and no-fee) that placed a medium emphasis on academic success (the lowest category). None of the learners at
no-fee schools were in learning environments where a ‘very high’ emphasis was placed on academic success.
Less than one per cent of learners that attended fee-paying schools were in the top category. By comparison,
23 per cent of learners in independent schools benefited from a very high emphasis on academic success that was
in place at the school and only 35 per cent of learners were in schools where a medium emphasis on academic
success was in place.
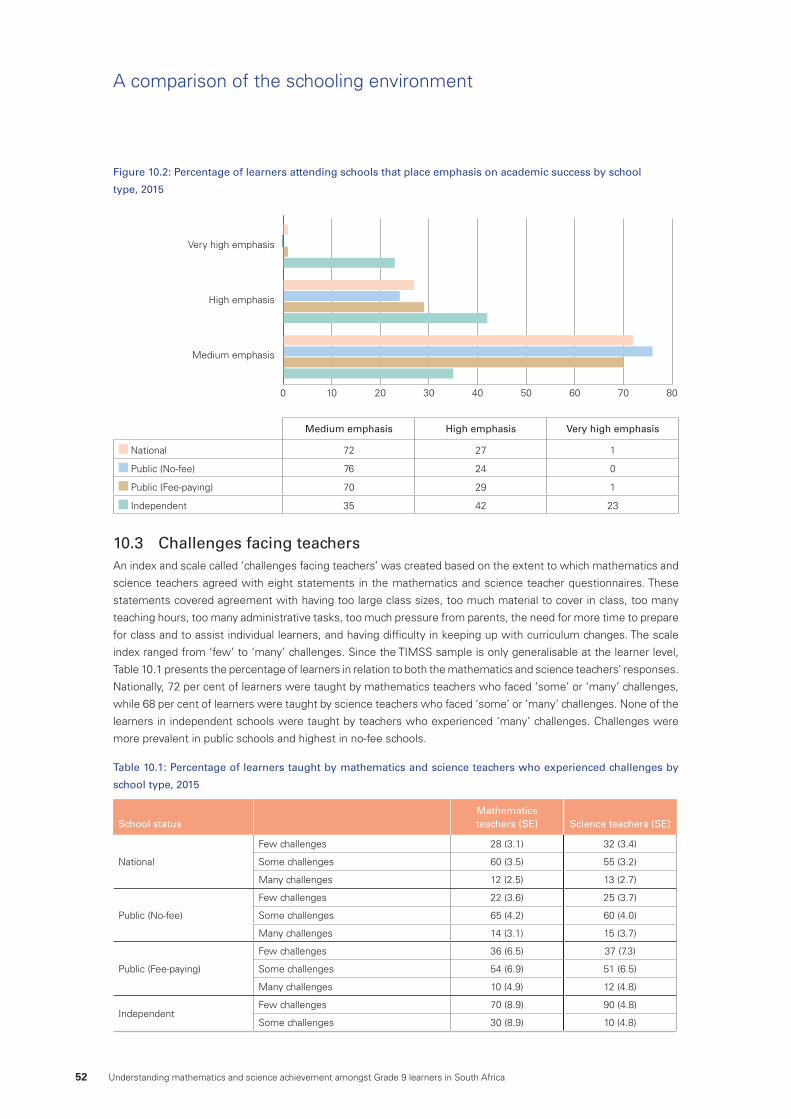
52 Understanding mathematics and science achievement amongst Grade 9 learners in South Africa
Figure 10.2: Percentage of learners attending schools that place emphasis on academic success by school
type, 2015
0 10 20 30 40 50 60 70 80
Very high emphasis
High emphasis
Medium emphasis
Medium emphasis High emphasis Very high emphasis
National 72 27 1
Public (No-fee) 76 24 0
Public (Fee-paying) 70 29 1
Independent 35 42 23
10.3 Challenges facing teachersAn index and scale called ‘challenges facing teachers’ was created based on the extent to which mathematics and
science teachers agreed with eight statements in the mathematics and science teacher questionnaires. These
statements covered agreement with having too large class sizes, too much material to cover in class, too many
teaching hours, too many administrative tasks, too much pressure from parents, the need for more time to prepare
for class and to assist individual learners, and having difficulty in keeping up with curriculum changes. The scale
index ranged from ‘few’ to ‘many’ challenges. Since the TIMSS sample is only generalisable at the learner level,
Table 10.1 presents the percentage of learners in relation to both the mathematics and science teachers’ responses.
Nationally, 72 per cent of learners were taught by mathematics teachers who faced ‘some’ or ‘many’ challenges,
while 68 per cent of learners were taught by science teachers who faced ‘some’ or ‘many’ challenges. None of the
learners in independent schools were taught by teachers who experienced ‘many’ challenges. Challenges were
more prevalent in public schools and highest in no-fee schools.
Table 10.1: Percentage of learners taught by mathematics and science teachers who experienced challenges by
school type, 2015
School status Mathematics teachers (SE) Science teachers (SE)
National
Few challenges 28 (3.1) 32 (3.4)
Some challenges 60 (3.5) 55 (3.2)
Many challenges 12 (2.5) 13 (2.7)
Public (No-fee)
Few challenges 22 (3.6) 25 (3.7)
Some challenges 65 (4.2) 60 (4.0)
Many challenges 14 (3.1) 15 (3.7)
Public (Fee-paying)
Few challenges 36 (6.5) 37 (7.3)
Some challenges 54 (6.9) 51 (6.5)
Many challenges 10 (4.9) 12 (4.8)
IndependentFew challenges 70 (8.9) 90 (4.8)
Some challenges 30 (8.9) 10 (4.8)
A comparison of the schooling environment
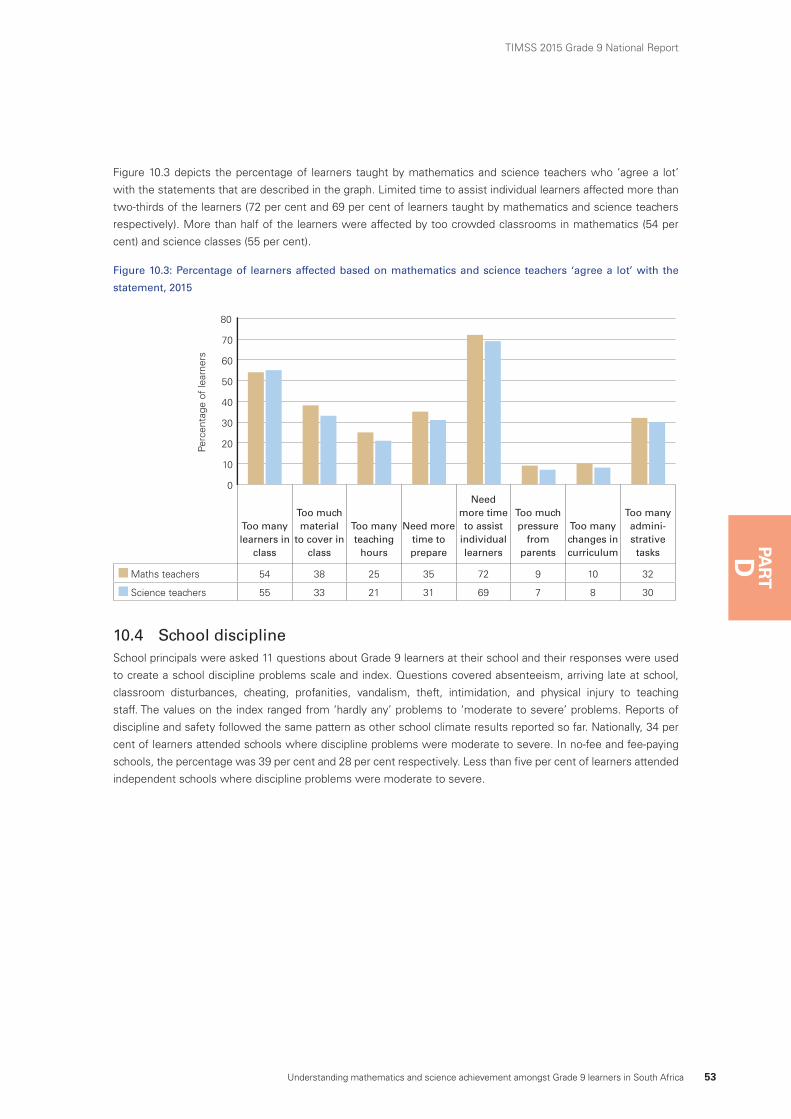
Understanding mathematics and science achievement amongst Grade 9 learners in South Africa 53
TIMSS 2015 Grade 9 National Report
PAR
TD
Figure 10.3 depicts the percentage of learners taught by mathematics and science teachers who ‘agree a lot’
with the statements that are described in the graph. Limited time to assist individual learners affected more than
two-thirds of the learners (72 per cent and 69 per cent of learners taught by mathematics and science teachers
respectively). More than half of the learners were affected by too crowded classrooms in mathematics (54 per
cent) and science classes (55 per cent).
Figure 10.3: Percentage of learners affected based on mathematics and science teachers ‘agree a lot’ with the
statement, 2015
Too many learners in
class
Too much material
to cover in class
Too many teaching
hours
Need more time to prepare
Need more time to assist
individual learners
Too much pressure
from parents
Too many changes in curriculum
Too many admini-strative
tasks
Maths teachers 54 38 25 35 72 9 10 32
Science teachers 55 33 21 31 69 7 8 30
0
10
20
30
40
50
60
70
80
Perc
enta
ge o
f le
arne
rs
10.4 School disciplineSchool principals were asked 11 questions about Grade 9 learners at their school and their responses were used
to create a school discipline problems scale and index. Questions covered absenteeism, arriving late at school,
classroom disturbances, cheating, profanities, vandalism, theft, intimidation, and physical injury to teaching
staff. The values on the index ranged from ‘hardly any’ problems to ‘moderate to severe’ problems. Reports of
discipline and safety followed the same pattern as other school climate results reported so far. Nationally, 34 per
cent of learners attended schools where discipline problems were moderate to severe. In no-fee and fee-paying
schools, the percentage was 39 per cent and 28 per cent respectively. Less than five per cent of learners attended
independent schools where discipline problems were moderate to severe.
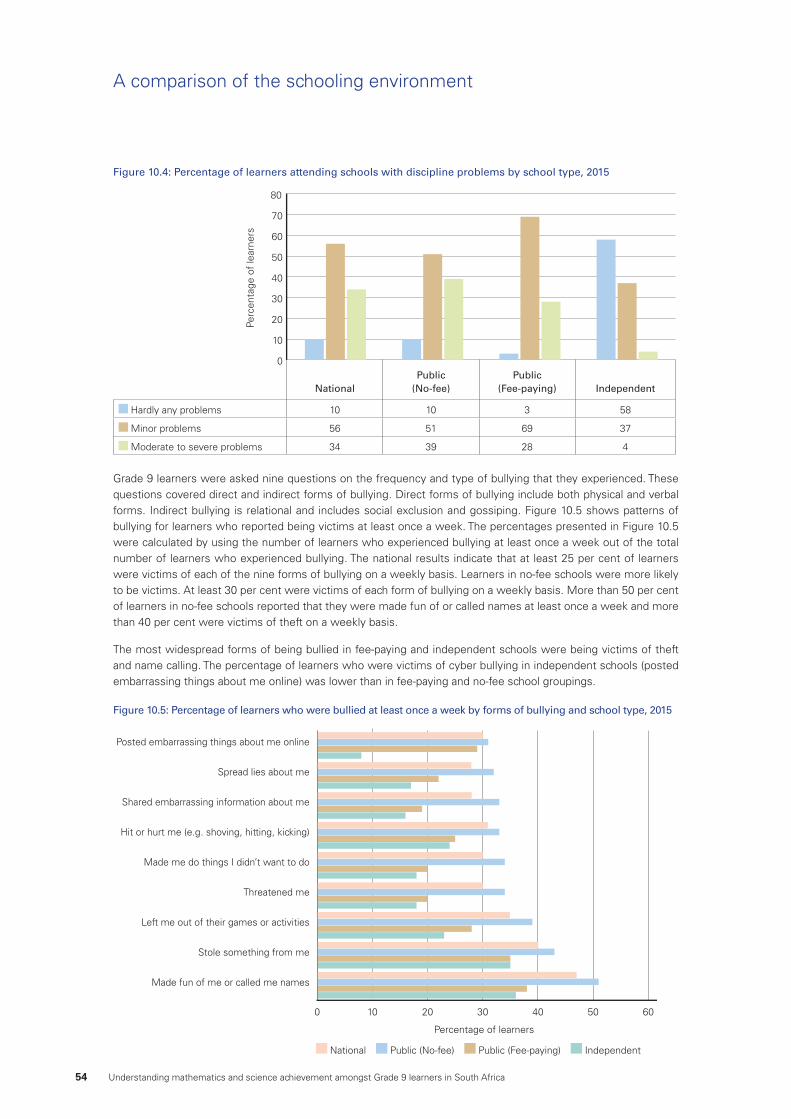
54 Understanding mathematics and science achievement amongst Grade 9 learners in South Africa
Figure 10.4: Percentage of learners attending schools with discipline problems by school type, 2015
NationalPublic
(No-fee)Public
(Fee-paying) Independent
Hardly any problems 10 10 3 58
Minor problems 56 51 69 37
Moderate to severe problems 34 39 28 4
0
10
20
30
40
50
60
70
80
Perc
enta
ge o
f le
arne
rs
Grade 9 learners were asked nine questions on the frequency and type of bullying that they experienced. These questions covered direct and indirect forms of bullying. Direct forms of bullying include both physical and verbal forms. Indirect bullying is relational and includes social exclusion and gossiping. Figure 10.5 shows patterns of bullying for learners who reported being victims at least once a week. The percentages presented in Figure 10.5 were calculated by using the number of learners who experienced bullying at least once a week out of the total number of learners who experienced bullying. The national results indicate that at least 25 per cent of learners were victims of each of the nine forms of bullying on a weekly basis. Learners in no-fee schools were more likely to be victims. At least 30 per cent were victims of each form of bullying on a weekly basis. More than 50 per cent of learners in no-fee schools reported that they were made fun of or called names at least once a week and more than 40 per cent were victims of theft on a weekly basis.
The most widespread forms of being bullied in fee-paying and independent schools were being victims of theft and name calling. The percentage of learners who were victims of cyber bullying in independent schools (posted embarrassing things about me online) was lower than in fee-paying and no-fee school groupings.
Figure 10.5: Percentage of learners who were bullied at least once a week by forms of bullying and school type, 2015
0 10 20 30 40 50 60
Posted embarrassing things about me online
Spread lies about me
Shared embarrassing information about me
Hit or hurt me (e.g. shoving, hitting, kicking)
Made me do things I didn’t want to do
Threatened me
Left me out of their games or activities
Stole something from me
Made fun of me or called me names
Percentage of learners
A comparison of the schooling environment
National Public (No-fee) Public (Fee-paying) Independent
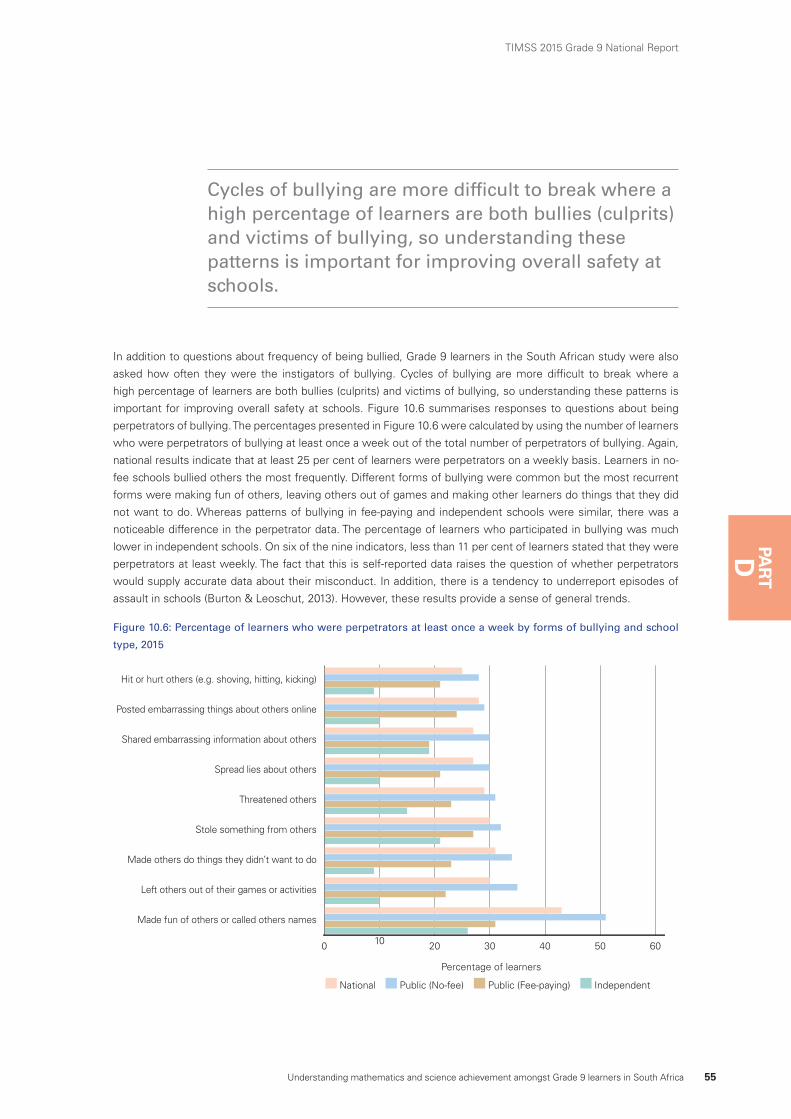
Understanding mathematics and science achievement amongst Grade 9 learners in South Africa 55
TIMSS 2015 Grade 9 National Report
PAR
TD
In addition to questions about frequency of being bullied, Grade 9 learners in the South African study were also
asked how often they were the instigators of bullying. Cycles of bullying are more difficult to break where a
high percentage of learners are both bullies (culprits) and victims of bullying, so understanding these patterns is
important for improving overall safety at schools. Figure 10.6 summarises responses to questions about being
perpetrators of bullying. The percentages presented in Figure 10.6 were calculated by using the number of learners
who were perpetrators of bullying at least once a week out of the total number of perpetrators of bullying. Again,
national results indicate that at least 25 per cent of learners were perpetrators on a weekly basis. Learners in no-
fee schools bullied others the most frequently. Different forms of bullying were common but the most recurrent
forms were making fun of others, leaving others out of games and making other learners do things that they did
not want to do. Whereas patterns of bullying in fee-paying and independent schools were similar, there was a
noticeable difference in the perpetrator data. The percentage of learners who participated in bullying was much
lower in independent schools. On six of the nine indicators, less than 11 per cent of learners stated that they were
perpetrators at least weekly. The fact that this is self-reported data raises the question of whether perpetrators
would supply accurate data about their misconduct. In addition, there is a tendency to underreport episodes of
assault in schools (Burton & Leoschut, 2013). However, these results provide a sense of general trends.
Figure 10.6: Percentage of learners who were perpetrators at least once a week by forms of bullying and school
type, 2015
0 10 20 30 40 50 60
Hit or hurt others (e.g. shoving, hitting, kicking)
Posted embarrassing things about others online
Shared embarrassing information about others
Spread lies about others
Threatened others
Stole something from others
Made others do things they didn’t want to do
Left others out of their games or activities
Made fun of others or called others names
Percentage of learners
Cycles of bullying are more difficult to break where a high percentage of learners are both bullies (culprits) and victims of bullying, so understanding these patterns is important for improving overall safety at schools.
National Public (No-fee) Public (Fee-paying) Independent
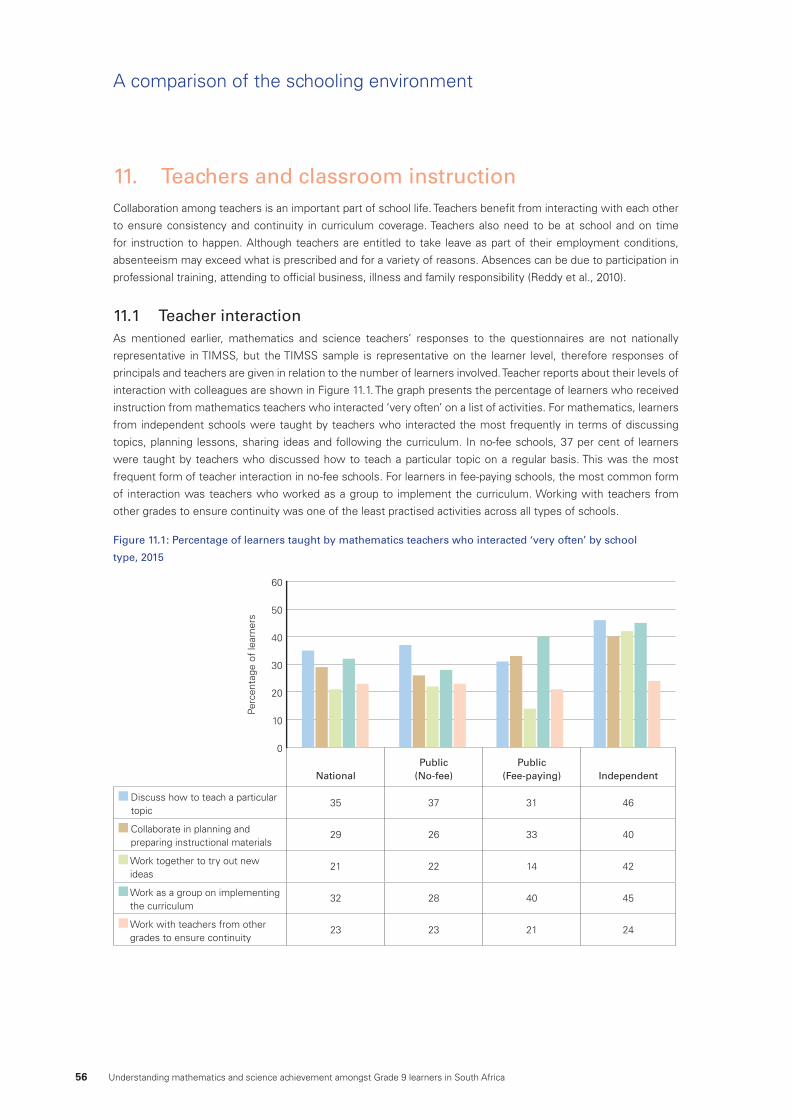
56 Understanding mathematics and science achievement amongst Grade 9 learners in South Africa
11. Teachers and classroom instruction Collaboration among teachers is an important part of school life. Teachers benefit from interacting with each other
to ensure consistency and continuity in curriculum coverage. Teachers also need to be at school and on time
for instruction to happen. Although teachers are entitled to take leave as part of their employment conditions,
absenteeism may exceed what is prescribed and for a variety of reasons. Absences can be due to participation in
professional training, attending to official business, illness and family responsibility (Reddy et al., 2010).
11.1 Teacher interactionAs mentioned earlier, mathematics and science teachers’ responses to the questionnaires are not nationally
representative in TIMSS, but the TIMSS sample is representative on the learner level, therefore responses of
principals and teachers are given in relation to the number of learners involved. Teacher reports about their levels of
interaction with colleagues are shown in Figure 11.1. The graph presents the percentage of learners who received
instruction from mathematics teachers who interacted ‘very often’ on a list of activities. For mathematics, learners
from independent schools were taught by teachers who interacted the most frequently in terms of discussing
topics, planning lessons, sharing ideas and following the curriculum. In no-fee schools, 37 per cent of learners
were taught by teachers who discussed how to teach a particular topic on a regular basis. This was the most
frequent form of teacher interaction in no-fee schools. For learners in fee-paying schools, the most common form
of interaction was teachers who worked as a group to implement the curriculum. Working with teachers from
other grades to ensure continuity was one of the least practised activities across all types of schools.
Figure 11.1: Percentage of learners taught by mathematics teachers who interacted ‘very often’ by school
type, 2015
NationalPublic
(No-fee)Public
(Fee-paying) Independent
Discuss how to teach a particular topic
35 37 31 46
Collaborate in planning and preparing instructional materials
29 26 33 40
Work together to try out new ideas
21 22 14 42
Work as a group on implementing the curriculum
32 28 40 45
Work with teachers from other grades to ensure continuity
23 23 21 24
0
10
20
30
40
50
60
Perc
enta
ge o
f le
arne
rs
A comparison of the schooling environment
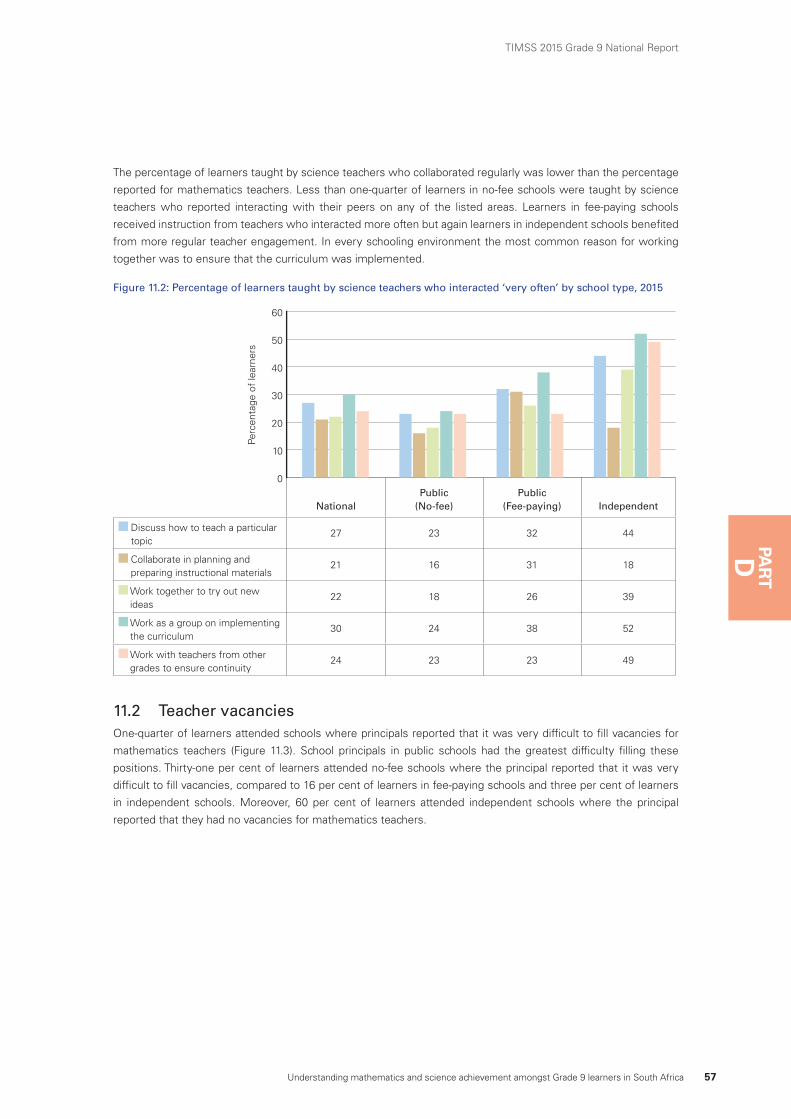
Understanding mathematics and science achievement amongst Grade 9 learners in South Africa 57
TIMSS 2015 Grade 9 National Report
PAR
TD
The percentage of learners taught by science teachers who collaborated regularly was lower than the percentage
reported for mathematics teachers. Less than one-quarter of learners in no-fee schools were taught by science
teachers who reported interacting with their peers on any of the listed areas. Learners in fee-paying schools
received instruction from teachers who interacted more often but again learners in independent schools benefited
from more regular teacher engagement. In every schooling environment the most common reason for working
together was to ensure that the curriculum was implemented.
Figure 11.2: Percentage of learners taught by science teachers who interacted ‘very often’ by school type, 2015
NationalPublic
(No-fee)Public
(Fee-paying) Independent
Discuss how to teach a particular topic
27 23 32 44
Collaborate in planning and preparing instructional materials
21 16 31 18
Work together to try out new ideas
22 18 26 39
Work as a group on implementing the curriculum
30 24 38 52
Work with teachers from other grades to ensure continuity
24 23 23 49
0
10
20
30
40
50
60
Perc
enta
ge o
f le
arne
rs
11.2 Teacher vacanciesOne-quarter of learners attended schools where principals reported that it was very difficult to fill vacancies for
mathematics teachers (Figure 11.3). School principals in public schools had the greatest difficulty filling these
positions. Thirty-one per cent of learners attended no-fee schools where the principal reported that it was very
difficult to fill vacancies, compared to 16 per cent of learners in fee-paying schools and three per cent of learners
in independent schools. Moreover, 60 per cent of learners attended independent schools where the principal
reported that they had no vacancies for mathematics teachers.
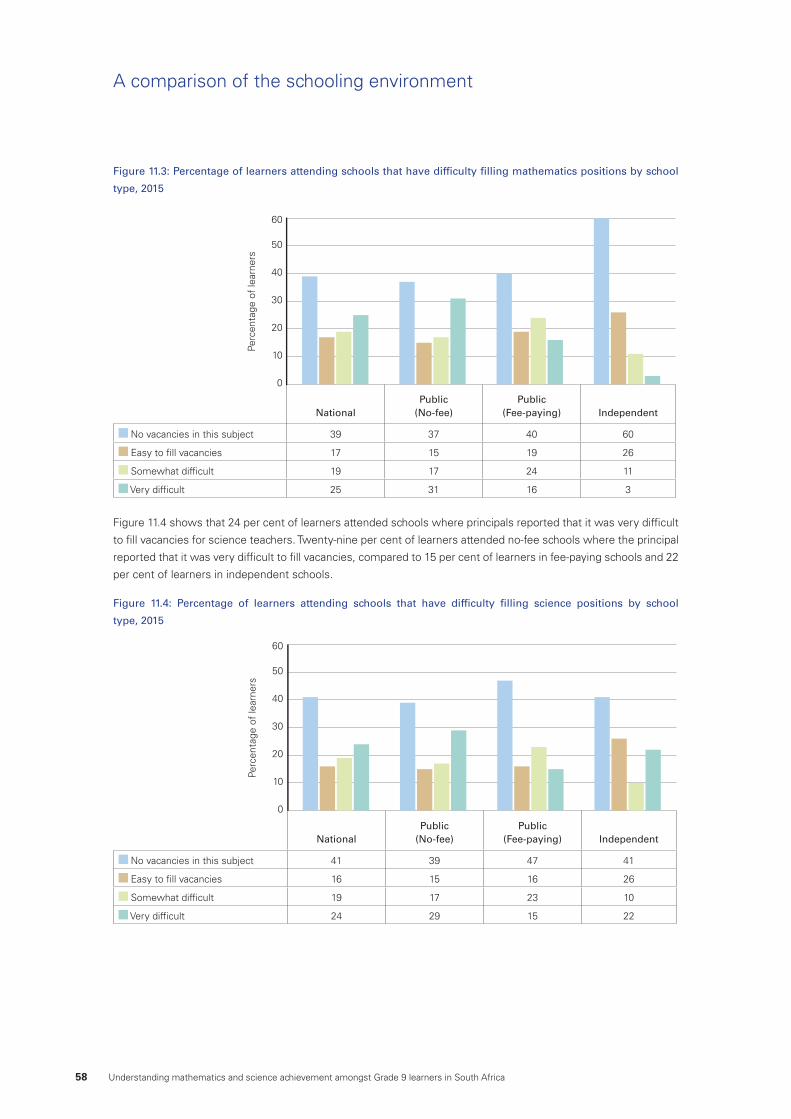
58 Understanding mathematics and science achievement amongst Grade 9 learners in South Africa
Figure 11.3: Percentage of learners attending schools that have difficulty filling mathematics positions by school
type, 2015
NationalPublic
(No-fee)Public
(Fee-paying) Independent
No vacancies in this subject 39 37 40 60
Easy to fill vacancies 17 15 19 26
Somewhat difficult 19 17 24 11
Very difficult 25 31 16 3
0
10
20
30
40
50
60
Perc
enta
ge o
f le
arne
rs
Figure 11.4 shows that 24 per cent of learners attended schools where principals reported that it was very difficult
to fill vacancies for science teachers. Twenty-nine per cent of learners attended no-fee schools where the principal
reported that it was very difficult to fill vacancies, compared to 15 per cent of learners in fee-paying schools and 22
per cent of learners in independent schools.
Figure 11.4: Percentage of learners attending schools that have difficulty filling science positions by school
type, 2015
0
10
20
30
40
50
60
Perc
enta
ge o
f le
arne
rs
NationalPublic
(No-fee)Public
(Fee-paying) Independent
No vacancies in this subject 41 39 47 41
Easy to fill vacancies 16 15 16 26
Somewhat difficult 19 17 23 10
Very difficult 24 29 15 22
A comparison of the schooling environment
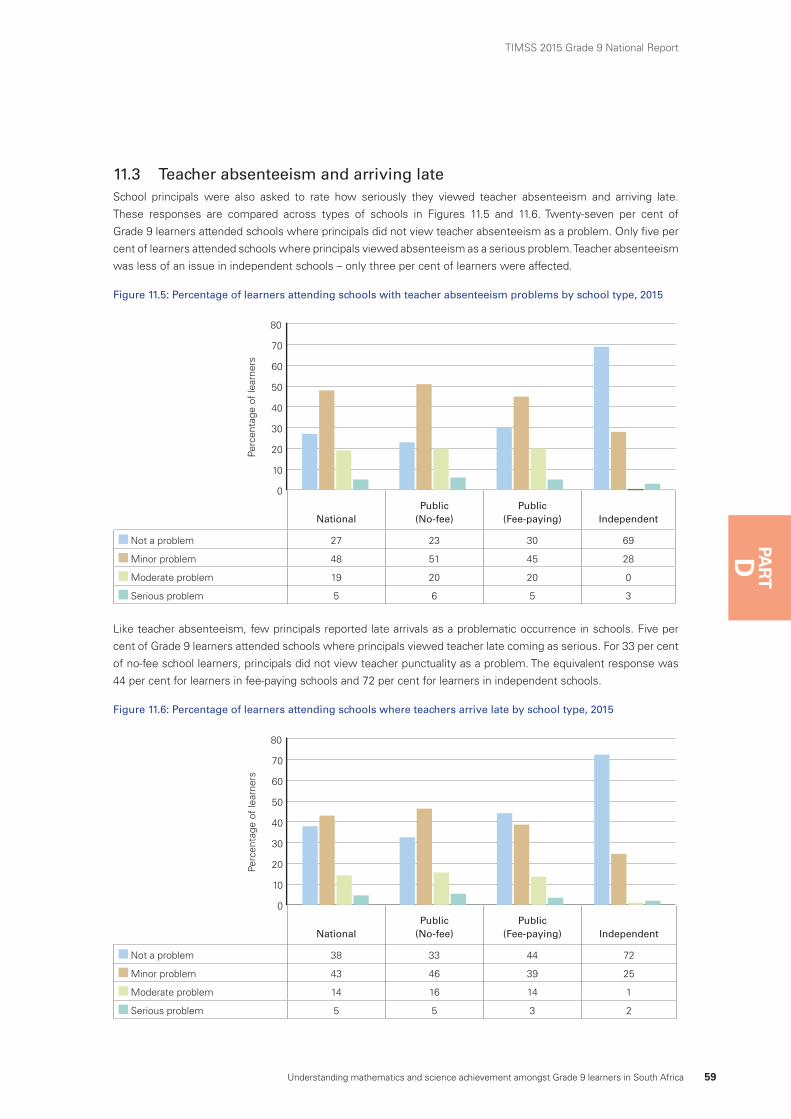
Understanding mathematics and science achievement amongst Grade 9 learners in South Africa 59
TIMSS 2015 Grade 9 National Report
PAR
TD
11.3 Teacher absenteeism and arriving lateSchool principals were also asked to rate how seriously they viewed teacher absenteeism and arriving late.
These responses are compared across types of schools in Figures 11.5 and 11.6. Twenty-seven per cent of
Grade 9 learners attended schools where principals did not view teacher absenteeism as a problem. Only five per
cent of learners attended schools where principals viewed absenteeism as a serious problem. Teacher absenteeism
was less of an issue in independent schools – only three per cent of learners were affected.
Figure 11.5: Percentage of learners attending schools with teacher absenteeism problems by school type, 2015
NationalPublic
(No-fee)Public
(Fee-paying) Independent
Not a problem 27 23 30 69
Minor problem 48 51 45 28
Moderate problem 19 20 20 0
Serious problem 5 6 5 3
0
10
20
30
40
50
60
70
80
Perc
enta
ge o
f le
arne
rs
Like teacher absenteeism, few principals reported late arrivals as a problematic occurrence in schools. Five per
cent of Grade 9 learners attended schools where principals viewed teacher late coming as serious. For 33 per cent
of no-fee school learners, principals did not view teacher punctuality as a problem. The equivalent response was
44 per cent for learners in fee-paying schools and 72 per cent for learners in independent schools.
Figure 11.6: Percentage of learners attending schools where teachers arrive late by school type, 2015
NationalPublic
(No-fee)Public
(Fee-paying) Independent
Not a problem 38 33 44 72
Minor problem 43 46 39 25
Moderate problem 14 16 14 1
Serious problem 5 5 3 2
0
10
20
30
40
50
60
70
80
Perc
enta
ge o
f le
arne
rs
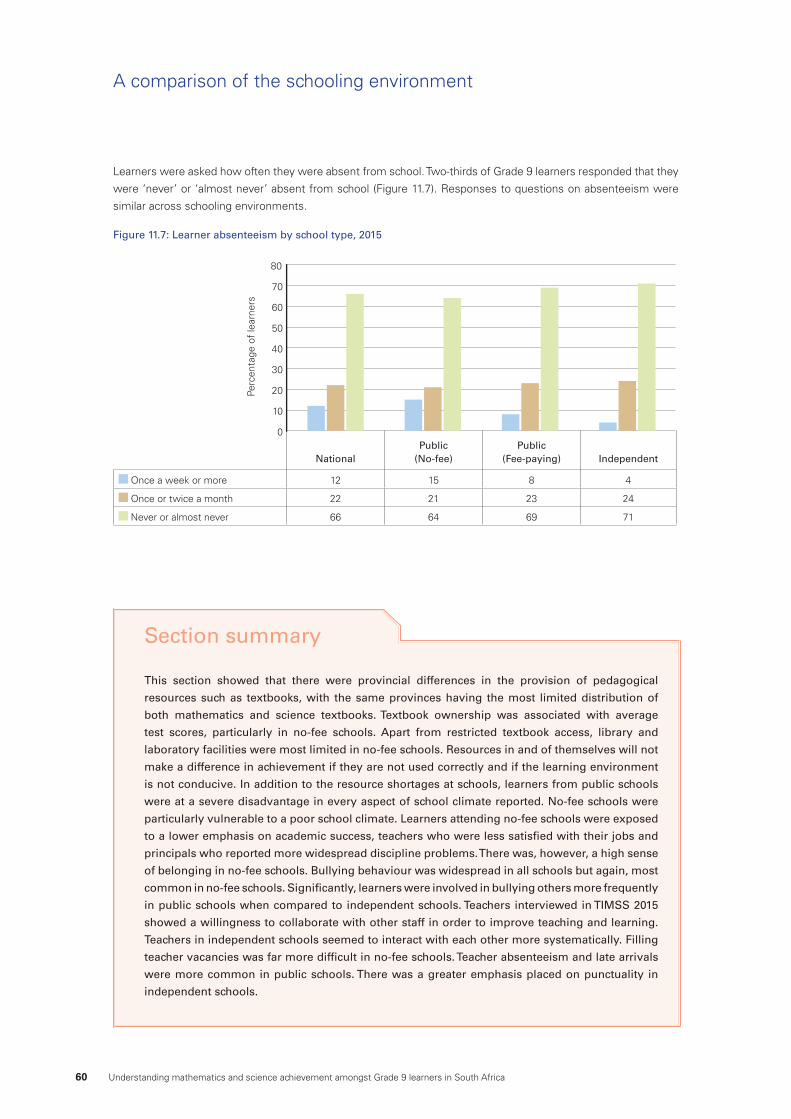
60 Understanding mathematics and science achievement amongst Grade 9 learners in South Africa
This section showed that there were provincial differences in the provision of pedagogical
resources such as textbooks, with the same provinces having the most limited distribution of
both mathematics and science textbooks. Textbook ownership was associated with average
test scores, particularly in no-fee schools. Apart from restricted textbook access, library and
laboratory facilities were most limited in no-fee schools. Resources in and of themselves will not
make a difference in achievement if they are not used correctly and if the learning environment
is not conducive. In addition to the resource shortages at schools, learners from public schools
were at a severe disadvantage in every aspect of school climate reported. No-fee schools were
particularly vulnerable to a poor school climate. Learners attending no-fee schools were exposed
to a lower emphasis on academic success, teachers who were less satisfied with their jobs and
principals who reported more widespread discipline problems. There was, however, a high sense
of belonging in no-fee schools. Bullying behaviour was widespread in all schools but again, most
common in no-fee schools. Significantly, learners were involved in bullying others more frequently
in public schools when compared to independent schools. Teachers interviewed in TIMSS 2015
showed a willingness to collaborate with other staff in order to improve teaching and learning.
Teachers in independent schools seemed to interact with each other more systematically. Filling
teacher vacancies was far more difficult in no-fee schools. Teacher absenteeism and late arrivals
were more common in public schools. There was a greater emphasis placed on punctuality in
independent schools.
Section summary
Learners were asked how often they were absent from school. Two-thirds of Grade 9 learners responded that they
were ‘never’ or ‘almost never’ absent from school (Figure 11.7). Responses to questions on absenteeism were
similar across schooling environments.
Figure 11.7: Learner absenteeism by school type, 2015
0
10
20
30
40
50
60
70
80
Perc
enta
ge o
f le
arne
rs
NationalPublic
(No-fee)Public
(Fee-paying) Independent
Once a week or more 12 15 8 4
Once or twice a month 22 21 23 24
Never or almost never 66 64 69 71
A comparison of the schooling environment
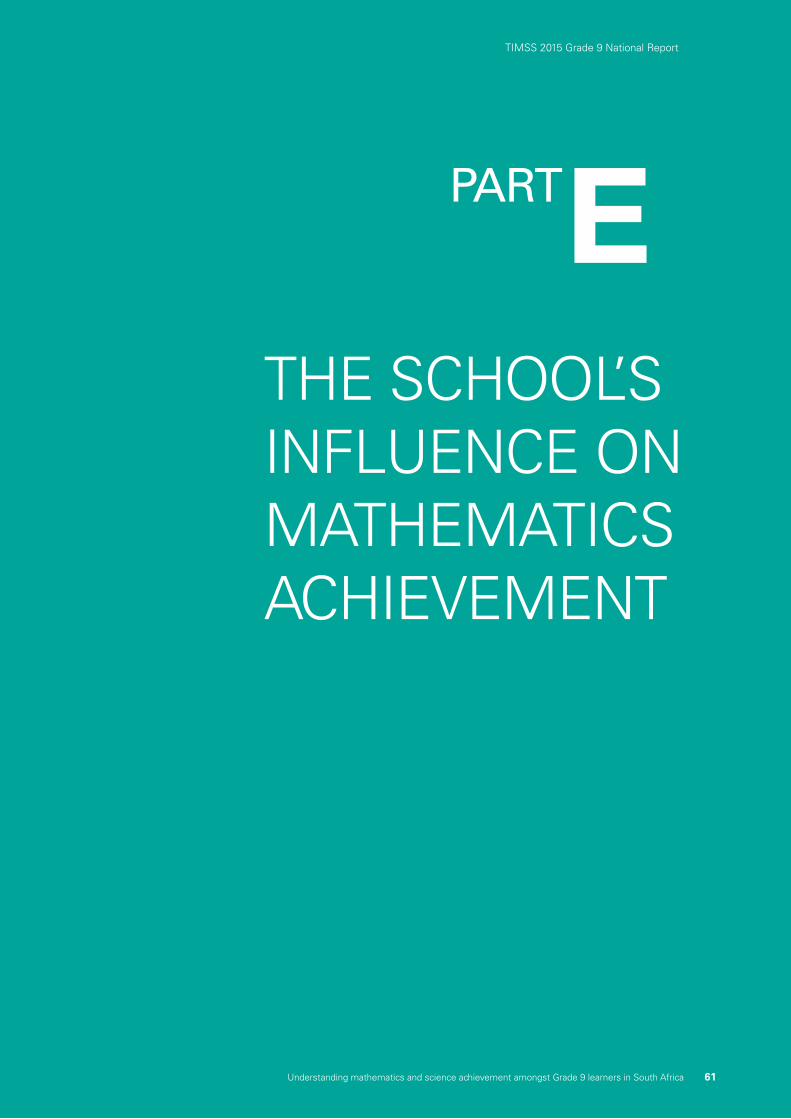
EPART
THE SCHOOL’S INFLUENCE ON MATHEMATICS ACHIEVEMENT
TIMSS 2015 Grade 9 National Report
Understanding mathematics and science achievement amongst Grade 9 learners in South Africa 61
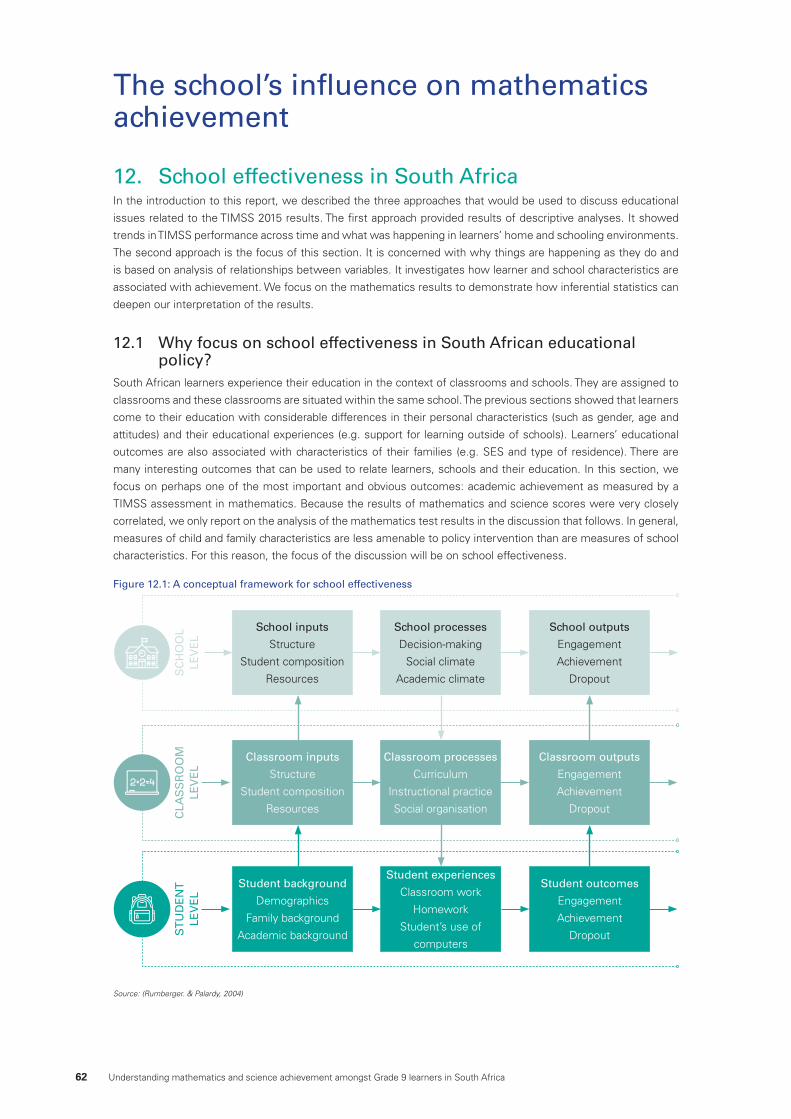
62 Understanding mathematics and science achievement amongst Grade 9 learners in South Africa
12. School effectiveness in South AfricaIn the introduction to this report, we described the three approaches that would be used to discuss educational
issues related to the TIMSS 2015 results. The first approach provided results of descriptive analyses. It showed
trends in TIMSS performance across time and what was happening in learners’ home and schooling environments.
The second approach is the focus of this section. It is concerned with why things are happening as they do and
is based on analysis of relationships between variables. It investigates how learner and school characteristics are
associated with achievement. We focus on the mathematics results to demonstrate how inferential statistics can
deepen our interpretation of the results.
12.1 Why focus on school effectiveness in South African educational policy?
South African learners experience their education in the context of classrooms and schools. They are assigned to
classrooms and these classrooms are situated within the same school. The previous sections showed that learners
come to their education with considerable differences in their personal characteristics (such as gender, age and
attitudes) and their educational experiences (e.g. support for learning outside of schools). Learners’ educational
outcomes are also associated with characteristics of their families (e.g. SES and type of residence). There are
many interesting outcomes that can be used to relate learners, schools and their education. In this section, we
focus on perhaps one of the most important and obvious outcomes: academic achievement as measured by a
TIMSS assessment in mathematics. Because the results of mathematics and science scores were very closely
correlated, we only report on the analysis of the mathematics test results in the discussion that follows. In general,
measures of child and family characteristics are less amenable to policy intervention than are measures of school
characteristics. For this reason, the focus of the discussion will be on school effectiveness.
Figure 12.1: A conceptual framework for school effectiveness
School inputs
Structure
Student composition
Resources
Classroom inputs
Structure
Student composition
Resources
School processes
Decision-making
Social climate
Academic climate
Classroom processes
Curriculum
Instructional practice
Social organisation
School outputs
Engagement
Achievement
Dropout
Classroom outputs
Engagement
Achievement
Dropout
SC
HO
OL
LEV
EL
ST
UD
EN
T
LEV
EL
CLA
SS
RO
OM
LE
VE
L
Student background
Demographics
Family background
Academic background
Student experiences
Classroom work
Homework
Student’s use of
computers
Student outcomes
Engagement
Achievement
Dropout
Source: (Rumberger. & Palardy, 2004)
The school’s influence on mathematics achievement
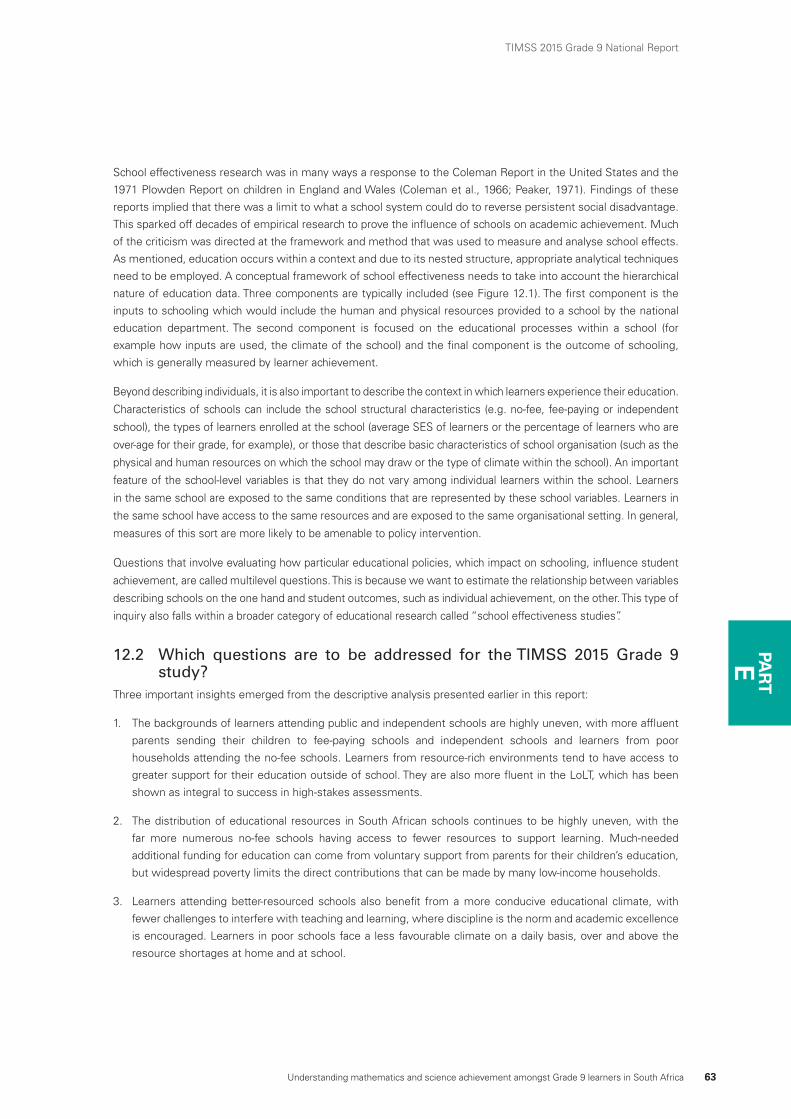
Understanding mathematics and science achievement amongst Grade 9 learners in South Africa 63
TIMSS 2015 Grade 9 National Report
PAR
TE
School effectiveness research was in many ways a response to the Coleman Report in the United States and the
1971 Plowden Report on children in England and Wales (Coleman et al., 1966; Peaker, 1971). Findings of these
reports implied that there was a limit to what a school system could do to reverse persistent social disadvantage.
This sparked off decades of empirical research to prove the influence of schools on academic achievement. Much
of the criticism was directed at the framework and method that was used to measure and analyse school effects.
As mentioned, education occurs within a context and due to its nested structure, appropriate analytical techniques
need to be employed. A conceptual framework of school effectiveness needs to take into account the hierarchical
nature of education data. Three components are typically included (see Figure 12.1). The first component is the
inputs to schooling which would include the human and physical resources provided to a school by the national
education department. The second component is focused on the educational processes within a school (for
example how inputs are used, the climate of the school) and the final component is the outcome of schooling,
which is generally measured by learner achievement.
Beyond describing individuals, it is also important to describe the context in which learners experience their education.
Characteristics of schools can include the school structural characteristics (e.g. no-fee, fee-paying or independent
school), the types of learners enrolled at the school (average SES of learners or the percentage of learners who are
over-age for their grade, for example), or those that describe basic characteristics of school organisation (such as the
physical and human resources on which the school may draw or the type of climate within the school). An important
feature of the school-level variables is that they do not vary among individual learners within the school. Learners
in the same school are exposed to the same conditions that are represented by these school variables. Learners in
the same school have access to the same resources and are exposed to the same organisational setting. In general,
measures of this sort are more likely to be amenable to policy intervention.
Questions that involve evaluating how particular educational policies, which impact on schooling, influence student
achievement, are called multilevel questions. This is because we want to estimate the relationship between variables
describing schools on the one hand and student outcomes, such as individual achievement, on the other. This type of
inquiry also falls within a broader category of educational research called “school effectiveness studies”.
12.2 Which questions are to be addressed for the TIMSS 2015 Grade 9 study?
Three important insights emerged from the descriptive analysis presented earlier in this report:
1. The backgrounds of learners attending public and independent schools are highly uneven, with more affluent
parents sending their children to fee-paying schools and independent schools and learners from poor
households attending the no-fee schools. Learners from resource-rich environments tend to have access to
greater support for their education outside of school. They are also more fluent in the LoLT, which has been
shown as integral to success in high-stakes assessments.
2. The distribution of educational resources in South African schools continues to be highly uneven, with the
far more numerous no-fee schools having access to fewer resources to support learning. Much-needed
additional funding for education can come from voluntary support from parents for their children’s education,
but widespread poverty limits the direct contributions that can be made by many low-income households.
3. Learners attending better-resourced schools also benefit from a more conducive educational climate, with
fewer challenges to interfere with teaching and learning, where discipline is the norm and academic excellence
is encouraged. Learners in poor schools face a less favourable climate on a daily basis, over and above the
resource shortages at home and at school.
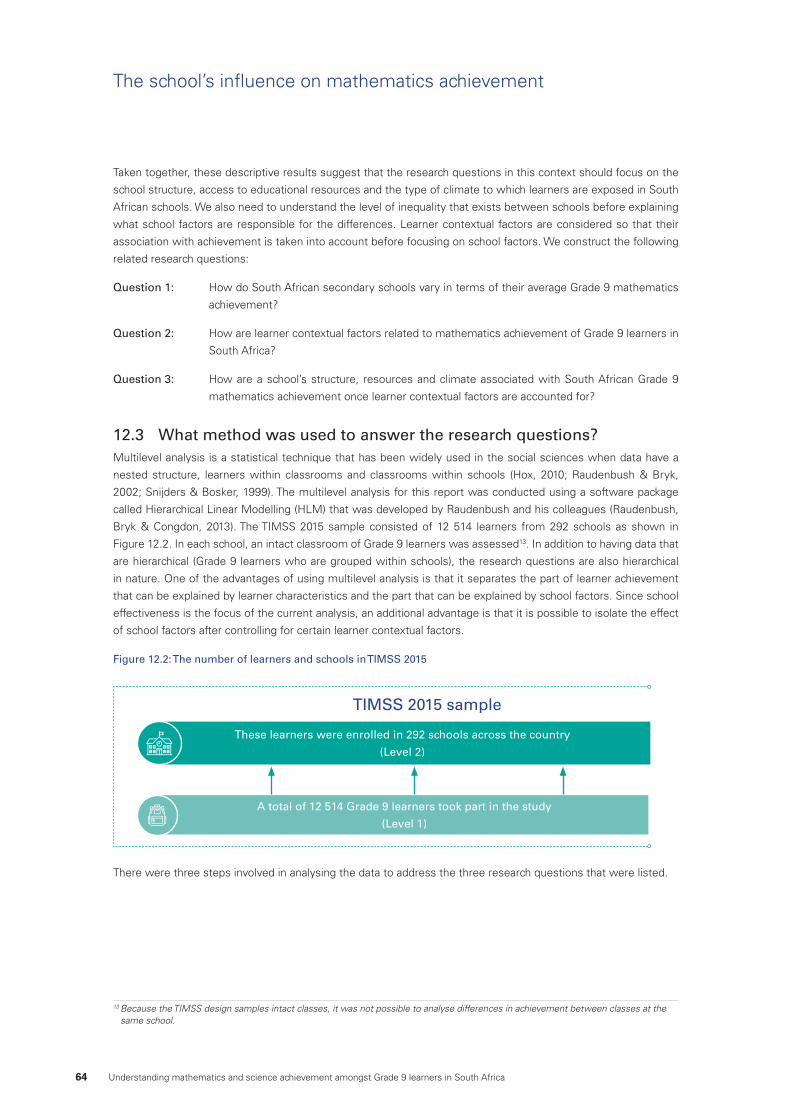
64 Understanding mathematics and science achievement amongst Grade 9 learners in South Africa
Taken together, these descriptive results suggest that the research questions in this context should focus on the
school structure, access to educational resources and the type of climate to which learners are exposed in South
African schools. We also need to understand the level of inequality that exists between schools before explaining
what school factors are responsible for the differences. Learner contextual factors are considered so that their
association with achievement is taken into account before focusing on school factors. We construct the following
related research questions:
Question 1: How do South African secondary schools vary in terms of their average Grade 9 mathematics
achievement?
Question 2: How are learner contextual factors related to mathematics achievement of Grade 9 learners in
South Africa?
Question 3: How are a school’s structure, resources and climate associated with South African Grade 9
mathematics achievement once learner contextual factors are accounted for?
12.3 What method was used to answer the research questions? Multilevel analysis is a statistical technique that has been widely used in the social sciences when data have a
nested structure, learners within classrooms and classrooms within schools (Hox, 2010; Raudenbush & Bryk,
2002; Snijders & Bosker, 1999). The multilevel analysis for this report was conducted using a software package
called Hierarchical Linear Modelling (HLM) that was developed by Raudenbush and his colleagues (Raudenbush,
Bryk & Congdon, 2013). The TIMSS 2015 sample consisted of 12 514 learners from 292 schools as shown in
Figure 12.2. In each school, an intact classroom of Grade 9 learners was assessed13. In addition to having data that
are hierarchical (Grade 9 learners who are grouped within schools), the research questions are also hierarchical
in nature. One of the advantages of using multilevel analysis is that it separates the part of learner achievement
that can be explained by learner characteristics and the part that can be explained by school factors. Since school
effectiveness is the focus of the current analysis, an additional advantage is that it is possible to isolate the effect
of school factors after controlling for certain learner contextual factors.
Figure 12.2: The number of learners and schools in TIMSS 2015
These learners were enrolled in 292 schools across the country
(Level 2)
A total of 12 514 Grade 9 learners took part in the study
(Level 1)
TIMSS 2015 sample
There were three steps involved in analysing the data to address the three research questions that were listed.
The school’s influence on mathematics achievement
13 Because the TIMSS design samples intact classes, it was not possible to analyse differences in achievement between classes at the same school.
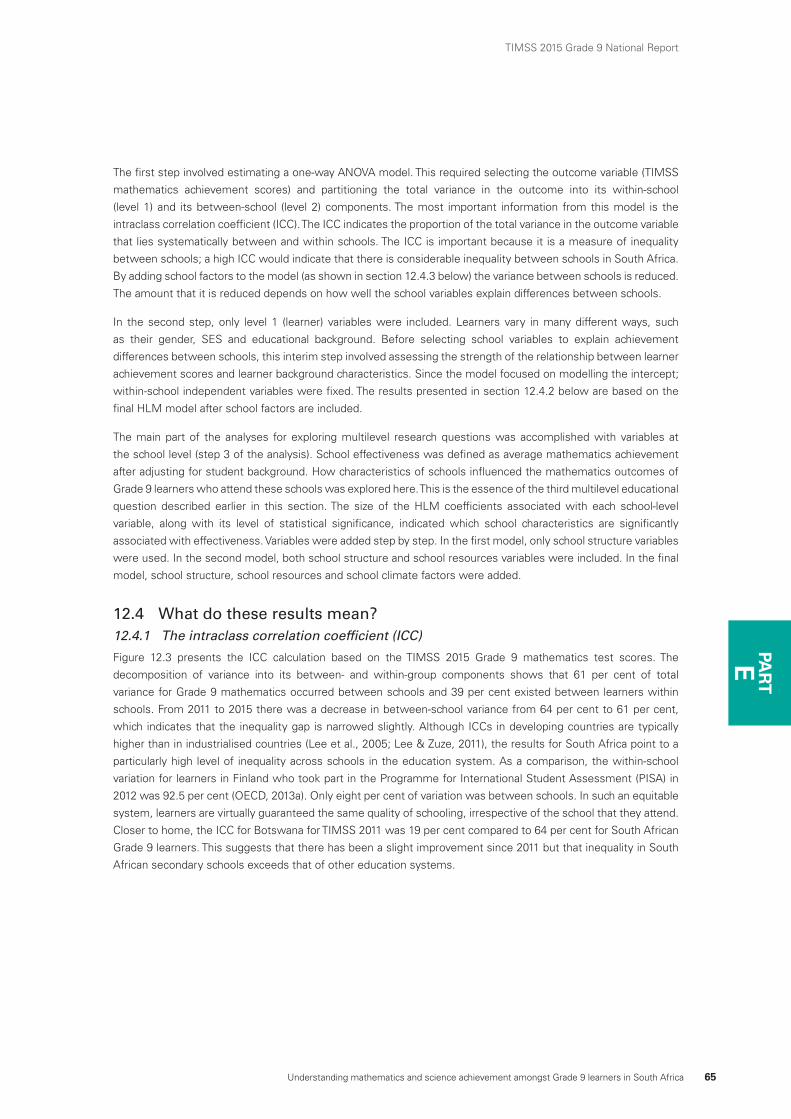
Understanding mathematics and science achievement amongst Grade 9 learners in South Africa 65
TIMSS 2015 Grade 9 National Report
PAR
TE
The first step involved estimating a one-way ANOVA model. This required selecting the outcome variable (TIMSS
mathematics achievement scores) and partitioning the total variance in the outcome into its within-school
(level 1) and its between-school (level 2) components. The most important information from this model is the
intraclass correlation coefficient (ICC). The ICC indicates the proportion of the total variance in the outcome variable
that lies systematically between and within schools. The ICC is important because it is a measure of inequality
between schools; a high ICC would indicate that there is considerable inequality between schools in South Africa.
By adding school factors to the model (as shown in section 12.4.3 below) the variance between schools is reduced.
The amount that it is reduced depends on how well the school variables explain differences between schools.
In the second step, only level 1 (learner) variables were included. Learners vary in many different ways, such
as their gender, SES and educational background. Before selecting school variables to explain achievement
differences between schools, this interim step involved assessing the strength of the relationship between learner
achievement scores and learner background characteristics. Since the model focused on modelling the intercept;
within-school independent variables were fixed. The results presented in section 12.4.2 below are based on the
final HLM model after school factors are included.
The main part of the analyses for exploring multilevel research questions was accomplished with variables at
the school level (step 3 of the analysis). School effectiveness was defined as average mathematics achievement
after adjusting for student background. How characteristics of schools influenced the mathematics outcomes of
Grade 9 learners who attend these schools was explored here. This is the essence of the third multilevel educational
question described earlier in this section. The size of the HLM coefficients associated with each school-level
variable, along with its level of statistical significance, indicated which school characteristics are significantly
associated with effectiveness. Variables were added step by step. In the first model, only school structure variables
were used. In the second model, both school structure and school resources variables were included. In the final
model, school structure, school resources and school climate factors were added.
12.4 What do these results mean? 12.4.1 The intraclass correlation coefficient (ICC)
Figure 12.3 presents the ICC calculation based on the TIMSS 2015 Grade 9 mathematics test scores. The
decomposition of variance into its between- and within-group components shows that 61 per cent of total
variance for Grade 9 mathematics occurred between schools and 39 per cent existed between learners within
schools. From 2011 to 2015 there was a decrease in between-school variance from 64 per cent to 61 per cent,
which indicates that the inequality gap is narrowed slightly. Although ICCs in developing countries are typically
higher than in industrialised countries (Lee et al., 2005; Lee & Zuze, 2011), the results for South Africa point to a
particularly high level of inequality across schools in the education system. As a comparison, the within-school
variation for learners in Finland who took part in the Programme for International Student Assessment (PISA) in
2012 was 92.5 per cent (OECD, 2013a). Only eight per cent of variation was between schools. In such an equitable
system, learners are virtually guaranteed the same quality of schooling, irrespective of the school that they attend.
Closer to home, the ICC for Botswana for TIMSS 2011 was 19 per cent compared to 64 per cent for South African
Grade 9 learners. This suggests that there has been a slight improvement since 2011 but that inequality in South
African secondary schools exceeds that of other education systems.
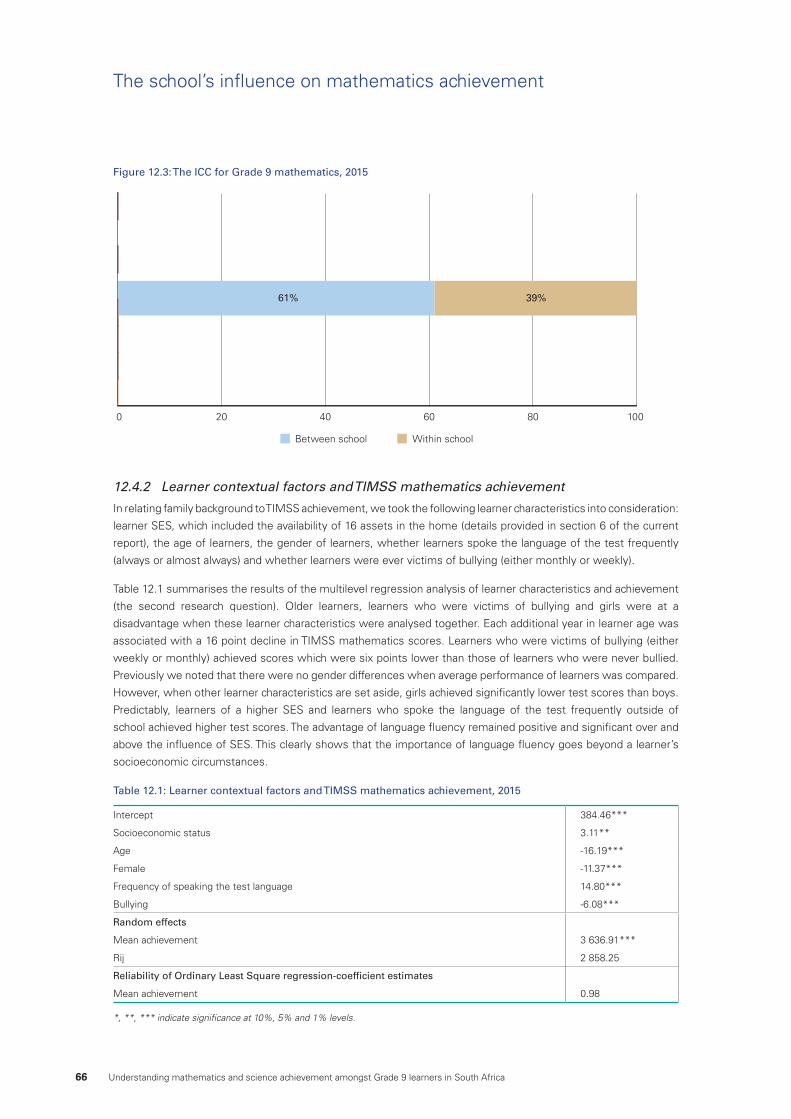
66 Understanding mathematics and science achievement amongst Grade 9 learners in South Africa
Figure 12.3: The ICC for Grade 9 mathematics, 2015
0 20 40 60 80 100
Within schoolBetween school
39%61%
12.4.2 Learner contextual factors and TIMSS mathematics achievement
In relating family background to TIMSS achievement, we took the following learner characteristics into consideration:
learner SES, which included the availability of 16 assets in the home (details provided in section 6 of the current
report), the age of learners, the gender of learners, whether learners spoke the language of the test frequently
(always or almost always) and whether learners were ever victims of bullying (either monthly or weekly).
Table 12.1 summarises the results of the multilevel regression analysis of learner characteristics and achievement
(the second research question). Older learners, learners who were victims of bullying and girls were at a
disadvantage when these learner characteristics were analysed together. Each additional year in learner age was
associated with a 16 point decline in TIMSS mathematics scores. Learners who were victims of bullying (either
weekly or monthly) achieved scores which were six points lower than those of learners who were never bullied.
Previously we noted that there were no gender differences when average performance of learners was compared.
However, when other learner characteristics are set aside, girls achieved significantly lower test scores than boys.
Predictably, learners of a higher SES and learners who spoke the language of the test frequently outside of
school achieved higher test scores. The advantage of language fluency remained positive and significant over and
above the influence of SES. This clearly shows that the importance of language fluency goes beyond a learner’s
socioeconomic circumstances.
Table 12.1: Learner contextual factors and TIMSS mathematics achievement, 2015
Intercept 384.46***
Socioeconomic status 3.11**
Age -16.19***
Female -11.37***
Frequency of speaking the test language 14.80***
Bullying -6.08***
Random effects
Mean achievement 3 636.91***
Rij 2 858.25
Reliability of Ordinary Least Square regression-coefficient estimates
Mean achievement 0.98
*, **, *** indicate significance at 10%, 5% and 1% levels.
The school’s influence on mathematics achievement
Understanding mathematics and science achievement amongst Grade 9 learners in South Africa 67
TIMSS 2015 Grade 9 National Report
PAR
TE
12.4.3 School factors and TIMSS mathematics achievement
In Table 12.2 the results of the analysis addressing the third research question related to school factors and TIMSS
achievement are shown. Learner characteristics were taken into account in running this analysis and therefore
are not repeated in Table 12.2. Our third question focused on particular school features of educational policy –
namely, the structure, resourcing and climate of schooling. Throughout this report, we have considered three
types of schooling environments: no-fee schools, fee-paying schools and independent schools. To an extent, these
environments represent the type of physical and human resources on which a school may draw because of the
financial support provided to schools where tuition fees are charged. Many studies of education in the developing
world have found that resources really matter for achievement (Lee et al., 2005; Zuze & Leibbrandt, 2011). In
addition to the resources represented by the structure of schooling, we also explicitly included variables related to
the availability and shortage of physical resources in the second model shown below.
Our findings related to resources are both heartening and discouraging. It is heartening to find that if schools
have more physical resources (library facilities) and fewer resource shortages (materials to teach mathematics),
then achievement is higher. Moreover, these resource effects persisted even when we took account of the type
of school attended (no-fee, fee-paying or independent). This implies that the resource findings are real and not
simply artefacts of the type of school learners attend. It is good news for policy that physical resources exerted
independent and positive effects on school average achievement because this suggests that resources really
matter for educational quality. However, the news about the school type and average achievement is not as good.
Compared to no-fee schools, school average achievement was significantly higher in fee-paying schools and higher
still in independent schools. Part of this school achievement gap was explained by the availability of physical
resources. The strength of the relationship between school type and mathematics achievement reduced when
physical resources were included in the analysis in model 214. However, a far greater part of the achievement gap
was explained by the school climate as discussed below.
The school climate was represented by a number of TIMSS indicators that captured the quality of the learning
environment. These were: the school’s emphasis on academic success, whether a school experienced disciplinary
problems, whether a school was safe and orderly, frequency of bullying in schools and whether teachers felt that
they faced challenges in the classroom. Higher values on these indexes represented a more positive climate.
Bullying was included at the school level as well because it is a measure of school climate but also because the
effect of bullying could vary significantly between schools as well as within schools.
The importance of school climate is very clear from this analysis. Not only did different dimensions of school
climate contribute to higher school average achievement, but they explained the difference in average test scores
between no-fee, fee-paying and independent schools. Moreover at schools where bullying was widespread,
learners achieved lower average test scores, even when the resource levels of schools was accounted for. Creating
a healthy school climate clearly requires far more than just improving the quantity and quality of resources available
at a school. How to ensure that the organisational and professional conditions of the school support learning
should remain a high educational priority for South African policy makers.
14 This relationship is represented by the size of the coefficients in Table 12.2.
Physical resources exerted independent and positive effects on school average achievement because this suggests that resources really matter for educational quality.
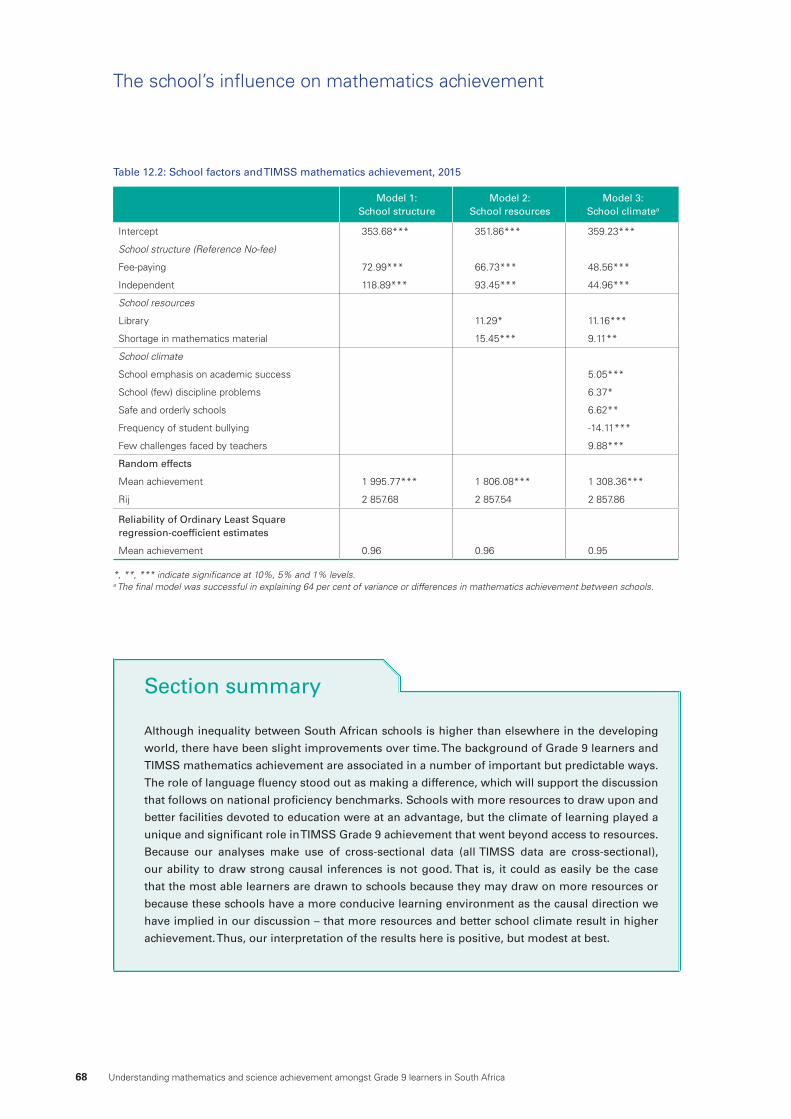
68 Understanding mathematics and science achievement amongst Grade 9 learners in South Africa
Although inequality between South African schools is higher than elsewhere in the developing
world, there have been slight improvements over time. The background of Grade 9 learners and
TIMSS mathematics achievement are associated in a number of important but predictable ways.
The role of language fluency stood out as making a difference, which will support the discussion
that follows on national proficiency benchmarks. Schools with more resources to draw upon and
better facilities devoted to education were at an advantage, but the climate of learning played a
unique and significant role in TIMSS Grade 9 achievement that went beyond access to resources.
Because our analyses make use of cross-sectional data (all TIMSS data are cross-sectional),
our ability to draw strong causal inferences is not good. That is, it could as easily be the case
that the most able learners are drawn to schools because they may draw on more resources or
because these schools have a more conducive learning environment as the causal direction we
have implied in our discussion – that more resources and better school climate result in higher
achievement. Thus, our interpretation of the results here is positive, but modest at best.
Section summary
Table 12.2: School factors and TIMSS mathematics achievement, 2015
Model 1: School structure
Model 2: School resources
Model 3: School climatea
Intercept 353.68*** 351.86*** 359.23***
School structure (Reference No-fee)
Fee-paying 72.99*** 66.73*** 48.56***
Independent 118.89*** 93.45*** 44.96***
School resources
Library 11.29* 11.16***
Shortage in mathematics material 15.45*** 9.11**
School climate
School emphasis on academic success 5.05***
School (few) discipline problems 6.37*
Safe and orderly schools 6.62**
Frequency of student bullying -14.11***
Few challenges faced by teachers 9.88***
Random effects
Mean achievement 1 995.77*** 1 806.08*** 1 308.36***
Rij 2 857.68 2 857.54 2 857.86
Reliability of Ordinary Least Square regression-coefficient estimates
Mean achievement 0.96 0.96 0.95
*, **, *** indicate significance at 10%, 5% and 1% levels.a The final model was successful in explaining 64 per cent of variance or differences in mathematics achievement between schools.
The school’s influence on mathematics achievement
FPART
SCIENCE CURRICULUM INSIGHTS FROM NATIONAL AND INTERNATIONAL BENCHMARKS
Understanding mathematics and science achievement amongst Grade 9 learners in South Africa 69
TIMSS 2015 Grade 9 National Report
70 Understanding mathematics and science achievement amongst Grade 9 learners in South Africa
13. Science curriculum and national benchmarksTIMSS uses the curriculum, broadly defined, as the major organising concept in considering how educational
opportunities are provided to students and the factors that influence how students use these opportunities.
The TIMSS Curriculum Model has three aspects: the intended curriculum, the implemented curriculum, and
the attained curriculum. The TIMSS 2015 achievement results are summarised using IRT scaling and report
mathematics achievement scores on a scale with a mean of 500 and a standard deviation of 100. The countries’
average scores provide users of the data with information about how achievement compares among countries and
whether scores are changing over time.
In order to extend the information for policy and curriculum reform, however, it is important to understand the
science competencies associated with different locations within the range of scores on the achievement scales.
These performance level descriptors describe what learners know and can do within the performance levels of
knowledge and skills (Zieky, 2012).
In addition to describing TIMSS achievement by the IRT scaled score, TIMSS has created a set of international
benchmarks to provide participating countries with comparable descriptions of what learners know and can do
at different locations within the range of scores on the achievement scales. TIMSS defines four categories of
benchmarks, namely: scores between 400 and 475 points are classified as achievement at a low level, scores
between 475 and 550 points as achievement at an intermediate level, scores from 550 to 625 points as achievement
at a high level and scores above 625 points as achievement at an advanced level15.
In order to make the global assessment locally meaningful, we extended the analyses using Rasch techniques to
create a natural benchmark scale of TIMSS performance. A comprehensive report on the methodology and results
of this analysis is available on the TIMSS South Africa website (Scherman, Long, Coetzee & Abrie, 2017). In this
section, we describe the South African achievement using IRT mean scores for the different content areas tested,
and present the Rasch analyses to describe what South African learners know and can do at different points on
the achievement scale.
13.1 International science curriculum analysisThe TIMSS curriculum and assessment framework is organised around the science content domains of biology,
chemistry, physics and earth science. The TIMSS 2015 achievement instruments included trend and new items16.
Table 13.1 presents the match between the TIMSS and South African curriculum in terms of content and cognitive
domains.
Science curriculum insights from national and international benchmarks
15 See Table 3.1 for the descriptors.16 See Methodology section in the Appendix for further details.
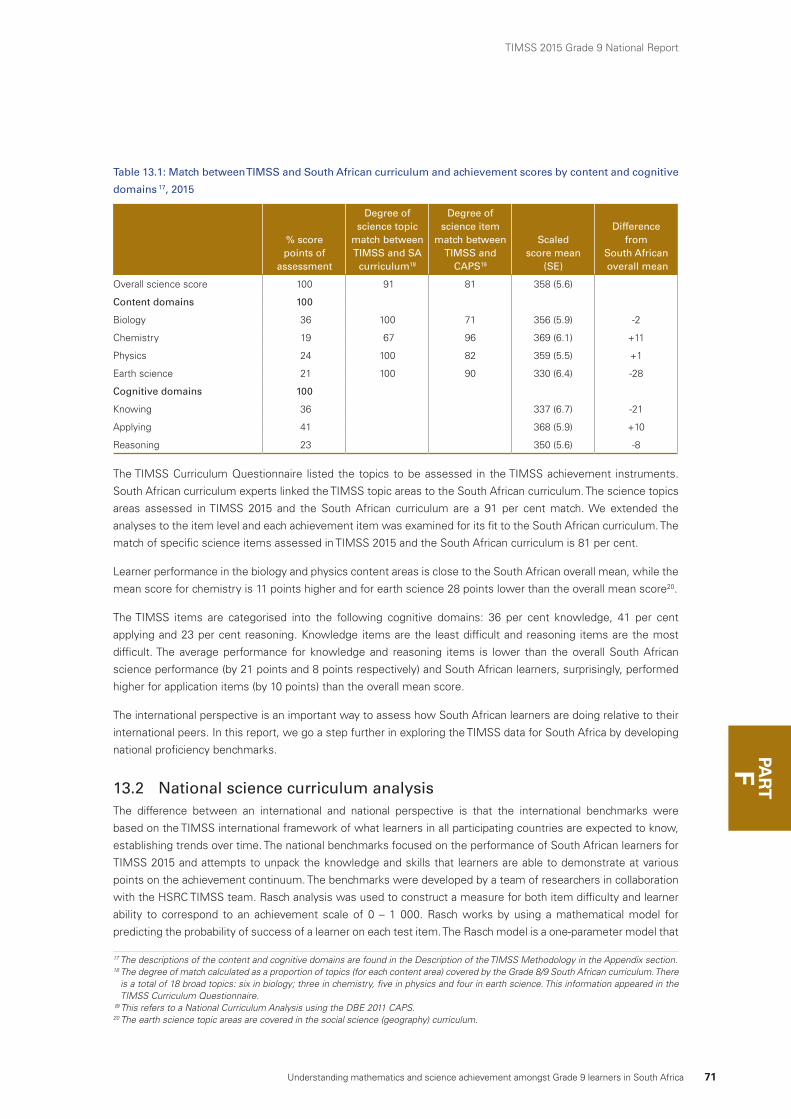
Understanding mathematics and science achievement amongst Grade 9 learners in South Africa 71
TIMSS 2015 Grade 9 National Report
PAR
TF
Table 13.1: Match between TIMSS and South African curriculum and achievement scores by content and cognitive
domains 17, 2015
% score points of
assessment
Degree of science topic
match between TIMSS and SA
curriculum18
Degree of science item
match between TIMSS and
CAPS19
Scaled score mean
(SE)
Difference from
South African overall mean
Overall science score 100 91 81 358 (5.6)
Content domains 100
Biology 36 100 71 356 (5.9) -2
Chemistry 19 67 96 369 (6.1) +11
Physics 24 100 82 359 (5.5) +1
Earth science 21 100 90 330 (6.4) -28
Cognitive domains 100
Knowing 36 337 (6.7) -21
Applying 41 368 (5.9) +10
Reasoning 23 350 (5.6) -8
The TIMSS Curriculum Questionnaire listed the topics to be assessed in the TIMSS achievement instruments.
South African curriculum experts linked the TIMSS topic areas to the South African curriculum. The science topics
areas assessed in TIMSS 2015 and the South African curriculum are a 91 per cent match. We extended the
analyses to the item level and each achievement item was examined for its fit to the South African curriculum. The
match of specific science items assessed in TIMSS 2015 and the South African curriculum is 81 per cent.
Learner performance in the biology and physics content areas is close to the South African overall mean, while the
mean score for chemistry is 11 points higher and for earth science 28 points lower than the overall mean score20.
The TIMSS items are categorised into the following cognitive domains: 36 per cent knowledge, 41 per cent
applying and 23 per cent reasoning. Knowledge items are the least difficult and reasoning items are the most
difficult. The average performance for knowledge and reasoning items is lower than the overall South African
science performance (by 21 points and 8 points respectively) and South African learners, surprisingly, performed
higher for application items (by 10 points) than the overall mean score.
The international perspective is an important way to assess how South African learners are doing relative to their
international peers. In this report, we go a step further in exploring the TIMSS data for South Africa by developing
national proficiency benchmarks.
13.2 National science curriculum analysisThe difference between an international and national perspective is that the international benchmarks were
based on the TIMSS international framework of what learners in all participating countries are expected to know,
establishing trends over time. The national benchmarks focused on the performance of South African learners for
TIMSS 2015 and attempts to unpack the knowledge and skills that learners are able to demonstrate at various
points on the achievement continuum. The benchmarks were developed by a team of researchers in collaboration
with the HSRC TIMSS team. Rasch analysis was used to construct a measure for both item difficulty and learner
ability to correspond to an achievement scale of 0 – 1 000. Rasch works by using a mathematical model for
predicting the probability of success of a learner on each test item. The Rasch model is a one-parameter model that
17 The descriptions of the content and cognitive domains are found in the Description of the TIMSS Methodology in the Appendix section.18 The degree of match calculated as a proportion of topics (for each content area) covered by the Grade 8/9 South African curriculum. There
is a total of 18 broad topics: six in biology; three in chemistry, five in physics and four in earth science. This information appeared in the TIMSS Curriculum Questionnaire.
¹9 This refers to a National Curriculum Analysis using the DBE 2011 CAPS.20 The earth science topic areas are covered in the social science (geography) curriculum.
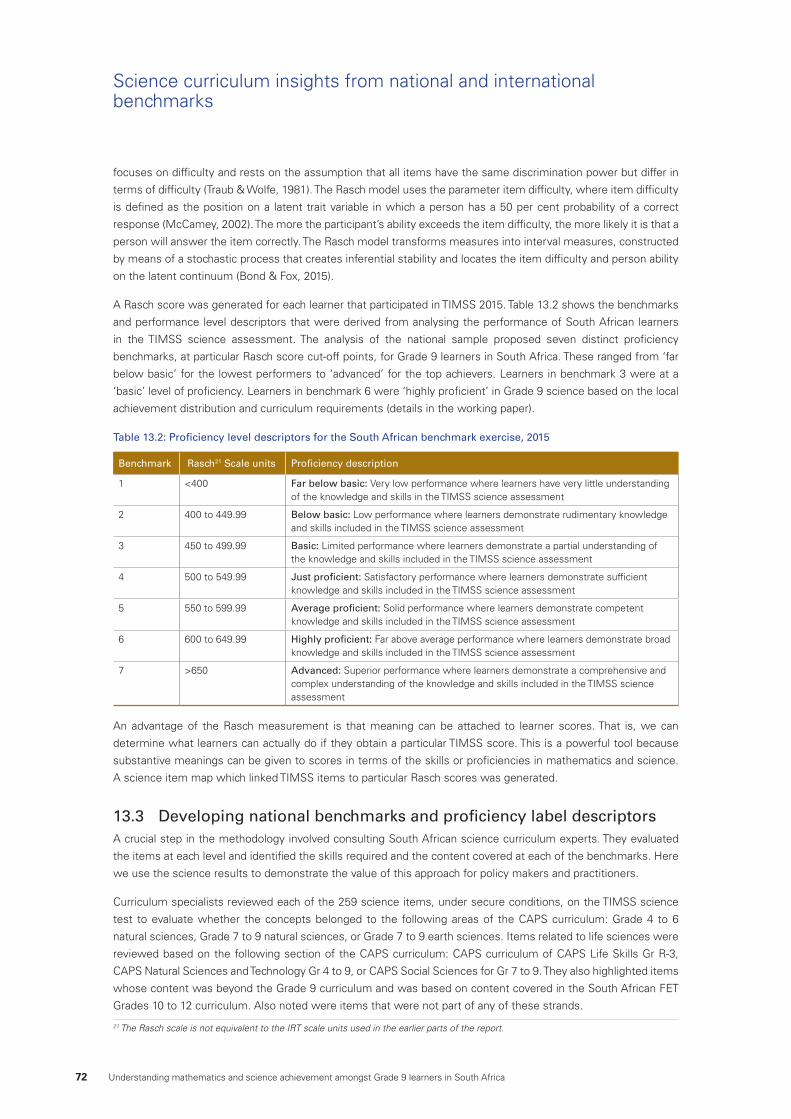
72 Understanding mathematics and science achievement amongst Grade 9 learners in South Africa
Science curriculum insights from national and international benchmarks
focuses on difficulty and rests on the assumption that all items have the same discrimination power but differ in
terms of difficulty (Traub & Wolfe, 1981). The Rasch model uses the parameter item difficulty, where item difficulty
is defined as the position on a latent trait variable in which a person has a 50 per cent probability of a correct
response (McCamey, 2002). The more the participant’s ability exceeds the item difficulty, the more likely it is that a
person will answer the item correctly. The Rasch model transforms measures into interval measures, constructed
by means of a stochastic process that creates inferential stability and locates the item difficulty and person ability
on the latent continuum (Bond & Fox, 2015).
A Rasch score was generated for each learner that participated in TIMSS 2015. Table 13.2 shows the benchmarks
and performance level descriptors that were derived from analysing the performance of South African learners
in the TIMSS science assessment. The analysis of the national sample proposed seven distinct proficiency
benchmarks, at particular Rasch score cut-off points, for Grade 9 learners in South Africa. These ranged from ‘far
below basic’ for the lowest performers to ‘advanced’ for the top achievers. Learners in benchmark 3 were at a
‘basic’ level of proficiency. Learners in benchmark 6 were ‘highly proficient’ in Grade 9 science based on the local
achievement distribution and curriculum requirements (details in the working paper).
Table 13.2: Proficiency level descriptors for the South African benchmark exercise, 2015
Benchmark Rasch21 Scale units Proficiency description
1 <400 Far below basic: Very low performance where learners have very little understanding of the knowledge and skills in the TIMSS science assessment
2 400 to 449.99 Below basic: Low performance where learners demonstrate rudimentary knowledge and skills included in the TIMSS science assessment
3 450 to 499.99 Basic: Limited performance where learners demonstrate a partial understanding of the knowledge and skills included in the TIMSS science assessment
4 500 to 549.99 Just proficient: Satisfactory performance where learners demonstrate sufficient knowledge and skills included in the TIMSS science assessment
5 550 to 599.99 Average proficient: Solid performance where learners demonstrate competent knowledge and skills included in the TIMSS science assessment
6 600 to 649.99 Highly proficient: Far above average performance where learners demonstrate broad knowledge and skills included in the TIMSS science assessment
7 >650 Advanced: Superior performance where learners demonstrate a comprehensive and complex understanding of the knowledge and skills included in the TIMSS science assessment
An advantage of the Rasch measurement is that meaning can be attached to learner scores. That is, we can
determine what learners can actually do if they obtain a particular TIMSS score. This is a powerful tool because
substantive meanings can be given to scores in terms of the skills or proficiencies in mathematics and science.
A science item map which linked TIMSS items to particular Rasch scores was generated.
13.3 Developing national benchmarks and proficiency label descriptorsA crucial step in the methodology involved consulting South African science curriculum experts. They evaluated
the items at each level and identified the skills required and the content covered at each of the benchmarks. Here
we use the science results to demonstrate the value of this approach for policy makers and practitioners.
Curriculum specialists reviewed each of the 259 science items, under secure conditions, on the TIMSS science
test to evaluate whether the concepts belonged to the following areas of the CAPS curriculum: Grade 4 to 6
natural sciences, Grade 7 to 9 natural sciences, or Grade 7 to 9 earth sciences. Items related to life sciences were
reviewed based on the following section of the CAPS curriculum: CAPS curriculum of CAPS Life Skills Gr R-3,
CAPS Natural Sciences and Technology Gr 4 to 9, or CAPS Social Sciences for Gr 7 to 9. They also highlighted items
whose content was beyond the Grade 9 curriculum and was based on content covered in the South African FET
Grades 10 to 12 curriculum. Also noted were items that were not part of any of these strands.
21 The Rasch scale is not equivalent to the IRT scale units used in the earlier parts of the report.
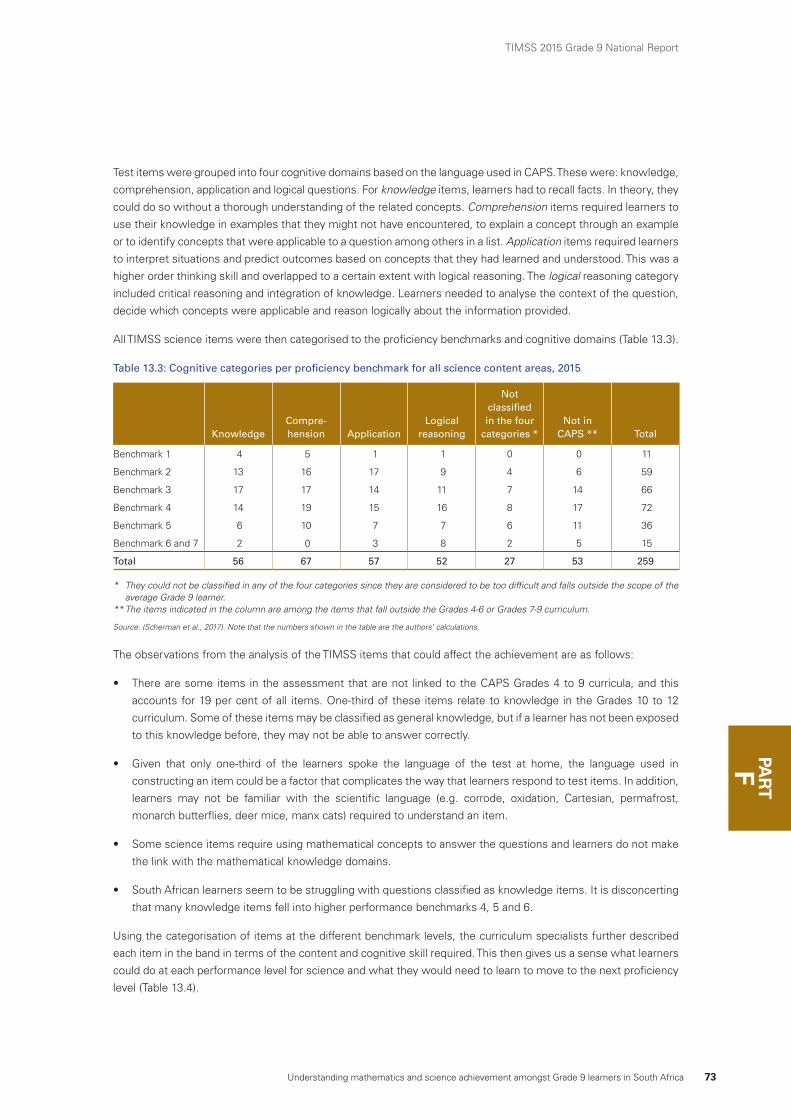
Understanding mathematics and science achievement amongst Grade 9 learners in South Africa 73
TIMSS 2015 Grade 9 National Report
PAR
TF
Test items were grouped into four cognitive domains based on the language used in CAPS. These were: knowledge,
comprehension, application and logical questions. For knowledge items, learners had to recall facts. In theory, they
could do so without a thorough understanding of the related concepts. Comprehension items required learners to
use their knowledge in examples that they might not have encountered, to explain a concept through an example
or to identify concepts that were applicable to a question among others in a list. Application items required learners
to interpret situations and predict outcomes based on concepts that they had learned and understood. This was a
higher order thinking skill and overlapped to a certain extent with logical reasoning. The logical reasoning category
included critical reasoning and integration of knowledge. Learners needed to analyse the context of the question,
decide which concepts were applicable and reason logically about the information provided.
All TIMSS science items were then categorised to the proficiency benchmarks and cognitive domains (Table 13.3).
Table 13.3: Cognitive categories per proficiency benchmark for all science content areas, 2015
KnowledgeCompre-hension Application
Logical reasoning
Not classified in the four
categories *Not in
CAPS ** Total
Benchmark 1 4 5 1 1 0 0 11
Benchmark 2 13 16 17 9 4 6 59
Benchmark 3 17 17 14 11 7 14 66
Benchmark 4 14 19 15 16 8 17 72
Benchmark 5 6 10 7 7 6 11 36
Benchmark 6 and 7 2 0 3 8 2 5 15
Total 56 67 57 52 27 53 259
* They could not be classified in any of the four categories since they are considered to be too difficult and falls outside the scope of the average Grade 9 learner.
** T he items indicated in the column are among the items that fall outside the Grades 4-6 or Grades 7-9 curriculum.
Source: (Scherman et al., 2017). Note that the numbers shown in the table are the authors’ calculations.
The observations from the analysis of the TIMSS items that could affect the achievement are as follows:
• There are some items in the assessment that are not linked to the CAPS Grades 4 to 9 curricula, and this
accounts for 19 per cent of all items. One-third of these items relate to knowledge in the Grades 10 to 12
curriculum. Some of these items may be classified as general knowledge, but if a learner has not been exposed
to this knowledge before, they may not be able to answer correctly.
• Given that only one-third of the learners spoke the language of the test at home, the language used in
constructing an item could be a factor that complicates the way that learners respond to test items. In addition,
learners may not be familiar with the scientific language (e.g. corrode, oxidation, Cartesian, permafrost,
monarch butterflies, deer mice, manx cats) required to understand an item.
• Some science items require using mathematical concepts to answer the questions and learners do not make
the link with the mathematical knowledge domains.
• South African learners seem to be struggling with questions classified as knowledge items. It is disconcerting
that many knowledge items fell into higher performance benchmarks 4, 5 and 6.
Using the categorisation of items at the different benchmark levels, the curriculum specialists further described
each item in the band in terms of the content and cognitive skill required. This then gives us a sense what learners
could do at each performance level for science and what they would need to learn to move to the next proficiency
level (Table 13.4).
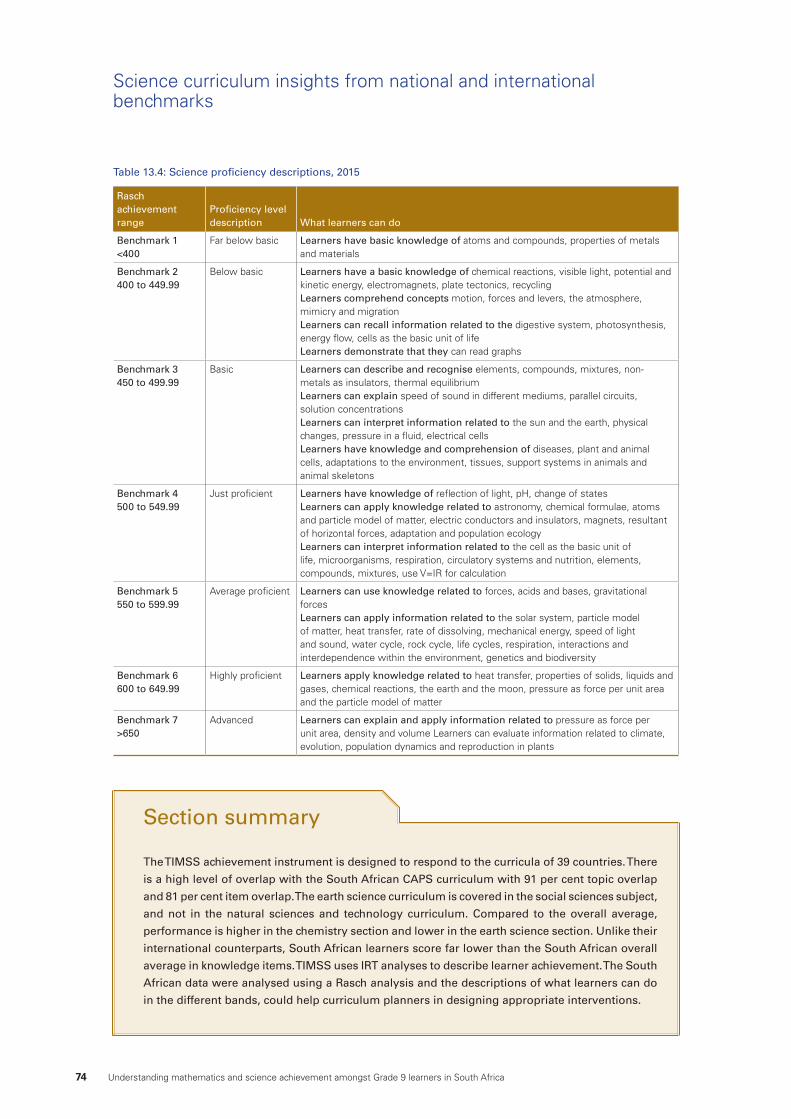
74 Understanding mathematics and science achievement amongst Grade 9 learners in South Africa
Science curriculum insights from national and international benchmarks
Table 13.4: Science proficiency descriptions, 2015
Rasch achievement range
Proficiency level description What learners can do
Benchmark 1<400
Far below basic Learners have basic knowledge of atoms and compounds, properties of metals and materials
Benchmark 2400 to 449.99
Below basic Learners have a basic knowledge of chemical reactions, visible light, potential and kinetic energy, electromagnets, plate tectonics, recyclingLearners comprehend concepts motion, forces and levers, the atmosphere, mimicry and migrationLearners can recall information related to the digestive system, photosynthesis, energy flow, cells as the basic unit of lifeLearners demonstrate that they can read graphs
Benchmark 3450 to 499.99
Basic Learners can describe and recognise elements, compounds, mixtures, non-metals as insulators, thermal equilibrium Learners can explain speed of sound in different mediums, parallel circuits, solution concentrations Learners can interpret information related to the sun and the earth, physical changes, pressure in a fluid, electrical cells Learners have knowledge and comprehension of diseases, plant and animal cells, adaptations to the environment, tissues, support systems in animals and animal skeletons
Benchmark 4500 to 549.99
Just proficient Learners have knowledge of reflection of light, pH, change of statesLearners can apply knowledge related to astronomy, chemical formulae, atoms and particle model of matter, electric conductors and insulators, magnets, resultant of horizontal forces, adaptation and population ecologyLearners can interpret information related to the cell as the basic unit of life, microorganisms, respiration, circulatory systems and nutrition, elements, compounds, mixtures, use V=IR for calculation
Benchmark 5550 to 599.99
Average proficient Learners can use knowledge related to forces, acids and bases, gravitational forcesLearners can apply information related to the solar system, particle model of matter, heat transfer, rate of dissolving, mechanical energy, speed of light and sound, water cycle, rock cycle, life cycles, respiration, interactions and interdependence within the environment, genetics and biodiversity
Benchmark 6600 to 649.99
Highly proficient Learners apply knowledge related to heat transfer, properties of solids, liquids and gases, chemical reactions, the earth and the moon, pressure as force per unit area and the particle model of matter
Benchmark 7>650
Advanced Learners can explain and apply information related to pressure as force per unit area, density and volume Learners can evaluate information related to climate, evolution, population dynamics and reproduction in plants
The TIMSS achievement instrument is designed to respond to the curricula of 39 countries. There
is a high level of overlap with the South African CAPS curriculum with 91 per cent topic overlap
and 81 per cent item overlap. The earth science curriculum is covered in the social sciences subject,
and not in the natural sciences and technology curriculum. Compared to the overall average,
performance is higher in the chemistry section and lower in the earth science section. Unlike their
international counterparts, South African learners score far lower than the South African overall
average in knowledge items. TIMSS uses IRT analyses to describe learner achievement. The South
African data were analysed using a Rasch analysis and the descriptions of what learners can do
in the different bands, could help curriculum planners in designing appropriate interventions.
Section summary
GKEY FINDINGS, POLICY IMPLICATIONS AND RECOMMENDATIONS
Understanding mathematics and science achievement amongst Grade 9 learners in South Africa 75
TIMSS 2015 Grade 9 National Report
PART
76 Understanding mathematics and science achievement amongst Grade 9 learners in South Africa
1. The value in participating in international assessments is increased when the results are used for understanding national conditions. South Africa’s participation in TIMSS over the last twenty years has enriched our
understanding of learner performance and how the country is ranked relative to other education systems
around the world. Raising performance standards can improve a country’s economic competitiveness.
Therefore, the global perspective is an important one. South Africa’s membership in the TIMSS community
has also helped to develop the capacity of local researchers and increased the technical rigour of our large-
scale assessments. The global perspective was supplemented by a national one. The South African analysis
included the identification of a group of potential learners. These are learners who are close to the minimum
competency benchmarks as defined by TIMSS. Additional Rasch analysis of the South African results can
better inform policy makers about what mathematics and science skills Grade 9 learners have acquired.
2. South African mathematics and science achievement scores have improved from a ‘very low’ (1995, 1999, 2003) to a ‘low’ (2011, 2015) national average. South Africa is still one of the lower-performing countries in
mathematics and science in comparison to other TIMSS participating countries. However, from 2003 to 2015
the country has shown the biggest positive improvement of all participating countries in both mathematics
(by 90 points) and science (by 87 points), which is equivalent to an improvement in achievement by two grade
levels. Average performance in the public school system and among historically weaker provinces has clearly
improved but most Grade 9 learners are yet to achieve a minimum level of competency in mathematics and
science, based on the TIMSS international perspective.
3. South African achievement continues to remain highly unequal but there has been a slight decline in inequality between schools over time. Like other low-performing countries, only one-third of South African learners
achieved a mathematics and science score above the benchmark of 400 points, a score denoting the minimum
level of competence. When the achievement scores are broken down by school type, the patterns reveal vast
inequalities. Approximately 80 per cent of learners attending independent schools, 60 per cent of learners at
fee-paying and 20 per cent of learners at no-fee schools achieved mathematics scores above the minimum
level of competency. Within this unequal performance, it is also worth noting that 3.2 per cent of South African
mathematics learners and 4.9 per cent of science learners achieved mathematics and science scores at the
high level of achievement (above 550 points).
Key findings, policy implications and recommendations
This report presented the findings of the TIMSS 2015 Grade 9 study in South Africa. It was also written to provide some perspective about how the results of international assessments can be used to provide meaningful national insights. The section that follows brings together the main findings from the descriptive, inferential and psychometric analyses and provides some policy recommendations for improving educational quality.
Understanding mathematics and science achievement amongst Grade 9 learners in South Africa 77
TIMSS 2015 Grade 9 National Report
PAR
TG
4. Almost half the Grade 9 learners in the school system are over-age. The pattern is different based on school
types with 43 per cent of learners in no-fee schools, 64 per cent in fee-paying and 73 per cent in independent
schools at the appropriate age. The achievement scores of over-age learners is much lower than age-grade
appropriate learners, suggesting that simply spending an extra year in a grade is not leading to more learning.
For grade repetition to lead to improved learning outcomes, repeat learners must receive extra learning
support. This must start at the foundation phase otherwise the performance levels will widen as learners
progress through the education system.
5. The importance of LoLT for mathematics and science goes further than previously considered in TIMSS. The influence of language was evident throughout this study. The national benchmarking exercise emphasised that
language skills were important for answering any item on the test regardless of the level of difficulty. At home,
parents who were not fluent in the language of instruction struggled to provide homework support for their
children. At school, less fluency in the language of the test (either English or Afrikaans) was related to lower
test scores. Learners who spoke the language of the test more frequently, achieved better results and this was
over and above the effect of SES. This implies that all learners, regardless of their SES, are disadvantaged by
lack of language fluency. Moreover, fluency in the LoLT does not guarantee academic success. The language
of mathematics and science in the classroom may present a completely different set of challenges if words
that learners are familiar with take on a different meaning in the classroom context. Addressing the role of
language is not easy nor is it quick. The goal is not to make learners more capable in the use of language simply
for testing purposes, but to ensure that they are better equipped to understand the nuances of the materials
covered in mathematics and science.
6. Resources matter but educational success goes beyond improving resource access. Learners from no-fee
schools had the most limited access to home resources, although there has been some improvement in
terms of equalising home access to running tap water, water-flush toilets and electricity. Access to technology
remained exclusive to wealthier learners. The evidence on school resources was both heartening and
disappointing. It was encouraging that physical resources had an independent and positive association with
average school achievement. This means that policies that have worked to improve access to school resources
can continue to play a positive role in improving educational quality. However, narrowing the achievement gap
between no-fee, fee-paying and independent schools is not as simple as just improving resource access. Forty
per cent of learners in fee-paying schools and 20 per cent of learners in independent schools failed to meet the
minimum level of competency set by TIMSS. Maintaining the momentum around resource accessibility and
efficient utility must continue but this is only part of the solution for improving performance and equity between
schools. Human resource challenges were greater in public schools and it was more difficult to fill vacancies in
these environments. Strategies to recruit and retain the best subject-specific teaching professionals into public
schools needs to continue.
7. The climate of the school counts. Schools with a healthier school climate (emphasis on academic success,
safety and order, fewer disciplinary problems, fewer incidences of bullying and fewer challenges faced by
teachers) had higher average achievement scores. A significant part of the achievement gaps between no-fee,
fee-paying and independent schools was explained by the type of climate in the school. Also worth noting was
that many different dimensions of school climate made a difference. In as much as improving school climate
needs to be prioritised, a broad view needs to be adopted when studying the climate of the school. The goal
should be to understand how the organisational and professional conditions of the school can support learning.
Because the climate of the school will reflect the climate of the community in which it is based, a healthy
school climate requires the input and support of school management and the community at large.
78 Understanding mathematics and science achievement amongst Grade 9 learners in South Africa
Key findings, policy implications and recommendations
8. Greater expectations endure in spite of the academic difficulties faced by many learners. Some learners
from no-fee schools did not plan to further their education beyond secondary school; and yet there was a
high percentage of learners with a low socioeconomic profile who aspired to obtaining an advanced degree.
Learners from public schools were also more likely to attend extra lessons, either to excel in class or keep
up in class. Further research is needed to understand how extra lessons fit into teaching and learning. It is
unclear whether learners attended extra lessons by choice, whether these lessons were paid for or offered
as a service by the community. Because learner support programmes may take many different forms, it is
crucial that their quality be regulated and that, wherever possible, learners receive support from accredited
organisations. Some would suggest that ambitions for further study are unrealistic, given the many hurdles
that these learners will face just to complete secondary school. We take a different view. We would like to think
that an enduring faith in the transformative power of education remains. It is the responsibility of educational
leaders to ensure that these hopes are fulfilled.
9. Continued analyses using local benchmarks should be encouraged to inform curriculum reform more effectively. We identified 35 per cent of mathematics learners and 28 per cent of science learners in the
group of potential learners (scoring between 325 and 400 TIMSS points). With a greater investment, especially
in no-fee schools, this group could improve their scores to over 400. The Rasch analysis created national
proficiency benchmarks based on South Africa’s learner performance. This provided a better sense of the
specific competency levels that exist in South Africa and what learners knew relative to the local curriculum
requirements. Most importantly, this process revealed in practical terms what teachers needed to cover to
help learners move from one benchmark to another. Policy makers, researchers and practitioners would do
well to build on this exercise so that local and international assessments can be better integrated. This is not an
easy undertaking, but building the links between local and international studies is crucial for future monitoring
purposes.
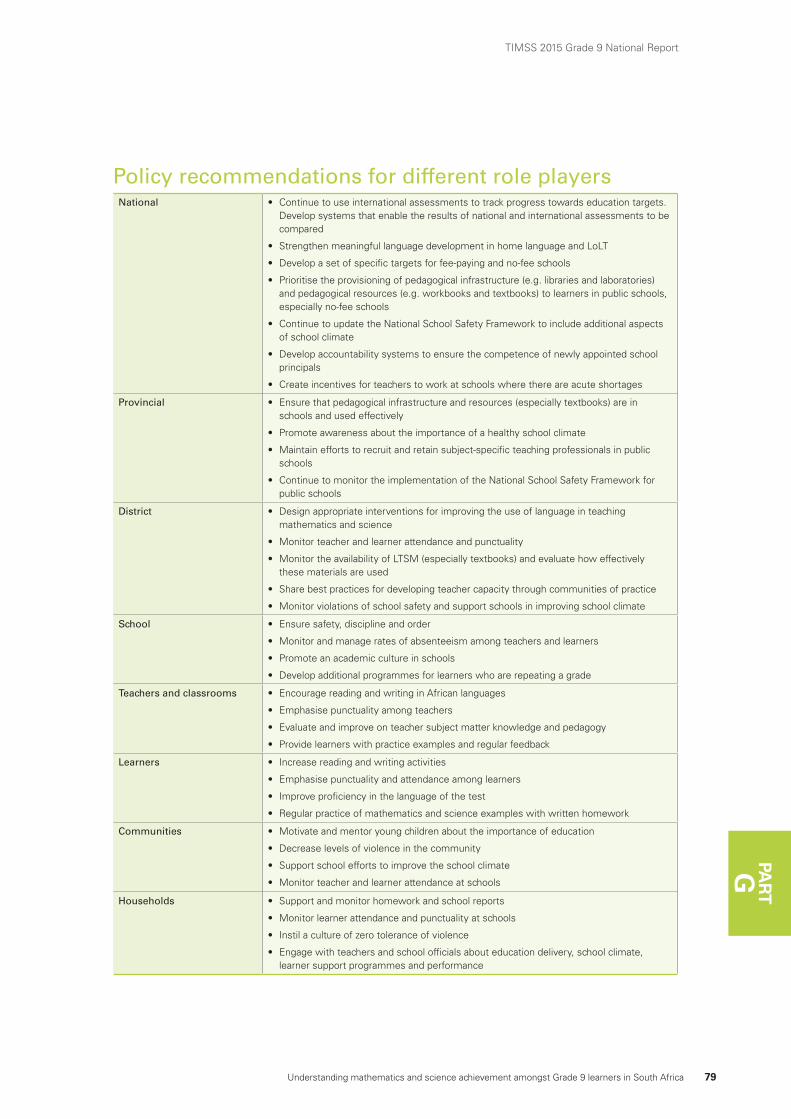
Understanding mathematics and science achievement amongst Grade 9 learners in South Africa 79
TIMSS 2015 Grade 9 National Report
PAR
TG
Policy recommendations for different role players National • Continue to use international assessments to track progress towards education targets.
Develop systems that enable the results of national and international assessments to be compared
• Strengthen meaningful language development in home language and LoLT
• Develop a set of specific targets for fee-paying and no-fee schools
• Prioritise the provisioning of pedagogical infrastructure (e.g. libraries and laboratories) and pedagogical resources (e.g. workbooks and textbooks) to learners in public schools, especially no-fee schools
• Continue to update the National School Safety Framework to include additional aspects of school climate
• Develop accountability systems to ensure the competence of newly appointed school principals
• Create incentives for teachers to work at schools where there are acute shortages
Provincial • Ensure that pedagogical infrastructure and resources (especially textbooks) are in schools and used effectively
• Promote awareness about the importance of a healthy school climate
• Maintain efforts to recruit and retain subject-specific teaching professionals in public schools
• Continue to monitor the implementation of the National School Safety Framework for public schools
District • Design appropriate interventions for improving the use of language in teaching mathematics and science
• Monitor teacher and learner attendance and punctuality
• Monitor the availability of LTSM (especially textbooks) and evaluate how effectively these materials are used
• Share best practices for developing teacher capacity through communities of practice
• Monitor violations of school safety and support schools in improving school climate
School • Ensure safety, discipline and order
• Monitor and manage rates of absenteeism among teachers and learners
• Promote an academic culture in schools
• Develop additional programmes for learners who are repeating a grade
Teachers and classrooms • Encourage reading and writing in African languages
• Emphasise punctuality among teachers
• Evaluate and improve on teacher subject matter knowledge and pedagogy
• Provide learners with practice examples and regular feedback
Learners • Increase reading and writing activities
• Emphasise punctuality and attendance among learners
• Improve proficiency in the language of the test
• Regular practice of mathematics and science examples with written homework
Communities • Motivate and mentor young children about the importance of education
• Decrease levels of violence in the community
• Support school efforts to improve the school climate
• Monitor teacher and learner attendance at schools
Households • Support and monitor homework and school reports
• Monitor learner attendance and punctuality at schools
• Instil a culture of zero tolerance of violence
• Engage with teachers and school officials about education delivery, school climate, learner support programmes and performance
80 Understanding mathematics and science achievement amongst Grade 9 learners in South Africa
APPENDIX
Understanding mathematics and science achievement amongst Grade 9 learners in South Africa 81
TIMSS 2015 Grade 9 National Report
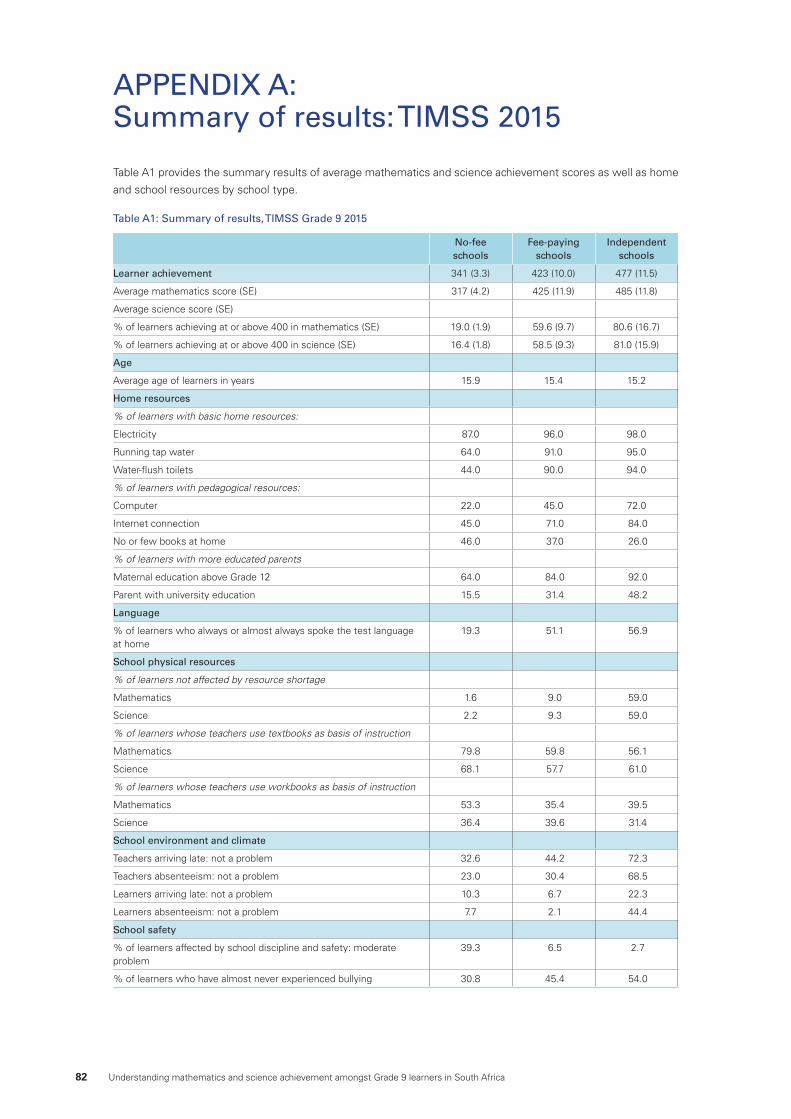
82 Understanding mathematics and science achievement amongst Grade 9 learners in South Africa
Table A1 provides the summary results of average mathematics and science achievement scores as well as home
and school resources by school type.
Table A1: Summary of results, TIMSS Grade 9 2015
No-fee schools
Fee-paying schools
Independent schools
Learner achievement 341 (3.3) 423 (10.0) 477 (11.5)
Average mathematics score (SE) 317 (4.2) 425 (11.9) 485 (11.8)
Average science score (SE)
% of learners achieving at or above 400 in mathematics (SE) 19.0 (1.9) 59.6 (9.7) 80.6 (16.7)
% of learners achieving at or above 400 in science (SE) 16.4 (1.8) 58.5 (9.3) 81.0 (15.9)
Age
Average age of learners in years 15.9 15.4 15.2
Home resources
% of learners with basic home resources:
Electricity 87.0 96.0 98.0
Running tap water 64.0 91.0 95.0
Water-flush toilets 44.0 90.0 94.0
% of learners with pedagogical resources:
Computer 22.0 45.0 72.0
Internet connection 45.0 71.0 84.0
No or few books at home 46.0 37.0 26.0
% of learners with more educated parents
Maternal education above Grade 12 64.0 84.0 92.0
Parent with university education 15.5 31.4 48.2
Language
% of learners who always or almost always spoke the test language at home
19.3 51.1 56.9
School physical resources
% of learners not affected by resource shortage
Mathematics 1.6 9.0 59.0
Science 2.2 9.3 59.0
% of learners whose teachers use textbooks as basis of instruction
Mathematics 79.8 59.8 56.1
Science 68.1 57.7 61.0
% of learners whose teachers use workbooks as basis of instruction
Mathematics 53.3 35.4 39.5
Science 36.4 39.6 31.4
School environment and climate
Teachers arriving late: not a problem 32.6 44.2 72.3
Teachers absenteeism: not a problem 23.0 30.4 68.5
Learners arriving late: not a problem 10.3 6.7 22.3
Learners absenteeism: not a problem 7.7 2.1 44.4
School safety
% of learners affected by school discipline and safety: moderate problem
39.3 6.5 2.7
% of learners who have almost never experienced bullying 30.8 45.4 54.0
APPENDIX A: Summary of results: TIMSS 2015
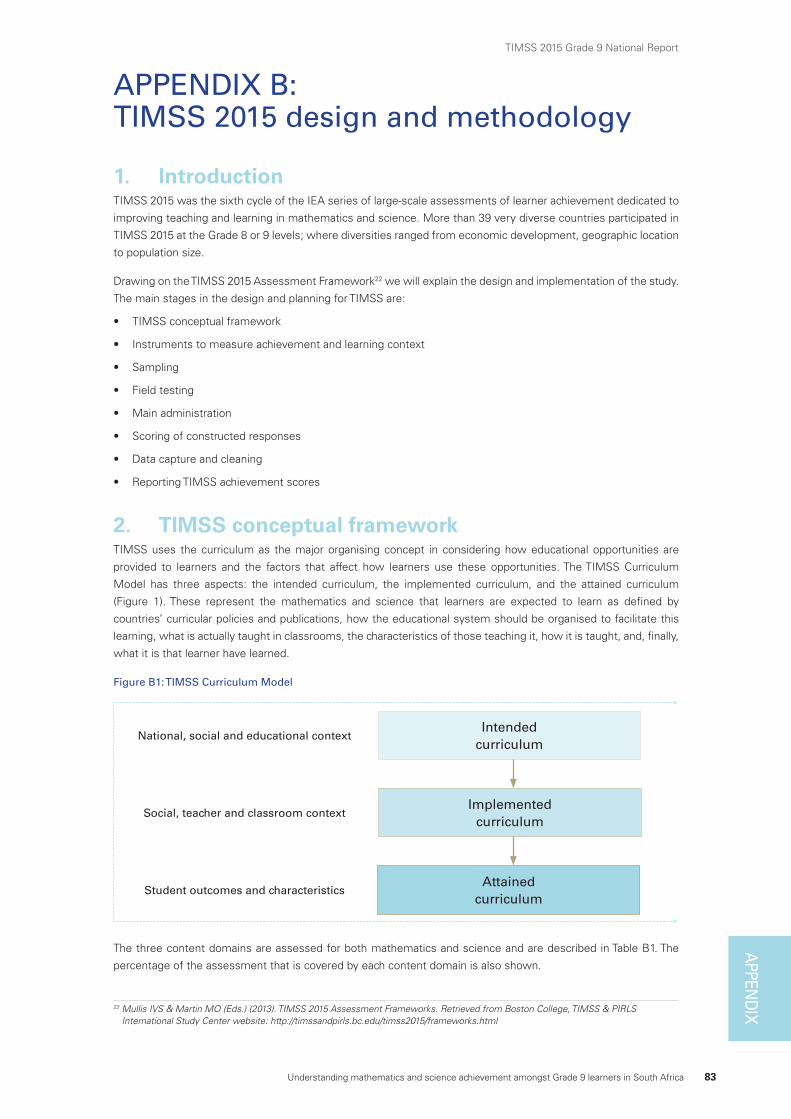
Understanding mathematics and science achievement amongst Grade 9 learners in South Africa 83
TIMSS 2015 Grade 9 National ReportAPPEN
DIX
1. IntroductionTIMSS 2015 was the sixth cycle of the IEA series of large-scale assessments of learner achievement dedicated to
improving teaching and learning in mathematics and science. More than 39 very diverse countries participated in
TIMSS 2015 at the Grade 8 or 9 levels; where diversities ranged from economic development, geographic location
to population size.
Drawing on the TIMSS 2015 Assessment Framework22 we will explain the design and implementation of the study.
The main stages in the design and planning for TIMSS are:
• TIMSS conceptual framework
• Instruments to measure achievement and learning context
• Sampling
• Field testing
• Main administration
• Scoring of constructed responses
• Data capture and cleaning
• Reporting TIMSS achievement scores
2. TIMSS conceptual frameworkTIMSS uses the curriculum as the major organising concept in considering how educational opportunities are
provided to learners and the factors that affect how learners use these opportunities. The TIMSS Curriculum
Model has three aspects: the intended curriculum, the implemented curriculum, and the attained curriculum
(Figure 1). These represent the mathematics and science that learners are expected to learn as defined by
countries’ curricular policies and publications, how the educational system should be organised to facilitate this
learning, what is actually taught in classrooms, the characteristics of those teaching it, how it is taught, and, finally,
what it is that learner have learned.
Figure B1: TIMSS Curriculum Model
Intendedcurriculum
Implementedcurriculum
National, social and educational context
Social, teacher and classroom context
Student outcomes and characteristicsAttained
curriculum
The three content domains are assessed for both mathematics and science and are described in Table B1. The
percentage of the assessment that is covered by each content domain is also shown.
APPENDIX B: TIMSS 2015 design and methodology
22 Mullis IVS & Martin MO (Eds.) (2013). TIMSS 2015 Assessment Frameworks. Retrieved from Boston College, TIMSS & PIRLS International Study Center website: http://timssandpirls.bc.edu/timss2015/frameworks.html
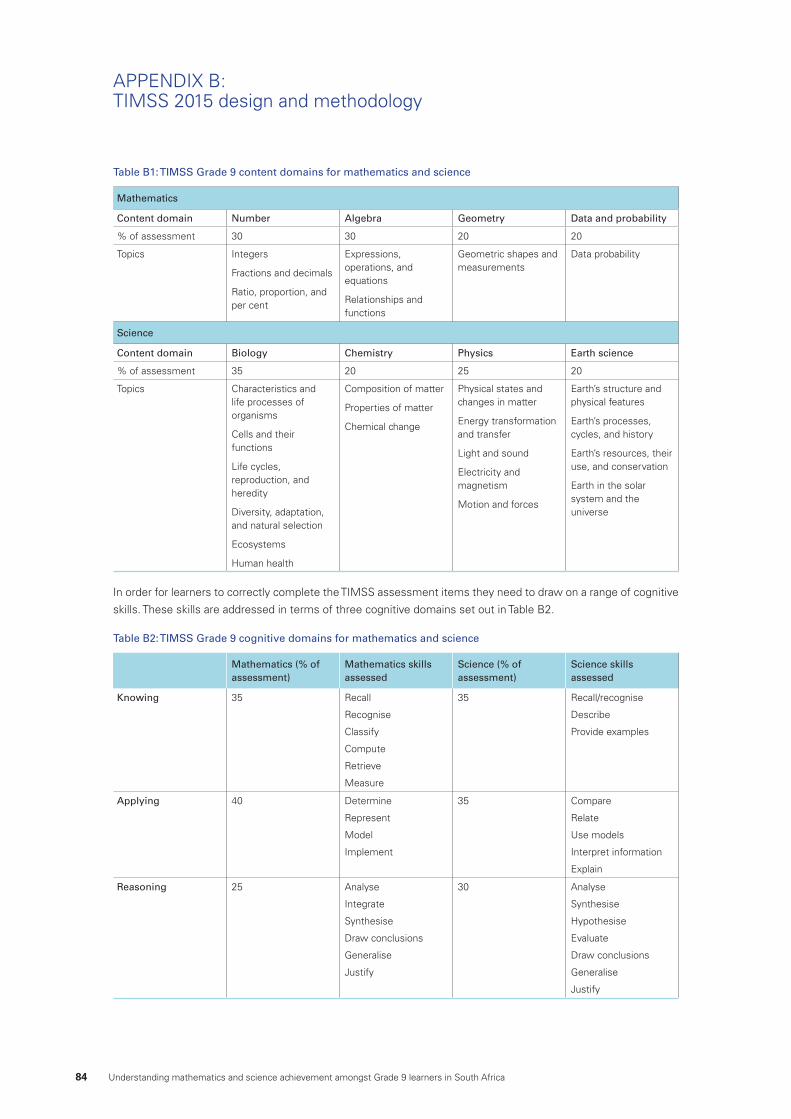
84 Understanding mathematics and science achievement amongst Grade 9 learners in South Africa
Table B1: TIMSS Grade 9 content domains for mathematics and science
Mathematics
Content domain Number Algebra Geometry Data and probability
% of assessment 30 30 20 20
Topics Integers
Fractions and decimals
Ratio, proportion, and per cent
Expressions, operations, and equations
Relationships and functions
Geometric shapes and measurements
Data probability
Science
Content domain Biology Chemistry Physics Earth science
% of assessment 35 20 25 20
Topics Characteristics and life processes of organisms
Cells and their functions
Life cycles, reproduction, and heredity
Diversity, adaptation, and natural selection
Ecosystems
Human health
Composition of matter
Properties of matter
Chemical change
Physical states and changes in matter
Energy transformation and transfer
Light and sound
Electricity and magnetism
Motion and forces
Earth’s structure and physical features
Earth’s processes, cycles, and history
Earth’s resources, their use, and conservation
Earth in the solar system and the universe
In order for learners to correctly complete the TIMSS assessment items they need to draw on a range of cognitive
skills. These skills are addressed in terms of three cognitive domains set out in Table B2.
Table B2: TIMSS Grade 9 cognitive domains for mathematics and science
Mathematics (% of assessment)
Mathematics skills assessed
Science (% of assessment)
Science skills assessed
Knowing 35 Recall
Recognise
Classify
Compute
Retrieve
Measure
35 Recall/recognise
Describe
Provide examples
Applying 40 Determine
Represent
Model
Implement
35 Compare
Relate
Use models
Interpret information
Explain
Reasoning 25 Analyse
Integrate
Synthesise
Draw conclusions
Generalise
Justify
30 Analyse
Synthesise
Hypothesise
Evaluate
Draw conclusions
Generalise
Justify
APPENDIX B: TIMSS 2015 design and methodology
Understanding mathematics and science achievement amongst Grade 9 learners in South Africa 85
TIMSS 2015 Grade 9 National ReportAPPEN
DIX
3. Instruments measuring learner achievement and context
A set of research instruments pertaining to learner achievement items and background information is developed
by the IEA with input from the various countries participating in the study. These instruments will be discussed in
the following sections.
3.1. Achievement bookletsThe TIMSS Achievement Booklets contain trend items. Trend items are used to measure trends but also to rescale
or calibrate items between cycles. After every cycle items are released and replaced with new items in the next
cycle. The new items are generated in National Research Coordinator meetings and are subjected to extensive
validation processes.
Throughout the TIMSS studies, vast numbers of items have accumulated and with every cycle certain items are
released into the public domain. Those that are used as trend items are not released. By releasing items into the
public domain, countries are able to use these items as examples for preparation for the next TIMSS cycle. The
HSRC sent all the released items to the sampled schools on a CD and these items appear on the DBE’s Thutong
website.
In order to ensure maximum curriculum coverage, TIMSS uses a matrix sampling approach where items are
arranged into blocks. The TIMSS items are spread across 14 booklets and a single booklet is administered to
learners.
3.2. Background questionnairesTo obtain better insights and explanations for the achievement scores, TIMSS included a number of background
questionnaires. Four questionnaires are administered in addition to the assessment instruments; these are:
• The Learner background questionnaire which is completed by the learner who completed the assessment
and asks about aspects of the learners’ home and school lives, their home environment, school climate for
learning and their perceptions and attitudes towards mathematics and science.
• The Teacher questionnaire is administered to the mathematics and science teachers of the learners who
wrote the assessment tests. The questionnaire was designed to gather information on teacher characteristics
as well as classroom contexts for teaching and learning mathematics and science.
• The School questionnaire is administered to the principal in all sampled schools. It asks about school
characteristics like instructional time, resources and technology as well as parental involvement.
• The Curriculum questionnaire is completed by the National Research Coordinator who is required to complete
information pertaining to the curriculum which is followed by South African public schools.
4. SamplingA sample of Grade 9 schools was selected to provide a national estimate of mathematics and science scores.
TIMSS 2015 followed the sampling procedures as prescribed in the TIMSS methods and procedures manual23.
TIMSS follows a two-stage stratified cluster sampling design; where 300 schools were selected with probability
proportionate to size at the first stage and at the second stage an intact Grade 9 class was selected within each
of the sampled schools.
23 Martin MO, Mullis IVS & Hooper M (Eds.). (2016). Methods and Procedures in TIMSS 2015. Retrieved from Boston College, TIMSS & PIRLS International Study Center website: http://timssandpirls.bc.edu/publications/timss/2015-methods.html
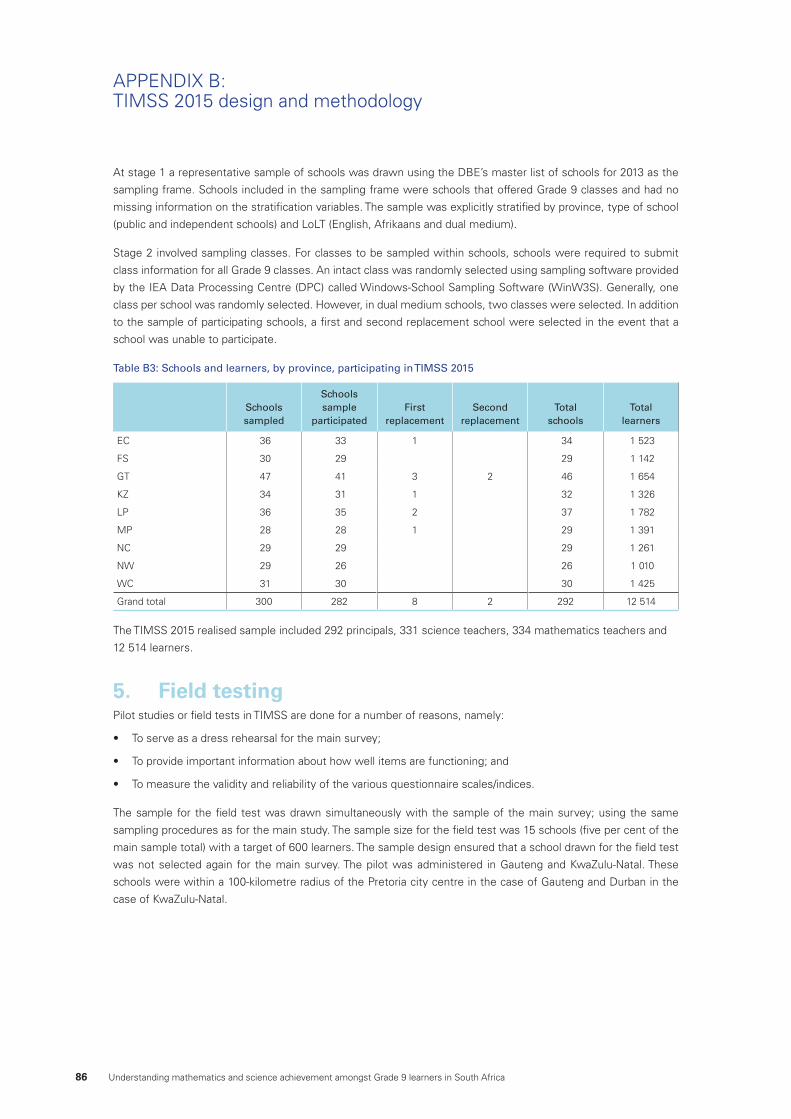
86 Understanding mathematics and science achievement amongst Grade 9 learners in South Africa
At stage 1 a representative sample of schools was drawn using the DBE’s master list of schools for 2013 as the
sampling frame. Schools included in the sampling frame were schools that offered Grade 9 classes and had no
missing information on the stratification variables. The sample was explicitly stratified by province, type of school
(public and independent schools) and LoLT (English, Afrikaans and dual medium).
Stage 2 involved sampling classes. For classes to be sampled within schools, schools were required to submit
class information for all Grade 9 classes. An intact class was randomly selected using sampling software provided
by the IEA Data Processing Centre (DPC) called Windows-School Sampling Software (WinW3S). Generally, one
class per school was randomly selected. However, in dual medium schools, two classes were selected. In addition
to the sample of participating schools, a first and second replacement school were selected in the event that a
school was unable to participate.
Table B3: Schools and learners, by province, participating in TIMSS 2015
Schoolssampled
Schools sample
participatedFirst
replacementSecond
replacementTotal
schoolsTotal
learners
EC 36 33 1 34 1 523
FS 30 29 29 1 142
GT 47 41 3 2 46 1 654
KZ 34 31 1 32 1 326
LP 36 35 2 37 1 782
MP 28 28 1 29 1 391
NC 29 29 29 1 261
NW 29 26 26 1 010
WC 31 30 30 1 425
Grand total 300 282 8 2 292 12 514
The TIMSS 2015 realised sample included 292 principals, 331 science teachers, 334 mathematics teachers and
12 514 learners.
5. Field testing Pilot studies or field tests in TIMSS are done for a number of reasons, namely:
• To serve as a dress rehearsal for the main survey;
• To provide important information about how well items are functioning; and
• To measure the validity and reliability of the various questionnaire scales/indices.
The sample for the field test was drawn simultaneously with the sample of the main survey; using the same
sampling procedures as for the main study. The sample size for the field test was 15 schools (five per cent of the
main sample total) with a target of 600 learners. The sample design ensured that a school drawn for the field test
was not selected again for the main survey. The pilot was administered in Gauteng and KwaZulu-Natal. These
schools were within a 100-kilometre radius of the Pretoria city centre in the case of Gauteng and Durban in the
case of KwaZulu-Natal.
APPENDIX B: TIMSS 2015 design and methodology
Understanding mathematics and science achievement amongst Grade 9 learners in South Africa 87
TIMSS 2015 Grade 9 National ReportAPPEN
DIX
6. Main administrationThere was a large amount of preparatory work done before the study was administered. The international TIMSS
team provided countries with very strict guidelines on how the preparation needed to be done. All these procedures
can be found, and described in detail, in the TIMSS 2015 survey operations procedures (unit 1 to 7) documents
within the TIMSS 2015 Methods and Procedures report24.
Pre-administration contact with schools is extremely important as it allowed the HSRC to obtain permission to
conduct the study, to access class lists with learner information as well as to arrange appointments with the
schools to administer the study.
Consistency between countries is important and the international team developed two basic procedures to guide
countries through the data collection phase:
6.1 Administration of the main surveyThe main survey was administered by an external fieldwork company with relevant qualifications and experience
in the field of educational assessment. South Africa administered the main study in the last two weeks of August
into the first week of September 2015. The HSRC worked with the DBE and provincial coordinators to ensure that
the study was successfully administered.
6.2 Monitoring the quality of the survey administrationQuality assurance of the fieldwork is important as it allows for valid learner achievement comparisons between
and within countries. Ten per cent of the sampled schools were randomly selected and senior HSRC researchers
served as National Quality Control Monitors to monitor the TIMSS administration processes. In addition, the
International TIMSS team selected and trained an International Quality Control Monitor. The International Quality
Control Monitor monitored the administration processes in 29 schools in South Africa.
7. Scoring the constructed response itemsThe constructed response (open-ended) items represent approximately 50 per cent of the TIMSS assessments,
hence the reliability and validity of scoring is critical to the quality of the assessment results. In order to achieve
reliable and valid scoring, the IEA provided training, comprehensive scoring guides and scoring procedures.
Learners’ responses were scored consistently, regardless of who is assigning the scores. The HSRC employed
teachers and university students to conduct the scoring. As a quality control measure, five per cent of the booklets
were marked twice by different scorers to check for consistency. This is referred to as reliability scoring. Moderating
of scoring quality was done by the HSRC staff on an ongoing basis for maintaining accurate and consistent scoring
throughout the process.
8. Data capture and cleaningAll data was captured using a software program developed by the IEA called Data Management Expert (DME).
The HSRC double captured all data and verified against the original capture. This ensured that the data remained
below the acceptable error rate of 0.1 per cent for assessment data and one per cent for contextual data. Once all
validation steps were performed on the data, it was sent to the IEA DPC in Germany for the final phase of cleaning.
The IEA remained in contact with data managers at the HSRC during the cleaning process.
24 Martin, MO, Mullis IVS & Hooper M (Eds.). (2016). Methods and Procedures in TIMSS 2015. Retrieved from Boston College, TIMSS & PIRLS International Study Center website: http://timssandpirls.bc.edu/publications/timss/2015-methods.html
88 Understanding mathematics and science achievement amongst Grade 9 learners in South Africa
9. Reporting TIMSS achievement scoresDue to the TIMSS item block design, IRT scaling methods generated five plausible values to obtain estimated
proficiency scores in mathematics and science. Each learner responded to about 70 items. Using statistical
methods and demographic background for similar learners, a score was imputed for each learner. This design solicits
relatively few responses from each sampled student while maintaining a wide range of content representation
when responses are aggregated across all learners. With this approach, the advantage of estimating population
characteristics is offset by the inability to make precise statements about individuals25.
The TIMSS 2015 achievement results are summarised using IRT scaling and report mathematics achievement
scores on a scale with a mean of 500 and a standard deviation of 100 together with a SE, which refers to the
statistical accuracy of the estimate.
APPENDIX B: TIMSS 2015 design and methodology
25 TIMSS and PIRLS Achievement Scaling Methodology Retrieved from https://timssandpirls.bc.edu/methods/pdf/TP11_Scaling_Methodology.pdf
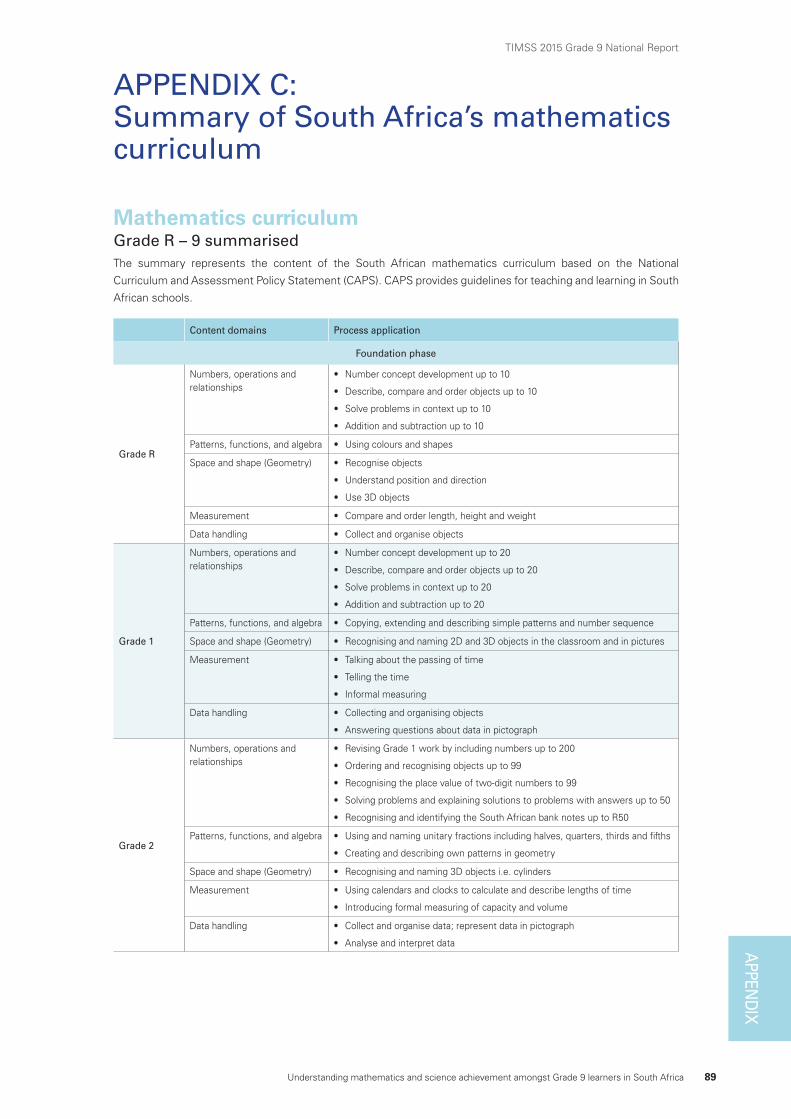
Understanding mathematics and science achievement amongst Grade 9 learners in South Africa 89
TIMSS 2015 Grade 9 National ReportAPPEN
DIX
Mathematics curriculumGrade R – 9 summarisedThe summary represents the content of the South African mathematics curriculum based on the National
Curriculum and Assessment Policy Statement (CAPS). CAPS provides guidelines for teaching and learning in South
African schools.
Content domains Process application
Foundation phase
Grade R
Numbers, operations and relationships
• Number concept development up to 10
• Describe, compare and order objects up to 10
• Solve problems in context up to 10
• Addition and subtraction up to 10
Patterns, functions, and algebra • Using colours and shapes
Space and shape (Geometry) • Recognise objects
• Understand position and direction
• Use 3D objects
Measurement • Compare and order length, height and weight
Data handling • Collect and organise objects
Grade 1
Numbers, operations and relationships
• Number concept development up to 20
• Describe, compare and order objects up to 20
• Solve problems in context up to 20
• Addition and subtraction up to 20
Patterns, functions, and algebra • Copying, extending and describing simple patterns and number sequence
Space and shape (Geometry) • Recognising and naming 2D and 3D objects in the classroom and in pictures
Measurement • Talking about the passing of time
• Telling the time
• Informal measuring
Data handling • Collecting and organising objects
• Answering questions about data in pictograph
Grade 2
Numbers, operations and relationships
• Revising Grade 1 work by including numbers up to 200
• Ordering and recognising objects up to 99
• Recognising the place value of two-digit numbers to 99
• Solving problems and explaining solutions to problems with answers up to 50
• Recognising and identifying the South African bank notes up to R50
Patterns, functions, and algebra • Using and naming unitary fractions including halves, quarters, thirds and fifths
• Creating and describing own patterns in geometry
Space and shape (Geometry) • Recognising and naming 3D objects i.e. cylinders
Measurement • Using calendars and clocks to calculate and describe lengths of time
• Introducing formal measuring of capacity and volume
Data handling • Collect and organise data; represent data in pictograph
• Analyse and interpret data
APPENDIX C: Summary of South Africa’s mathematics curriculum
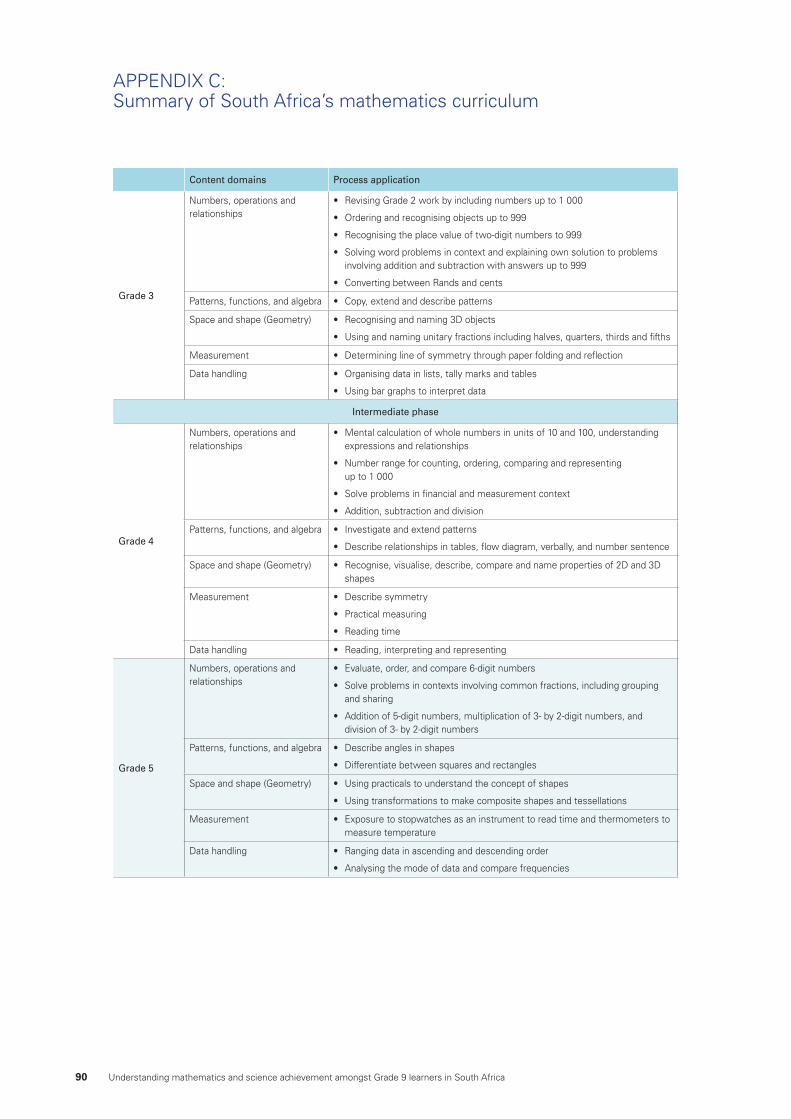
90 Understanding mathematics and science achievement amongst Grade 9 learners in South Africa
Content domains Process application
Grade 3
Numbers, operations and relationships
• Revising Grade 2 work by including numbers up to 1 000
• Ordering and recognising objects up to 999
• Recognising the place value of two-digit numbers to 999
• Solving word problems in context and explaining own solution to problems involving addition and subtraction with answers up to 999
• Converting between Rands and cents
Patterns, functions, and algebra • Copy, extend and describe patterns
Space and shape (Geometry) • Recognising and naming 3D objects
• Using and naming unitary fractions including halves, quarters, thirds and fifths
Measurement • Determining line of symmetry through paper folding and reflection
Data handling • Organising data in lists, tally marks and tables
• Using bar graphs to interpret data
Intermediate phase
Grade 4
Numbers, operations and relationships
• Mental calculation of whole numbers in units of 10 and 100, understanding expressions and relationships
• Number range for counting, ordering, comparing and representing up to 1 000
• Solve problems in financial and measurement context
• Addition, subtraction and division
Patterns, functions, and algebra • Investigate and extend patterns
• Describe relationships in tables, flow diagram, verbally, and number sentence
Space and shape (Geometry) • Recognise, visualise, describe, compare and name properties of 2D and 3D shapes
Measurement • Describe symmetry
• Practical measuring
• Reading time
Data handling • Reading, interpreting and representing
Grade 5
Numbers, operations and relationships
• Evaluate, order, and compare 6-digit numbers
• Solve problems in contexts involving common fractions, including grouping and sharing
• Addition of 5-digit numbers, multiplication of 3- by 2-digit numbers, and division of 3- by 2-digit numbers
Patterns, functions, and algebra • Describe angles in shapes
• Differentiate between squares and rectangles
Space and shape (Geometry) • Using practicals to understand the concept of shapes
• Using transformations to make composite shapes and tessellations
Measurement • Exposure to stopwatches as an instrument to read time and thermometers to measure temperature
Data handling • Ranging data in ascending and descending order
• Analysing the mode of data and compare frequencies
APPENDIX C: Summary of South Africa’s mathematics curriculum
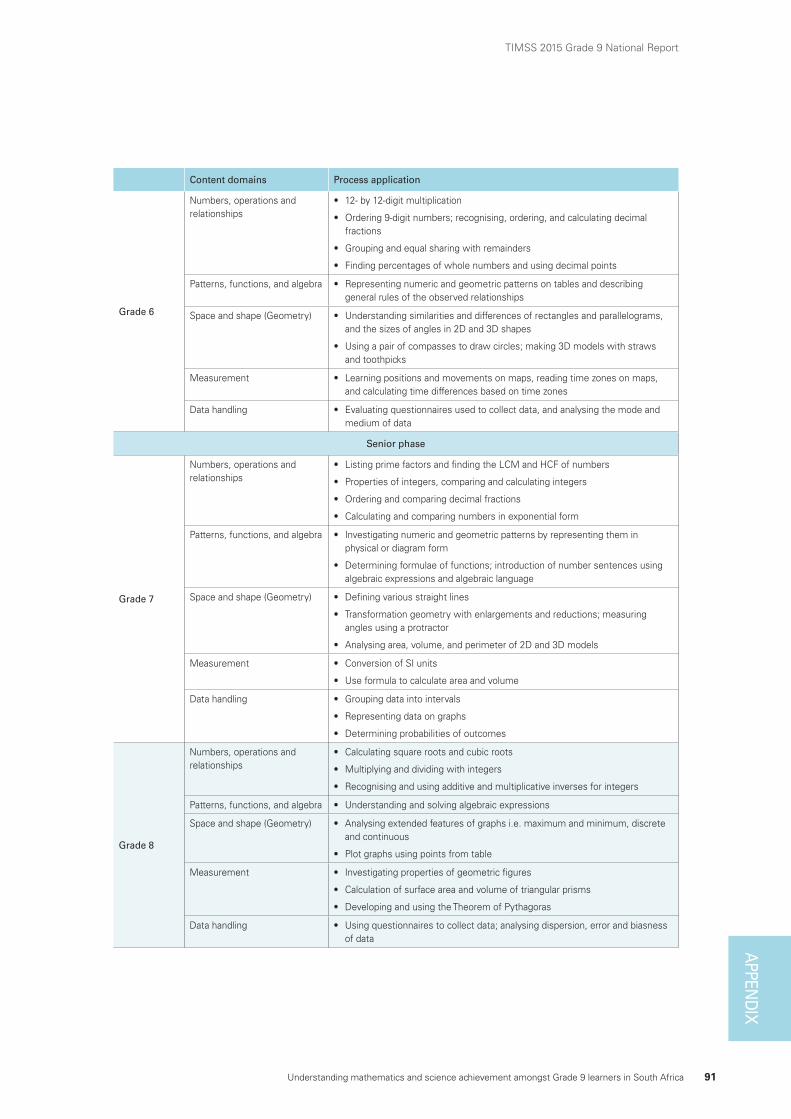
Understanding mathematics and science achievement amongst Grade 9 learners in South Africa 91
TIMSS 2015 Grade 9 National ReportAPPEN
DIX
Content domains Process application
Grade 6
Numbers, operations and relationships
• 12- by 12-digit multiplication
• Ordering 9-digit numbers; recognising, ordering, and calculating decimal fractions
• Grouping and equal sharing with remainders
• Finding percentages of whole numbers and using decimal points
Patterns, functions, and algebra • Representing numeric and geometric patterns on tables and describing general rules of the observed relationships
Space and shape (Geometry) • Understanding similarities and differences of rectangles and parallelograms, and the sizes of angles in 2D and 3D shapes
• Using a pair of compasses to draw circles; making 3D models with straws and toothpicks
Measurement • Learning positions and movements on maps, reading time zones on maps, and calculating time differences based on time zones
Data handling • Evaluating questionnaires used to collect data, and analysing the mode and medium of data
Senior phase
Grade 7
Numbers, operations and relationships
• Listing prime factors and finding the LCM and HCF of numbers
• Properties of integers, comparing and calculating integers
• Ordering and comparing decimal fractions
• Calculating and comparing numbers in exponential form
Patterns, functions, and algebra • Investigating numeric and geometric patterns by representing them in physical or diagram form
• Determining formulae of functions; introduction of number sentences using algebraic expressions and algebraic language
Space and shape (Geometry) • Defining various straight lines
• Transformation geometry with enlargements and reductions; measuring angles using a protractor
• Analysing area, volume, and perimeter of 2D and 3D models
Measurement • Conversion of SI units
• Use formula to calculate area and volume
Data handling • Grouping data into intervals
• Representing data on graphs
• Determining probabilities of outcomes
Grade 8
Numbers, operations and relationships
• Calculating square roots and cubic roots
• Multiplying and dividing with integers
• Recognising and using additive and multiplicative inverses for integers
Patterns, functions, and algebra • Understanding and solving algebraic expressions
Space and shape (Geometry) • Analysing extended features of graphs i.e. maximum and minimum, discrete and continuous
• Plot graphs using points from table
Measurement • Investigating properties of geometric figures
• Calculation of surface area and volume of triangular prisms
• Developing and using the Theorem of Pythagoras
Data handling • Using questionnaires to collect data; analysing dispersion, error and biasness of data
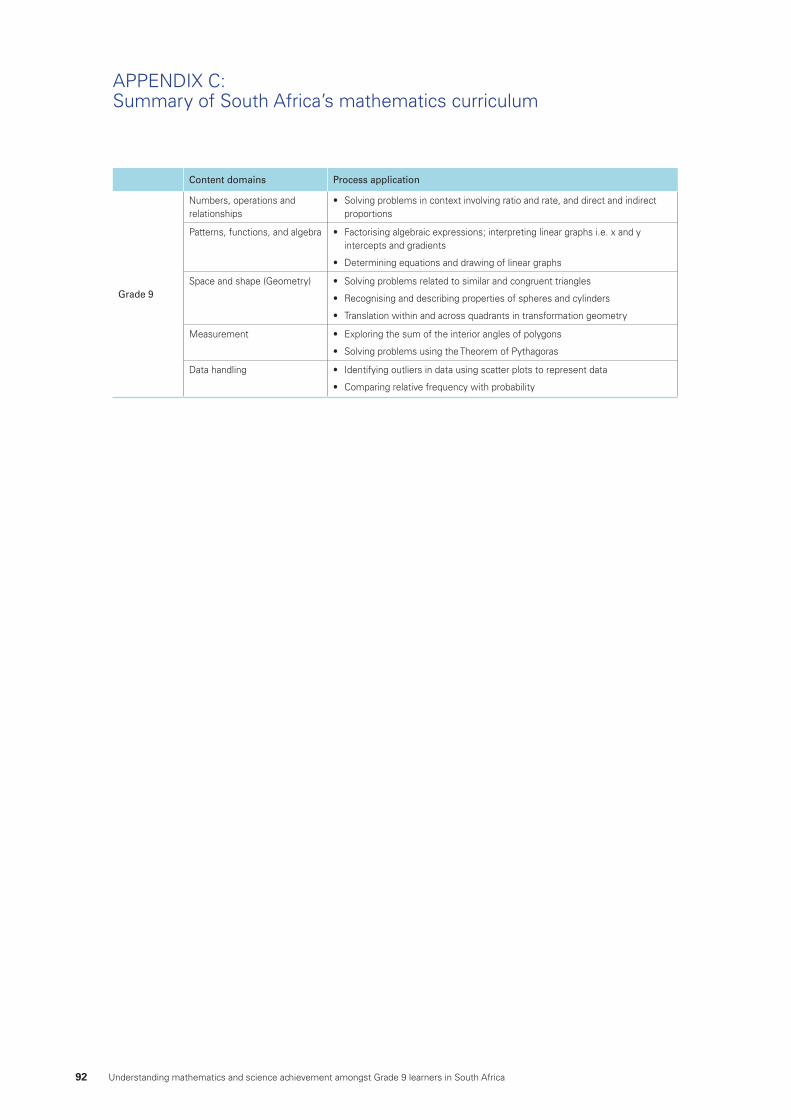
92 Understanding mathematics and science achievement amongst Grade 9 learners in South Africa
Content domains Process application
Grade 9
Numbers, operations and relationships
• Solving problems in context involving ratio and rate, and direct and indirect proportions
Patterns, functions, and algebra • Factorising algebraic expressions; interpreting linear graphs i.e. x and y intercepts and gradients
• Determining equations and drawing of linear graphs
Space and shape (Geometry) • Solving problems related to similar and congruent triangles
• Recognising and describing properties of spheres and cylinders
• Translation within and across quadrants in transformation geometry
Measurement • Exploring the sum of the interior angles of polygons
• Solving problems using the Theorem of Pythagoras
Data handling • Identifying outliers in data using scatter plots to represent data
• Comparing relative frequency with probability
APPENDIX C: Summary of South Africa’s mathematics curriculum
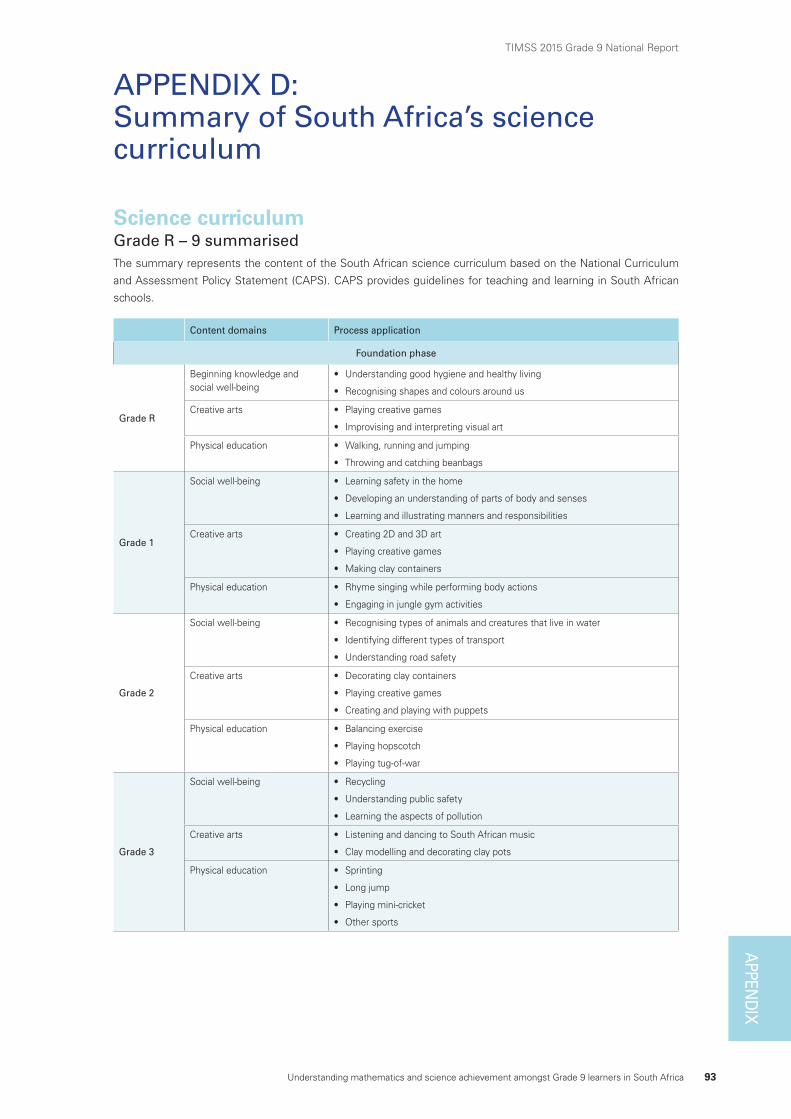
Understanding mathematics and science achievement amongst Grade 9 learners in South Africa 93
TIMSS 2015 Grade 9 National ReportAPPEN
DIX
Science curriculumGrade R – 9 summarisedThe summary represents the content of the South African science curriculum based on the National Curriculum
and Assessment Policy Statement (CAPS). CAPS provides guidelines for teaching and learning in South African
schools.
Content domains Process application
Foundation phase
Grade R
Beginning knowledge and social well-being
• Understanding good hygiene and healthy living
• Recognising shapes and colours around us
Creative arts • Playing creative games
• Improvising and interpreting visual art
Physical education • Walking, running and jumping
• Throwing and catching beanbags
Grade 1
Social well-being • Learning safety in the home
• Developing an understanding of parts of body and senses
• Learning and illustrating manners and responsibilities
Creative arts • Creating 2D and 3D art
• Playing creative games
• Making clay containers
Physical education • Rhyme singing while performing body actions
• Engaging in jungle gym activities
Grade 2
Social well-being • Recognising types of animals and creatures that live in water
• Identifying different types of transport
• Understanding road safety
Creative arts • Decorating clay containers
• Playing creative games
• Creating and playing with puppets
Physical education • Balancing exercise
• Playing hopscotch
• Playing tug-of-war
Grade 3
Social well-being • Recycling
• Understanding public safety
• Learning the aspects of pollution
Creative arts • Listening and dancing to South African music
• Clay modelling and decorating clay pots
Physical education • Sprinting
• Long jump
• Playing mini-cricket
• Other sports
APPENDIX D: Summary of South Africa’s science curriculum
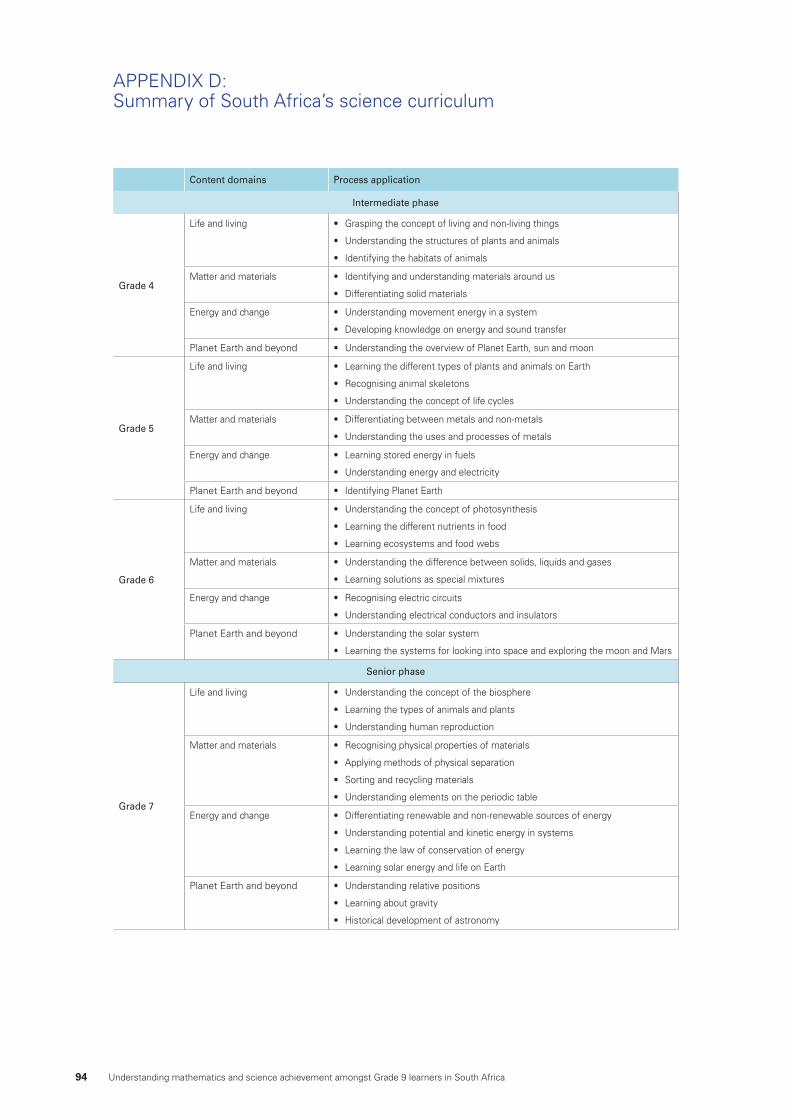
94 Understanding mathematics and science achievement amongst Grade 9 learners in South Africa
APPENDIX D: Summary of South Africa’s science curriculum
Content domains Process application
Intermediate phase
Grade 4
Life and living • Grasping the concept of living and non-living things
• Understanding the structures of plants and animals
• Identifying the habitats of animals
Matter and materials • Identifying and understanding materials around us
• Differentiating solid materials
Energy and change • Understanding movement energy in a system
• Developing knowledge on energy and sound transfer
Planet Earth and beyond • Understanding the overview of Planet Earth, sun and moon
Grade 5
Life and living • Learning the different types of plants and animals on Earth
• Recognising animal skeletons
• Understanding the concept of life cycles
Matter and materials • Differentiating between metals and non-metals
• Understanding the uses and processes of metals
Energy and change • Learning stored energy in fuels
• Understanding energy and electricity
Planet Earth and beyond • Identifying Planet Earth
Grade 6
Life and living • Understanding the concept of photosynthesis
• Learning the different nutrients in food
• Learning ecosystems and food webs
Matter and materials • Understanding the difference between solids, liquids and gases
• Learning solutions as special mixtures
Energy and change • Recognising electric circuits
• Understanding electrical conductors and insulators
Planet Earth and beyond • Understanding the solar system
• Learning the systems for looking into space and exploring the moon and Mars
Senior phase
Grade 7
Life and living • Understanding the concept of the biosphere
• Learning the types of animals and plants
• Understanding human reproduction
Matter and materials • Recognising physical properties of materials
• Applying methods of physical separation
• Sorting and recycling materials
• Understanding elements on the periodic table
Energy and change • Differentiating renewable and non-renewable sources of energy
• Understanding potential and kinetic energy in systems
• Learning the law of conservation of energy
• Learning solar energy and life on Earth
Planet Earth and beyond • Understanding relative positions
• Learning about gravity
• Historical development of astronomy
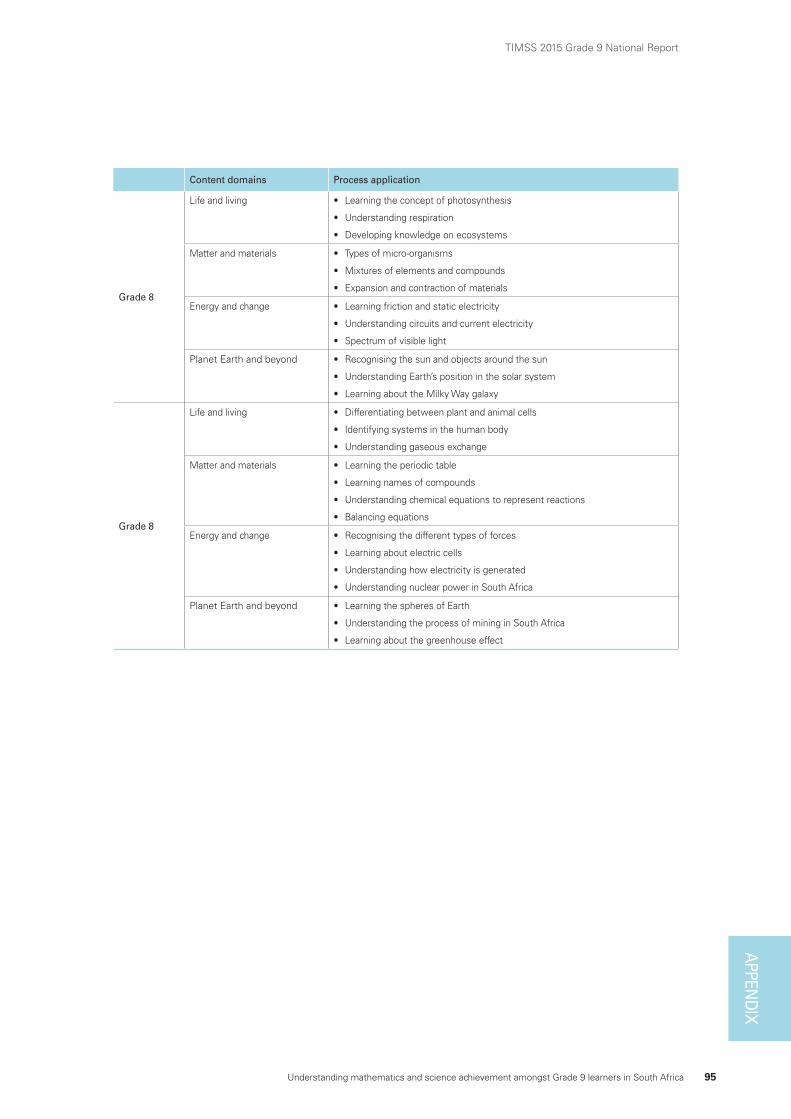
Understanding mathematics and science achievement amongst Grade 9 learners in South Africa 95
TIMSS 2015 Grade 9 National ReportAPPEN
DIX
Content domains Process application
Grade 8
Life and living • Learning the concept of photosynthesis
• Understanding respiration
• Developing knowledge on ecosystems
Matter and materials • Types of micro-organisms
• Mixtures of elements and compounds
• Expansion and contraction of materials
Energy and change • Learning friction and static electricity
• Understanding circuits and current electricity
• Spectrum of visible light
Planet Earth and beyond • Recognising the sun and objects around the sun
• Understanding Earth’s position in the solar system
• Learning about the Milky Way galaxy
Grade 8
Life and living • Differentiating between plant and animal cells
• Identifying systems in the human body
• Understanding gaseous exchange
Matter and materials • Learning the periodic table
• Learning names of compounds
• Understanding chemical equations to represent reactions
• Balancing equations
Energy and change • Recognising the different types of forces
• Learning about electric cells
• Understanding how electricity is generated
• Understanding nuclear power in South Africa
Planet Earth and beyond • Learning the spheres of Earth
• Understanding the process of mining in South Africa
• Learning about the greenhouse effect
96 Understanding mathematics and science achievement amongst Grade 9 learners in South Africa
References
Adler J (1998) A Language of Teaching Dilemmas: Unlocking the Complex Multilingual Secondary Mathematics
Classroom. For the Learning of Mathematics 18(1): 24-33
Adler J (1999) The dilemma of transparency: Seeing and seeing through talk in the mathematics classroom. Journal for Research in Mathematics Education 30(1): 47-64
Adler J (2006) Teaching mathematics in multilingual classrooms (Vol. 26): Springer: Science & Business Media
Banerjee A, Galiani S, Levinsohn J, McLaren Z & Woolard I (2009) Why has unemployment risen in the new South
Africa? Economics of Transition 16(4): 715-740
Basic Education Laws Amendment Act (Act 15). (2011). Basic Education Laws Amendment Act (Act 15 of 2011). South
Africa. Available at https://www.gov.za/sites/www.gov.za/files/a15_2011.pdf. [Accessed on 7 November 2017]
Bond TG & Fox CM (2015) Applying the Rasch model: Fundamental measurement in the human sciences (3rd edition). London: Lawrence Erlbaum Associates
Branson N & Hofmeyer C (2013) Progress through school and the determinants of school dropout in South Africa. Cape Town: SALDRU
Branson N, Lam D & Zuze TL (2012) Education: Analysis of the NIDS Wave 1 and 2 Datasets. Cape Town: SALDRU
Burton P & Leoschut L (2013) School Violence in South Africa: Results of the 2012 National School Violence Study. Cape Town: Centre for Justice and Crime Prevention
Caro DH, McDonald JT & Willms JD (2009) Socio-economic Status and Academic Achievement Trajectories from
Childhood to Adolescence. Canadian Journal of Education 32(3): 558-590
Case A & Deaton A (1999) School Inputs and Educational Outcomes in South Africa. The Quarterly Journal of Economics 114(3): 1047-1084
Cates GL & Rhymer KN (2003) Examining the relationship between mathematics anxiety and mathematics
performance: An instructional hierarchy perspective. Journal of Behavioral Education 12(1): 23-34
Cape Higher Education Consortium (2013) Pathways from university to work: A graduate destination survey of the 2010 cohort of graduates from the Western Cape Universities. Wynberg: CHEC
Central Applications Office (2017) Handbook 2018 Entry. Durban: Central Applications Office
Chisholm L (2013) The textbook saga and corruption in education. Southern African Review of Education with Education with Production 19(1): 7-22
Coleman JS, Campbell EQ, Hobson CJ, McPortland J, Mood AM, Weinfeld FD & York RL (1966), Equality of
Educational Opportunity, Washington D.C., US. Dept. of Health, Education and Welfare, Office of Education/
National Center for Education Statistics
Commission for Gender Equality (2007) Gender in the curriculum. Johannesburg: Commissiin for Gender Equality
Department of Basic Education (2010) The National Policy for an Equitable Provision of an Enabling School Physical Teaching and Learning Environment. Pretoria: Department of Basic Education
Department of Basic Education (2011a) Action Plan to 2014: Towards the Realisation of Schooling 2025. Pretoria:
Department of Basic Education
Department of Basic Education (2011b) National Education Infrastructure Management System Report. Pretoria:
Department of Basic Education
Understanding mathematics and science achievement amongst Grade 9 learners in South Africa 97
TIMSS 2015 Grade 9 National Report
Department of Basic Education (2012a) Guidelines Relating to Planning for Public School Infrastructure. Pretoria:
Department of Basic Education
Department of Basic Education (2012b) National Guidelines for School Library and Information Services. Pretoria:
Department of Basic Education
Department of Basic Education (2013a) Guide to Drug Testing in South African Schools. Pretoria: Department of
Basic Education
Department of Basic Education (2013b) The Incremental Introduction of African Languages in South African Schools. Draft Policy. Pretoria: Department of Basic Education
Department of Basic Education (2014) Draft National Policy for the Provision and Management of Learning and Teaching Support Material (LTSM). Pretoria: Department of Basic Education
Department of Basic Education (2015a) Action Plan to 2019: Towards the realisation of schooling 2030. Taking forward South Africa’s National Development Plan 2030. Pretoria: Department of Basic Education
Department of Basic Education (2015b) National School Nutrition Programme 2013/14 Annual Report. Pretoria:
Department of Basic Education
Department of Basic Education (2015c) The National School Safety Framework. Pretoria: Department of Basic
Education
Department of Basic Education (2015d) School Safety/Violence & Bullying in Schools; Quality Learning and Teaching Campaign (QLTC) Implementation: progress report. Pretoria: Department of Basic Education
Department of Basic Education (2016a) Education Statistics in South Africa 2014. Pretoria: Department of Basic
Education
Department of Basic Education (2016b) National Senior Certificate Examination Report 2016. Pretoria: Department
of Basic Education
Department of Basic Education (2016c) Report on progress in the schooling sector against key learner performance and attainment indicators. Pretoria: Department of Basic Education
Department of Basic Education (2016d) Revised Five Year Strategic Plan – 2015/16-2019/20. Pretoria: Department
of Basic Education
Department of Basic Education (2017a) Safety in schools. Pretoria: Department of Basic Education
Department of Basic Education (2017b) School Infrastructure and Security Guidelines. Pretoria: Department of
Basic Education
Department of Education (1995) White Paper on Education and Training. Pretoria: Department of Education
Department of Education (2001a) National Strategy for Mathematics, Science and Technology Education. Pretoria:
Department of Education
Department of Education (2001b) National Strategy for Mathematics, Science and Technology Education in Gender and Further Education and Training. Pretoria: Department of Education
Department of Education (2004) White Paper on e-Education. Transforming Learning and Teaching through Information and Communication Technologies (ICTs). Pretoria: Department of Education
98 Understanding mathematics and science achievement amongst Grade 9 learners in South Africa
References
Department of Planning, Monitoring and Evaluation (2014) Medium Term Strategic Framework: 2014-2019. Pretoria:
Department of Planning, Monitoring and Evaluation
Education Laws Amendment Act No. 50 (2002) Education Laws Amendment Act (Act 50 of 2002)
Eyal K & Woolard I (2013) School Enrolment and the Child Support Grant: Evidence from South Africa. Cape Town:
NIDS
Fleisch B (2008) Primary education in crisis: Why South African schoolchildren underachieve in reading and
mathematics. Cape Town: Juta and Company Ltd
Foley AE, Herts JB, Borgonovi F, Guerriero S, Levine SC & Beilock SL (2017) The Math Anxiety-Performance Link:
A Global Phenomenon. Current Directions in Psychological Science 26(1): 52-58
Gauteng Department of Education (2012) Exemplar School Safety Policy. Johannesburg: Gauteng Department of
Education
Gustafsson M (2016) Understanding trends in high-level achievement in Grade 12 mathematics and physical science. Stellenbosch: Research on Socio-Economic Policy
Gustafsson M & Patel F (2006) Undoing the apartheid legacy: Pro-poor spending shifts in the South African public
school system. Perspectives in education 24(2): 65-77
Hanushek EA & Woessmann L (2015) The Knowledge Capital of Nations: Education and the Economics of Growth. Cambridge Massachusetts: MIT Press
Harris AL & Robinson K (2016) A New Framework for Understanding Parental Involvement: Setting the Stage
for Academic Success. Russell Sage Foundation Journal of the Social Sciences. 2(5): 186-201. doi:10.7758/
rsf.2016.2.5.09
Hoover-Dempsey KV, Battiato AC, Walker JMT, Reed RP, DeJong JM & Jones KP (2001) Parental Involvement in
Homework. Educational Psychologist 36(3): 195-209. doi:10.1207/S15326985EP3603_5
Hox J (2010) Multilevel Analysis. Techniques and Applications. New York: Routledge
Lee VE, Zuze TL & Ross K (2005) School effectiveness in 14 sub-Saharan African countries: Links with 6 th Graders’ reading achievement. (Vol. 31)
Lee VE & Zuze TL (2011) School Resources and Academic Performance in Sub-Saharan Africa. Comparative Education Review 55(3): 369-397
Lubienski ST, Robinson JP, Crane CC & Ganley CM (2013) Girls’ and Boys’ Mathematics Achievement, Affect, and
Experiences: Findings from ECLS-K. National Council of Teachers of Mathematics 44(4): 634-645
McCamey R (2002) A primer for the one-parameter Rasch model. Paper presented at the Annual Meeting of the
Southwest Educational Research Association, Austin, Texas
Mouton J, Boshoff N, James M & Treptow R (2010) ASSAF Tracer Study of University Graduates in the Social Sciences, Humanities and Arts. Stellenbosch: National Institute for the Human and Social Sciences
Mullis IVS, Martin MO, Foy P & Hooper M (2016) TIMSS 2015 International Results in Mathematics. Boston: TIMSS
& PIRLS International Study Center
National Planning Commission (2011) National Development Plan: Vision for 2030. Pretoria: The Presidency
Understanding mathematics and science achievement amongst Grade 9 learners in South Africa 99
TIMSS 2015 Grade 9 National Report
OECD (2013a) PISA 2012 Results: Excellence Through Equity: Giving Every Student the Chance to Succeed (Volume II). Paris: OECD
OECD (2013b) Ready to Learn: Students’ Engagement, Drive and Self-Beliefs - Volume II. Paris: OECD
PISA (2016) Equations and Inequalities. Making Mathematics Accessible to All. Paris: OECD
Probyn M (2009) ‘Smuggling the vernacular into the classroom’: conflicts and tensions in classroom codeswitching
in township/rural schools in South Africa. International Journal of Bilingual Education and Bilingualism 12(2):
123-136. doi:10.1080/13670050802153137
Raudenbush SW & Bryk AS (2002) Hierarchical linear models: Applications and data analysis methods. London:
Sage
Reddy V, Visser M., Winnaar L., Arends F., Juan A., Prinsloo CH & Isdale K (2016a) TIMSS 2015. Highlights of Mathematics and Science Achievement of Grade 9 South African Learners. Nurturing Green Shoots. Pretoria:
Human Sciences Research Council
Reddy V, Bhorat H, Powell M, Visser M & Arends F (2016b) Skills Supply and Demand in South Africa. Pretoria:
HSRC
Reddy V, Juan A, Zuze TL, Namome C & Hannan S (2016c) Does it matter if students enjoy learning science?
Exploring student attitudes towards science in South Africa. TIMSS SA Policy Briefs. Pretoria: HSRC
Reddy V, Kanjee A, Diedericks G & Winnaar L (2006) Mathematics and science achievement at South African schools in TIMSS 2003. Pretoria: HSRC
Reddy V, Prinsloo CH, Netshitangani T, Moletsane R, Juan A & Janse van Rensburg D (2010) An investigation into
educator leave in the South African ordinary public schooling system. Pretoria: HSRC
Reddy V, Zuze T, Visser M, Winnaar L, Juan A, Prinsloo C & Rogers S (2015) Beyond benchmarks: What twenty years of TIMSS data tell us about South African education: HSRC Press
Rodwell P (2015) 8 Aspects of a positive school climate & culture. Available at https://www.kickboardforschools.
com/blog/post/8-aspects-of-a-positive-school-climate-culture. [Accessed on 6 November 2017]
Roksa J & Potter D (2011) Parenting and Academic Achievement: Intergenerational Transmission of Educational
Advantage. Sociology of Education 84(4): 299-321
Rumberger RW & Palardy GJ (2004). Multilevel models of School Effectiveness Research. In D. Kaplan (Ed.),
Handbook of Quantitative Methodology for the Social Sciences (pp. 235-258). Thousand Oaks, CA: Sage
Publishers
SACMEQ. (2010) How successful are textbook provision programmes? Paris: SACMEQ
SASSA (2017) Statistical Report 4 of 2017 – 30 April 2017. Pretoria: South African Social Security Agency SASSA
Scherman V, Long C, Coetzee C & Abrie M (2017) Establishing Benchmarks. Using TIMSS performance data to create relevant benchmarks for South Africa. Unpublished manuscript
Sebastian J, Moon JM & Cunningham M (2017) The relationship of school-based parental involvement with student
achievement: a comparison of principal and parent survey reports from PISA 2012. Educational Studies, 43(2):
123-146
Setati M & Adler J (2000) Between languages and discourses: Language practices in primary multilingual
mathematics classrooms in South Africa. Educational Studies in Mathematics, 43(3): 243-269
100 Understanding mathematics and science achievement amongst Grade 9 learners in South Africa
References
Snijders T & Bosker R (1999) Multilevel analysis: An introduction to basic and applied multilevel analysis. London:
Sage
Stats SA (2016) Community Survey 2016 in Brief. Statistics South Africa. Pretoria: SSA
Swars SL, Daane C & Giesen J (2006) Mathematics anxiety and mathematics teacher efficacy: What is the
relationship in elementary preservice teachers? School Science and Mathematics, 106(7): 306-315
Taylor S & Yu D (2009) The importance of socio-economic status in determining educational achievement in South
Africa. Unpublished Working Paper (Economics). Stellenbosch: Stellenbosch University.
Thapa A, Cohen J, Higgins-D’Alessandro A & Guffey S (2012) School climate research summary: August 2012. New
York: National School Climate Center
The Constitution of the Republic of South Africa (1996) Constitution of the Republic of South Africa. Pretoria:
Government Printer
Thien LM & Ong MY (2015) Malaysian and Singaporean students’ affective characteristics and mathematics
performance: evidence from PISA 2012 SpringerPlus 4: 563
Traub RE & Wolfe RG (1981) Latent Trait Theories and the Assessment of Educational Achievement. Review of Research in Education 9: 377-435
United Nations (2017) The Sustainable Development Goals Report. Retrieved from New York: UN
Van der Berg S (2008) How effective are poor schools? Poverty and educational outcomes in South Africa. Studies in Educational Evaluation 34(3): 145-154
Veriava F (2013) The 2012 Limpopo Book Crisis. Johannesburg: Section 27
Visser M, Juan A & Feza N (2015) Home and school resources as predictors of mathematics performance in South
Africa. South African Journal of Education 35(1): 1-10
Wang M & Sheikh-Khalil S (2014) Does Parental Involvement Matter for Student Achievement and Mental Health
in High School? Child development 85(2): 610-625
Watt L (2016) Engaging hard to reach families: learning from five ‘outstanding’ schools. Education 3-13 44(1): 32-43
Wilder S (2014) Effects of parental involvement on academic achievement: a meta-synthesis. Educational Review 66(3): 377-397
Zieky MJ (2012) So much has changed. In Cizek GJ (Ed.), Setting performance standards: Foundations, methods and innovations. London: Routledge
Zuze TL & Leibbrandt M (2011) Free education and social inequality in Ugandan primary schools: A step backward
or a step in the right direction? International Journal of Educational Development 31(2): 169-178
Zuze TL & Reddy V (2014) School resources and the gender reading literacy gap in South African schools.
International Journal of Educational Development 36 (Supplement C): 100-107
Zuze TL, Reddy V, Juan A, Hannan S, Visser M & Winnaar L (2016) Safe and sound?: violence and South African
education. TIMSS SA Policy Briefs
Zuze TL, Reddy V, Juan A, Visser M, Winnaar L & Hannan S (2015) Have we reached gender equity in mathematics education? Evidence from TIMSS South Africa 2011
Understanding mathematics and science achievement amongst Grade 9 learners in South Africa 101
TIMSS 2015 Grade 9 National Report
Index
A
Accelerated Schools Infrastructure Development Initiative (ASIDI) ...................................................................7, 18
C
Curriculum ........................................................ 3, 6, 7, 8, 9, 10, 12, 14,17, 18, 19, 20, 30, 44, 50, 51, 52, 53, 56,57,
.................................................................................... 62, 69, 70, 71, 72, 73, 74, 78, 83, 85, 89, 90, 92, 93, 94, 96
D
DBE Action Plan...................................................................................................................................18, 47, 96, 97
E
Educational quality ......................................................................................................................7, 12, 14, 67, 76, 77
H
Homework .......................................................................................2, 4, 6, 9, 11, 38, 39, 40, 41, 42, 62, 77, 79, 98
I
Incremental Introduction of African Languages (IIAL) .................................................................................7, 18, 29
International benchmarks ............................................................................... 3, 4, 6, 19, 23, 24, 69, 70, 71, 72, 74
L
Language of Learning and Teaching (LoLT) .......................................................2, 7, 9, 11, 18, 20, 29, 63, 77, 79, 86
Learner attitudes .......................................................................................................6, 9, 34, 35, 36, 51, 62, 85, 99
Learning and Teaching Support Material (LTSM) ...................................................................7, 18, 19, 44, 47, 79, 97
Library .....................................................................................................................3, 4, 19, 48, 49, 60, 67, 68, 97
School computer............................................................................................................................................4, 48
Science Laboratory ..................................................................................................................3, 5, 16, 48, 49, 60
Textbook .....................................................................................2, 4, 6, 18, 44, 45, 46, 47, 48, 60, 79, 82, 96, 99
M
Meals offered at school ................................................................................................................................3, 5, 50
N
National benchmarks .......................................................................................... 3, 6, 10, 11, 20, 69, 70, 71, 72, 77
National Development Plan (NDP) .....................................................................................................................7, 17
National School Nutrition Programme (NSNP) ...................................................................................... 7, 30, 50, 97
National School Safety Framework ...........................................................................................................19, 79, 97
National Strategy for Mathematics, Science and Technology Education ...........................................................7, 18
S
Sampling ........................................................................................................................................... 7, 8, 83, 85, 86
School climate ............................................................3, 5, 9, 12, 44, 50, 51, 53, 60, 65, 67, 68, 77, 79, 85, 99, 100
Bullying of learners in schools .............................................5, 9, 12, 19, 20, 50, 54, 55, 60, 66, 67, 68, 77, 82, 97
Challenges teachers face ...................................................................................................................................50
Emphasis on academic success ........................................................3, 5, 9, 14, 12, 20, 51, 52, 60, 67, 68, 77, 98
Learner sense of school belonging ..............................................................................................................51, 60
Safe and orderly schools ........................................9, 12, 18, 19, 50, 51, 53, 55, 67, 68, 77, 79,82, 93, 97, 98, 100
School discipline ..........................................................................................3, 5, 9, 51, 53, 54, 60, 63, 68, 79, 82
Teacher job satisfaction .....................................................................................................................9, 50, 51, 60
School effectiveness .......................................................................................................3, 5, 10, 62, 63, 64, 65, 98
Multilevel modeling (HLM) ..................................................................................8, 10, 20, 63, 64, 65, 66, 98, 99
Learner effects...............................................................................................................................................6, 66
School effects .......................................................................................................................................... 6, 67, 68
102 Understanding mathematics and science achievement amongst Grade 9 learners in South Africa
Science curriculum insights nationally ............................................................................................ 3, 69, 70, 72, 74
Socioeconomic .................................................................................................... 2, 7, 11, 12, 14, 28, 31, 32, 66, 78
Home resources .......................................................................................................2, 4, 9, 12, 30, 31, 36, 77, 82
Parental education .........................................................................................................................4, 6, 31, 33, 36
STEM ...........................................................................................................................................................7, 15, 17
T
Teachers and classroom instruction ......................................................................................................................56
Difficulty to fill vacancies ..................................................................................................................... 3, 9, 57, 60
Teacher absenteeism and punctuality ............................................................................................................3, 59
Teacher collaboration .....................................................................................................................................3, 56
Trends in performance ...................................................... 1, 2, 4, 7, 8, 17, 20, 21, 22, 29, 47, 55, 62, 70, 71, 85, 98
Index
Understanding mathematics and science achievement amongst Grade 9 learners in South Africa 103
TIMSS 2015 Grade 9 National Report
Notes
104 Understanding mathematics and science achievement amongst Grade 9 learners in South Africa
Notes

www.hsrcpress.ac.za
ISBN 978-0-7969-2502-2
9 780796 925022
ISBN 978-0-7969-2502-2
The 2015 TIMSS Grade 9 study was administered in August 2015
by a team of researchers at the Human Sciences Research Council
(HSRC) in collaboration with the Department of Basic Education
(DBE) and the International Association for the Evaluation of
Educational Achievement (IEA). This was the fifth time that South
Africa has participated in TIMSS since 1995. In addition to the
learner assessment data, the study also collected contextual
information from learners, teachers and school principals, making
it possible to explore the factors that are related to Grade 9
mathematics and science achievement. This report was written to
provide some perspective about how the results of international
assessments can be used to provide meaningful national insights.
Sections of the report bring together the main findings based on
descriptive, inferential and psychometric analysis of the data.
The report concludes with recommendations of how the results
relate to policy and practice for improving educational quality.
www.timss-sa.org.za
Understanding mathematics and science achievement amongst Grade 9 learners in South Africa
Related Documents