1 SCIENTIFIC REPORTS | 6:28160 | DOI: 10.1038/srep28160 www.nature.com/scientificreports Time-varying land subsidence detected by radar altimetry: California, Taiwan and north China Cheinway Hwang 1 , Yuande Yang 2 , Ricky Kao 1 , Jiancheng Han 1 , C. K. Shum 3,4 , Devin L. Galloway 5 , Michelle Sneed 6 , Wei-Chia Hung 7 , Yung-Sheng Cheng 1 & Fei Li 2 Contemporary applications of radar altimetry include sea-level rise, ocean circulation, marine gravity, and icesheet elevation change. Unlike InSAR and GNSS, which are widely used to map surface deformation, altimetry is neither reliant on highly temporally-correlated ground features nor as limited by the available spatial coverage, and can provide long-term temporal subsidence monitoring capability. Here we use multi-mission radar altimetry with an approximately 23 year data-span to quantify land subsidence in cropland areas. Subsidence rates from TOPEX/POSEIDON, JASON-1, ENVISAT, and JASON-2 during 1992–2015 show time-varying trends with respect to displacement over time in California’s San Joaquin Valley and central Taiwan, possibly related to changes in land use, climatic conditions (drought) and regulatory measures affecting groundwater use. Near Hanford, California, subsidence rates reach 18 cm yr −1 with a cumulative subsidence of 206 cm, which potentially could adversely affect operations of the planned California High-Speed Rail. The maximum subsidence rate in central Taiwan is 8 cm yr −1 . Radar altimetry also reveals time-varying subsidence in the North China Plain consistent with the declines of groundwater storage and existing water infrastructure detected by the Gravity Recovery And Climate Experiment (GRACE) satellites, with rates reaching 20 cm yr −1 and cumulative subsidence as much as 155 cm. Land subsidence is caused by natural and/or anthropogenic processes including subsurface fluid extraction, underground mining, drainage of organic soils, sediment compaction/load in coastal regions, and permafrost degradation 1,2 . Globally, in regions with irrigated agriculture and rapid population growth, groundwater extrac- tion typically is the principal cause of subsidence 1,3,4 . Subsidence is a hazard that increases flood risk, causes damages to man-made structures and cultural heritages in low-lying regions, exacerbates sea level rise in coastal regions, and results in significant socio-economic distress 1,5 . Standard tools for monitoring subsidence are preci- sion leveling, Global Navigation Satellite System (GNSS), interferometric synthetic aperture radar (InSAR) and borehole extensometers 1,4,6 . Satellite gravimetry from the Gravity Recovery And Climate Experiment (GRACE 7 ) can deduce groundwater mass changes at a coarse spatial resolution (350 km or greater). Currently, a large per- centage of lands including croplands is threatened by subsidence, erosion and desertification which are affecting global food safety 8 . By 2050, an estimated two billion more people will need to be fed, increasing demand on agricultural land use for improved rates of food production 9 . For irrigated croplands dependent solely on ground- water or on the conjunctive use of surface water and groundwater, high rates of groundwater extraction can lead to unsustainable cropland practices owing to groundwater depletion. ese practices can result in undesirable effects including irreversible aquifer-system compaction and land subsidence in susceptible aquifer systems, which can be exacerbated during droughts 1,2,10 . is study explores the use of satellite radar altimetry for improved monitoring of subsidence in three irri- gated cropland areas: California’s San Joaquin Valley (SJV), central Taiwan (CT), and the North China Plain 1 Department of Civil Engineering, National Chiao Tung University, 1001 Ta Hsueh Road, Hsinchu, Taiwan. 2 Chinese Antarctic Center of Surveying and Mapping, Wuhan University, 129 Luoyu Road, Wuhan 430079, China. 3 State Key Laboratory of Geodesy and Earth Dynamics, Institute of Geodesy & Geophysics, Chinese Academy of Sciences, Wuhan 43077, China. 4 Division of Geodetic Science, School of Earth Sciences, the Ohio State University, Columbus, OH 43210, USA. 5 U.S. Geological Survey, 5957 Lakeside Blvd, Indianapolis, IN 46278, USA. 6 U.S. Geological Survey, 6000 J Street, Placer Hall, Sacramento, CA 95819, USA. 7 Green Environmental Engineering Consultant Co. LTD, Hsinchu, Taiwan. Correspondence and requests for materials should be addressed to C.H. (email: cheinway@mail. nctu.edu.tw) Received: 04 November 2015 Accepted: 31 May 2016 Published: 21 June 2016 OPEN

Welcome message from author
This document is posted to help you gain knowledge. Please leave a comment to let me know what you think about it! Share it to your friends and learn new things together.
Transcript
1Scientific RepoRts | 6:28160 | DOI: 10.1038/srep28160
www.nature.com/scientificreports
Time-varying land subsidence detected by radar altimetry: California, Taiwan and north ChinaCheinway Hwang1, Yuande Yang2, Ricky Kao1, Jiancheng Han1, C. K. Shum3,4, Devin L. Galloway5, Michelle Sneed6, Wei-Chia Hung7, Yung-Sheng Cheng1 & Fei Li2
Contemporary applications of radar altimetry include sea-level rise, ocean circulation, marine gravity, and icesheet elevation change. Unlike InSAR and GNSS, which are widely used to map surface deformation, altimetry is neither reliant on highly temporally-correlated ground features nor as limited by the available spatial coverage, and can provide long-term temporal subsidence monitoring capability. Here we use multi-mission radar altimetry with an approximately 23 year data-span to quantify land subsidence in cropland areas. Subsidence rates from TOPEX/POSEIDON, JASON-1, ENVISAT, and JASON-2 during 1992–2015 show time-varying trends with respect to displacement over time in California’s San Joaquin Valley and central Taiwan, possibly related to changes in land use, climatic conditions (drought) and regulatory measures affecting groundwater use. Near Hanford, California, subsidence rates reach 18 cm yr−1 with a cumulative subsidence of 206 cm, which potentially could adversely affect operations of the planned California High-Speed Rail. The maximum subsidence rate in central Taiwan is 8 cm yr−1. Radar altimetry also reveals time-varying subsidence in the North China Plain consistent with the declines of groundwater storage and existing water infrastructure detected by the Gravity Recovery And Climate Experiment (GRACE) satellites, with rates reaching 20 cm yr−1 and cumulative subsidence as much as 155 cm.
Land subsidence is caused by natural and/or anthropogenic processes including subsurface fluid extraction, underground mining, drainage of organic soils, sediment compaction/load in coastal regions, and permafrost degradation1,2. Globally, in regions with irrigated agriculture and rapid population growth, groundwater extrac-tion typically is the principal cause of subsidence1,3,4. Subsidence is a hazard that increases flood risk, causes damages to man-made structures and cultural heritages in low-lying regions, exacerbates sea level rise in coastal regions, and results in significant socio-economic distress1,5. Standard tools for monitoring subsidence are preci-sion leveling, Global Navigation Satellite System (GNSS), interferometric synthetic aperture radar (InSAR) and borehole extensometers1,4,6. Satellite gravimetry from the Gravity Recovery And Climate Experiment (GRACE7) can deduce groundwater mass changes at a coarse spatial resolution (350 km or greater). Currently, a large per-centage of lands including croplands is threatened by subsidence, erosion and desertification which are affecting global food safety8. By 2050, an estimated two billion more people will need to be fed, increasing demand on agricultural land use for improved rates of food production9. For irrigated croplands dependent solely on ground-water or on the conjunctive use of surface water and groundwater, high rates of groundwater extraction can lead to unsustainable cropland practices owing to groundwater depletion. These practices can result in undesirable effects including irreversible aquifer-system compaction and land subsidence in susceptible aquifer systems, which can be exacerbated during droughts1,2,10.
This study explores the use of satellite radar altimetry for improved monitoring of subsidence in three irri-gated cropland areas: California’s San Joaquin Valley (SJV), central Taiwan (CT), and the North China Plain
1Department of Civil Engineering, National Chiao Tung University, 1001 Ta Hsueh Road, Hsinchu, Taiwan. 2Chinese Antarctic Center of Surveying and Mapping, Wuhan University, 129 Luoyu Road, Wuhan 430079, China. 3State Key Laboratory of Geodesy and Earth Dynamics, Institute of Geodesy & Geophysics, Chinese Academy of Sciences, Wuhan 43077, China. 4Division of Geodetic Science, School of Earth Sciences, the Ohio State University, Columbus, OH 43210, USA. 5U.S. Geological Survey, 5957 Lakeside Blvd, Indianapolis, IN 46278, USA. 6U.S. Geological Survey, 6000 J Street, Placer Hall, Sacramento, CA 95819, USA. 7Green Environmental Engineering Consultant Co. LTD, Hsinchu, Taiwan. Correspondence and requests for materials should be addressed to C.H. (email: [email protected])
Received: 04 November 2015
accepted: 31 May 2016
Published: 21 June 2016
OPEN
www.nature.com/scientificreports/
2Scientific RepoRts | 6:28160 | DOI: 10.1038/srep28160
(NCP). The three croplands areas are affected by historical and ongoing subsidence3,11–16, where groundwater extraction is the leading cause of subsidence2,6,12,16, and recent droughts have exacerbated groundwater depletion and its consequences in the SJV and the NCP13,17. Subsidence poses risks to existing high speed railways in CT, the NCP, and one under construction in the SJV4. Subsidence patterns and rates in much of the NCP, SJV and CT have been extensively studied using precision leveling, extensometry, InSAR, and GNSS4,6,14,15,18.
A synthesis of vertical displacement rates (VDRs) measured at 1,499 GNSS stations (Table S1 and Fig. S1, Sec. S1, Supplementary Information [SI]) between 1993 and 2015 across the Central Valley (including the SJV and the southern portion of the Sacramento Valley), California, show that the distribution of the GNSS sites within the valley are too sparse by themselves to map areal subsidence in adequate spatial detail (Fig. 1). Three coalescing subsidence bowls are evident: a southern bowl south of Bakersfield corresponding to the Arvin-Maricopa histor-ical subsidence bowl19, a central bowl between Bakersfield and Fresno roughly centered on the Tulare-Hanford area and roughly corresponding to the Tulare-Wasco historical subsidence bowl19, and a northern bowl north of Fresno roughly centered on the Madera-Mendota area near the Delta-Mendota Canal15, which is located along the western edge of the San Joaquin Valley (Fig. 1). In general, the GNSS-derived subsidence rates are relatively large in the Tulare-Hanford area (maximum: 9.8 cm yr−1), and the rates decay southward and northward in the SJV to near zero. In the mountainous regions surrounding the Central Valley, the VDRs are largely positive, sug-gesting uplifts possibly caused by tectonics and reduced mass loading due to the current drought in California20. The mean subsidence rate in the central subsidence bowl (from Bakersfield to Fresno) is 2.86 cm yr−1, compared with 0.62 cm yr−1 in the northern subsidence bowl and smaller mean rates in the Sacramento Valley. Note that a negative vertical displacement rate determined in this paper (in all relevant figures and tables) corresponds to a positive subsidence rate. To emphasize land subsidence in this paper, we replace negative displacement rates by subsidence rates in all descriptions.
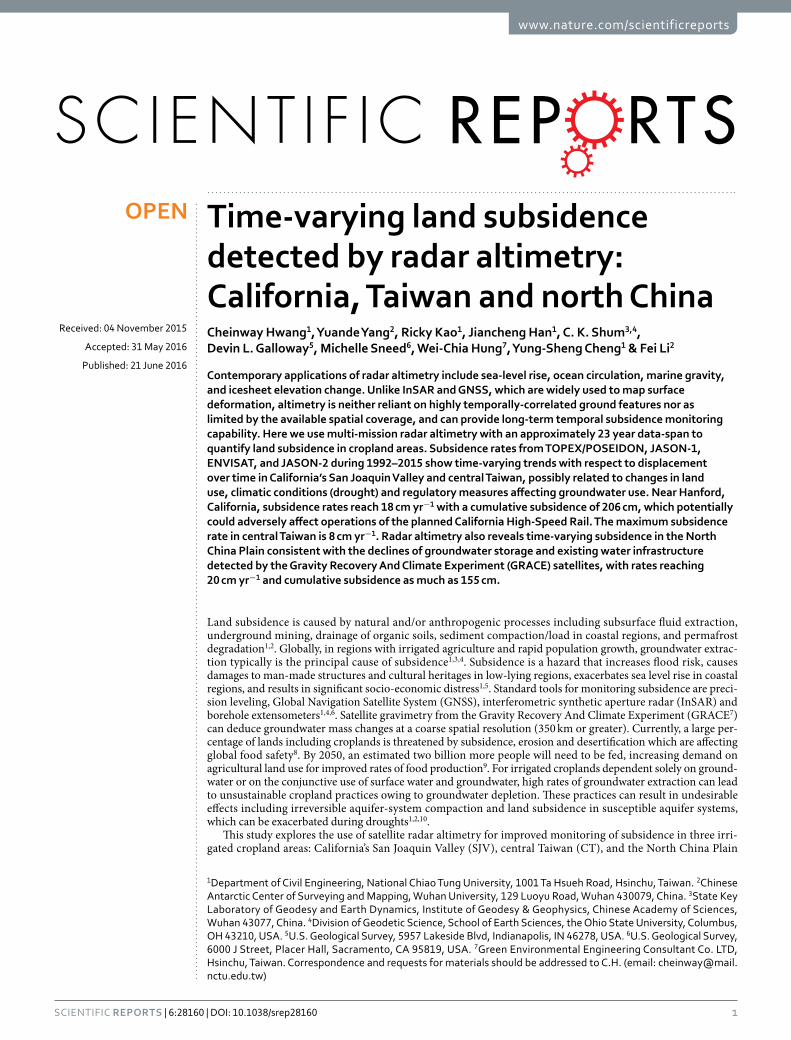
Mean subsidence rates during 2002–14 in CT derived from annual precision leveling ranged from zero to about 8 cm yr−1 (Fig. 2a, Sec. S2, SI). Despite its high accuracy, precision leveling can be costly4 and generally is not repeated frequently enough to resolve inter-annual and annual signals. About 310,000 pumping wells in Changhua and Yunlin Counties pump groundwater to meet agricultural and industrial water demands (Fig. 2b). Two major coalescing subsidence bowls are evident—on either side of the Zhuoshui River, and subsidence rates as much as 7 cm yr−1 threaten the operation of the Taiwan High Speed Rail4 (THSR; Fig. 2a) and sustainable development in the region. For example, the prevalence of fine-grained sediments here makes this area more
Figure 1. GNSS (green points)-derived vertical displacement rates (negative of subsidence rates) in the Central Valley (includes the San Joaquin and southern portion of the Sacramento Valleys inside the boundary in purple), California, (Sec. S1, SI). The planned California High-Speed Rail (CHSR) is red alternating with white line. GMT36 V5.1.3 is used to plot Fig. 1 (http://gmt.soest.hawaii.edu/). Overlapped are TOPEX/POSEIDON (red line) and ENVISAT (orange line) satellite ground tracks (labeled as satellite abbreviation-pass number), where vertical displacement rates at a 1-km interval are derived from the two altimeters (see Fig. 3). The topography is from the digital elevation model of SRTM15_PLUS37.

www.nature.com/scientificreports/
3Scientific RepoRts | 6:28160 | DOI: 10.1038/srep28160
susceptible to compaction. Though pumping-well distribution is even, subsidence rates are not, suggesting a significant spatial variation of hydrogeological properties6.
The NCP has a population of 437 million and an area of 300,000 km2, and is one of many regions in China with critical subsidence problems16,21. In the NCP, groundwater provides more than 60% of fresh water supplies22 and is the main water source for agricultural irrigation23. Near Tianjin, the mean subsidence rates range from 0.80 to 5.60 cm yr−1, with a maximum rate of 16 cm yr−1 and cumulative subsidence of 3.90 m during 1965–8518,24. The GRACE satellite gravimetry data have detected mass losses that are attributed to severe groundwater storage declines in the SJV and NCP13,22.
In this paper, we explore satellite altimetry as a new remote-sensing subsidence-mapping method and demon-strate its utility in cropland areas where the differential and persistent scatterer (PS)-based InSAR methods are limited by sparse temporally-coherent, stable radar reflectors3; however, improvements in identifying PS scatterers over agricultural regions have been reported25,26. We also demonstrate the temporal and along-track spatial detail of the radar altimetry method compared to GNSS (Fig. S1) and leveling (Fig. S2) which can be cost prohibitive to map subsidence in similar temporal and spatial detail. Satellite altimetry has been principally used to derive marine
Figure 2. (a) Vertical displacement rates, from precision leveling in central Taiwan (Section S2, SI), (b) Distribution of about 310,000 groundwater pumping wells is in the same 2,364 km2 area as Fig. 2a. Overlapped are TOPEX/POSEIDON and ENVISAT satellite ground tracks (labeled as satellite abbreviation-pass number), where vertical displacement rates at a 1-km interval are derived from the two altimeters (see Fig. 3).
www.nature.com/scientificreports/
4Scientific RepoRts | 6:28160 | DOI: 10.1038/srep28160
gravity/bathymetry, and to study ocean circulations, sea level rise, ice sheet elevation and water level changes27–29. Because only a few studies have used satellite altimetry to measure solid earth deformation and a standard numerical procedure to measure vertical displacement has not yet been established, there are concerns about the accuracies of altimeter-derived rates30,31. However, this study shows that, accurate VDRs at the sub-cm yr−1 level can be achieved using satellite altimetry by using more than two decades of near-continuous land surface elevation measurements from the improved coverage offered from multi-mission altimeter data with 10-day or monthly sampling: TOPEX/POSEIDON (TP, 1992–2002), JASON-1 (J1, 2002–09), JASON-2 (J2, 2008–present), and ENVISAT (EN, 2002–10). TP, J1 and J2 have the same repeated ground tracks.
ResultsSubsidence rates derived from satellite radar altimetry (TP and EN) agree well with rates determined from precision leveling in CT and GNSS in the southern SJV (Fig. 3). Height changes derived from different radar altimetry mis-sions also agree well. For example, in the SJV at the crossover of TP-043 and EN-684 (Fig. 3a), the time-series height changes derived from J1 (the follow-on mission for TP) and EN (Fig. S6, 2002–10) and the resulting subsidence rates (about 6 cm yr−1) show good agreement. Three major subsiding bowls identified in the SJV from the GNSS measurements (Fig. 1) are reflected in the TP and EN along-track subsidence profiles. Along TP-043, the largest altimeter-derived subsidence rate near Hanford (A2, Fig. 3a) in the central subsidence bowl is about 10 cm yr−1, and consistent with the GNSS-derived rates (Table S1). At GNSS stations P056 and P566, subsidence rates are <4 cm yr−1 and agree with the altimeter-derived rates to 1 cm yr−1. The largest subsidence rate from EN is ~13 cm yr−1 along EN-611 (A1, Fig. 3b). In CT, the two principal subsidence bowls identified by leveling (Fig. 2a) are reflected in the TP and EN along-track subsidence profiles, and the patterns and rates are consistent with those from leveling (Fig. 3d–f).
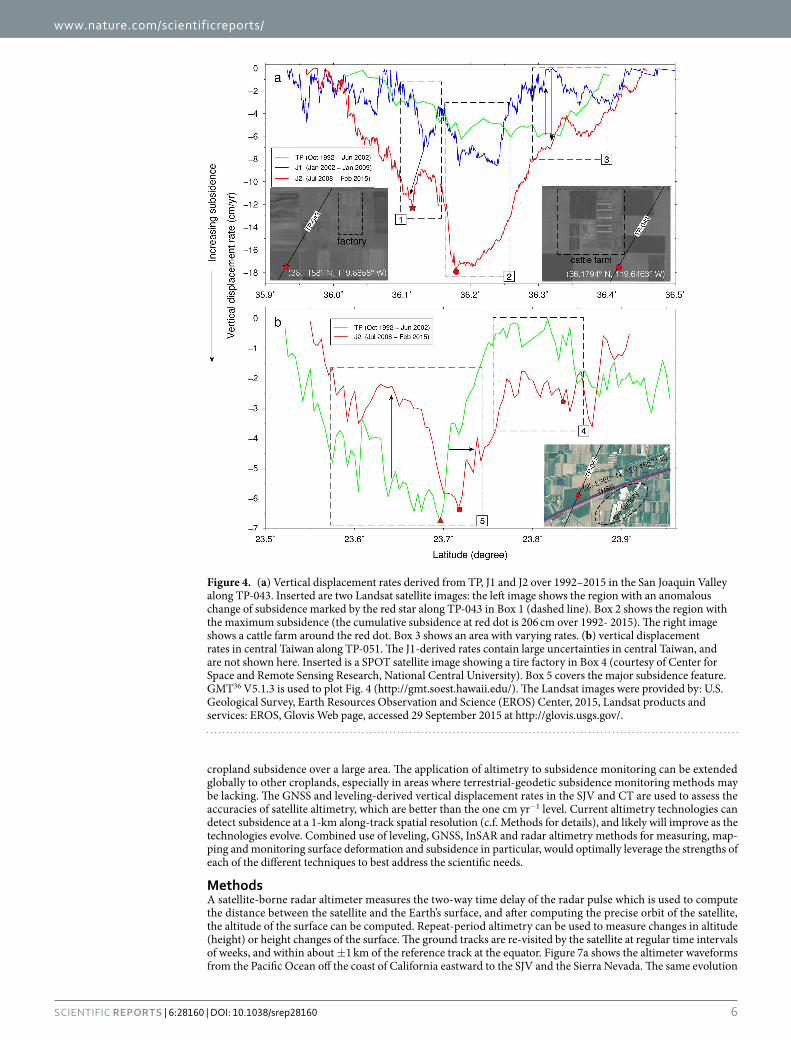
Subsidence patterns in the SJV and CT are time-varying and could be influenced by changing groundwater use related to land-use, climatic and regulatory factors. Figure 4 shows patterns in the VDRs along profiles near Hanford in the SJV and in Tuku Township, CT (Fig. S7, Sec. S4, SI). In Box 1 (Fig. 4a), the VDRs derived from TP, J1 and J2 for the SJV show a consistent pattern from J1 and J2: a steep drop (increased subsidence rate) followed by a bump (decreased subsidence rate) in the profile. The drop in Box 1 reaches its lowest point (maximum subsidence rate) at 36.1158° N, 119.6858° W (red star, Fig. 4a). In Box 2 (Fig. 4a), the subsidence extent is expanding and the rates are accelerating during the period covered by the altimetry. At the location of maxium subsidence (Fig. 5), the VDR during Oct 1992–Jul 2002 is 6 cm yr−1, increasing to 8 cm yr−1 during Jan 2002–Jan 2009, and to 18 cm yr−1 during Jul 2008–Feb 2015. The increased groundwater pumping owing to the recent ongoing drought in California may partially contribute to the increased rate from J2. The subsidence rates in the SJV are time-varying: in Box 3 (Fig. 4a), initially the rates are about 6 cm yr−1 (TP), decrease to 3 cm yr−1 (J1), and increase to 7 cm yr−1 (J2).
The rates in CT also vary with time and space. In Box 4 (Fig. 4b), the subsidence rates increased in recent years. In Box 5 (Fig. 4b), between 23.60°N and 23.75°N, the changes in the subsidence rates from TP to J2 show the extent of subsidence shrinks (from green lines to red lines) in recent years. The location of maximum subsid-ence shifts northward to about 23.72°N and the extent of subsidence increases northward from 23.71 to 23.85°N. The shifts in patterns likely are due to measures restricting groundwater use along a section of THSR near the point of maximum subsidence (Figs S7 and S8).
Land subsidence can cause angular deflection (AD) of the THSR owing to vertical displacements of the indi-vidual structural support columns of the elevated railway. A large AD could weaken the foundational support of the railway and result in serious operational problems if not adequately mitigated4. Along the THSR section in Yunlin County (Fig. 2a), heavy groundwater pumping and heterogeneity of sediments with varying degrees of compressibility have led to large ADs, which once approached the 1/1000 limit set by the safety code. TP-051 is nearly parallel to THSR near Tuku (see Fig. S7) and altimetry data have already provided valuable observations to monitor ADs here. The planned California High-Speed Rail (CHSR) now faces the same potential risk of large ADs as the TSHR does: it passes through a region that has been experiencing subsidence due to heavy groundwa-ter depletion. As it happens, EN-684 and TP-043 are perpendicular to the planned route of CHSR near Hanford and the observations from EN and TP follow-on missions can provide an effective means to monitor the subsid-ence as well as the ADs in the future.
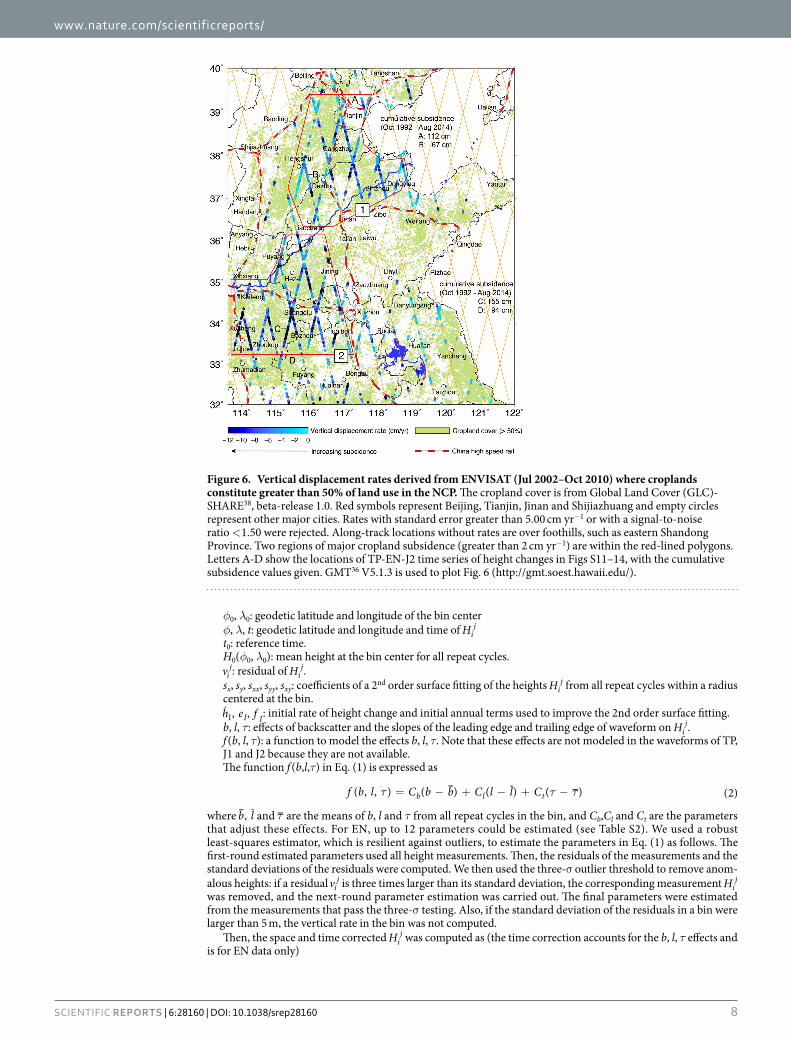
EN identifies two regions of major cropland subsidence in the NCP (Fig. 6, also Figs S9–12): Region 1 covers eastern Hebei Province and northern Shandong Province, with an affected area of 67,900 km2; Region 2 covers eastern Henan Province and northern Anhui Province, with an affected area of 78,000 km2. In the foothills of the NCP, VDRs derived from EN and TP, and J2 are indeterminate because the altimetry waveforms are corrupted (see Waveform E, Fig. 7). The J1 rates contain large uncertainties in much of the NCP and are not shown here. TP and J2 detect time-varying subsidence elsewhere in the NCP (Fig. 8). For example, in Boxes 1 and 2 (Fig. 8), located in the Hebei and Anhui provinces, the along-track rates increased dramatically from the time of TP to the time of J2. In Box 3 (Fig. 8), near Tianjin, the J2 subsidence rates are less than those from TP, suggesting that groundwater extraction was reduced here due to measures implemented to control subsidence since the start of high-speed rail operations (Fig. S9). In Box 4 (Fig. 8), many VDRs were derived from TP, but only a few from J2. This is attributed to urbanization around this region, where new man-made structures (at the time of J2) con-taminated altimeter waveforms and degraded ranging accuracies (see Waveform D, Fig. 7). The altimeter results identify many subsidence-affected areas and changing subsidence patterns in the NCP that are consistent with the temporal and spatial groundwater storage changes detected by GRACE22. The results can be used as guides for future, more detailed, precise geodetic and geotechnical measurements.
DiscussionThe causes for subsidence are complicated and not well understood in the study regions (SJV, CT and NCP). Groundwater abstraction may be a major contributing source for land subsidence. Near the point with the larg-est subsidence in SJV, operations in factory and cattle farms, such as those shown in Box 1 and 2 in Fig. 4a, may

www.nature.com/scientificreports/
5Scientific RepoRts | 6:28160 | DOI: 10.1038/srep28160
contribute partially to the steep subsidence observed along the profiles through abstraction of large amounts of groundwater. Along the THSR in CT, heavy groundwater extraction from surrounding factories, such as a tire factory (Fig. 4b), may be responsible for land subsidence. However, more studies are needed to investigate the roles of the farms and factories on the land subsidence detected in this paper.
Long-term, time-varying land subsidence over croplands from 1992 to present has been determined by TP, J1, J2 and EN altimeters using a dedicated processing method for land altimeter data. The result in the NCP suggests that a mission with a long repeat period and relatively small cross-track spacing (< 50 km) like EN can measure
Figure 3. (a) Along-track subsidence rates from TP and EN in the San Joaquin Valley, (b) comparison between altimeter-derived rates and GNSS-derived rates in the San Joaquin Valley. A1 is the location of maximum subsidence from EN-611, A2 is the location of maximum subsidence from TP-043 and where accelerating subsidence is detected by TP, J1 and J2 over 1992–2015, (c) along-track subsidence rates in central Taiwan, (d–f) comparison with leveling-derived rates along TP-051, TP-164 and EN-993. C1 is the location of maximum subsidence in central Taiwan (see Fig. 2a), C2 and C3 are the centers of the bow-shaped subsidence patterns detected by TP-164 and EN-993. Note: negative vertical displacement corresponds to subsidence. GMT36 V5.1.3 is used to plot Fig. 3 (http://gmt.soest.hawaii.edu/). The topography is from the digital elevation model of SRTM15_PLUS37.
www.nature.com/scientificreports/
6Scientific RepoRts | 6:28160 | DOI: 10.1038/srep28160
cropland subsidence over a large area. The application of altimetry to subsidence monitoring can be extended globally to other croplands, especially in areas where terrestrial-geodetic subsidence monitoring methods may be lacking. The GNSS and leveling-derived vertical displacement rates in the SJV and CT are used to assess the accuracies of satellite altimetry, which are better than the one cm yr−1 level. Current altimetry technologies can detect subsidence at a 1-km along-track spatial resolution (c.f. Methods for details), and likely will improve as the technologies evolve. Combined use of leveling, GNSS, InSAR and radar altimetry methods for measuring, map-ping and monitoring surface deformation and subsidence in particular, would optimally leverage the strengths of each of the different techniques to best address the scientific needs.
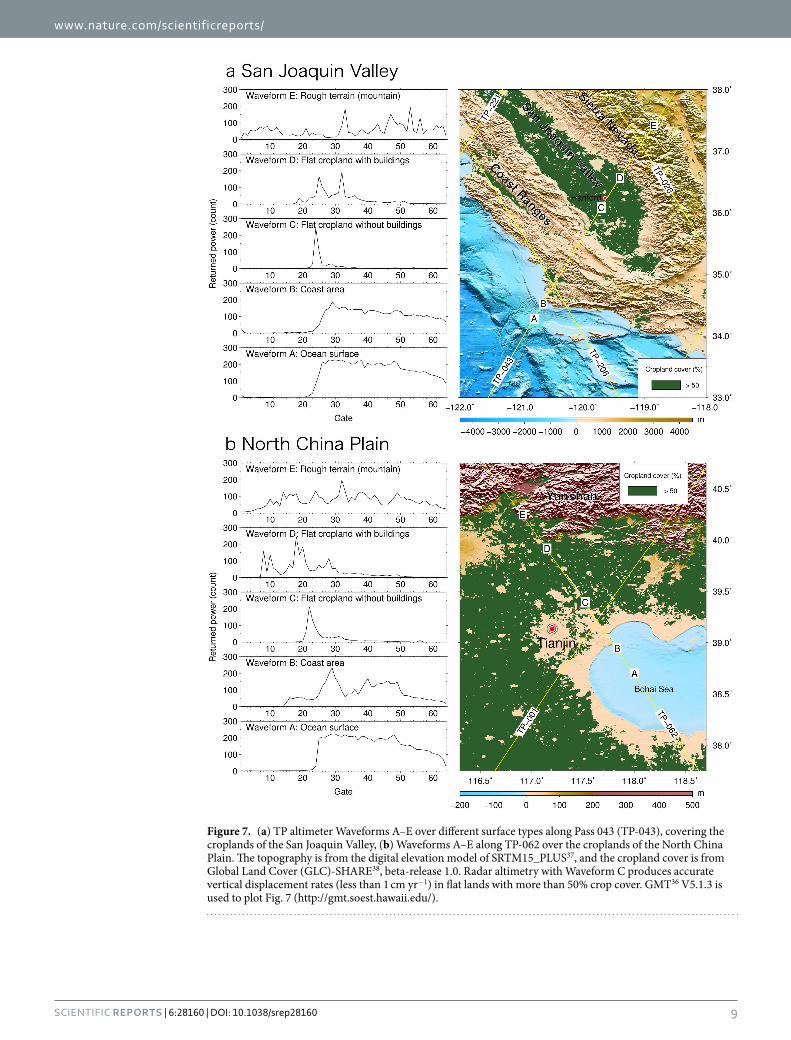
MethodsA satellite-borne radar altimeter measures the two-way time delay of the radar pulse which is used to compute the distance between the satellite and the Earth’s surface, and after computing the precise orbit of the satellite, the altitude of the surface can be computed. Repeat-period altimetry can be used to measure changes in altitude (height) or height changes of the surface. The ground tracks are re-visited by the satellite at regular time intervals of weeks, and within about ± 1 km of the reference track at the equator. Figure 7a shows the altimeter waveforms from the Pacific Ocean off the coast of California eastward to the SJV and the Sierra Nevada. The same evolution
Figure 4. (a) Vertical displacement rates derived from TP, J1 and J2 over 1992–2015 in the San Joaquin Valley along TP-043. Inserted are two Landsat satellite images: the left image shows the region with an anomalous change of subsidence marked by the red star along TP-043 in Box 1 (dashed line). Box 2 shows the region with the maximum subsidence (the cumulative subsidence at red dot is 206 cm over 1992- 2015). The right image shows a cattle farm around the red dot. Box 3 shows an area with varying rates. (b) vertical displacement rates in central Taiwan along TP-051. The J1-derived rates contain large uncertainties in central Taiwan, and are not shown here. Inserted is a SPOT satellite image showing a tire factory in Box 4 (courtesy of Center for Space and Remote Sensing Research, National Central University). Box 5 covers the major subsidence feature. GMT36 V5.1.3 is used to plot Fig. 4 (http://gmt.soest.hawaii.edu/). The Landsat images were provided by: U.S. Geological Survey, Earth Resources Observation and Science (EROS) Center, 2015, Landsat products and services: EROS, Glovis Web page, accessed 29 September 2015 at http://glovis.usgs.gov/.

www.nature.com/scientificreports/
7Scientific RepoRts | 6:28160 | DOI: 10.1038/srep28160
of waveforms is also demonstrated for the NCP (Fig. 7b). The Brown waveforms over the ocean (Waveform A, Fig. 7) and coast (Waveform B, Fig. 7) may result in precise range measurements for marine applications, but waveforms on land may be too contaminated to recover precise ranges for detecting height changes.
The waveform over flat terrain with crops (Waveform C, Fig. 7) or with snowpack, e.g., land regions near Hudson Bay, Canada29–31 can be retracked to yield a precise range change, after correcting surface gradients using the collinear track analysis. The surface roughness of croplands diffuses radar pulses, similar to wind-induced, small-scale waves in oceans. The surface of a fallow, flat and building-free cropland is similar to a calm lake surface—the altimeter waveform is specular with a steep leading edge compared to other types of waveform. In summer, the cropland surface roughens as crops grow, resulting in a waveform with a less steep leading edge. Similar to a significant wave height at sea, terrain undulation creates a ranging bias and modulates the footprint size of a pulse-limited radar. For example, a terrain undulation of 1 m at a length scale of several km leads to a pulse-limited footprint radius of about 1 km for EN and slightly larger for the TP series altimeters28,29 (pulse width = 3.125 ns). However, unlike significant wave height at sea, terrain undulation at a given location can remain constant for the satellite mission period, and the undulation-induced ranging bias will be eliminated when heights from repeat cycles are differenced.
Here we adopted a modified, enhanced version of the repeat-track method32–34 for the space and time reduc-tion of raw height measurements from TP, J1, J2 and EN. For EN, we also estimated parameters that account for the effects of backscatter and the slopes of the leading and trailing edges32,35. For all missions, we chose to compute VDRs for bins spaced at about 1 km along satellite ground tracks. A bin is a circular region with a given radius, centered at a location along the mean ground track of all repeat cycles in a satellite mission. Over a flat cropland with a moderate undulation of about 1 m, the radius of an altimeter footprint is about 1 km. Within a given bin, all the raw height measurements (the sampling rate is 18 Hz for EN, and 10 Hz for TP, J1 and J2) from the repeat cycles were least-squares fitted to the following space and time function3:
φ λ φ λ φ φ λ λ φ φ
λ λ φ φ λ λ
τ πω
πω
+ = + − + − + −
+ − + − −
+ + − + − +
−
H t v H s s s
s s
f b l h t t e cos t t f
sin t t
( , , ) ( , ) ( ) ( ) ( )
( ) ( )( )
( , , ) ( ) [2 ( )]
[2 ( )] (1)
ij
ij
x y xx
yy xy
0 0 0 0 0 02
02
0 0
I 0 I 0 I
0
whereHi
j: height from altimeter, with range correction from the subwaveform threshold retracker (see below).j: repeat cycle.i: the i th measurement from repeat cycle j in the bin.
Figure 5. Height changes at the location of the maximum subsidence measured (in this study) in the San Joaquin Valley near Hanford, California along TP-043 (red dot in Box 2, Fig. 3a) from (a) the original heights and (b) the shifted heights.
www.nature.com/scientificreports/
8Scientific RepoRts | 6:28160 | DOI: 10.1038/srep28160
φ0, λ0: geodetic latitude and longitude of the bin centerφ, λ, t: geodetic latitude and longitude and time of Hi
j
t0: reference time.H0(φ0, λ0): mean height at the bin center for all repeat cycles.vi
j: residual of Hij.
sx, sy, sxx, syy, sxy: coefficients of a 2nd order surface fitting of the heights Hij from all repeat cycles within a radius
centered at the bin.h e f, ,I II : initial rate of height change and initial annual terms used to improve the 2nd order surface fitting.b, l, τ: effects of backscatter and the slopes of the leading edge and trailing edge of waveform on Hi
j. f (b, l, τ): a function to model the effects b, l, τ. Note that these effects are not modeled in the waveforms of TP, J1 and J2 because they are not available.The function f (b,l,τ) in Eq. (1) is expressed as
τ τ τ= − + − + −f b l C b b C l l C( , , ) ( ) ( ) ( ) (2)b l t
where b l, and τ are the means of b, l and τ from all repeat cycles in the bin, and Cb,Cl and Ct are the parameters that adjust these effects. For EN, up to 12 parameters could be estimated (see Table S2). We used a robust least-squares estimator, which is resilient against outliers, to estimate the parameters in Eq. (1) as follows. The first-round estimated parameters used all height measurements. Then, the residuals of the measurements and the standard deviations of the residuals were computed. We then used the three-σ outlier threshold to remove anom-alous heights: if a residual vi
j is three times larger than its standard deviation, the corresponding measurement Hij
was removed, and the next-round parameter estimation was carried out. The final parameters were estimated from the measurements that pass the three-σ testing. Also, if the standard deviation of the residuals in a bin were larger than 5 m, the vertical rate in the bin was not computed.
Then, the space and time corrected Hij was computed as (the time correction accounts for the b, l, τ effects and
is for EN data only)
Figure 6. Vertical displacement rates derived from ENVISAT (Jul 2002–Oct 2010) where croplands constitute greater than 50% of land use in the NCP. The cropland cover is from Global Land Cover (GLC)-SHARE38, beta-release 1.0. Red symbols represent Beijing, Tianjin, Jinan and Shijiazhuang and empty circles represent other major cities. Rates with standard error greater than 5.00 cm yr−1 or with a signal-to-noise ratio < 1.50 were rejected. Along-track locations without rates are over foothills, such as eastern Shandong Province. Two regions of major cropland subsidence (greater than 2 cm yr−1) are within the red-lined polygons. Letters A-D show the locations of TP-EN-J2 time series of height changes in Figs S11–14, with the cumulative subsidence values given. GMT36 V5.1.3 is used to plot Fig. 6 (http://gmt.soest.hawaii.edu/).
www.nature.com/scientificreports/
9Scientific RepoRts | 6:28160 | DOI: 10.1038/srep28160
Figure 7. (a) TP altimeter Waveforms A–E over different surface types along Pass 043 (TP-043), covering the croplands of the San Joaquin Valley, (b) Waveforms A–E along TP-062 over the croplands of the North China Plain. The topography is from the digital elevation model of SRTM15_PLUS37, and the cropland cover is from Global Land Cover (GLC)-SHARE38, beta-release 1.0. Radar altimetry with Waveform C produces accurate vertical displacement rates (less than 1 cm yr−1) in flat lands with more than 50% crop cover. GMT36 V5.1.3 is used to plot Fig. 7 (http://gmt.soest.hawaii.edu/).

www.nature.com/scientificreports/
1 0Scientific RepoRts | 6:28160 | DOI: 10.1038/srep28160
φ λ φ λ τ= − … −H t H t T s s f b l( , , ) ( , , ) ( , , ) ( , , ) (3)ij
ij
x xy0 0
where T is the sum of terms 2–6 in Eq. (1) and φ λH t( , , )ij
0 0 is regarded as a corrected height at the bin center at time t. For a given cycle j, we used the three-σ threshold to remove anomalous values φ λH t( , , )i
j0 0 in the bin, and
then compute the representative height for cycle j:
∑φ λ φ λ==
ˆH tn
H t( , , ) 1 ( , , )(4)
j
i
n
ij
0 01
0 0
where Hij is an acceptable height measurement and n is the number of such measurements. With H j computed for
all repeat cycles in the given bin (the mean position is at φ0, λ0), a time series of height was formed and least-squares fitted to the function
πω πω= + − + − + − + − H t H h t t h t t e t t f t t( ) ( ) ( ) cos [2 ( )] sin [2 ( )] (5)j
0 0 02
0 0
where H h h, ,0 are the mean, VDR and vertical acceleration, and e and f account for the seasonal variation of height. Again, we used the robust least-squares estimator to determine the parameters in Eq. (5). Note that the terms h e f, ,I II in Eq. (1) are just the initial estimates for VDR and annual variations; the final VDR is h and the amplitudes of the annual variations are e and f. In Sec. S3 of Supplementary Information (SI), we selected an opti-mal waveform retracker to recover precise ranges from TP, J1, J2 and EN from waveforms like Waveform C in Fig. 7 for the SJV and NCP. Note that backscatter effects are not considered for TP, J1 and J2 in this study because of a lack of the necessary data.
The repeat-track method also diminishes the anisotropy roughness effect due to non-circular radar polari-zation, which causes different radar echoes for descending and ascending passes for the EN altimeter system. In fact, such height measurements do not repeat the exact same locations (maximum lateral offset: 1 km) and the measurements are affected by a number of time-varying factors. As a summary, the following conditions should be met to obtain precise heights on land: (a) sufficiently flat terrain within the altimeter footprint that may be cov-ered with short vegetation, such as crops, (b) low percentage of buildings in the footprint area, (c) use of a proper waveform retracker, and (d) proper accounting of radar backscatter effects using an empirical threshold value. Parts of the croplands in the SJV, CT and the NCP meet conditions (a,b). If the proportion of cropland within a “bin” of selected and processed data is greater than 50%, the accuracy of the resulting altimeter-derived VDR is generally better than 1 cm yr−1 (at 1-km resolution), based on the assessments using leveling data (CT, Table S3) and crossover differences (CT and NCP, Table S4).
Typically, there will be inter-mission altimeter range biases between two altimeter missions, and such biases depend on surface attributes (ocean, land, ice and river, etc). The combination of inter-mission altimeter bias
Figure 8. Vertical displacement rates in the croplands of the North China Plain from (a) TP (Aug 1992 – Jun 2002) and (b) J2 (Jun 2008 – Aug 2014). The cropland cover (shaded areas) is from Global Land Cover (GLC)-SHARE38, beta-release 1.0. GMT36 V5.1.3 (http://gmt.soest.hawaii.edu/) is used to plot the land cover, ground tracks and all the features.
www.nature.com/scientificreports/
1 1Scientific RepoRts | 6:28160 | DOI: 10.1038/srep28160
and terrain-induced height difference between reference tracks will lead to an apparent discontinuity between the two time series of height changes from two satellite missions at the crossovers of two ground tracks (Fig. S6). Because the VDRs in this study are computed for individual satellites and are the time derivatives of heights, the inter-mission discontinuities will not affect individual rates. In this study, we compute the cumulative subsidence, S, at a given bin from multiple satellite missions, such as TP, J1 and J2, using
= + + S h T h T h T (6)TP TP J J J J1 1 2 2
where h h,TP J1 and hJ2 are the mean rates from TP, J1 and J2, and TTP,TJ1 and TJ2 are the time spans over which rates are computed. For example, at the locations corresponding to Figs 5 and S6, the cumulative subsidence val-ues from Oct 1992 to Feb 2015 are 206 cm and 153 cm, respectively.
Given a height time series (see Figs 5 and S6, S9–S12), both the VDR and its uncertainty (one-standard deviation, at the 68% confidence level) are computed (see Eq. S5), and they can be used to determine the rate’s signal-to-noise ratio for decision making. Because of the influence of height oscillations (the key component is annual oscillation), the uncertainty of a VDR tends to decrease with the length of time series. As such, the altim-etry method in this paper would be more applicable to long-term (longer than one year) subsidence monitoring.
References1. Galloway, D. L. In Encyclopedia of Natural Hazards (ed. Bobrowsky, P. T.) 979–985 (Springer, 2013).2. Galloway, D. L. & Sneed, M. Analysis and simulation of regional subsidence accompanying groundwater abstraction and compaction
of susceptible aquifer systems in the USA. Bol. Soc. Geol. Mex. 65, 123–134 (2013).3. Galloway, D. L. & Burbey, T. J. Review: regional land subsidence accompanying groundwater extraction. Hydrogeol. J. 19, 1459–1486
(2011).4. Hwang, C., Hung, W. C. & Liu, C. H. Results of geodetic and geotechnical monitoring of subsidence for Taiwan High Speed Rail
operation. Nat. Hazards 47, 1–16 (2008).5. Land Subsidence Working Group of the United Nations Educational, Scientific and Cultural Organization (UNESCO), http://
landsubsidence-unesco.org/ (Date of access: 01/06/2015) (2015).6. Hung, W. C. et al. Monitoring severe aquifer-system compaction and land subsidence in Taiwan using multiple sensors: Yunlin, the
southern Choushui River Alluvial Fan. Environ. Earth Sci. 59, 1535–1548 (2010).7. Tapley, B. D., Bettadpur, S., Ries, J. C., Thompson, P. F. & Watkins, M. M. GRACE measurements of mass variability in the Earth
system. Science 305, 503–505 (2004).8. Smith, P. Delivering food security without increasing pressure on land. Glob Food Sec. 2, 18–23 (2013).9. Fritz, S. et al. The need for improved maps of global cropland, EOS 94, 31–32 (2013).
10. Faunt, C. C. Groundwater Availability of the Central Valley Aquifer, California: U.S. Geological Survey Professional Paper 1766. Technical report. Available at: http://pubs.usgs.gov/pp/1766/ (Date of access: 04/06/2015) (2009).
11. Hung, W. C. et al. Surface deformation from persistent scatterers SAR interferometry and fusion with leveling data: A case study over the Choushui River Alluvial Fan, Taiwan. Remote Sens. Environ. 115, 957–967 (2011).
12. Hung, W. C., Hwang, C., Liou, J. C., Lin, Y. S. & Yang, H. L. Modeling aquifer-system compaction and predicting land subsidence in central Taiwan. Engineering Geology 147, 78–90 (2012).
13. Famiglietti, J. S. et al. Satellites measure recent rates of groundwater depletion in California’s Central Valley. Geophy. Res. Lett. 38, L03403 (2011).
14. Sneed, M. & Brandt, J. T. Detection and measurement of land subsidence using Global Positioning System and interferometric synthetic aperture radar, Coachella Valley, California, 1996–2005. Technical report. Available at: http://pubs.usgs.gov/sir/2007/5251/ (Date of access: 04/07/2015) (2013).
15. Sneed, M., Brandt, J. & Solt, M. Land subsidence along the Delta-Mendota Canal in the northern part of the San Joaquin Valley, California, 2003–10. Technical report. Available at: http://pubs.usgs.gov/sir/2013/5142/ (Date of access: 04/07/2015) (2013).
16. Liu, C., Yu, J. & Eloise, K. Groundwater exploitation and its impact on the environment in the North China Plain. Water International 26, 265–272 (2001).
17. Taylor, R. G. et al. Ground water and climate change. Nature Clim. Change 3, 322–329 (2013).18. Xu, Y. S., Shen, S. L., Cai, Z. Y. & Zhou, G. Y. The state of land subsidence and prediction approaches due to groundwater withdrawal
in China. Nat. Hazards 45, 123–135 (2008).19. Ireland, R. L., Poland, J. F. & Riley, F. S. Land subsidence in the San Joaquin Valley, California, as of 1980. Technical report. Available
at: http://www.calwater.ca.gov/Admin_Record/C-040893.pdf (Date of access: 04/06/2015) (1984).20. Amos, C. B. et al. Uplift and seismicity driven by groundwater depletion in central California. Nature 509, 483–486 (2014).21. Xue, Y., Zhang, Y., Ye, S., Wu, J. & Li, Q. Land subsidence in China. Environmental Geology 48, 713–720 (2005).22. Feng, W. et al. Evaluation of groundwater depletion in North China using the Gravity Recovery and Climate Experiment (GRACE)
data and ground-based measurements. Water Resour. Res. 49, 2110–2118 (2013).23. Yang, Y., Yang, Y., Moiwo, J. P. & Hu, Y. Estimation of irrigation requirement for sustainable water resources reallocation in North
China. Agricultural Water Management 97, 1711–1721 (2010).24. Hu, R. L., Yue, Z. Q., Wang, L. C. & Wang, S. J. Review on current status and challenging issues of land subsidence in China.
Engineering Geology 76, 65–77 (2004).25. Chen, J., Zebker, H. A. & Knight, R. A persistent scatterer interpolation for retrieving accurate ground deformation over InSAR-
decorrelated agricultural fields. Geophys. Res. Lett. 42, 9294–9301 (2015).26. Farr, T. G., Jones, C. & Liu, Z. Progress Report: Subsidence in the Central Valley, California. Technical report. (2014) Available at:
http://water.ca.gov/groundwater/docs/NASA_REPORT.pdf (Date of access: 17/02/2016).27. Chelton, D. B., Ries, J. C., Haines, B. J., Fu, L. L. & Callahan, P. S. In Satellite Altimetry and Earth Sciences (eds Fu, L. L. & Cazenave,
A.) Ch. 1, 1–131 (Academic Press, 2000).28. Sandwell, D. T., Müller, R. D., Smith, W. H. F., Garcia, E. & Francis, R. New global marine gravity model from CryoSat-2 and Jason-1
reveals buried tectonic structure. Science 346, 65–67 (2014).29. Zwally, H. J. & Brenner, A. C. In Satellite Altimetry and Earth Sciences (eds Fu, L. L. & Cazenave, A.) Ch. 9, 351–369 (Academic
Press, 2000).30. Lee, H., Shum, C., Yi, Y., Braun, A. & Kuo, C. Laurentia Glacial crustal motion observed using TOPEX/POSEIDON radar altimetry
over land. J. Geodyn. 46, 182–193 (2008).31. Kuo, C., Cheng, Y., Lan, W. & Kao, H. Monitoring vertical land motions in southwestern Taiwan with retracked TOPEX/Poseidon
and Jason-2 satellite altimetry. Remote Sens. 7, 3808–3825 (2015).32. Flament, T. & Rémy, F. Dynamic thinning of Antarctic glaciers from along-track repeat radar altimetry. J. Glaciology 58, 830–840
(2012).

www.nature.com/scientificreports/
1 2Scientific RepoRts | 6:28160 | DOI: 10.1038/srep28160
33. Rémy, F., Flament, T., Michel, A. & Verron, J. Ice sheet survey over Antarctica using satellite altimetry: ERS-2, Envisat, SARAL/AltiKa, the key importance of continuous observations along the same repeat orbit. Int. J. of Remote Sens. 35, 5497–5512 (2014).
34. Lee, H., Shum, C., Kuo, C., Yi, Y. & Braun, A. Application of TOPEX altimetry for solid earth deformation studies. Terr. Atmos. Ocean. Sci. (TAO) 19, 37–46 (2008).
35. Yang, Y., Hwang, C. & E, D. A fixed full-matrix method for determining ice sheet height change from satellite altimeter: an ENVISAT case study in East Antarctica with backscatter analysis. J. Geod. 88, 901–914 (2014).
36. Wessel, P., Smith, W. H. F., Scharroo, R., Luis, J. F. & Wobbe, F. Generic Mapping Tools: Improved version released. EOS Trans. AGU 94, 409–410 (2013).
37. Becker, J. J. et al. Global bathymetry and elevation data at 30 arc seconds resolution: SRTM30_PLUS. Mar. Geod. 32, 355–371 (2009).38. Latham, J., Cumani, R., Rosati, I. & Bloise, M. Global Land Cover SHARE (GLC-SHARE) database. Beta-V1.0 – 2014, Technical
report. Available at: http://www.glcn.org/downs/prj/glcshare/GLC_SHARE_beta_v1.0_2014.pdf (Date of access: 25/04/2015) (2014).
AcknowledgementsWe are grateful to JPL/NASA for the TOPEX/POSEIDON, JASON-1 and JASON-2 altimeter data, which are provided to our team through the web site of AVISO. ENVISAT altimeter data are provided by the European Space Agency. This work is supported by MOST/Taiwan Grant 103-2221-E-009-114-MY3, NSFC/China Grants 41429401 and 41374020, and MOST/China grant 2013CBA01804. NASA’s Concept in Advanced Geodesy Program (NNX12AK28G), and Belmont Forum/IGFA NSF Grant (ICER-1342644) partially supported the Ohio State University component of this research. The U.S. Geological Survey Cooperative Water and Groundwater Resources Programs supported portions of this work. The Landsat images were provided by: U.S. Geological Survey, Earth Resources Observation and Science (EROS) Center, 2015, Landsat products and services: EROS, Glovis Web page, accessed 29 September 2015 at http://glovis.usgs.gov/. The SPOT satellite images are courtesy of the Center for Space and Remote Sensing Research, National Central University (http://140.115.110.11/index_WMTS.php/). The terms of reference for using the SPOT images are as follows: Following the open data policy promoted by the Taiwan government, the Center for Space and Remote Sensing Research at National Central University provides free and open SPOT satellite images of the whole island of Taiwan from 1996 to 2014 to any organization or individual in Taiwan with a non-profit purpose.
Author ContributionsC.H. designed the project and wrote the first draft. Y.Y. computed the vertical displacement rates from altimetry and made some of the figures. R.K. and J.H. performed data and statistical analyses and made Figs 1–8, and most figures in Supplementary Information. C.K.S., D.L.G. and M.S. made critical suggestions and improved the draft. W.C.H. and Y.S.C. performed analyses of leveling data. F.L. provided computing resources and discussed the result with Y.Y.
Additional InformationSupplementary information accompanies this paper at http://www.nature.com/srepCompeting financial interests: The authors declare no competing financial interests.How to cite this article: Hwang, C. et al. Time-varying land subsidence detected by radar altimetry: California, Taiwan and north China. Sci. Rep. 6, 28160; doi: 10.1038/srep28160 (2016).
This work is licensed under a Creative Commons Attribution 4.0 International License. The images or other third party material in this article are included in the article’s Creative Commons license,
unless indicated otherwise in the credit line; if the material is not included under the Creative Commons license, users will need to obtain permission from the license holder to reproduce the material. To view a copy of this license, visit http://creativecommons.org/licenses/by/4.0/
1
Supplementary information 1
Time-varying land subsidence revealed by radar altimetry: California, Taiwan 2
and north China 3
4
Cheinway Hwang1,*
, Yuande Yang2, Ricky Kao
1, Jiancheng Han
1, C.K. Shum
3,7, 5
Devin L. Galloway4, Michelle Sneed
5, Wei-Chia Hung
6, Yung-Sheng Cheng
1, and Fei 6
Li2 7
1Department of Civil Engineering, National Chiao Tung University, 1001 Ta Hsueh 8
Road, Hsinchu, Taiwan. 9
2Chinese Antarctic Center of Surveying and Mapping, Wuhan University, 129 Luoyu 10
Road, Wuhan 430079, China. 11
3State Key Laboratory of Geodesy and Geodynamics, Institute of Geodesy & Geophysics, 12
Chinese Academy of Sciences, Wuhan 43077, China 13
4U.S. Geological Survey, 5957 Lakeside Blvd, Indianapolis, IN 46278, U.S.A. 14
5U.S. Geological Survey, 6000 J Street, Placer Hall, Sacramento, CA 95819, U.S.A. 15
6Green Environmental Engineering Consultant Co. LTD, Hsinchu, Taiwan. 16
7Division of Geodetic Science, School of Earth Sciences, the Ohio State University, 17
Columbus, OH 43210, U.S.A. 18
*Corresponding author: Cheinway Hwang, [email protected] 19
20
S1: GNSS data showing land subsidence in the Central Valley, California and for 21
validating vertical displacement rates derived from radar altimetry 22
The vertical displacement rates (VDRs) in Fig. 1 over the Central Valley 23
(includes the San Joaquin Valley [SJV] and the southern portion of the Sacramento 24
Valley) and the surrounding areas are based on the measurements collected at the 25
GNSS stations in the networks of CentralCalifornia, CentralCalifornia_SGPS, 26

2
SFBayArea, SFBayArea_SGPS, NCalifornia, NCalifornia_SGPS, LongValley, and 27
BasinAndRange_SGPS (http://earthquake.usgs.gov/monitoring/gps/). In total, there 28
are 803 continuous and 696 campaign-mode stations used in this study. Table S1 29
shows the GNSS stations with the 15 largest measured subsidence rates over 30
croplands in the SJV and the southern portion of the Sacramento Valley within the 31
Central Valley. The first campaign-mode station was H104, established and first 32
collected data in 1993. Note that a subsidence rate is the negative of a VDR and is a 33
positive number indicating the downward movement of ground surface. Near the 34
Hanford Municipal Airport (Fig. S1), the GNSS-derived subsidence rate is 9.79 ± 0.05 35
cm yr-1
, which is the largest among the 1499 stations. Hanford is surrounded by flat 36
croplands where satellite altimetry produces the most accurate and best coverage of 37
VDRs measured in this study. 38
Table S1: Geodetic coordinates of the GNSS stations with 15 largest measured 39
vertical displacement rates in the Central Valley (includes the San Joaquin Valley and 40
the southern portion of the Sacramento Valley), and their horizontal velocities (north 41
and east components). ‘*’ for Campaign-mode station; otherwise continuous station 42
43
Station Longitude (°) Latitude (°) North (cm yr-1
) East (cm yr-1
) Vertical (cm yr-1
) Time span
P271 -121.715 38.657 -0.47 ± 0.03 -2.32 ± 0.03 -0.80 ± 0.03 6/2004-5/2015
UCD1 -121.751 38.536 -0.31 ± 0.02 -2.22 ± 0.02 -1.14 ± 0.02 1/1999-5/2015
RIOV* -121.694 38.149 -0.50 ± 0.07 -1.98 ± 0.08 -1.12 ± 0.29 2/2002-1/2012
P270 -122.055 39.244 -0.49 ± 0.03 -2.24 ± 0.03 -0.15 ± 0.03 5/2005-5/2015
P273 -121.388 38.116 -0.29 ± 0.03 -2.26 ± 0.03 -0.32 ± 0.03 10/2005-5/2014
P275 -121.215 38.322 -0.36 ± 0.03 -2.28 ± 0.03 -0.20 ± 0.03 7/2006-5/2015
P303 -120.705 37.054 -0.19 ± 0.03 -2.22 ± 0.03 -2.43 ± 0.03 7/2005-5/2015
P307 -120.058 36.947 -0.05 ± 0.03 -2.48 ± 0.03 -2.30 ± 0.03 10/2005-5/2015
C2R3* -119.863 36.554 -0.15 ± 0.04 -2.23 ± 0.04 -1.59 ± 0.10 6/2001-1/2014
P566 -119.229 36.324 -0.17 ± 0.03 -2.32 ± 0.03 -1.12 ± 0.03 11/2005-5/2015
P056 -119.063 36.027 -0.01 ± 0.03 -2.36 ± 0.03 -3.13 ± 0.03 11/2005-5/2015
P565 -119.237 35.744 -0.04 ± 0.03 -2.39 ± 0.03 -1.77 ± 0.03 11/2005-5/2015
ARM2 -118.911 35.201 0.00 ± 0.03 -2.65 ± 0.03 -1.85 ± 0.03 12/2000-5/2015
3
BKR1 -119.109 35.132 0.26 ± 0.03 -2.55 ± 0.03 -1.77 ± 0.03 2/2004-5/2015
HAND*
-119.628 36.317 -0.37 ± 0.03 -2.50 ± 0.03 -9.79 ± 0.05 10/2001-1/2014
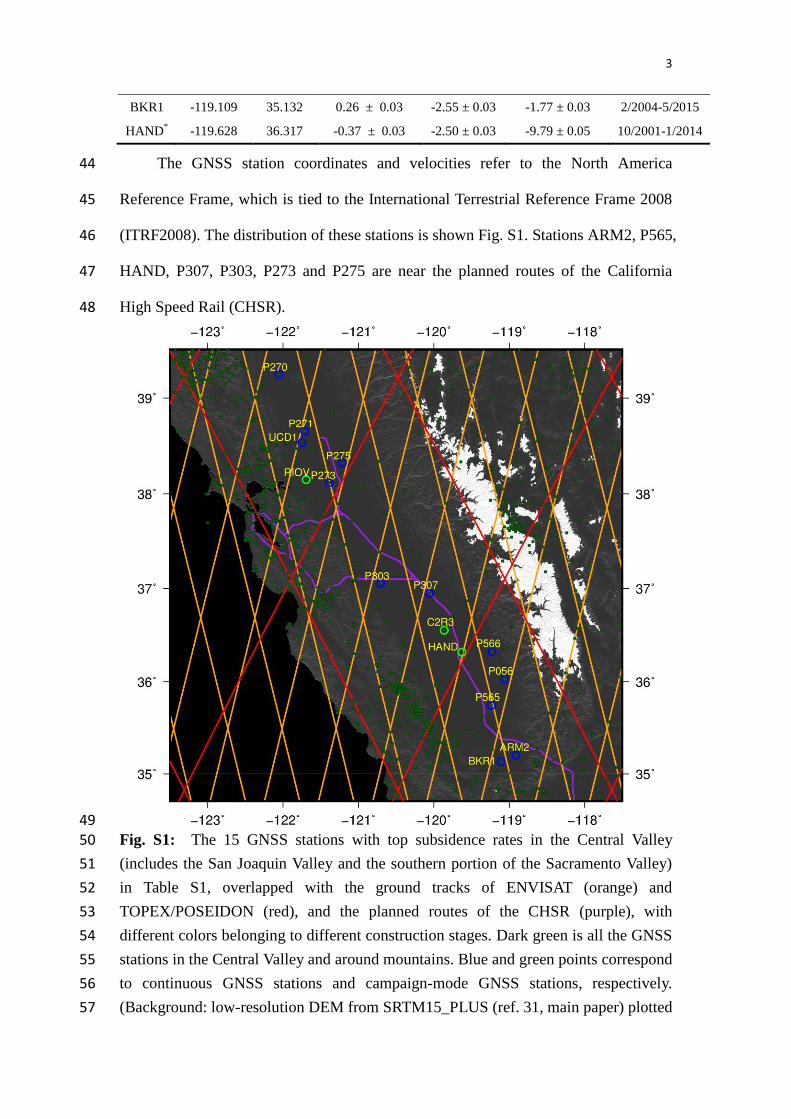
The GNSS station coordinates and velocities refer to the North America 44
Reference Frame, which is tied to the International Terrestrial Reference Frame 2008 45
(ITRF2008). The distribution of these stations is shown Fig. S1. Stations ARM2, P565, 46
HAND, P307, P303, P273 and P275 are near the planned routes of the California 47
High Speed Rail (CHSR). 48
49 Fig. S1: The 15 GNSS stations with top subsidence rates in the Central Valley 50
(includes the San Joaquin Valley and the southern portion of the Sacramento Valley) 51
in Table S1, overlapped with the ground tracks of ENVISAT (orange) and 52
TOPEX/POSEIDON (red), and the planned routes of the CHSR (purple), with 53
different colors belonging to different construction stages. Dark green is all the GNSS 54
stations in the Central Valley and around mountains. Blue and green points correspond 55
to continuous GNSS stations and campaign-mode GNSS stations, respectively. 56
(Background: low-resolution DEM from SRTM15_PLUS (ref. 31, main paper) plotted 57

4
by the authors). GMT V5.1.3 (http://gmt.soest.hawaii.edu/) is used plot the DEM and 58
tracks. 59
60
5
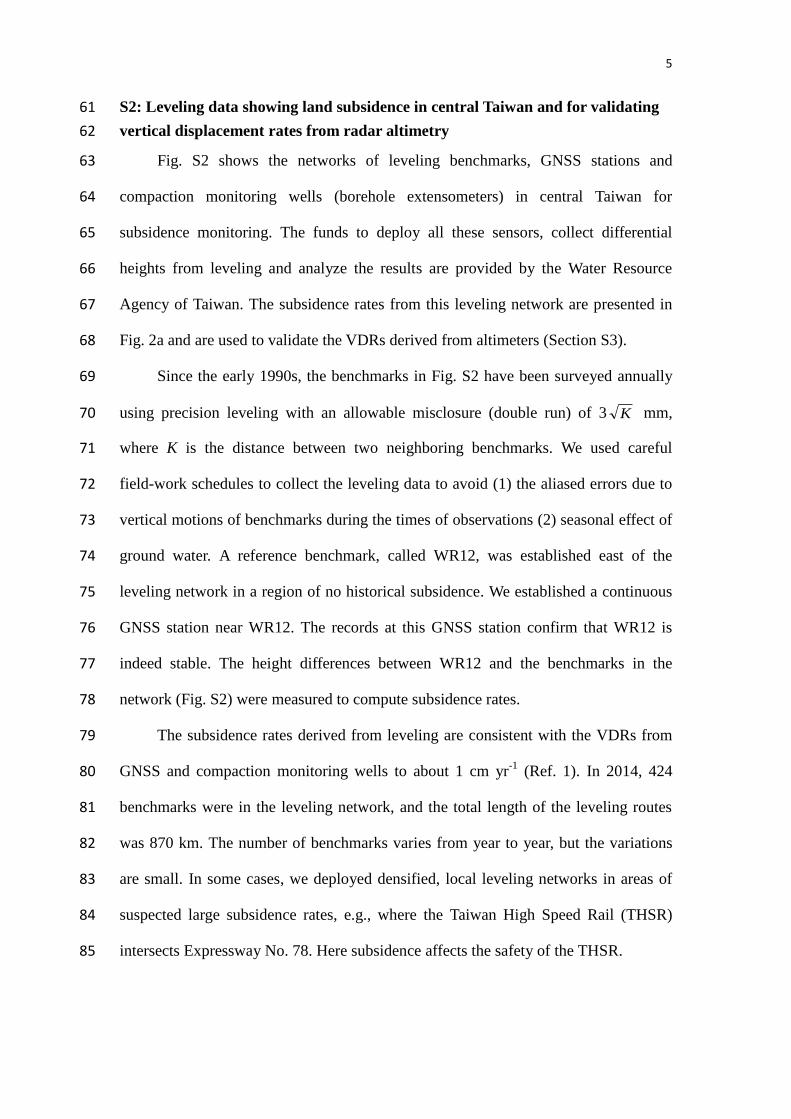
S2: Leveling data showing land subsidence in central Taiwan and for validating 61
vertical displacement rates from radar altimetry 62
Fig. S2 shows the networks of leveling benchmarks, GNSS stations and 63
compaction monitoring wells (borehole extensometers) in central Taiwan for 64
subsidence monitoring. The funds to deploy all these sensors, collect differential 65
heights from leveling and analyze the results are provided by the Water Resource 66
Agency of Taiwan. The subsidence rates from this leveling network are presented in 67
Fig. 2a and are used to validate the VDRs derived from altimeters (Section S3). 68
Since the early 1990s, the benchmarks in Fig. S2 have been surveyed annually 69
using precision leveling with an allowable misclosure (double run) of 3 K mm, 70
where K is the distance between two neighboring benchmarks. We used careful 71
field-work schedules to collect the leveling data to avoid (1) the aliased errors due to 72
vertical motions of benchmarks during the times of observations (2) seasonal effect of 73
ground water. A reference benchmark, called WR12, was established east of the 74
leveling network in a region of no historical subsidence. We established a continuous 75
GNSS station near WR12. The records at this GNSS station confirm that WR12 is 76
indeed stable. The height differences between WR12 and the benchmarks in the 77
network (Fig. S2) were measured to compute subsidence rates. 78
The subsidence rates derived from leveling are consistent with the VDRs from 79
GNSS and compaction monitoring wells to about 1 cm yr-1
(Ref. 1). In 2014, 424 80
benchmarks were in the leveling network, and the total length of the leveling routes 81
was 870 km. The number of benchmarks varies from year to year, but the variations 82
are small. In some cases, we deployed densified, local leveling networks in areas of 83
suspected large subsidence rates, e.g., where the Taiwan High Speed Rail (THSR) 84
intersects Expressway No. 78. Here subsidence affects the safety of the THSR. 85

6
86 Fig. S2: Networks of leveling benchmarks, GNSS stations, compaction monitoring 87
wells for monitoring land subsidence in central Taiwan. WR12 (star) is the reference 88
benchmark. Vertical displacement rates from the leveling network are used to show 89
the subsidence rates in Fig. 2a and to assess the altimeter-derived VDRs in Section S3. 90
This figure is generated using MapInfo 10.0, 91
http://www.pitneybowes.com/us/location-intelligence/geographic-information-system92
s/mapinfo-pro.html), using boundaries, roads and township names are from our 93
databases. 94

7
S3: Altimeter data and waveform retracking and accuracy assessment for 95
altimeter measurements of land subsidence 96
In the Methods section of the main paper, we have presented the key method of 97
altimeter data processing for determination of vertical displacement rate. Here we 98
provide more information. This section shows the altimeter data, and the method of 99
retracking for obtaining acceptable rates of height change (VDRs) on cropland. The 100
altimeter-derived VDRs are assessed by comparing to the Taiwan leveling results in 101
Section S2. The geophysical data records (GDRs) and Sensor Data Records (radar 102
waveforms) of TOPEX/POSEIDON (TP), JASON-1 (J1), JASON-2 (J2) are from 103
AVISO (http://www.aviso.altimetry.fr) and those of ENVISAT (EN) are from 104
European Space Agency. In the EN GDRs, range corrections based on the following 105
retrackers are supplied: Ice1, Ice2, Sea ice and Ocean retrackers. However, as 106
demonstrated below, we used range corrections from the subwaveform retracker2 to 107
derive VDRs. The EN GDRs also supply backscatter power change and slopes of 108
leading and trailing edges. No such range corrections and backscatter and 109
leading/trailing edge effects are supplied in the GDRs of TP, J1 and J2. Like in oceans, 110
geophysical corrections were applied to raw altimeter height measurements on land, 111
including solid earth and pole tides, and to remove both the dry and wet tropospheric 112
delays and the ionospheric effect of the altimeter range measurements. 113
For EN, it turns out that a proper selection of the three parameters in Eq. (2) is 114
critical to obtaining good range accuracy (note: no need to have this selection for TP, 115
J1 and J2 because of lack of the needed data in the GDRS of these satellites). To 116
assess the impact of the three parameters, we experimented with 8 cases of parameter 117
combination. Each case is associated with a binary (on or off) treatment of the three 118
parameters. We then compared the resulting VDRs computed for the period 119
2002–2010 along EN Pass 993 (EN-993) with the VDRs from precision leveling 120
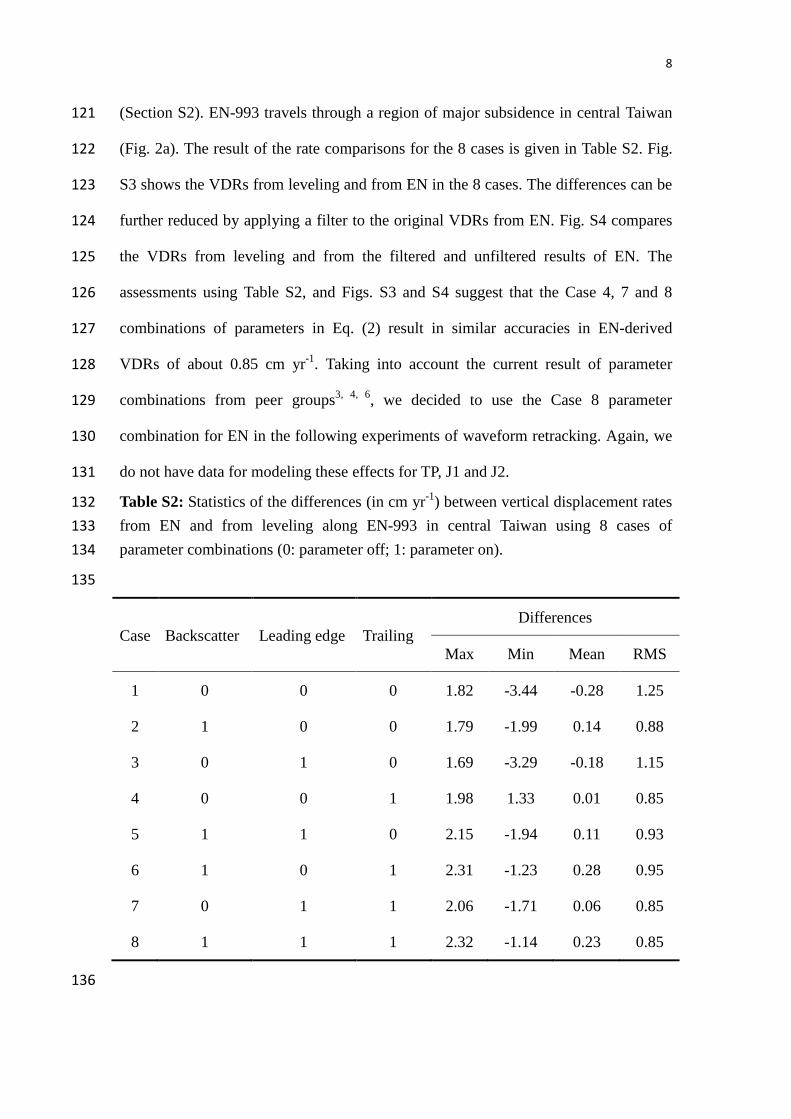
8
(Section S2). EN-993 travels through a region of major subsidence in central Taiwan 121
(Fig. 2a). The result of the rate comparisons for the 8 cases is given in Table S2. Fig. 122
S3 shows the VDRs from leveling and from EN in the 8 cases. The differences can be 123
further reduced by applying a filter to the original VDRs from EN. Fig. S4 compares 124
the VDRs from leveling and from the filtered and unfiltered results of EN. The 125
assessments using Table S2, and Figs. S3 and S4 suggest that the Case 4, 7 and 8 126
combinations of parameters in Eq. (2) result in similar accuracies in EN-derived 127
VDRs of about 0.85 cm yr-1
. Taking into account the current result of parameter 128
combinations from peer groups3, 4, 6
, we decided to use the Case 8 parameter 129
combination for EN in the following experiments of waveform retracking. Again, we 130
do not have data for modeling these effects for TP, J1 and J2. 131
Table S2: Statistics of the differences (in cm yr-1
) between vertical displacement rates 132
from EN and from leveling along EN-993 in central Taiwan using 8 cases of 133
parameter combinations (0: parameter off; 1: parameter on). 134
135
Case Backscatter Leading edge Trailing
Differences
Max Min Mean RMS
1 0 0 0 1.82 -3.44 -0.28 1.25
2 1 0 0 1.79 -1.99 0.14 0.88
3 0 1 0 1.69 -3.29 -0.18 1.15
4 0 0 1 1.98 1.33 0.01 0.85
5 1 1 0 2.15 -1.94 0.11 0.93
6 1 0 1 2.31 -1.23 0.28 0.95
7 0 1 1 2.06 -1.71 0.06 0.85
8 1 1 1 2.32 -1.14 0.23 0.85
136

9
137
Fig. S3: Vertical displacement rates from precision leveling and from corrected 138
heights of EN altimeter along Pass 993 (EN-993). For the 8 cases see Table S2. 139
140
141
Fig. S4: Vertical displacement rates from leveling and from filtered and unfiltered 142
results of EN altimeter along Pass 993 in central Taiwan. 143
144

10
In Eq. (1), heights j
iH are based on range corrections using the subwaveform 145
threshold retracker5. Here we show that the subwaveform threshold retracker indeed 146
outperforms other retrackers, based on comparisons between EN-derived VDRs and 147
those from precision leveling in Taiwan (see Section S2). As shown earlier, the EN 148
product supplies range corrections using the Ice1, Ice2, Sea ice and Ocean retrackers. 149
In this study, the range corrections were also determined using the subwaveform 150
threshold retracker and the offset center of gravity (OCOG) retracker7. The 151
computational steps using the subwaveform threshold retracker are as follows2: 152
Step 1: Obtain a reference subwaveform from the full Brown waveform model. 153
Step 2: Compute the correlations between candidate subwaveforms and the reference 154
waveform to find the optimal subwaveform. 155
Step 3: Determine the gate number,rG , at the center of the leading edge from the 156
optimal subwaveform by the improved threshold retracking with the optimal 157
threshold value. 158
Step 4: Compute the retracking correction using RGGC trR )( , where R is 159
the width of the radar pulse and tG is the theoretical gate number. 160
In Step 3, the optimal threshold value is a value that will remove the effects of radar 161
penetration in soil and of sub-surface volume scattering of radar8. In this study, the 162
optimal threshold value was determined by an empirical method as follows: we 163
experimented with various threshold values to obtain range corrections and then 164
compute VDRs. The computed VDRs were compared with the measured VDRs from 165
leveling (Section S2), and the optimal threshold value was the threshold value that 166
resulted in the least difference between the VDRs from leveling and altimetry. Table 167
S3 shows the statistics of the differences between the VDRs from leveling and from 168
EN in central Taiwan. The VDRs from EN are based on range corrections supplied in 169
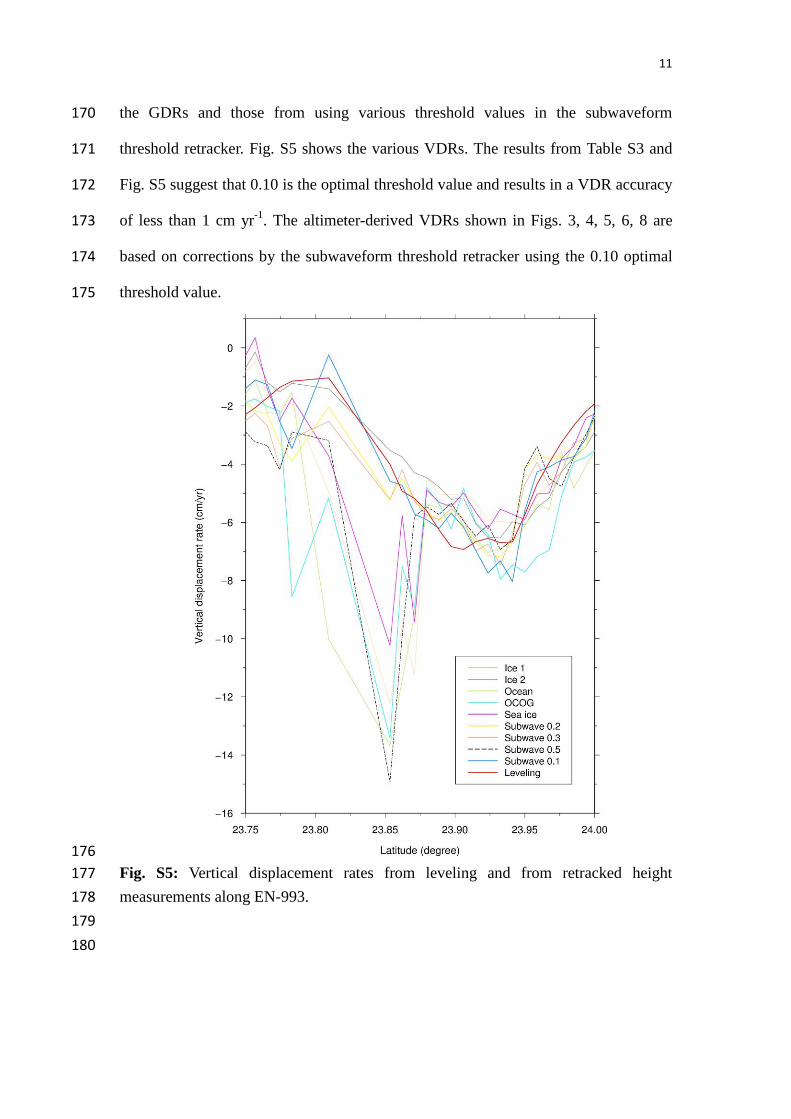
11
the GDRs and those from using various threshold values in the subwaveform 170
threshold retracker. Fig. S5 shows the various VDRs. The results from Table S3 and 171
Fig. S5 suggest that 0.10 is the optimal threshold value and results in a VDR accuracy 172
of less than 1 cm yr-1
. The altimeter-derived VDRs shown in Figs. 3, 4, 5, 6, 8 are 173
based on corrections by the subwaveform threshold retracker using the 0.10 optimal 174
threshold value. 175
176
Fig. S5: Vertical displacement rates from leveling and from retracked height 177
measurements along EN-993. 178
179
180

12
Table S3: Statistics of the differences between vertical displacement rates derived 181
from leveling and from EN-993 by different retrackers in central Taiwan (unit: cm 182
yr-1
) 183
184
Retracker Max Min Mean RMS
Subwave1 0.1
2 2.32 -1.14 0.23 0.85
Subwave 0.2 2.73 -1.58 0.14 0.97
Subwave 0.3 2.73 -1.30 0.37 0.99
Subwave 0.5 10.91 -1.69 0.86 2.54
Ice 13
8.22 -1.93 0.65 2.40
Ice 23 2.01 -1.92 -0.11 1.04
Sea ice3 6.22 -2.41 0.34 1.82
Ocean3 9.66 -1.48 1.46 3.05
OCOG 9.41 -2.11 1.46 2.91
1subwaveform threshold retracker 185
2threshold value 186
3 retrackers supplied in EN GDRs 187
188
If there is no leveling data over a study region, one can use differences between 189
the VDRs at the crossover of two intersecting ground tracks (one ascending and one 190
descending track) to assess the altimeter-derived rates. However, one must be cautious 191
in choosing the bin radius to estimate the parameters for the space and time reductions 192
needed in Eq. (1). Also, the slopes of the terrain near the crossover along the two 193
tracks can vary, resulting in different slope-induced effects that are difficult to correct. 194
Unless the area near a crossover is sufficiently flat and the measurements are dense, it 195
is difficult for the ascending and descending tracks to produce equally good 196

13
parameters for data reductions and equally good VDRs from the two tracks. 197
Despite the difficulty in using the crossover approach for assessing altimeter 198
results, here we show two examples of crossover assessment using the VDRs derived 199
from TP-051 (an odd pass number indicates an ascending track) and TP-164 (an even 200
pass number indicates a descending track) in central Taiwan, and the rates derived 201
from TP-001 and TP-062 near Tianjin, northern China. Table S4 shows the differences 202
between the rates from the ascending and descending tracks, based on corrections 203
using 4 different threshold values in the subwaveform threshold retracker and using 204
the OCOG retracker. The subwaveform threshold retracker with a 0.10 threshold 205
value resulted in the least difference at the two crossovers in central Taiwan and 206
northern China. This result is consistent with the result in Table S3. Note that the 207
difference at the TP-001and TP-062 crossover from OCOG is 0.15 cm yr-1
, which is 208
the smallest among all differences. However, the VDR from OCOG at this crossover 209
is about -7.50 cm yr-1
, which is about 3 cm yr-1
larger than (in terms of subsidence) 210
the rate determined by precision leveling (the correct rate is about -4.50 cm yr-1
). 211
212
Table S4: Differences between vertical displacement rates from ascending and 213
descending tracks of TP (unit: cm yr-1
). 214
Retracker TP-051 and TP-164 crossover
(Taiwan)
TP-001 and TP-062 crossover
(Tianjin, north China)
No retracking 3.00 11.25
OCOG 2.43 0.15
Subwave 0.1 0.20 1.58
Subwave 0.2 1.14 2.81
Subwave 0.3 2.03 3.21
Subwave 0.5 3.30 4.81
14
215
S4: Time series of height at the TP-EN crossover and at the location of 216
maximum subsidence, near HanfordSan Joaquin Valley, California, USA 217
Fig. S6 shows the time series of heights at the crossover of TP-043 and 218
EN-684 (see Fig. 3a) in the SJV. The coordinates of this crossover, located in the 219
Tulare Basin, are 36.1586° N, 119.6594° W. The maximum VDRs from TP and EN 220
along these two passes occur north of the crossover at about 36.25° N and are -6, and 221
-10 cm yr-1
, respectively. The rates indicate that subsidence here has accelerated from 222
the period of TP (1992–2002) to that of EN (2002–10) and to J2 (2008–15). This 223
acceleration is attributed in part to increased groundwater extraction that accompanies 224
the recent drought in California. 225
Fig. 5 shows the time series of height at the location of the maximum 226
subsidence (see Fig. 4a) along TP-043. Both Figs. 5 and S6 show trends of decreasing 227
heights with superimposed oscillations in the heights. In Fig. S6, the VDRs from EN 228
and J1 are quite consistent. In the SJV, altimeter-measured heights peaked in summer 229
and were lowest in winter. The oscillations are likely caused by different volume 230
scatters and different soil penetration depths of radar in the dry and wet seasons, and 231
by varying vegetation types that result in variable diffusions of radar pulses. 232
In Eq. (1), 0H is the mean height at the mean position (the bin center) for all 233
repeat cycles from a particular satellite mission. The mean position for TP will be 234
different from the mean position for its follow-on mission J1. This is also applicable 235
to the differences between any two missions. At a given bin, the difference between 236
the two mean positions for TP and J1 can vary from few meters to hundreds of meters. 237
As an example, for a gentle slope with a 1% gradient, a 10-m difference in mean 238
position will lead to a 10-cm height difference. Both inter-mission altimeter bias and 239
terrain graident will create an apparent shift between heights from two satellites at a 240

15
crossover of the two satellites (see Methods). In Figs. 5 and S6, we show both the 241
time series from the original heights and the shifted heights (the shift for a mission is 242
a constant applied to all the heights from this mission). 243
244
Fig. S6: Height changes in San Joaquin Valley, California, from TP, EN, J1 and J2 at 245
the crossover of tracks TP-043 and EN-684 (see Fig. 3a for the location of crossover) 246
from (a) the original heights and (b) shifted heights. The marked differences between 247
EN and J1 heights in (a) are caused partially by different reference ellispoids adopted 248
for the two altimetry GDRs (6378137.0 m versus 6378136.3 m). 249
250
16
S5: Hanford and Tuku: similarities in distribution of altimeter ground tracks, 251
route of high speed rail and risk of subsidence 252
Fig. S7 shows the similarities between Hanford, California, and Tuku, Taiwan, 253
in terms of the distribution of altimeter ground tracks, the route of high speed rail and 254
the risk of subsidence. Both Hanford and Tuku experience the largest subsidence rates 255
(in this study) as seen in the TP-J2 results. The TP-J2 altimeters have provided 256
subsidence rates (Oct 2002–Feb 2015) along the sections of CHSR and THSR near 257
Hanford and Tuku. In Fig. S7b, the red (first priority) - and blue (second priority) 258
-shaded areas within 1.5 km of THSR are areas where groundwater use is restricted. 259
These shaded areas were defined in a project of groundwater restriction use near Tuku 260
that started in 2005 and was completed in 2008 261
(http://www.wra.gov.tw/ct.asp?xItem=45677&ctNode=7748&comefrom=lp, in 262
Chinese). Note that THSR began operation in 2007. As pointed out in the main text, 263
the reduction in the subsidence magnitude and in the subsiding area near Tuku seen in 264
the J2-derived VDRs (Fig. 4b) is due to the measure of groundwater use. THSR in the 265
red-shaded area used to suffer the most severe subsidence problems due to 266
groundwater pumping (Fig. S8) and loading by Expressway No. 78 (Fig. S2). For the 267
planned CHSR, there is a potential operational risk near Hanford due to the large 268
subsidence measured there. However, the restricted groundwater use near Tuku 269
suggests that this measure is effective in reducing the subsidence rate and may be a 270
measure to consider for the CHSR. 271
With proper data processing, the J2 altimeter and future JASON-3 will continue 272
to provide near real-time monitoring of the severe subsidence in the two areas for safe 273
operations of CHSR and THSR. 274

17
275
Fig. S7: (a) CHSR, and ground tracks of TP-043 (same as J1-043 and J2-043) and 276
EN-684 overlapped with an image from the Landsat satellite near Hanford, California. 277
The positions of the red dot and star correspond to the positions of the same symbols 278
shown in Fig. 4a, (b) THSR, and ground tracks of TP-051 and EN-993 overlapped 279
with an image from the SPOT satellite near Tuku Township, Taiwan. The positions of 280
the triangle and square correspond to the positions of the same symbols shown in Fig. 281
4b. GMT V5.1.3 (http://gmt.soest.hawaii.edu/) is used to plot the ground tracks and 282
names. The Landsat image was provided by: U.S. Geological Survey, Earth Resources 283
Observation and Science (EROS) Center, 2015, Landsat products and services: EROS, 284
Glovis Web page, accessed 29 September 2015 at http://glovis.usgs.gov/. 285
286
287
Fig. S8: (a) Pumping groundwater to irrigate rice fields near Tuku Township, Taiwan, 288
(b) existing wells are prohibited from pumping groundwater in a restricted area within 289
1.5 km from the THSR (the shaded-area in Fig. S7b). Irrigation ditches divert water 290
from outside the restricted area. (Photos: R. Kao) 291
292
18
S6: Vertical displacement rates in the North China Plain from TP, EN,J2, and 293
height time series at crossovers 294
Fig. 8 shows the VDRs derived from TP and J2 in the North China Plain. Due to 295
their short repeat period of 10 days, the cross-track spacing (from one ascending track 296
to its neighboring ascending track) is about 314 km. However, the along-track VDRs 297
are useful for detecting cropland subsidence and its time variation. The time series of 298
height changes (original, un-shifted) at the crossovers of TP, EN and J2 at points A-D 299
(Fig. 7) are shown in Figs. S9-12, indicating that the VDRs for different satellite 300
periods can vary substantially. The VDRs in Figs. S9-12 are used to compute the 301
cumulative subsidence values in Fig. 7. During the period when EN and J2 overlap 302
(2008–10), the trends of height changes from the two satellites for this period are very 303
consistent, and the same consistency is also seen in Figs. 5 and S6. 304
According to Document No. AAA22I-0215-2013-00960 issued by the Water 305
Resource Agency of Tianjin City in 2013 306
(http://www.tjzfxxgk.gov.cn/tjep/ConInfoParticular.jsp?id=45399, in Chinese), 307
pumping of groundwater is prohibited within 1.5 km of the Jin-Qin High Speed Rail 308
(same measure is imposed along THSR near Tuku, Fig. S7). This measure is 309
associated with the deceleration of land subsidence from the EN period to the J2 310
period seen in Fig. S9. The successful detections of the slowed VDRs due to restricted 311
groundwater use near Tuku (Taiwan) and Tianjin (north China) suggest that satellite 312
altimetry can determine whether a particular management measure to control 313
groundwater use is effective. 314
315
316
317
19
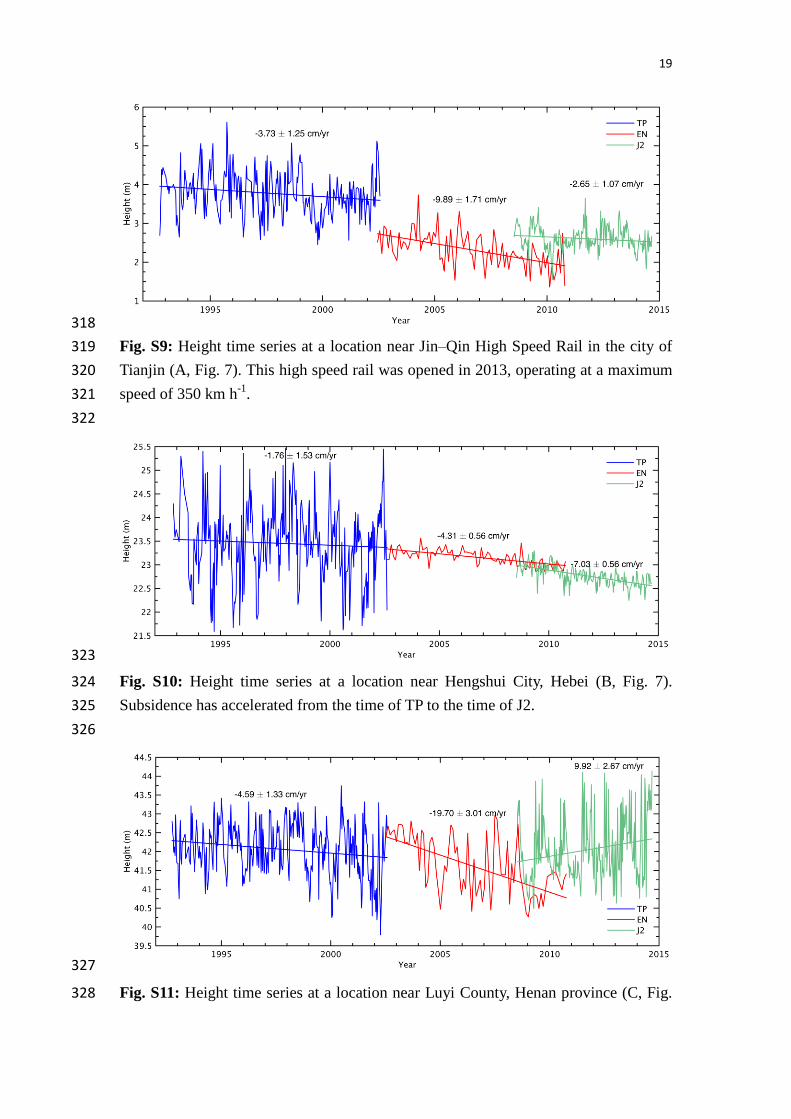
318
Fig. S9: Height time series at a location near Jin–Qin High Speed Rail in the city of 319
Tianjin (A, Fig. 7). This high speed rail was opened in 2013, operating at a maximum 320
speed of 350 km h-1
. 321
322
323
Fig. S10: Height time series at a location near Hengshui City, Hebei (B, Fig. 7). 324
Subsidence has accelerated from the time of TP to the time of J2. 325
326
327
Fig. S11: Height time series at a location near Luyi County, Henan province (C, Fig. 328

20
7), with J2 heights showing an increasing trend (EN also shows such a trend in the 329
overlapping period 2008–2010). 330
331
332
Fig. S12: Height time series at a location near Fuyang City, Anhui province (D, Fig. 333
7), showing a significant accelerating subsidence during 2011–15. 334
335
References for Supplementary Information 336
1. Hwang, C., Hung, W. C. & Liu, C. H. Results of geodetic and geotechnical 337
monitoring of subsidence for Taiwan High Speed Rail operation. Natural Hazards 338
47, 1-16 (2008). 339
2. Yang, Y., Hwang, C., Hsu, H., E, D. & Wang, H. A subwaveform threshold 340
retracker for ERS-1 altimetry: A case study in the Antarctic Ocean, Computers & 341
Geosciences 41, 88-98, doi:10.1016/j.cageo.2011.08.017 (2012). 342
3. Flament, T. & Rémy, F. Dynamic thinning of Antarctic glaciers from along-track 343
repeat radar altimetry, J. Glaciology 58, 830-840, doi: 10.3189/2012JoG11J118 344
(2012). 345
4. Rémy, F., Flament, T., Michel, A. & Verron, J. Ice sheet survey over Antarctica 346
using satellite altimetry: ERS-2, Envisat, SARAL/AltiKa, the key importance of 347
continuous observations along the same repeat orbit, International Journal of 348
Remote Sensing 35, 5497-5512, doi: 10.1080/01431161.2014.926419 (2014). 349
5. Lee, H., Shum, C., Kuo, C., Yi, Y. & Braun, A. Application of TOPEX altimetry for 350

21
solid earth deformation studies, Terrestrial, Atmospheric and Oceanic Sciences 351
(TAO) 19, 37-46 (2008). 352
6. Yang, Y., Hwang, C. & E, D. A fixed full-matrix method for determining ice sheet 353
height change from satellite altimeter: an ENVISAT case study in East Antarctica 354
with backscatter analysis, Journal of Geodesy 88, 901-914, doi: 355
10.1007/s00190-014-0730-z (2014). 356
7. Wingham, D. J., Rapley, C. G. & Griffiths, H. New techniques in satellite tracking 357
system. In: Proceedings of IGARSS’ 88 symposium, Zurich, pp 1339–1344 (1986). 358
8. Zwally, H. J. & Brenner, A. C. Ice sheet dynamics and mass balance. in L.L. Fu 359
and A. Cazenave (eds.), Satellite Altimetry and Earth Sciences, Academic Press, pp 360
351-369, doi:10.1016/S0074-6142(01)80154-6 (2001). 361
362
Related Documents


![Time-varying jump tails - Duke Universitypublic.econ.duke.edu/~boller/Published_Papers/joe_14.pdf · varying± ± ± ± ± − (+ −]) ± (+ − ±, =,..., −] = −, −] = −,),](https://static.cupdf.com/doc/110x72/5f9eb1e298e27c43de4b3c12/time-varying-jump-tails-duke-bollerpublishedpapersjoe14pdf-varying-.jpg)