Dr. Nicholas R. Bates Senior Research Scientist Bermuda Biological Station For Research Bermuda Biological Station For Research Time Series Observations: A Case Study of the North Atlantic and the BATS site Rationale/Motivation Gruber and Sarmiento, 2002 Gruber and Sarmiento, 2002 Humans are changing atmospheric composition and climate Thanks to Scott Thanks to Scott Doney Doney Rationale/Motivation Takahashi et al., 2002 Takahashi et al., 2002 Rationale/Motivation Red Areas: Red Areas: Oceanic Source of CO Oceanic Source of CO 2 2 Blue Areas: Blue Areas: Oceanic Sinks of CO Oceanic Sinks of CO 2 2

Welcome message from author
This document is posted to help you gain knowledge. Please leave a comment to let me know what you think about it! Share it to your friends and learn new things together.
Transcript

Dr. Nicholas R. BatesSenior Research Scientist
Bermuda Biological Station For ResearchBermuda Biological Station For Research
Time Series Observations:A Case Study of the North Atlantic and
the BATS site
Rationale/Motivation
Gruber and Sarmiento, 2002Gruber and Sarmiento, 2002
Humans are changing atmospheric composition and climate
Thanks to Scott Thanks to Scott DoneyDoney
Rationale/Motivation
Takahashi et al., 2002Takahashi et al., 2002
Rationale/Motivation
Red Areas:Red Areas: Oceanic Source of COOceanic Source of CO22
Blue Areas:Blue Areas: Oceanic Sinks of COOceanic Sinks of CO22

Globally integrated flux: 2.2 PgC yr-1
Sabine et al., 2004Sabine et al., 2004
Rationale/Motivation
H. sapiens traitstop competitor for space (urbanization)
effective predator(overfishing)
prolific biogeochemical recycler (C, N, P, H20 cycles)
symbiotic relationships with other species (ranching, habitat protection)
Ecosystem responsehabitat loss
food web adjustment → ecosystem shift
ecosystem shiftatmospheric CO2 higher than past 105–106 yearshabitat gain/loss
Ecosystems in the AnthropoceneDomination of Ecosystems by H. sapiens
J.J. KleypasKleypasThanks: J. Kleypas, NCAR; Pearson and Palmer, 2000
Effects of Atmospheric CO2on Ocean Ecosystems
Increased CO2
Increased AtmosphericTemperature
Increased SST
IncreasedStability
Climatic Changes
Alteredstorm
frequency/intensity
Increaseddust (Fe
fertilization)
Increase in N2 fixation?
Increased Atmospheric CO2
Decrease in nutrients?
Increase in Photosynthesis
Changes in ecosystems?
Changes in ecosystems?
Thanks to Scott Thanks to Scott DoneyDoney/Joan /Joan KleypasKleypas
1. Time1. Time--series studies: Introduction to BATS.series studies: Introduction to BATS.2. Introduction to the BATS site in the North Atlantic.2. Introduction to the BATS site in the North Atlantic.3.3. Carbon imbalance, new production, new sources of Carbon imbalance, new production, new sources of
nitrogen, nitrogen fixation, connections to modes nitrogen, nitrogen fixation, connections to modes of climate variability (i.e., NAO).of climate variability (i.e., NAO).
4.4. TimeTime--scales of COscales of CO2 variability, interannual variability, interannual variability of COvariability of CO2 and oceanic sink of COand oceanic sink of CO2..
5. New technologies.5. New technologies.
Outline of Talk:

1.1. Introduction to timeIntroduction to time--series studies. series studies. 2. Introduction to the BATS site in the North Atlantic.2. Introduction to the BATS site in the North Atlantic.3.3. Carbon imbalance, new production, new sources of Carbon imbalance, new production, new sources of
nitrogen, nitrogen fixation, connections to modes nitrogen, nitrogen fixation, connections to modes of climate variability (i.e. NAO).of climate variability (i.e. NAO).
4.4. Timescales of COTimescales of CO2 variability, interannual variability variability, interannual variability of COof CO2 and oceanic sink of COand oceanic sink of CO2..
5. New technologies.5. New technologies.
Outline:Global-scale processes may change climate andecological systems in unforeseen ways that could affectour political and economic stability. It is thereforeimperative that we learn as much as possible about the causes and effects of such change. The magnitude of the natural fluctuations is similar to or larger than thatpredicted to result, initially, from human-induced perturbations to global climate, making it difficult to clearly identify the sources of ecosystem variability.
Outline:
Chlorophyll biomass (SeaWifs)
Difference approaches for studyingcarbon and nitrogen in the ocean
Thanks to NASA/LODYCThanks to NASA/LODYC
From spaceFrom spaceDrifting instrumentsDrifting instruments
Observing ocean processes
Ship ExpeditionsShip Expeditions••Ocean timeOcean time--seriesseries••Ocean surveys and process studiesOcean surveys and process studies
Observing ocean processesDifferent approaches for studyingcarbon and nitrogen in the ocean
Thanks to BBSR/UCSB/BNLThanks to BBSR/UCSB/BNL
In the lab back homeMooring and buoys

An important contribution of present time-series programshas been to document the temporal evolution of CO2 in surface seawater and changing air-sea fluxes. Theseobservations have clearly shown the effect of differentmodes of climate variability (e.g. ENSO, PDO) on CO2fluxes and water column biogeochemistry.
Objectives of time-series studies:Time series measurements have also shown that theuptake of anthropogenic CO2 is variable over a widerange of time and space scales necessitatinga sustained observing program to monitor the changes inocean chemistry and CO2 uptake efficiency in the future.
Objectives of time-series studies:
The present time series programs have also helpedelucidate phytoplankton primary production in relation to climateperturbations. Phytoplankton occupy a central role in oceanicecosystems, as their nutrient uptake, growth, and sinkingmediate the biogeochemical fluxes of carbon and otherelements between the atmosphere, surface ocean, and deepocean. They also influence the penetration depth of solarenergy and thus influence the ocean heat budget.
Objectives of time-series studies:Because the atmosphere and oceans are physically coupled,climate exerts strong effects on the marine biogeochemistryand food web mediated by phytoplankton.
Objectives of time-series studies:

time
space1 m2 1 km2 GlobeOcean
BasinRegional(106 km2)
centuries
decadal
Inter-annual
seasonal
daily
Remote sensing
hourly
Process Studies
Repeat Trans-basin
Sections
VOS
surface pCO2
Shipboard
Time-Series
Moored
Time-Series
Different Time and Space Scales
• Time series data, augmented with information from satellites and gliders, will span many scales of variability.
time
space1 m2 1 km2 GlobeOcean
BasinRegional(106 km2)
centuries
decadal
Inter-annual
seasonal
daily
Remote sensing
hourly
Process Studies
Repeat Trans-basin
Sections
VOS
surface pCO2
Shipboard
Time-Series
Moored
Time-Series
Different Time and Space Scales
• The major focus in the early years is seasonal and spatial pattern of the physics, nutrient chemistry, and primary production.
time
space1 m2 1 km2 GlobeOceanBasin
Regional(106 km2)
centuries
decadal
Inter-annual
seasonal
daily
Remote sensing
hourly
Process Studies
Repeat Trans-basin
Sections
VOS
surface pCO2
Shipboard
Time-Series
Moored
Time-Series
Different Time and Space Scales
• As the time series mature, the data will facilitate rigorous study of processes at longer time scales, such as the PDO and NAO.
• Global atmospheric flask network with biweekly for CO2 and other species (e.g., methane, N2O, halocarbons, etc.) • CO2 interhemispheric gradient places strong constraints on source/sink patterns.
Atmospheric Time-series
P. TansP. Tans
Open-ocean Time-series
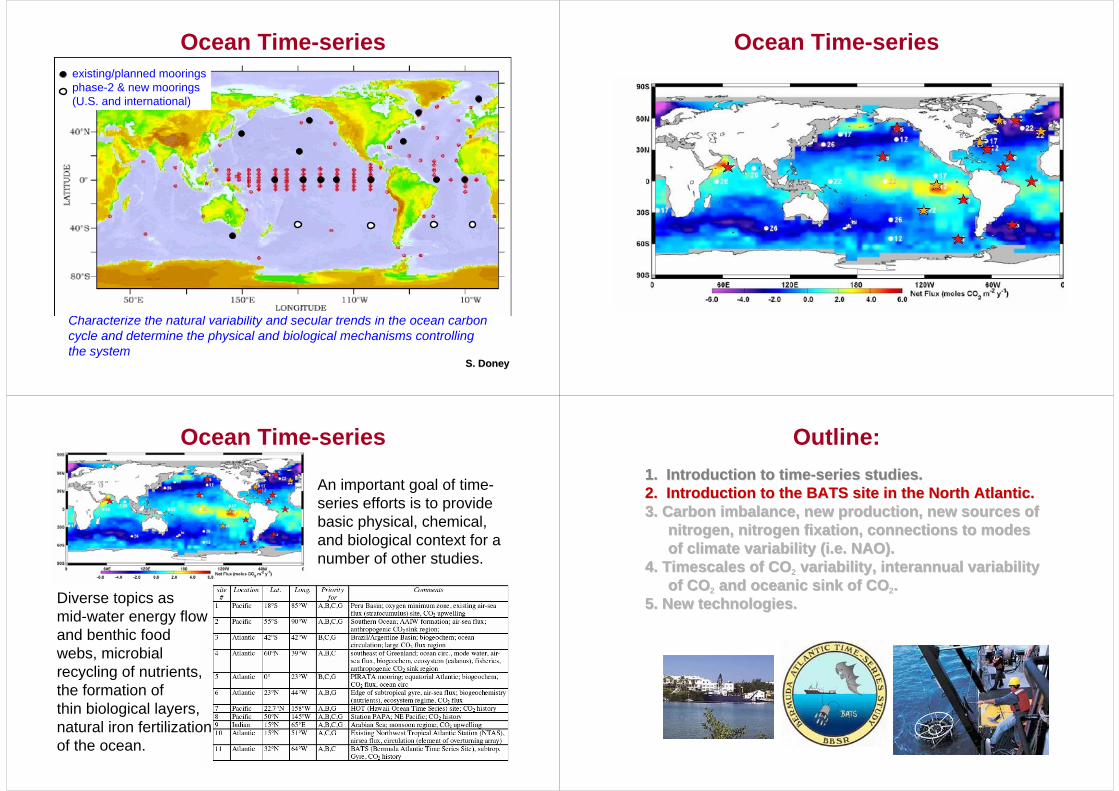
Characterize the natural variability and secular trends in the ocean carbon cycle and determine the physical and biological mechanisms controlling the system
existing/planned mooringsphase-2 & new moorings(U.S. and international)
Ocean Time-series
S.S. DoneyDoney
Ocean Time-series
Ocean Time-series
Diverse topics asmid-water energy flow and benthic food webs, microbial recycling of nutrients, the formation ofthin biological layers, natural iron fertilization of the ocean.
An important goal of time-series efforts is to provide basic physical, chemical, and biological context for a number of other studies.
1. Introduction to time1. Introduction to time--series studies.series studies.2. Introduction to the BATS site in the North Atlantic.2. Introduction to the BATS site in the North Atlantic.3.3. Carbon imbalance, new production, new sources of Carbon imbalance, new production, new sources of
nitrogen, nitrogen fixation, connections to modes nitrogen, nitrogen fixation, connections to modes of climate variability (i.e. NAO).of climate variability (i.e. NAO).
4.4. Timescales of COTimescales of CO2 variability, interannual variability variability, interannual variability of COof CO2 and oceanic sink of COand oceanic sink of CO2..
5. New technologies.5. New technologies.
Outline:

BATSBATSALOHAALOHA
Ocean Time-series (since 1988)
Karl et al., 2001Karl et al., 2001
BATSBATS
Sargasso Sea
Gulf Stream
• Monthly sampling16 core cruises a year 2-3 validation cruises
0-4200 m• 24 Hydrostation S
cruises per year.
Bermuda Atlantic Time-series Study
Hydrostation S (1954Hydrostation S (1954--present)present)
Bermuda Bermuda Testbed Testbed Mooring Mooring (BTM) (1994(BTM) (1994--present)present)
BATS (1988BATS (1988--present)present)
Hydrostation S
BATS/OFP SITE
BATS Deployment Area
(32° 10N, 64° 30W)
(31° 50N, 64° 10W)
32°32°
64°
64°65°
65°
AEROCE Tower
Harbour Radio Tower200 m2000 m4000 m
Ocean Flux Program (OFP) Ocean Flux Program (OFP) (1978(1978--present)present)
AEROCE Tower AEROCE Tower (atmosphere sampling)(atmosphere sampling)
Time-series Studies near Bermuda Ocean Flux Program (OFP)
The OFP sediment trap time-series mooring is located in the western Sargasso Sea at 31 50'N, 64 10'W, approximately 75 km southeast of Bermuda. The traps have continually sampled deep ocean fluxes with a resolution of either two months (1978-1989) or two weeks (1989 to present). There is a 21+ year flux record at 3200 m (>85% temporal coverage), a 13+ year record at 1500 m, and a 10+ year record at 500 m.
M. Conte, WHOIM. Conte, WHOI
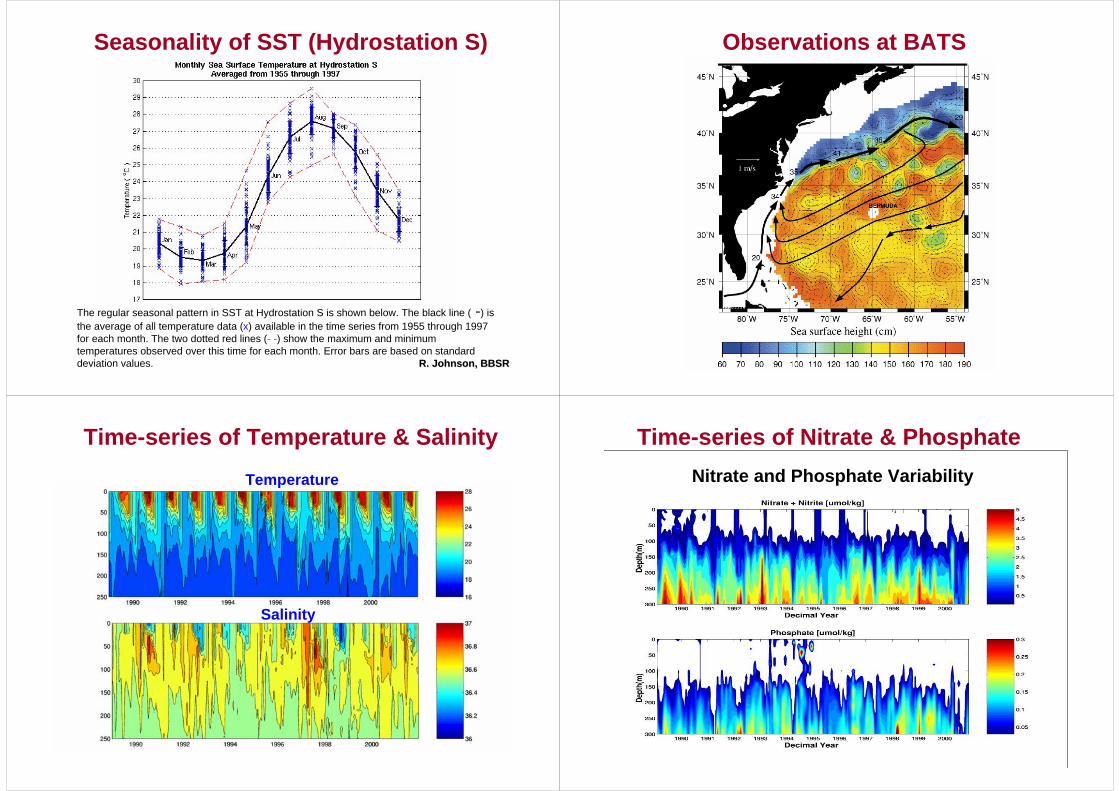
The regular seasonal pattern in SST at Hydrostation S is shown below. The black line ( -) is the average of all temperature data (x) available in the time series from 1955 through 1997 for each month. The two dotted red lines (- -) show the maximum and minimum temperatures observed over this time for each month. Error bars are based on standard deviation values. R. Johnson, BBSRR. Johnson, BBSR
Seasonality of SST (Hydrostation S) Observations at BATS
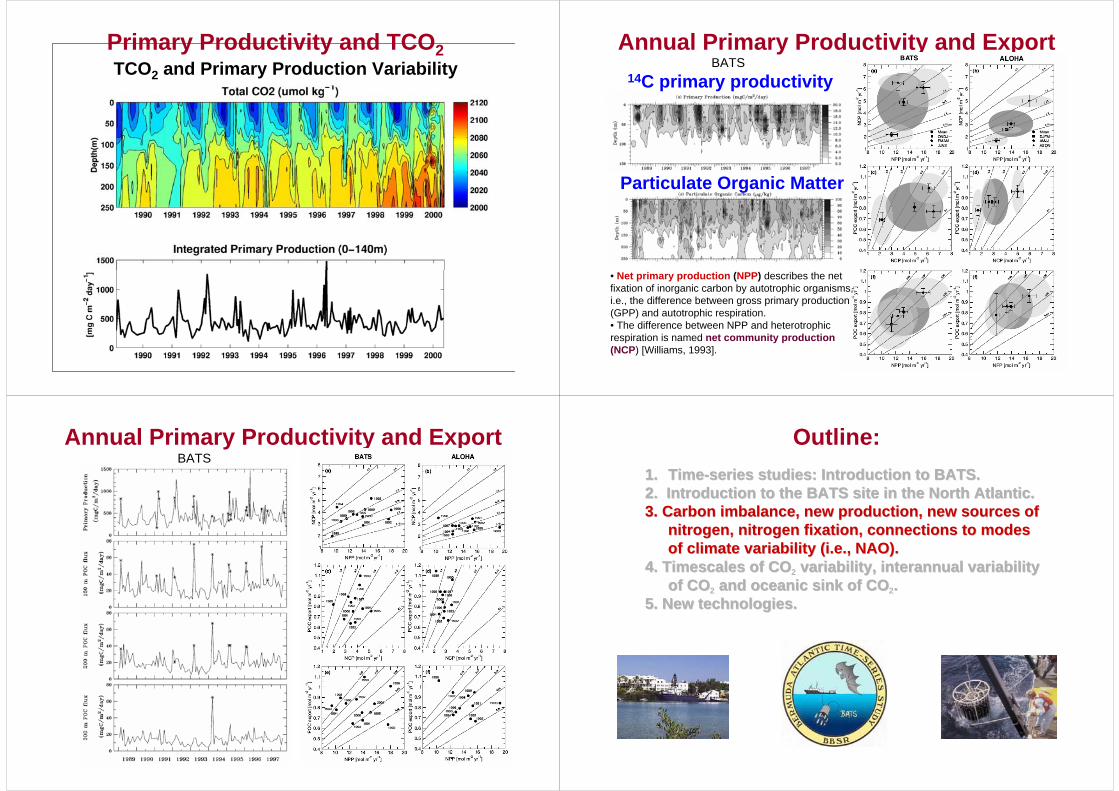
Temperature
Salinity
Time-series of Temperature & Salinity Time-series of Nitrate & PhosphateNitrate and Phosphate Variability
TCO2 and Primary Production VariabilityPrimary Productivity and TCO2 Annual Primary Productivity and Export
14C primary productivity
Particulate Organic Matter
BATS
• Net primary production (NPP) describes the net fixation of inorganic carbon by autotrophic organisms, i.e., the difference between gross primary production (GPP) and autotrophic respiration.• The difference between NPP and heterotrophic respiration is named net community production (NCP) [Williams, 1993].
Annual Primary Productivity and ExportBATS
1.1. TimeTime--series studies: Introduction to BATS.series studies: Introduction to BATS.2. Introduction to the BATS site in the North Atlantic.2. Introduction to the BATS site in the North Atlantic.3.3. Carbon imbalance, new production, new sources of Carbon imbalance, new production, new sources of
nitrogen, nitrogen fixation, connections to modes nitrogen, nitrogen fixation, connections to modes of climate variability (i.e., NAO).of climate variability (i.e., NAO).
4.4. Timescales of COTimescales of CO2 variability, interannual variability variability, interannual variability of COof CO2 and oceanic sink of COand oceanic sink of CO2..
5. New technologies.5. New technologies.
Outline:

COCO22
OrganicOrganicMatterMatter
OrganicOrganicMatterMatter
Upwelling/Upwelling/CirculationCirculation
PhotosynthesisPhotosynthesis
RespirationRespiration
Gas ExchangeGas Exchange
AtmosphereAtmosphere
OceanOcean
Aphotic Aphotic ZoneZone
RemineralizationRemineralization
Sinking of Sinking of ParticlesParticles
Ocean carbon cycle processes
COCO22
COCO22
OrganicOrganicMatterMatter
OrganicOrganicMatterMatter
Upwelling/Upwelling/CirculationCirculation
PhotosynthesisPhotosynthesis
AtmosphereAtmosphere
OceanOcean
Aphotic Aphotic ZoneZone
RemineralizationRemineralization
Sinking of Sinking of ParticlesParticles
Ocean nitrogen cycle
NONO33
NONO33
New production paradigm without NNew production paradigm without N22 fixationfixation
Drawdown of Seawater pCO2 and nitrate North Atlantic Ocean near the NABE siteNorth Atlantic Ocean near the NABE site
Drawdown of Drawdown of ppCOCO22 or DIC due to NCPor DIC due to NCPNCP = Net community productivityNCP = Net community productivity
North PacificNorth Pacific
NCP
NCP
Mixing
Takahashi Takahashi et alet al., 2002., 2002
NCP and drawdown of seawater pCO22
New production = export productionNew production = export production
Ross SeaRoss Sea

2300
2250
2200
2150
2100
10 15 20 25 30 35
DIC
(D
IC ( µµ
mol
es/k
g)m
oles
/kg)
Nitrate + nitrite (Nitrate + nitrite (µµmoles/kg)moles/kg)
Blue: Blue: NovNov--Dec. 1994Dec. 1994
Green:Green:Dec. 1995Dec. 1995--Jan. Jan.
19961996
C:N = 6.7:1C:N = 6.7:1
DIC & nitrate drawdown in the Ross Sea
Bates Bates et alet al., 1998a., 1998a
High Rates of Productivity on ShelvesChukchi and Beaufort Sea Chukchi and Beaufort Sea shelfshelf--slope NCPslope NCPThe highest rates of net community productivity, NCP (~1000-2850 mg C m2
d-1), calculated from DIC and nitrate changes, occurred on the shelf in the Barrow Canyon region of the Chukchi Sea and east of Point Barrow in the western Beaufort Sea.
Bates et al., 2005a,bBates et al., 2005a,b
SpringSpring
SummerSummer
Takahashi Takahashi et alet al., 2002., 2002
Global drawdown of pCO22
BATSBATS Gulf Stream
• Monthly sampling16 core cruises a year 2-3 validation cruises
0-4200 m• 24 Hydrostation S
cruises per year.
Seasonal Changes of DIC at BATS
2070
2060
2050
2040
2030
2020
2010
2000
1990
J F M A M J J A S O N D
440
420
400
380
360
340
320
300
pp COCO
22(( µµ
atm
)at
m)
Tem
pera
ture
cor
rect
edTe
mpe
ratu
re c
orre
cted
DIC
(D
IC ( µµ m
oles/kg)m
oles/kg)
DICDIC
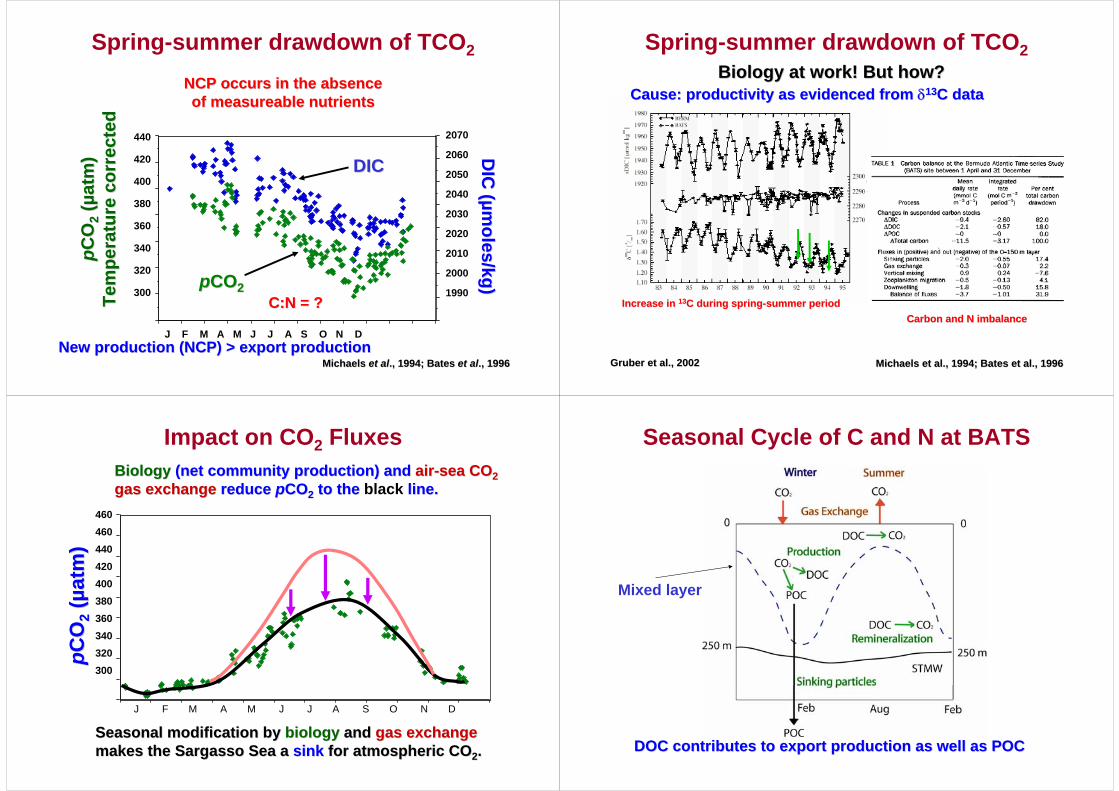
ppCOCO22C:N = ?C:N = ?
Michaels Michaels et alet al., 1994; Bates ., 1994; Bates et alet al., 1996., 1996
Spring-summer drawdown of TCO2
NCP occurs in the absence NCP occurs in the absence of of measureable measureable nutrientsnutrients
New production (NCP) > export productionNew production (NCP) > export production
Increase in Increase in 1313C during springC during spring--summer periodsummer period
Gruber et al., 2002Gruber et al., 2002
Spring-summer drawdown of TCO2
Cause: productivity as evidenced from Cause: productivity as evidenced from δδ1313C dataC data
Carbon and N imbalanceCarbon and N imbalance
Michaels et al., 1994; Bates et al., 1996Michaels et al., 1994; Bates et al., 1996
Biology at work! But how?Biology at work! But how?
Jan Feb Mar Apr May Jun July Aug Sep Oct Nov DecSeasonal modification bySeasonal modification by biologybiology andand gas exchangegas exchange
makes the Sargasso Sea a makes the Sargasso Sea a sinksink for atmospheric COfor atmospheric CO22..
pp COCO
22(( µµ
atm
)at
m)
460460440420400380360340320300
BiologyBiology (net community production) and (net community production) and airair--sea COsea CO22gas exchangegas exchange reduce reduce ppCOCO22 to the to the black line.line.
Impact on CO2 Fluxes
J F M A M J J A S O N D
Mixed layer
Seasonal Cycle of C and N at BATS
DOC contributes to export production as well as POCDOC contributes to export production as well as POC

Circulation: Schmitz and McCartney, 1993Circulation: Schmitz and McCartney, 1993
N S
38°N 22°N
N2 (N*)
Gulf Stream
NO3
N2
•Winter mixing?•Mesoscale eddies?
•Local N2 fixation or transport?•Transport of DON and NO3?
•Non-redfield C:N:P processes?
DON and/or NO3
Where does the new N come from?
NO3
Mixed layer
Seasonal Cycle of C and N at BATS
DOC contributes to export production as well as POCDOC contributes to export production as well as POCSee Carlson See Carlson et alet al., 1994., 1994
Mixed layer
NO3
N2
DON?
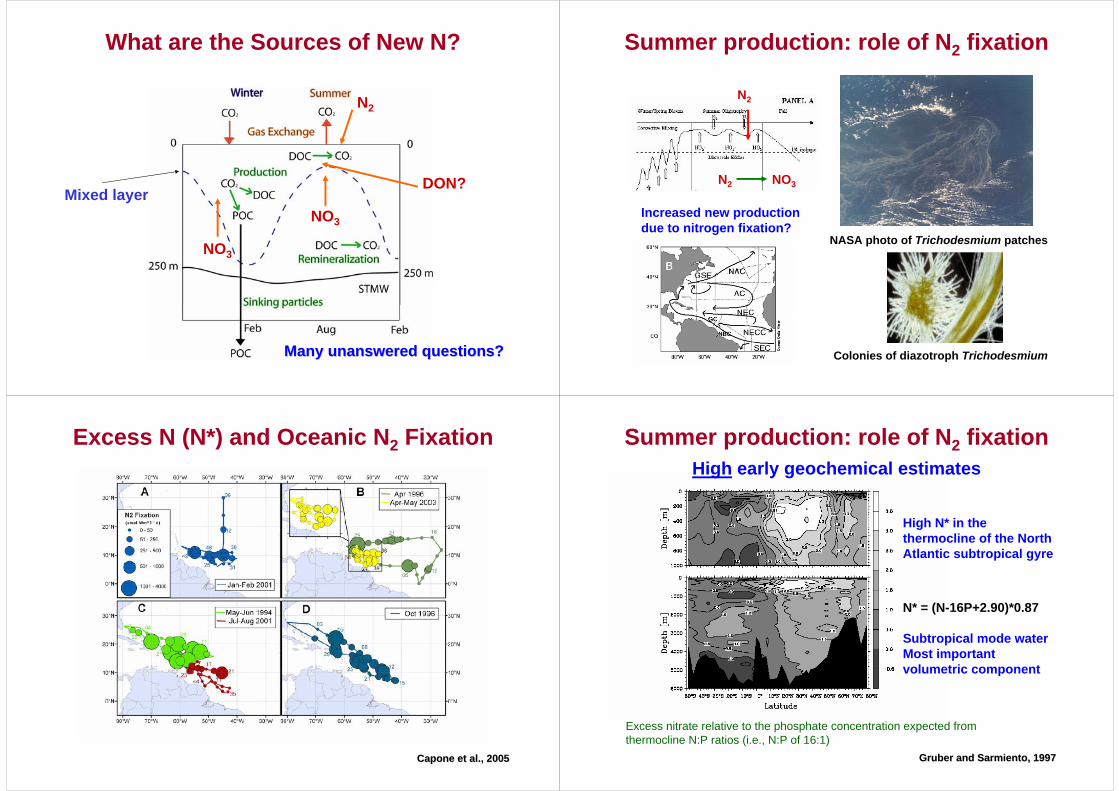
What are the sources of new N?
NO3
Many unanswered questions?Many unanswered questions?
Winter mixing and new production
Primary productivity ~150 g C m-2 year-1
New production ~ 0.6 mol N m-2 year-1
Mixed layer depth
Nitrate injection
Export
Lomas Lomas et alet al., 2005., 2005
Biomass build up

Winter new production
Export
J u l i a n D a y
6 6 6 7 6 8 6 9 7 0 7 1 7 2 7 3 7 4
nDIC
(um
ol/k
g)
2 0 5 8
2 0 6 0
2 0 6 2
2 0 6 4
2 0 6 6
2 0 6 8
2 0 7 0
J u l i a n D a y
6 6 6 8 7 0 7 2
Int.
PP
(mgC
m-2
d-1
)
0
5 0 0
1 0 0 0
1 5 0 0
2 0 0 0
Lomas Lomas et alet al., 2005., 2005
Winter new production
Lomas Lomas et alet al., 2005., 2005
•Alternation between deep and shallow mixed layer depths does lead to nutrient injections into the deeper parts of the mixed layer, 80 – 140 m.
–Mixed layer deepened then shoaled over the next few days–Biomass increased only slightly–Primary production went up dramatically–Export production went up dramatically
Mixed layer Carbon(mg C m-2 d-1)
Feb 2004 Front BATS Winter MixingTPM flux 288 + 69 198 + 98POC flux 49 + 11 37 + 20BSiO flux 14 + 3 6 + 4
Primary Production 1,595 + 178 474 + 58
DIC drawdown) 1,620 – 1,920 0
Period of ‘normal’ PrimaryProductivity (JD 48-52)
Period of higher PrimaryProductivity (JD 66-70)
Diatom response?
Summer production: role of eddies
NO3
Export
Increased chlorophyll biomassin mesoscale eddies
Summer production: EDDIES project
Determining the biogeochemical and biological responses to mesoscale eddiesin the North Atlantic subtropical gyre EDDIES Project P.I.EDDIES Project P.I.’’ss
D. D. McGillicuddyMcGillicuddy, W.J. Jenkins, W.J. JenkinsJ. J. LedwellLedwell, K.O. Buesseler (WHOI) , K.O. Buesseler (WHOI) N.R. Bates (BBSR)N.R. Bates (BBSR)P. Falkowski (Rutgers) P. Falkowski (Rutgers) D. Siegel (UCSB) D. Hansell (RSMAS)D. Siegel (UCSB) D. Hansell (RSMAS)
Summer 2004
Mixed layer
NO3
N2
DON?
What are the Sources of New N?
NO3
Many unanswered questions?Many unanswered questions?
Summer production: role of N2 fixation
N2
N2 NO3
NASA photo of Trichodesmium patches
Colonies of diazotroph Trichodesmium
Increased new production due to nitrogen fixation?
NASA photo of Trichodesmium patches
Excess N (N*) and Oceanic N2 Fixation
Capone et al., 2005Capone et al., 2005
High N* in the thermocline of the North Atlantic subtropical gyre
Excess nitrate relative to the phosphate concentration expected from thermocline N:P ratios (i.e., N:P of 16:1)
Subtropical mode waterMost important volumetric component
High early geochemical estimatesSummer production: role of N2 fixation
N* = (N-16P+2.90)*0.87
Gruber and Sarmiento, 1997Gruber and Sarmiento, 1997

Excess N (or N*) relative to P
High N* in the thermocline of the North Atlantic subtropical gyre
Excess nitrate relative to the phosphate concentration expected from thermocline N:P ratios (i.e., N:P of 16:1)
Subtropical mode waterMost important volumetric component
Capone et al., 2005Capone et al., 2005
Definition of Excess Nitrate (�DINxs)
DINxs = N - 16P
where N is the concentration (µmoles kg-1) of nitrate (plus nitrite where available) and P is the concentration of soluble reactive phosphate (µmoles kg-1).
N* = (N - 16P + 2.90) x 0.87
where the constant (2.90) and multiplier are used to force the global mean N* to zero (Gruber and Sarmiento, 1997; Deutsch et al., 2001; Gruber and Sarmiento, 2001).
Hansell et al., 2004Hansell et al., 2004
1980 1990 2000
20
x
x
Nor
th A
tlant
icN
2Fi
xatio
n(T
g o r
1012
g N
yr-1
)
Biological Estimatesx Geochemical Estimates
xHansell et alCapone and Carpenter *Capone et al
Michaels et al
Gruber and Sarmiento
10
30
0
Nitrogen Fixation Rates (Tg N yr-1)
Hansell et al., 2004Hansell et al., 2004
Variability of DINxs (1988-2002)
Bates and Hansell 2005Bates and Hansell 2005
N.R. Bates, A.C Pequignet, and R.J. JohnsonBermuda Biological Station For ResearchBermuda Biological Station For Research
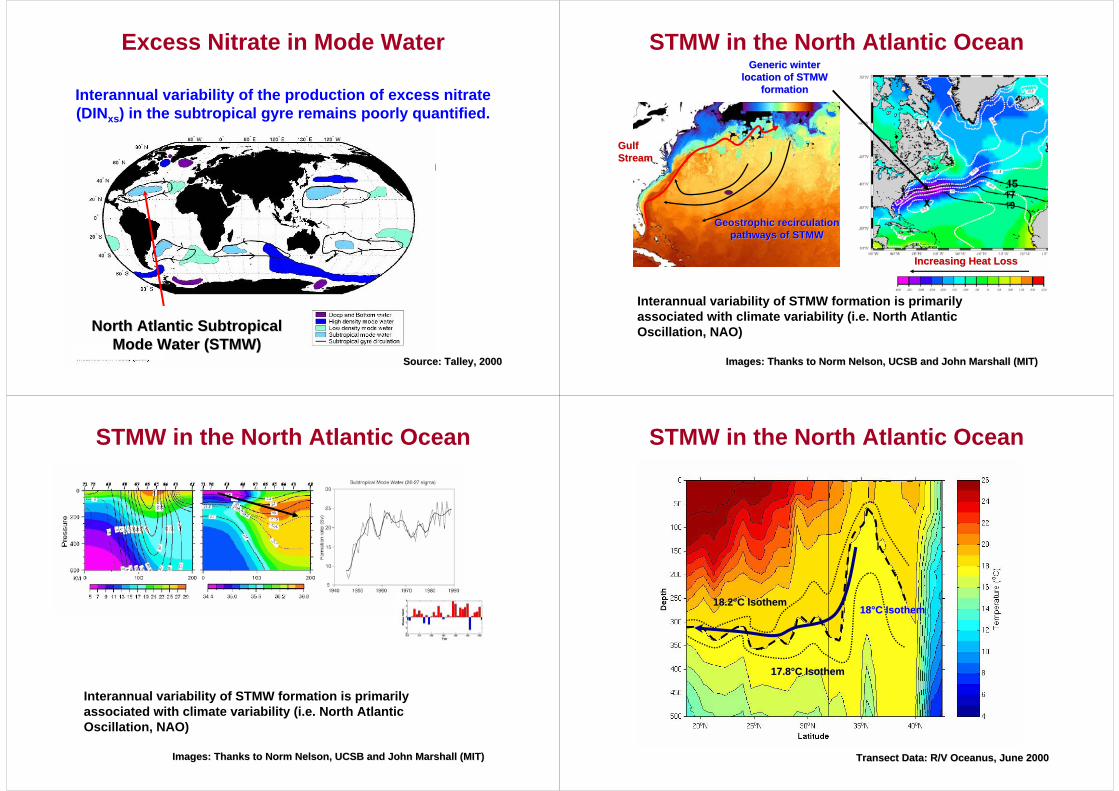
Source: Talley, 2000Source: Talley, 2000
North Atlantic Subtropical North Atlantic Subtropical Mode Water (STMW)Mode Water (STMW)
Interannual variability of the production of excess nitrate (DINxs) in the subtropical gyre remains poorly quantified.
Excess Nitrate in Mode Water
18°C 25°C4°C
STMW in the North Atlantic OceanGeneric winter Generic winter
location of STMW location of STMW formationformation
Geostrophic Geostrophic recirculation recirculation pathways of STMWpathways of STMW
Interannual variability of STMW formation is primarily associated with climate variability (i.e. North Atlantic Oscillation, NAO)
Images: Thanks to Norm Nelson, UCSB and John Marshall (MIT)Images: Thanks to Norm Nelson, UCSB and John Marshall (MIT)
Gulf Gulf StreamStream
Increasing Heat LossIncreasing Heat Loss
18°C 25°C4°C
STMW in the North Atlantic Ocean
Interannual variability of STMW formation is primarily associated with climate variability (i.e. North Atlantic Oscillation, NAO)
Images: Thanks to Norm Nelson, UCSB and John Marshall (MIT)Images: Thanks to Norm Nelson, UCSB and John Marshall (MIT) Transect Data: R/V Oceanus, June 2000Transect Data: R/V Oceanus, June 2000
Generic winter Generic winter location of STMW location of STMW
formationformation
Geostrophic Geostrophic recirculation recirculation pathways of STMWpathways of STMW
1818°°C C IsothemIsothem
17.817.8°°C C IsothemIsothem
18.218.2°°C C IsothemIsothem
STMW in the North Atlantic Ocean
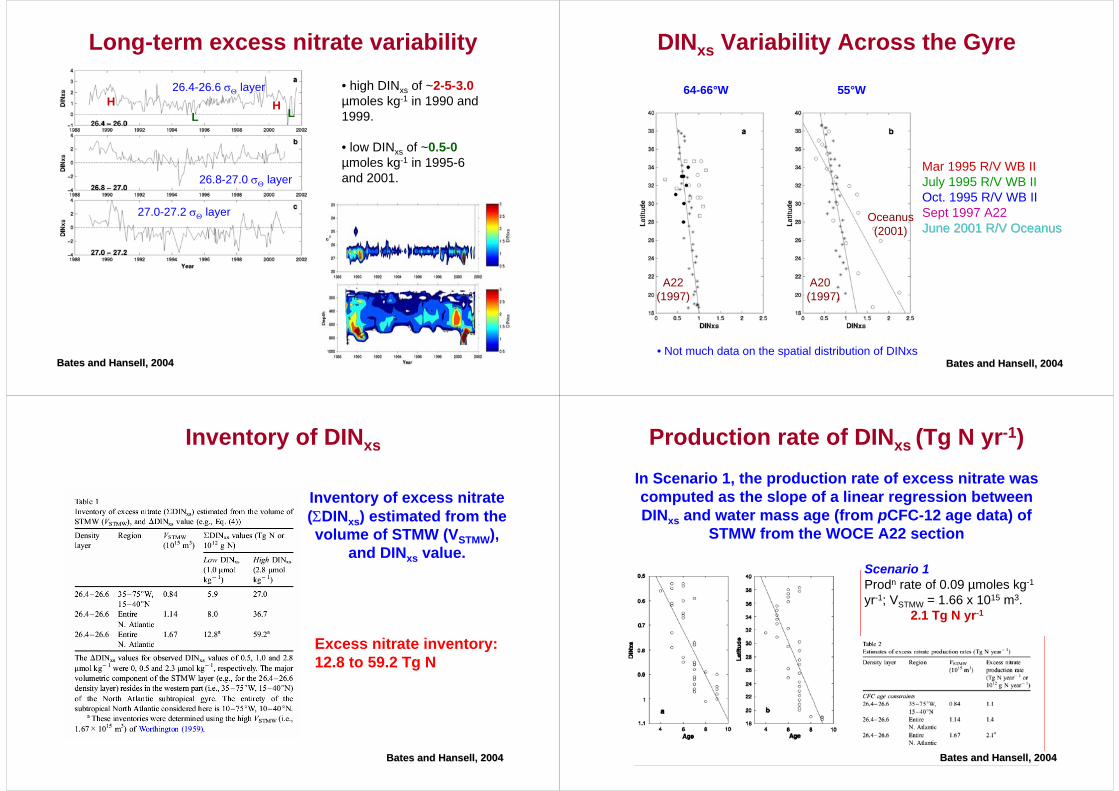
Long-term excess nitrate variability
• low DINxs of ~0.5-0µmoles kg-1 in 1995-6 and 2001.
• high DINxs of ~2-5-3.0µmoles kg-1 in 1990 and 1999.
26.4-26.6 σΘ layer
26.8-27.0 σΘ layer
27.0-27.2 σΘ layer
H HL L
Bates and Hansell, 2004Bates and Hansell, 2004
DINxs Variability Across the Gyre
Mar 1995 R/V WB IIJuly 1995 R/V WB IIOct. 1995 R/V WB IISept 1997 A22June 2001 R/V OceanusJune 2001 R/V Oceanus
55°W64-66°W
A22(1997)
A20(1997)
Oceanus(2001)
• Not much data on the spatial distribution of DINxsBates and Hansell, 2004Bates and Hansell, 2004
Excess nitrate inventory:12.8 to 59.2 Tg N
Inventory of excess nitrate (ΣDINxs) estimated from the volume of STMW (VSTMW),
and DINxs value.
Inventory of DINxs
Bates and Hansell, 2004Bates and Hansell, 2004
In Scenario 1, the production rate of excess nitrate was computed as the slope of a linear regression between DINxs and water mass age (from pCFC-12 age data) of
STMW from the WOCE A22 section
Production rate of DINxs (Tg N yr-1)
Scenario 1Prodn rate of 0.09 µmoles kg-1
yr-1; VSTMW = 1.66 x 10¹⁵ m3.2.1 Tg N yr-1
Bates and Hansell, 2004Bates and Hansell, 2004

Production rate of DINxs (Tg N yr-1)
In Scenario 2, production rate of excess nitrate was computed from DINxs inventory (ΣDINxs) and residence
times (τSTMW of 10 years) for the STMW layer.
DINxs
Scenario 2 τ = 10 yearsVSTMW = 1.66 x 10¹⁵ m3.
DINxs values 1.0 µmoles kg-1 0.6 Tg N yr-1
2.8 µmoles kg-1 2.8 Tg N yr-1
Bates and Hansell, 2004Bates and Hansell, 2004
Michaels et al. (1996), Gruber and Sarmiento (1997) estimates determined from thermocline values for N*; whereas Hansell et al. (2002) and this study determine
the rate of DINxs production per year.
Production rates of DINxs (Tg N yr-1)
Note: In order to compare rates directly with Michaels et al. (1996) and Gruber and Sarmiento (1997), rates of excess nitrate production are divided by a factor of 0.76 (equation 14; Gruber and Sarmiento, 1997).
Bates and Hansell, 2004Bates and Hansell, 2004
1980 1990 2000
20
Nor
th A
tlant
icN
2Fi
xatio
n(T
g o r
1012
g N
yr-1
)
Geochemical Estimates
Hansell et al. 2004
Michaels et al 1996
Gruber & Sarmiento, 1997
10
30
0
Production rates of DINxs (Tg N yr-1)
Bates & Hansell, 2004
Bates and Hansell, 2004Bates and Hansell, 2004
Climate connections: excess nitrate and dust deposition?
NA
ON
AO
NA
O
• higher DINxs and dust inputs to Sargasso Seaduring NAO +ve phase.
• lower DINxs and dust inputs to Sargasso Seaduring NAO-ve phase.
Bates and Hansell, 2004Bates and Hansell, 2004

The NAO, a component of the The NAO, a component of the Arctic Oscillation (AO), is the sea Arctic Oscillation (AO), is the sea level pressure (SLP) difference level pressure (SLP) difference between between Ponta DelgadaPonta Delgada, Azores , Azores and and StykkisholmurStykkisholmur, Iceland , Iceland ((Hurrell Hurrell 1995).1995).
North Atlantic Oscillation (NAO)
Image: D. StephensonImage: D. Stephenson Data Image: T. OsbornData Image: T. Osborn
NAO NAO --ve ve state:state:
•• fewerfewer winterwinterstormsstorms
•• lessless rain rain in N. Europein N. Europe
•• coolercooler in in N. EuropeN. Europe
North Atlantic Oscillation (NAO)
•• coolercoolerin subtropical gyrein subtropical gyre
Data Image: T. OsbornData Image: T. Osborn
NAO + NAO + ve ve state:state:
•• moremore rain rain in N. Europein N. Europe
•• warmerwarmer in in N. EuropeN. Europe
•• moremore winterwinterstormsstorms
North Atlantic Oscillation (NAO)
•• warmerwarmerin subtropical gyrein subtropical gyre
Dust, N2 fixation, DINxs and NAO?r2 = 0.53
r2 = 0.42
r2 = 0.49
NAO +ve Phase NAO -ve Phase
Low Fe (<0.3 µm)
High Fe (>0.5 µm)

Long-term Changes
Bates 2005Bates 2005
•• Mixed layer TCO2 (µmoles kg-1 yr-1)TCO2 +1.20 + 0.35 (r2= 0.36*)nTCO2 +1.19 + 0.25 (r2= 0.37*)DO -0.10 + 0.24 (r2= 0.00)
STMW TCOSTMW TCO22
Surface TCOSurface TCO22
•• STMW TCO2 (µmoles kg-1 yr-1)TCO2/nTCO2 +2.22 + 0.27 (r2= 0.65) DO -0.58 + 0.22 (r2= 0.27)
Interannual Variability of CO2Uptake of anthropogenic CO2
Bates Bates et alet al., 2002., 2002
• Higher winter wind speeds in 1990’s compared to 1980’sGEOSECS data GEOSECS data TTO dataTTO dataKeeling dataKeeling dataBrewer data Brewer data BATS dataBATS data
* ** **
Variability of Carbon Storage?
* ** * *
* Extensive STMW formation Bates Bates et alet al., 2002., 2002
• Higher winter wind speeds in 1990’s compared to 1980’s
• Higher winter wind speeds in 1990’s compared to 1980’s
Mean winter wind speedMean winter wind speed
Mean annual wind speedMean annual wind speed
GEOSECS data GEOSECS data TTO dataTTO dataKeeling dataKeeling dataBrewer data Brewer data BATS dataBATS data
CO2 gas flux at the site of STMW formation should increase STMW by 2-3 µmoles kg-1 yr-1.
Increased Gas Exchange?
Bates Bates et alet al., 2002., 2002

Post 1987: CO2 transferred to ocean interior
1960’s, 1970’s, early 1980’s: CO2 in STMW redistributed
Long-term CO2 sink >10 yearsShort-term CO2 sink ~1-4 years
NAO-ve State NAO+ve State
Bates Bates et alet al., 2002., 2002
• Annual global ocean uptake of CO2 is about 2 Pg C yr-1. • Over the last 12 years, the extra uptake of CO2 into STMW (~ 0.6 to 2.8 Pg C) has the same range as the global annual uptake of CO2. • Since 1988, STMW has taken up (~ 0.05 to 0.23 Pg C yr-1). This is ~3 to 11% of the best estimate of annual uptake of CO2 into the global ocean.
2020°°NN 4040°°NN
3-11% of global CO2 uptake
Conclusions and Implications: A changed oceanic CO2 Sink in 1990’s
• New sources of nitrogen remain unquantified. Implications for the CO2 sink status of the North Atlantic Ocean.
• Excess nitrate within the STMW of the subtropical gyre was highly variable over the 1988-2001 period, with two extended periods of high DINxs values (~2.0-3.0 µmoles kg-1) in 1989-1990, and in 2000.
• Extended periods of low DINxs values (~0-0.5 µmoles kg-1) were observed in 1995, and 2001, with brief low DINxsperiods in 1992 and 1993.
• Production rates of excess nitrate for most of the 1988-2001 period were low (~0.6-2.8 Tg N yr-1).
• Excess nitrate values (~1.5-2.8 µmoles kg-1) and rates of excess nitrate production (~2.8 Tg N yr-1) were generally high during positive phases of the North Atlantic Oscillation (NAO) (e.g., 1989-1994; 1997-2000), and periods of higher atmospheric mineral dust input to the ocean.
Conclusions
Bates and Hansell, 2004Bates and Hansell, 2004
Acknowledgements:
Thanks to:
A.H. Knap, M. Lomas, R.J. Johnson (BBSR)D.A. Hansell (RSMAS)A.F. Michaels (USC)
N. Gruber (UCLA)
Related Documents