TIME RESOLVED PIV ANALYSIS OF FLOW OVER A NACA 0015 AIRFOIL WITH GURNEY FLAP APPLICATION NOTE PIV-014 D. R. Troolin, E.K. Longmire, W. T. Lai D. R. Troolin, W. T. Lai, TSI Incorporated, 500 Cardigan Road, Shoreview, MN 55126, USA E. K. Longmire, Department of Aerospace Engineering and Mechanics, University of Minnesota, Minneapolis, MN 55455, USA Correspondence to: D. R. Troolin, TSI Incorporated, 500 Cardigan Rd., Shoreview, MN 55126, E-mail: [email protected], Tel: 651-490-3885, Fax: 651-490-3824 Abstract A NACA 0015 airfoil with and without a Gurney flap was studied in a wind tunnel with Re c = 2.0 × 10 5 in order to examine the evolving flow structure of the wake through time-resolved PIV and to correlate this structure with time-averaged measurements of the lift coefficient. The Gurney flap, a tab of small length (1% to 4% of the airfoil chord) that protrudes perpendicular to the chord at the trailing edge, yields a significant and relatively constant lift increment through the linear range of the C L vs. α curve. Two distinct vortex shedding modes were found to exist and interact in the wake downstream of flapped airfoils. The dominant mode resembles a Kàrmàn vortex street shedding behind an asymmetric bluff body. The second mode, which was caused by the intermittent shedding of fluid recirculating in the cavity upstream of the flap, becomes more coherent with increasing angle of attack. For a 4% Gurney flap at α = 8°, the first and second modes corresponded with Strouhal numbers based on flap height of 0.18 and 0.13. Comparison of flow around “filled” and “open” flap configurations suggested that the second shedding mode was responsible for a significant portion of the overall lift increment. 1 Introduction Aerodynamic design has seen a rise in the implementation of multifunctional devices and actuators that allow for dramatic changes in performance with only slight variations to the effective surfaces. Although rote airfoil design has essentially yielded its peak in performance, auxiliary mechanisms are being investigated and explored for their potential in making airfoils more functional, especially in demanding environments such as edge-of-the envelope performance, unmanned, light and fast, and high-lift low- speed applications. The Gurney flap, a small tab approximately 1% to 4% of the airfoil chord in length that protrudes typically 90° to the chord at the trailing edge, is one such device. Recently, the flap has been of interest in applications from banner-towing aircraft (see Wynbrandt 2002), to unmanned air vehicles (UAVs) as investigated by Solovitz and Eaton (2004a and b).

Welcome message from author
This document is posted to help you gain knowledge. Please leave a comment to let me know what you think about it! Share it to your friends and learn new things together.
Transcript
TIME RESOLVED PIV ANALYSIS OF FLOW OVER A NACA 0015 AIRFOIL WITH GURNEY FLAP
APPLICATION NOTE PIV-014
D. R. Troolin, E.K. Longmire, W. T. Lai
D. R. Troolin, W. T. Lai, TSI Incorporated, 500 Cardigan Road, Shoreview, MN 55126, USA
E. K. Longmire, Department of Aerospace Engineering and Mechanics, University of Minnesota,
Minneapolis, MN 55455, USA
Correspondence to:
D. R. Troolin, TSI Incorporated, 500 Cardigan Rd., Shoreview, MN 55126, E-mail: [email protected],
Tel: 651-490-3885, Fax: 651-490-3824
Abstract A NACA 0015 airfoil with and without a Gurney flap was studied in a wind tunnel with Rec
= 2.0 × 10⁵ in order to examine the evolving flow structure of the wake through time-resolved PIV and to
correlate this structure with time-averaged measurements of the lift coefficient. The Gurney flap, a tab of
small length (1% to 4% of the airfoil chord) that protrudes perpendicular to the chord at the trailing edge,
yields a significant and relatively constant lift increment through the linear range of the CL vs. α curve.
Two distinct vortex shedding modes were found to exist and interact in the wake downstream of flapped
airfoils. The dominant mode resembles a Kàrmàn vortex street shedding behind an asymmetric bluff
body. The second mode, which was caused by the intermittent shedding of fluid recirculating in the cavity
upstream of the flap, becomes more coherent with increasing angle of attack. For a 4% Gurney flap at α =
8°, the first and second modes corresponded with Strouhal numbers based on flap height of 0.18 and
0.13. Comparison of flow around “filled” and “open” flap configurations suggested that the second
shedding mode was responsible for a significant portion of the overall lift increment.
1 Introduction
Aerodynamic design has seen a rise in the implementation of multifunctional devices and actuators that
allow for dramatic changes in performance with only slight variations to the effective surfaces. Although
rote airfoil design has essentially yielded its peak in performance, auxiliary mechanisms are being
investigated and explored for their potential in making airfoils more functional, especially in demanding
environments such as edge-of-the envelope performance, unmanned, light and fast, and high-lift low-
speed applications. The Gurney flap, a small tab approximately 1% to 4% of the airfoil chord in length that
protrudes typically 90° to the chord at the trailing edge, is one such device. Recently, the flap has been of
interest in applications from banner-towing aircraft (see Wynbrandt 2002), to unmanned air vehicles
(UAVs) as investigated by Solovitz and Eaton (2004a and b).

-2-
Originally used on a racecar in the 1970s by Daniel Gurney, for whom it is named, the flap was first
studied at some length by Liebeck (1978), who first proposed the existence of counter-rotating vortices
downstream of the flap. A subsequent study by Neuhart and Pendergraft (1988) at a Reynolds number of
8588 gave valuable qualitative information on the wake structure through visual observation of dye
streaks. The Gurney flap was found to delay the separation on the suction surface of the airfoil for angles
of attack less than 3.5°. In addition, a configuration in which the upstream cavity of the flap was filled was
tested and found to diminish the “separation delay” benefit of the flap. Wadcock (1987) performed wind
tunnel tests at a Reynolds Number of 1.64 × 10⁶ on a baseline NACA 4412 airfoil. These tests showed a
significant increase in the lift coefficient, shifting the lift curve up by 0.3 for a Gurney flap of 1.25% of the
chord length, and providing a greater maximum lift. There was no appreciable increase in drag until the
Gurney flap was extended beyond about 2% of the airfoil chord length, at which point the flap extended
beyond the boundary layer thickness.
Storms and Jang (1994) used pressure sensors located around the surface of a NACA 4412 airfoil with
Gurney flap to measure lift, drag, and pitching moment. The time-averaged results matched well with their
RANS computations of the same airfoil. They found the Gurney flap to increase lift at all angles of attack.
Jang et al. (1998) presented additional results of RANS computations based on the same airfoil shape
suggesting that increases in lift coefficient resulted from increases in pressure difference along the entire
chord of the airfoil with stronger increases near the flap.
Jeffrey et al. (2000) performed a comprehensive study on flapped airfoils including surface pressure and
LDA measurements and flow visualization. The time-averaged velocity fields revealed a pair of counter-
rotating vortices downstream of the flap consistent with earlier hypotheses by Liebeck and the RANS
results of Jang et al. Spectra from the LDA measurements and smoke visualizations documented the
presence of a Karman vortex street. The authors attributed the increase in lift caused by the flap to two
causes: periodic vortex shedding downstream of the flap served to increase the trailing-edge suction of
the airfoil, and the deceleration of the flow directly upstream of the flap contributed to a pressure
difference acting across the trailing-edge. Time- and phase-averaged PIV analysis by Solovitz and Eaton
(2004a and b) was used to gather additional information on the flow pattern around static and
dynamically-actuated Gurney flaps.
This study quantifies the effects of a Gurney flap on a NACA 0015 airfoil through time-averaged force
measurements, hot film anemometry, and time-resolved particle image velocimetry (TRPIV). Although it is
well known that the flaps yield increased lift forces, the mechanisms behind the increases are still not well
understood. TRPIV allows investigation of details of flow patterns that are not easily observed or
quantified by other measurement techniques. In particular, TRPIV can be used to examine evolving flow
fields in order to observe variations not associated with a “standard” vortex street. As will be described
below, an additional shedding mode associated with the recirculation zone upstream of the flap appears
to contribute significantly to the overall airfoil lift.
2 Experimental Apparatus and Methods
The experiments were conducted in the University of Minnesota Department of Aerospace Engineering
Open Return Wind Tunnel which is blower driven. The test section was 0.6 m × 0.6 m. Hot-film
anemometry measurements revealed a freestream turbulence intensity of less than 0.25%. Each airfoil
section had a span (b) of 304.8 mm and a chord length (c) of 190.5 mm, resulting in an aspect ratio A =
1.6. The airfoils and flap attachments were fabricated in a rapid-prototype machine at the University of
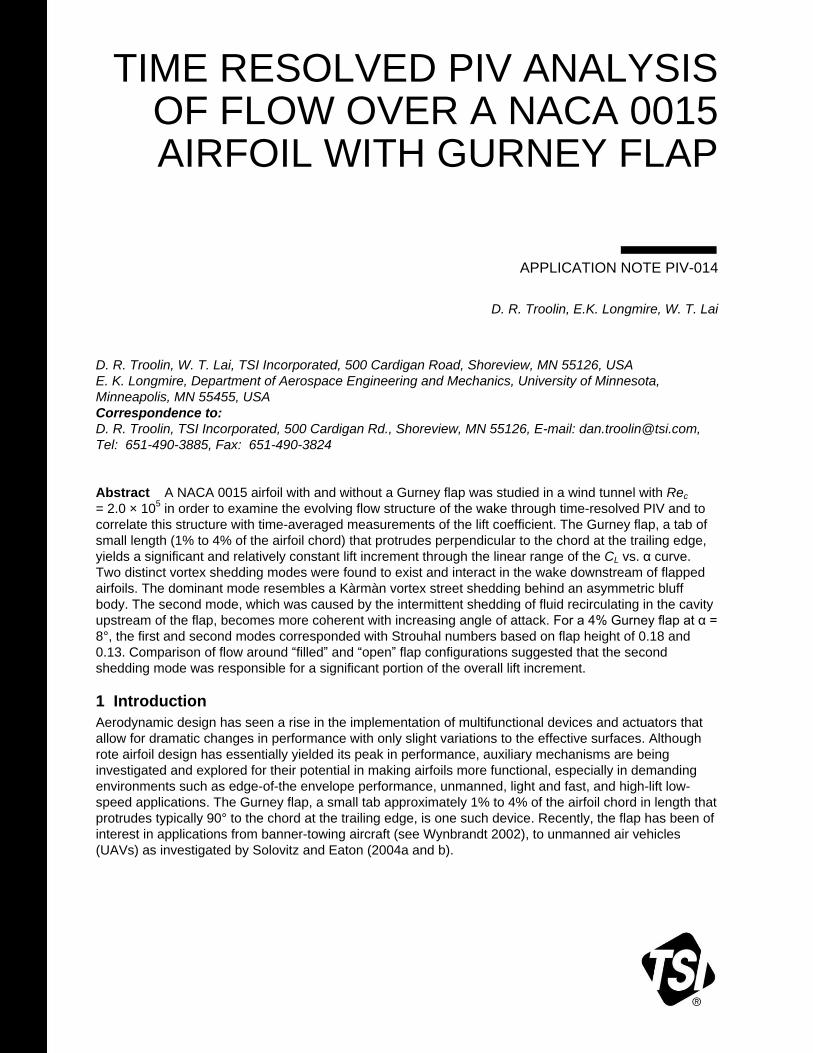
Minnesota Department of Aerospace Engineering and Mechanics. In the wind tunnel, the airfoil was
mounted to a flat, circular plate and then to a sting, as shown in Figure 1, which entered the tunnel from
the side so that it was horizontal and perpendicular to the freestream flow direction. In addition, the sting
was capable of rotating, so that various angles of attack could be set with an accuracy of
approximately 0.2°.
-3-
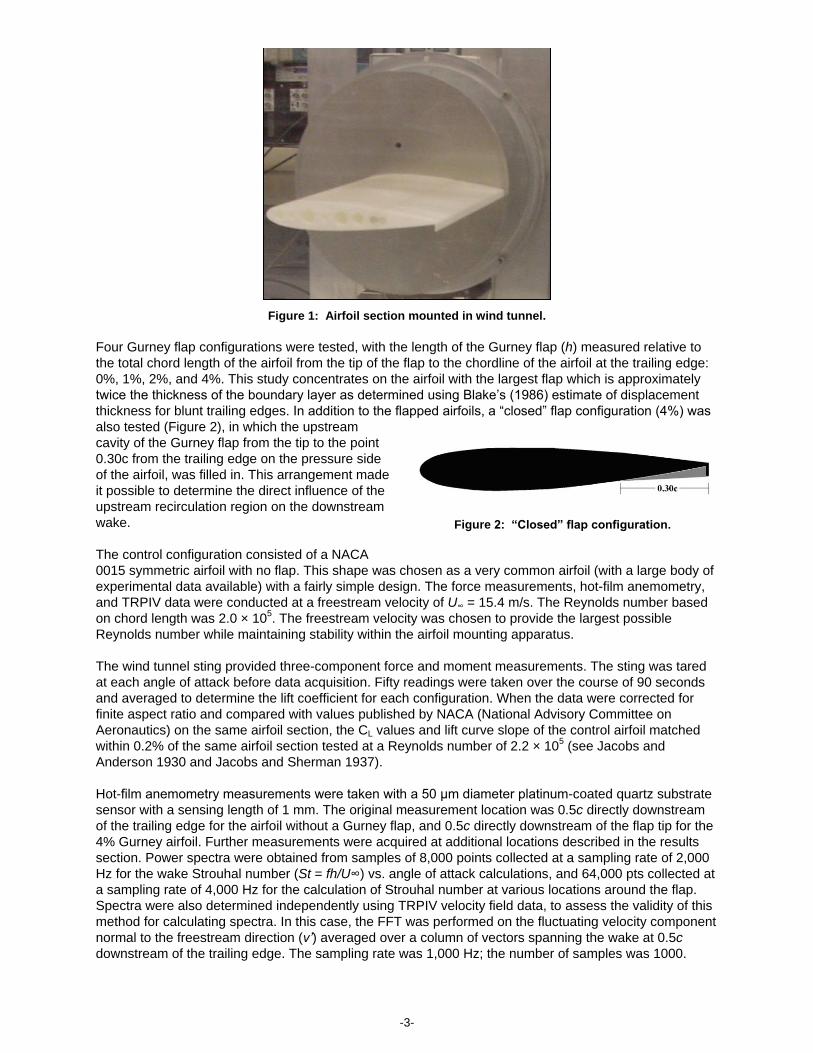
Figure 2: “Closed” flap configuration.
Figure 1: Airfoil section mounted in wind tunnel.
Four Gurney flap configurations were tested, with the length of the Gurney flap (h) measured relative to
the total chord length of the airfoil from the tip of the flap to the chordline of the airfoil at the trailing edge:
0%, 1%, 2%, and 4%. This study concentrates on the airfoil with the largest flap which is approximately
twice the thickness of the boundary layer as determined using Blake’s (1986) estimate of displacement
thickness for blunt trailing edges. In addition to the flapped airfoils, a “closed” flap configuration (4%) was
also tested (Figure 2), in which the upstream
cavity of the Gurney flap from the tip to the point
0.30c from the trailing edge on the pressure side
of the airfoil, was filled in. This arrangement made
it possible to determine the direct influence of the
upstream recirculation region on the downstream
wake.
The control configuration consisted of a NACA
0015 symmetric airfoil with no flap. This shape was chosen as a very common airfoil (with a large body of
experimental data available) with a fairly simple design. The force measurements, hot-film anemometry,
and TRPIV data were conducted at a freestream velocity of U∞ = 15.4 m/s. The Reynolds number based
on chord length was 2.0 × 10⁵. The freestream velocity was chosen to provide the largest possible
Reynolds number while maintaining stability within the airfoil mounting apparatus.
The wind tunnel sting provided three-component force and moment measurements. The sting was tared
at each angle of attack before data acquisition. Fifty readings were taken over the course of 90 seconds
and averaged to determine the lift coefficient for each configuration. When the data were corrected for
finite aspect ratio and compared with values published by NACA (National Advisory Committee on
Aeronautics) on the same airfoil section, the CL values and lift curve slope of the control airfoil matched
within 0.2% of the same airfoil section tested at a Reynolds number of 2.2 × 10⁵ (see Jacobs and
Anderson 1930 and Jacobs and Sherman 1937).
Hot-film anemometry measurements were taken with a 50 μm diameter platinum-coated quartz substrate
sensor with a sensing length of 1 mm. The original measurement location was 0.5c directly downstream
of the trailing edge for the airfoil without a Gurney flap, and 0.5c directly downstream of the flap tip for the
4% Gurney airfoil. Further measurements were acquired at additional locations described in the results
section. Power spectra were obtained from samples of 8,000 points collected at a sampling rate of 2,000
Hz for the wake Strouhal number (St = fh/U∞) vs. angle of attack calculations, and 64,000 pts collected at
a sampling rate of 4,000 Hz for the calculation of Strouhal number at various locations around the flap.
Spectra were also determined independently using TRPIV velocity field data, to assess the validity of this
method for calculating spectra. In this case, the FFT was performed on the fluctuating velocity component
normal to the freestream direction (v’) averaged over a column of vectors spanning the wake at 0.5c
downstream of the trailing edge. The sampling rate was 1,000 Hz; the number of samples was 1000.

-4-
TRPIV is a simple extension of the standard PIV technique described well by Adrian (1991) whereby
images are acquired at a faster rate. For this experiment, images were acquired at approximately the
center of the wind tunnel span and center of the airfoil section, with the goal of minimizing 3-D effects
occurring near the wingtip. In addition, measurements were made in two configurations. The first was with
the laser light sheet entering from the exit of the tunnel, and the second with the light sheet entering the
tunnel from above, with the camera mounted on the side of the tunnel in both cases, as seen in Figure 3.
The data from the second configuration was inverted in the subsequent plots for purposes of comparison.
These two configurations allowed velocity information to be gleaned from the area directly downstream of
the Gurney flap, as well as from the cavity directly upstream of the flap.
Figure 3: Schematic of the experimental setup in the wind tunnel.
Upper two Figures show configuration one; lower two Figures show configuration two.
Two 25 W diode-pumped Nd:YLF lasers emitted light of wavelength 527 nm with pulse width of 135 ns,
beam diameter of 1.5 mm, and divergence of 3 mrad. The two beams were combined to travel on co-
linear paths. Coplanar light sheets were generated with a cylindrical lens to diverge the incident laser
beams in one direction; the divergence was controlled by the focal length of the lens which was -25 mm.
A spherical lens controlled the thickness of the sheet by focusing it in the direction normal to the plane of
the sheet. At the measurement region, the thickness was approximately 1 mm. Each laser could be
operated over a range of pulsing frequencies with the energy per pulse decreasing as the pulse
frequency increased. At 1000 Hz, the energy per pulse was 10 mJ, and at 4000 Hz the energy per pulse
was 4 mJ.
Digital image sequences were acquired from a 10-bit CMOS high speed camera at rates of 2000 frames
per second, 4000 frames per second, and 8000 frames per second, which correspond to velocity field
capture rates of 1000 Hz, 2000 Hz, and 4000 Hz, respectively. The pixel size was 9 microns. In this
paper, we concentrate primarily on the data captured at 2000 frames per second with camera resolution
of 1024 by 1024 pixels, and on data captured at 4000 frames per second with pixel resolution of 1024 by
512 pixels (Some of the data were captured at 8000 frames per second with pixel resolution of 1024 by
256, but only every second field is shown for purposes of clarity). Higher frequencies were attempted, but
the laser illumination energy was too low to produce meaningful results. A 50 mm lens was used with a
largest aperture setting of f#1.4. The full field of view ranged from (123 mm)2 to (141 mm)
2 depending on
the distance to the measurement region which changed slightly for the various flap configurations. Olive
oil atomized with an array of six Laskin nozzles was used to seed the flow providing droplets with a mean
diameter between 1 μm and 3 μm.
-5-
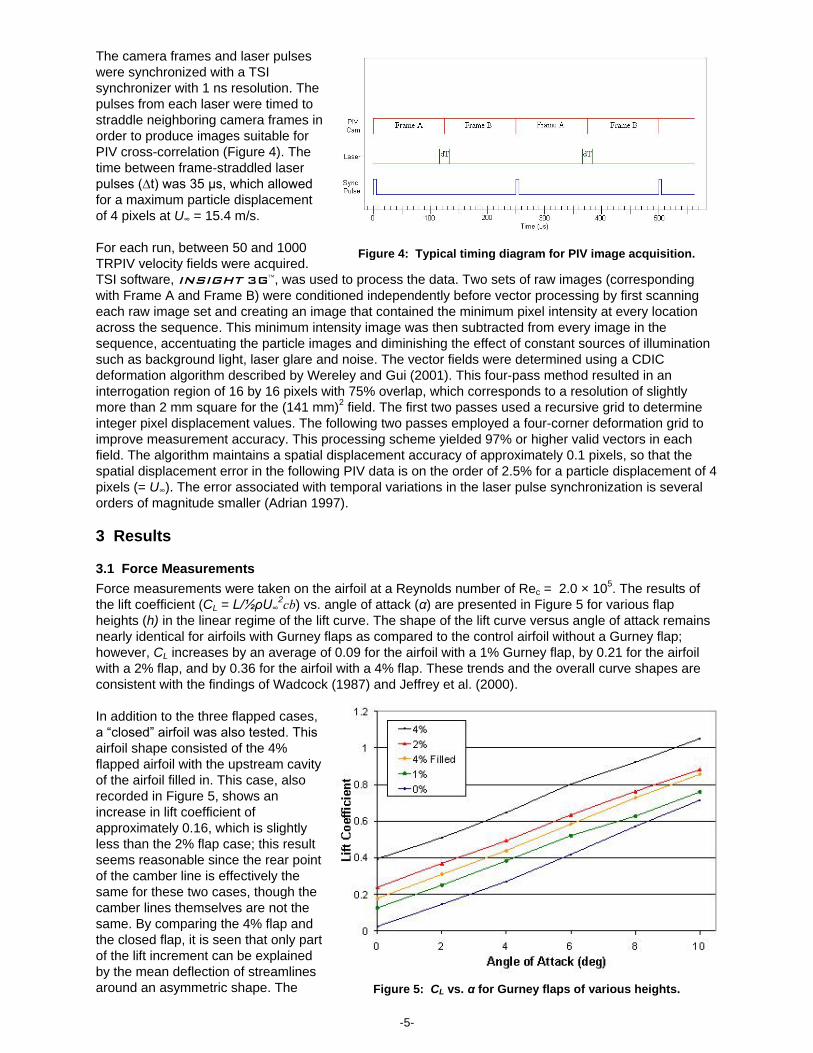
Figure 4: Typical timing diagram for PIV image acquisition.
Figure 5: CL vs. α for Gurney flaps of various heights.
The camera frames and laser pulses
were synchronized with a TSI
synchronizer with 1 ns resolution. The
pulses from each laser were timed to
straddle neighboring camera frames in
order to produce images suitable for
PIV cross-correlation (Figure 4). The
time between frame-straddled laser
pulses (∆t) was 35 μs, which allowed
for a maximum particle displacement
of 4 pixels at U∞ = 15.4 m/s.
For each run, between 50 and 1000
TRPIV velocity fields were acquired.
TSI software, INSIGHT 3G, was used to process the data. Two sets of raw images (corresponding
with Frame A and Frame B) were conditioned independently before vector processing by first scanning
each raw image set and creating an image that contained the minimum pixel intensity at every location
across the sequence. This minimum intensity image was then subtracted from every image in the
sequence, accentuating the particle images and diminishing the effect of constant sources of illumination
such as background light, laser glare and noise. The vector fields were determined using a CDIC
deformation algorithm described by Wereley and Gui (2001). This four-pass method resulted in an
interrogation region of 16 by 16 pixels with 75% overlap, which corresponds to a resolution of slightly
more than 2 mm square for the (141 mm)2 field. The first two passes used a recursive grid to determine
integer pixel displacement values. The following two passes employed a four-corner deformation grid to
improve measurement accuracy. This processing scheme yielded 97% or higher valid vectors in each
field. The algorithm maintains a spatial displacement accuracy of approximately 0.1 pixels, so that the
spatial displacement error in the following PIV data is on the order of 2.5% for a particle displacement of 4
pixels (= U∞). The error associated with temporal variations in the laser pulse synchronization is several
orders of magnitude smaller (Adrian 1997).
3 Results
3.1 Force Measurements
Force measurements were taken on the airfoil at a Reynolds number of Rec = 2.0 × 10⁵. The results of
the lift coefficient (CL = L/½ρU∞2cb) vs. angle of attack (α) are presented in Figure 5 for various flap
heights (h) in the linear regime of the lift curve. The shape of the lift curve versus angle of attack remains
nearly identical for airfoils with Gurney flaps as compared to the control airfoil without a Gurney flap;
however, CL increases by an average of 0.09 for the airfoil with a 1% Gurney flap, by 0.21 for the airfoil
with a 2% flap, and by 0.36 for the airfoil with a 4% flap. These trends and the overall curve shapes are
consistent with the findings of Wadcock (1987) and Jeffrey et al. (2000).
In addition to the three flapped cases,
a “closed” airfoil was also tested. This
airfoil shape consisted of the 4%
flapped airfoil with the upstream cavity
of the airfoil filled in. This case, also
recorded in Figure 5, shows an
increase in lift coefficient of
approximately 0.16, which is slightly
less than the 2% flap case; this result
seems reasonable since the rear point
of the camber line is effectively the
same for these two cases, though the
camber lines themselves are not the
same. By comparing the 4% flap and
the closed flap, it is seen that only part
of the lift increment can be explained
by the mean deflection of streamlines
around an asymmetric shape. The
-6-
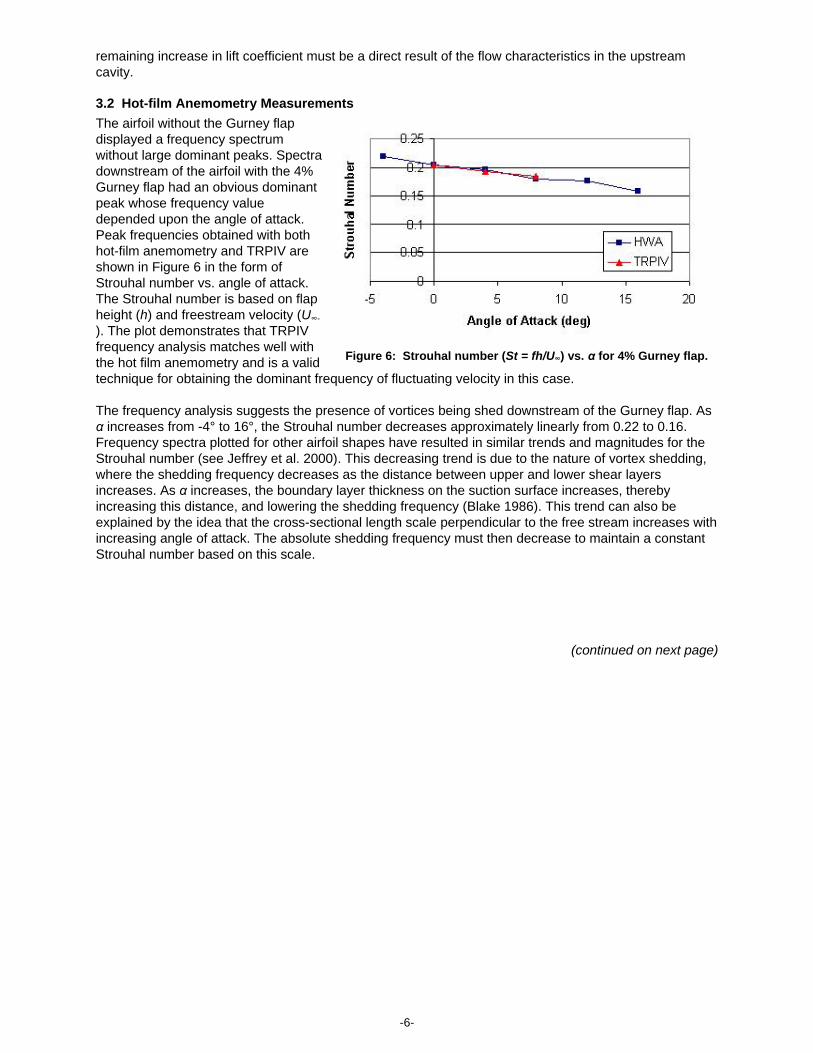
Figure 6: Strouhal number (St = fh/U∞) vs. α for 4% Gurney flap.
remaining increase in lift coefficient must be a direct result of the flow characteristics in the upstream
cavity.
3.2 Hot-film Anemometry Measurements
The airfoil without the Gurney flap
displayed a frequency spectrum
without large dominant peaks. Spectra
downstream of the airfoil with the 4%
Gurney flap had an obvious dominant
peak whose frequency value
depended upon the angle of attack.
Peak frequencies obtained with both
hot-film anemometry and TRPIV are
shown in Figure 6 in the form of
Strouhal number vs. angle of attack.
The Strouhal number is based on flap
height (h) and freestream velocity (U∞-
). The plot demonstrates that TRPIV
frequency analysis matches well with
the hot film anemometry and is a valid
technique for obtaining the dominant frequency of fluctuating velocity in this case.
The frequency analysis suggests the presence of vortices being shed downstream of the Gurney flap. As
α increases from -4° to 16°, the Strouhal number decreases approximately linearly from 0.22 to 0.16.
Frequency spectra plotted for other airfoil shapes have resulted in similar trends and magnitudes for the
Strouhal number (see Jeffrey et al. 2000). This decreasing trend is due to the nature of vortex shedding,
where the shedding frequency decreases as the distance between upper and lower shear layers
increases. As α increases, the boundary layer thickness on the suction surface increases, thereby
increasing this distance, and lowering the shedding frequency (Blake 1986). This trend can also be
explained by the idea that the cross-sectional length scale perpendicular to the free stream increases with
increasing angle of attack. The absolute shedding frequency must then decrease to maintain a constant
Strouhal number based on this scale.
(continued on next page)

-7-
3.3 Ensemble-Averaged PIV Measurements
The time-averaged velocity
magnitude field with streamlines can
be seen in Figure 7 for a 4% Gurney
flap at α = 0°, 4°, 8°, and 12°. Fifty
consecutive fields, corresponding
with approximately 18 cycles of
vortex shedding, were averaged,
and the results are normalized by
the freestream velocity U∞.
The plots show that the area of
decreased velocity directly
downstream of the Gurney flap
increases in length as the angle of
attack increases. At α = 0°, the zone
of strongly reduced velocity
(depicted as blue) is compact, and
the higher speed flows on either
side of the airfoil recover fairly
quickly after the separation behind
the flap. This recovery takes longer
spatially as α is increased. Note also
that the wake (or zone of reduced
velocity) is turned downward as α
increases. The streamlines are also
turned downward with increasing α
as expected from the lift
measurements. The “average”
separated region depicted by the
streamlines shows a relatively
symmetric vortex pair at α = 0° that
becomes increasingly asymmetric
as α is increased. At α = 12°, a
negative vortex dominates the area
directly downstream of the Gurney,
while a more compact, positive
vortex has been shifted
downstream. These results agree
well with the time-averaged velocity
fields determined by Jeffrey et al.
(2000) and others (see Jang et al. 1998 and Solovitz and Eaton 2004a and b).
3.4 Time-Resolved PIV Measurements
Vortex shedding occurs downstream of trailing edges that support separating shear layers, and the
resulting interaction forms the well-known Kármán vortex street. The Gurney flap acts as a bluff body that
produces vortex shedding, but its asymmetry yields asymmetries in the wake pattern. Of particular
interest in this study was the nature and path of the vortices as they formed and convected downstream.
TRPIV sequences of vorticity and streamwise velocity are shown in Figures 8 and 9 (for α = 0° and
α = 8°). Each plot is assigned a phase according to the dominant Strouhal number for that angle of attack;
specifically, the dominant spectral frequency is divided by the PIV capture rate and shown in terms of
percent of one complete shedding sequence. The 0% phase is chosen to coincide with the formation of a
vortex, so that the evolution of the vortex can be seen easily in the subsequent plots. The plots reveal
strips of spanwise vorticity (ω) with negative and positive sign that are shed from the upper airfoil surface
and Gurney flap tip respectively. In Figure 8 (α = 0°), the negative vorticity shed from the upper surface
remains focused in the form of a strip that is pulled downward into the flap wake. The positive vorticity
shed from the flap tip is spread initially over a larger length scale across the wake and shows greater
Figure 7: Time-averaged velocity magnitude for 4% Gurney flap
with α = 0°, 4°, 8° and 12°, respectively.

-8-
intermittency in the streamwise direction. Downstream of the trailing edge, the wake develops into an
asymmetric Kármán vortex street pattern. The areas of negative vorticity appear more focused than the
areas of positive vorticity. The wake also exhibits a net downward flow direction which is expected given
the positive lift coefficient for this configuration. The wake asymmetry can be explained partially by the
differences in flow direction at the airfoil trailing edge and the flap tip. The presence of the flap generates
a local separation upstream so that the streamlines are diverted downward compared with the “no flap”
configuration. The measurement of CL for the closed flap configuration suggests that this is only part of
the reason behind the asymmetry.
Figure 8: Normalized vorticity (ωc/U∞) (left), and normalized streamwise velocity (u/U∞) (right) downstream of
the 4% Gurney flap on a NACA 0015 airfoil at α = 0°. Phase values on the left indicate the percentage of one
complete shedding cycle. The velocity field capture rate was 1000 Hz (2000 fps).
The plots of normalized streamwise velocity (u/U∞) indicate strong oscillations in magnitude consistent
with the presence of a vortex street. In contrast to the time-averaged plot, zones of very low streamwise
velocity (shown as cyan) persist downstream to the limit of the field of view. Note the slow moving zone in
the bottom right corner of the last plot in the sequence, and also that a very fast moving zone lies
immediately above it. This juxtaposition corresponds directly with a compact zone of strong negative
vorticity (blue in left sequence) that has traversed across the field. A juxtaposition of opposite sense (cyan
lying above dark red) is associated with positive vorticity (red in left plots) that also traverses the field.
Though this “vortex” appears to have a similar order of circulation, the magnitude is approximately 14%
smaller than the negative vortex bundle. This vortex drops vertically out of the field of view due to the
wake asymmetry. One final point is that the velocity magnitude immediately below the flap tip varies
significantly indicating intermittent shedding of fluid from the separated zone upstream of the flap.
-9-
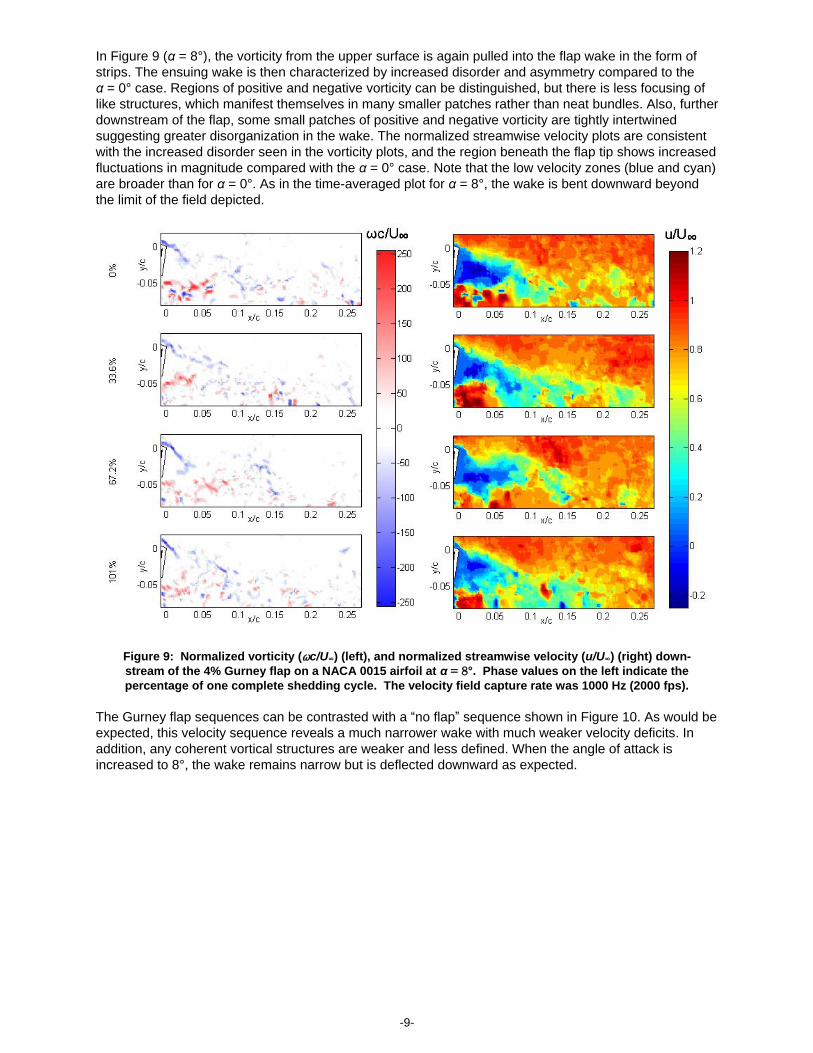
In Figure 9 (α = 8°), the vorticity from the upper surface is again pulled into the flap wake in the form of
strips. The ensuing wake is then characterized by increased disorder and asymmetry compared to the
α = 0° case. Regions of positive and negative vorticity can be distinguished, but there is less focusing of
like structures, which manifest themselves in many smaller patches rather than neat bundles. Also, further
downstream of the flap, some small patches of positive and negative vorticity are tightly intertwined
suggesting greater disorganization in the wake. The normalized streamwise velocity plots are consistent
with the increased disorder seen in the vorticity plots, and the region beneath the flap tip shows increased
fluctuations in magnitude compared with the α = 0° case. Note that the low velocity zones (blue and cyan)
are broader than for α = 0°. As in the time-averaged plot for α = 8°, the wake is bent downward beyond
the limit of the field depicted.
Figure 9: Normalized vorticity (ωc/U∞) (left), and normalized streamwise velocity (u/U∞) (right) down-
stream of the 4% Gurney flap on a NACA 0015 airfoil at α = 8°. Phase values on the left indicate the
percentage of one complete shedding cycle. The velocity field capture rate was 1000 Hz (2000 fps).
The Gurney flap sequences can be contrasted with a “no flap” sequence shown in Figure 10. As would be
expected, this velocity sequence reveals a much narrower wake with much weaker velocity deficits. In
addition, any coherent vortical structures are weaker and less defined. When the angle of attack is
increased to 8°, the wake remains narrow but is deflected downward as expected.

-10-
Figure 10: TRPIV sequence captured at 2000 Hz (4000 fps) for the control airfoil with no Gurney flap
at α = 0°. Column on the left shows normalized vorticity (ωc/U∞), while the column on the right
shows normalized streamwise velocity (u/U∞). Phase values are not included as this configuration
does not have a dominant shedding frequency.
TRPIV data taken with the laser sheet directed through the top of the wind tunnel allowed the cavity
upstream of the Gurney flap to be examined. In this case, the flapped airfoils were inverted compared
with those in the previous studies. For ease of comparison with the previous results, the plots in this
section have been inverted to match the previous geometries.
Figures 11 and 12 exhibit the 2D swirl strength and the normal velocity (component perpendicular to the
streamwise velocity) around the tip of the Gurney flap for α = 0° and α = 8°. Two-dimensional swirl is a
quantity used to identify vortex cores with significant strength, and orientation normal to the measurement
plane. Specifically, it distinguishes fluid swirling about an axis from fluid rotation caused by a shear layer.
If the discriminant of the characteristic equation of the two-dimensional velocity gradient tensor is less
than zero, then the 2D swirl strength is defined as the imaginary part of its complex root (see Adrian et al.
2000). The swirl is normalized by the freestream velocity and the chord length. Also, the swirl (a positive
scalar quantity) is given a sign indicating the direction of the corresponding vorticity. The phase values
shown to the left of each plot were calculated based on the Strouhal number determined in the hot film
anemometry and TRPIV frequency measurements. The swirl strength plots show distinct alternating
positive and negative vortex cores being generated asymmetrically downstream of the flap, with a positive
streamwise and negative normal velocity trajectory. Significant swirl zones are not apparent upstream of
the flap, most likely because the fluid there does not rotate about a single axis.

-11-
For the α = 0° case (Figure 11), the 0% phase plot shows a positive vortex core forming on the
downstream edge of the Gurney flap tip. The core then moves downstream and slightly downward in the
subsequent phases. Approximately half way through the cycle, a negative vortex core is seen separating
from the upper surface, and continuing downstream and slightly downward in the airfoil wake. The normal
velocity plot (right column) reveals large upflow and downflow zones associated with the vortices. Note
the intermittent downwash immediately upstream of the Gurney flap.
Figure 11: One full primary vortex shedding sequence for the case of a 4% Gurney flap at α = 0°
captured at 4000 Hz (8000 fps), every other frame is shown. The phase values to the left of each plot
represent the percentage of one complete vortex shedding sequence. The plots display the
normalized 2D swirl strength (left) and the normalized normal velocity (v/U∞) (right).
Figure 12 plots the α = 8° case. The same general structure can be seen in terms of the vortex shedding;
however, consistent with the previous vorticity plots (Figure 8), the ensuing wake is less organized, as
can be seen by the red counterclockwise cores that are distributed over a larger spatial area for α = 8°.
Also, the shapes of the upwash and downwash zones appear similar, but the local velocity magnitudes
are somewhat weaker.

-12-
Figure 12: One full primary vortex shedding sequence for the case of a 4% Gurney flap at α = 8°
captured at 4000 Hz (8000 fps), every other frame is shown. The phase values to the left of each plot
represent the percentage of one complete vortex shedding sequence. The plots display the
normalized 2D swirl strength (left) and the normalized normal velocity (v/U∞) (right).
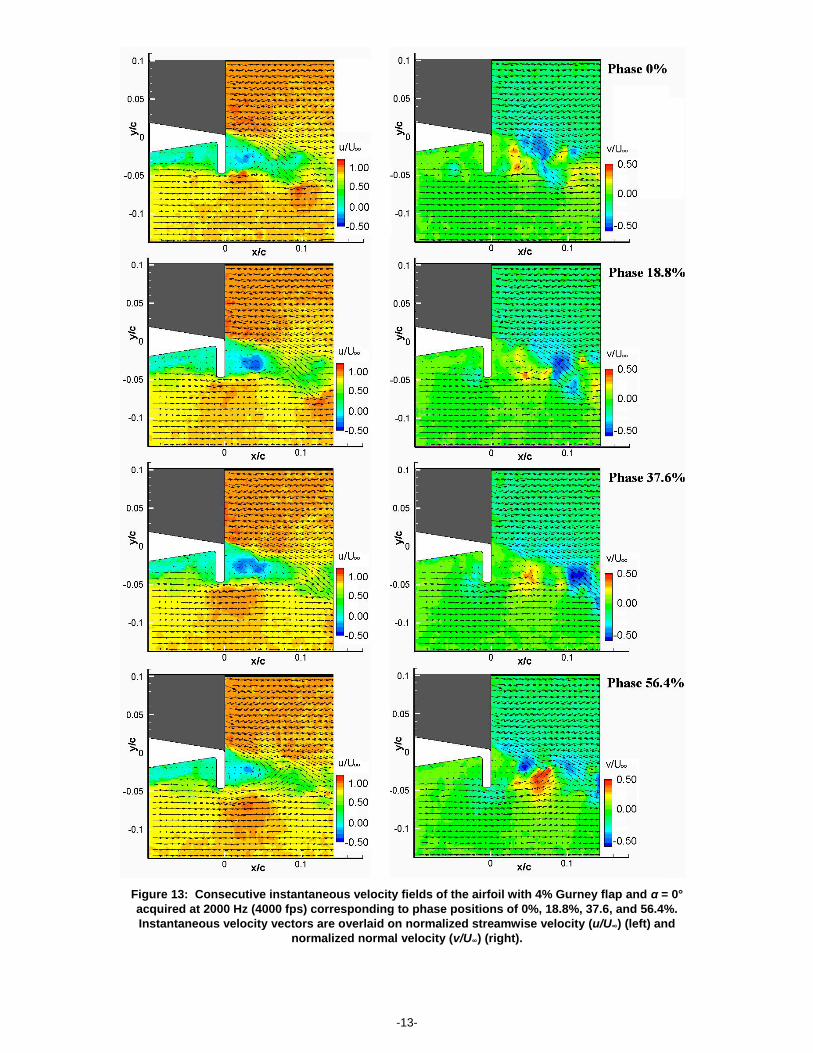
Careful studies of the time-resolved movies of streamwise and normal velocity show that the asymmetry
of the vortex street is due at least partially to the presence of two shedding modes off of the flap tip. A
representative sequence for α = 0° is shown in Figure 13. In the cavity upstream of the flap tip, fluid
recirculates. Periodically, some of this fluid is ejected below the flap tip (see the vectors in the last two
phases shown). This process generates a local surge in streamwise velocity with some downward
orientation.
-13-
Figure 13: Consecutive instantaneous velocity fields of the airfoil with 4% Gurney flap and α = 0°
acquired at 2000 Hz (4000 fps) corresponding to phase positions of 0%, 18.8%, 37.6, and 56.4%.
Instantaneous velocity vectors are overlaid on normalized streamwise velocity (u/U∞) (left) and
normalized normal velocity (v/U∞) (right).
-14-
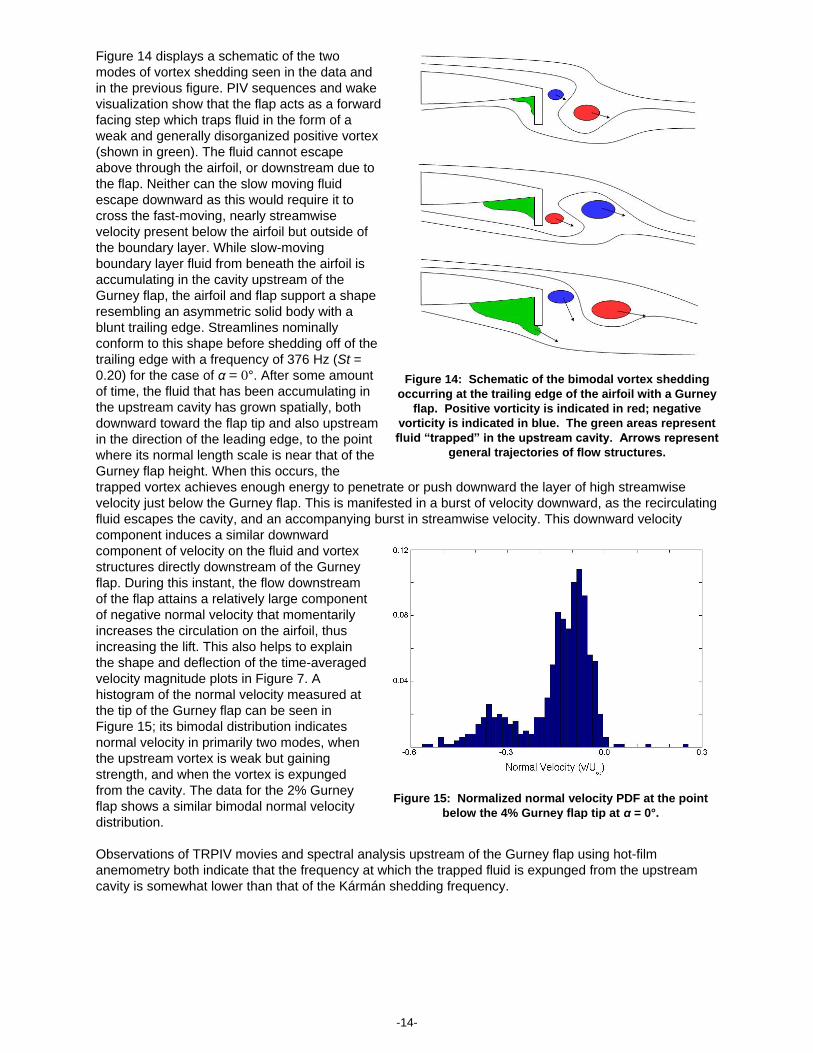
Figure 14: Schematic of the bimodal vortex shedding
occurring at the trailing edge of the airfoil with a Gurney
flap. Positive vorticity is indicated in red; negative
vorticity is indicated in blue. The green areas represent
fluid “trapped” in the upstream cavity. Arrows represent
general trajectories of flow structures.
Figure 15: Normalized normal velocity PDF at the point
below the 4% Gurney flap tip at α = 0°.
Figure 14 displays a schematic of the two
modes of vortex shedding seen in the data and
in the previous figure. PIV sequences and wake
visualization show that the flap acts as a forward
facing step which traps fluid in the form of a
weak and generally disorganized positive vortex
(shown in green). The fluid cannot escape
above through the airfoil, or downstream due to
the flap. Neither can the slow moving fluid
escape downward as this would require it to
cross the fast-moving, nearly streamwise
velocity present below the airfoil but outside of
the boundary layer. While slow-moving
boundary layer fluid from beneath the airfoil is
accumulating in the cavity upstream of the
Gurney flap, the airfoil and flap support a shape
resembling an asymmetric solid body with a
blunt trailing edge. Streamlines nominally
conform to this shape before shedding off of the
trailing edge with a frequency of 376 Hz (St =
0.20) for the case of α = 0°. After some amount
of time, the fluid that has been accumulating in
the upstream cavity has grown spatially, both
downward toward the flap tip and also upstream
in the direction of the leading edge, to the point
where its normal length scale is near that of the
Gurney flap height. When this occurs, the
trapped vortex achieves enough energy to penetrate or push downward the layer of high streamwise
velocity just below the Gurney flap. This is manifested in a burst of velocity downward, as the recirculating
fluid escapes the cavity, and an accompanying burst in streamwise velocity. This downward velocity
component induces a similar downward
component of velocity on the fluid and vortex
structures directly downstream of the Gurney
flap. During this instant, the flow downstream
of the flap attains a relatively large component
of negative normal velocity that momentarily
increases the circulation on the airfoil, thus
increasing the lift. This also helps to explain
the shape and deflection of the time-averaged
velocity magnitude plots in Figure 7. A
histogram of the normal velocity measured at
the tip of the Gurney flap can be seen in
Figure 15; its bimodal distribution indicates
normal velocity in primarily two modes, when
the upstream vortex is weak but gaining
strength, and when the vortex is expunged
from the cavity. The data for the 2% Gurney
flap shows a similar bimodal normal velocity
distribution.
Observations of TRPIV movies and spectral analysis upstream of the Gurney flap using hot-film
anemometry both indicate that the frequency at which the trapped fluid is expunged from the upstream
cavity is somewhat lower than that of the Kármán shedding frequency.
-15-
Figure 17: Peak Strouhal numbers (St = fh/U∞) observed
from hot-film spectra at various locations.
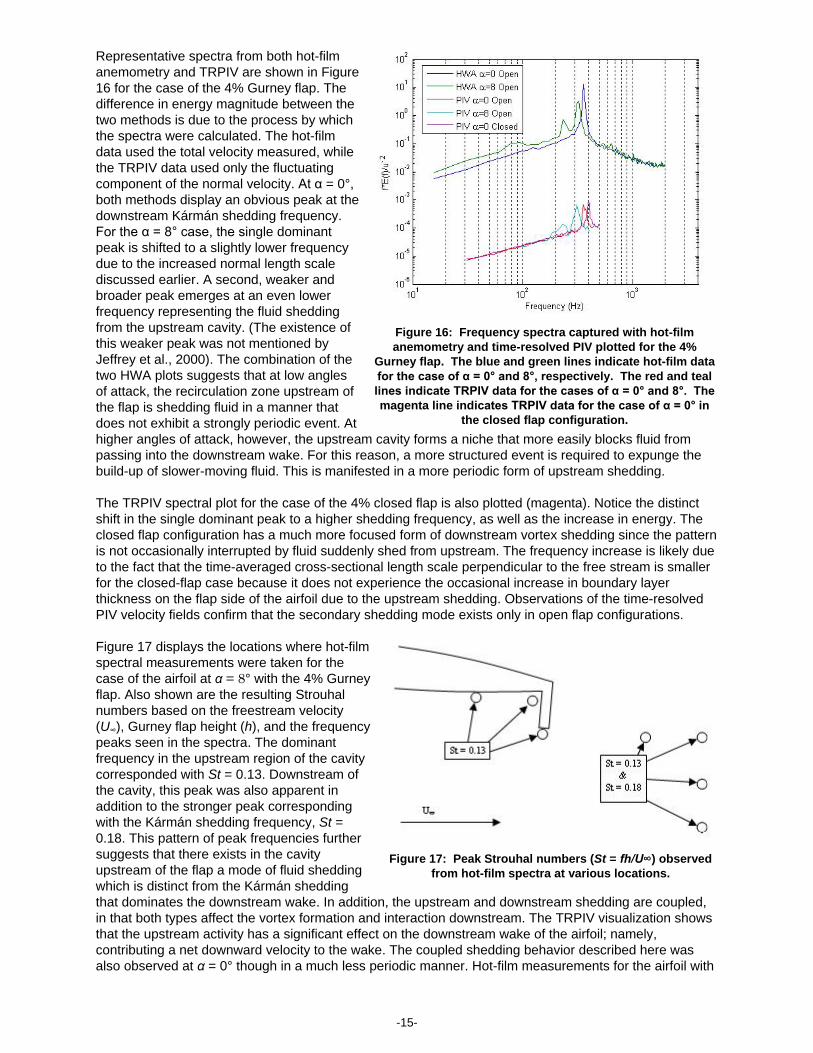
Figure 16: Frequency spectra captured with hot-film
anemometry and time-resolved PIV plotted for the 4%
Gurney flap. The blue and green lines indicate hot-film data
for the case of α = 0° and 8°, respectively. The red and teal
lines indicate TRPIV data for the cases of α = 0° and 8°. The
magenta line indicates TRPIV data for the case of α = 0° in
the closed flap configuration.
Representative spectra from both hot-film
anemometry and TRPIV are shown in Figure
16 for the case of the 4% Gurney flap. The
difference in energy magnitude between the
two methods is due to the process by which
the spectra were calculated. The hot-film
data used the total velocity measured, while
the TRPIV data used only the fluctuating
component of the normal velocity. At α = 0°,
both methods display an obvious peak at the
downstream Kármán shedding frequency.
For the α = 8° case, the single dominant
peak is shifted to a slightly lower frequency
due to the increased normal length scale
discussed earlier. A second, weaker and
broader peak emerges at an even lower
frequency representing the fluid shedding
from the upstream cavity. (The existence of
this weaker peak was not mentioned by
Jeffrey et al., 2000). The combination of the
two HWA plots suggests that at low angles
of attack, the recirculation zone upstream of
the flap is shedding fluid in a manner that
does not exhibit a strongly periodic event. At
higher angles of attack, however, the upstream cavity forms a niche that more easily blocks fluid from
passing into the downstream wake. For this reason, a more structured event is required to expunge the
build-up of slower-moving fluid. This is manifested in a more periodic form of upstream shedding.
The TRPIV spectral plot for the case of the 4% closed flap is also plotted (magenta). Notice the distinct
shift in the single dominant peak to a higher shedding frequency, as well as the increase in energy. The
closed flap configuration has a much more focused form of downstream vortex shedding since the pattern
is not occasionally interrupted by fluid suddenly shed from upstream. The frequency increase is likely due
to the fact that the time-averaged cross-sectional length scale perpendicular to the free stream is smaller
for the closed-flap case because it does not experience the occasional increase in boundary layer
thickness on the flap side of the airfoil due to the upstream shedding. Observations of the time-resolved
PIV velocity fields confirm that the secondary shedding mode exists only in open flap configurations.
Figure 17 displays the locations where hot-film
spectral measurements were taken for the
case of the airfoil at α = 8° with the 4% Gurney
flap. Also shown are the resulting Strouhal
numbers based on the freestream velocity
(U∞), Gurney flap height (h), and the frequency
peaks seen in the spectra. The dominant
frequency in the upstream region of the cavity
corresponded with St = 0.13. Downstream of
the cavity, this peak was also apparent in
addition to the stronger peak corresponding
with the Kármán shedding frequency, St =
0.18. This pattern of peak frequencies further
suggests that there exists in the cavity
upstream of the flap a mode of fluid shedding
which is distinct from the Kármán shedding
that dominates the downstream wake. In addition, the upstream and downstream shedding are coupled,
in that both types affect the vortex formation and interaction downstream. The TRPIV visualization shows
that the upstream activity has a significant effect on the downstream wake of the airfoil; namely,
contributing a net downward velocity to the wake. The coupled shedding behavior described here was
also observed at α = 0° though in a much less periodic manner. Hot-film measurements for the airfoil with

-16-
no Gurney flap revealed no equivalent spectral peaks. Further, the peak at St = 0.13 was not observed at
locations further than one-third chord length upstream of the 4% flap.
4 Conclusions
The velocity field sequences generated by the TRPIV method revealed a mode of vortex shedding not
previously observed or postulated in experimental or numerical investigations of flow around Gurney
flaps. A loosely organized vortex forms and grows in the cavity upstream of the flap until it is expunged
into the airfoil wake where it interacts with the Kármán vortex street that forms directly downstream of the
flap. This upstream vortex shedding was not present in a case with a “filled-in” flap that generated
approximately half the lift increment of the open-cavity case. Thus, it appears that a significant part of the
lift increment produced by the Gurney flap results directly from the upstream shedding and its influence
on the trailing wake.
While it is somewhat intuitive that the Gurney flap increases lift by adding to the effective camber of the
wing, the less-obvious advantage of the Gurney flap lies in the complex flow structure surrounding it.
TRPIV is an effective tool in studying this structure due to the presence of recirculation, unsteadiness,
and coherent vortices that form at more than one frequency. TRPIV provides a field-based temporal
history that can capture the dynamics of the flow. The Gurney design, which includes both a blunt trailing
edge and a single-sided leading edge, generates both a “standard” wake of alternating counter-rotating
vortices with fairly predictable frequency and the additional single-signed vortices shed from the cavity
upstream of the flap tip at a lower frequency. The flow sequences reveal that the intermittent release of
fluid from the cavity induces a net negative normal velocity on the airfoil wake increasing the circulation,
and thus the lift. This phenomenon served to increase the lift at every angle of attack measured.
Although the lift increment for a given flap length is fairly constant for different angles of attack,
examination of TRPIV sequences and spectra suggests that the coherence of the shedding of upstream
fluid increases and the related shedding frequency decreases with increasing angle of attack. Also, since
the volume of “trapped” fluid is expected to decrease with decreasing flap length, it is expected that the
corresponding shedding frequency would increase. This hypothesis as well as the details of the specific
relationship between the two shedding modes under different parametric conditions will be examined in
future work. Further, it would be interesting to see if the dual-mode shedding observed could be captured
by computational methods suited for modeling unsteady separated flows.
5 Acknowledgements
The authors thank the University of Minnesota Aerospace Engineering and Mechanics Department for the
use of the facilities and for fabrication of the airfoil test sections.
6 References
Adrian R (1991), “Particle-Imaging Techniques for Experimental Fluid Mechanics.” University of Illinois,
Annual Review Fluid Mechanics, Vol. 23, pp 261-304.
Adrian R (1997), “Dynamic Ranges of Velocity and Spatial Resolution of Particle Image Velocimetry.”
Meas. Sci. Technol. 8, pp. 1393–1398.
Adrian R; Christensen K; Liu Z; (2000), “Analysis and interpretation of instantaneous turbulent velocity
fields.” Exp. Fluids 29, pp. 275-290.
Blake W (1986), “Mechanics of Flow-Induced Sound and Vibration” Vol. II, Academic Press, Inc., pp. 756-
782.
Jacobs E; Anderson R (1930), “Large-Scale Aerodynamic Characteristics of Airfoils as Tested in the
Variable Density Wind Tunnel,” NACA Langley Memorial Aeronautical Laboratory (Langley Field, VA,
United States) NACA TR 352, pp. 421-50.
Jacobs E; Sherman A (1937), “Airfoil section characteristics as affected by variations of the Reynolds
number,” NACA Langley Memorial Aeronautical Laboratory (Langley Field, VA, United States) NACA
Report 586, pp. 41.
TSI Incorporated – Visit our website www.tsi.com for more information. USA Tel: +1 800 874 2811 UK Tel: +44 149 4 459200 France Tel: +33 4 91 11 87 64 Germany Tel: +49 241 523030
India Tel: +91 80 67877200 China Tel: +86 10 8251 6588 Singapore Tel: +65 6595 6388
PIV-014 Rev. C ©2012 TSI Incorporated Printed in U.S.A.
Jang C; Ross J; Cummings R (1998), “Numerical investigation of an airfoil with a Gurney flap.” Aircraft
Design 1, pp. 75-88.
Jeffrey D; Zhang X; Hurst D (2000), “Aerodynamics of Gurney Flaps on a Single-Element High-Lift Wing,”
Journal of Aircraft, Vol. 37. No. 2, pp. 295-301.
Liebeck R (1978), “Design of subsonic airfoils for high lift.” Journal of Aircraft 15(9), pp. 547-61.
Maughmer M; Lesieutre G; Koopmann G (2003), “Miniature Trailing Edge Effectors for Rotorcraft
Applications.” Natl. Rotorcraft Tech. Center.
Neuhart D; Pendergraft O (1988), “A water tunnel study of Gurney flaps.” NASA TM 4071.
Solovitz S; Eaton J (2004), “Spanwise Response Variation for Partial-Span Gurney-Type Flaps,” AIAA
Journal, Vol. 42, No. 8, pp. 1640-1643.
Solovitz S; Eaton J (2004), “Dynamic Flow Response Due to Motion of Partial-Span Gurney-Type Flaps,”
AIAA Journal, Vol. 42, No. 9, pp. 1729-1736.
Storms B; Jang C (1994), “Lift Enhancement of an Airfoil Using a Gurney Flap and Vortex Generators,”
J. Aircraft, Vol. 31, No. 3, pp. 542-547.
Wadcock A (1987), “Investigations of low-speed turbulent separated flow around airfoils.” NASA CR
177450.
Wereley S; Gui L (2001), “PIV measurement in a four-roll-mill flow with a central difference image
correction (CDIC) method,” 4th International Symposium on Particle Image Velocimetry, Göttingen,
Germany, September 17.
Wynbrandt J (2002), “Ban, or Banner?” AOPA Pilot, pp. 97-101.
This paper was originally published in “Experiments in Fluids,” Volume 41, Number 2/August 2006,
publisher Springer Berlin/Heidelberg. The original publication is available at www.springerlink.com.
Related Documents