Time-resolved multi-channel optical system for assessment of brain oxygenation and perfusion by monitoring of diffuse reflectance and fluorescence D. MILEJ 1* , A. GEREGA 1 , M. KACPRZAK 1 , P. SAWOSZ 1 , W. WEIGL 2 , R. MANIEWSKI 1 , and A. LIEBERT 1 1 Nalecz Institute of Biocybernetics and Biomedical Engineering, Polish Academy of Sciences, 4 Ks. Trojdena Str., 02–109, Warsaw, Poland 2 Warsaw Praski Hospital, Department of Intensive Care and Anesthesiology, 67 Al. Solidarności Str., 03–401 Warsaw, Poland Time−resolved near−infrared spectroscopy is an optical technique which can be applied in tissue oxygenation assessment. In the last decade this method is extensively tested as a potential clinical tool for noninvasive human brain function monitoring and imaging. In the present paper we show construction of an instrument which allows for: (i) estimation of changes in brain tissue oxygenation using two−wavelength spectroscopy approach and (ii) brain perfusion assessment with the use of sin− gle−wavelength reflectometry or fluorescence measurements combined with ICG−bolus tracking. A signal processing algo− rithm based on statistical moments of measured distributions of times of flight of photons is implemented. This data analysis method allows for separation of signals originating from extra− and intracerebral tissue compartments. In this paper we present compact and easily reconfigurable system which can be applied in different types of time−resolved experiments: two−wavelength measurements at 687 and 832 nm, single wavelength reflectance measurements at 760 nm (which is at maxi− mum of ICG absorption spectrum) or fluorescence measurements with excitation at 760 nm. Details of the instrument con− struction and results of its technical tests are shown. Furthermore, results of in−vivo measurements obtained for various modes of operation of the system are presented. Keywords: diffuse reflectance and fluorescence, time−resolved optical measurements, brain perfusion, brain oxygenation. 1. Introduction Near−infrared spectroscopy (NIRS) is an optical technique which was proposed for measurement and monitoring of oxyge nation changes in human brain [1]. The method is based on estimation of changes in oxy− and deoxyhemoglo− bin concentration by utilization of different spectral proper− ties [2] of these two forms of hemoglobin contained in blood. In numerous studies it was shown that this technique can be used as an effective tool for monitoring of changes in brain oxygenation during neurophysiological experiments and in assessment of brain perfusion insufficiencies [3–7]. In relation to the most popular brain imaging techniques (MRI [8], CT [9], SPECT [10–12] or PET [13]), NIRS tech− nique can be characterized by a relatively low cost, appli− cability at the bedside, and non−invasiveness. As an effect of technological development the NIRS technique underwent a serious evolution. Three modes of operation were proposed which differ in technical advance− ment, price and flexibility of use. Continuous wave NIRS (cwNIRS) is based on assessment of changes in intensity of light diffusely reflected from the tissue at a distance of 1–5 cm. This technique and its modifications based on multi−distance detection [14–16] is most popular because of low cost and compactness of instrumentation [17–19]. Fre− quency−domain NIRS (fdNIRS) makes use of sub−GHz fre− quency modulation of intensity of the light delivered to the tissue and allows for estimation of pathlength of photons in the tissue by analysis of phase shift between the light waves emitted to the medium and diffusely reflected [20–22]. Most advanced NIRS technique, called time−resolved NIRS (trNIRS) [23–29], is based on emission of picosecond light pulses and analysis of distributions of times of flight of diffusely reflected photons. A methodology based on measurement of diffuse reflec− tance combined with optical contrast agent tracking was developed for assessment of cerebral perfusion [30–33]. In this respect indocyanine green (ICG) is considered as a va− luable contrast agent revealing high absorption in near infra− red wavelength region [34] which can be safely [35] used in clinical studies [36–38]. In some of these studies the time− −resolved optical systems were applied in order to eliminate Opto−Electron. Rev., 22, no. 1, 2014 D. Milej OPTO−ELECTRONICS REVIEW 22(1), 55–67 DOI: 10.2478/s11772−014−0178−y * e−mail: [email protected]

Welcome message from author
This document is posted to help you gain knowledge. Please leave a comment to let me know what you think about it! Share it to your friends and learn new things together.
Transcript

Time-resolved multi-channel optical system for assessment of brainoxygenation and perfusion by monitoring of diffuse reflectance
and fluorescence
D. MILEJ1*, A. GEREGA1, M. KACPRZAK1, P. SAWOSZ1, W. WEIGL2, R. MANIEWSKI1,and A. LIEBERT1
1Nalecz Institute of Biocybernetics and Biomedical Engineering, Polish Academy of Sciences,4 Ks. Trojdena Str., 02–109, Warsaw, Poland
2Warsaw Praski Hospital, Department of Intensive Care and Anesthesiology, 67 Al. Solidarności Str.,03–401 Warsaw, Poland
Time−resolved near−infrared spectroscopy is an optical technique which can be applied in tissue oxygenation assessment. Inthe last decade this method is extensively tested as a potential clinical tool for noninvasive human brain function monitoringand imaging. In the present paper we show construction of an instrument which allows for: (i) estimation of changes in braintissue oxygenation using two−wavelength spectroscopy approach and (ii) brain perfusion assessment with the use of sin−gle−wavelength reflectometry or fluorescence measurements combined with ICG−bolus tracking. A signal processing algo−rithm based on statistical moments of measured distributions of times of flight of photons is implemented. This data analysismethod allows for separation of signals originating from extra− and intracerebral tissue compartments. In this paper wepresent compact and easily reconfigurable system which can be applied in different types of time−resolved experiments:two−wavelength measurements at 687 and 832 nm, single wavelength reflectance measurements at 760 nm (which is at maxi−mum of ICG absorption spectrum) or fluorescence measurements with excitation at 760 nm. Details of the instrument con−struction and results of its technical tests are shown. Furthermore, results of in−vivo measurements obtained for variousmodes of operation of the system are presented.
Keywords: diffuse reflectance and fluorescence, time−resolved optical measurements, brain perfusion, brain oxygenation.
1. Introduction
Near−infrared spectroscopy (NIRS) is an optical techniquewhich was proposed for measurement and monitoring ofoxyge nation changes in human brain [1]. The method isbased on estimation of changes in oxy− and deoxyhemoglo−bin concentration by utilization of different spectral proper−ties [2] of these two forms of hemoglobin contained inblood. In numerous studies it was shown that this techniquecan be used as an effective tool for monitoring of changes inbrain oxygenation during neurophysiological experimentsand in assessment of brain perfusion insufficiencies [3–7].In relation to the most popular brain imaging techniques(MRI [8], CT [9], SPECT [10–12] or PET [13]), NIRS tech−nique can be characterized by a relatively low cost, appli−cability at the bedside, and non−invasiveness.
As an effect of technological development the NIRStechnique underwent a serious evolution. Three modes ofoperation were proposed which differ in technical advance−ment, price and flexibility of use. Continuous wave NIRS
(cwNIRS) is based on assessment of changes in intensity oflight diffusely reflected from the tissue at a distance of1–5 cm. This technique and its modifications based onmulti−distance detection [14–16] is most popular because oflow cost and compactness of instrumentation [17–19]. Fre−quency−domain NIRS (fdNIRS) makes use of sub−GHz fre−quency modulation of intensity of the light delivered to thetissue and allows for estimation of pathlength of photons inthe tissue by analysis of phase shift between the light wavesemitted to the medium and diffusely reflected [20–22].Most advanced NIRS technique, called time−resolved NIRS(trNIRS) [23–29], is based on emission of picosecond lightpulses and analysis of distributions of times of flight ofdiffusely reflected photons.
A methodology based on measurement of diffuse reflec−tance combined with optical contrast agent tracking wasdeveloped for assessment of cerebral perfusion [30–33]. Inthis respect indocyanine green (ICG) is considered as a va−luable contrast agent revealing high absorption in near infra−red wavelength region [34] which can be safely [35] used inclinical studies [36–38]. In some of these studies the time−−resolved optical systems were applied in order to eliminate
Opto−Electron. Rev., 22, no. 1, 2014 D. Milej 55
OPTO−ELECTRONICS REVIEW 22(1), 55–67
DOI: 10.2478/s11772−014−0178−y
*e−mail: [email protected]

influence of changes in extracerebral tissue perfusion andoxygenation during recording of signals related to theinflow of the dye to the brain [39–41]. Moreover, it wasreported that fluorescence light excited in the fluorophorecirculating in the brain can be detected on the surface of thehead [42–47].
Time−resolved NIRS was reported as a potentially valu−able tool allowing for depth−resolved analysis of changes inabsorption of the tissue. A universal trNIRS instrumentshould allow for two modes of operation: (i) monitoring oftissue oxygenation or (ii) monitoring of inflow of the ICG.Such instrument may be effectively applied in clinical stud−ies on different categories of patients with brain perfusionand/or oxygenation disorders.
In the present paper a construction and technical testingof a modular multichannel trNIRS instrument is presented.The system can be used for acquisition of distributions oftimes of arrival (DTA) of fluorescence photons and distribu−tions of times of flight (DTOF) of diffusely reflected pho−tons. Its construction is based on our earlier methodologicalstudies in which we used trNIRS [41,48–50]. Most impor−tant advantage of the presented instrument is its compactdesign and ability to switch between different modes ofoperation in less than 5 min. The setup is optimized foracquisition of time−resolved data from 4 spots (related to 4source−detector pairs) on each hemisphere of the brain, thusallowing for depth− and space resolved assessment of chan−ges in brain oxygenation or in brain perfusion. Results oftechnical tests of the system and examples of in−vivomeasurements in clinical environment are presented.
2. Methods
2.1. InstrumentationThe instrument for multi−channel time−resolved NIRS mea−surements is housed in a mobile 19” cabinet (Shroff, Ger−many) 120×60×60 cm (height, width and depth) (see Fig. 1).The constructed instrument consists of the following parts : in−dustrial PC with eight time−correlated single photon counting(TCSPC) cards (SPC−134, Becker&Hickl, Germany), pulse/pattern generator (81110A, Agilent, US), power supply(HN7042−5, HAMEG Industries, Germany), multichannelcontroller (PDL 808 Sepia, PicoQuant, Germany) which deliv−ers current pulses to the laser heads (LDH−P 690, LDH−P 760,LDH−P 830, PicoQuant, Germany). These elements are grou−ped in two detection and one emission module which will bedescribed below in detail.
2.1.1. Emission module
Construction of the emission module is presented in Fig. 2.The setup is equipped with five picosecond semiconductorlaser diodes (LD) operating at four wavelengths 687 nm,760 nm, 780 nm and 832 nm. Each laser head generateslight pulses at a frequency of 80 MHz with an average powerof 6–8 mW. In order to obey safety limits (2 mW/mm2),the construction of the optode cause that the power of light
on the tips of the emitting fibres is lower than 1 mW. In theemission module the light is coupled into 2 m long step−−index optical fibres (M28L02 Thorlabs, Sweden, numericalaperture is NA = 0.39, diameter is of 400 μm) which areused for transmission of laser pulses to the studied medium.
For assessment of cerebral oxygenation, laser diodesoperating at 687 nm and 832 nm are used (LDH−P−690 andLDH−P−830, PicoQuant, Germany). Laser light from thetwo laser heads is coupled into two optical fibres with anadjustable optical setup equipped with a 50:50 broadbandplate beam splitter (BSW27, Thorlabs, Sweden). Thus, eachof the emitting fibres is used for transmission of laser pulsesat two wavelengths. These pulses are shifted in time usingthe precision programmable delay line (Kentech Instru−ments Ltd., UK) and distributions of times of flight of pho−tons can be observed separately for both wavelengths.
In order to perform measurements of diffuse reflectanceand fluorescence, emission module was equipped with addi−tional two LDs operating at 760 nm and beam splitter same
Time−resolved multi−channel optical system for assessment of brain oxygenation and perfusion by monitoring...
56 Opto−Electron. Rev., 22, no. 1, 2014 © 2014 SEP, Warsaw
Fig. 1. Schematic diagram of the universal multichannel NIRSsystem.
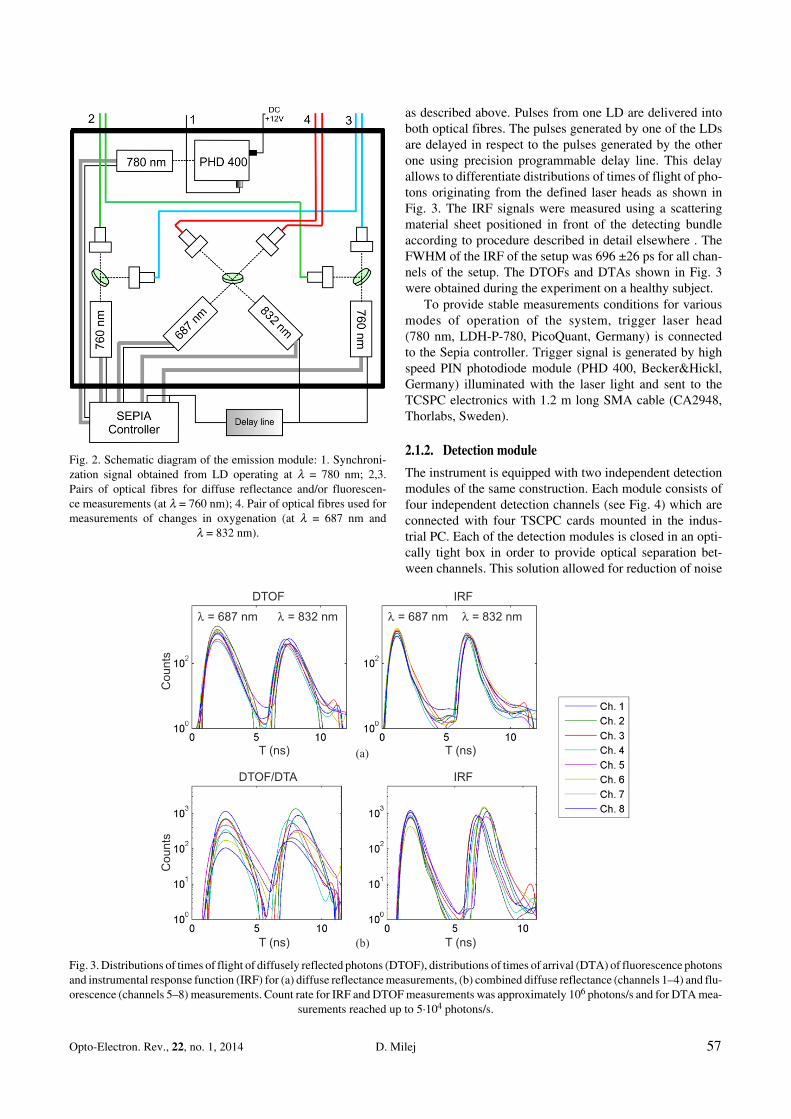
as described above. Pulses from one LD are delivered intoboth optical fibres. The pulses generated by one of the LDsare delayed in respect to the pulses generated by the otherone using precision programmable delay line. This delayallows to differentiate distributions of times of flight of pho−tons originating from the defined laser heads as shown inFig. 3. The IRF signals were measured using a scatteringmaterial sheet positioned in front of the detecting bundleaccording to procedure described in detail elsewhere . TheFWHM of the IRF of the setup was 696 ±26 ps for all chan−nels of the setup. The DTOFs and DTAs shown in Fig. 3were obtained during the experiment on a healthy subject.
To provide stable measurements conditions for variousmodes of operation of the system, trigger laser head(780 nm, LDH−P−780, PicoQuant, Germany) is connectedto the Sepia controller. Trigger signal is generated by highspeed PIN photodiode module (PHD 400, Becker&Hickl,Germany) illuminated with the laser light and sent to theTCSPC electronics with 1.2 m long SMA cable (CA2948,Thorlabs, Sweden).
2.1.2. Detection module
The instrument is equipped with two independent detectionmodules of the same construction. Each module consists offour independent detection channels (see Fig. 4) which areconnected with four TSCPC cards mounted in the indus−trial PC. Each of the detection modules is closed in an opti−cally tight box in order to provide optical separation bet−ween channels. This solution allowed for reduction of noise
Opto−Electron. Rev., 22, no. 1, 2014 D. Milej 57
Fig. 2. Schematic diagram of the emission module: 1. Synchroni−zation signal obtained from LD operating at � = 780 nm; 2,3.Pairs of optical fibres for diffuse reflectance and/or fluorescen−ce measurements (at � = 760 nm); 4. Pair of optical fibres used formeasurements of changes in oxygenation (at � = 687 nm and
� = 832 nm).
Fig. 3. Distributions of times of flight of diffusely reflected photons (DTOF), distributions of times of arrival (DTA) of fluorescence photonsand instrumental response function (IRF) for (a) diffuse reflectance measurements, (b) combined diffuse reflectance (channels 1–4) and flu−orescence (channels 5–8) measurements. Count rate for IRF and DTOF measurements was approximately 106 photons/s and for DTA mea−
surements reached up to 5·104 photons/s.

from ambient light and cross−emission of light betweenchannels.
Light reemitted from the tissue is delivered to the detec−tion channel with the use of optical fibre bundles. Eightfibre bundles (Loptek, Germany, NA = 0.54) with a 1.5 mlength, a 4 mm diameter of active area, connected to eachdetection channel were used in oxygenation measurements.In simultaneous reflectance−fluorescence measurementsfour bifurcated fibre bundles in which the output fibres wereselected by random mixing from set of input fibres wereused. Bundles of a 1.5 m length and a 5 mm diameter ofactive input area and 4 mm diameter output area (NA =0.54, Loptek, Germany) were used. This solution warrantedthat the light from the tissue was equally distributed into twodetection channels for simultaneous diffuse reflectance andfluorescence detection.
It was reported that the high NA and increase of thelength of the detecting bundles leads to broadening of theDTOFs measured in turbid media [51]. However, the sourceand detection fibres/bundles must be at least 1.5 m longwhich allows for easy attachment of the optode to the headduring in−vivo measurements. The detection bundles ofa large NA were used in order to provide transfer of as manyas possible of the photons reemitted from the tissue to thephotodetector. This property of the setup is a trade−off bet−ween countrate (which influence the noise in the measuredsignals of moments of the DTOFs and DTAs) and temporalresolution of the measurement.
Design of the fibre bundle mounting slot allows for aneasy and fast exchange of the fibre bundles used in differentkinds of experiments. In order to provide proper filtration of
the light which is transmitted onto the detector, a set of opti−cal elements was used which form a quasi−parallel beamfrom the wave front which exits the fibre bundle. Construc−tion of the optical detection setups is shown in Fig. 4. Forthe beam forming configuration of two lenses was used:symmetric convex lens a) (f = 16 mm, � = 22,4 mm, BK7,G06 3033, Linos, US) and aspheric condenser lenses (b andc) (f = 18 mm, � = 22,4 mm, B270, G06 3097, Linos, US).The distances between the surfaces of subsequent elements(a and b) are 5mm and between b and c 15 mm. The lengthof the whole optics setup is 5 cm. For selection of mode ofoperation of the instrument a rotating filter wheel was used.Four different positions of the filter wheel correspond to dif−ferent modes of operation: (i) for diffuse reflectance mea−surements at 760 nm, short−pass filters (NT47−586, EdmundOptics, USA) with a cut−off wavelength of 800 nm weremounted in order to block fluorescence light; (ii) for the flu−orescence measurements with excitation at 760 nm, long−−pass interference filters (800LP, TFI Technologies, USA)with a cut−off wavelength of 790 nm were applied; (iii) nofilters were applied in detection channel for oxygenationchanges measurements in which wavelengths of 687 nmand 832 nm were used; (iv) for safety of the detectors duringtransportation of the instrument or stand−by periods the de−tection channel is completely blocked. For every detectingchannel photomultiplier (PMT) module was constructedwhich is composed of: a small−size (8 mm in diameter)photomultiplier tube detector (R7400U−02, HamamatsuPhotonics, Japan), high−voltage power supplier (C4900−01,Hamamatsu Photonics, Japan) and a preamplifier (HFA−D,Becker&Hickl, Germany). For adjustment of intensity oflight transmitted to the photodetectors rotating film filterswere applied. They were prepared by printing black dots onMylar film and composing nine zones with different trans−missions from 0 to 100%. This filter allowed for an easyadjustment of intensity of light reaching detectors in diffe−rent channels of the instrument.
2.2. Operation modes
Construction of the instrument allows its use in severaloperation modes, as presented in Table 1. The system can beused for time−resolved measurements of optical properties,oxygenation changes or monitoring of an inflow and out−flow of the optical contrast agent. It should be noted, thatchanging the operating mode needs a short and easy proce−dure which takes less than 10 minutes for the most compli−
Time−resolved multi−channel optical system for assessment of brain oxygenation and perfusion by monitoring...
58 Opto−Electron. Rev., 22, no. 1, 2014 © 2014 SEP, Warsaw
Fig. 4. Schematic presentation of the construction of a single detec−tion channel: 1. Beam−forming optics: (a) symmetric convex lens,(b) and (c) aspheric condenser lenses; 2. Rotating filter wheel for se−lection of operation mode; 3. Rotating film filter; 4,5 Rotating filtersare operated using knobs located on opposite sides of the detectingmodule; 6. Photomultiplier (PMT) module; 7. Fibre bundle moun−
ting slot.
Table 1. Comparison of the various operation modes.
Operation mode Emission wavelengths No. of channels Fibre bundle type Instrument setup time
Oxygenation measurement 687 nm, 760 nm up to 8 single (8 pcs.) < 5 min
Diffuse reflectance measurement 760 nm up to 8 single (8 pcs.) < 5 min
Fluorescence measurement 760 nm up to 8 single (8 pcs.) < 5 min
Combined reflectance−−fluorescence measurement 760 nm 4 bifurcated (4 pcs.) < 10 min
cated configuration (when the change of detection bundlesis necessary). Acquisition of the DTOFs or DTAs can bedone with a frequency of up to 20 Hz. It should be noted thatthe system is characterized by a short instrument setup time,which is the time necessary to achieve fully operationalstatus for measurements after power on.
2.3. Data analysisAlgorithms based on a mathematical model of the light trans−port in the turbid media [23,52] were used for analysis of themeasured data. DTOFs and DTAs which were measured dur−ing the experiments were analysed by calculation of their sta−tistical moments [53]: total number of photons Ntot (zeroth mo−ment), mean time of flight/arrival of photons <t> (first central−ized moment of DTOF/DTA) and variance of theDTOF/DTA. For the diffuse reflectance and fluorescence sig−nals differential nonlinearity of the analogue−digital converter(DNL) correction [54] and subtraction of background levelwas done. DNL measurement was realized with use of a re−sponse box in which red LED diode as a source of light was lo−cated. Background level was calculated as a mean value ofnumber of photons in the beginning part of a DTOF/DTAcurve in which only temporally uncorrelated photons were de−tected. In order to present the results of the changes in concen−tration of oxy− (�CHbO2
) and deoxyhemoglobin (�CHb ) in theintracerebral layer during the motor task, we used the dataanalysis algorithm based on analysis of changes of moments ofDTOFs and sensitivity profiles derived using diffusion theorywhich was described elsewhere [48,55]. Signal processing wascarried out in Matlab 13 environment (Mathworks Inc., USA).
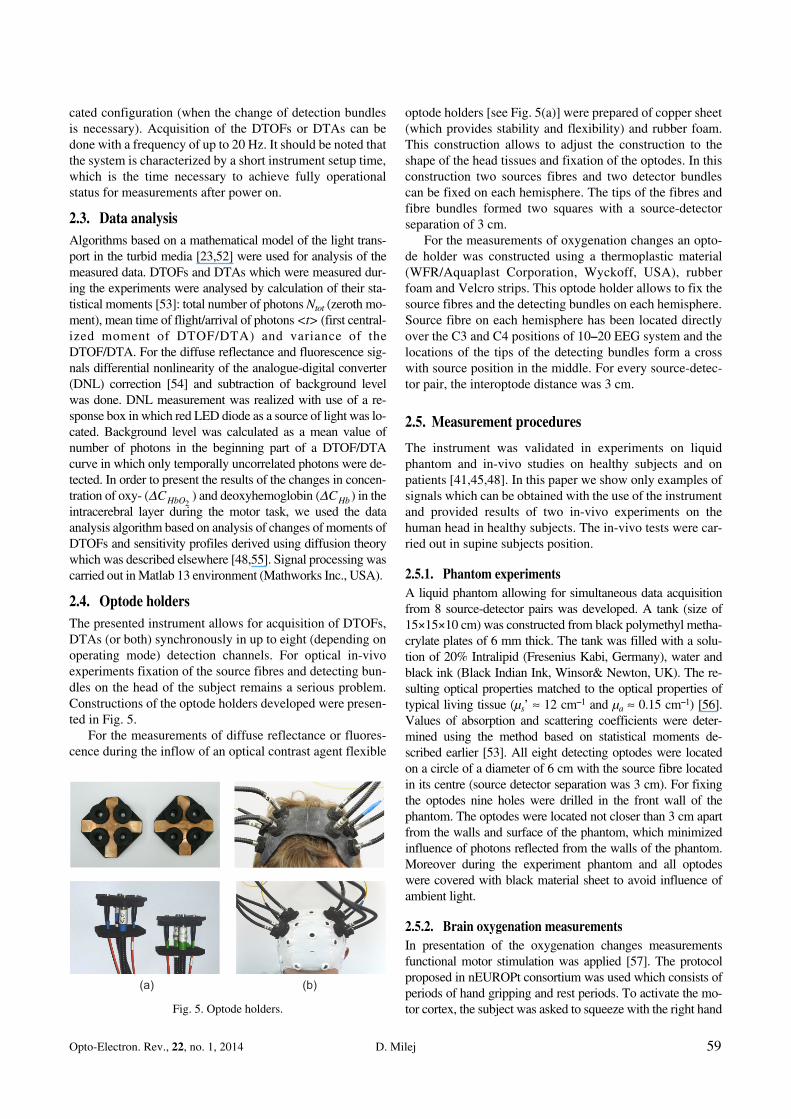
2.4. Optode holdersThe presented instrument allows for acquisition of DTOFs,DTAs (or both) synchronously in up to eight (depending onoperating mode) detection channels. For optical in−vivoexperiments fixation of the source fibres and detecting bun−dles on the head of the subject remains a serious problem.Constructions of the optode holders developed were presen−ted in Fig. 5.
For the measurements of diffuse reflectance or fluores−cence during the inflow of an optical contrast agent flexible
optode holders [see Fig. 5(a)] were prepared of copper sheet(which provides stability and flexibility) and rubber foam.This construction allows to adjust the construction to theshape of the head tissues and fixation of the optodes. In thisconstruction two sources fibres and two detector bundlescan be fixed on each hemisphere. The tips of the fibres andfibre bundles formed two squares with a source−detectorseparation of 3 cm.
For the measurements of oxygenation changes an opto−de holder was constructed using a thermoplastic material(WFR/Aquaplast Corporation, Wyckoff, USA), rubberfoam and Velcro strips. This optode holder allows to fix thesource fibres and the detecting bundles on each hemisphere.Source fibre on each hemisphere has been located directlyover the C3 and C4 positions of 10–20 EEG system and thelocations of the tips of the detecting bundles form a crosswith source position in the middle. For every source−detec−tor pair, the interoptode distance was 3 cm.
2.5. Measurement procedures
The instrument was validated in experiments on liquidphantom and in−vivo studies on healthy subjects and onpatients [41,45,48]. In this paper we show only examples ofsignals which can be obtained with the use of the instrumentand provided results of two in−vivo experiments on thehuman head in healthy subjects. The in−vivo tests were car−ried out in supine subjects position.
2.5.1. Phantom experimentsA liquid phantom allowing for simultaneous data acquisitionfrom 8 source−detector pairs was developed. A tank (size of15×15×10 cm) was constructed from black polymethyl metha−crylate plates of 6 mm thick. The tank was filled with a solu−tion of 20% Intralipid (Fresenius Kabi, Germany), water andblack ink (Black Indian Ink, Winsor& Newton, UK). The re−sulting optical properties matched to the optical properties oftypical living tissue (μs’ � 12 cm–1 and μa � 0.15 cm–1) [56].Values of absorption and scattering coefficients were deter−mined using the method based on statistical moments de−scribed earlier [53]. All eight detecting optodes were locatedon a circle of a diameter of 6 cm with the source fibre locatedin its centre (source detector separation was 3 cm). For fixingthe optodes nine holes were drilled in the front wall of thephantom. The optodes were located not closer than 3 cm apartfrom the walls and surface of the phantom, which minimizedinfluence of photons reflected from the walls of the phantom.Moreover during the experiment phantom and all optodeswere covered with black material sheet to avoid influence ofambient light.
2.5.2. Brain oxygenation measurementsIn presentation of the oxygenation changes measurementsfunctional motor stimulation was applied [57]. The protocolproposed in nEUROPt consortium was used which consists ofperiods of hand gripping and rest periods. To activate the mo−tor cortex, the subject was asked to squeeze with the right hand
Opto−Electron. Rev., 22, no. 1, 2014 D. Milej 59
Fig. 5. Optode holders.

a small soft ball made of foam rubber with a repetition fre−quency of about 2 Hz. To ensure the stimulation frequency,a 2 Hz acoustic signal (click) was emitted by a metronome.The experiment consisted of 20 repetitions of periods of 30 s ofright hand squeeze followed by 30 s of rest.
For this type of measurements five healthy adult volun−teers were recruited (two females and three males, mean age32 years). All subjects were right−handed and had normal orcorrected−to−normal vision. The volunteers were lying on anadjustable bed in supine position. Optodes were fixed on thehead using EEG cap and plastic foam [Fig. 5(b)]. For everysource fibre and detecting bundle, the hair was removedfrom the space between the skin and the fibre/fibre bundletip. The source fibres and detecting bundles were fixed ina stand that was positioned over the subject’s head to avoidbending and movement of the fibres. Optode holders werecentered on the patient's head according to C3 and C4 posi−tions of 10−20 EEG system [Fig. 5(b)]. The recordedDTOFs were analysed by calculation of their statistical mo−ments for both wavelengths. For every subject, the signalsof the moments were averaged synchronously with the cyc−les of the right−hand movement.
2.5.3. Monitoring of inflow and washout of an opticalcontrast agent
Indocyanine Green was used for the diffuse reflectance andfluorescence measurements during the inflow and washoutof an optical contrast agent. A dose of 5 mg of ICG diluted
in 3 ml of aqua pro injectione was rapidly injected (injectiontime of about 1 s) into the forearm vein and flushed by con−secutive quick injection of 10 ml of normal saline.
For the monitoring of inflow and washout of ICG fivehealthy adult volunteers were recruited (one female and fourmales, mean age 31 years). Subjects were examined insupine position. Optodes were fixed on the head usingoptode holders presented in a Fig. 5(a). Optode holders werecentred on the patient's head on C3 and C4 positions of10–20 EEG system. The recorded DTOFs and DTAs wereanalysed by calculation of their statistical moments. For pre−sentation, all signals were smoothed with a 3 s long movingaverage.
3. Results
3.1. Phantom experimentsStability of the system was tested on a liquid phantom usingprotocols similar to those proposed by the European Net−work MEDPHOT [58]. Measurements were carried out forall wavelengths used in the instrument. For each wavelengthDTOFs corresponding to eight source−detector pairs weremeasured during 60 min period which started just afterswitching on all the subunits of the instrument. Timecourses of the moments of DTOFs recorded during these ex−periments were presented in Fig. 6. For the total number ofdetected photons Ntot, the mean time of flight <t> and thevariance V of the DTOF, only small fluctuations can be ob−
Time−resolved multi−channel optical system for assessment of brain oxygenation and perfusion by monitoring...
60 Opto−Electron. Rev., 22, no. 1, 2014 © 2014 SEP, Warsaw
Fig. 6. Evaluation of the instrument stability. The time courses of statistical moments of DTOFs observed during 1 h after switching on the in−strument for different operating wavelengths. Black line represent mean values, grey thin lines stand for minimum and maximum values
from all channels.

served during the instrument warm−up period. The signalfluctuations which occur in Ntot and <t> do not exceed 1%within the 1h long period of measurement. Fluctuations ob−served in variance signals are larger, but they do not exceed5% of the mean value.
The uncertainty of the measurement caused by limitednumber of photons detected was evaluated by calculation ofthe coefficient of variation (CV) for each of the statisticalmoments of the DTOFs for all the source−detector pairs. Thecoefficient of variation is defined as the ratio of the standarddeviation of the moments and its mean value [48]. The coef−ficients of variations of the moments for three wavelengthswere presented in Fig. 7. It can be observed that even fora small number of detected photons (20,000), the uncer−tainty of the measurement of the moments was on the levelof a few percent. The coefficient of variation decreases withan increase of number of photons collected. It should benoted that the CV for the variance of the DTOF was a fewpercent higher than for other moments.
3.2. In vivo experimentsSeveral tests were performed to show feasibility of the con−structed instrument in in−vivo measurements on the humanhead. Two main applications of the system were tested:measurements of the cerebral oxygenation change duringthe motor stimulation and monitoring of an optical contrastagent inflow and washout by measurements of diffuse ref−lectance and fluorescence.
As an example, results of the motor stimulation experi−ment for one selected subject are presented in Fig. 8. Theaveraged changes in Ntot, �t, and V obtained for a singleemitter−detector pair placed above the hemisphere whichwas active during the stimulation are presented. The verticaldotted lines mark the beginning and end of the right−handmovement period. A typical change with the opposite trendsof the signals change which were measured at the two wave−lengths located on the opposite sides of the isobestic point inall statistical moments can be observed. These oppositechanges in the motor cortex activation are caused by chan−ges of the absorption coefficients (for 687 nm and 832 nmwavelengths) which result from increase in oxyhemoglobinconcentration and decrease in deoxyhemoglobin con−centration [59–67].
Using the data analysis algorithms based on momentsdescribed in detail in Refs. 48 and 68 the signals corre−sponding to the changes in concentration of oxy− �CHbO2and deoxyhemoglobin �CHb in the intracerebral tissue com−partments during the right−hand movement task wereobtained. Results are presented in Fig. 9. In subplots a and bthe signals obtained from optodes located on the left hemi−sphere and right hemisphere were presented, respectively.For the left (contralateral) hemisphere, increase in �CHbO2and decrease in �CHb is clearly visible. For right (ipsilatre−ral) hemisphere only a small amplitude response in themotor cortex can be observed.
Opto−Electron. Rev., 22, no. 1, 2014 D. Milej 61
Fig. 7. Coefficients of variation (CV) of the statistical moments of the DTOFs vs. number of photons collected. The averaged data for all 8 de−tecting channel are presented. Black dots represent mean values, starlets stand for minimum and maximum values of CV from all 8 channelsof the instrument. Gray lines represent CV values calculated from the moments of DTOFs using theory presented by Liebert et al. [53].

The constructed instrument can be used for monitoringof an optical contrast agent inflow. As an example theresults of ICG inflow measurement are presented. Changesin Ntot, �t, and V averaged from all source−detector pairs forone selected subject were shown in Fig. 10. In the results ofthe time−resolved reflectance measurements we can observethe decrease in each of the measured statistical moments ofDTOFs. In the fluorescence measurements increase in Ntot
and decrease of the signals representing first and secondorder moments of DTAs can be observed. This pattern ofchanges matches well with the previous reports [42–46].
4. Discussion and conclusions
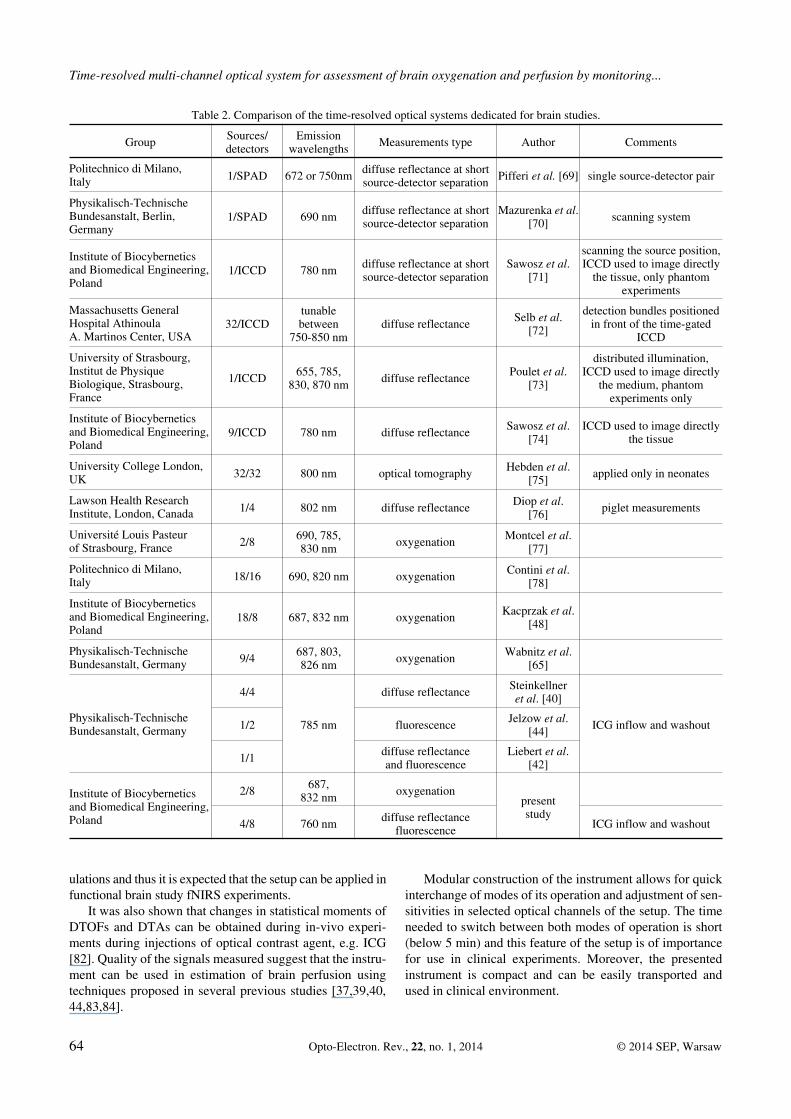
In the last several years research groups developed time−−resolved systems allowing tissue imaging and dedicatedspecifically for brain studies. In the proposed setups differ−
ent detection scenarios based on PMTs, APDs or ICCDcameras were utilized. Most of them are dedicated to themeasurement of oxygenation changes or changes in theoptical properties of tissue. Few of them allow for monitor−ing inflow of an optical contrast agent, but only by measur−ing the diffuse reflectance signals.
Comparison of the systems proposed for the time−resol−ved measurements on the brain is presented in Table 2. Itcan be noted that our setup is the only one which allows forthe simultaneous measurement of diffuse reflectance andfluorescence during inflow of the contras agent. The instru−ment constructed in Physikalisch−Technische Bundesanstaltwas used in these two modes of operation (diffuse reflec−tance or fluorescence detection) in two separate studies only[40,44]. In addition, the only one multichannel fluorescencedetection system which was used by Jelzow et al. [44] didnot allow to compare fluorescence signals obtained fromboth hemispheres of the brain. Simultaneously measure−ments of diffuse reflectance and fluorescence was perfor−med by Liebert et al. [42], but conducted only for one pairof source and detector, and never repeat until now. In thisaspect the setup proposed in the present study represents an
Time−resolved multi−channel optical system for assessment of brain oxygenation and perfusion by monitoring...
62 Opto−Electron. Rev., 22, no. 1, 2014 © 2014 SEP, Warsaw
Fig. 8. Time courses of statistical moments of the DTOFs obtainedduring motor stimulation experiment averaged over all cycles ofright hand grip are presented. Signals averaged from all source−de−tector pairs located on contralateral hemisphere in respect to thehand grip: �Ntot – changes in total number of photons, �t – changesin mean time of flight of photons and �V – changes in variance ofthe DTOF. Changes in moments were calculated for two wave−lengths 687 nm (red line) and 832 nm (blue line). Vertical black dot−ted lines mark the beginning and end of the right hand grip task.
Fig. 9. Time courses of changes in concentration of oxy− (red line)and deoxy− (blue line) hemoglobin observed in the (a) left and (b)right hemisphere. Panels refer to the positions of the optodes on thesurface of the head. Vertical black dotted lines mark the beginning
and end of the right hand grip task.

extension of the previous solutions and we will show in nextinvestigation usefulness of such simultaneous measure−ments of diffuse reflectance and fluorescence carried out onboth hemispheres in patients with impaired brain perfusion.Furthermore, the setup proposed can be applied in bothkinds of experiments – tissue perfusion assessment and oxy−genation studies. This device was successfully applied instudies related to monitoring of focal changes in brain cor−tex oxygenation during motor stimulation. The instrumentallows also for evaluation of optical contrast agent inflowand washout which can be used in estimation of brain perfu−sion parameters [33,79–81]. In series of experiments onphantoms and in healthy volunteers we showed feasibilityof time resolved measurements in diffuse reflectance modeand fluorescence light detection. Metrological properties ofthe setup were also tested.
Analysis of the stability of the system presented aboveshows drifts of the measured signals of statistical momentsof DTOFs and DTAs not larger than 3% within one hour
after beginning of the measurements. Analysis of changesof coefficient of variation as a function of the total numberof measured photons shows that uncertainty of the measure−ment of the moments was only slightly higher than the val−ues obtained with the theoretical analysis. This result sug−gests that the systematic noise components represent onlysmall fraction of the noise in the measured DTOFs andDTAs. Unfortunately, the uncertainty related to the numberof photons detected is an intrinsic property of the TCSPCtechnology [54].
Analysis of the data recorded during focal stimulation ofthe motor cortex shows that significant changes in the signalsof statistical moments of the DTOFs obtained at 687 nm and832 nm can be observed. Moreover, utilization of momentsof DTOFs, allowed to evaluate the changes in oxy− anddeoxyhemoglobin with depth discrimination. Changes in he−moglobin concentration observed for two hemispheres of thebrain showed that the instrument can be successfully used inmonitoring of brain oxygenation changes during motor stim−
Opto−Electron. Rev., 22, no. 1, 2014 D. Milej 63
Fig. 10. Results of the time−resolved measurements during the inflow and washout of ICG in the head of healthy subject. Normalized changesof moments of the DTOFs measured in diffuse reflectance mode (a, b) and DTAs measured in fluorescence light acquisition (c, d):�N – changes in total number of photons (red line), �t – changes in mean time of flight/arrival of photons (green line) and �V – changes invariance (blue line). Changes in moments were calculated for left hemisphere (a, c) and right hemisphere (b, d). Panels refer to different posi−
tions of the source−detector pairs on the head.
ulations and thus it is expected that the setup can be applied infunctional brain study fNIRS experiments.
It was also shown that changes in statistical moments ofDTOFs and DTAs can be obtained during in−vivo experi−ments during injections of optical contrast agent, e.g. ICG[82]. Quality of the signals measured suggest that the instru−ment can be used in estimation of brain perfusion usingtechniques proposed in several previous studies [37,39,40,44,83,84].
Modular construction of the instrument allows for quickinterchange of modes of its operation and adjustment of sen−sitivities in selected optical channels of the setup. The timeneeded to switch between both modes of operation is short(below 5 min) and this feature of the setup is of importancefor use in clinical experiments. Moreover, the presentedinstrument is compact and can be easily transported andused in clinical environment.
Time−resolved multi−channel optical system for assessment of brain oxygenation and perfusion by monitoring...
64 Opto−Electron. Rev., 22, no. 1, 2014 © 2014 SEP, Warsaw
Table 2. Comparison of the time−resolved optical systems dedicated for brain studies.
Group Sources/detectors
Emissionwavelengths Measurements type Author Comments
Politechnico di Milano,Italy 1/SPAD 672 or 750nm diffuse reflectance at short
source−detector separation Pifferi et al. [69] single source−detector pair
Physikalisch−TechnischeBundesanstalt, Berlin,Germany
1/SPAD 690 nm diffuse reflectance at shortsource−detector separation
Mazurenka et al.[70] scanning system
Institute of Biocyberneticsand Biomedical Engineering,Poland
1/ICCD 780 nm diffuse reflectance at shortsource−detector separation
Sawosz et al.[71]
scanning the source position,ICCD used to image directly
the tissue, only phantomexperiments
Massachusetts GeneralHospital AthinoulaA. Martinos Center, USA
32/ICCDtunablebetween
750−850 nmdiffuse reflectance Selb et al.
[72]
detection bundles positionedin front of the time−gated
ICCD
University of Strasbourg,Institut de PhysiqueBiologique, Strasbourg,France
1/ICCD 655, 785,830, 870 nm diffuse reflectance Poulet et al.
[73]
distributed illumination,ICCD used to image directly
the medium, phantomexperiments only
Institute of Biocyberneticsand Biomedical Engineering,Poland
9/ICCD 780 nm diffuse reflectance Sawosz et al.[74]
ICCD used to image directlythe tissue
University College London,UK 32/32 800 nm optical tomography Hebden et al.
[75] applied only in neonates
Lawson Health ResearchInstitute, London, Canada 1/4 802 nm diffuse reflectance Diop et al.
[76] piglet measurements
Université Louis Pasteurof Strasbourg, France 2/8 690, 785,
830 nm oxygenation Montcel et al.[77]
Politechnico di Milano,Italy 18/16 690, 820 nm oxygenation Contini et al.
[78]
Institute of Biocyberneticsand Biomedical Engineering,Poland
18/8 687, 832 nm oxygenation Kacprzak et al.[48]
Physikalisch−TechnischeBundesanstalt, Germany 9/4 687, 803,
826 nm oxygenation Wabnitz et al.[65]
Physikalisch−TechnischeBundesanstalt, Germany
4/4
785 nm
diffuse reflectance Steinkellneret al. [40]
ICG inflow and washout1/2 fluorescence Jelzow et al.[44]
1/1 diffuse reflectanceand fluorescence
Liebert et al.[42]
Institute of Biocyberneticsand Biomedical Engineering,Poland
2/8 687,832 nm oxygenation
presentstudy
4/8 760 nm diffuse reflectancefluorescence ICG inflow and washout
Acknowledgements
Studies financed by EC Seventh Framework Programme un−der grant agreement n°201076 – project nEUROPt “Non−inva−sive imaging of brain function and disease by pulsed near in−frared light” and Polish National Centre of Science under grantagreement 2011/03/N/ST7/02598. This work has been alsosupported with a scholarship from the European Social Fund,Human Capital Operational Programme for the execution ofthe project “Support for bio tech med scientists in technologytransfer”; (UDA−POKL.08.02.01− 14−041/09).
References
1. F.F. Jobsis, “Noninvasive, Infrared monitoring of cerebraland myocardial oxygen sufficiency and circulatory parame−ters”. Science 198, 1264–1267 (1977).
2. S. Wray, M. Cope, D.T. Delpy, J.S. Wyatt, and E.O. Rey−nolds, , “Characterization of the near infrared absorptionspectra of cytochrome aa3 and haemoglobin for the non−in−vasive monitoring of cerebral oxygenation”, BiochimBiophys Acta. 933, 184–192 (1988).
3. A. Villringer, J. Planck, C. Hock, L. Schleinkofer, and U.Dirnagl, “Near infrared spectroscopy (NIRS): a new tool tostudy hemodynamic changes during activation of brain func−tion in human adults”, Neurosci. Lett. 154, 101–104 1993).
4. A. Villringer and B. Chance, “Non−invasive optical spectros−copy and imaging of human brain function”, Trends InNeurosciences 20, 435–442 (1997).
5. G. Litscher and G. Schwarz, Transcranial Cerebral Oxime−try, Pabst Sci. Pub. Lengerich, 1997.
6. A.F. Cannestra, I. Wartenburger, H. Obrig, A. Villringer, and A.W.Toga, “Functional assessment of Broca's area using near infra−red spectroscopy in humans”, Neuroreport 14, 1961–5 (2003).
7. H. Obrig and A. Villringer, “Beyond the visible − Imagingthe human brain with light”, J. Cerebr. Blood F. Met. 23,1–18 (2003).
8. G. Schlaug, A. Benfield, A.E. Baird, B. Siewert, K.O.Lovblad, R.A. Parker, R.R. Edelman, and S. Warach, “Theischemic penumbra: operationally defined by diffusion andperfusion MRI”, Neurolog. 53, 1528–37 (1999).
9. K.A. Miles, “Perfusion imaging with computed tomography:brain and beyond”, Eur Radiol. 16 Suppl 7, 37–43 (2006).
10. E. Facco, P. Zucchetta, M. Munari, F. Baratto, A.U. Behr, M.Gregianin, A. Gerunda, F. Bui, M. Saladini, and G. Giron,“99mTc−HMPAO SPECT in the diagnosis of brain death”Intens. Care Med. 24, 911–7 (1998).
11. H.H. Abu−Judeh, R. Parker, S. Aleksic, M.L. Singh, S.Naddaf, S. Atay, M. Kumar, W. Omar, H. El−Zeftawy, J.Q.Luo, and H.M. Abdel−Dayem, “SPECT brain perfusion find−ings in mild or moderate traumatic brain injury”, Nucl. Med.Rev. Cent. East Eur. 3, 5–11 (2000).
12. U. Roelcke, “Imaging brain tumors with PET, SPECT, andultrasonography”, Handb. Clin. Neurol. 104, 135–42 (2012).
13. J.M. Gruner, R. Paamand, L. Hojgaard, and I. Law, “Brainperfusion CT compared with 15O−H2O−PET in healthy sub−jects”, EJNMMI Res. 1, 28 (2011).
14. J.A. Wahr, K.K. Tremper, S. Samra, and D.T. Delpy, “Near−in−frared spectroscopy: theory and applications”, J. CardiothoracVasc. Anesth. 10, 406–18 (1996).
15. V. Quaresima, M. Ferrari, M.C.P. van der Sluijs, J. Menssen,and W. Colier, “Lateral frontal cortex oxygenation changesduring translation and language switching revealed by non−−invasive near−infrared multi−point measurements”, BrainRes. Bull. 59, 235–243 (2002).
16. M. Diop, J.T. Elliott, K.M. Tichauer, T.Y. Lee, and K. StLawrence, “A broadband continuous−wave multichannelnear−infrared system for measuring regional cerebral bloodflow and oxygen consumption in newborn piglets”, Rev. Sci.Instrum. 80, 054302 (2009).
17. K. van Rossem, S. Garcia−Martinez, G. De Mulder, B. VanDeuren, K. Engelborghs, J. Van Reempts, and M. Borgers,“Brain oxygenation after experimental closed head injury.A NIRS study”, Adv. Exp. Med. Biol. 471, 209–15 (1999).
18. Y. Murata, Y. Katayama, H. Oshima, T. Kawamata, T. Yama−moto, K. Sakatani, and S. Suzuki, “Changes in cerebral bloodoxygenation induced by deep brain stimulation: study by near−−infrared spectroscopy (NIRS)”, Keio J. Med. 49 Suppl 1,61–3 (2000).
19. R. Maniewski, A. Liebert, M. Kacprzak, and A. Zbiec, “Se−lected applications of near infrared optical methods in medi−cal diagnosis”, Opto−Electron. Rev. 12, 255–262 (2004).
20. J.C. Hebden, S.R. Arridge, and D.T. Delpy, “Optical imag−ing in medicine: I. Experimental techniques”, Phys. Med.Biol. 42, 825–40 (1997).
21. E.M. Sevick−Muraca, J.S. Reynolds, J. Lee, D. Hawrysz,A.B. Thompson, R.H. Mayer, R. Roy, and T.L. Troy, “Fluo−rescence lifetime imaging of tissue volumes using near− in−frared frequency domain photon migration”, Photochem.Photobiol. 69, 66S−66S (1999).
22. J. Zhao, H.S. Ding, X.L. Hou, C.L. Zhou, and B. Chance, “Invivo determination of the optical properties of infant brainusing frequency−domain near−infrared spectroscopy”, J.Biomed. Opt. 10, 024028 (2005).
23. M.S. Patterson, B. Chance, and B.C. Wilson, “Time resolvedreflectance and transmittance for the noninvasive measure−ments of tissue optical properties”, Appl. Opt. 28,. 2331–2336(1989).
24. J. Hebden, R. Kruger, and K. Wong, “Time resolved imagingtrough a highly scattering medium”, Appl. Opt. 30, 788–794(1991).
25. J. Hebden and K. Wong, “Time−resolved optical tomogra−phy”, Appl. Opt. 32, 372–380 (1993).
26. R.R. Alfano, S.G. Demos, and S.K. Gayen, “Advances in op−tical imaging of biomedical media”, Ann. NY Acad. Sci. 820,248–70; discussion 271 (1997).
27. R.R. Alfano, S.G. Demos, P. Galland, S.K. Gayen, Y. Guo,P.P. Ho, X. Liang, F. Liu, L. Wang, Q.Z. Wang, and W.B.Wang, “Time−resolved and nonlinear optical imaging formedical applications”, Ann NY Acad. Sci. 838, 1428 (1998).
28. H. Eda, I. Oda, Y. Ito, Y. Wada, Y. Oikawa, Y. Tsunazawa,M. Takada, Y. Tsuchiya, Y. Yamashita, M. Oda, A. Sas−saroli, Y. Yamada, and M. Tamura, “Multichannel time−re−solved optical tomographic imaging system”, Rev. Sci.Instrum. 70, 3595–3602 (1999).
29. S. Okawa, A. Yano, K. Uchida, Y. Mitsui, M. Yoshida, M.Takekoshi, A. Marjono, F. Gao, Y. Hoshi, I. Kida, K. Masa−moto, and Y. Yamada, “Phantom and mouse experiments oftime−domain fluorescence tomography using total light ap−proach”, Biomed Opt. Express 4, 635–51 (2013).
30. W.M. Kuebler, A. Sckell, O. Habler, M. Kleen, G.E.H. Kuh−nle, M. Welte, K. Messmer, and A.E. Goetz, “Noninvasive
Opto−Electron. Rev., 22, no. 1, 2014 D. Milej 65
measurement of regional cerebral blood flow by near−infra−red spectroscopy and indocyanine green”, J. Cerebr. BloodF. Met. 18, 445–456 (1998).
31. J. Patel, K. Marks, I. Roberts, D. Azzopardi, and A.D. Ed−wards, “Measurement of cerebral blood flow in newborn in−fants using near infrared spectroscopy with indocyaninegreen”, Pediatr. Res. 43, 34–9 (1998).
32. D.W. Brown, P.A. Picot, J.G. Naeini, R. Springett, D.T.Delpy, and T.Y. Lee, “Quantitative near infrared spectros−copy measurement of cerebral hemodynamics in newbornpiglets”, Pediatr. Res. 51, 564–70 (2002).
33. J.T. Elliott, M. Diop, K.M. Tichauer, T.Y. Lee, and K. StLawrence, “Quantitative measurement of cerebral bloodflow in a juvenile porcine model by depth−resolved near−in−frared spectroscopy”, J. Biomed. Opt. 15, 037014 (2010).
34. P. Desmettre, “Diagnosis and prevention of equine infectiousdiseases: present status, potential, and challenges for the fu−ture” Adv. Vet. Med. 41, 359–77 (1999).
35. M. Hope−Ross, L.A. Yannuzzi, E.S. Gragoudas, D.R. Guyer,J.S. Slakter, J.A. Sorenson, S. Krupsky, D.A. Orlock, andC.A. Puliafito, “Adverse reactions due to indocyaninegreen”, Ophthalmology 101, 529–33 (1994).
36. R. Springett, Y. Sakata, and D.T. Delpy, “Precise measure−ment of cerebral blood flow in newborn piglets from thebolus passage of indocyanine green”, Phys. Med. Biol. 46,2209–25 (2001).
37. E. Keller, A. Nadler, H. Alkadhi, S.S. Kollias, Y. Yonekawa,and P. Niederer, “Noninvasive measurement of regional ce−rebral blood flow and regional cerebral blood volume bynear−infrared spectroscopy and indocyanine green dye dilu−tion”, Neuroimage 20, 828–39 (2003).
38. C. Terborg, S. Bramer, S. Harscher, M. Simon, and O.W.Witte, “Bedside assessment of cerebral perfusion reductionsin patients with acute ischaemic stroke by near−infrared spec−troscopy and indocyanine green”, J. Neurol. Neurosurg. Psy−chiatry 75, 38–42 (2004).
39. A. Liebert, H. Wabnitz, J. Steinbrink, M. Moller, R. Macdon−ald, H. Rinneberg, A. Villringer, and H. Obrig, “Bed−side as−sessment of cerebral perfusion in stroke patients based on opti−cal monitoring of a dye bolus by time−resolved diffuse reflec−tance”, Neuroimage 24, 426–35 (2005).
40. O. Steinkellner, C. Gruber, H. Wabnitz, A. Jelzow, J. Stein−brink, J.B. Fiebach, R. Macdonald, and H. Obrig, “Opticalbedside monitoring of cerebral perfusion: technological andmethodological advances applied in a study on acute ische−mic stroke”, J. Biomed. Opt. 15, 061708 (2010).
41. A. Liebert, P. Sawosz, D. Milej, M. Kacprzak, W. Weigl, M.Botwicz, J. Maczewska, K. Fronczewska, E. Mayzner−Za−wadzka, L. Krolicki, and R. Maniewski, “Assessment of in−flow and washout of indocyanine green in the adult humanbrain by monitoring of diffuse reflectance at large source−de−tector separation”, J. Biomed. Opt. 16, 046011 (2011).
42. A. Liebert, H. Wabnitz, H. Obrig, R. Erdmann, M. Moller, R.Macdonald, H. Rinneberg, A. Villringer, and J. Steinbrink,“Non−invasive detection of fluorescence from exogenous chro−mophores in the adult human brain”, Neuroimage 31, 600–8(2006).
43. J. Steinbrink, A. Liebert, H. Wabnitz, R. Macdonald, H.Obrig, A. Wunder, R. Bourayou, T. Betz, J. Klohs, U. Lin−dauer, U. Dirnagl, and A. Villringer, “Towards noninvasivemolecular fluorescence imaging of the human brain”, Neuro−degener. Dis. 5, 296–303 (2008).
44. A. Jelzow, H. Wabnitz, H. Obrig, R. Macdonald, and J.Steinbrink, “Separation of indocyanine green boluses in thehuman brain and scalp based on time−resolved in−vivo fluo−rescence measurements”, J. Biomed. Opt. 17, 057003 (2012).
45. D. Milej, A. Gerega, N. Zolek, W. Weigl, M. Kacprzak, P.Sawosz, J. Maczewska, K. Fronczewska, E. Mayzner−Za−wadzka, L. Krolicki, R. Maniewski, and A. Liebert, “Time−−resolved detection of fluorescent light during inflow of ICGto the brain−a methodological study”, Phys. Med. Biol. 57,6725–42 (2012).
46. A. Gerega, D. Milej, W. Weigl, M. Botwicz, N. Zolek, M.Kacprzak, W. Wierzejski, B. Toczylowska, E. Mayzner−Za−wadzka, R. Maniewski, and A. Lieber, “Multi−wavelengthtime−resolved detection of fluorescence during the inflow ofindocyanine green into the adult’s brain”, J. Biomed. Opt. 17,087001 (2012).
47. W. Weigl, D. Milej, A. Gerega, B. Toczylowska, M. Kac−przak, P. Sawosz, M. Botwicz, R. Maniewski, E. Mayzner−−Zawadzka, and A. Lieber, “Assessment of cerebral perfu−sion in post−traumatic brain injury patients with the use of ICG−−bolus tracking method”, Neuroimage 85, 555–565 (2014).
48. M. Kacprzak, A. Liebert, P. Sawosz, N. Żołek, and R. Ma−niewski, “Time−resolved optical imager for assessment of ce−rebral oxygenation”, J. Biomed. Opt. 12, 034019 (2007).
49. D. Milej, M. Kacprzak, N. Żołek, P. Sawosz, R. Maniewski,and A. Liebert, An Instrument for Monitoring Inflow andWashout of An Optical Contrast Agent into The Brain, in Infor−mation Technologies in Biomedicine, E. Pietka and J. KawaEditors, pp. 85–90, Springer Berlin / Heidelberg: Berlin, 2010.
50. D. Milej, M. Kacprzak, N. Zolek, A. Liebert, and R. Maniew−ski, “Advantages of fluorescence over diffuse reflectance mea−surements tested in phantom experiments with dynamic inflowof ICG”, Opto−Electron. Rev. 18, 208–213 (2010).
51. A. Liebert, H. Wabnitz, D. Grosenick, and R. Macdonald, “Fi−bre dispersion in time domain measurements compromisingthe accuracy of determination of optical properties of stronglyscattering media”, J. Biomed. Opt. 8, 512–516 (2003).
52. M.S. Patterson and B.W. Pogue, “Mathematical model fortime−resolved and frequency−domain fluorescence spectros−copy in biological tissues”, Appl. Opt. 33, 1963–74 (1994).
53. A. Liebert, H. Wabnitz, D. Grosenick, M. Moller, R. Mac−donald, and H. Rinneberg, “Evaluation of optical propertiesof highly scattering media by moments of distributions oftimes of flight of photons”, Appl. Opt. 42, 5785–92 (2003).
54. W. Becker, Advanced Time−Correlated Single Photon Coun−ting Techniques, Chemical Physics Berlin Heidelberg: Sprin−ger−Verlag, 2005.
55. A. Liebert, H. Wabnitz, J. Steinbrink, H. Obrig, M. Moller, R.Macdonald, A. Villringer, and H. Rinneberg, “Time−resolvedmultidistance near−infrared spectroscopy of the adult head:intracerebral and extracerebral absorption changes from mo−ments of distribution of times of flight of photons”, Appl. Opt.43, 3037–3047 (2004).
56. M. Jager and A. Kienle, “Non−invasive determination of theabsorption coefficient of the brain from time−resolved ref−lectance using a neural network”, Phys. Med. Biol. 56,139–144 (2011).
57. N. Zolek, A. Liebert, D. Milej, M. Kacprzak, A. Torricelli,D. Contini, L. Spinelli, M. Caffini, L. Zucchelli, R. Cubeddu,A. Jelzow, O. Steinkellner, H. Wabnitz, S. Koch, J. Stein−brink, and W. Weigl, “Comparative study of algorithms toderive changes in hemoglobin concentrations from time do−
Time−resolved multi−channel optical system for assessment of brain oxygenation and perfusion by monitoring...
66 Opto−Electron. Rev., 22, no. 1, 2014 © 2014 SEP, Warsaw
main near infrared spectroscopy measurements” in Eur.Conf. Biomed. Opt., Munich, 2011
58. A. Pifferi, A. Torricelli, A. Bassi, P. Taroni, R. Cubeddu, H.Wabnitz, D. Grosenick, M. Moller, R. Macdonald, J. Swart−ling, T. Svensson, S. Andersson−Engels, R.L. van Veen, H.J.Sterenborg, J.M. Tualle, H.L. Nghiem, S. Avrillier, M. Whe−lan, and H. Stamm, “Performance assessment of photon mi−gration instruments: the MEDPHOT protoco”, Appl. Opt. 44,2104–2014 (2005).
59. H. Obrig, T. Wolf, C. Doge, J.J. Hulsing, U. Dirnagl, and A.Villringer, “Cerebral oxygenation changes during motor andsomatosensory stimulation in humans, as measured by near−−infrared spectroscopy”, Adv. Exp. Med. Biol. 388, 219–224(1996).
60. V. Toronov, M.A. Franceschini, M. Filiaci, S. Fantini, M.Wolf, A. Michalos, and E. Gratton, “Near−infrared study offluctuations in cerebral hemodynamics during rest and motorstimulation: temporal analysis and spatial mapping”, Med.Phys. 27, 801–815 (2000).
61. G. Strangman, J.P. Culver, J.H. Thompson, and D.A. Boas,“A quantitative comparison of simultaneous BOLD fMRIand NIRS recordings during functional brain activation”,Neuroimage 17, 719–731 (2002).
62. T.J. Huppert, R.D. Hoge, S.G. Diamond, M.A. Franceschini,and D.A. Boas, “A temporal comparison of BOLD, ASL,and NIRS hemodynamic responses to motor stimuli in adulthumans”, Neuroimage 29, 368–382 (2006).
63. M. Butti, D. Contini, E. Molteni, M. Caffini, L. Spinelli, G.Baselli, A.M. Bianchi, S. Cerutti, R. Cubeddu, and A. Torri−celli, “Effect of prolonged stimulation on cerebral hemody−namic: a time−resolved fNIRS study”, Med. Phys. 36,4103–4114 (2009).
64. L. Holper, M. Biallas, and M. Wolf, “Task complexity re−lates to activation of cortical motor areas during uni− andbimanual performance: a functional NIRS study”, Neuro−image 46, 1105–1113 (2009).
65. H. Wabnitz, M. Moeller, A. Liebert, H. Obrig, J. Steinbrink,and R. Macdonald, “Time−resolved near−infrared spectros−copy and imaging of the adult human brain”, Adv. Exp. Med.Biol. 662, 143–148 (2010).
66. L. Gagnon, M.A. Yucel, M. Dehaes, R.J. Cooper, K.L. Per−due, J. Selb, T.J. Huppert, R.D. Hoge, and D.A. Boas,“Quantification of the cortical contribution to the NIRS sig−nal over the motor cortex using concurrent NIRS−fMRI mea−surements”, Neuroimage 59, 3933–3940 (2012).
67. H. Karim, S.I. Fuhrman, P. Sparto, J. Furman, and T. Huppert,“Functional brain imaging of multi−sensory vestibular process−ing during computerized dynamic posturography using near−−infrared spectroscopy”, Neuroimage 74C, 318–325 (2013).
68. M. Kacprzak, A. Liebert, W. Staszkiewicz, A. Gabrusiewicz,P. Sawosz, G. Madycki, and R. Maniewski, “Application ofa time−resolved optical brain imager for monitoring cerebraloxygenation during carotid surgery”, J. Biomed. Opt. 17,016002 (2012).
69. A. Pifferi, A. Torricelli, L. Spinelli, D. Contini, R. Cubeddu,F. Martelli, G. Zaccanti, A. Tosi, A. Dalla Mora, F. Zappa,and S. Cova, “Time−resolved diffuse reflectance using smallsource−detector separation and fast single−photon gating”,Phys. Rev. Lett. 100, 138101 (2008).
70. M. Mazurenka, A. Jelzow, H. Wabnitz, D. Contini, L. Spi−nelli, A. Pifferi, R. Cubeddu, A.D. Mora, A. Tosi, F. Zappa,
and R. Macdonald, “Non−contact time−resolved diffuse ref−lectance imaging at null source−detector separation”, Opt.Express 20, 283–290 (2012).
71. P. Sawosz, N. Zolek, M. Kacprzak, R. Maniewski, and A.Liebert, “Application of time−gated CCD camera with imageintensifier in contactless detection of absorbing inclusionsburied in optically turbid medium which mimic local chan−ges in oxygenation of the brain tissue”, Opto−Electron. Rev.20, 309–314 (2012).
72. J. Selb, D.K. Joseph, and D.A. Boas, “Time−gated opticalsystem for depth−resolved functional brain imaging”, J.Biomed. Opt. 11, 044008 (2006).
73. P. Poulet, W. Uhring, W. Hanselmann, R. Glazenborg, F.Nouizi, V. Zint, and W. Hirschi, “A time−gated near−infraredspectroscopic imaging device for clinical applications” inProc. SPIE 8565, 85654M (2013).
74. P. Sawosz, M. Kacprzak, W. Weigl, A. Borowska−Solonynko,P. Krajewski, N. Zolek, B. Ciszek, R. Maniewski, and A. Lie−bert, “Experimental estimation of the photons visiting proba−bility profiles in time−resolved diffuse reflectance measure−ment”, Phys. Med. Biol. 57, 7973–7981 (2012).
75. J.C. Hebden, A. Gibson, T. Austin, R.M. Yusof, N. Everdell,D.T. Delpy, S.R. Arridge, J.H. Meek, and J.S. Wyatt, “Imag−ing changes in blood volume and oxygenation in the new−born infant brain using three−dimensional optical tomogra−phy”, Phys. Med. Biol. 49, 1117–1130 (2004).
76. M. Diop, K.M. Tichauer, J.T. Elliott, M. Migueis, T.Y. Lee,and K. St Lawrence, “Comparison of time−resolved and con−tinuous−wave near−infrared techniques for measuring cerebralblood flow in piglets”, J. Biomed. Opt. 15, 057004 (2010).
77. B. Montcel, R. Chabrier, and P. Poulet, “Detection of corticalactivation with time−resolved diffuse optical methods”, Appl.Opt. 44, 1942–1947 (2005).
78. D. Contini, A. Torricelli, A. Pifferi, L. Spinelli, F. Paglia,and R. Cubeddu, “Multi−channel time−resolved system forfunctional near infrared spectroscopy”, Opt. Express 14,5418–5432 (2006).
79. L. Ostergaard, “Cerebral perfusion imaging by bolus track−ing”, Top Magn. Reson. Imaging 15, 3–9 (2004).
80. L. Ostergaard, “Principles of cerebral perfusion imaging bybolus tracking”, J. Magn. Reson. Imaging 22, 710–717 (2005).
81. J. Woitzik, P.G. Pena−Tapia, U.C. Schneider, P. Vajkoczy,and C. Thome, “Cortical perfusion measurement by indocya−nine−green videoangiography in patients undergoing hemi−craniectomy for malignant stroke”, Stroke 37, 1549–5151(2006).
82. A. Gerega, N. Zolek, T. Soltysinski, D. Milej, P. Sawosz, B.Toczylowska, and A. Liebert, “Wavelength−resolved mea−surements of fluorescence lifetime of indocyanine green”, J.Biomed. Opt. 16, 067010 (2011).
83. A. Oldag, M. Goertler, A.K. Bertz, S. Schreiber, C. Stoppel,H.J. Heinze, and K. Kopitzki, “Assessment of cortical hemo−dynamics by multichannel near−infrared spectroscopy insteno−occlusive disease of the middle cerebral artery”, Stroke43, 2980–2985 (2012).
84. J.T. Elliott, D. Milej, A. Gerega, W. Weigl, M. Diop, L.B.Morrison, T.Y. Lee, A. Liebert, and K. St Lawrence, “Varianceof time−of−flight distribution is sensitive to cerebral blood flowas demonstrated by ICG bolus−tracking measurements in adultpigs”, Biomed. Opt. Express 4, 206–218 (2013).
Opto−Electron. Rev., 22, no. 1, 2014 D. Milej 67
Related Documents