Time Frequency Analysis • We want to see how the frequencies of a signal change with time. • Typical example of a Time/Frequency representation: time log(fre q)

Time Frequency Analysis We want to see how the frequencies of a signal change with time. Typical example of a Time/Frequency representation: time log(freq)
Dec 13, 2015
Welcome message from author
This document is posted to help you gain knowledge. Please leave a comment to let me know what you think about it! Share it to your friends and learn new things together.
Transcript
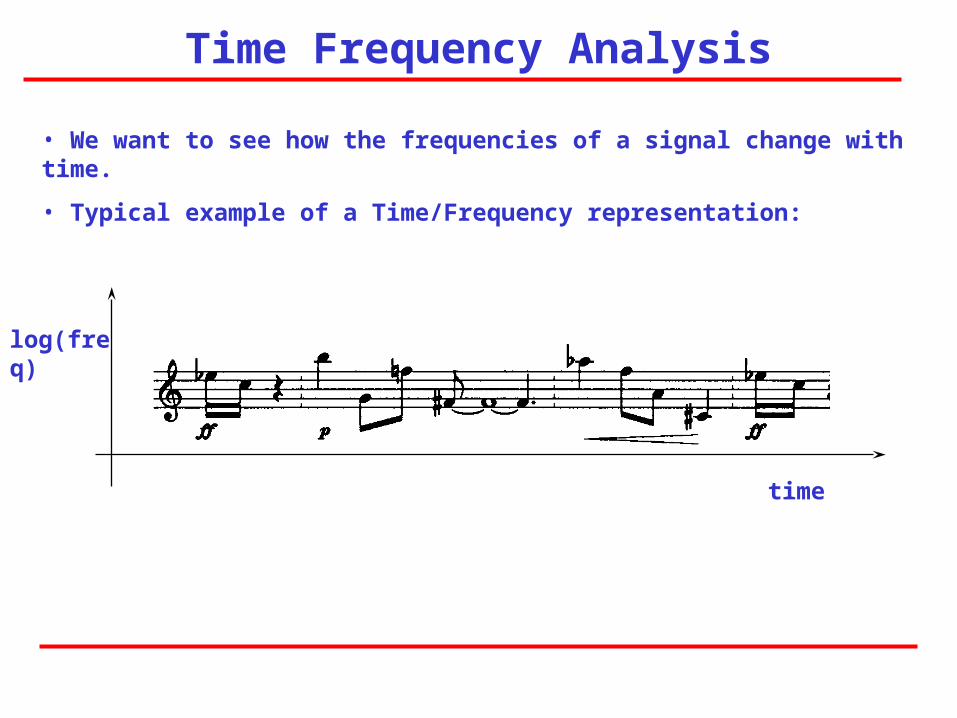
Time Frequency Analysis
• We want to see how the frequencies of a signal change with time.
• Typical example of a Time/Frequency representation:
time
log(freq)
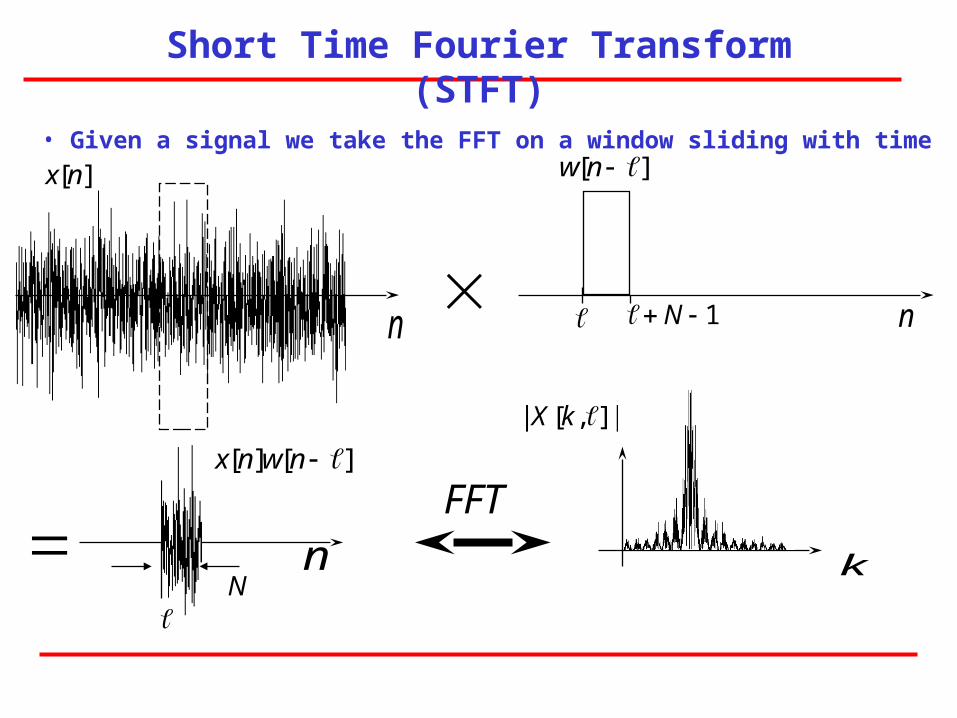
Short Time Fourier Transform (STFT)
• Given a signal we take the FFT on a window sliding with time
][nx
n
][][ nwnx
][ nw
FFT
|],[| kX
n
n
k
1N
N
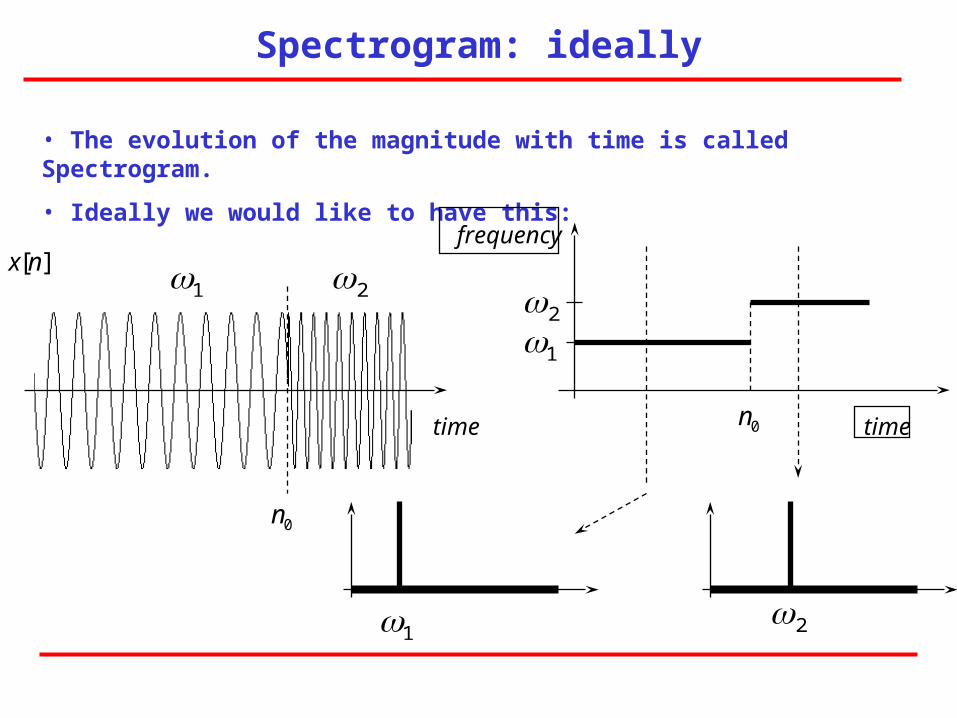
Spectrogram: ideally
• The evolution of the magnitude with time is called Spectrogram.
• Ideally we would like to have this:
1
time
0n
][nx
time
frequency
1 2
12
2
0n

Spectrogram: in practice
• We need to deal with the effects of the window: main lobe and sidelobes
time
frequency
12
21
Nm
2
N
FmF S
N STNt
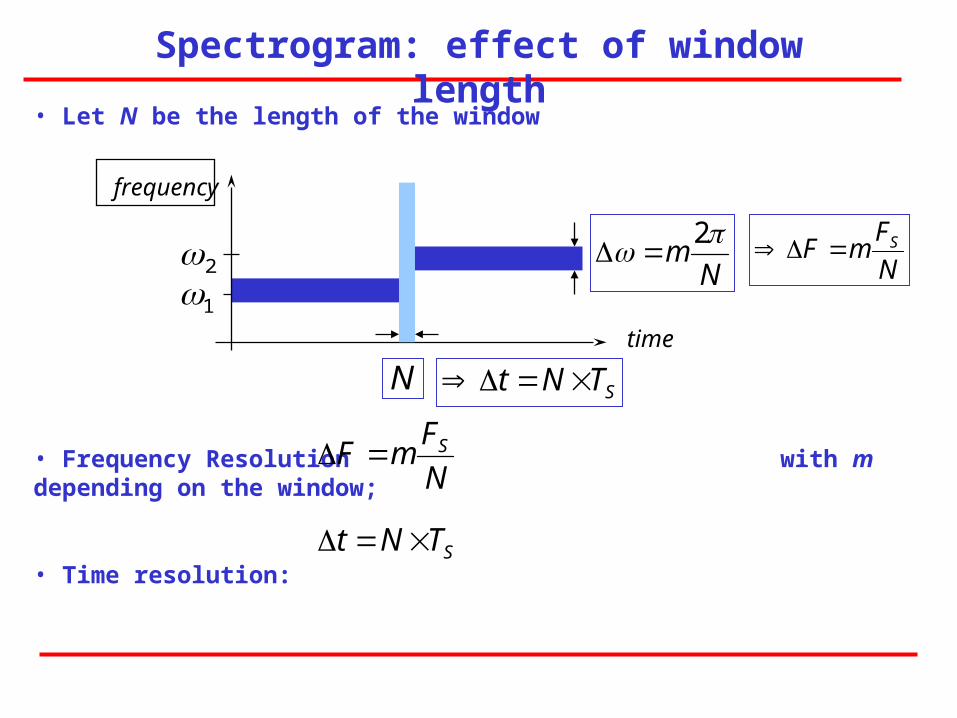
Spectrogram: effect of window length
• Let N be the length of the window
• Frequency Resolution with m depending on the window;
• Time resolution:
N
FmF S
STNt
time
frequency
12
N
Nm
2
N
FmF S
STNt
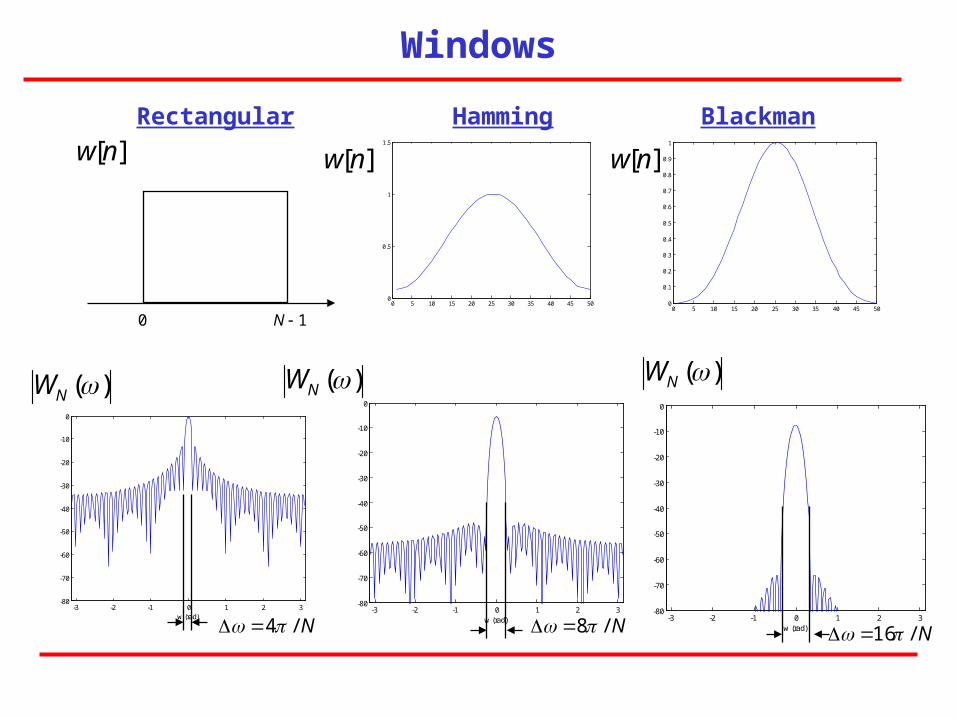
Windows
0 5 10 15 20 25 30 35 40 45 500
0.5
1
1.5
-3 -2 -1 0 1 2 3-80
-70
-60
-50
-40
-30
-20
-10
0
w (rad)
0 5 10 15 20 25 30 35 40 45 500
0.1
0.2
0.3
0.4
0.5
0.6
0.7
0.8
0.9
1
-3 -2 -1 0 1 2 3-80
-70
-60
-50
-40
-30
-20
-10
0
w (rad)-3 -2 -1 0 1 2 3
-80
-70
-60
-50
-40
-30
-20
-10
0
w (rad)
0 1N
Rectangular Hamming Blackman
][nw ][nw ][nw
)(NW )(NW )(NW
N/4 N/8 N/16
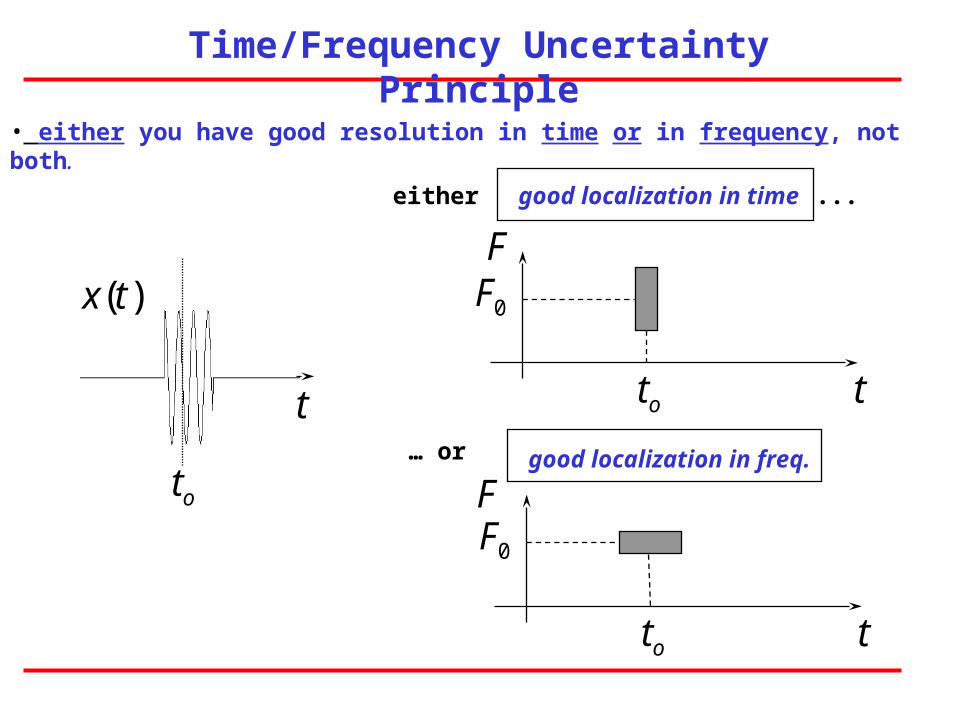
• either you have good resolution in time or in frequency, not both.
t
F
to
F0
t
F
to
F0
to
t
x t( )
good localization in time
good localization in freq.
either
… or
...
Time/Frequency Uncertainty Principle
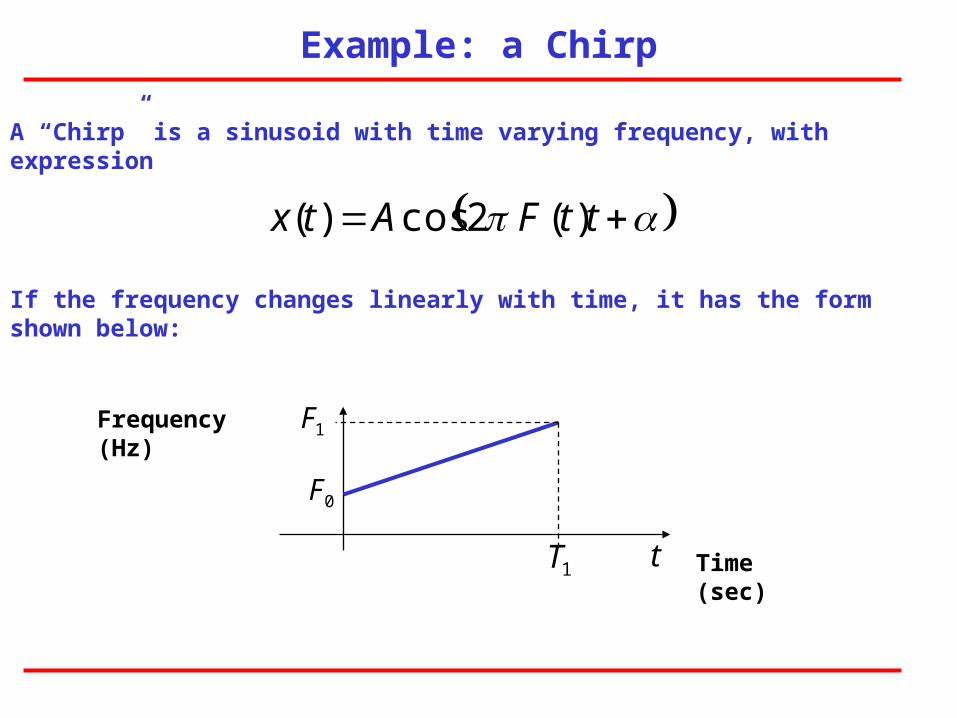
Example: a Chirp
ttFAtx )(2cos)(
A “Chirp” is a sinusoid with time varying frequency, with expression
If the frequency changes linearly with time, it has the form shown below:
0F
1F
t1T Time (sec)
Frequency (Hz)
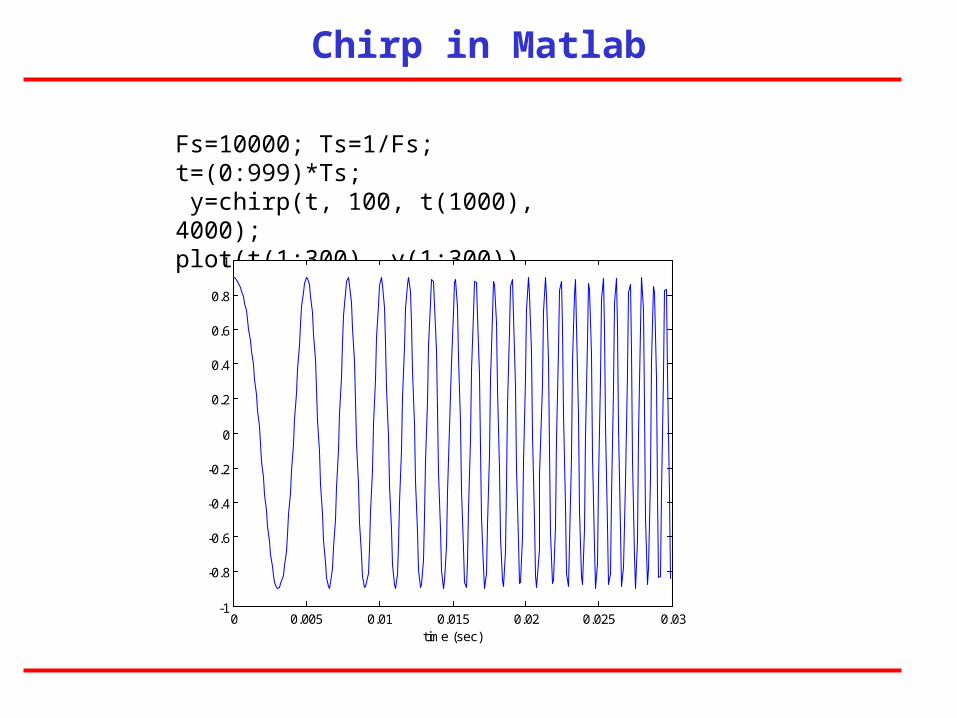
Chirp in Matlab
Fs=10000; Ts=1/Fs; t=(0:999)*Ts; y=chirp(t, 100, t(1000), 4000);plot(t(1:300), y(1:300))
0 0.005 0.01 0.015 0.02 0.025 0.03-1
-0.8
-0.6
-0.4
-0.2
0
0.2
0.4
0.6
0.8
1
time (sec)
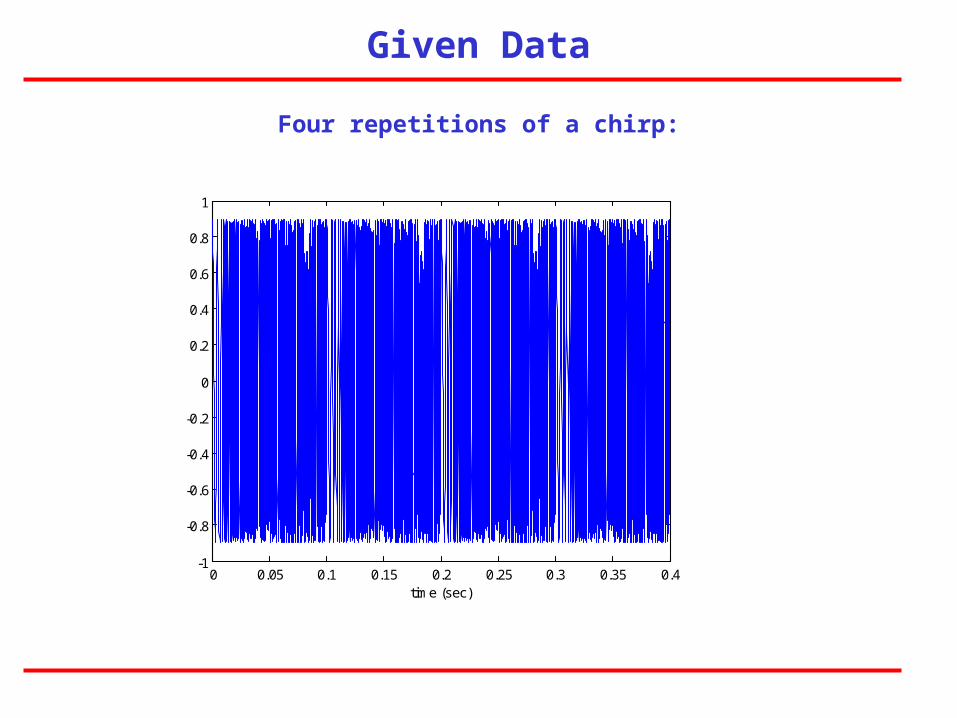
Given Data
0 0.05 0.1 0.15 0.2 0.25 0.3 0.35 0.4-1
-0.8
-0.6
-0.4
-0.2
0
0.2
0.4
0.6
0.8
1
time (sec)
Four repetitions of a chirp:
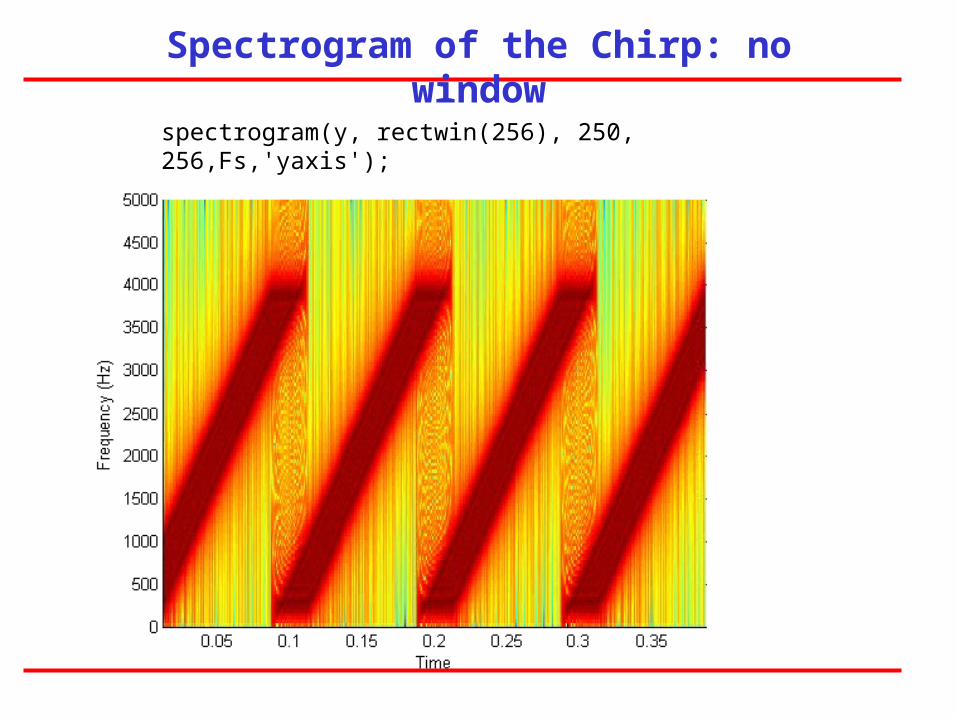
Spectrogram of the Chirp: no window
spectrogram(y, rectwin(256), 250, 256,Fs,'yaxis');
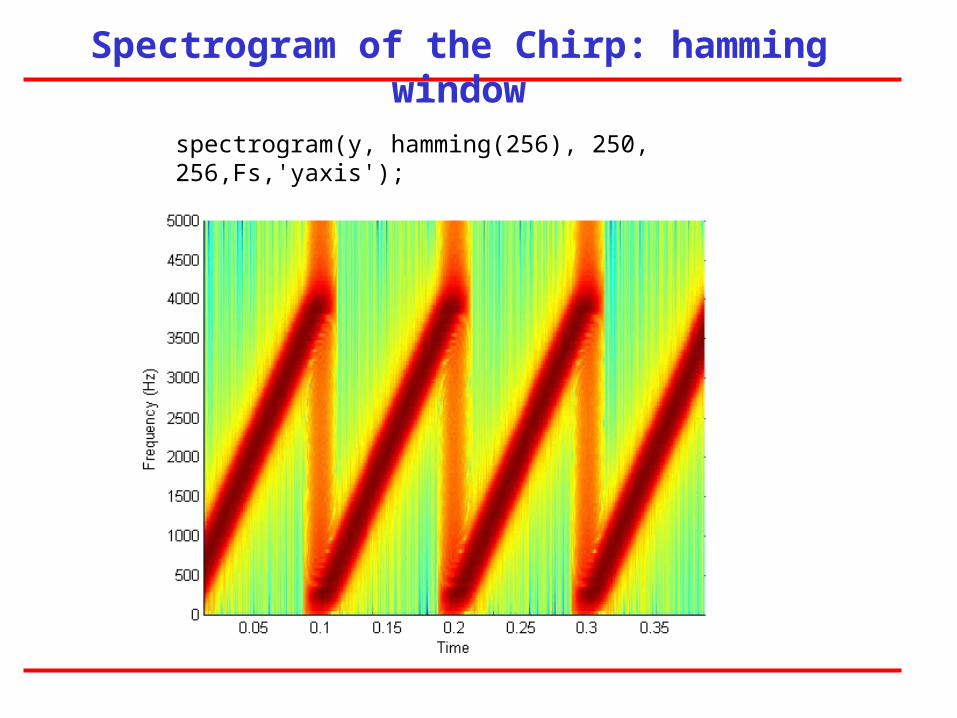
Spectrogram of the Chirp: hamming window
spectrogram(y, hamming(256), 250, 256,Fs,'yaxis');
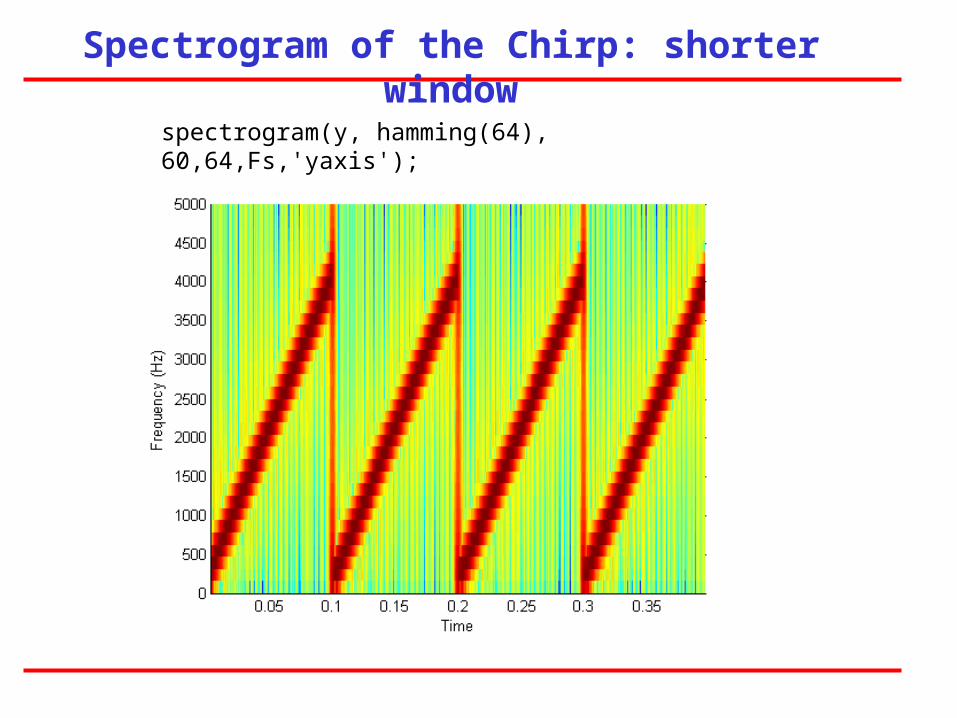
Spectrogram of the Chirp: shorter window
spectrogram(y, hamming(64), 60,64,Fs,'yaxis');
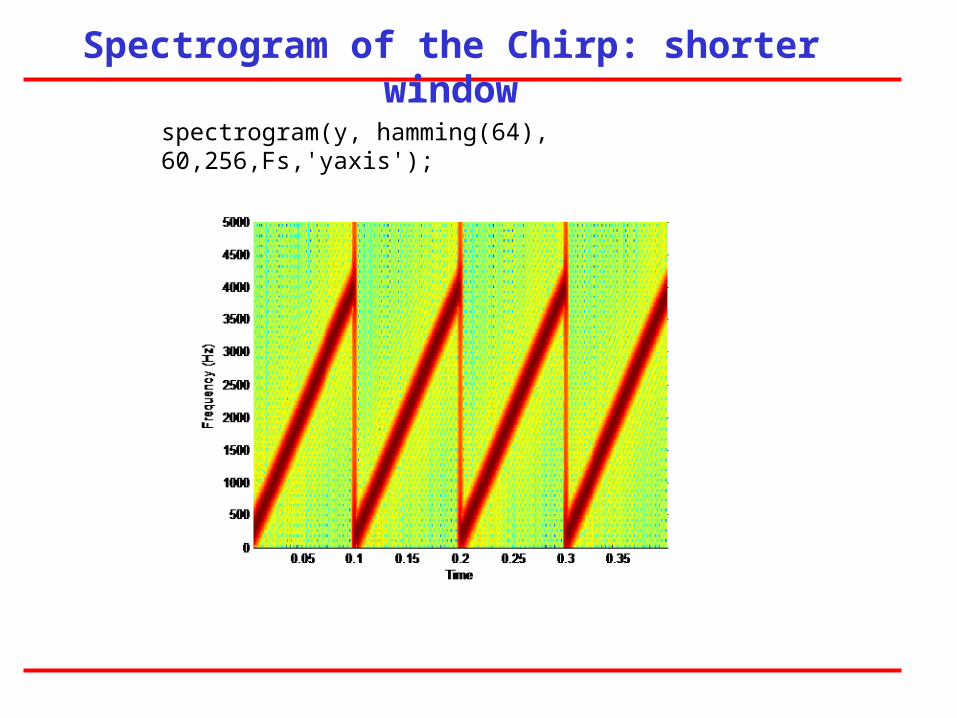
Spectrogram of the Chirp: shorter window
spectrogram(y, hamming(64), 60,256,Fs,'yaxis');
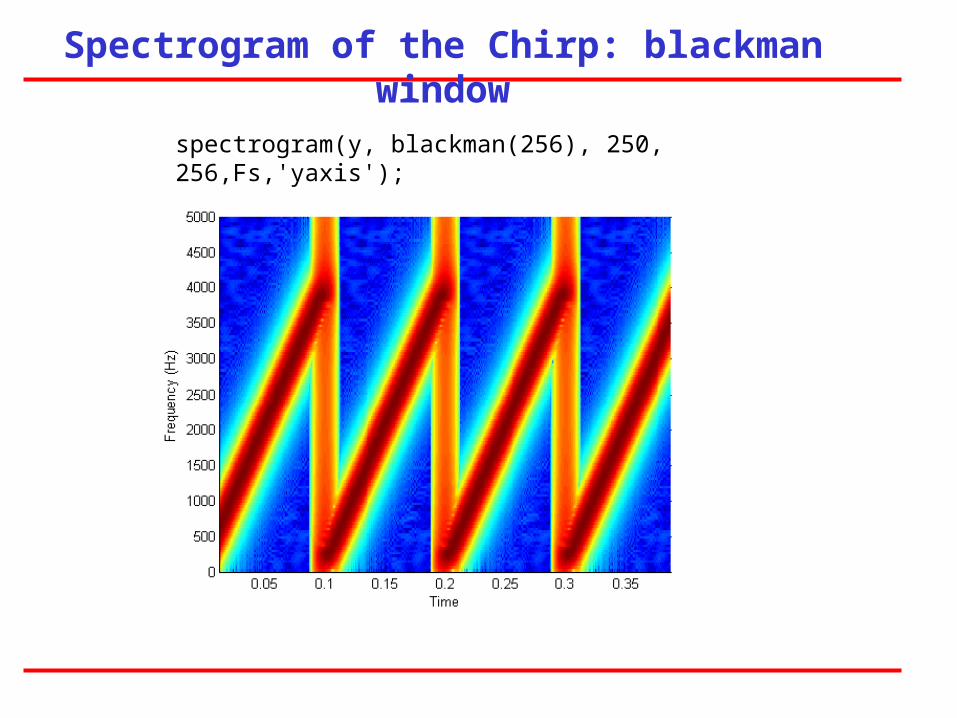
Spectrogram of the Chirp: blackman window
spectrogram(y, blackman(256), 250, 256,Fs,'yaxis');
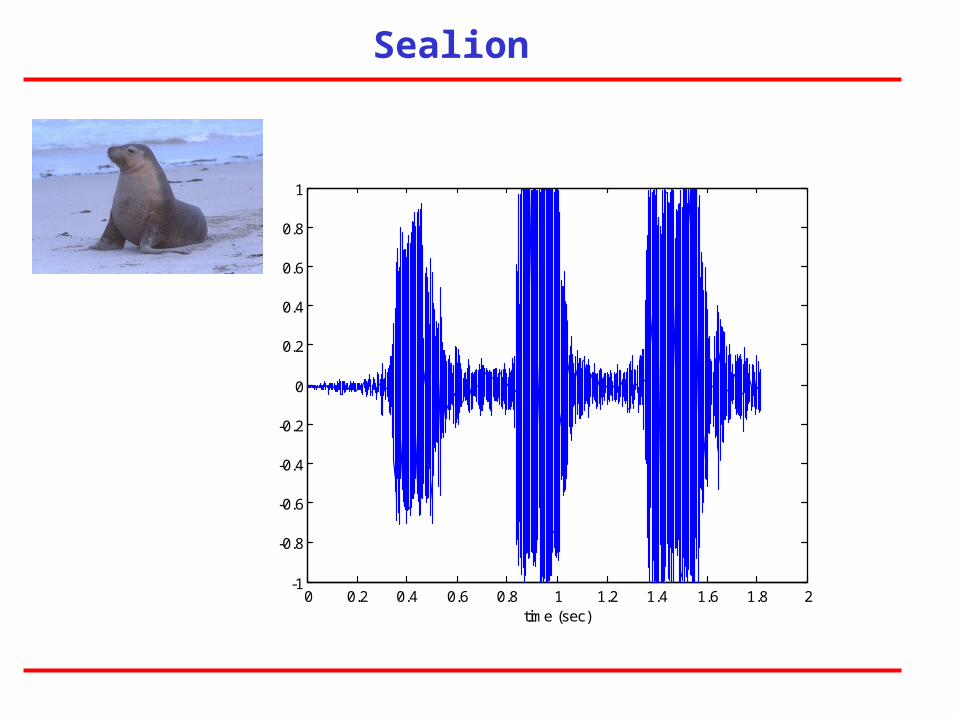
Sealion
0 0.2 0.4 0.6 0.8 1 1.2 1.4 1.6 1.8 2-1
-0.8
-0.6
-0.4
-0.2
0
0.2
0.4
0.6
0.8
1
time (sec)
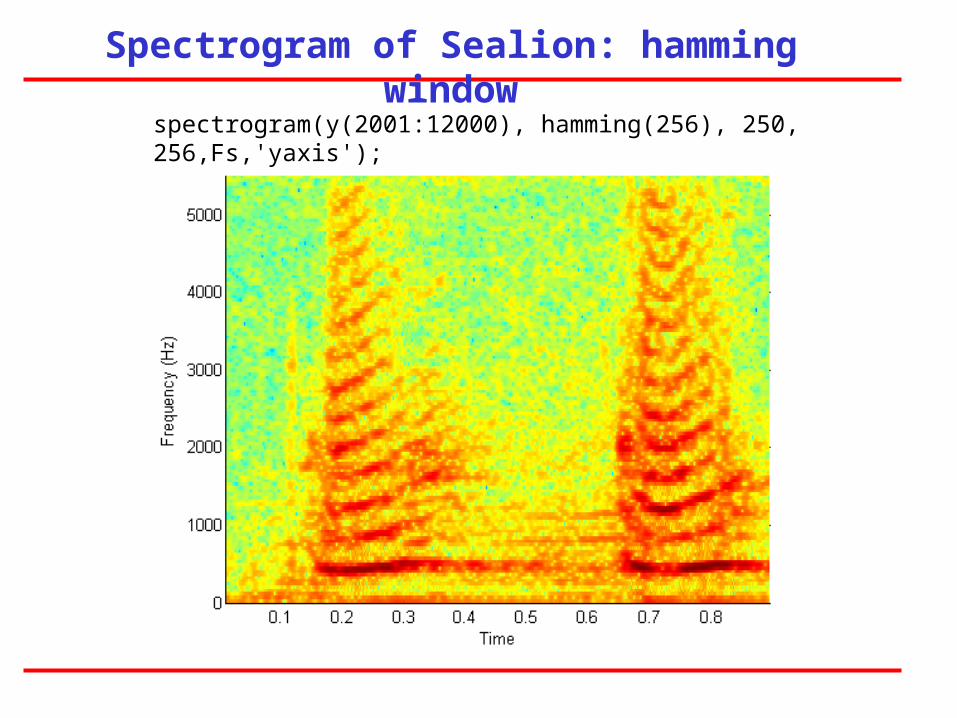
Spectrogram of Sealion: hamming window
spectrogram(y(2001:12000), hamming(256), 250, 256,Fs,'yaxis');
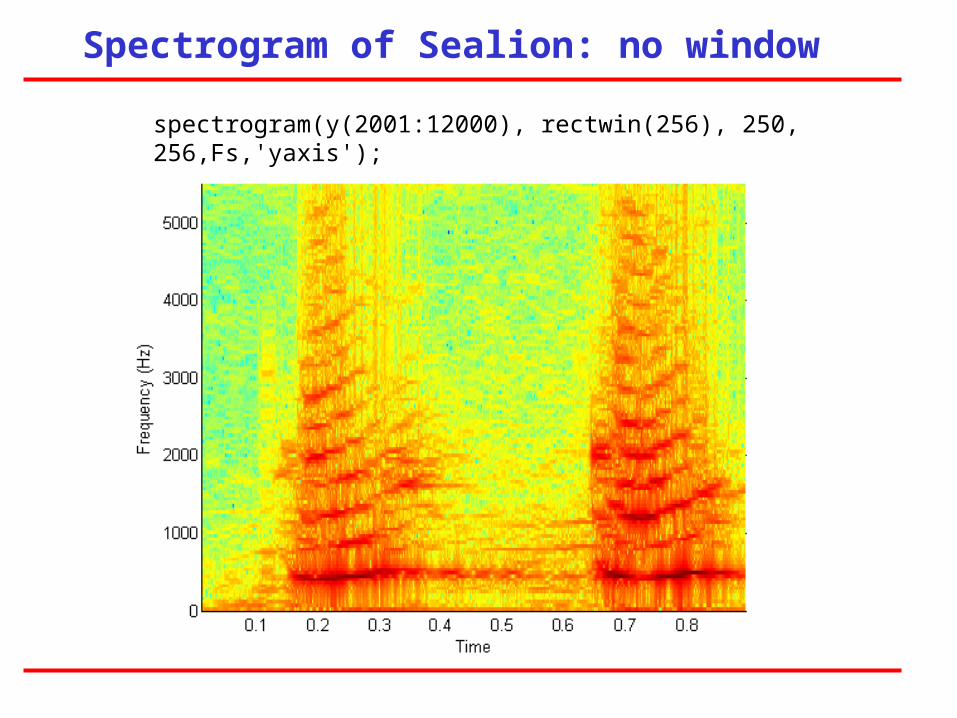
Spectrogram of Sealion: no window
spectrogram(y(2001:12000), rectwin(256), 250, 256,Fs,'yaxis');
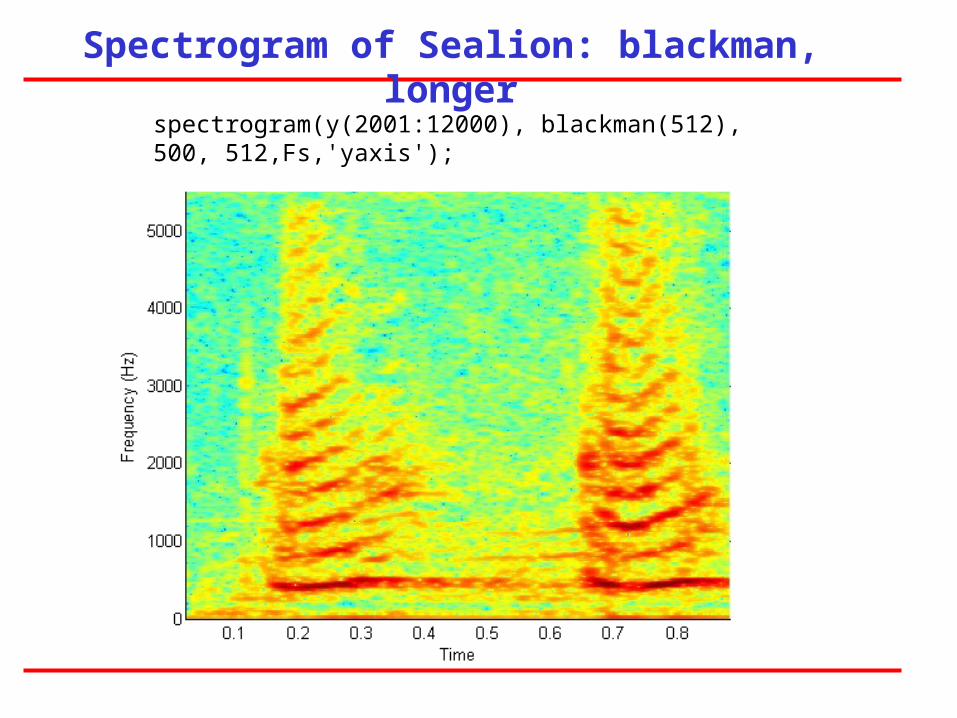
Spectrogram of Sealion: blackman, longer
spectrogram(y(2001:12000), blackman(512), 500, 512,Fs,'yaxis');
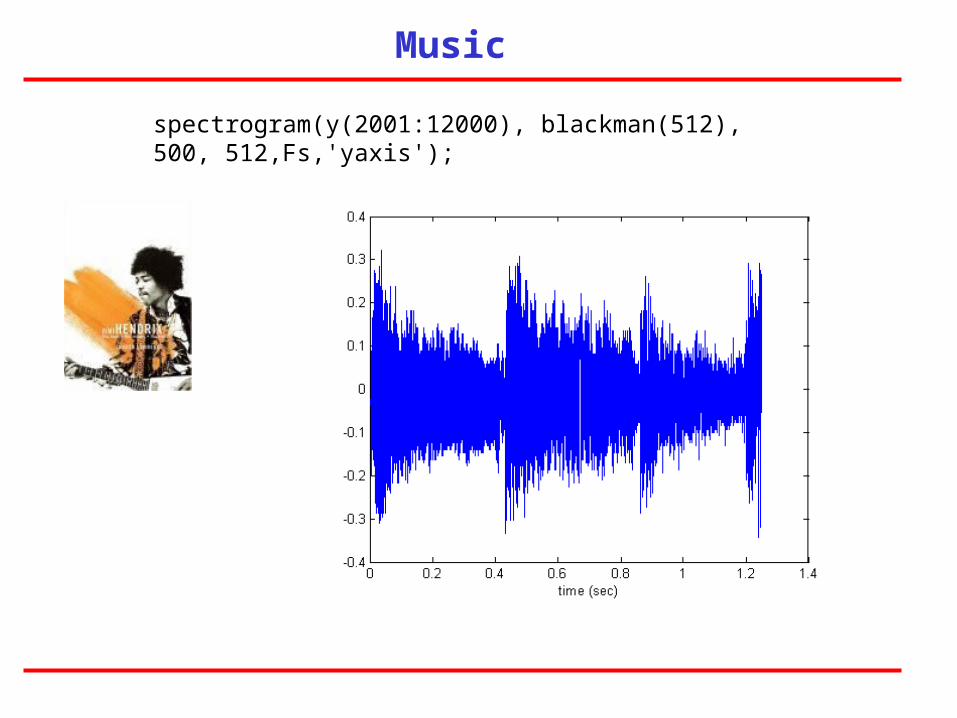
Music
spectrogram(y(2001:12000), blackman(512), 500, 512,Fs,'yaxis');
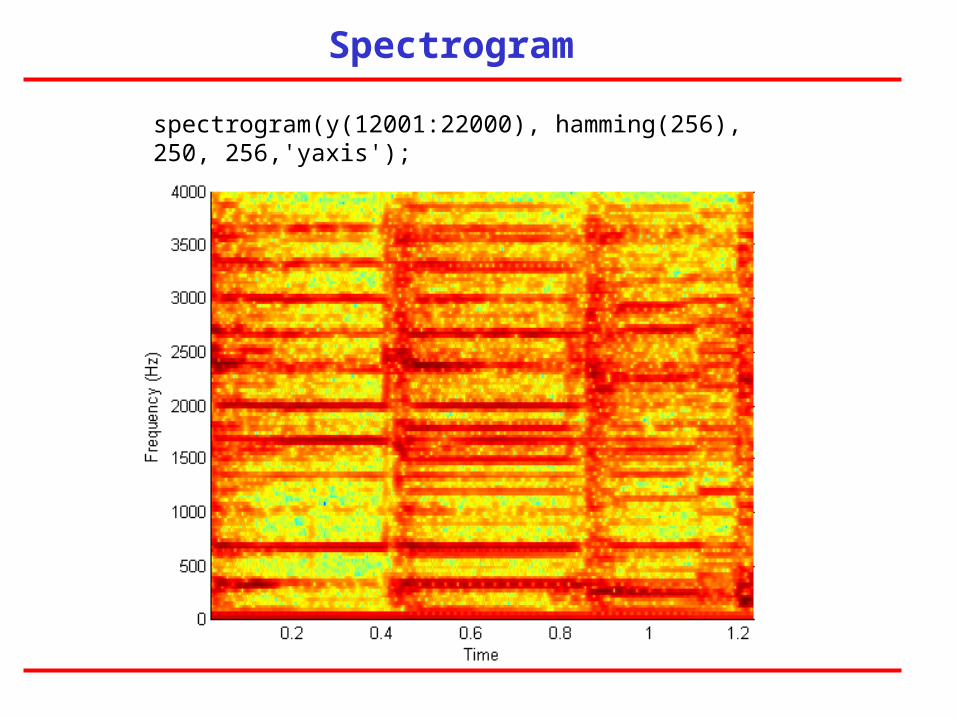
Spectrogram
spectrogram(y(12001:22000), hamming(256), 250, 256,'yaxis');
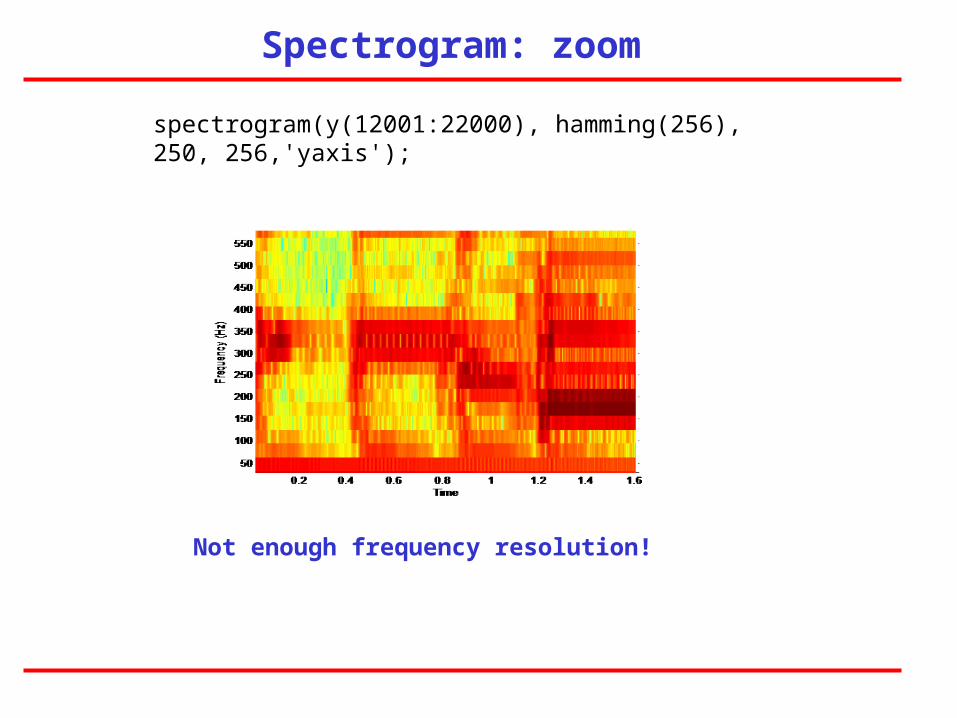
Spectrogram: zoom
spectrogram(y(12001:22000), hamming(256), 250, 256,'yaxis');
Not enough frequency resolution!
Frequencies we expect to see
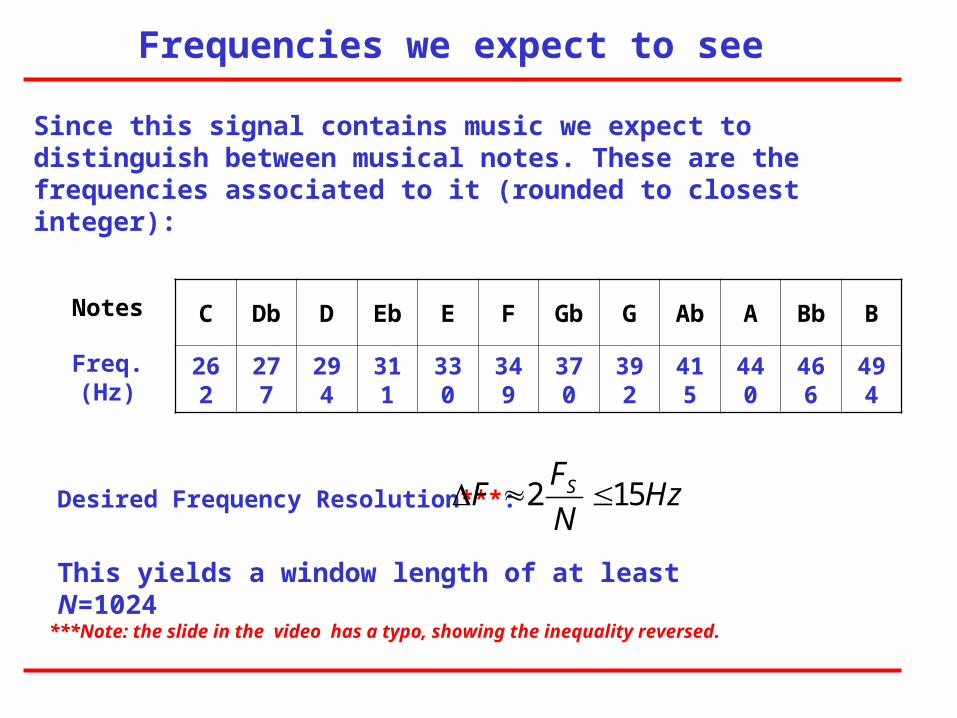
Since this signal contains music we expect to distinguish between musical notes. These are the frequencies associated to it (rounded to closest integer):
C Db D Eb E F Gb G Ab A Bb B
262 277 294 311 330 349 370 392 415 440 466 494
Notes
Freq. (Hz)
Desired Frequency Resolution***: 2 15SFF HzN
This yields a window length of at least N=1024
***Note: the slide in the video has a typo, showing the inequality reversed.
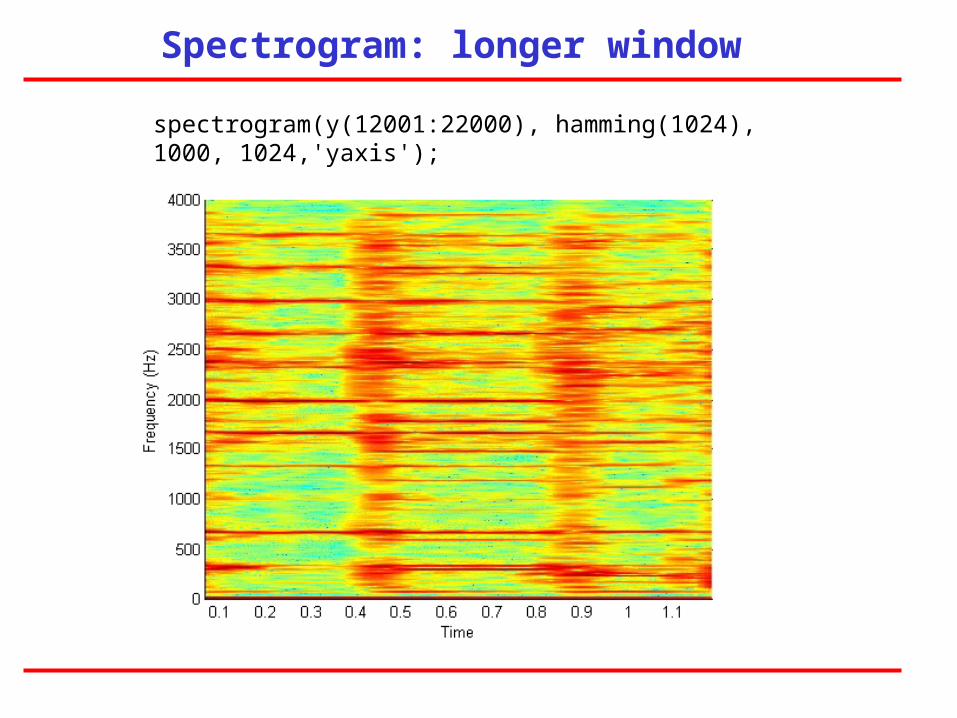
Spectrogram: longer window
spectrogram(y(12001:22000), hamming(1024), 1000, 1024,'yaxis');
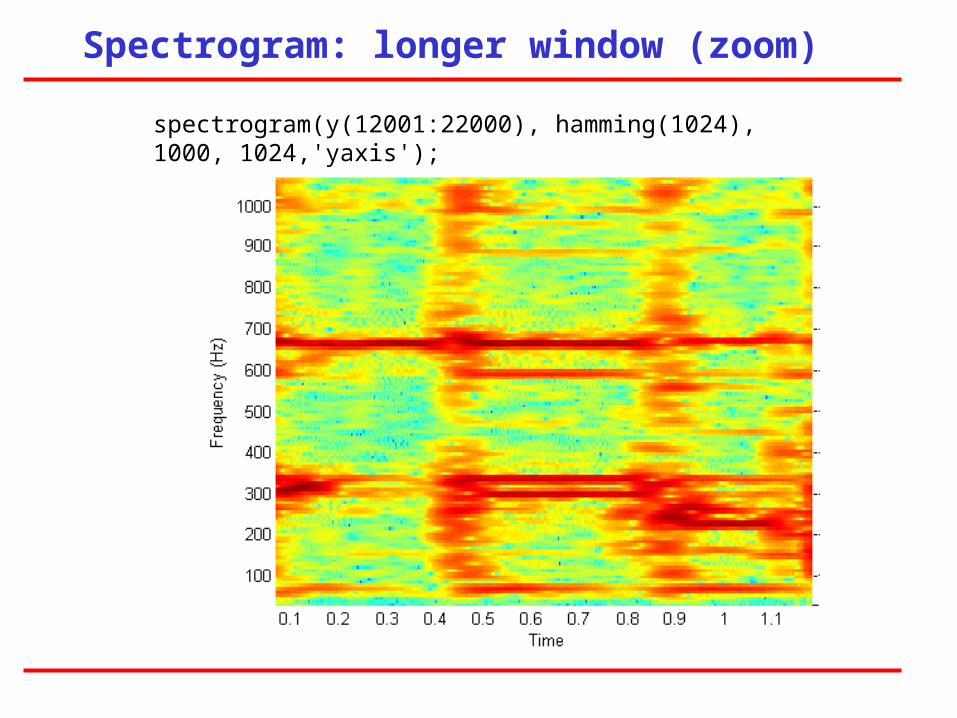
Spectrogram: longer window (zoom)
spectrogram(y(12001:22000), hamming(1024), 1000, 1024,'yaxis');
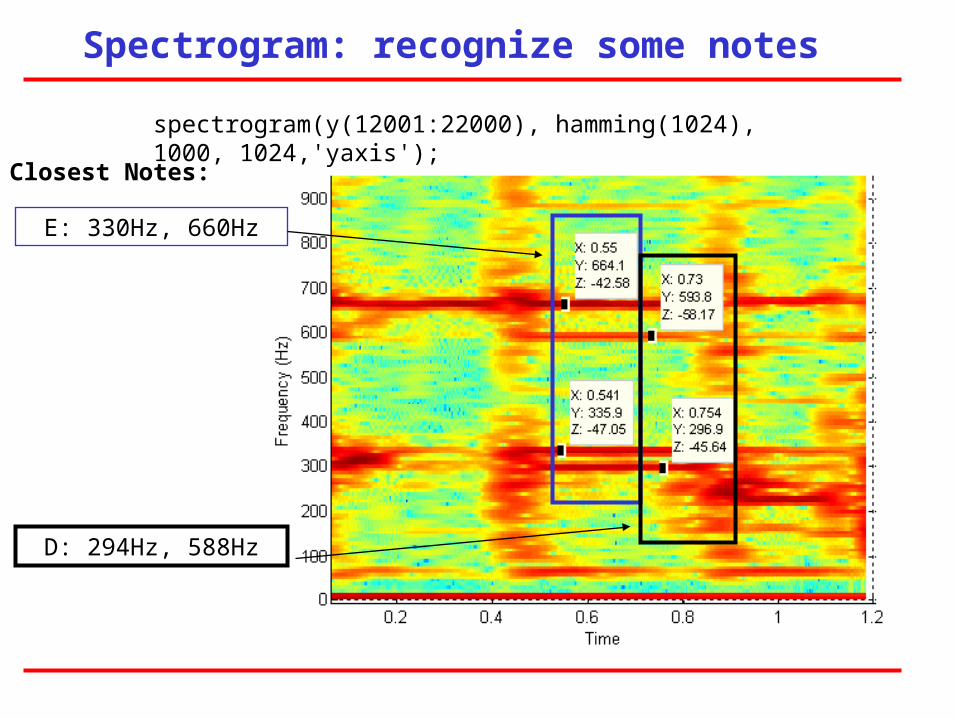
Spectrogram: recognize some notes
spectrogram(y(12001:22000), hamming(1024), 1000, 1024,'yaxis');
E: 330Hz, 660Hz
D: 294Hz, 588Hz
Closest Notes:
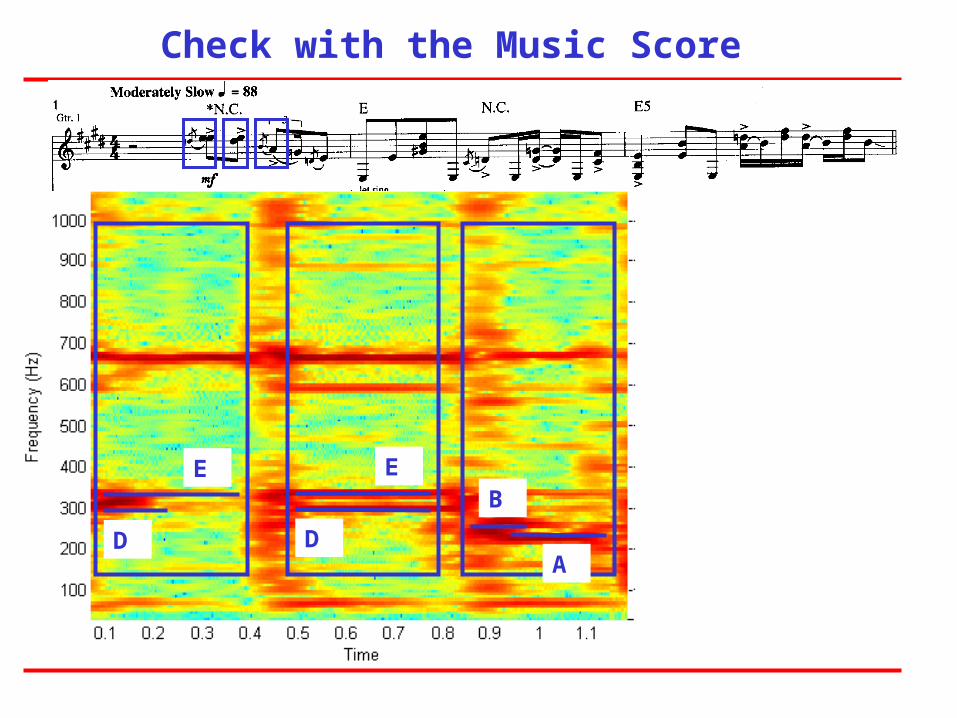
Check with the Music Score
E
D
E
D
B
A
Related Documents