Time-dependent effects of isoflurane and dexmedetomidine on functional connectivity, spectral characteristics, and spatial distribution of spontaneous BOLD fluctuations Matthew Evan Magnuson, Garth John Thompson, Wen-Ju Pan* and Shella Dawn Keilholz Q2 * Anesthesia is often necessary to perform fMRI experiments in the rodent model; however, commonly used anesthetic protocols may manifest changing brain conditions over the duration of the study. This possibility was explored in the current work. Eleven rats were anesthetized with 2% isoflurane anesthesia; four rats were anesthe- tized for a short period (30 min, simulating induction and fMRI setup) and seven rats were anesthetized for a long period (3 h, simulating surgical preparation). Following the initial anesthetic period, isoflurane was discontinued, and a dexmedetomidine bolus (0.025 mg/kg) and continuous subcutaneous infusion (0.05 mg/kg/h) were admi- nistered. Blood-oxygen-level dependent resting state imaging was performed every 30 min from 0.75 h post dexmedetomidine bolus until 5.75 h post-bolus. Evaluation of power spectra obtained from time courses in the pri- mary somatosensory cortex revealed, in general, a monotonic increase in low-frequency power (0.05–0.3 Hz) in both groups over the duration of resting state imaging. Greater low-band spectral power (0.05–0.15 Hz) is present in the short isoflurane group for the first 2.75 h, but the spectra become highly uniform at 3.25 h. The emergence of a ~0.18 Hz peak, beginning at the 3.75 h time point, exists in both groups and evolves similarly, increasing in strength as the duration of dexmedetomidine sedation (and time since isoflurane cessation) extends. In the long isoflurane group only, bilateral functional connectivity strengthens with anesthetic duration, and correlation is linearly linked to low-band spectral power. Convergence of connectivity and spectral metrics between the short and long isoflurane groups occurs at ~3.25 h, suggesting the effects of isoflurane have subsided. Researchers using dexmedetomidine following isoflurane for functional studies should be aware of the duration specific effects of the pre-scan isoflurane durations as well as the continuing influences of long-term imaging under dexmedetomidine. Copyright © 2014 John Wiley & Sons, Ltd. Additional supporting information may be found in the online version of this article at the publisher’s web-site. Keywords: dexmedetomidine; resting-state fMRI; BOLD; physiology; power spectra; functional connectivity; spatiotemporal dynamics; isoflurane INTRODUCTION Animal models are a powerful tool, allowing for the detailed and often invasive investigation into analogues of human dis- ease, structure, and function. Animal models have provided an ideal platform to study the origin and functions of the blood-oxygen-level dependent (BOLD) signal and functional connectivity in fMRI; however, one complication is that anes- thesia is commonly required to prevent movement and allevi- ate pain or anxiety. In BOLD fMRI using rodents, anesthesia is almost always used, but it introduces confounding influences to the function of the neural and vascular architecture of the brain (1–7). Anesthesia directly affects basal neuronal activity as well as the coupling between neurons and the vasculature (8), so understanding an anesthesia’ s effect on neural activity and BOLD data is vital for interpreting functional MRI data. Isoflurane is commonly used to induce anesthesia, perform surgical procedures, and maintain a deep level of unconscious- ness in rodents during setup for fMRI (5–7,9,10). Anesthesia is typically switched to an agent that is less suppressive of neural activity for the imaging portion of the experiment, although isoflurane has been used during imaging as well (11–13). Isoflurane’ s anesthetic mechanism is not well understood, but it is known that is acts on GABA receptors, potassium channels, and the GLT1/EAAT2 glial glutamate transporter, resulting in complex interrelationships producing the desired anesthetic state (14). At high isoflurane doses (>1.8%) widespread cortical neural burst suppression results in reduced cortical excitation * Correspondence to: W.-J. Pan and S. D. Keilholz, Georgia Institute of Technol- ogy and Emory University, Biomedical Engineering, Atlanta, GA, USA. E-mail: [email protected]; [email protected] Q1 M. E. Magnuson, G. J. Thompson, W.-J. Pan, S. D. Keilholz Georgia Institute of Technology and Emory University Biomedical Engineering, Atlanta, GA, USA Abbreviations used: BOLD, blood-oxygen-level dependent; CNS, central ner- vous system; fcMRI, functional connectivity magnetic resonance imaging; S1, primary somatosensory cortex; CoM, center of mass; SGoF, sequential good- ness of fit; SEM, squared error of the mean, EPI, echo planar imaging. Research article Received: 19 July 2012, Revised: 17 November 2013, Accepted: 22 November 2013, Published online in Wiley Online Library (wileyonlinelibrary.com) DOI: 10.1002/nbm.3062 NMR Biomed. 2014 Copyright © 2014 John Wiley & Sons, Ltd. 1 Journal Code Article ID Dispatch: 10.01.14 CE: N B M 3 0 6 2 No. of Pages: 13 ME: 1 2 3 4 5 6 7 8 9 10 11 12 13 14 15 16 17 18 19 20 21 22 23 24 25 26 27 28 29 30 31 32 33 34 35 36 37 38 39 40 41 42 43 44 45 46 47 48 49 50 51 52 53 54 55 56 57 58 59 60 61 62 63 64 65 66 67 68 69 70 71 72 73 74 75 76 77 78 79 80 81 82 83 84 85 86 87 88 89 90 91 92 93 94 95 96 97 98 99 100 101 102 103 104 105 106 107 108 109 110 111 112 113 114 115 116 117 118 119 120 121 122 123 124 125 126 127 128 129 130

Welcome message from author
This document is posted to help you gain knowledge. Please leave a comment to let me know what you think about it! Share it to your friends and learn new things together.
Transcript

Time-dependent effects of isoflurane anddexmedetomidine on functional connectivity,spectral characteristics, and spatialdistribution of spontaneous BOLD fluctuationsMatthew Evan Magnuson, Garth John Thompson, Wen-Ju Pan*and Shella Dawn KeilholzQ2 *
Anesthesia is often necessary to perform fMRI experiments in the rodent model; however, commonly usedanesthetic protocols may manifest changing brain conditions over the duration of the study. This possibility wasexplored in the current work. Eleven rats were anesthetized with 2% isoflurane anesthesia; four rats were anesthe-tized for a short period (30min, simulating induction and fMRI setup) and seven rats were anesthetized for a longperiod (3 h, simulating surgical preparation). Following the initial anesthetic period, isoflurane was discontinued,and a dexmedetomidine bolus (0.025mg/kg) and continuous subcutaneous infusion (0.05mg/kg/h) were admi-nistered. Blood-oxygen-level dependent resting state imaging was performed every 30min from 0.75 h postdexmedetomidine bolus until 5.75 h post-bolus. Evaluation of power spectra obtained from time courses in the pri-mary somatosensory cortex revealed, in general, a monotonic increase in low-frequency power (0.05–0.3Hz) in bothgroups over the duration of resting state imaging. Greater low-band spectral power (0.05–0.15Hz) is present in theshort isoflurane group for the first 2.75 h, but the spectra become highly uniform at 3.25h. The emergence of a~0.18Hz peak, beginning at the 3.75 h time point, exists in both groups and evolves similarly, increasing in strengthas the duration of dexmedetomidine sedation (and time since isoflurane cessation) extends. In the long isofluranegroup only, bilateral functional connectivity strengthens with anesthetic duration, and correlation is linearly linkedto low-band spectral power. Convergence of connectivity and spectral metrics between the short and long isofluranegroups occurs at ~3.25 h, suggesting the effects of isoflurane have subsided. Researchers using dexmedetomidinefollowing isoflurane for functional studies should be aware of the duration specific effects of the pre-scan isofluranedurations as well as the continuing influences of long-term imaging under dexmedetomidine. Copyright © 2014John Wiley & Sons, Ltd.Additional supporting information may be found in the online version of this article at the publisher’s web-site.
Keywords: dexmedetomidine; resting-state fMRI; BOLD; physiology; power spectra; functional connectivity; spatiotemporaldynamics; isoflurane
INTRODUCTION
Animal models are a powerful tool, allowing for the detailedand often invasive investigation into analogues of human dis-ease, structure, and function. Animal models have providedan ideal platform to study the origin and functions of theblood-oxygen-level dependent (BOLD) signal and functionalconnectivity in fMRI; however, one complication is that anes-thesia is commonly required to prevent movement and allevi-ate pain or anxiety. In BOLD fMRI using rodents, anesthesia isalmost always used, but it introduces confounding influencesto the function of the neural and vascular architecture of thebrain (1–7). Anesthesia directly affects basal neuronal activityas well as the coupling between neurons and the vasculature(8), so understanding an anesthesia’s effect on neural activityand BOLD data is vital for interpreting functional MRI data.Isoflurane is commonly used to induce anesthesia, perform
surgical procedures, and maintain a deep level of unconscious-ness in rodents during setup for fMRI (5–7,9,10). Anesthesia istypically switched to an agent that is less suppressive of neural
activity for the imaging portion of the experiment, althoughisoflurane has been used during imaging as well (11–13).Isoflurane’s anesthetic mechanism is not well understood, butit is known that is acts on GABA receptors, potassium channels,and the GLT1/EAAT2 glial glutamate transporter, resulting incomplex interrelationships producing the desired anestheticstate (14). At high isoflurane doses (>1.8%) widespread corticalneural burst suppression results in reduced cortical excitation
* Correspondence to: W.-J. Pan and S. D. Keilholz, Georgia Institute of Technol-ogy and Emory University, Biomedical Engineering, Atlanta, GA, USA.E-mail: [email protected]; [email protected] Q1
M. E. Magnuson, G. J. Thompson, W.-J. Pan, S. D. KeilholzGeorgia Institute of Technology and Emory University Biomedical Engineering,Atlanta, GA, USA
Abbreviations used: BOLD, blood-oxygen-level dependent; CNS, central ner-vous system; fcMRI, functional connectivity magnetic resonance imaging; S1,primary somatosensory cortex; CoM, center of mass; SGoF, sequential good-ness of fit; SEM, squared error of the mean, EPI, echo planar imaging.
Research article
Received: 19 July 2012, Revised: 17 November 2013, Accepted: 22 November 2013, Published online in Wiley Online Library
(wileyonlinelibrary.com) DOI: 10.1002/nbm.3062
NMR Biomed. 2014 Copyright © 2014 John Wiley & Sons, Ltd.
1Journal Code Article ID Dispatch: 10.01.14 CE:
N B M 3 0 6 2 No. of Pages: 13 ME:
1234567891011121314151617181920212223242526272829303132333435363738394041424344454647484950515253545556575859606162636465
66676869707172737475767778798081828384858687888990919293949596979899100101102103104105106107108109110111112113114115116117118119120121122123124125126127128129130
Shella
Sticky Note
Name is correct as written
Shella
Sticky Note
email address is correct
(14,15) and reduced spatial sensitivity of functional connectiv-ity (13), while at lower dosages (<1.5%) functional activityand connectivity remain fairly intact (11–13,16). It has beendemonstrated that it takes nearly an hour following isofluranediscontinuation for the end tidal volumes of isoflurane todrop below 0.1% following relatively short isoflurane para-digms (17). This residual isoflurane likely introduces lingeringeffects on both neural activity (continued neural suppression)and the vasculature (continued vasodilation) that must beconsidered.
Dexmedetomidine is a α2-adrenergic receptor agonist whichselectively binds to and stimulates α2-adrenergic receptorsafter crossing the blood–brain barrier. It is also a vasoconstric-tor (18,19). Dexmedetomidine acts by inhibiting adenylylcyclase activity, causing a reduction of firing rates of locuscereleus noradrenergic neurons, thus leading to sedation (20).Unlike many other anesthetics, which deeply suppress centralnervous system (CNS) activity (21), dexmedetomidine inducesa neural state very similar to natural sleep (20) while simul-taneously causing muscular relaxation. The drug was previouslyformulated as medetomidine, which contains the activeenantiomer, dexmedetomidine, used in the current experi-ment. (In 2009, Pfizer discontinued medetomidine (Domitor)in their veterinary line and switched to dexmedetomidine(Dexdomitor)). The two drugs have nearly identical effects onthe rodent; however, the dosing of dexmedetomidine is halfthat of medetomidine (22).
α-chloralose was once the anesthetic of choice for fMRIstudies, allowing for well preserved brain activity andneurovascular coupling (1,23–25); however, the experimentalsetup was complicated and the experiments terminal. In 2006,Weber et al. presented a protocol using medetomidine seda-tion allowing for longitudinal fMRI studies to be performed inrats (10). Weber’s protocol provided long-term stable physio-logical conditions, a reproducible and expected BOLD responseto forepaw stimulation (matching previous α-chloralosestudies), adequate sedation, simple subcutaneous administra-tion, and finally a quick reversal and full recovery of the rodentfollowing experimentation. This was a drastic improvementover previously accepted protocols, allowing for longitudinalstudies of fMRI in the rodent model. Following Weber’s work,Pawela et al. released a study pointing to the advantages ofstepping up the anesthetic dosage two hours after the initialbolus in order to maintain stable physiology and neuralresponsiveness (5). Pawela et al. examined the anesthetic dosedependence of both BOLD response to forepaw stimulation atseveral frequencies and resting state seed based functionalconnectivity (5). They determined that increasing themedetomidine dosage threefold approximately 2.5 h after theinitial bolus preserved the frequency dependent stimulationBOLD responses and the strength of resting state functionalconnectivity.
In 2005, Austin et al. published data indicating that the BOLDresponse to a fixed stimulus was variable as a function of timeunder α-chloralose anesthesia (following halothane induction);specifically, the spatial extent and peak amplitude responseto the stimulus both increased several hours post α-chloraloseinduction (26). Austin et al. suggest that changes in the BOLDresponse under α-chloralose were a product of combinedeffects of halothane and α-chloralose on neuronal activity orchanges in vascular response and neurovascular coupling asa result of anesthesia. If the changes observed are related
to changes in vascular tone, then variations in the BOLDresponse over time would theoretically manifest in spontane-ous brain activity.Slow fluctuations in the BOLD signal (presumed to be linked
to spontaneous neural activity) have been used to mapfunctional connectivity, a term used to describe spectrally andtemporally coherent activity arising in different areas of thebrain (2,6,7,27,28). The frequency of the fluctuations dependson the type of contrast (2) and the anesthetic agent (29).Spatiotemporal dynamic analysis reveals patterns of quasi-periodic (periodic, but not constant), often bilaterally sym-metric, spatially propagating patterns of functional activityobserved both in humans (30,31) and in the anesthetized rat(29,31). In the work presented here, we evaluate the time-sensitive effects of dexmedetomidine anesthesia (followinginitial administration of isoflurane anesthesia) on traditionalfunctional connectivity MRI (fcMRI), the frequency specificsignatures of the BOLD fluctuations, and the occurrence ofspatiotemporal dynamics.In previous experiments using (dex)medetomidine, our
laboratory has observed time-dependent effects of medeto-midine on functional connectivity measured with resting statefMRI, functional network spatiotemporal dynamics (29,30),and spectral characteristics of functional time courses. Conse-quently, we designed a longitudinal experimental paradigmusing two anesthetic regimens, one with a short duration ofisoflurane (30min; comparable to typical studies usingisoflurane for induction and setup (5,10,16)) prior to functionalimaging and another with a long isoflurane duration (3 h;comparable to studies involving complex surgical proceduressuch as combined electrophysiology–fMRI (3)) prior to imaging.Both paradigms are followed by an identical dosage of dexme-detomidine anesthesia concurrent with a 5.75 h imaging series.The goal of this work is twofold: first to evaluate possible
lingering, duration dependent effects of isoflurane on functionalconnectivity, and second to evaluate evolving changes in therat’s functional state based upon long-term use of dexme-detomidine anesthesia. We found that an extended isofluraneparadigm will attenuate functional activity for a longer durationas compared with a shorter isoflurane paradigm. Furthermore,we also observed a significant evolution of functional metricsas a result of long durations of dexmedetomidine use underthe currently accepted and refined dexmedetomidine sedationparadigm. Using the dosing methods of Pawela et al., weexpand on their initial findings by focusing both on the effectsof isoflurane prior to functional imaging on precedingfunctional activity and on time dependent effects of dexme-detomidine anesthesia on spontaneous BOLD frequencycharacteristics, spatiotemporal dynamics, and resting statefunctional connectivity metrics.
MATERIALS AND METHODS
Animal preparation and physiological monitoring
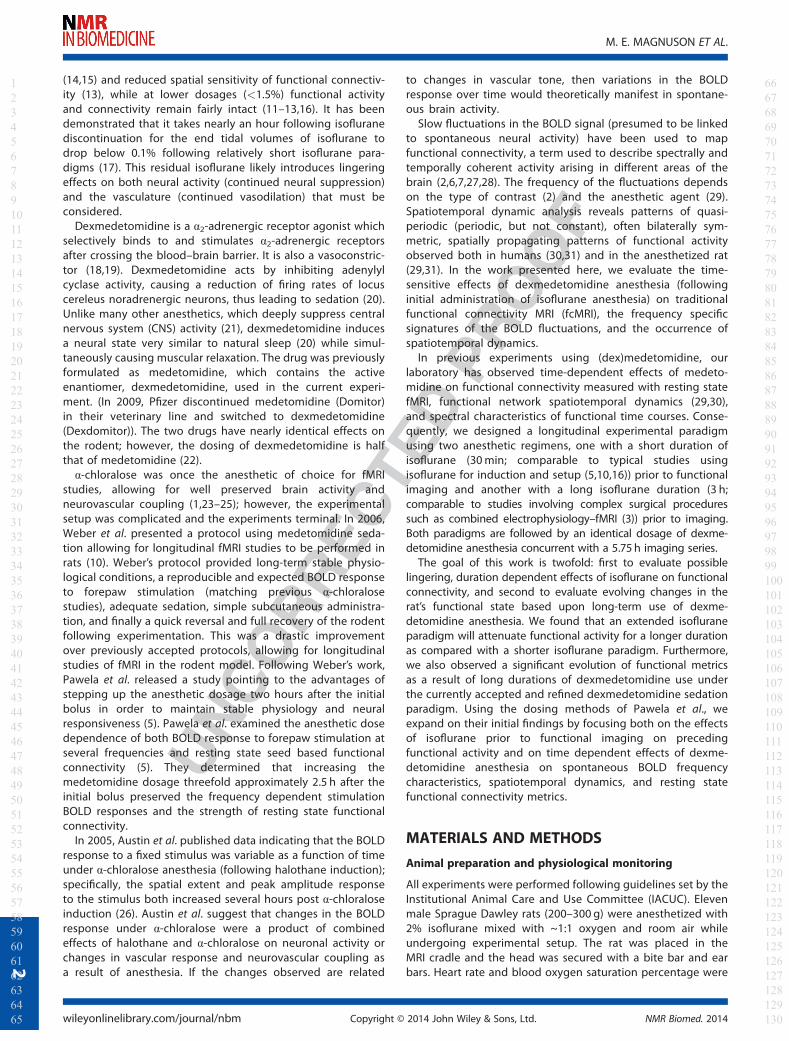
All experiments were performed following guidelines set by theInstitutional Animal Care and Use Committee (IACUC). Elevenmale Sprague Dawley rats (200–300 g) were anesthetized with2% isoflurane mixed with ~1:1 oxygen and room air whileundergoing experimental setup. The rat was placed in theMRI cradle and the head was secured with a bite bar and earbars. Heart rate and blood oxygen saturation percentage were
M. E. MAGNUSON ET AL.
wileyonlinelibrary.com/journal/nbm Copyright © 2014 John Wiley & Sons, Ltd. NMR Biomed. 2014
2
1234567891011121314151617181920212223242526272829303132333435363738394041424344454647484950515253545556575859606162636465
66676869707172737475767778798081828384858687888990919293949596979899100101102103104105106107108109110111112113114115116117118119120121122123124125126127128129130

recorded with a pulse oximeter placed on the rear left paw.Body temperature was monitored with a rectal thermometerand maintained at ~37 °C using an adjustable warm waterpad. Respiratory rate was also monitored by using a pressure-sensitive balloon placed under the rat’s chest.Once setup was complete, the rat was left to rest in the
cradle under 2% isoflurane until the total time under isofluranereached 3 h (long isoflurane – experimental group 1) or 30min(short isoflurane – experimental group 2). For the longisoflurane group, after 2 h 30min, isoflurane was reduced to1.5% for 30min before the induction of dexmedetomidine(Dexdomitor, Pfizer, Karlsruhe, Germany). The long isoflurane“wait period” was chosen to replicate our previous experi-ments, where it was necessary to keep the rat under isofluranefor long periods of time while surgical procedures wereperformed (3). The short isoflurane group replicates setup timefor a rodent to be anesthetized and prepared for scanningwhere no surgery or complex setup is involved, but keeps timeunder isoflurane the same for all rats. Following the wait period,the short isoflurane group was switched directly from 2%isoflurane to dexmedetomidine.A subcutaneous bolus injection of 0.025mg/kg dexme-
detomidine was administered subcutaneously to the rat’s rightrear upper leg. Five minutes after the dexmedetomidine bolus,isoflurane was discontinued. Fifteen minutes post-bolus,subcutaneous infusion of 0.05mg/kg/h dexmedetomidine wasinitiated using a butterfly needle taped in place to maintainanesthetic depth for the duration of the experiment (10).Approximately 80min following the initial dexmedetomidinebolus, the infusion dosage was increased to 0.15mg/kg/h(3 × initial infusion rate) for maintaining anesthetic depth (5).The beginning of the threefold increased infusion did notexactly match Pawela’s protocol. In experiments where surgerywas performed, it was necessary to ensure anesthetic depth,and we found that increasing the dexmedetomidine dosageat ~80min was conducive to adequate sedation with no alter-ation of functional activity (4,10).
Image acquisition
All resting state functional images were acquired on a 20 cmhorizontal bore 9.4 T Bruker BioSpec magnet equipped with anactively shielded gradient coil capable of producing 20G/cmgradient strength with a rise time of 120μs. The BioSpec wasinterfaced with an AVANCE (Bruker, Billerica, MA) console. Anactively decoupled imaging setup was used, including a 2 cmsurface coil for reception and a 7 cm volume coil for RF transmis-sion (Bruker, Billerica, MA).A FLASH image was acquired in three planes, providing
necessary anatomical information to properly position thesingle slice to be used for resting state imaging. Using the flashimage a coronal slice was selected covering the primary so-matosensory (S1) cortex, based on known anatomical markers.Shimming was conducted on this single slice to obtain maxi-mum signal-to-noise ratio and spatial homogeneity. 45minafter the initial dexmedetomidine bolus, the first resting statescan was collected with the following parameters: Single-shotgradient echo EPI, 1000 repetitions, TR = 500ms, TE = 15ms,total scan time = 8min 20 s, number of slices = 1, slice thick-ness = 2mm, FOV= 2.56 cm × 2.56 cm, matrix size = 64 × 64.Every 30min this identical resting state scan was repeated untilthe 5.75 h mark was reached. This paradigm constituted a total
of 11 scans; all scans were collected in eight of 11 rodents. Onerodent was missing the initial time point, one rodent wasmissing two of the initial time points due to delays duringsetup, one rodent was missing the final scan, and anotherrodent was missing the final three scans. They were removedfrom the scanner early because of abnormally increased heartrate and slight motion (indicating the rat might have beencoming out of sedation). Following the final scan, rodents wereremoved from the MRI scanner.
Data analysis
Functional activity and spectral metrics were directly comparedbetween the short and long isoflurane experimental groups.Functional metrics were also compared between early and lateportions of the experiment within each group. All fMRI dataprocessing and analysis was performed using code written inMATLAB (MathWorks, Natick, MA). Two initial preprocessingsteps were performed before data evaluation. First the meanvalue was subtracted from functional time courses, followed bydivision by one standard deviation to normalize for comparisonbetween rats (29). Following normalization, whole brain signalregression was performed (13).
Spectral analysis
Following the initial preprocessing, spectral data were evalu-ated. A nine voxel (3 × 3 square) ROI from the single coronalslice imaged was chosen manually in the forepaw region ofthe S1 cortex, and a functional time course was obtained forthe average intensity in the ROI for the duration of the scan.Power spectra were obtained for the resulting functional timecourse, using the Welch method (200 s sections, 99.5% overlap,Hamming window). The resulting power spectra were averagedat each time point to create a spectrum for both experimentalgroups, highlighting frequencies where consistent high poweris present, while reducing noise from anomalous frequencycomponents. Maximum power value (%/cHz), maximum powerfrequency location (Hz), and the center of mass (CoM) forpower (Hz) were calculated using spectral data between 0.05and 0.3 Hz (chosen based on analysis of low-frequency BOLDpower localization from previous works) (2,29,31). For thepurposes of this manuscript, when describing spectral ranges,the designations “low-band,” “high-band,” and “broad-band”power will be used. Data were divided into low-band power(0.05–0.149 Hz), high-band power (0.015–0.30 Hz), and broad-band power (0.05–0.3 Hz). Spectral data below 0.05 Hz werenot used for raw spectral analysis due to the presence ofhigh-powered 0–0.05 Hz components in some of the data setsthat were not removed by detrending or global signal regres-sion. Each set of values was plotted against dexmedetomidinesedation time to determine time sensitive systematic influ-ences of the anesthesias.
Functional connectivity analysis
Functional connectivity and spatiotemporal dynamics wereevaluated for each data set. Additional preprocessing was re-quired before analysis; data were linearly detrended followedby FIR band pass filtering between 0.01 and 0.3 Hz (allowingfor removal of DC artifacts and higher-frequency components).The ROI selected for spectral analysis was used to obtain a timecourse of the filtered and detrended S1 data. The functional
TIME DEPENDENT BOLD PROPERTIES UNDER DEXMED FOLLOWING ISOFLURANE
NMR Biomed. 2014 Copyright © 2014 John Wiley & Sons, Ltd. wileyonlinelibrary.com/journal/nbm
3
1234567891011121314151617181920212223242526272829303132333435363738394041424344454647484950515253545556575859606162636465
66676869707172737475767778798081828384858687888990919293949596979899100101102103104105106107108109110111112113114115116117118119120121122123124125126127128129130

time course of the left S1FL was then correlated with all othervoxels in the image to obtain a functional connectivity map.The correlation values (r) from the 15 most highly correlatedvoxels in the hemisphere contralateral to the seed (clusteredin S1) time course were averaged to generate a functionalconnectivity value for every rat and every scan. Correlationvalues were plotted against dexmedetomidine sedation times.Total low-band spectral power was plotted versus broadbandfunctional connectivity to determine if a relationship existsbetween the two. All data points for each experimental groupwere plotted on a scatter plot, and R2 (linear regression), r(Pearson correlation), and p values (unpaired, two-tailed, equalvariance t-tests; multiple-comparisons corrected) were calcu-lated for each group.
Global signal connectivity was evaluated (using processeddata without global signal regression) by performing Pearsoncorrelation between the functional time course representingthe whole brain signal and all other voxels in the brain. Theresulting Pearson correlation values for all brain voxels werethen averaged to obtain global connectivity for each ratand scan.
Spatiotemporal dynamic analysis
A pattern-finding algorithm designed to identify reproduciblespatiotemporal dynamics was applied to the filtered data(29,31), allowing for the visualization of patterns of low-frequency activity that propagate through cortical and subcor-tical brain regions. A chunk of consecutive images is chosenfrom the resting state data set at a random starting position;sliding correlation is then performed between the image chunkand the preprocessed image series, correlation peaks aredetected from the sliding correlation data, and image chunkscorresponding to the correlation peaks are then averagedtogether to create a new template. This averaged template isonce again used in sliding correlation analysis; this processcontinues until convergence is reached. The final template,containing 11 images in this case (5.5 s), is then displayed onan image strip or as a movie to allow for ideal viewing of spa-tiotemporal dynamic patterns. This algorithm is explained indetail by Majeed et al. (29,31).
Templates for each scan were visualized on a blue-to-redcolor scale (colors indicate template strength: blue – low,red – high, the “jet” colormap in MATLAB). Each templatewas evaluated by an experienced researcher, who classifiedeach run as either containing or not containing spatiotem-poral dynamics. Scans were grouped in a Boolean fashionas either showing or not showing the presence of spatiotem-poral dynamics.
Inter- and intra- group t-tests
Two sets of statistical analyses were performed, intergroup andintragroup analysis. Unpaired, two-tailed, equal variance t-testswere performed between the two experimental groups (shortand long isoflurane exposure) at each time point for all metricsdiscussed above (except spatiotemporal dynamics). Unpaired,two-tailed, equal variance t-tests were also performed withineach experimental group comparing data from the first halfof the imaging series (0.75–3.25 h) with data from the secondhalf of the imaging series (3.75–5.75 h) to evaluate evolvingproperties of each metric. This division of time points was
chosen because of the emergence of the ~0.18 Hz peak at thistime point; in addition, it represents the half-way point offunctional imaging.
Multiple regression analysis: resting state metrics and physiology
Multivariate ANOVA analysis was performed to determine ifquantified functional resting state metrics were significantlycoupled with variation in physiological parameters. Heart ratewas obtained in nine out of 11 rats, oxygen measurementswere collected in 10 out of 11 rats, and breath rate and temper-ature were collected for all 11 rats. For each rat, spectral CoM,maximum power, frequency location of maximum power, bilat-eral connectivity, and total low-frequency power (0.05–0.3 Hz)were independently evaluated versus all physiological record-ings (heart rate, breath rate, blood oxygen, and body tem-perature). Four p-values were obtained for each ANOVA,indicating the statistical significance and interaction effects ofthe relationship between all physiological parameters and theevaluated functional resting state metrics (spectral CoM, maxi-mum spectral power, frequency location of maximum spectralpower, maximum connectivity, and total spectral powerbetween 0.05 and 0.3 Hz). Multiple regression ANOVAs wereperformed for each rodent’s physiological parameters andeach calculated Q3RS metric (a total of 50 ANOVAs). Twenty setsof p-values were obtained (five functional metrics × four phys-iological parameters).Inter-group physiological parameters were examined to deter-
mine if there was a difference in physiology between the shortand long isoflurane groups. Physiological values were averagedtogether for all rats to determine if physiological conditionshifted significantly over the course of the experiment. Studentt-tests were performed comparing physiological data from thefirst half of the experiment (0.75–3.25 h) to the same parametersfrom the second half of the experiment (3.75–5.75 h).
Correcting for multiple comparisons
The sequential goodness of fit (SGoF) method developed byCarvajal-Rodriguez et al. (32) was used to correct for multiplecomparisons to control the chance that false positives wouldbe considered significant. Seventy-seven hypotheses weretested regarding the relationship between our two experimentalgroups (seven functional metrics on 11 different time points).SGoF performs a binomial test based on a null hypothesis onthe expected distribution of the P-value family created fromthe 77 Student t-tests performed. This controls the chance offalse positives being presented (type 1 errors) to a set value,but does not increase the change for false negatives (type 2 er-rors) as much as Bonferroni or false-discovery rate controllingmethods (32). SGoF was also performed on a second family ofhypotheses (intra-individual comparisons), where data from thefirst six time points for each rat are compared with the next fivetime points to test for significant differences. Eight comparisonsare made for both experimental groups for a total of 16 compar-isons. All values described as significant in the results sectionhave passed SGoF multiple-comparison correction at 0.05.
RESULTS
All components of functional network activity explored in thisstudy exhibited evolving properties occurring as length of time
M. E. MAGNUSON ET AL.
wileyonlinelibrary.com/journal/nbm Copyright © 2014 John Wiley & Sons, Ltd. NMR Biomed. 2014
4
1234567891011121314151617181920212223242526272829303132333435363738394041424344454647484950515253545556575859606162636465
66676869707172737475767778798081828384858687888990919293949596979899100101102103104105106107108109110111112113114115116117118119120121122123124125126127128129130
Shella
Sticky Note
resting state

from isoflurane use increased and the duration of dexme-detomidine exposure increased. Each time point evaluatedconsists of data from 11 rats excluding the 0.75 h time point(nine rats), the 1 h time point (10 rats), the 4.75 and 5.25 h timepoints (10 rats), and the 5.75 h time point (nine rats). Data werenot collected from all rats for these data points and are explainedin detail in the methods section. A summary of all inter- andintra-subject statistical comparisons can be found in TableT1 1and TableT2 2 respectively; all values highlighted in bold are signif-icant and have passed SGoF multiple-comparison correction at athreshold of 0.05 (Table 1, p< 0.0319; Table 2, p< 0.0345).
Spectral characteristic evolution
Inter-group analysis
FigureF1 1 contains the group average of spectral componentsobtained from time courses extracted from the rightQ4 S1FL ateach recorded time point for both short and long isofluranegroups. Data collection began 0.75 h following the initial dex-medetomidine bolus. Resting state scans occurred at 30minintervals until the 5.75 h post-bolus data point is reached (11plots represent 11 time points).At the 0.75 h time point, power is low across the entire spec-
trum; slightly higher power exists in the low-frequency band(0.05Hz–0.149Hz) for both experimental groups. At the secondtime point (1.25 h), the short isoflurane group displays a major
increase in low-frequency power; low-frequency power increasesslightly in the long isoflurane group as well. This spectral organi-zation continues in general through the 2.75 h time point, whilea gradual increase in the high-band frequencies (0.15–0.3) begin-ning to occur in both groups. At the 3.25 h time point, the powerspectra of the two groups come close to convergence andevolve similarly throughout the final five time points. At 3.75 h,a strong peak begins to emerge at ~0.18 Hz in both short andlong isoflurane groups. By the 4.25 h time point, the ~0.18 Hzpeak dominates the spectra. This peak remains dominantthroughout the remaining time points for both groups. Meanspectral data at the 4.25 h time point in the long isoflurane groupwere plotted for both the S1 cortex signal and the whole brainsignal in Figure F22, indicating that the ~0.18 Hz peak was specificto local cortical activity.
The average power and squared error of the mean (SEM) forthe low-band, high-band, and broadband spectra were plottedin Figure F33 for both experimental groups. For low-band totalpower (Figure 3, left), statistical differences exist between theshort and long isoflurane groups at 1.25 h (p= 0.0003), 1.75 h(p =0.0036), and 2.75 h (p = 0.0022). Low-band spectral powervalues become more similar at 3.25 h and finally converge at3.75 h. A similar trend is seen in the high-band power (Figure 3,center); however, average power values for the first time point(0.75 h) are more similar than in the low band; following thefirst time point there is an “unzipping” of high-band power datavalues until the 3.25 h time point, where the values “re-zip”.
Table 1. Inter-group: p-values were calculated from Student’s t-tests performed between the short and long isoflurane groups ateach time point for each functional metric. The values highlighted in bold represent statistically significant differences between thegroups that passed multiple-comparisons testing (SGoF) which indicated significance at p< 0.0319. Significant differences be-tween the groups were found in functional connectivity, maximum spectral power, low-band, high-band, and broad-band power,and global connectivity (see Figures 3 and 4). Interestingly, no significant differences were found after the 2.75 h time point,suggesting the influences of the long isoflurane duration prior to functional imaging had dissipated by the 3.25 h time point
Time point (h) 0.75 1.25 1.75 2.25 2.75 3.25 3.75 4.25 4.75 5.25 5.75Connectivity 0.019 0.283 0.245 0.746 0.976 0.874 0.992 0.685 0.250 0.110 0.178Spectral CoM 0.035 0.113 0.490 0.353 0.682 0.132 0.666 0.383 0.365 0.370 0.420Max. power 0.045 0.008 0.0006 0.079 0.010 0.114 0.572 0.348 0.044 0.412 0.185Max. location 0.276 0.614 0.250 0.504 0.698 0.042 0.988 0.092 0.246 0.699 0.756Low-band power 0.048 0.0002 0.004 0.078 0.002 0.771 0.691 0.474 0.359 0.319 0.617High-band power 0.112 0.005 0.013 0.050 0.016 0.145 0.503 0.098 0.172 0.222 0.534Broadband power 0.052 0.0001 0.0001 0.0138 0.002 0.149 0.414 0.035 0.123 0.151 0.310Global connectivity 0.032 0.041 0.029 0.051 0.066 0.159 0.066 0.66 0.114 0.141 0.840
Table 2. Intra-group: p-values were calculated from Student’s t-tests performed between all functional metrics comparing the0.75–3.25 h time frame with the same metrics from the 3.75–5.75 h time points. All values highlighted in bold represent statisticallysignificant findings passing multiple-comparison correction (SGoF), p< 0.0345. Long isoflurane data shows a significant evolutionof functional metrics for five of eight functional metrics while short isoflurane data indicates a significant evolution of functionalmetrics for three of eight metrics
Connectivity CoMlocation
Max.power
Max.location
Low-bandpower
(0.05–0.149Hz)
High-bandpower
(0.15–0.3 Hz)
Broadbandpower
(0.05–0.3 Hz)
Globalconnectivity
Long ISO 0.0002 0.332 5.57 × 10�6 0.034 5.84 × 10�8 2.8 × 10�8 2.23 ×10�11 0.749Short ISO 0.729 0.042 0.003 0.079 0.177 0.0008 5.81 ×10�5 0.229
TIME DEPENDENT BOLD PROPERTIES UNDER DEXMED FOLLOWING ISOFLURANE
NMR Biomed. 2014 Copyright © 2014 John Wiley & Sons, Ltd. wileyonlinelibrary.com/journal/nbm
5
1234567891011121314151617181920212223242526272829303132333435363738394041424344454647484950515253545556575859606162636465
66676869707172737475767778798081828384858687888990919293949596979899100101102103104105106107108109110111112113114115116117118119120121122123124125126127128129130
Shella
Sticky Note
primary somatosensory area for the forelimb

Statistically significant differences were found for the sametime points, 1.25 h (p = 0.0049), 1.75 h (p = 0.0129), and 2.75 h(p = 0.0164), as seen in the low band power. Broadband power(Figure 3, right) reflects a combination of low-band and high-band values; naturally, a similar trend is seen as in the previoustwo cases, although statistical differences between the shortand long term isoflurane groups are also found at the 2.25 htime point (p = 0.0001) in addition to the 1.25 (p = 0.0001),1.75 (p = 0.0138), and 2.75 (p = 0.0017) h time points. Quali-tatively, the short isoflurane group appears to have greaterpower throughout all time points in the high-band andbroadband ranges as compared with the long isoflurane group;however, SEM increases as the mean power increases anddiminishes the statistical significance of differences betweenthe two groups.Peak power, peak location, center of spectral mass (CoM), and
bilateral S1 functional connectivity were plotted in Figure F44 forboth experimental groups. No statistically significant differenceswere found between the short and long isoflurane groups forCoM calculations (Figure 4, top left) or the frequency location
Figure 2. Primary somatosensory cortex and whole brain spectra. Theaverage group power spectra from the long isoflurane data at the4.25 h time point are plotted for the both the S1 signal (solid line) andthe global signal (dotted line). A strong peak at ~0.18Hz dominates thelow-frequency power spectrum of the S1 signal, but it is only minimallypresent in the whole brain spectra, indicating that this peak is a localphenomenon as opposed to a global one.
Figure 3. Average power evolution.Q8 Summation of low-band power (left, 0.05–0.149Hz), high-band power (middle, 0.15–0.3 Hz), and broadbandpower (right, 0.05–0.3Hz) are shown for both the short (dotted) and long (solid) isoflurane groups. Mean and SEM values for each group are plottedfor each time point. Significant differences are found between the short and long isoflurane groups in the low-band power at the 1.25, 1.75, and2.25 h data points, in the high-band power at the 1.25, 1.75, and 2.25 h data points, and in the broadband power at the 1.25, 1.75, 2.25, and 2.75 h datapoints. Intra-group evaluations highlighting differences between early data and late data are calculated and presented in Table 2.
Figure 1. Power spectrum evolution. Plots of average power spectra from the short isoflurane (30min) group (four rats – dotted white line) and longisoflurane (3 h) group (seven rats – solid black line) followed by resting state imaging at 30min intervals under a fixed dosage of dexmedetomidine for5.75 h. Power spectra are derived from a time course generated from the left S1 cortex. Low-band power (0.05–0.149Hz; light grey) increases at the1.25 h time point in the short isoflurane group and does not increase in the long isoflurane to a similar level until the 3.25 h time point, when nearconvergence of the two groups’ spectral signals occurs. At the 3.25 h time point, a strong ~0.18Hz peak arises in both groups within the high-banddata (0.15–0.3 Hz) and dominates the power spectra for the remainder of the functional scans. Both groups indicate a clear evolution of spectral infor-mation as time under dexmedetomidine (and time since isoflurane cessation) increases.
M. E. MAGNUSON ET AL.
wileyonlinelibrary.com/journal/nbm Copyright © 2014 John Wiley & Sons, Ltd. NMR Biomed. 2014
6
1234567891011121314151617181920212223242526272829303132333435363738394041424344454647484950515253545556575859606162636465
66676869707172737475767778798081828384858687888990919293949596979899100101102103104105106107108109110111112113114115116117118119120121122123124125126127128129130

of the maximum spectral power (Figure 4, bottom right). Maxi-mum power occurring in the broadband spectrum (Figure 4, bot-tom left) is significantly different between the short and longisoflurane groups at 1.25 (p= 0.0078), 1.75 (p=0.0006), and 2.75(p= 0.0103) h. While mean maximum power appears greater inthe short isoflurane group than the long isoflurane for most timepoints, SEM increases substantially as mean maximum spectralpower increases, resulting in overlap in the error bars.
Intra-group analysis
Functional metrics were also evaluated on an intra-group basis(Table 2), assessing their evolution as a result of both time sinceisoflurane discontinuation and total duration under dexme-detomidine. Early time points (0.75–3.25 h) were compared withlate time points (3.75–5.75 h) for each functional metric. Qualita-tively, the short isoflurane group’s low-band power showed aslight trend towards increasing power over the 5 h recordingduration; however, comparing early data with late data did notreveal a significant difference. The long isoflurane group had amore dramatic increase in low-frequency power as a functionof scanning time; a significant difference between early and latetime points in long isoflurane low-band power was calculated(p= 5.84 × 10�8).Short and long isoflurane high-band power displayed a strong
increase as time under dexmedetomidine anesthesia increased,with statistically significant differences between early and latedata in both experimental groups (short, p= 0.0008; long,p=2.8 × 10�8). Much of this increasing power in the high-band
data is a result of the appearance of a high-powered ~0.18 Hzpeak in both groups occurring around the 3.75 h time point(see Figure 1). Similarly, in the broadband power, data for bothshort and long isoflurane groups displayed a pattern of increas-ing power over the duration of the scanning session, with bothgroups having highly significant differences between early andlate data (short, p= 2.23 × 10�11; long, p= 5.81 × 10�5).
Intra-group analysis of center of spectral mass data revealedminor shifts over the duration of the experiment in both experi-mental groups (Figure 4, top left), but neither shift was signifi-cant after multiple-comparison correction. The maximum valueof broadband spectral power increased significantly in both theshort and long isoflurane groups over the experiment’s duration(Figure 4, bottom left); both experimental groups confirmed astatistically significant shift in data from the first half of the ex-periment to the second (short, p= 5.57 × 10⁻⁶; long, p= 0.0035).Finally, the specific frequency location of the maximum spectralpower also has a general trend of shifting towards the higher fre-quencies as the time under dexmedetomidine increases in bothexperimental groups (Figure 4, bottom right). Only the longisoflurane data exhibited a statistically significant shift in locationof the maximum spectral power (p= 0.035).
Seed based functional connectivity
Inter-group analysis
Bilateral connectivity of the S1 cortex was evaluated for all ratsand scans. There was a significant difference in functional
Figure 4. Spectral characteristic and connectivity evolution. Average group values and SEM are plotted for center of spectral mass (top left), bilateralS1 connectivity (top right), maximum spectral power (bottom left), and the location of that maximum power (bottom right) for both the short (dottedline) and long isoflurane groups (solid line). No significant differences are found between the two groups for spectral CoM or for location of the max-imum spectral power. Bilateral functional connectivity exhibits a significant difference between the groups at the 0.75 h time point followed by a con-vergence in connectivity data at the 2.25 h time point. Significant differences between maximum spectral powers are found at the 1.25, 1.75, and 2.75 htime points. Intra-group evaluations highlighting changes between early data and late data are calculated and presented in Table 2.
TIME DEPENDENT BOLD PROPERTIES UNDER DEXMED FOLLOWING ISOFLURANE
NMR Biomed. 2014 Copyright © 2014 John Wiley & Sons, Ltd. wileyonlinelibrary.com/journal/nbm
7
1234567891011121314151617181920212223242526272829303132333435363738394041424344454647484950515253545556575859606162636465
66676869707172737475767778798081828384858687888990919293949596979899100101102103104105106107108109110111112113114115116117118119120121122123124125126127128129130

connectivity (Figure 4, top right) between the short and longterm isoflurane groups at only the 0.75 h time point(p=0.0187). While no other time points showed a significantdifference in connectivity, convergence of mean connectivityvalues does not occur until the 2.25 h time point.
A visual example of functional connectivity over time is shownin FigureF5 5 (top). The resulting maps represent the correlationbetween a time course derived from the left S1 cortex and allother voxels within this coronal brain slice. In this example
depicted in Figure 5 (long isoflurane – rat 7), functional con-nectivity generally increases as dexmedetomidine sedationtimes increases.Connectivity between the average signal from the whole brain
and each voxel in the brain was also evaluated for each rat andscan to determine anesthetic influences on whole brain connec-tivity. Whole brain mean connectivity was generally stronger forall data points from the short isoflurane data as compared withthe long isoflurane data; however, significant differences were
Figure 5. Functional connectivity strength and spatial extent evolution. Top: correlation maps representing functional connectivity between left S1and the rest of the coronal brain slice (coronal slice contains primary and secondary somatosensory cortices, the caudate putamen complex, andthe primary motor cortices) as a function of time. The rat pictured is rat 7 from the long isoflurane group (chosen for display due to its similarity withthe group correlation analysis). The strong correlation values in the left superior region represent correlation with the seed time course. High correlationvalues in the bilaterally symmetric region on the right side of the brain represent bilateral functional connectivity. As total time underdexmedetomidine increases functional connectivity becomes more prominent, until it reaches a semi-stable state around 3.75 h. Very little connectivityis evident before 2.75 h. Similar trends are apparent in the group analysis of long isoflurane data, as seen in the data in Figure 4. Bottom left: single-sliceecho planar imaging ( Q5EPI) image corresponding to functional connectivity maps above. Bottom right: average correlation with the global signal is plot-ted as function of time for both short (dotted line) and long (solid line) isoflurane data with no global signal regression. Significant differences in globalsignal connectivity between the two groups are found at the 0.75 and 1.75 h time points.
Figure 6. Summation of low-band (0.05–0.149Hz) power plotted against bilateral functional connectivity for the short (left) and long (right) isofluranegroups. There was no significant linear fit between short isoflurane and functional connectivity; however, a significant linear relationship was foundbetween the low-band power and functional connectivity in the long isoflurane data.
M. E. MAGNUSON ET AL.
wileyonlinelibrary.com/journal/nbm Copyright © 2014 John Wiley & Sons, Ltd. NMR Biomed. 2014
8
1234567891011121314151617181920212223242526272829303132333435363738394041424344454647484950515253545556575859606162636465
66676869707172737475767778798081828384858687888990919293949596979899100101102103104105106107108109110111112113114115116117118119120121122123124125126127128129130
Shella
Sticky Note
correct
only confirmed at the 0.75 (p=0.0319) and 1.75 (p=0.0292) htime points. This is likely due to increased SEM values at highermean power (Figure 5, lower right).
Intra-group analysis
Short isoflurane connectivity shifts throughout the duration ofexperiment but not in a monotonic fashion; SEM of recordedconnectivity values increased significantly in the last 2 h of datacollection. There is no significant evolution of short isofluranefunctional data over the duration of the experiment. Longisoflurane connectivity increased consistently and significantlythroughout the experimental duration (p= 0.0002).
Functional connectivity’s relationship to low-band power
Total low-band spectral power (0.05–0.149Hz) is plotted versusbilateral functional connectivity for both experimental groupsin FigureF6 6. Linear regression of the short isoflurane data did
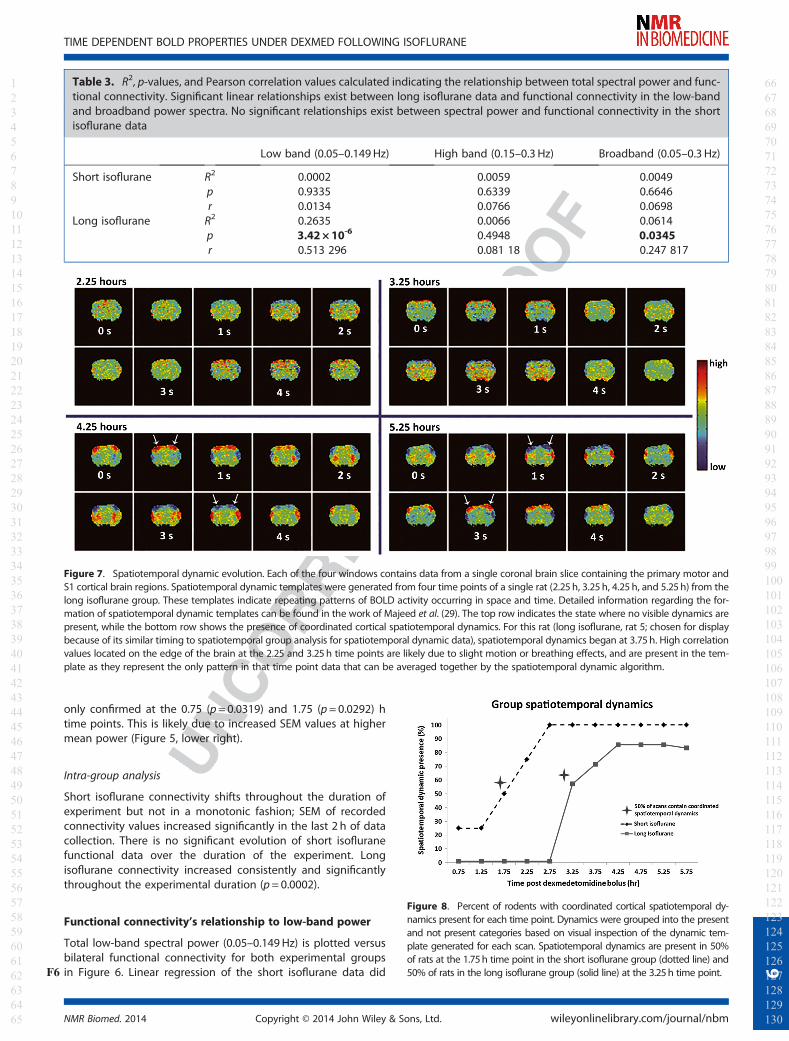
Figure 7. Spatiotemporal dynamic evolution. Each of the four windows contains data from a single coronal brain slice containing the primary motor andS1 cortical brain regions. Spatiotemporal dynamic templates were generated from four time points of a single rat (2.25h, 3.25h, 4.25 h, and 5.25h) from thelong isoflurane group. These templates indicate repeating patterns of BOLD activity occurring in space and time. Detailed information regarding the for-mation of spatiotemporal dynamic templates can be found in the work of Majeed et al. (29). The top row indicates the state where no visible dynamics arepresent, while the bottom row shows the presence of coordinated cortical spatiotemporal dynamics. For this rat (long isoflurane, rat 5; chosen for displaybecause of its similar timing to spatiotemporal group analysis for spatiotemporal dynamic data), spatiotemporal dynamics began at 3.75h. High correlationvalues located on the edge of the brain at the 2.25 and 3.25h time points are likely due to slight motion or breathing effects, and are present in the tem-plate as they represent the only pattern in that time point data that can be averaged together by the spatiotemporal dynamic algorithm.
Table 3. R2, p-values, and Pearson correlation values calculated indicating the relationship between total spectral power and func-tional connectivity. Significant linear relationships exist between long isoflurane data and functional connectivity in the low-bandand broadband power spectra. No significant relationships exist between spectral power and functional connectivity in the shortisoflurane data
Low band (0.05–0.149Hz) High band (0.15–0.3 Hz) Broadband (0.05–0.3 Hz)
Short isoflurane R2 0.0002 0.0059 0.0049p 0.9335 0.6339 0.6646r 0.0134 �0.0766 �0.0698
Long isoflurane R2 0.2635 0.0066 0.0614p 3.42 × 10⁻⁶ 0.4948 0.0345r 0.513 296 0.081 18 0.247 817
Figure 8. Percent of rodents with coordinated cortical spatiotemporal dy-namics present for each time point. Dynamics were grouped into the presentand not present categories based on visual inspection of the dynamic tem-plate generated for each scan. Spatiotemporal dynamics are present in 50%of rats at the 1.75h time point in the short isoflurane group (dotted line) and50% of rats in the long isoflurane group (solid line) at the 3.25h time point.
TIME DEPENDENT BOLD PROPERTIES UNDER DEXMED FOLLOWING ISOFLURANE
NMR Biomed. 2014 Copyright © 2014 John Wiley & Sons, Ltd. wileyonlinelibrary.com/journal/nbm
9
1234567891011121314151617181920212223242526272829303132333435363738394041424344454647484950515253545556575859606162636465
66676869707172737475767778798081828384858687888990919293949596979899100101102103104105106107108109110111112113114115116117118119120121122123124125126127128129130

not reveal linearity or significance (Figure 6, left). Long isofluranedata did indicate a linearly significant relationship between low-band power and connectivity (R2 = 0.2635, p= 3.42 × 10⁻⁶;Figure 6, right). A relationship between high-band power andfunctional connectivity was not significant in either experimentalgroup. The relationship between broadband power and func-tional connectivity is significant in the long isoflurane data(p=0.0345), but not in the short isoflurane data. A summary ofthese results can be found in TableT3 3.
Spatiotemporal dynamics
The template resulting from spatiotemporal dynamic analysismanifested in one of two forms: largely spatially unlocalizedhigh and low correlations spread sporadically throughout thebrain (FigureF7 7, top row – no coordinated spatiotemporaldynamics) or propagating waves of activity moving from thelateral cortex (S2) towards the medial cortex (M1) (Figure 7,bottom row – coordinated cortical spatiotemporal dynamics).The latter dynamic pattern matches what has been previouslyobserved in the rat cortex under normal functional conditions;these spatiotemporal patterns are thought to contribute tofunctional connectivity observed between spatially distinctbrain regions (29,31).
A second output of spatiotemporal dynamic analysis is a plotof mean spatial correlation versus the defined template. Thiscorrelation incidence analysis reveals patterns of activity thatare spatially reproducible throughout the duration of the scan.Once this coordinated template is observed, it remains presentthroughout all subsequent scans in the study. Figure 7 shows a4.5 s template generated from two scans occurring before thepresence of strong spatiotemporal dynamics (top) and two scansoccurring after the coordinated, reproducible spatiotemporal dy-namics are present (bottom) in one rat (long isoflurane, rat 5).There is an obvious qualitative shift between the two states.Based on visualization, spatiotemporal dynamics are groupedas being either detectable or not detectable. The percentage ofscans displaying coordinated cortical spatiotemporal dynamicsis plotted for each time point and shown in FigureF8 8. Of note isthat 50% of rats contain coordinated spatiotemporal dynamics
by the 1.75 h time point in the short isoflurane group, whilethe 50% marker is not reached in the long isoflurane rats untilthe 3.25 h time point.
Physiological parameters
Heart rate, breathing rate, oxygen saturation, and bodytemperature over the duration of anesthesia were plotted insupplementary Figure 1. Physiological parameters all fell intoacceptable ranges: heart rate – 300± 7.7 beats/min; breathingrate – 79.8 ± 5.1 breaths/min; oxygen saturation – 98.3 ± 0.23%;body temperature – 37.2 ± 0.13 °C. Fifty-five (11 rats × fivefunctional metrics) multivariate ANOVA regression analyses wereperformed between four physiological metrics (heart rate, breathrate, oxygenation, and temperature) and five functional metrics(CoM, maximum power, maximum location, functional connec-tivity, and band power) for all rats. 205 P-values (55 ANOVAs ×four physiological parameters minus rats where specific physiol-ogy was not collected, see ANOVA section of methods) wereobtained, and multiple-comparison correction was performedon the results. Three of 205 relationships resulted in significantcorrelations, which is less than the number expected by chance.
DISCUSSION AND CONCLUSION
To determine the effects of an anesthesia regimen consisting ofisoflurane and prolonged dexmedetomidine use, we evaluatedspectral components of functional BOLD activity, seed basedfunctional connectivity, and the presence of spatiotemporaldynamics over a 5 h period of resting state fMRI scanning(0.75–5.75 h post dexmedetomidine bolus). Two experimentalgroups were used to compare and contrast the effects ofincreased periods of isoflurane use prior to functional imagingand possible effects of extended durations of dexmedetomidineuse. The first experimental group was anesthetized using a shortperiod of isoflurane, 30min, followed by 5.75 h of dexme-detomidine anesthesia at a standard infusion dosage (5). Thesecond experimental group’s anesthesia regimen began with along period under isoflurane, 3 h, followed by the standard
Figure 9. Power spectra generated from a dexmedetomidine-only anesthetic paradigm. Five rats were injected with a bolus of dexmedetomidinewhile fully awake to induce the sedated state. Following sedation, standard dexmedetomidine infusion rates were used to maintain sedation. fMRIscans were collected at 30min intervals for 5.75 h. This figure shows averaged power spectra at each time point obtained from the S1 cortex. Low-bandpower (0.05–0.15Hz) remains relatively consistent throughout the study, while a strong ~0.18Hz peak emerges around the 3.75 h time point anddominates the signal by the 4.25 h time point.
M. E. MAGNUSON ET AL.
wileyonlinelibrary.com/journal/nbm Copyright © 2014 John Wiley & Sons, Ltd. NMR Biomed. 2014
10
1234567891011121314151617181920212223242526272829303132333435363738394041424344454647484950515253545556575859606162636465
66676869707172737475767778798081828384858687888990919293949596979899100101102103104105106107108109110111112113114115116117118119120121122123124125126127128129130

dexmedetomidine dosing for 5.75 h. There were several signifi-cant differences between functional metrics in our two experi-mental groups within the first 2.75 h of scanning, but nosignificant differences were found between the two groups after2.75 h. Both groups exhibited changes in the analyzed functionaldata as time under dexmedetomidine anesthesia (and time sinceuse of isoflurane) increased. The variations in the functionalmetrics were more drastic in the long isoflurane group as com-pared to the short isoflurane group.Recent studies have examined the differential effects of
isoflurane and dexmedetomidine on resting state functionalconnectivity (12,13,16). Kalthoff et al. conducted a compre-hensive investigation of each anesthesia separately, performingimaging under either 1.5% isoflurane or standard dexme-detomidine, and compared and contrasted the resulting func-tional state. Liu et al. identify effects of variable doses ofisoflurane as it relates to functional activity. In this work wecontribute an important missing link not provided by the twohighly relevant studies mentioned above. The current workfocuses on the effects of variable length of isoflurane dosingprior to the switch to dexmedetomidine and the time depen-dent, cumulative effects of isoflurane and dexmedetomidine byevaluating and comparing the resulting functional states. It isalso important to note that the findings of this work are limitedto the S1 cortex. Nasrallah et al. indicated differential neuraleffects of dexmedetomidine dependent upon the brain regionevaluated, which were reported to be a function of α-2 receptordensity (33). We focused on the S1 cortex, as it has been thor-oughly characterized (2,6,9) in the rodent model and limitscomplexity from variable anatomical architecture.The primary findings of this study suggest that increased
durations of isoflurane use prior to functional imaging underdexmedetomidine anesthesia result in pronounced lingeringeffects of isoflurane that suppressed functional connectivity,spatiotemporal dynamics, and low frequency spectral powerfor multiple hours. Functional metrics from the long isofluranedata do not match those of the short isoflurane data until~3.25 h following the cessation of isoflurane. Short isofluraneusage prior to functional imaging exhibits early signs of depres-sion of functional connectivity and low-frequency power, butthese effects diminish quickly, allowing for robust functionalactivity as early as 1.25 h following the cessation of isoflurane.Once the effects of isoflurane diminish there is a secondaryeffect, possibly arising from the use of dexmedetomidineanesthesia, manifesting as an evolving ~0.18 Hz peak in boththe long and the short isoflurane data as time under dexmede-tomidine increases. Experimenters using the isoflurane/dexmedetomidine anesthetic regimen (5) for functional imagingshould consider isoflurane sedation length prior to functionalimaging when evaluating data and also be aware of the strong~0.18Hz peak that arises at the 3.75 h time point.Parsing the effects of isoflurane from the effects of dexme-
detomidine is a difficult task considering overlapping anestheticinfluences in our experimental groups and the known lingeringeffects and interactions of both anesthesias; however, we canreasonably assume there are effects of both anesthesias basedon the experimental results. Short isoflurane data have relativelyconsistent low-band power throughout the duration of theexperiment, while low-frequency power in the long isofluranedata begins low and does not reach the power level of shortisoflurane data until the 3.25 h time point. Similarly, functionalconnectivity in the short isoflurane data is relatively consistent
throughout the duration of the experiment (although there isdecreased mean and increased variation in the final hour ofexperimentation), while long isoflurane functional connectivitybegins low and converges with the short isoflurane data aroundthe 2.25 h time point. Evaluating the presence of highlycoordinated patterns of spatiotemporal activity in each groupreveals that spatiotemporal dynamics are present, on average,1.5 h sooner in the short isoflurane data than the long isofluranedata. A final piece of the puzzle untangling the effects ofisoflurane from dexmedetomidine lies in the relationship be-tween low-band power and functional connectivity, which indi-cates there is no relationship between the two variables in theshort isoflurane data but a linear relationship in the longisoflurane data. This relationship suggests depressed functionalconditions (decreased low-frequency power and decreased func-tional connectivity) in the early portion of the long isofluraneexperiment. Each of these occurrences suggests that short andlong isoflurane data display differing functional signatures earlyin the experiment, which can only be attributed to the differencein isoflurane anesthetic duration.
The second portion of the results parsing the isoflurane effectsfrom dexmedetomidine effects lies in the similarities betweenthe two groups following the near spectral convergence at the3.25 h time point. Both groups show a time locked evolution ofhigh-band and broadband spectral power. Similarly, both groupsshow the presence of a strong ~0.18 Hz peak appearing at the3.75 h time point following the cessation of isoflurane. Basedon the known differential effects of isoflurane on the functionalparameters, we infer that this time locked functional evolutionmay be attributed to the effects of the dexmedetomidine (orthe generalized extended anesthetic condition) on eithermechanical vascular properties, neural activity, or neurovas-cular coupling. Testing this hypothesis, pilot data were collectedfrom rats where no isoflurane was used and only the initial bolusof dexmedetomidine was used to sedate the rats. Following initialsedation, dexmedetomidine infusion and imaging protocols werefollowed that were identical to the current study. Figure F99 showsthe evolving power spectra for dexmedetomidine only rats. The~0.18Hz peak appears strongly at 4.25 h and dominates the low-frequency signal in a nearly identical manner to the two isofluraneexperimental groups used in the current study. These pilot datafurther highlight the hypothesis that the emerging ~0.18Hz peakcannot be attributed to isoflurane and is likely associated withdexmedetomidine itself or the extended anesthetic condition(Figure 9).
We have gained two primary insights regarding the combineduse of dexmedetomidine and isoflurane: (1) increased durationsof isoflurane use prior to dexmedetomidine administrationsignificantly influenced the spontaneous BOLD fluctuations,and (2) as the effects of isoflurane “wear off”, there were second-ary functional activity effects that seemingly can only be attrib-uted to long term dexmedetomidine use. Based on the twoisoflurane lengths used in this study, we speculate that decreas-ing the time under isoflurane (<30min) prior to the switch todexmedetomidine would result in a further reduction in theduration of suppression of functional connectivity and spontane-ous low-frequency activity following isoflurane cessation. Simi-larly, increasing the isoflurane dose beyond 3 h would likelyresult in an extended duration of suppression of the currentlyevaluated functional metrics.
Another interesting finding of this work relates to the func-tional significance of the two spectral bands (and the 0.18 Hz
TIME DEPENDENT BOLD PROPERTIES UNDER DEXMED FOLLOWING ISOFLURANE
NMR Biomed. 2014 Copyright © 2014 John Wiley & Sons, Ltd. wileyonlinelibrary.com/journal/nbm
11
1234567891011121314151617181920212223242526272829303132333435363738394041424344454647484950515253545556575859606162636465
66676869707172737475767778798081828384858687888990919293949596979899100101102103104105106107108109110111112113114115116117118119120121122123124125126127128129130

peak) that were evaluated. Low-band power (0.05–0.149Hz) andbilateral functional connectivity increase in a coupled fashion inlong isoflurane data, suggesting the functional relevance of thisBOLD band. In contrast, the high-band power does not showany relationship to functional connectivity (a known neuralcorrelate); the unexpected emergence of the high-amplitude~0.18 Hz peak does not result in a concurrent increase of func-tional connectivity. The ~0.18 Hz peak has been associated withthe appearance of coordinated spatiotemporal dynamics (29),which in turn may be linked to infraslow electrical oscillations(4). The link between infraslow activity and the BOLD signal isstrongly dependent on anesthesia (4), and may be related tothe time variation observed in this study
There was a significant difference in recorded physiologicalmetrics between the pre- and post-3.75 h time points(corresponding to both the halfway point of the experimentand emergence of the ~0.18 Hz peak) for heart rate and oxygen-ation; however, all measurements fell into normal physiologicalranges throughout the experiment. Oxygenation exhibited asudden decrease of mean signal at the 4.75 h time point(supplementary Figure 1). Interestingly, most of the functionalmetrics recorded exhibited their greatest variance in the finalthree data points. Blood oxygenation is a primary influencer ofthe BOLD signal, and it is possible that the increased varianceof the oxygenation was directly related to increased variance inthe functional metrics.
In the refined dexmedetomidine paradigm of Pawela et al.,rodents responded to a tail pinch approximately 5.25 hfollowing the dexmedetomidine bolus (5). The increased vari-ance in the functional and physiological values obtained forthe 4.75–5.75 h time points recorded in the current study likelyreflect this increased level of wakefulness. Functional connec-tivity exhibited a greater decrease and greater variance in thefinal hour of experiment in the short isoflurane group as com-pared to the long isoflurane group. This higher variance, andlower mean connectivity, could possibly be attributed to thesmaller sample size in the short isoflurane group; however,there were no significant differences between the two groupsfound in this time range.
Isoflurane is conventionally used for anesthetization beforedexmedetomidine administration. The behavioral effects ofvolatile anesthetics typically wear off quickly when admini-stration is discontinued; however, isoflurane is also a potentvasodilator and the effects on the vasculature may persist afterbehavior has returned to baseline (34). Dexmedetomidine is avasoconstrictor and may inhibit the cerebrovascular dilationinduced by isoflurane. The inverse effects on vascular walls dueto the change in anesthetics may cause unstable responses inneurovascular coupling during a certain period after theanesthetic switch (33). It is possible that the evolution of the~0.18 Hz BOLD peak is related to modulations in vascular tone.In 2010 our laboratory reported a study comparing functionalconnectivity measured with BOLD and cerebral blood volume(CBV) contrast (2). Interestingly, a ~0.2 Hz peak presents domi-nantly in the low-frequency spectrum for the CBV-weightedimages, well before the 3.75 h critical time point discussed in thispaper for the BOLD ~0.18 Hz peak emergence. BOLD is a com-posite measure of cerebral blood flow, cerebral blood volume,and cerebral metabolic rate of oxygen, while an independentmeasure of CBV only accounts for changes in vascular volume.A vascular contribution at ~0.18 Hz peak would be detectedusing a contrast mechanism heavily weighted towards the
vasculature (CBV). Anesthesia may induce a time dependentincrease in this vascular phenomenon, which can eventually bemeasured with BOLD contrast. An in depth evaluation of this~0.18 Hz peak deserves independent attention and an experi-mental design focused on probing its origin, and is a topic offuture work.This work focuses on the anesthetic protocols presented by
Pawela et al. and Weber et al., specifically the influences of thelength of time under isoflurane prior to the switch to dexme-detomidine (5,10). Ideally anesthetized rodents should be in acondition as close to the “normal functioning” awake state aspossible during fMRI; however, defining normal activity is notan easy task. In this work we have discovered that lingeringeffects of isoflurane have a significant effect on functional activ-ity and persist after cessation of isoflurane at a length corre-sponding to the initial isoflurane anesthetic length. Similarly,we have uncovered an interesting phenomenon of a strong~0.18 Hz peak, which dominates the low-frequency spectrumbeginning 3.75 h into the scanning period that should beexplored in more depth. The potentially confounding factorsassociated with increased isoflurane sedation times could possi-bly be addressed with pharmacological intervention, change indexmedetomidine dosage, or using an anesthesia other thanisoflurane for induction; however, this is the topic of furtherwork. Researchers should be aware that anesthetic agents mayexhibit effects that vary over time and use caution wheninterpreting changes between groups or conditions that occurafter different lengths of anesthetic administration.
Acknowledgements
Grant support: NSF 1-R21NS057718-01, Scholarly Inquiry andResearch at Emory (SIRE) Fellowship.
REFERENCES1. Keilholz SD, Silva AC, Raman M, Merkle H, Koretsky AP. Functional
MRI of the rodent somatosensory pathway using multislice echoplanar imaging. Magn. Reson. Med. 2004; 52(1): 89–99.
2. Magnuson M, Majeed W, Keilholz SD. Functional connectivity inblood oxygenation level-dependent and cerebral blood volume-weighted resting state functional magnetic resonance imaging inthe rat brain. J. Magn. Reson. Imaging 2010; 32(3): 584–592.
3. Pan WJ, Thompson G, Magnuson M, Majeed W, Jaeger D, Keilholz S.Broadband local field potentials correlate with spontaneous fluc-tuations in functional magnetic resonance imaging signals in therat somatosensory cortex under isoflurane anesthesia. Brain Connect2011; 1(2): 119–131. Q6
4. Pan WJ, Thompson GJ, Magnuson ME, Jaeger D, Keilholz S. InfraslowLFP correlates to resting-state fMRI BOLD signals. Neuroimage 2013;74: 288–297.
5. Pawela CP, Biswal BB, Hudetz AG, Schulte ML, Li R, Jones SR, Cho YR,Matloub HS, Hyde JS. A protocol for use of medetomidine anesthesiain rats for extended studies using task-induced BOLD contrast andresting-state functional connectivity. Neuroimage 2009; 46(4):1137–1147.
6. Williams KA, Magnuson M, Majeed W, LaConte SM, Peltier SJ, Hu X,Keilholz SD. Comparison of alpha-chloralose, medetomidine andisoflurane anesthesia for functional connectivity mapping in therat. Magn. Reson. Imaging 2010; 28(7): 995–1003.
7. Zhao F, Zhao T, Zhou L, Wu Q, Hu X. BOLD study of stimulation-induced neural activity and resting-state connectivity inmedetomidine-sedated rat. Neuroimage 2008; 39(1): 248–260.
8. Nakao Y, Itoh Y, Kuang TY, Cook M, Jehle J, Sokoloff L. Effects ofanesthesia on functional activation of cerebral blood flow andmetabolism. Proc. Natl. Acad. Sci. U. S. A. 2001; 98(13): 7593–7598.
M. E. MAGNUSON ET AL.
wileyonlinelibrary.com/journal/nbm Copyright © 2014 John Wiley & Sons, Ltd. NMR Biomed. 2014
12
1234567891011121314151617181920212223242526272829303132333435363738394041424344454647484950515253545556575859606162636465
66676869707172737475767778798081828384858687888990919293949596979899100101102103104105106107108109110111112113114115116117118119120121122123124125126127128129130
Shella
Sticky Note
Brain Connectivity

9. Pawela CP, Biswal BB, Cho YR, Kao DS, Li R, Jones SR, Schulte ML,Matloub HS, Hudetz AG, Hyde JS. Resting-state functional connectiv-ity of the rat brain. Magn. Reson. Med. 2008; 59(5): 1021–1029.
10. Weber R, Ramos-Cabrer P, Wiedermann D, van Camp N, Hoehn M. Afully noninvasive and robust experimental protocol for longitudinalfMRI studies in the rat. Neuroimage 2006; 29(4): 1303–1310.
11. Guilfoyle DN, Gerum SV, Sanchez JL, Balla A, Sershen H, Javitt DC,Hoptman MJ. Functional connectivity fMRI in mouse brain at 7 Tusing isoflurane. J. Neurosci. Methods 2013.Q7
12. Kalthoff D, Po C, Wiedermann D, Hoehn M. Reliability and spatialspecificity of rat brain sensorimotor functional connectivity networksare superior under sedation compared with general anesthesia. NMRBiomed. 2013.
13. Liu X, Zhu XH, Zhang Y, Chen W. The change of functional connectiv-ity specificity in rats under various anesthesia levels and its neural or-igin. Brain Topogr. 2012.
14. Ferron JF, Kroeger D, Chever O, Amzica F. Cortical inhibition duringburst suppression induced with isoflurane anesthesia. J. Neurosci.2009; 29(31): 9850–9860.
15. Antunes LM, Golledge HD, Roughan JV, Flecknell PA. Comparison ofelectroencephalogram activity and auditory evoked responsesduring isoflurane and halothane anaesthesia in the rat. Vet. Anaesth.Analg. 2003; 30(1): 15–23.
16. Hutchison RM, Mirsattari SM, Jones CK, Gati JS, Leung LS. Functionalnetworks in the anesthetized rat brain revealed by independentcomponent analysis of resting-state FMRI. J. Neurophysiol. 2010;103(6): 3398–3406.
17. Sommers MG, van Egmond J, Booij LH, Heerschap A. Isofluraneanesthesia is a valuable alternative for alpha-chloralose anesthesiain the forepaw stimulation model in rats. NMR Biomed. 2009; 22(4):414–418.
18. Asano Y, Koehler RC, Kawaguchi T, McPherson RW. Pial arteriolarconstriction to alpha 2-adrenergic agonist dexmedetomidine in therat. Am. J. Physiol. 1997; 272(6 Pt 2): H2547–2556.
19. Fukuda M, Vazquez AL, Zong X, Kim SG. Effects of the alpha(2)-adrenergic receptor agonist dexmedetomidine on neural, vascularand BOLD fMRI responses in the somatosensory cortex. Eur. J.Neurosci. 2013; 37(1): 80–95.
20. Nelson LE, Lu J, Guo T, Saper CB, Franks NP, Maze M. The alpha2-adrenoceptor agonist dexmedetomidine converges on an endoge-nous sleep-promoting pathway to exert its sedative effects.Anesthesiology 2003; 98(2): 428–436.
21. Rehberg B, Xiao YH, Duch DS. Central nervous system sodiumchannels are significantly suppressed at clinical concentrations ofvolatile anesthetics. Anesthesiology 1996; 84(5): 1223–1233; discus-sion 1227A.
22. Granholm M, McKusick BC, Westerholm FC, Aspegren JC. Evaluationof the clinical efficacy and safety of intramuscular and intravenous
doses of dexmedetomidine and medetomidine in dogs and theirreversal with atipamezole. Vet. Record 2007; 160(26): 891–897.
23. Huttunen JK, Grohn O, Penttonen M. Coupling between simulta-neously recorded BOLD response and neuronal activity in the ratsomatosensory cortex. Neuroimage 2008; 39(2): 775–785.
24. Sanganahalli BG, Herman P, Hyder F. Frequency-dependent tactileresponses in rat brain measured by functional MRI. NMR Biomed.2008; 21(4): 410–416.
25. Keilholz SD, Silva AC, Raman M, Merkle H, Koretsky AP. BOLD andCBV-weighted functional magnetic resonance imaging of the ratsomatosensory system. Magn. Reson. Med. 2006; 55(2): 316–324.
26. Austin VC, Blamire AM, Allers KA, Sharp T, Styles P, Matthews PM,Sibson NR. Confounding effects of anesthesia on functionalactivation in rodent brain: a study of halothane and alpha-chloralose anesthesia. Neuroimage 2005; 24(1): 92–100.
27. Biswal B, Yetkin FZ, Haughton VM, Hyde JS. Functional connectivityin the motor cortex of resting human brain using echo-planar MRI.Magn. Reson. Med. 1995; 34(4): 537–541.
28. Bullmore ET, Rabe-Hesketh S, Morris RG, Williams SC, Gregory L, GrayJA, Brammer MJ. Functional magnetic resonance image analysis of alarge-scale neurocognitive network. Neuroimage 1996; 4(1): 16–33.
29. Majeed W, Magnuson M, Keilholz SD. Spatiotemporal dynamics oflow frequency fluctuations in BOLD fMRI of the rat. J. Magn. Reson.Imaging 2009; 30(2): 384–393.
30. Grigg O, Grady CL. Task-related effects on the temporal and spatialdynamics of resting-state functional connectivity in the defaultnetwork. PLoS ONE 2010; 5(10): e13311.
31. Majeed W, Magnuson M, Hasenkamp W, Schwarb H, Schumacher EH,Barsalou L, Keilholz SD. Spatiotemporal dynamics of low frequencyBOLD fluctuations in rats and humans. Neuroimage 2011; 54(2):1140–1150.
32. Carvajal-Rodriguez A, de Una-Alvarez J, Rolan-Alvarez E. A newmultitest correction (SGoF) that increases its statistical power whenincreasing the number of tests. BMC Bioinformat. 2009; 10: 209.
33. Nasrallah FA, Tan J, Chuang KH. Pharmacological modulation offunctional connectivity: alpha2-adrenergic receptor agonist alterssynchrony but not neural activation. Neuroimage 2012; 60(1):436–446.
34. Ohata H, Iida H, Dohi S, Watanabe Y. Intravenous dexmedetomidineinhibits cerebrovascular dilation induced by isoflurane and sevo-flurane in dogs. Anesth. Analg. 1999; 89(2): 370–377.
SUPPORTING INFORMATION
Additional supporting information may be found in the onlineversion of this article at the publisher’s web-site.
TIME DEPENDENT BOLD PROPERTIES UNDER DEXMED FOLLOWING ISOFLURANE
NMR Biomed. 2014 Copyright © 2014 John Wiley & Sons, Ltd. wileyonlinelibrary.com/journal/nbm
13
1234567891011121314151617181920212223242526272829303132333435363738394041424344454647484950515253545556575859606162636465
66676869707172737475767778798081828384858687888990919293949596979899100101102103104105106107108109110111112113114115116117118119120121122123124125126127128129130
Shella
Sticky Note
HYPERLINK \l ""J Neurosci Methods. 2013 Apr 15;214(2):144-8. doi: 10.1016/j.jneumeth.2013.01.019. Epub 2013 Jan 31.
Research Article
Time-dependent effects of isoflurane and dexmedetomidine on functional connectivity,spectral characteristics, and spatial distribution of spontaneous BOLD fluctuations
Matthew Evan Magnuson, Garth John Thompson, Wen-Ju Pan and Shella Dawn Keilholz
The purpose of this work was to evaluate changes in BOLD functional metrics as a function of time spent under dexme-detomidine anesthesia following variable lengths of isoflurane. Extended isoflurane use prior to the dexmedetomidineswitch will attenuate functional activity for prolonged durations as compared to the shorter isoflurane paradigm. There isalso an evolution of functional metrics related to the use of dexmedetomidine. Researchers using isoflurane/dexmedetomidine paradigms in functional studies should consider these time dependent influences in data interpretation.

Author Query Form
Journal: NMR in Biomedicine
Article: nbm_3062
Dear Author,
During the copyediting of your paper, the following queries arose. Please respond to these by annotating your proofs with thenecessary changes/additions.• If you intend to annotate your proof electronically, please refer to the E-annotation guidelines.• If you intend to annotate your proof by means of hard-copy mark-up, please refer to the proof mark-up symbols guidelines.If manually writing corrections on your proof and returning it by fax, do not write too close to the edge of the paper. Pleaseremember that illegible mark-ups may delay publication.
Whether you opt for hard-copy or electronic annotation of your proofs, we recommend that you provide additional clarificationof answers to queries by entering your answers on the query sheet, in addition to the text mark-up.
Query No. Query Remark
Q1 AUTHOR: Please check captured e-mail address for author Wen-Ju Pan if correct.
Q2 AUTHOR: Please check if ’Dawn’ is part of the given name for author Shella DawnKeilholz.
Q3 AUTHOR: ’RS’ – please give in full.
Q4 AUTHOR: ’S1FL’ – please give in full.
Q5 AUTHOR: ’EPI’ expanded as ’echo planar imaging’ – OK?
Q6 AUTHOR: Please provide abbreviated with dot journal title for Reference 3.
Q7 AUTHOR: References 11–13 vol. and page nos?
Q8 AUTHOR: Figure 3 contains small text. Please check and resupply if necessary.

USING e-ANNOTATION TOOLS FOR ELECTRONIC PROOF CORRECTION
Required software to e-Annotate PDFs: Adobe Acrobat Professional or Adobe Reader (version 7.0 or above). (Note that this document uses screenshots from Adobe Reader X) The latest version of Acrobat Reader can be downloaded for free at: http://get.adobe.com/uk/reader/
Once you have Acrobat Reader open on your computer, click on the Comment tab at the right of the toolbar:
1. Replace (Ins) Tool – for replacing text.
Strikes a line through text and opens up a text box where replacement text can be entered.
How to use it
Highlight a word or sentence.
Click on the Replace (Ins) icon in the Annotations section.
Type the replacement text into the blue box that appears.
This will open up a panel down the right side of the document. The majority of tools you will use for annotating your proof will be in the Annotations section, pictured opposite. We’ve picked out some of these tools below:
2. Strikethrough (Del) Tool – for deleting text.
Strikes a red line through text that is to be deleted.
How to use it
Highlight a word or sentence.
Click on the Strikethrough (Del) icon in the Annotations section.
3. Add note to text Tool – for highlighting a section to be changed to bold or italic.
Highlights text in yellow and opens up a text box where comments can be entered.
How to use it
Highlight the relevant section of text.
Click on the Add note to text icon in the Annotations section.
Type instruction on what should be changed regarding the text into the yellow box that appears.
4. Add sticky note Tool – for making notes at specific points in the text.
Marks a point in the proof where a comment needs to be highlighted.
How to use it
Click on the Add sticky note icon in the Annotations section.
Click at the point in the proof where the comment should be inserted.
Type the comment into the yellow box that appears.

USING e-ANNOTATION TOOLS FOR ELECTRONIC PROOF CORRECTION
For further information on how to annotate proofs, click on the Help menu to reveal a list of further options:
5. Attach File Tool – for inserting large amounts of text or replacement figures.
Inserts an icon linking to the attached file in the appropriate pace in the text.
How to use it
Click on the Attach File icon in the Annotations section.
Click on the proof to where you’d like the attached file to be linked.
Select the file to be attached from your computer or network.
Select the colour and type of icon that will appear in the proof. Click OK.
6. Add stamp Tool – for approving a proof if no corrections are required.
Inserts a selected stamp onto an appropriate place in the proof.
How to use it
Click on the Add stamp icon in the Annotations section.
Select the stamp you want to use. (The Approved stamp is usually available directly in the menu that appears).
Click on the proof where you’d like the stamp to appear. (Where a proof is to be approved as it is, this would normally be on the first page).
7. Drawing Markups Tools – for drawing shapes, lines and freeform annotations on proofs and commenting on these marks.
Allows shapes, lines and freeform annotations to be drawn on proofs and for comment to be made on these marks..
How to use it
Click on one of the shapes in the Drawing Markups section.
Click on the proof at the relevant point and draw the selected shape with the cursor.
To add a comment to the drawn shape, move the cursor over the shape until an arrowhead appears.
Double click on the shape and type any text in the red box that appears.
Related Documents