Provided by the author(s) and University College Dublin Library in accordance with publisher policies. Please cite the published version when available. Downloaded 2013-02-24T19:45:42Z Some rights reserved. For more information, please see the item record link above. Title Time and Space Resolved Uptake Study of Silica Nanoparticles by Human Cells Author(s) Shapero, Kayle; Fenaroli, Federico; Lynch, Iseult; Cottell, David C.; Salvati, Anna; Dawson, Kenneth A. Publication Date 2011 Publication information Molecular Biosystems, 7 (2): 371-378 Publisher Royal Society of Chemistry This item's record/more information http://hdl.handle.net/10197/3694

Welcome message from author
This document is posted to help you gain knowledge. Please leave a comment to let me know what you think about it! Share it to your friends and learn new things together.
Transcript
Provided by the author(s) and University College Dublin Library in accordance with publisher policies. Please
cite the published version when available.
Downloaded 2013-02-24T19:45:42Z
Some rights reserved. For more information, please see the item record link above.
Title Time and Space Resolved Uptake Study of SilicaNanoparticles by Human Cells
Author(s) Shapero, Kayle; Fenaroli, Federico; Lynch, Iseult; Cottell,David C.; Salvati, Anna; Dawson, Kenneth A.
PublicationDate 2011
Publicationinformation Molecular Biosystems, 7 (2): 371-378
Publisher Royal Society of Chemistry
This item'srecord/moreinformation
http://hdl.handle.net/10197/3694
1
Time and Space Resolved Uptake Study of Silica
Nanoparticles by Human Cells
Kayle Shapero,1 Federico Fenaroli,
1,2 Iseult Lynch,
1 David C. Cottell,
2 Anna Salvati,*
1 and Kenneth
Dawson* 1.
(Kayle Shapero and Federico Fenaroli contributed equally to this manuscript)
1Centre for BioNano Interactions, School of Chemistry and Chemical Biology, UCD Conway Institute
for Biomolecular and Biomedical Research, University College Dublin, Belfield, Dublin 4, Ireland;
2Electron Microscopy Laboratory, University College Dublin, Belfield, Dublin 4. Ireland.
*Corresponding authors:
Kenneth A. Dawson ([email protected]); Anna Salvati ([email protected])
Centre for BioNano Interactions, School of Chemistry and Chemical Biology, University College
Dublin, Belfield, Dublin 4, Ireland
Phone: +353 (0)1 716 6928; Fax: +353 (0)1 716 2415.
2
A spatio-temporal mapping of the uptake of silica (SiO2) nanoparticles of different sizes by lung
epithelial cells has been obtained. Based on high control of nanoparticle dispersion in cell media and
cell exposure, one obtains reproducible and quantitative time-resolved data using a combination of flow
cytometry, fluorescence and electron microscopies. We are thereby able to give a rather detailed account
the journey of SiO2 nanoparticles from the early events of uptake to their final sub-cellular localization.
Introduction
Scientists, regulatory authorities and industry are currently considering whether living organisms interact
differently with nanoparticles than with larger particles of similar substances, or small molecules.1-4
The
increased accessibility of nanoparticles to cellular machinery (combined with their enormous surface
area which binds large quantities of proteins and other biomolecules) may lead to new biological
impacts from nanoscale materials.5-8
Significant experimental and data interpretation challenges can also
result from the nanoscale nature of materials, such as biomolecule-induced particle agglomeration and
non-linear dose-responses due to particle agglomeration at high concentrations,9 or the presence of the
nanomaterials interfering with biological assay readouts by adsorbing the reporter molecules to their
surface.10
Combined, these effects have lead to some significant uncertainty in the literature, and to the
need for systematic and highly controlled studies to assess the potential health implications of
nanomaterials.11, 12
There are few examples where a complete account of the uptake pathway and final
localization of engineered nanoparticles can be given, for this requires a full time resolved study using a
variety of complementary techniques. Furthermore, if one is to compare the different methods, it is
necessary to ensure that the uptake process itself can be accomplished reproducibly. A variety of
different cell-interaction outcomes with silica nanoparticles have been reported recently, some citing
export or degradation after particle accumulation.13
The existing literature contains a number of results
involving different materials (mesoporous silica as opposed to amorphous silica, or materials of
3
different surface charge, size and aspect ratio) presented to a range of different cell types, with different
suggestions for the uptake and transport pathways.14-18
In part because of this diversity of results and
outcomes in the literature, we seek to be as definitive as possible on the more limited question of the
spatio-temporal description of nanoparticle uptake up until cell division. To clarify these issues in a
direct manner, sufficient controls have been established in this work to ensure reproducibility of the
various measurands including, for example flow cytometry data, so that the basic elements of cell-
uptake/export, intracellular transport, and final nanoparticle localization can be settled with certainty.
Much more extensive studies would be required to settle the functional impacts, and detailed entry
mechanism than have been hitherto undertaken.
Here, using lung epithelial cells as a simple model system, we illustrate how cellular uptake,
trafficking and localization of nanoparticles can be resolved in a spatio-temporal manner from early
entry to their final sub-cellular localisation. Limited results from our lab, not yet reported, using other
cell types such as astrocytes, HeLa and others lead to similar conclusions.
Using complementary methodologies of flow cytometry, confocal and electron microscopy (EM)
studies, we describe and explain the detailed time course of uptake and localization of SiO2
nanoparticles of different sizes (50, 100 and 300 nm) by A549 cells. Using fluorescently labelled SiO2
nanoparticles, all of these methods can be applied to replicate samples, giving complementary
information on different length and time scales. A detailed gallery of high resolution EM images at
different exposure times is given to illustrate the typical locations of the SiO2 nanoparticles inside the
cells as a function of time. To address the much cited issue of the special role of 100 nm as a cut off for
uptake in biological interactions,19-21
we show some comparisons for 300 nm particles, and discuss the
implications of the results. We find that the uptake process for all sizes of the SiO2 nanoparticles is
active (requiring energy), and EM indicates that nanoparticles enter one by one engulfed in a vesicle,
without evident involvement of classical-clathrin-coated pits. The intracellular nanoparticle
concentration grows linearly with increasing exposure time. At shorter exposure times, endosomal
structures are occupied, and later lysosomes are populated. Extensive studies have shown no evidence of
4
SiO2 nanoparticle export or particle degradation, and lysosomes appear to be the major final end
destination, with no evident association of the particles with other organelles in the cells. In no case is
there evidence of association of SiO2particles of these sizes with the nucleus.
Results and Discussion
SiO2 nanoparticles have been characterized by EM, and in dispersion in relevant buffers (as shown in
the Supplementary Information in Table S1 and Figure S1A-C). Although the fluorescent dye label is
chemically linked and (largely) internal, particles have also been checked for the presence of residual
labile dye which could affect the interpretation of the uptake studies, as described in Salvati et al.22
A
fluorescence image of a representative SDS gel is shown in Figure S1D, together with the excitation and
emission spectra of the SiO2 nanoparticles in PBS, as a reference (Figure S1E). These gels indicate the
relative intensities of the fluorescence associated with the SiO2 nanoparticles (top bands) and the
residual labile dye (bottom bands), which could be released from the particles in the cellular
environment, an issue that confounds uptake and localisation results in many samples.
The SiO2 nanoparticle dispersions in cell culture medium containing serum have also been characterised
by DLS over a period of 24 hours at 37 °C, in order to obtain insight regarding the stability of the
nanoparticles over the duration of their exposure to cells. The results for the 50 and 100 nm SiO2
nanoparticles are shown in Figure S1F-G; upon contact with serum, the particles are coated by proteins
and some larger particle-protein complexes are formed.23, 24
These dispersions are quite stable (as are the
particle protein coronas) for the duration of our experiments (see for example Walczyk et al.25
).
Using well-characterized standardised procedures for nanoparticle dispersion and exposure to cells,
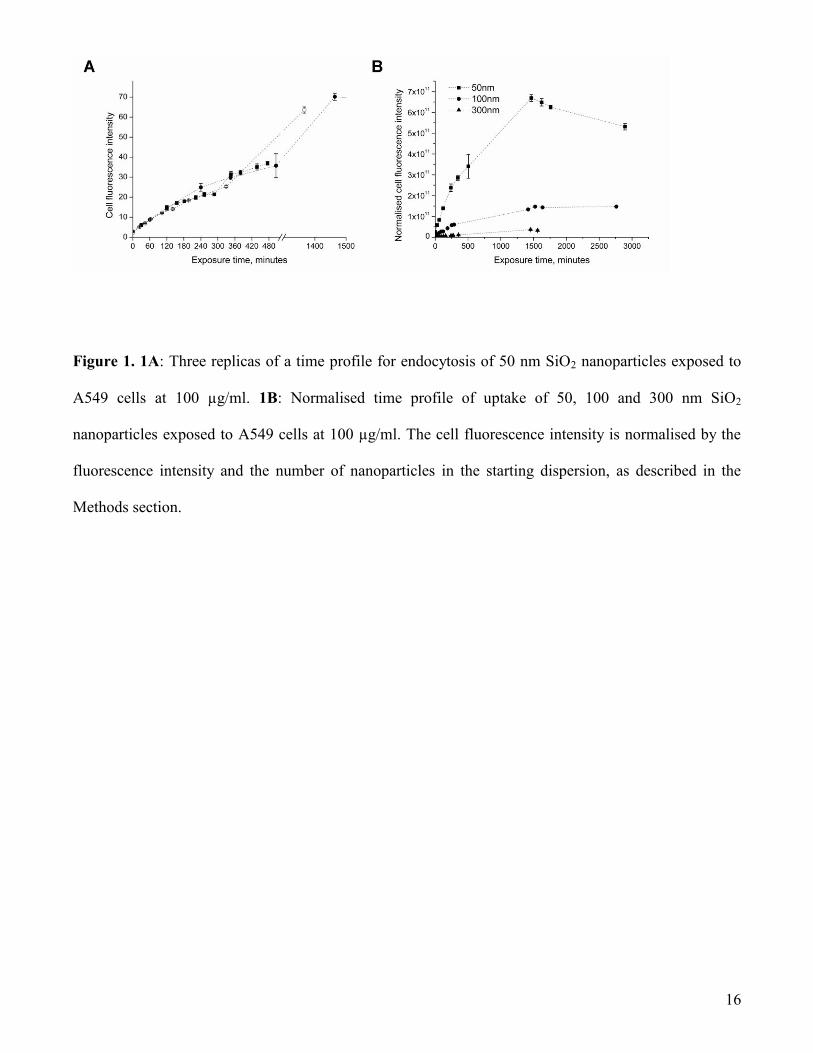
quantitatively reproducible uptake curves can be obtained. In Figure 1A, uptake profiles for the 50nm
SiO2 nanoparticles taken in independent experiments are shown. The data are the averaged mean of the
distributions obtained by flow cytometry on at least 15000 individual cells (see Methods for details).
Reproducibility of the replicates is excellent, and permits comparisons between the different
techniques used. Figure 1B shows the uptake profiles for the three SiO2 nanoparticle sizes after
5
normalization to the total number of particles in the dispersion and the average fluorescence per particle
for each size, as the fluorescence intensity per particle differs for the different particle sizes, as shown in
Figure S1E (see Methods section for a detailed explanation). The corresponding un-normalized data are
given in Figure S2A, while Figure S2B shows time profiles for early stages of uptake of the SiO2
nanoparticles. It is important to notice that un-normalised data can lead to wrong interpretations of these
kinetic profiles. Since we have made efforts to obtain quantitative data, we also interpret it in terms of
absolute intracellular mass (see Methods for details, though the raw data is still given in S2A). Without
this step, the size dependence of uptake is deceptive, and we believe that this approach may be of value
in future. The results indicate that SiO2 nanoparticle uptake is less rapid as particle size increases, but
even particles as large as 300nm enter the cells, with little evidence of a dramatic change in the
internalisation kinetics for sizes beyond 100nm. Nanoparticle uptake is linear for the first few hours, and
the deviations from this at later times are discussed after the presentation of Figure 4.
Systematic imaging studies on identical samples are revealing regarding the SiO2 particle location(s)
during the different periods of the uptake. Since the cells are exposed continuously to excess particles,
we discuss when particles first reach a given location, and, separately, the different events that can be
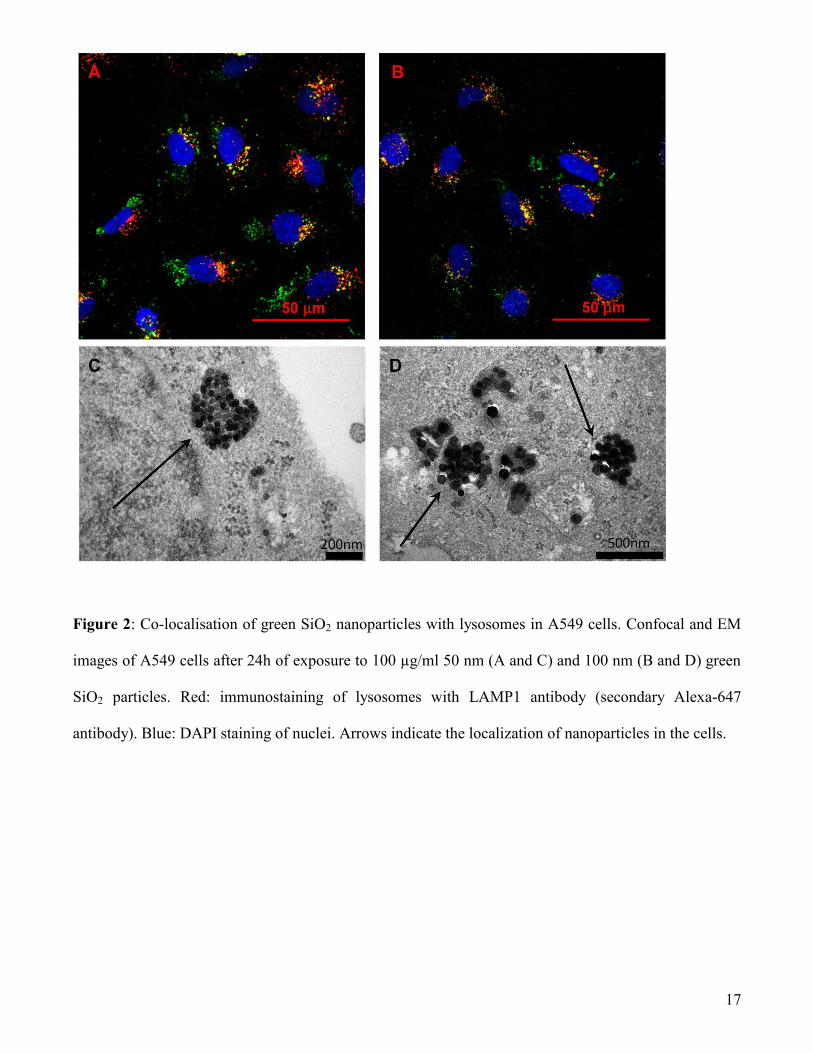
observed at steady state. Confocal microscopy and EM imaging clearly show that the final localisation
of both the 50 and the 100nm SiO2 nanoparticles is in the lysosomes. This is particularly clear after long
exposure times, as shown in Figure 2 after 24h of uptake.
Earlier events of uptake and trafficking in cells are more complex. Fluorescence microscopy shows that
after 2h of exposure to SiO2 nanoparticles of sizes 50 and 100nm, there is no clear evidence of co-
localization in either EEA1 positive endosomal structures (Figures S3A and S3B for 50 and 100 nm
particles respectively), or in LAMP1-positive lysosomes (Figure S3C and S3D). Naturally, objects are
not accumulated in EEA1-positive endosomes but are instead sorted to different locations into cells, and
one is thus dependent on fluorescence intensity limits. Co-localisation with these structures cannot be
observed by simply increasing the exposure time. Still, we note that, even after 24h of exposure, there is
6
no evident co-localisation with EEA1-endosomes (Figure S3E and S3F for 50 and 100 nm SiO2
nanoparticles).
The time course of the EM images is quite unambiguous and shows that in first tens of minutes
(Figure S4) SiO2 nanoparticles pass the cell membrane and enter early endosomal structures, but are still
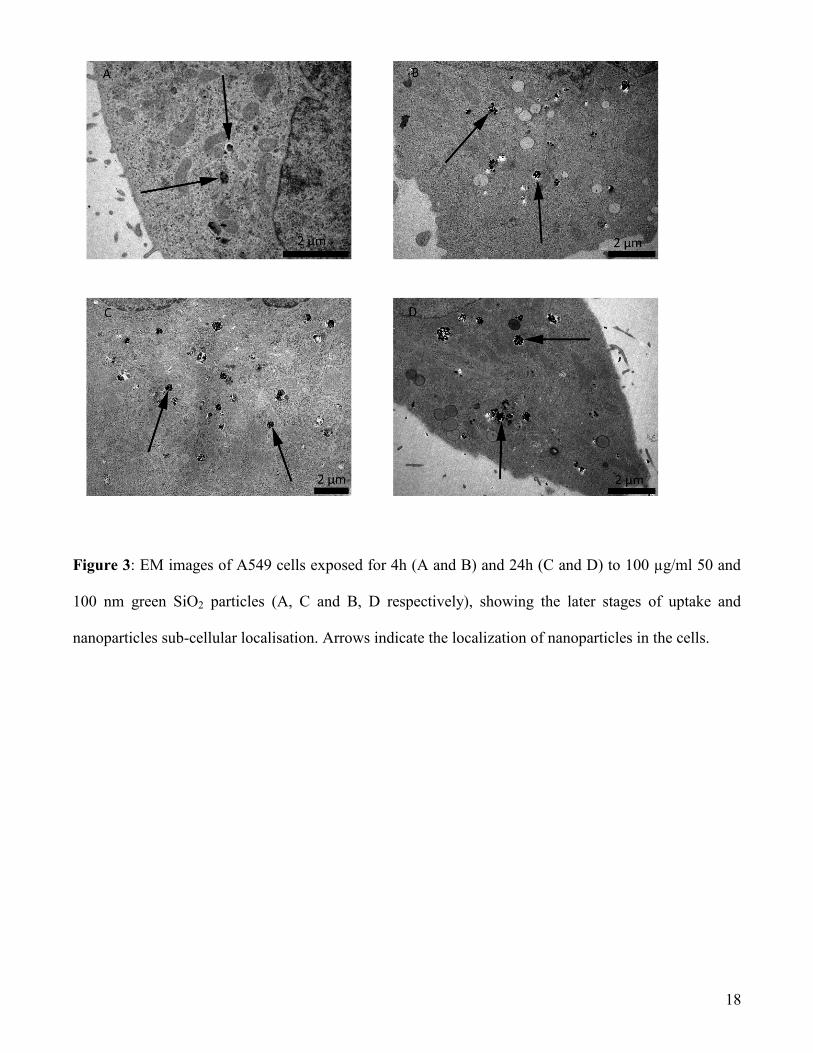
largely absent from the rest of the cell. After 4 hours, as shown in Figure 3, SiO2 nanoparticles have
reached the lysosomes in some numbers (Figure 3A and B for 50 and 100 nm particles) and at 24 hours
lysosomes are highly populated with particles (Figure 3C-D for both particle sizes). These results
essentially interpret the flow cytometry results over the relevant time period.
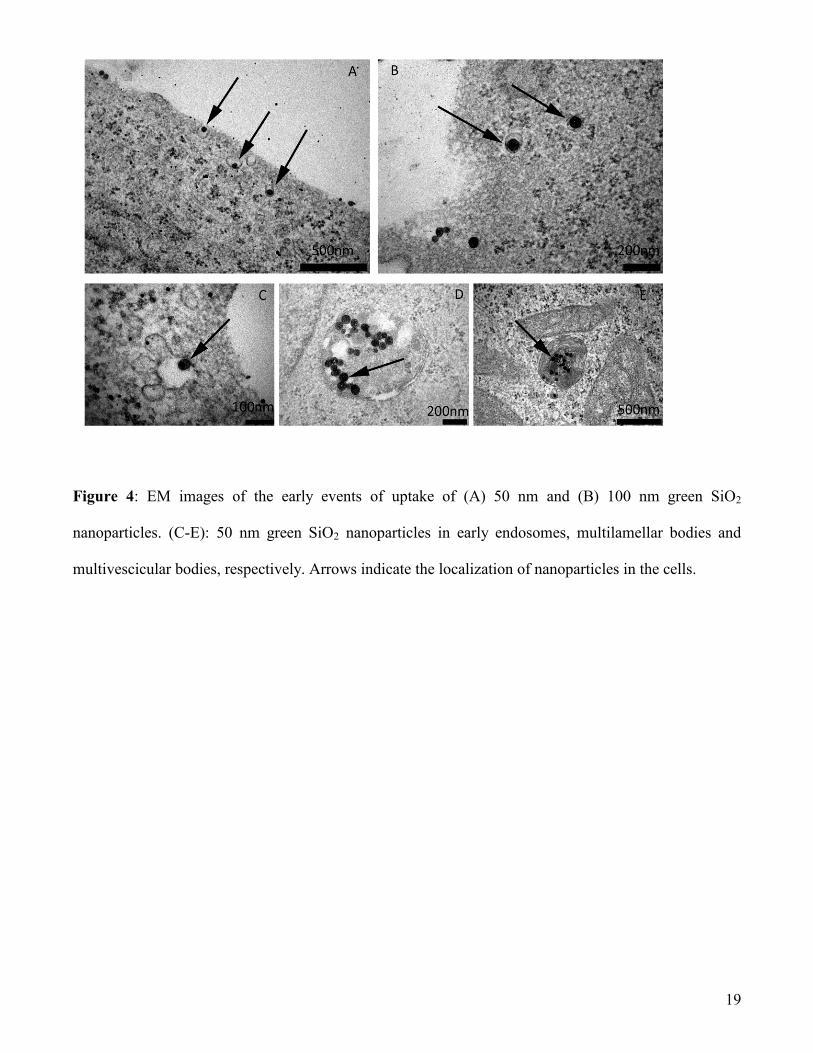
Detailed EM images, as shown in Figure 4, illustrate the events occurring during the SiO2 nanoparticle
uptake and trafficking processes. Early cell membrane crossing and transport events are shown (Figure
4A for 50 nm, and B for 100 nm SiO2 nanoparticles), indicating that particles enter one by one via
membrane invaginations and early stages of transport into the cells within endosomes. Enlarged views
of the invaginations yield no evidence of the involvement of clathrin. The resulting vesicle has sizes
slightly larger than the 100nm nanoparticles (see panel A and B). Deeper into the cytosol there is
evidence of more complex endosomal fusion events (Figure 4C). Though uncommon, multi-vesicular
and multilamellar bodies containing particles have also been identified (4D and E). Short-time
immunostaining with EEA1, clathrin heavy chain and caveolin 1 antibodies give no clear evidence of
co-localisation with any of these structures (Figure S5). Whilst not conclusive, such experiments
highlight the ongoing uncertainty about the nature of nanoparticle uptake pathways, and we consider it
necessary to exercise caution in this whole question and in interpretation of the experimental results for
the moment.
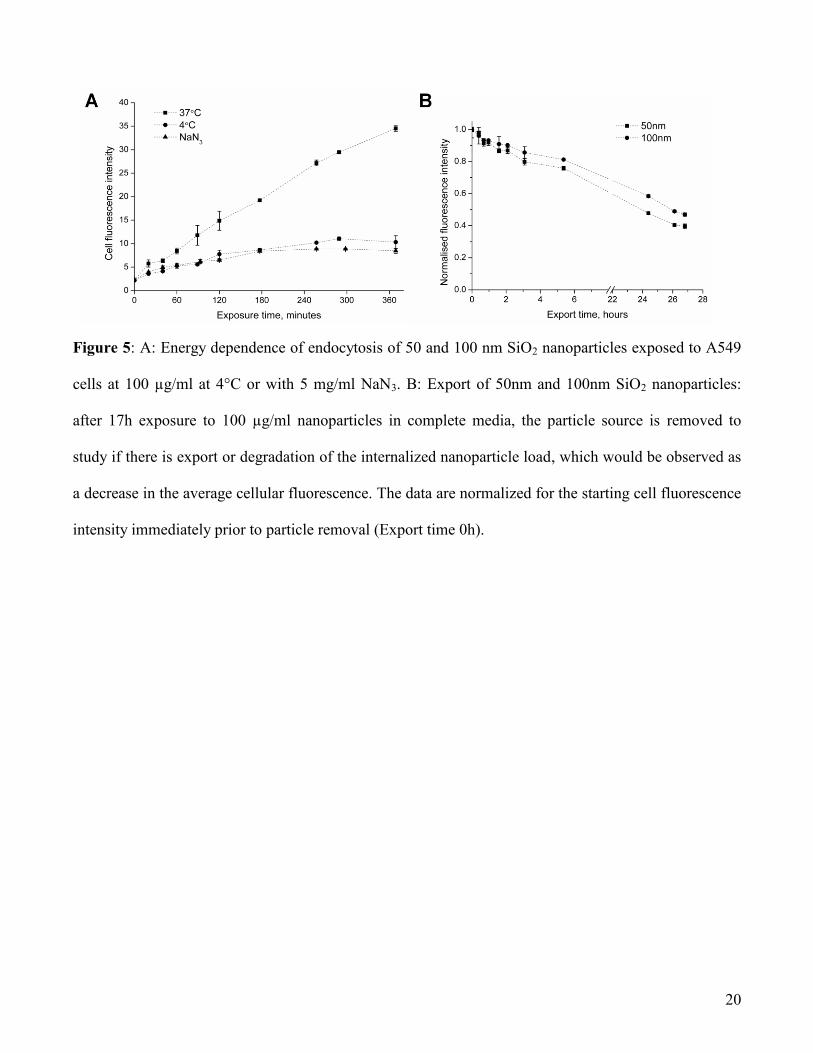
Depletion of cellular energy using sodium azide (which inhibits the respiratory chain in the
mitochondria, thus impairing the production of ATP in the cell) or lowered cell culture temperature
reduces considerably the rate of intracellular fluorescence increase, corresponding to reduced particle
uptake, as shown by flow cytometry in Figure 5A. EM images (see Figure S7) of cells after 4h of
exposure to SiO2 nanoparticles in the presence sodium azide or at 4°C confirm the idea that uptake
7
largely ceases with energy depletion: almost no particles could be found in cells under these conditions.
Interestingly though, with depletion of energy at 4°C, the few particles that enter are stopped (even after
4 hours) at early events and no particles could be found in lysosomes. This could reflect the fact that at
this temperature not only are active processes impaired, but also that the lipids of the cell and organelle
membranes have an increased tendency to form a ‘gel-like’ phase which further inhibits trafficking
inside the cell. On the other hand, with sodium azide depletion of cellular energy, the rare particles that
do enter go to the lysosomes. Even though these subtle differences could be observed, we may conclude
that the major outcome of both these treatments confirmed that uptake is a strongly energy dependent
process. These results are in agreement with similar data from the literature regarding the interaction of
mesoporous silica with pancreatic and hepatic cancer cells, and silica coated nanoparticles with HeLa
cells, where the authors also found the uptake to be energy dependent.17, 18
It is also of interest to investigate whether the SiO2 nanoparticles have exit pathways once they have
been taken up into cells and if silica degradation can occur once SiO2 particles accumulate in the
lysosomes. Indeed, silica has been even been posed as a useful drug delivery material, and it is of some
interest to appreciate its fate at the cellular level. Thus, after some hours of exposure to SiO2
nanoparticles, cells are washed and incubated with medium (without particles) and the fluorescence
intensity in the cells observed as a function of time. The flow cytometry studies in Figure 5B indicate
that, in this scenario, once nanoparticles have reached the lysosomes (after 17 hours exposure)
fluorescence decrease is extremely slow. Direct imaging observations indicate that, upon cell division,
the intracellular nanoparticle load is split, more or less equally, between the 2 daughter cells
(representative confocal images are given in Figure S6). One can show that uptake compets with cell
division leading to the apparent long-time saturation of fluorescence, as shown in Figure 1B. Using
upper and lower bounds to cell division time (16 to 22 hours as indicated for this cell line), these time
profiles can be modelled as explained in ref.22
and the typical slow decrease of fluorescence observed in
Figure 5B can be explained by the only cell division, without recourse to nanoparticle export. Time
8
resolved EM images (see Figure 3) are in agreement and quite convincing. They yield no evidence of
loss of SiO2 nanoparticles by export or degradation, at least on the time-scales investigated here.
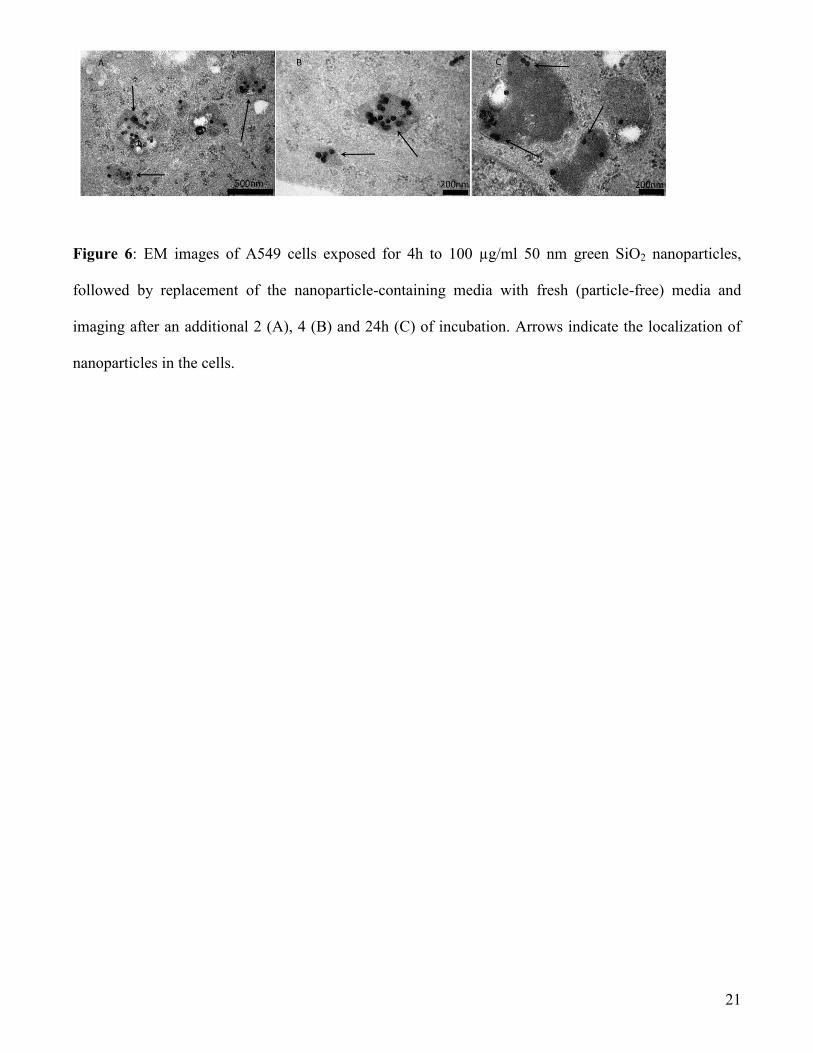
More refined analysis has been carried out by additional EM studies on nanoparticle final localisation
and export: after allowing uptake for 4 hours, followed by removal of excess external particles and
incubation of the cells in medium without particles, the time course of the typical movements of the
internalised SiO2 nanoparticles can be followed by EM (see Figure 6). These image sequences are
striking. They suggest that the SiO2 nanoparticles continue to travel to the lysosomes (only rarely are
particles still seen in intermediate locations), and after 24h of this chasing experiment, nanoparticles
could still only be found in the lysosomes, where they appear to remain. Whilst one cannot fully exclude
export processes (and indeed there is no real reason to expect lysosomes to release the particles), if they
exist, they are rare events. That is, nanoparticles will tend to accumulate irreversibly in lysosomes.
Having summarized the main results, several more subtle aspects of the system are worth comment,
especially for the larger SiO2 particles. Detailed EM images for the uptake of the 300nm particles by
A549 cells (Figures S8) show that even these larger particles enter as single objects. It is difficult,
however, to visualise the presence of a vesicle around them during the early events of uptake, as was
evident for the smaller particle sizes. This could be due to the increased contrast for these larger SiO2
particles, which makes the proximate structures of the cell less visible, but it may also signal a different
uptake process. As was the case for the smaller SiO2 particle sizes, the final particle localization is in
confined structures inside the cells (see Figure S9). These confined structures appear to be lysosomes
(note that the ‘holes’ are likely due to the much bigger size of the particles in comparison to the
ultramicrotomy slices of 80nm). In some cases, the 300nm SiO2 particles seem to accumulate in
organelles that resemble macropinosomes. Further studies are required to confirm these preliminary
results. In light of what is reported here, efforts should be made to study the precise nature of the uptake
mechanisms, without prejudice or a priori assumption that any of the well known uptake mechanisms
are at work. Fluorescence immunostaining confirms co-localization of the 300nm SiO2 particles with
9
lysosomes already after 4h (see Figure S9), but as for the other particle sizes these is no evidence of co-
localization with EEA1 labeled early endosomes.
Conclusions
In this work, SiO2 nanoparticles of different sizes have been exposed in a controlled and reproducible
way to A549 lung epithelial cells. We establish that, if one fixes carefully all aspects of the system, from
nanoparticle dispersion in cell media, to exposure to cells and sample preparation for the final
measurements, dose control and quantitative reproducibility of these complex systems can be achieved.
This allows us to ‘make a movie’ of the uptake process via the different, complementary, imaging
approaches, so that they may be visualized and the process quantified from the early entry to the final
sub-cellular destination of the particles. This clarifies rather well the nature of the processes, at least for
silica nanoparticles, and illustrates how such studies may be planned in future.
Our results show that uptake of SiO2 nanoparticles by A549 cells is energy dependent but with no
evident involvement of classic pathways like clathrin or caveolin dependent mechanisms. Moreover,
even particles larger than 100nm can easily enter the cells (300nm) although with lower efficiency of
uptake. Competing nanoparticle export, if present at all, is insignificant, SiO2 nanoparticles accumulate
in the lysosomes, and there is no evidence of silica particles reaching the nucleus under the conditions
studied. By making these statements we do not exclude the possibility of rarer events in which
nanoparticles escape the uptake pathway and reach other organelles, and certainly fluorescence
microscopy of this type is limited by the label intensity, while electron microscopy is limited by
statistics.
Our hope is that these studies will frame the further investigations needed to obtain a full understanding
of the biological pathways of uptake of nanoscale materials, which is still a topic of considerable
uncertainty.
10
Experimental section
Nanoparticle characterization. Silica (SiO2) nanoparticles were purchased from G. Kisker- Products for
Biotechnology (Steinfurt, Germany) at sizes of 50, 100 and 300 nm with green or red fluorescent labels.
Unless otherwise stated, the experiments were performed using the green fluorescent variants. To
confirm that the size of the nanoparticles matched the size as stated by the manufacturers, EM pictures
of the dried nanoparticles were taken. Particle dispersions were characterized at concentrations of 100
µg/ml in millipore water, PBS, and the cell culture media, using a Malvern Zetasizer Nano ZS90
(Worcestershire, UK) to measure the hydrodynamic radius by Dynamic light scattering (DLS) and the
zeta potential (surface charge). The samples in cell culture media have been characterized for up to 24h
of incubation at 37°C, in order to obtain a better description of the evolution of the protein corona
formed upon contact with the serum and to study their stability against agglomeration during the full
length of the exposure to cells. The emission and excitation spectra of the fluorescent SiO2 nanoparticles
were produced using a Perkin-Elmer LS 50B fluorimeter (Perkin-Elmer, Waltham, Massachusetts). The
green-labelled SiO2 nanoparticles were excited at their optimum wavelength of 485 (as specified by
Kisker-Products) and at 488nm (to match the excitation wavelength used in the Flow Cytometer for cell
uptake) and their emission spectra compared.
Cell Culture. A549 cells (passage 1-30 after defrosting from liquid nitrogen; original batches from
ATCC, item number CCL-185, at passage number 105 or 82) were cultured at 37 ºC in 5% CO2 in
Minimum Essential Medium (MEM, with additional L-Glutamine) supplemented with 10% Fetal Calf
Serum (FCS, Gibco), 1% penicillin/streptomycin (Invitrogen Corp.), and 1% MEM non-essential amino
acids (HyClone). Cells were confirmed to be mycoplasma negative using the mycoAlert kit (Lonza Inc.
Allendale, NJ) and were tested monthly.
Cellular treatments and nanoparticle dispersion in cell medium. Cells were plated at a density of 2.5 x
105 cells in a 6cm plate and allowed to adhere for 24 hours before exposure to 100ug/ml SiO2
nanoparticle dispersions. Nanoparticle dispersions were prepared by diluting the concentrated
nanoparticle stock solutions into the complete medium used for cell culture at room temperature,
11
immediately prior to the experiments on cells, with an identical time delay between diluting and
introducing the particles to the cells for all experiments. The medium was kept at room temperature and
not pre-warmed to 37°C to ensure better nanoparticle dispersions.
Cells were incubated with nanoparticles for the required times, depending on the experiment, and then
the particle-containing medium was discarded. In the case of export experiments, after exposure to
particles performed as described above, the dispersion was discarded and after 3 washes with DPBS,
medium without particles was added to the cells which were further incubated for the appropriate times.
After the required import or export incubation time, medium was removed and the samples were washed
thrice with DPBS and prepared for flow cytometry as described below. Uptake and export profiles of the
different sized SiO2 nanoparticles were investigated under several conditions. Energy dependence of the
uptake of the SiO2 nanoparticles was determined by pre-incubating cells for 60 minutes at either 4C or
in media containing 5mg/ml sodium azide (Invitrogen) prior to the introduction of the nanoparticles.
These energy-depleting conditions were maintained for the duration of the uptake experiments.
Flow Cytometry. Flow cytometry was carried out in the Flow Cytometry Core Facility of the Conway
Institute at University College Dublin. Fluorescence levels in the cells were measured using a CyAn™
ADP Analyzer by Beckman Coulter (Fullerton, CA). Following treatment with nanoparticles, cells were
washed three times with PBS, to ensure particle removal from the outer cell membrane, and trypsinized
for 3 minutes with 1ml 0.5% Trypsin-EDTA (GIBCO, Invitrogen). After deactivation of the trypsin by
addition of 1 ml of complete MEM, cells were pelleted by centrifugation at 1500rpm for 3 minutes
before being re-suspended in 4% Formaline solution for fixation for 20 minutes. After fixation, cells
were pelleted again by centrifugation for 3 minutes at 1500rpm and re-suspended in 1ml PBS. Samples
were stored at 4 C for approximately one hour before fluorescence levels were detected using the Flow
Cytometer.
The results are reported as the mean of the distribution of cell fluorescence intensity, obtained on at least
15000 events (cells), averaged between 3 independent replica. Error bars are the standard deviation
between the replica. The full time curves were performed at least 3 times.
12
Normalisation of the flow cytometry data. As shown in Figure S4B, without normalisation of the data,
the fluorescence of the cells due to SiO2 nanoparticle uptake is higher for larger particles. Given that
cells are treated with the same mass of nanoparticles, which means that very different particle numbers
are presented to the cells, and that the intensity of the starting dispersions are slightly different for the
different SiO2 nanoparticle sizes (as shown in Figure S2B), the raw data for each particle size have been
divided by the intensity of fluorescence of a single nanoparticle of that particle size. This normalisation
factor is obtained by dividing the intensity of emission of the starting dispersion (100 µg/ml in PBS as
obtained in Figure S2B) by the number of particles in 100 µg for each particle size calculated assuming
monodisperse spherical particles. After this normalisation, the fluorescence profiles are inverted (as
shown in Figure 1B) and this indicates that uptake is larger for the smaller SiO2 nanoparticle sizes, as
one would expect for non-phagocytic cells.
Confocal Imaging. Cells were plated on 35mm plates with 15mm diameter glass coverslips at densities
ranging from 1.25x10⁵ to 1.8x10
5 cells and treated as described above for flow cytometry sample
preparation. For actin visualization, cells were washed with 3 x 1ml PBS, permeabilized for 5 minutes
with 0.1% saponin from Quillaja bark (Sigma, St. Louis, MO), washed again with 3 x 1ml PBS then
incubated at room temperature for 20 minutes with a 2% Texas Red-X Phalloidin (Invitrogen) and 0.5%
BSA in PBS. Slides were then washed with 3 x 1ml PBS, treated for 3 minutes with DAPI to stain the
nuclei, washed with 1ml PBS, and then mounted onto slides for imaging. For lysosome and early
endosomes staining, samples were washed with 3 x 1ml PBS, fixed for 20 minutes with 1ml 4%
Formaline, permeabilized for 5 mins of 1ml 1% saponin from Quillaja bark (Sigma), and incubated for
30 minutes at room temperature with a blocking solution of 1% Albumin Bovine Serum Fraction V
(Sigma) in PBS-T to prevent non specific binding. Samples were incubated for 1 hour at room
temperature with a primary antibody of 1:330 mouse mAb to EEA1 (Abcam, Cambridge, UK) or 1:200
mouse mAb to LAMP [H4A3] (Abcam, Cambridge, UK), washed with 3 x 1ml PBS, and then incubated
at room temperature for 1hr with 1:400 dilution of AlexaFluor 647 Goat Anti-mouse IgG (H+L) as a
secondary antibody. Samples were washed 3 x 1ml PBS and incubated for 3 minutes with DAPI before
13
mounting with MOWIOL on slides for imaging. The cells were observed using a Carl Zeiss LSM 510
Meta laser scanning confocal microscope (Zeiss, Munchen, Germany) with lasers at 364nm (DAPI),
488nm (FITC labelled SiO2 nanoparticles), 543nm (Phalloidin), and 633nm (EEA1 and LAMP
antibodies).
Electron Microscopy. A549 cells treated as described above were fixed at room temperature in 2.5%
glutaraldehyde in 0.1 M Sorensen phosphate buffer(pH 7.3) for 1h, rinsed with Sorensen phosphate
buffer (pH 7.3), and then post-fixed for 1h in 1% osmium tetroxide in deionised water. After
dehydrating the samples in increasing concentrations of ethanol (from 70% up to 100%), they were then
immersed in an ethanol/Epon (1:1 vol/vol) mixture for 1h before being transferred to pure Epon and
embedded at 37 °C for 2 hours. The final polymerization was carried out at 60 °C for 24 hours. Ultrathin
Sections of 80nm, obtained with a diamond knife using an ultramicrotome Leica U6, were mounted on
copper grids, and stained with uranyl acetate and lead citrate before being examined with an FEI
TECNAI Transmission Electron Microscope. The Electron Microscope images were acquired, for each
condition, on (technical) replicate samples and three independent biological replicas (that is, different
experiments) to confirm the validity of the observed results. An average of about 50 images was taken
for each sample. Representative images have been selected for publication. Whilst the data and imaging
seem compelling, it will in future be useful to strive toward more statistical analysis in imaging.
SDS PAGE. SDS Polyacrylamide Gel Electrophoresis (PAGE) gels (4% stacking gel and 10% resolving
gel) were used to estimate the ratio of fluorescence due to the SiO2 nanoparticles and that due to residual
labile dye that elutes from the particles. Particles (25mg/ml) were diluted 1:1 with loading buffer (10%
mercaptoethanol, and 20% glycerol in Tris/HCl 25 nM ph 6.9, with 10% SDS), and loaded into the
stacking gel. Gels were run at 120mV for 45-60 minutes. Pictures were acquired using a Fujifilm
Intelligent dark box LAS-3000, exciting the gels with a blue light at 460nm and emission was recorded
with a 515nm filter. Images were taken at 2 second exposure times.
14
Acknowledgements
Funding for the project has been generously provided by EU FP6 NanoInteract (NMP4-CT-2006-
033231), SFI RFP (06/RFP/CHP031), EPA project grant (2008-EH-MS-5-S3-R2), the Irish Research
Council for Science, Engineering and Technology (A.S.), and is based upon works supported by Science
Foundation Ireland under Grant No. [SFI/SRC/B1155]. Andrzej Pitek and Dr. Francesca Baldelli
Bombelli are kindly acknowledged for assistance with nanoparticle characterization in cell culture
medium. Dr. Alfonso Blanco (UCD Conway Flow Cytometry facility) is kindly acknowledged for
technical support with flow cytometry. Use of the UCD Conway Imaging Facility and the UCD Electron
Microscopy Core facility is also acknowledged.
References
1. Colvin, V. L. The potential environmental impact of engineered nanomaterials. Nat Biotech
2003, 21 (10), 1166-1170.
2. Donaldson, K.; Stone, V.; Tran, C. L.; Kreyling, W.; Borm, P. J. A. Nanotoxicology. Occup
Environ Med 2004, 61 (9), 727-728.
3. Allianz and OECD: Small sizes that matter: Opportunities and risks of Nanotechnologies. 2005.
4. Dusinska, M.; Fjellsba ,̧ L.; Magdolenova, Z.; Rinna, A.; Runden Pran, E.; Bartonova, A.;
Heimstad, E.; Harju, M.; Tran, L.; Ross, B.; Juillerat, L.; Halamoda Kenzaui, B.; Marano, F.; Boland,
S.; Guadaginini, R.; Saunders, M.; Cartwright, L.; Carreira, S.; Whelan, M.; Kelin, C.; Worth, A.;
Palosaari, T.; Burello, E.; Housiadas, C.; Pilou, M.; Volkovova, K.; Tulinska, J.; Kazimirova, A.;
Barancokova, M.; Sebekova, K.; Hurbankova, M.; Kovacikova, Z.; Knudsen, L.; Poulsen, M.; Mose, T.;
Vilà , M.; Gombau, L.; Fernandez, B.; Castell, J.; Marcomini, A.; Pojana, G.; Bilanicova, D.; Vallotto,
D. Testing strategies for the safety of nanoparticles used in medical applications. Nanomed 2009, 4 (6),
605-607.
5. Nel, A. E.; Madler, L.; Velegol, D.; Xia, T.; Hoek, E. M. V.; Somasundaran, P.; Klaessig, F.;
Castranova, V.; Thompson, M. Understanding biophysicochemical interactions at the nano-bio interface.
Nat Mater 2009, 8 (7), 543-557.
6. Lynch, I.; Salvati, A.; Dawson, K. A. Protein-nanoparticle interactions: What does the cell see?
Nat Nano 2009, 4 (9), 546-547.
7. Oberdörster, G.; Elder, A.; Rinderknecht, A. Nanoparticles and the Brain: Cause for Concern? J
Nanosci Nanotech 2009, 9, 4996-5007.
8. Park, E.-J.; Yi, J.; Kim, Y.; Choi, K.; Park, K. Silver nanoparticles induce cytotoxicity by a
Trojan-horse type mechanism. Toxicology in Vitro 2010, 24 (3), 872-878.
9. Allouni, Z. E.; Cimpan, M. R.; Høl, P. J.; Skodvin, T.; Gjerdet, N. R. Agglomeration and
sedimentation of TiO2 nanoparticles in cell culture medium. Coll Surf B: Biointerfaces 2009, 68 (1), 83-
87.
10. Worle-Knirsch, J. M.; Pulskamp, K.; Krug, H. F. Oops They Did It Again! Carbon Nanotubes
Hoax Scientists in Viability Assays. Nano Letters 2006, 6 (6), 1261-1268.
11. Oberdörster, G.; Maynard, A.; Donaldson, K.; Castranova, V.; Fitzpatrick, J.; Ausman, K.;
Carter, J.; Karn, B.; Kreyling, W.; Lai, D.; Olin, S.; Monteiro-Riviere, N.; Warheit, D.; Yang, H.
15
Principles for characterizing the potential human health effects from exposure to nanomaterials:
elements of a screening strategy. Particle and Fibre Toxicology 2005, 2 (1), 8.
12. Dusinska, M.; et al. Development of methodology for alternative testing strategies for the
assessment of the toxicological profile of nanoparticles used in medical diagnostics. NanoTEST - EC
FP7 project. J Physics: Conference Series 2009, 170 (1), 012039.
13. Stayton, I.; Winiarz, J.; Shannon, K.; Ma, Y. Study of uptake and loss of silica nanoparticles in
living human lung epithelial cells at single cell level. Analyt Bioanalyt Chem 2009, 394 (6), 1595-1608.
14. Chung, T.-H.; Wu, S.-H.; Yao, M.; Lu, C.-W.; Lin, Y.-S.; Hung, Y.; Mou, C.-Y.; Chen, Y.-C.;
Huang, D.-M. The effect of surface charge on the uptake and biological function of mesoporous silica
nanoparticles in 3T3-L1 cells and human mesenchymal stem cells. Biomater 2007, 28 (19), 2959-2966.
15. Huang, X.; Teng, X.; Chen, D.; Tang, F.; He, J. The effect of the shape of mesoporous silica
nanoparticles on cellular uptake and cell function. Biomater 31 (3), 438-448.
16. Gemeinhart, R. A.; Luo, D.; Saltzman, W. M. Cellular Fate of a Modular DNA Delivery System
Mediated by Silica Nanoparticles. Biotech Progr 2005, 21 (2), 532-537.
17. Xing, X.; He, X.; Peng, J.; Wang, K.; Tan, W. Uptake of Silica-Coated Nanoparticles by HeLa
Cells. J Nanosci Nanotech 2005, 5, 1688-1693.
18. Lu, J.; Liong, M.; Sherman, S.; Xia, T.; Kovochich, M.; Nel, A.; Zink, J.; Tamanoi, F.
Mesoporous Silica Nanoparticles for Cancer Therapy: Energy-Dependent Cellular Uptake and Delivery
of Paclitaxel to Cancer Cells. NanoBioTechnology 2007, 3 (2), 89-95.
19. Royal Society of Chemistry and Royal Academy of Engineering: Nanoscience and
nanotechnologies: opportunities and uncertainties. Two-year review of progress on Government actions:
Joint academies' response to the Council for Science and Technology’s call for evidence. 2006.
20. Watson, P.; Jones, A. T.; Stephens, D. J. Intracellular trafficking pathways and drug delivery:
fluorescence imaging of living and fixed cells. Adv Drug Del Rev 2005, 57 (1), 43-61.
21. Rejman, J.; Oberle, V.; Zuhorn, I. S.; Hoekstra, D. Size-dependent internalization of particles via
the pathways of clathrin- and caveolae-mediated endocytosis. Biochem J 2004, 377 (1), 159-169.
22. Salvati, A.; Dos Santos, T.; Varela, J.; Åberg, C.; Pinto, P.; Lynch, I.; Dawson, K. A.
Experimental and theoretical approach to comparative nanoparticle and small molecule intracellular
import, trafficking, and export. Submitted 2010.
23. Cedervall, T.; Lynch, I.; Lindman, S.; Berggard, T.; Thulin, E.; Nilsson, H.; Dawson, K. A.;
Linse, S. Understanding the nanoparticle-protein corona using methods to quantify exchange rates and
affinities of proteins for nanoparticles. Proc Natl Acad Sci 2007, 104 (7), 2050-2055.
24. Jiang, J.; Oberdörster, G.; Biswas, P. Characterization of size, surface charge, and agglomeration
state of nanoparticle dispersions for toxicological studies. J Nanoparticle Res 2009, 11 (1), 77-89.
25. Walczyk, D.; Baldelli Bombelli, F.; Monopoli, M.; Lynch, I.; Dawson, K. A. What the Cell
“Sees” in Bionanoscience. J Amer Chem Soc 2010, 132 (16), 5761-5768.
16
Figure 1. 1A: Three replicas of a time profile for endocytosis of 50 nm SiO2 nanoparticles exposed to
A549 cells at 100 µg/ml. 1B: Normalised time profile of uptake of 50, 100 and 300 nm SiO2
nanoparticles exposed to A549 cells at 100 µg/ml. The cell fluorescence intensity is normalised by the
fluorescence intensity and the number of nanoparticles in the starting dispersion, as described in the
Methods section.
17
Figure 2: Co-localisation of green SiO2 nanoparticles with lysosomes in A549 cells. Confocal and EM
images of A549 cells after 24h of exposure to 100 µg/ml 50 nm (A and C) and 100 nm (B and D) green
SiO2 particles. Red: immunostaining of lysosomes with LAMP1 antibody (secondary Alexa-647
antibody). Blue: DAPI staining of nuclei. Arrows indicate the localization of nanoparticles in the cells.
18
Figure 3: EM images of A549 cells exposed for 4h (A and B) and 24h (C and D) to 100 µg/ml 50 and
100 nm green SiO2 particles (A, C and B, D respectively), showing the later stages of uptake and
nanoparticles sub-cellular localisation. Arrows indicate the localization of nanoparticles in the cells.
19
Figure 4: EM images of the early events of uptake of (A) 50 nm and (B) 100 nm green SiO2
nanoparticles. (C-E): 50 nm green SiO2 nanoparticles in early endosomes, multilamellar bodies and
multivescicular bodies, respectively. Arrows indicate the localization of nanoparticles in the cells.
20
Figure 5: A: Energy dependence of endocytosis of 50 and 100 nm SiO2 nanoparticles exposed to A549
cells at 100 µg/ml at 4°C or with 5 mg/ml NaN3. B: Export of 50nm and 100nm SiO2 nanoparticles:
after 17h exposure to 100 µg/ml nanoparticles in complete media, the particle source is removed to
study if there is export or degradation of the internalized nanoparticle load, which would be observed as
a decrease in the average cellular fluorescence. The data are normalized for the starting cell fluorescence
intensity immediately prior to particle removal (Export time 0h).
21
Figure 6: EM images of A549 cells exposed for 4h to 100 µg/ml 50 nm green SiO2 nanoparticles,
followed by replacement of the nanoparticle-containing media with fresh (particle-free) media and
imaging after an additional 2 (A), 4 (B) and 24h (C) of incubation. Arrows indicate the localization of
nanoparticles in the cells.
22
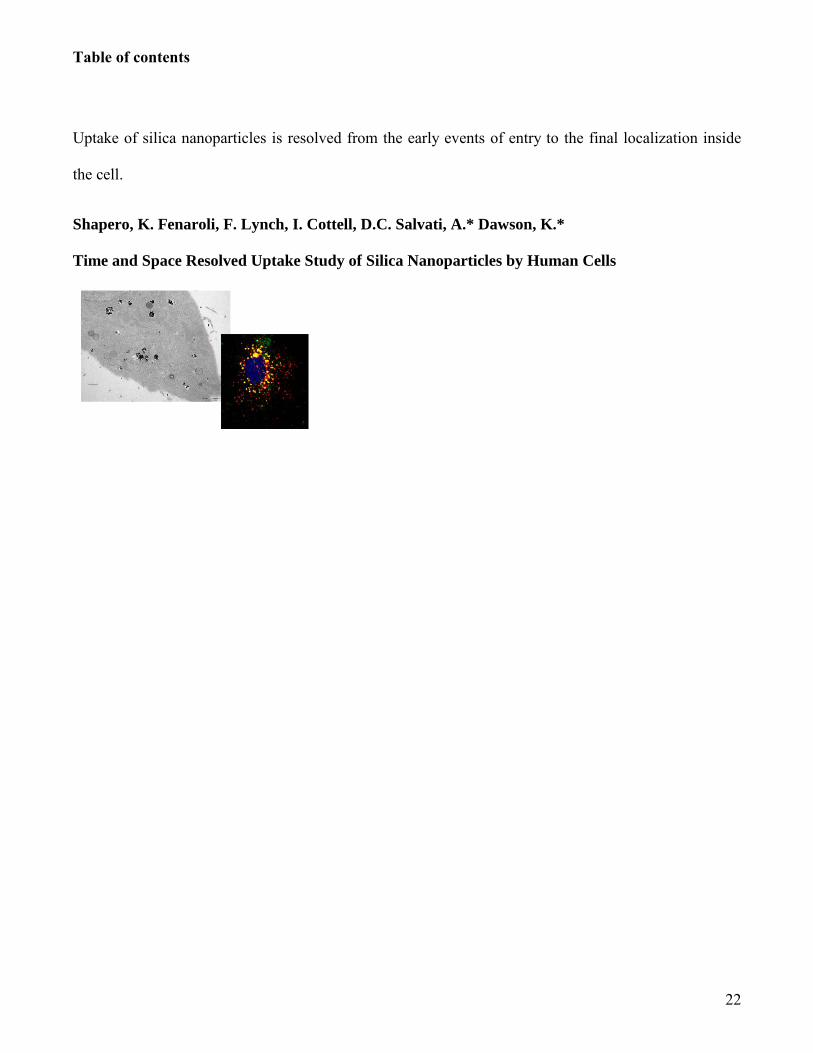
Table of contents
Uptake of silica nanoparticles is resolved from the early events of entry to the final localization inside
the cell.
Shapero, K. Fenaroli, F. Lynch, I. Cottell, D.C. Salvati, A.* Dawson, K.*
Time and Space Resolved Uptake Study of Silica Nanoparticles by Human Cells
Related Documents