Fifth International Symposium on Marine Propulsion SMP’17, Espoo, Finland, June 2017 Time accurate numerical cavitation erosion prediction of multiphase flow through a venturi Batuhan Aktas 1,* , Dmitriy Ponkratov 2 1 Naval Architecture, Ocean & Marine Engineering, University of Strathclyde, Glasgow, UK 2 Technical Investigation Department (TID), Lloyd’s Register, London, UK ABSTRACT Cavitation erosion affects the efficient operation of the vessel’s propeller, leading to increased costs of operation and maintenance. Traditionally, erosion is predicted using dedicated cavitation tests with utilization of soft paint application or materials as erosive sensors. However, even with materials that are most susceptible to erosion, such tests constitute significant amount of time. It is well- known that cavitation erosion occurs with the impact of high velocity liquid jets generated by the imploding bubbles, also called water hammer effect, and induced shock waves over time. However, it is both not a viable approach to simulate the complete duration of an experiment using numerical methods and extremely expensive in terms of computational time. Therefore, it is a common simplification to assume cavitation events to be repetitive for numerical simulations and based on this assumption there has been a plethora of studies utilizing the numerical simulations for cavitation erosion prediction. Whilst these simulations utilize instantaneous erosive power indicators for cavitation erosion estimation, an approach that takes into account of the summation/accumulation of the erosive intensity over time for precise erosion threshold determination is non- existent. Within this framework this study presents a time accurate numerical cavitation erosion prediction based on the intriguing experimental study conducted by Petkovšek & Dular (2013) that achieved visual cavitation erosion within 1.5 seconds. In addition to the well-known erosive indicators such as Erosive Power Function (Eskilsson & Bensow, 2015), Gray Level Method (Dular et al., 2006) and Intensity Function Method (van Terwisga et al., 2009), in house functions developed by Lloyds Register (LR) Technical Investigation Department (TID) (Ponkratov, 2015; Ponkratov & Caldas, 2015) are used to compare against the experimental results. Comparisons both aided the determination of a time accurate threshold and utilized as an evaluation case for each erosive indicator. Keywords Cavitation, Erosion, Erosive Indicators, Multiphase Flow. 1 INTRODUCTION Cavitation is a detrimental phenomenon for marine vehicles particularly in the field of propulsion. It manifests itself with undesirable effects to vessel’s operation by induced noise and vibration, deterioration of propeller performance and erosion. Amongst aforementioned undesirable consequences, cavitation erosion is considered to be most catastrophic as it can lead to increased noise and vibration, loss of propeller performance as well as high maintenance costs. Thus, prediction of cavitation erosion at an early design stage carries great importance. Current state of the art mainly relies on experimental investigations for the determination of erosive cavitation presence. These tests involve covering the blade foil sections with erosion prone material (Dular et al., 2006) or coating the propeller with soft paints that present pitting over significantly shorter time in comparison to full-scale operating conditions that cause cavitation erosion (Mantzaris et al., 2015). Nevertheless, carrying out such tests are mostly based on decades of experimental experience of renowned testing facilities and constitute significant amount of time and resources to carry out. For similar cavitation problems, such as noise, vibration and performance breakdown, it is generally possible to predict with reasonable accuracy using statistical, empirical or semi-empirical methods. However, it is rather impossible for cavitation erosion since it mainly occurs with the impact of high velocity liquid jets generated by the imploding bubbles and an accumulative process of consequent impacts over time (Bark & Bensow, 2014). Moreover, to further complicate the phenomena, properties of the collapse of cavitation such as location, velocity, area/volume, bubble shape, micro jet occurrence are all influential over the erosive potential of a cavitation (Bark et al., 2004). The lack of existence of such crucial, quick means of predictive tools resulted in development of more * Corresponding Author E-mail address:[email protected]

Welcome message from author
This document is posted to help you gain knowledge. Please leave a comment to let me know what you think about it! Share it to your friends and learn new things together.
Transcript

Fifth International Symposium on Marine Propulsion SMP’17, Espoo, Finland, June 2017
Time accurate numerical cavitation erosion prediction of multiphase flow through a venturi
Batuhan Aktas1,*, Dmitriy Ponkratov2 1 Naval Architecture, Ocean & Marine Engineering, University of Strathclyde, Glasgow, UK
2Technical Investigation Department (TID), Lloyd’s Register, London, UK
ABSTRACT
Cavitation erosion affects the efficient operation of the
vessel’s propeller, leading to increased costs of operation
and maintenance. Traditionally, erosion is predicted using
dedicated cavitation tests with utilization of soft paint
application or materials as erosive sensors. However,
even with materials that are most susceptible to erosion,
such tests constitute significant amount of time. It is well-
known that cavitation erosion occurs with the impact of
high velocity liquid jets generated by the imploding
bubbles, also called water hammer effect, and induced
shock waves over time. However, it is both not a viable
approach to simulate the complete duration of an
experiment using numerical methods and extremely
expensive in terms of computational time. Therefore, it is
a common simplification to assume cavitation events to
be repetitive for numerical simulations and based on this
assumption there has been a plethora of studies utilizing
the numerical simulations for cavitation erosion
prediction. Whilst these simulations utilize instantaneous
erosive power indicators for cavitation erosion estimation,
an approach that takes into account of the
summation/accumulation of the erosive intensity over
time for precise erosion threshold determination is non-
existent.
Within this framework this study presents a time accurate
numerical cavitation erosion prediction based on the
intriguing experimental study conducted by Petkovšek &
Dular (2013) that achieved visual cavitation erosion
within 1.5 seconds. In addition to the well-known erosive
indicators such as Erosive Power Function (Eskilsson &
Bensow, 2015), Gray Level Method (Dular et al., 2006)
and Intensity Function Method (van Terwisga et al.,
2009), in house functions developed by Lloyds Register
(LR) Technical Investigation Department (TID)
(Ponkratov, 2015; Ponkratov & Caldas, 2015) are used to
compare against the experimental results. Comparisons
both aided the determination of a time accurate threshold
and utilized as an evaluation case for each erosive
indicator.
Keywords
Cavitation, Erosion, Erosive Indicators, Multiphase Flow.
1 INTRODUCTION
Cavitation is a detrimental phenomenon for marine
vehicles particularly in the field of propulsion. It
manifests itself with undesirable effects to vessel’s
operation by induced noise and vibration, deterioration of
propeller performance and erosion. Amongst
aforementioned undesirable consequences, cavitation
erosion is considered to be most catastrophic as it can lead
to increased noise and vibration, loss of propeller
performance as well as high maintenance costs.
Thus, prediction of cavitation erosion at an early design
stage carries great importance. Current state of the art
mainly relies on experimental investigations for the
determination of erosive cavitation presence. These tests
involve covering the blade foil sections with erosion
prone material (Dular et al., 2006) or coating the propeller
with soft paints that present pitting over significantly
shorter time in comparison to full-scale operating
conditions that cause cavitation erosion (Mantzaris et al.,
2015). Nevertheless, carrying out such tests are mostly
based on decades of experimental experience of renowned
testing facilities and constitute significant amount of time
and resources to carry out.
For similar cavitation problems, such as noise, vibration
and performance breakdown, it is generally possible to
predict with reasonable accuracy using statistical,
empirical or semi-empirical methods. However, it is
rather impossible for cavitation erosion since it mainly
occurs with the impact of high velocity liquid jets
generated by the imploding bubbles and an accumulative
process of consequent impacts over time (Bark &
Bensow, 2014). Moreover, to further complicate the
phenomena, properties of the collapse of cavitation such
as location, velocity, area/volume, bubble shape, micro jet
occurrence are all influential over the erosive potential of
a cavitation (Bark et al., 2004).
The lack of existence of such crucial, quick means of
predictive tools resulted in development of more
* Corresponding Author
E-mail address:[email protected]
complicated erosive indicators. These erosive indicators
are derived from multiphase flow simulations using high
fidelity Computational Fluid Dynamics (CFD) methods
such as Reynolds Averaged Navier Stokes equations
solvers (RANS), Large Eddy Simulation (LES) and
Detached Eddy Simulations (DES) (SIEMENS PLM
Software, 2016). Such sophisticated computational
simulations provide enhanced insight to the flow
properties, particularly in terms of cavitation dynamics.
With the detailed information produced by the CFD
simulations, development of erosive indicators became
possible. Two commonly used methods include Intensity
Function Method (IFM) (van Terwisga et al., 2009) and
Gray Level Method (GLM) (Dular et al., 2006). The
former one is based on the time derivative of the local
pressure (∂p/∂t) and the latter is calculated using the time
derivative of cavitation volume (∂Vv/∂t). Furthermore, an
additional erosive indicator, named Erosive Power
(Eskilsson & Bensow, 2015), is used, that is developed by
Usta et al. (2017) based on a combination IFM and GLM
methods and given by Equation 1. The pressure derivative
part of the term is multiplied by cavitation volume and
cavitation volume derivative is multiplied by the
difference of local pressure and vapour pressure. This
inherently means that, indicator predicts no erosion to not
happen when cavitation does not exist. Moreover, in the
phase where cavitation volume is rising local pressure
will be lower than vapour pressure hence the first term
will be negative also agreeing with general conception of
erosion occurrence during the collapse of cavitation.
𝐼𝐸𝑃𝑀 = (𝑃 − 𝑃𝑣) (𝑑𝑉𝑉
𝑑𝑡) + 𝑉𝑉 (
𝑑𝑃
𝑑𝑡) (1)
where: 𝑃 is the local pressure, 𝑃𝑣 is the vapour pressure
for given temperature and 𝑉𝑉 is the cavitation volume.
Although based on such sophisticated software and
derived using complex cavitation dynamics, it is
computationally impossible to simulate the whole
duration of a cavitation erosion experiment. Thus, it is
generally assumed by CFD simulations that the cavitation
events will be repetitive over the time. However, with
regards to cavitation, particularly for erosive events, this
may not be the case. In this respect, time independent
simulations mainly have an impact on the determination
of the erosive indicator thresholds for the previously
discussed predictors.
Within this framework, this study aims to simulate a
multiphase flow through a venturi section that
experiences cavitation erosion within 1.5 seconds. Time
accurate prediction of the cavitating flow and
comparisons against the experimental findings are utilized
for the determination of accurate erosive indicator
thresholds
Following this introduction, experimental study that is
being replicated is presented in Section 2. Section 3,
explains the numerical setup. Section 4 discusses and
compares the numerical findings against the experimental
results. Finally, Section 5 outlines the drawn conclusions.
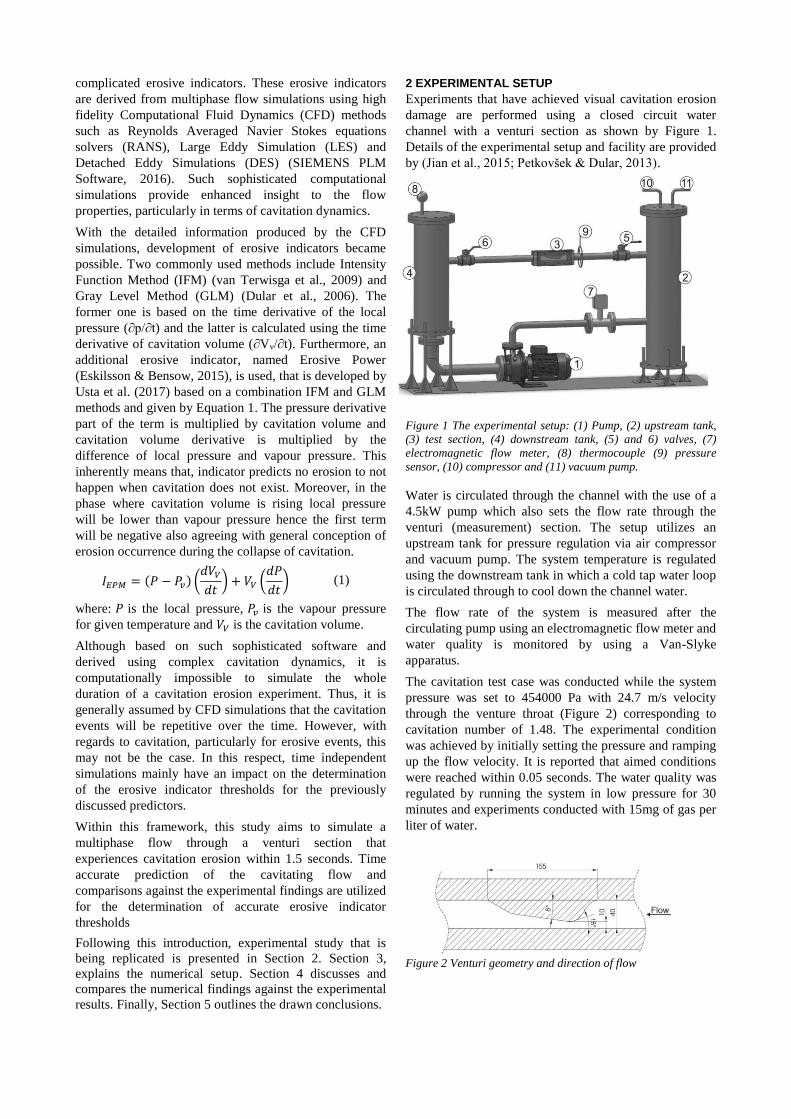
2 EXPERIMENTAL SETUP
Experiments that have achieved visual cavitation erosion
damage are performed using a closed circuit water
channel with a venturi section as shown by Figure 1.
Details of the experimental setup and facility are provided
by (Jian et al., 2015; Petkovšek & Dular, 2013).
Figure 1 The experimental setup: (1) Pump, (2) upstream tank,
(3) test section, (4) downstream tank, (5) and 6) valves, (7)
electromagnetic flow meter, (8) thermocouple (9) pressure
sensor, (10) compressor and (11) vacuum pump.
Water is circulated through the channel with the use of a
4.5kW pump which also sets the flow rate through the
venturi (measurement) section. The setup utilizes an
upstream tank for pressure regulation via air compressor
and vacuum pump. The system temperature is regulated
using the downstream tank in which a cold tap water loop
is circulated through to cool down the channel water.
The flow rate of the system is measured after the
circulating pump using an electromagnetic flow meter and
water quality is monitored by using a Van-Slyke
apparatus.
The cavitation test case was conducted while the system
pressure was set to 454000 Pa with 24.7 m/s velocity
through the venture throat (Figure 2) corresponding to
cavitation number of 1.48. The experimental condition
was achieved by initially setting the pressure and ramping
up the flow velocity. It is reported that aimed conditions
were reached within 0.05 seconds. The water quality was
regulated by running the system in low pressure for 30
minutes and experiments conducted with 15mg of gas per
liter of water.
Figure 2 Venturi geometry and direction of flow

3 NUMERICAL SETUP
The dynamics of fluid flow through the venturi was
simulated by using numerical approach. A CFD package,
STAR-CCM+ finite volume stress solver, was used to
solve governing equations (such as continuity and
momentum) (SIEMENS PLM Software, 2016). Finite
volume method discretises the integral formulation of the
governing flow equations. The solver employs a
predictor–corrector approach to link the continuity and
momentum equations.
Detached eddy simulation (DES) is a hybrid modeling
approach that combines features of Reynolds-Averaged
(RANS) simulation in some parts of the flow and large
eddy simulation (LES) in others based on predetermined
flow property thresholds (Spalart et al., 1997).
DES turbulence models are set up so that boundary layers
and irrotational flow regions are solved using a base
RANS closure model. However, the turbulence model is
intrinsically modified so that, if the grid is fine enough, it
will emulate a basic LES subgrid scale model in detached
flow regions. In this way, one gets the best of both
worlds: a RANS simulation in the boundary layers and an
LES simulation in the unsteady separated regions
(SIEMENS PLM Software, 2016).
The setup of the DES necessitated determination of a
number of crucial settings for the setup of the simulation.
Within this framework, turbulence model selected in this
study was a DES Version of the SST K-Omega Model
(Menter & Kuntz, 2004). DES solver utilized a segregated
flow model which solves the flow equation in an
uncoupled manner. Convection terms in the DES
formulations were discretized by applying a second-order
upwind scheme. The overall solution obtained using
Improved Delayed Detached Eddy Simulation (IDDES)
of Shur et al., (2008).
Overall, with the mesh refinement and volumetric mesh
enhancements, the domain was meshed with 3 million
cells as in Figure 3. The computational domain used for
the simulations is presented by Figure 4. Thus, inlet
boundary was placed at the right hand side of the figure at
100mm distance and outlet was placed on the left hand
side at 200mm away from the venturi throat. The venturi
surface was defined as a non-slip wall and rest as slip
wall.
Figure 3 Volume mesh of the venturi with volumetric refinement
Figure 4 boundary conditions of the computational domain
The convective Courant number is used as an indicator to
select the time-step size for the simulation (Courant et al.,
1928). For time-accurate simulations, the convective
Courant number set to be 1.0 on average within the whole
domain with target maximum Courant number being 5.
This value implies that the fluid moves by about one cell
per time step. Minimum time step for the simulation was
restricted to 1.6×10⁻⁵ s.
The cavitation models and the gas dissolution model in
STAR-CCM+ are based on the Rayleigh–Plesset equation
(Plesset & Prosperetti, 1977; Plesset, 1949). The full
Rayleigh–Plesset model includes the influence of bubble
growth acceleration, as well as viscous and surface
tension effects. The bubble-growth velocity that is needed
for the source term of the vapor volume fraction equation
is computed without neglecting any of the terms in the
Rayleigh-Plesset equation.
𝑅d𝑣𝑟
d𝑡+
3
2𝑣𝑟
2 =𝑝𝑣 − 𝑝
𝜌𝑙
−2𝜎
𝜌𝑙𝑅− 4
𝜇𝑙
𝜌𝑙𝑅𝑣𝑟 (2)
where: d𝑣𝑟
d𝑡, is the substantial derivative of the bubble
growth rate, 𝜎 is the surface tension, 𝜌𝑙 is the liquid
density.
The setup also adopted some reference parameters such as
vapour pressure as 𝑃𝑣 =3574 Pa, absolute pressure as 𝑃
=454000Pa and reference speed as 𝑈 =24.7m/s through
the venturi throat following Jian et al. (2015). The
established conditions corresponded to free stream
cavitation number of 1.48 matching the experimental
case. This is calculated using
𝑁𝑐𝑎𝑣 =𝑝 − 𝑝𝑣
12
𝜌𝑙𝑈2
(3)
where: 𝑈 is the velocity.
Water quality properties measured by the experiments
were also implemented by the CFD simulations. 15mg
gas per liter was converted to seed diameter and number
of nuclei per meter cube as 7.5*10-5m and 7*107
respectively.

4 RESULTS
Following the appropriate setup of the simulations, to
serve the main aim of the carried out study, cavitation
observations and erosive indicators are compared with the
experimental findings with a view to calibrate erosive
indicator threshold values for propeller and rudder cases.
In order to make sure experimental case is resurrected
appropriately both venturi throat average velocity and
absolute pressure inlet were monitored. This ensured the
accurate representation of cavitation phenomenon.
Following this, erosive indicators discussed in the
Introduction were implemented within the software
environment. Thus, GLM, IFM and Erosive Power
functions were employed for this purpose. In addition,
those functions developed in house by LR were also
employed.
It should be noted that in order to satisfy the Courant
number being smaller than 1, the computational mesh
should be very fine with a small time step. It suggests that
total computational time is significant even for a model
scale geometry. For example, it took 2 months to run the
1 sec real-time part of the case on 12 processor
workstation of Strathclyde University. The convective
CFL number introduced in STAR CCM+ v11.06 helped
significantly to satisfy keeping the CFL number at an
average of 1 for the overall domain and increasing the
time step when possible.
Following Figure 5 presents the cavitation volume
predicted by the simulation. An important remark about
this figure is the chaotic fluctuation of the cavitation
volume over time. This consequently means that the
assumption of the repeatability of the cavitation events is
not applicable for this kind of multiphase simulations.
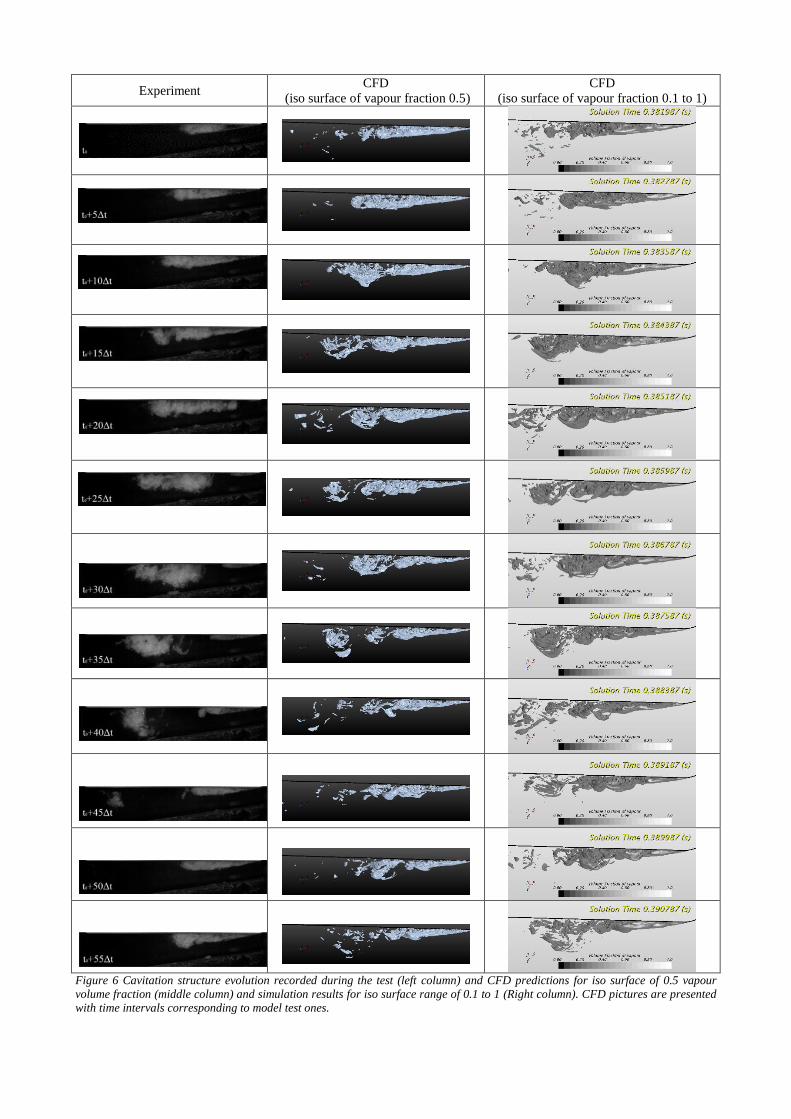
Figure 6 presents the cavitation observations during the
experiment and compares them against the CFD
simulations by LR and Strathclyde University. The
cavitation predictions are plotted for iso surfaces
corresponding to the value of 0.5 and iso surface range of
0.1 to 1 vapor volume fraction. It is apparent from the
comparisons that cavitation simulations agree well with
the experimental cavitation observations. Solution of full
Rayleigh-Plesset equations observed to improve the
accuracy of the cavitation simulations.
Based on the confidence gained through the comparisons
of the experimental cavitation observations versus
cavitation simulation predictions, further evaluations are
conducted regarding the erosive indicators. Erosive
indicators defined within the software were summed and
averaged over time to compare against the experimental
erosion extent.
As shown by Petkovšek & Dular (2013), the model test
paint removal suggests there are two main erosion zones
(top section of Figure 7 and 8). It is shown the first zone
corresponds to the area where the main cavitation sheet
collapse (denoted by 1) and the second where detached
cavitation structures collapse (denoted by 2).
Figure 7 presents the comparisons conducted for the 1
second mark of the experiments for Erosive Power
function, IFM and GLM as predicted by the numerical
simulation. Initially, simulations results are plotted and
scaled in order to match the experimental figures. Erosive
Power function presented by part A in Figure 7 observed
to show erosive indication in the 2nd region while the 1st
region is performing poor with not much erosive
indication. However, there is a concentration of light blue
contour at the downstream edge of the 1st region. This
shift in the location may be due to the time mismatch
between the simulation and experiments. IFM presented
by part B in Figure 7 shows a dense concentration in the
1st region while relatively small area of erosion is
predicted in the 2nd region. Erosive indication by GLM is
promising in terms of its appearance being similar to the
experimental observations with scattered pitting look as
shown in part C of Figure 7. Yet, erosive indication by
GLM is more concentrated in the 1st region in comparison
to the 2nd which does not agree with the experimental
observations.
Erosion prediction done by LR (Figure 8) roughly shows
the two zones, but functions appear as strips
perpendicular to the flow. It can be also noted that the
erosion prediction done by LR looks symmetrical along
middle longitudinal line. This behavior was not noticed in
the experiment and should not be predicted by fairly
realistic DES model, so further investigation is required to
clarify this finding. The functions utilized are developed
in house by LR as previously reported in (Ponkratov,
2015; Ponkratov & Caldas, 2015) and showed good
correlation on model and ship scale geometries.
Figure 5 Cavitation volume report of the simulation
Experiment CFD
(iso surface of vapour fraction 0.5)
CFD
(iso surface of vapour fraction 0.1 to 1)
Figure 6 Cavitation structure evolution recorded during the test (left column) and CFD predictions for iso surface of 0.5 vapour
volume fraction (middle column) and simulation results for iso surface range of 0.1 to 1 (Right column). CFD pictures are presented
with time intervals corresponding to model test ones.

Experiment
Figure 7 Experimental and CFD indication of cavitation erosion
at 1 second using Erosive Power function (A), IFM (B) and
GLM (C).
Function 5
Function 8 Figure 8 Experimental and CFD (Functions 5 and 8) indication
of cavitation erosion.
Based on the observations and comparisons of the erosive
indicators against the experimental findings, it is
concluded that best performing method for this particular
case is the Erosive Power function. The threshold of the
contour that has been set for the best comparison can now
be utilized for a more conventional marine application.
An exemplary application can be made to that propeller of
Usta et al. (2017) based on the experiments conducted by
(Mantzaris et al., 2015) as shown by Figure 9.
The calibrated threshold predictions show reasonable
agreement when compared with observations made by
Mantzaris et al., (2015). The erosion is observed to take
place where light blue color is present from the results of
Petkovšek & Dular (2013). If light blue color is assumed
to be an indicator, then erosion is predicted in mic-chord
to trailing edge region of the 0.7 r/R of the propeller
which is also shown soft paint removal as an indicator of
erosion in Figure 10.
5 CONCLUSION
This study presents a time accurate numerical cavitation
erosion prediction based on the experimental study
conducted by Petkovšek & Dular (2013) that achieved
visual cavitation erosion within 1.5 seconds. The
simulation setup incorporates state of the art
computational options such as full Rayleigh-Plesset
equation solution and convective CFL number selection.
The comparisons of the cavitation observation between
the experimental studies and CFD simulation results
shown satisfactory resemblance despite the presence of
highly dynamic cavitation phenomenon. The
implemented erosive indicators IFM and GLM
predictions for the first 1 second duration did not show
encouraging results when compared against the
experimental observations. However, Erosive Power
function predictions observed to perform relatively better.
The Erosive Power threshold values are then utilized to
calibrate the erosive thresholds on a propeller.
The erosive indicators implemented by the LR is found to
indicate two domains with erosion concentration with
some shift along the downstream of the flow which is also
observed by the experimental findings. Yet, LR
predictions have little resemblance of the experimental
pitting as experiments showed scattered dots like
appearance whilst LR functions showed 2D strips. This
will be investigated further.
Overall, whilst the case at first looks like a simple setup,
due to dynamic cavitation and significant venturi throat
contraction ratio, there exists some severe cavitation
dynamics such as rebounding, separation and bursting. By
simulating this case, a time accurate Erosive Power
function threshold calibration is applied to a propeller
with reasonable success. Yet, more established erosion
prediction functions, such as IFM and GLM and Function
5 and 8 by LR, which worked well on more complex
geometries such as propellers, foils and rudders, did not
Figure 10 Experimental cavitation erosion tests by Mantzaris et
al., (2015).
Figure 9 Calibrated Erosive Power threshold applied to
propeller simulation conducted by Usta et Al. (2017).

perform as expected for this particular case. The
deviations experienced by these erosive indicators need
careful care and scrutinization to better understand the
origin of these discrepancies. At this point, it is unclear
whether the discrepancies are due to CFD codes or to
algebraic nature of the empirical erosive indicators.
Systematic validation efforts are required in order to
assess the validity of the CFD codes and the erosive
indicators for predicting cavitation erosion tendency.
REFERENCES
Bark, G., & Bensow, R. E. (2014). Hydrodynamic
processes controlling cavitation erosion. Fluid
Mechanics and Its Applications, 106, pp.185–220.
Bark, G., Berchiche, N., & Grekula., M. (2004).
"Application of Principles for Observation and
Analysis of Eroding Cavitation-The EROCAV
Observation Handbook. EROCAV Report, Dept. of
Naval Architecture, Chalmers University of
Technology, Göteborg, Sweden.
Courant, K., Friedrichs, R., & Lewyt, H. (1928). On the
Partial Difference Equations of Mathematical
Physics. Mathematische Annalen, 100, pp.32–74.
Dular, M., Stoffel, B., & Širok, B. (2006). Development
of a cavitation erosion model. Wear, 261(5–6),
pp.642–655.
Eskilsson, C., & Bensow, R. E. (2015). Estimation of
Cavitation Erosion Intensity Using CFD: Numerical
Comparison of Three Different Methods. 4th
International Symposium on Marine Propulsors
(smp’15), (June).
Jian, W., Petkovšek, M., Houlin, L., Širok, B., & Dular,
M. (2015). Combined Numerical and Experimental
Investigation of the Cavitation Erosion Process.
Journal of Fluids Engineering, 137(5), pp.51302.
Mantzaris, A., Aktas, B., Fitzsimmons, P., & Atlar, M.
(2015). Establishment and verification of
reproducible method for coating propeller blades
for erosive cavitation detection. In The 4th
International Conference on Advanced Model
Measurement Technologies for the Maritime
Industry. Istanbul, Turkey.
Menter, F., & Kuntz, M. (2004). Adaptation of eddy-
viscosity turbulence models to un- steady separated
flow behind vehicles. The Aerodynamics of Heavy
Vehicles: Trucks, Buses, and Trains, 19, pp.339–
352.
Petkovšek, M., & Dular, M. (2013). Simultaneous
observation of cavitation structures and cavitation
erosion. Wear, 300(1–2), pp.55–64.
Plesset, M. S. (1949). The dynamics of cavitation
bubbles. Journal of Applied Mechanics, 16(3),
pp.277–282.
Plesset, M. S., & Prosperetti, a. (1977). Bubble
Dynamics and Cavitation. Annual Review of Fluid
Mechanics, 9(1), pp.145–185.
Ponkratov, D. (2015). DES Prediction of Cavitation
Erosion and Its Validation for a Ship Scale
Propeller. Journal of Physics: Conference Series.
Ponkratov, D., & Caldas, A. (2015). Prediction of
Cavitation Erosion by Detached Eddy Simulation
(DES) and its Validation against Model and Ship
Scale Results. Fourth International Symposium on
Marine Propulsors (SMP).
Shur, M. L., Spalart, P. R., Strelets, M. K., & Travin, A.
K. (2008). A hybrid RANS-LES approach with
delayed-DES and wall-modelled LES capabilities.
International Journal of Heat and Fluid Flow,
29(6), pp.1638–1649.
SIEMENS PLM Software. (2016). STAR-CCM+ User
Guide Version 11.06.
Spalart, P. R., Jou, W. H., Strelets, M., & Allmaras, S. R.
(1997). Comments on the feasibility of LES for
wings and on a hybrid RANS/LES approach.
Advances in DNS/LES.
Usta, O., Aktas, B., Maasch, M., Turan, O., Atlar, M., &
Korkut, E. (2017). A study on the numerical
prediction of cavitation erosion for propellers. Fifth
International Symposium on Marine Propulsion,
SMP’17, Helsinki,F(June).
van Terwisga, T. J. C., Fitzsimmons, P. A., Ziru, L., &
Foeth, E. J. (2009). Cavitation Erosion – A review
of physical mechanisms and erosion risk models.
Proceedings of the 7th International Symposium on
Cavitation, (41), pp.1–13.
Related Documents


