Dryland Cropping Systems 154 Agronomy Journal • Volume 100, Issue 1 • 2008 Published in Agron. J. 100:154–162 (2008). doi:10.2134/agronj2006.0218 Copyright © 2008 by the American Society of Agronomy, 677 South Segoe Road, Madison, WI 53711. All rights reserved. No part of this periodical may be reproduced or transmitted in any form or by any means, electronic or mechanical, including photocopying, recording, or any information storage and retrieval system, without permission in writing from the publisher. U nder dryland conditions, where crop yields are water-limited, cropping systems that increase water storage and WUE, and prevent soil erosion are impera- tive for successful crop production. In eastern Oregon, winter wheat is commonly grown in rotation with green pea under dryland conditions in the foothills of the Blue Mountains, where annual precipitation ranges from 380 to 500 mm. is inland Pacific Northwest (PNW) region has a Mediterranean-type climate with mild, wet winters and warm dry summers. About 70% of precipitation falls between September and February; therefore crops mature under increasing drought and heat stresses. Under these conditions, cropping practices that increase WUE are neces- sary to avoid crop failures. e standard tillage regime in eastern Oregon for winter wheat–green pea rotation is FP, which leaves little or no surface residue to prevent soil erosion or curb evaporation. Conservation tillage, where minimum tillage or NT is practiced, leaving about one-third of the soil covered with residues after planting, is being adopted worldwide. Crop residues left on the surface reduce soil water evaporation (Schillinger and Bolton, 1993; Hatfield et al., 2001), increase water infiltration (Logsdon et al., 1990; Hatfield et al., 2001; Franzluebbers, 2004), increase soil water storage (Ramig et al., 1983; Bolton and Glen, 1983; Bonfil et al., 1999; Halvorson et al., 1999) and reduce soil erosion (Allmaras et al., 1973; Ramig and Ekin, 1987). Conservation tillage can include NT, strip-till, ridge-till, and mulch-till. Even under conventional tillage, delaying cultivation until spring may be considered a temporary con- servation measure; standing stubble protects the soil from ero- sion during winter. Furthermore, standing residue has been shown to trap snow, enhance water infiltration, and increase soil water storage (Aase and Siddoway, 1990). Clearly, PNW wheat–pea cropping rotations can benefit from conserva- tion tillage systems. To evaluate the potential success of these practices, an understanding of how conservation tillage prac- tices influence water storage, crop water use, pests, and yield of wheat and pea is required. Pikul et al. (1993) and Payne et al. (2000, 2001) have reported on different aspects of a wheat–pea experiment specific to inland PNW which is the subject of this paper. Pikul et al. (1993) reported on tillage effects on soil properties and found that there were no signifi- cant differences in saturated hydraulic conductivity between tilled and non-tilled layers but the paper does not report on water storage and crop water use. Payne et al. (2000) pre- dicted yield response to precipitation and heat stress but also did not report on measured soil moisture and crop water use. In related work, Payne et al. (2001) modeled yield response using crop evapotranspiration (ET) as one of the variables in the model. e paper, however, does not attempt to explain the differences in ET among tillage treatments. In Canada, Lafond et al. (2006) reported an increase in yield for field pea (7%), flax (12.5%), and spring wheat (7.4%) grown under conservation tillage on cereal stubble compared to conven- ABSTRACT Under water-limited conditions, increasing water use efficiency (WUE) is essential for successful crop production. A 7-yr study (1977–1982, and 1985) to evaluate tillage and tillage timing effects on soil water storage, crop water use, and grain yield of winter wheat (Triticum aestivum L.) and spring green pea (Pisum sativum L.) in rotation, was conducted near Pendleton, OR. Treatments included (i) fall plow (FP)–fall moldboard plow after wheat and after pea, (ii) maximum tillage (MT)–fall roto-till after wheat and fall sweep after pea, (iii) spring plow (SP)–spring moldboard plow after wheat and fall moldboard plow after pea, and (iv) minimum tillage (MinT)–no-till (NT) after wheat and fall sweep after pea. During the wheat phase, water storage efficiency was 44, 40, 38, and 34%, for FP, MT, SP, and MinT, respectively. Corresponding values during the pea phase were 50, 53, 59, and 57%, for FP, MT, SP, and MinT, respectively. Wheat used all of the stored water and an additional 31, 41, 43, and 61% more water than water stored under FP, MT, SP and MinT, respectively. Pea used 71, 67, 67, and 60% of stored water under FP, MT, SP and MinT, respectively. Wheat and pea yields under MT, FP, and SP were not different. Lowest yield was obtained under MinT during both wheat and pea phases. WUE was highly correlated with yield and was lowest under MinT. Improving weed control, retaining stubble for soil erosion control, and reducing sweep operations in MinT should improve yields in this treatment. Tillage Effects on Water Use and Grain Yield of Winter Wheat and Green Pea in Rotation Stephen Machado,* Steve Petrie, Karl Rhinhart, and Robert E. Ramig Stephen Machado, Steve Petrie, and Karl Rhinhart, Oregon State Univ., Columbia Basin Agricultural Research Center, P.O. Box 370, Pendleton, OR 97801; Robert E. Ramig, USDA-ARS Columbia Plateau Conservation Research Center, Pendleton, OR 97801 (retired). Contribution of Oregon State University, Columbia Basin Agricultural Research Center, PO Box 370, Pendleton, OR 97801. Received 26 July 2006. *Corresponding author ([email protected]). Abbreviations: ET, evapotranspiration; FP, fall plow; MinT, minimum tillage; MT, maximum tillage; NT, no-till; SP, spring plow; WUE, water use efficiency.

Welcome message from author
This document is posted to help you gain knowledge. Please leave a comment to let me know what you think about it! Share it to your friends and learn new things together.
Transcript

Dryland C
ropping Systems
154 Agronomy Journa l • Vo lume 10 0 , I s sue 1 • 20 08
Published in Agron. J. 100:154–162 (2008).doi:10.2134/agronj2006.0218
Copyright © 2008 by the American Society of Agronomy, 677 South Segoe Road, Madison, WI 53711. All rights reserved. No part of this periodical may be reproduced or transmitted in any form or by any means, electronic or mechanical, including photocopying, recording, or any information storage and retrieval system, without permission in writing from the publisher.
Under dryland conditions, where crop yields are
water-limited, cropping systems that increase water
storage and WUE, and prevent soil erosion are impera-
tive for successful crop production. In eastern Oregon,
winter wheat is commonly grown in rotation with green
pea under dryland conditions in the foothills of the Blue
Mountains, where annual precipitation ranges from 380
to 500 mm. Th is inland Pacifi c Northwest (PNW) region
has a Mediterranean-type climate with mild, wet winters
and warm dry summers. About 70% of precipitation falls
between September and February; therefore crops mature
under increasing drought and heat stresses. Under these
conditions, cropping practices that increase WUE are neces-
sary to avoid crop failures. Th e standard tillage regime in
eastern Oregon for winter wheat–green pea rotation is FP,
which leaves little or no surface residue to prevent soil erosion
or curb evaporation. Conservation tillage, where minimum
tillage or NT is practiced, leaving about one-third of the
soil covered with residues after planting, is being adopted
worldwide. Crop residues left on the surface reduce soil
water evaporation (Schillinger and Bolton, 1993; Hatfi eld et
al., 2001), increase water infi ltration (Logsdon et al., 1990;
Hatfi eld et al., 2001; Franzluebbers, 2004), increase soil
water storage (Ramig et al., 1983; Bolton and Glen, 1983;
Bonfi l et al., 1999; Halvorson et al., 1999) and reduce soil
erosion (Allmaras et al., 1973; Ramig and Ekin, 1987).
Conservation tillage can include NT, strip-till, ridge-till,
and mulch-till. Even under conventional tillage, delaying
cultivation until spring may be considered a temporary con-
servation measure; standing stubble protects the soil from ero-
sion during winter. Furthermore, standing residue has been
shown to trap snow, enhance water infi ltration, and increase
soil water storage (Aase and Siddoway, 1990). Clearly, PNW
wheat–pea cropping rotations can benefi t from conserva-
tion tillage systems. To evaluate the potential success of these
practices, an understanding of how conservation tillage prac-
tices infl uence water storage, crop water use, pests, and yield
of wheat and pea is required. Pikul et al. (1993) and Payne
et al. (2000, 2001) have reported on diff erent aspects of a
wheat–pea experiment specifi c to inland PNW which is the
subject of this paper. Pikul et al. (1993) reported on tillage
eff ects on soil properties and found that there were no signifi -
cant diff erences in saturated hydraulic conductivity between
tilled and non-tilled layers but the paper does not report on
water storage and crop water use. Payne et al. (2000) pre-
dicted yield response to precipitation and heat stress but also
did not report on measured soil moisture and crop water use.
In related work, Payne et al. (2001) modeled yield response
using crop evapotranspiration (ET) as one of the variables in
the model. Th e paper, however, does not attempt to explain
the diff erences in ET among tillage treatments. In Canada,
Lafond et al. (2006) reported an increase in yield for fi eld pea
(7%), fl ax (12.5%), and spring wheat (7.4%) grown under
conservation tillage on cereal stubble compared to conven-
ABSTRACTUnder water-limited conditions, increasing water use effi ciency (WUE) is essential for successful crop production. A 7-yr study
(1977–1982, and 1985) to evaluate tillage and tillage timing eff ects on soil water storage, crop water use, and grain yield of
winter wheat (Triticum aestivum L.) and spring green pea (Pisum sativum L.) in rotation, was conducted near Pendleton, OR.
Treatments included (i) fall plow (FP)–fall moldboard plow after wheat and after pea, (ii) maximum tillage (MT)–fall roto-till after
wheat and fall sweep after pea, (iii) spring plow (SP)–spring moldboard plow after wheat and fall moldboard plow after pea, and
(iv) minimum tillage (MinT)–no-till (NT) after wheat and fall sweep after pea. During the wheat phase, water storage effi ciency
was 44, 40, 38, and 34%, for FP, MT, SP, and MinT, respectively. Corresponding values during the pea phase were 50, 53, 59, and
57%, for FP, MT, SP, and MinT, respectively. Wheat used all of the stored water and an additional 31, 41, 43, and 61% more water
than water stored under FP, MT, SP and MinT, respectively. Pea used 71, 67, 67, and 60% of stored water under FP, MT, SP and
MinT, respectively. Wheat and pea yields under MT, FP, and SP were not diff erent. Lowest yield was obtained under MinT during
both wheat and pea phases. WUE was highly correlated with yield and was lowest under MinT. Improving weed control, retaining
stubble for soil erosion control, and reducing sweep operations in MinT should improve yields in this treatment.
Tillage Effects on Water Use and Grain Yield of Winter Wheat and Green Pea in Rotation
Stephen Machado,* Steve Petrie, Karl Rhinhart, and Robert E. Ramig
Stephen Machado, Steve Petrie, and Karl Rhinhart, Oregon State Univ., Columbia Basin Agricultural Research Center, P.O. Box 370, Pendleton, OR 97801; Robert E. Ramig, USDA-ARS Columbia Plateau Conservation Research Center, Pendleton, OR 97801 (retired). Contribution of Oregon State University, Columbia Basin Agricultural Research Center, PO Box 370, Pendleton, OR 97801. Received 26 July 2006. *Corresponding author ([email protected]).
Abbreviations: ET, evapotranspiration; FP, fall plow; MinT, minimum tillage; MT, maximum tillage; NT, no-till; SP, spring plow; WUE, water use effi ciency.

Agronomy Journa l • Volume 100, Issue 1 • 2008 155
tional tillage in a summer rainfall region. Th e increase was
due to an increase in soil water in the 0 to 30 cm soil layer.
Cutforth et al. (2002) also reported an increase in the WUE
of fi eld pea when seeded in stubble in the Canadian prairies.
Th ere is little information on tillage eff ects on water stor-
age, crop water use, and WUE in wheat–pea rotations in the
inland PNW, a winter rainfall region. Th is information is
crucial to understanding the underlying processes and formu-
lating sound agronomic decisions. Th e objective of this study
was to quantify the eff ects of diff erent tillage methods and
timing of tillage operations on soil water storage, WUE, and
grain yield of winter wheat and green pea in rotation.
MATERIALS AND METHODSData discussed in this paper were obtained from a long-
term experiment with a winter wheat–spring green pea 2-yr
rotation at the Columbia Basin Agricultural Research Center
(CBARC), Pendleton, OR (45.7° N, 118.6° W, elevation 438
m). Th e soil at CBARC is a Walla Walla silt loam (coarse-silty,
mixed, superactive, mesic Typic Haploxeroll). Th e CBARC
receives 70% of its precipitation during the winter months
(September–February). Average crop-year (1 September–31
August) precipitation is about 406 mm. Th e ongoing
wheat–pea rotation experiment was established in the spring
of 1962. Each plot was 7.3 m wide and 37 m long. All plots
were spring-plowed in 1962 and tillage regimes fi rst applied
in the 1963–64 crop-year. Th e tillage treatments have been
modifi ed over time. Th is study reports on and discusses data
for seven crop-years from 1976–1977 to 1981–1982 and in
1984–85, when soil moisture was monitored and treatments
did not change. Results on tillage eff ects on soil water storage,
crop water use, and WUE during this period were not pub-
lished and are still relevant to the current winter wheat and
green pea growers. Green pea refers to immature spring pea
harvested for freezing and canning. Th e treatments for that
period were (i) fall plow (FP)–moldboard plow after wheat
and after pea (control), (ii) maximum tillage (MT)–fall roto-
till after wheat and fall sweep after pea, (iii) spring plow (SP)–
spring moldboard plow after wheat and fall moldboard plow
after pea, and (4) minimum tillage (MinT)–NT after wheat
and fall sweep after pea. Details of the treatments follow.
Treatment 1: Fall Plow After harvesting wheat, plots were moldboard-plowed
in the fall to a depth of 15 to 18 cm. Th is treatment was
designed to explore the eff ect of increased surface roughness
during winter on water storage. In early spring, plots were
sprayed with glyphosate (N-(phosphonomethyl)glycine) at
rates ranging from 314 to 628 g acid equivalent (a.e.) ha−1.
Before seeding pea, plots were cultivated one to three times to
a depth of approximatley 10 cm with a spring-tooth cultiva-
tor (John Deere CC, John Deere, Moline, IL). Th e plots were
roller-packed using a Dunham Culti-packer (Dunham Co.,
Dunham, OH) after planting pea. Before seeding wheat, plots
were moldboard-plowed in the summer after pea harvest fol-
lowed by secondary tillage using a spring-tooth cultivator to
a depth of approximately 10 cm. Glyphosate was applied as
needed to control weeds. Th is is the standard tillage regime in
eastern Oregon for winter wheat–green pea rotation and the
control for this experiment.
Treatment 2: Maximum Tillage Following wheat harvest, plots were roto-tilled in the fall
to a depth of 12 to15 cm to break up wheat stubble. In the
spring, plots were sprayed with glyphosate, or glyphosphate
+ 2,4-D (2,4-dichlorophenoxyacetic acid), cultivated with a
2.4 m V-shaped Noble (Noble Farms Ltd., Nobleford, AB,
Canada) sweep to a depth of 8 cm and rod-weeded to a depth
of about 4 cm when necessary before pea was sown in March
or early April. Th e 2,4-D rates ranged from 426 to 750 g a.e.
ha−1. Plots were roller-packed after sowing pea. Soon after
pea harvest in July, plots were cultivated with a sweep to stop
pea vine growth and water use and to stop weed growth and
weed seed production. In the fall, before seeding wheat, plots
were chisel plowed (or deep ripped) to a depth of 30 to 38
cm to break the soil pan created by roto-tilling, and then
rod-weeded. Th e purpose of this treatment was to explore the
eff ect of increased surface roughness during the winter period
on water storage
Treatment 3: Spring Plow Th is treatment was identical to FP before sowing wheat
and will be abbreviated as SP(FP) when discussing the wheat
phase. After wheat harvest, stubble was left standing and
weeds were controlled during winter and early spring with
herbicides that included paraquat dichloride (1,1′-dimethyl-
4,4′-bipyridinium dichloride) and glyphosate. Paraquat
dichloride rates ranged from 560 to 1120 g a.e. ha−1.
Immediately before seeding pea in the spring, the plots were
moldboard plowed to a depth of 15 to 18 cm and roller-har-
rowed. Plots were roller-packed after seeding pea. Th is treat-
ment was introduced to maintain crop residue surface cover
over winter during the pea phase to minimize or stop soil
erosion.
Treatment 4: Minimum TillageTh e MinT was an attempt to increase surface residue levels.
Only surface tillage was used in this system to manage residue
to facilitate sowing. Before sowing pea, wheat stubble was
fi nely mowed to a short height and the plot cultivated repeat-
edly with a Dunham skewtreader (Dunham Co., Dunham,
OH) to a depth of about 3 to 4 cm in the fall. A skewtreader
is an implement with tined wheels on two ganged shafts
angled like a section of a tandem disk. Th is cultivation was
done to break and uniformly distribute wheat residue to
improve drill performance during pea seeding. Herbicides
(paraquat dichloride or glyphosate) were used to control
weeds during winter. No mowing or skewtreading occurred
before sowing wheat into pea stubble; herbicides (paraquat
dichloride or glyphosate) were used to control weeds. A sweep
at a depth of 8 cm was used soon after pea harvest to control
post-harvest weeds, stop pea vine growth and water use, and
to loosen surface soil compacted by repeated skew-treading in
preparation for the pea phase.
156 Agronomy Journa l • Volume 100, Issue 1 • 2008
Crop ManagementWhen discussing crop-year, the year the crop was harvested
will be quoted from this point forward. For instance, crop-
year 1977 refers to the cropping season that started in the
fall of 1976 and ended in the summer of 1977. For crop-year
1977 through 1985, all wheat plots were seeded in the fall
(September or October) using a JD (John Deere) HZ split
packer hoe drill (John Deere, Moline, IL) on 36-cm spacing
and harvested between June and July. For crop-years 1977
through 1981, 1983, and 1984 all pea plots were seeded
using a JD LZA hoe type drill on 18-cm spacing and har-
vested in June. In 1985 all pea plots were seeded with a JD
8300 double disc type drill on 17-cm spacing. In 1982 tilled
pea treatments were seeded with a JD LZA hoe type drill on
18-cm spacing and MinT pea treatments were seeded with
a JD VB double disc type drill on 18-cm spacing. Pea was
seeded in March or early April.
Target sowing rates were 200 seeds m−2 for winter wheat
and 75 seeds m−2 for pea cultivars. ‘Hyslop’ winter wheat
was sown in crop-years 1977 and 1978. ‘Stephens’ winter
wheat was sown in crop-years 1979 through 1985. ‘Dark
Skin Perfection’ pea was seeded in all crop years except 1982
and 1983 when ‘Perfected Freezer’ pea was sown. Th e pea
was not inoculated with Rhizobium.
Ammonium nitrate (NH4NO3), 34–0–0 (N–P–K), was
broadcast on winter wheat plots before fi nal tillage or seeding
at a rate ranging from 45 to 93 kg N ha−1 based on soil tests.
Pea was not fertilized in 1980 and 1982. In the other 5 yr,
ammonium sulfate ((NH4)2SO4), 21–0–0–24 (N–P–K–S)
was broadcast at a rate of 22 to 25 kg N ha−1 before fi nal
tillage or seeding.
Soil Water MeasurementsOne access tube was installed in each plot and soil volu-
metric water content measurements, at 30.5 cm intervals to
a depth of 2.44 m, were obtained using neutron attenuation.
Details of the process were described by Payne et al. (2001).
For wheat, soil moisture was measured at the start of wheat
growth in early March following winter dormancy and at
wheat harvest in July. For pea, soil moisture was measured
at pea planting in early April and at pea harvest in late June.
For both crops, the change in soil water storage over the
winter was the diff erence in soil water amount, expressed
as water depth, in the 0 to 2.44 m layer, measured between
harvest and the fi rst spring reading in the following year.
Storage effi ciency is change in soil water storage from har-
vest to the fi rst spring soil water reading expressed as a per-
centage of precipitation for the same period. For both crops,
soil water depletion is the diff erence between the fi rst spring
soil water content measurement and the soil water content
measured after harvest. Growing season precipitation is pre-
cipitation received from the start of active growth to harvest
for wheat and from seeding to harvest for peas. In the PNW,
signifi cant plant growth and transpiration occur from March
to July for wheat and early April to June for pea. Growing
season evapotranspiration, defi ned here as evapotranspira-
tion during the period of active growth, is the sum of grow-
ing season precipitation and soil water depleted (Deibert
et al., 1986; Norwood, 1999; Chen et al., 2003). Based on
estimated internal soil drainage values for the long-term
experiments at CBARC (Payne, 1998; Payne et al., 2001),
soil drainage below the crop rooting depth was assumed to
be negligible. Runoff and erosion were also assumed to be
negligible because the experiment is located on fairly level
ground ( <2% slope). Th e WUE was determined using the
following equation:
[1]
where GY is grain yield (kg ha−1) and GSET (mm) is grow-
ing season evapotranspiration.
Grain YieldWheat was harvested with plot combines. Harvested widths
ranged from 1.5 to 2.5 m (depending on combine used); the
length of the harvested area was 37 m. Grain was cleaned
using a screen air cleaner, weighed, and reported on a dry
weight basis. Green pea, at a tendrometer reading of about 98,
was swathed using a locally designed draper swather with a
3.7-m wide platform. During the study period (1977–1985),
vines from each plot were hauled to a central stationary
thresher where green peas were removed from vines, cleaned
of debris, weighed, and reported on a fresh weight basis. Th e
vines were not returned to plots.
Data AnalysisTh e experimental design was a split plot in a randomized
complete block arrangement with four replications. Crops
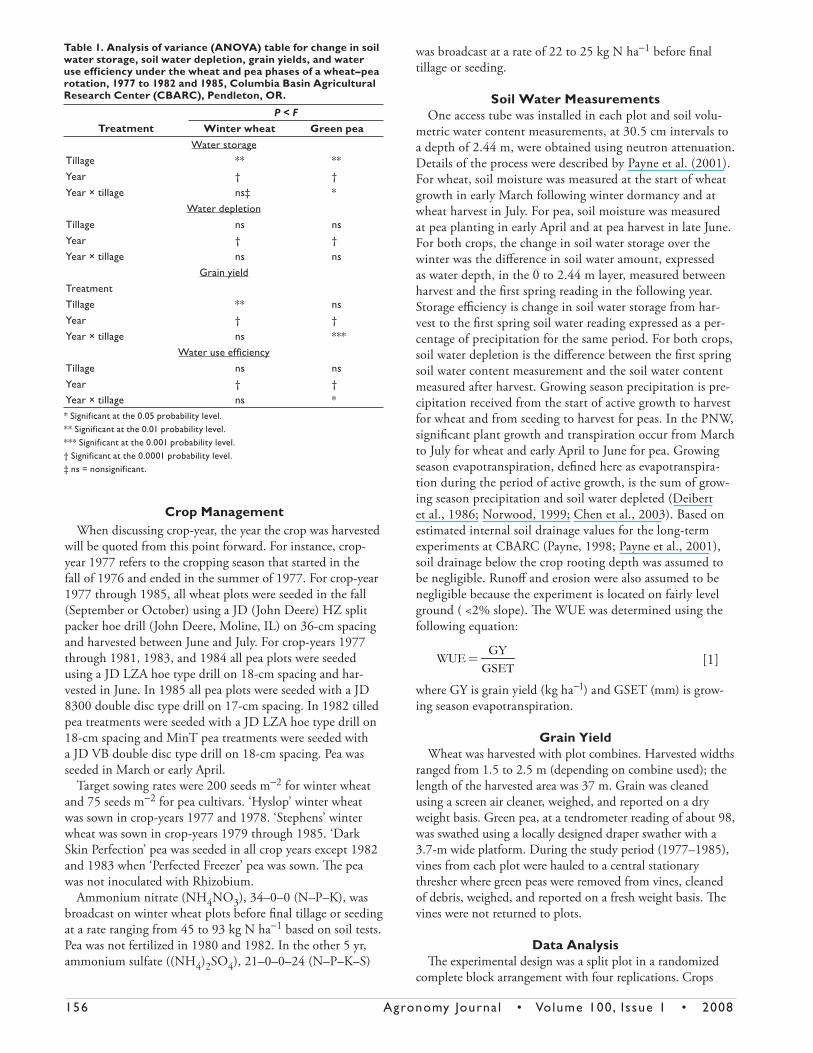
Table 1. Analysis of variance (ANOVA) table for change in soil water storage, soil water depletion, grain yields, and water use efficiency under the wheat and pea phases of a wheat–pea rotation, 1977 to 1982 and 1985, Columbia Basin Agricultural Research Center (CBARC), Pendleton, OR.
P < FTreatment Winter wheat Green pea
Water storageTillage ** **Year † †
Year × tillage ns‡ *
Water depletionTillage ns nsYear † †Year × tillage ns ns
Grain yieldTreatmentTillage ** nsYear † †Year × tillage ns ***
Water use effi ciencyTillage ns nsYear † †Year × tillage ns ** Significant at the 0.05 probability level.** Significant at the 0.01 probability level.*** Significant at the 0.001 probability level.† Significant at the 0.0001 probability level.‡ ns = nonsignificant.
=GYWUEGSET

Agronomy Journa l • Volume 100, Issue 1 • 2008 157
(winter wheat or green pea) were assigned to main plots and
tillage treatments were assigned to subplots. Each replication
contained eight plots (four tillage treatments for each of
the two crops in rotation). Each phase of the rotation was
present every year to ensure yearly data collection for both
wheat and pea. Since experiments were conducted for each
plot from 1977 to 1982, and 1985, the data from each plot
can be correlated over time. To that end we analyzed data
using PROC MIXED procedures with repeated measures
for year in conjunction with Auto-Regressive time series
modeling procedures (Littell et al., 1996; Lindsey, 1999).
Data on water storage, water depletion, WUE, and yield
were analyzed separately for each crop. Results obtained in
1983 and 1984 were omitted because of incomplete soil
water data.
RESULTSTillage Effects on Over-Winter
Soil Water StorageTh e change in stored water in the 0 to 2.44 m soil profi le
during the pea phase for FP, MT, SP, and MinT averaged 15,
29, 47, and 61%, respectively, more than the same treatments
during the wheat phase (Fig. 1a, 1b).
During the wheat phase, there were no signifi cant tillage by
year interactions on change in water storage. However, there
were signifi cant year and tillage main eff ects on water stor-
age (Table 1). Water storage was infl uenced by the amount of
winter precipitation and was generally higher in years that had
high winter precipitation (r = 0.77, P < 0.0001). On average,
all fall-cultivated treatments [FP, MT, and SP(FP)] stored
signifi cantly more winter precipitation than the MinT treat-
ment (Table 2). Th e water storage effi ciency was 44, 40, 38,
and 34%, for FP, MT, SP(FP), and MinT, respectively. Soil
water profi le data indicated that on average MinT stored the
most water in the 0 to 30 cm zone and this was signifi cantly
so when compared to MT (Fig. 1a). Below this zone, MinT
stored the least amount of water and this was signifi cantly
so in the 30 to150 cm zone. Th e FP stored less water than
SP(FP) and MinT in the 0 to 30 cm zone but stored the high-
est in the 30 to 150 cm zone. Th e SP(FP) stored slightly more
water than MT in the 0 to 30 cm zone but stored similar
amounts of water to MT below this zone.
During the pea phase, there was a signifi cant interaction
between tillage and year on the amount of water stored in
the 0 to 2.44 m profi le (Table 1). In 1977, the driest year of
the period under study, SP and MinT treatments, with wheat
stubble during winter, on average stored about 100 and 42%
more water than FP and MT, respectively (Table 3). In that
year, SP and MinT achieved storage effi ciencies of 50 and
47% compared with 34 and 24% under MT and FP, respec-
tively. In years when winter precipitation was high, diff erences
in water stored and storage effi ciency were minimized or
eliminated. During the pea phase, water storage effi ciency was
50, 53, 59, and 57%, for FP, MT, SP(FP), and MinT, respec-
tively. Th e total amount of water stored in the whole profi le
(0–2.44 m zone) was signifi cantly higher under MinT and
SP than under MT and FP (Table 3). However, the change
in stored water at each depth under MinT and SP, although
consistently larger than other treatments, was not signifi cant
(Fig. 1b).
Tillage Effects on Water DepletionTh ere were no signifi cant tillage by year interactions on the
amount of water depleted during both wheat and pea phases
(Table 1). Overall tillage had no signifi cant eff ect on soil water
depletion during both wheat and pea phases except in 1977
(Tables 2 and 3). In that year, water depletion during both the
wheat and pea phases was lowest under FP treatments (Tables
2 and 3). Th ere were, however, signifi cant year eff ects on
water depleted. In general, there was more water depleted in
years where crop-year precipitation was high; 1980 and 1985
were exceptions for wheat and pea, respectively. Th e reason
Fig. 1. Maximum tillage (MT), fall plow (FP), spring plow (SP), and minimum tillage (MinT) effects on soil profile water stor-age distribution (mm 305 mm−1) during (a) winter wheat phase (pea harvest to first spring moisture reading) and (b) green pea phase (wheat harvest to first spring moisture reading) at Columbia Basin Agricultural Research Center (CBARC), Pend-leton, OR. Means (at each depth zone) with the same letter are not significantly different at the 0.05 probability level.

158 Agronomy Journa l • Volume 100, Issue 1 • 2008
why water depletion was low in these years was not appar-
ent. In 1980, wheat had excellent stands but there was heavy
downy brome (Bromus tectorum L.) infestation in MinT plots.
In 1985, frost damaged the fi fth to seventh nodes in pea and
prevented the spraying of weeds. On average, wheat under FP,
MT, SP(FP), and MinT used 60, 63, 46, and 60%, respec-
tively, more water than pea under the same treatments. Wheat
used all of the stored water and an additional 31, 41, 43, and
61% more water than stored water under FP, MT, SP(FP)
and MinT, respectively. On the other hand, pea used about
71, 67, 67, and 60% of stored water
under FP, MT, SP(FP), and MinT,
respectively.
Tillage Effects on Grain YieldTillage and year signifi cantly infl u-
enced wheat grain yield but there were
no signifi cant tillage and year inter-
actions (Table 1). On average, wheat
grain yields were signifi cantly higher
in all the fall tillage treatments [MT,
FP, and SP(FP)] than in MinT (Fig.
2). However there were no signifi cant
diff erences in grain yield among the
fall tillage treatments. Th e MinT
yields were 94% of the average yield
for other treatments and were low-
est in 6 of 7 yr. In three of the study
years, there was heavy downy brome
infestation in MinT plots compared
with other treatments. Grain yield
of wheat generally followed trends in
precipitation and was high when crop-
year precipitation was high (Fig. 2).
Wheat grain yields were highly corre-
lated to both winter precipitation (r =
0.77, P < 0.0001) and growing season precipitation (r = 0.85,
P < 0.0001). Wheat grain yields were lowest in 1977, the dri-
est year, and highest in 1981, the wettest year (Fig. 2). Th ere
were some stand establishment problems in 1979 that resulted
in heavy downy brome infestation and low yields when com-
pared with 1985, which had comparable precipitation.
Th ere was a signifi cant tillage and year interaction for
green pea yield (Table 1). Green pea yield was infl uenced by
precipitation, particularly growing season precipitation (r =
0.87, P < 0.0001). Compared to wheat, winter precipitation
Table 2. Tillage effects on change in soil water storage [harvest (June or July) to March], soil water depletion [March to harvest (June or July)], and water use efficiency under winter wheat in rotation with green pea, 1977–1982 and 1985, Columbia Basin Agricultural Research Center (CBARC), Pendleton, OR.
Tillage† 1977 1978 1979 1980 1981 1982 1985 Mean mm 305 mm−1 soil depthWater storage MT 41.47a‡ 183.13a 150.43a 134.11a 191.71a 141.22b 125.22a 138.19ab FP 59.06a 186.82a 161.29a 128.84a 171.56ab 199.52a 140.40a 149.50a SP(FP) 36.32a 169.54a 137.73a 131.44a 188.92a 154.50b 108.84a 132.47b MinT 36.41a 160.02a 128.02a 117.86a 143.70b 158.24b 93.54a 119.68cWater depletion‡ MT 174.63a 151.77a 218.32a 193.29a 228.03a 210.00a 193.55a 195.65a FP 129.22b 159.89a 225.17a 170.56a 219.96a 242.38a 219.90a 195.30a SP(FP) 130.30b 164.40a 215.90a 189.50a 216.41a 211.71a 197.87a 189.48a MinT 169.74ab 148.91a 192.47a 190.38a 210.88a 239.33a 200.72a 193.20a
kg ha−1 mm−1 soil depth Water use effi ciency‡ MT 8.06b 17.86a 8.02a 15.91a 18.48a 15.47a 11.28a 13.58a FP 9.95ab 18.25ab 7.71a 15.43a 18.39a 13.71a 10.25a 13.38ab SP(FP) 10.44a 16.87a 7.35a 15.85a 18.29a 14.13a 11.39a 13.52a MinT 9.30ab 15.40b 7.16a 14.40a 18.23a 12.88b 10.78a 12.59b† MT, maximum tillage; FP, fall plow; SP, spring plow during pea phase; SP(FP), fall plow during wheat phase; MinT, minimum tillage.‡ Means within column groupings with similar letters are not significantly different from each other at the 0.05 probability level.
Table 3. Tillage effects on change in soil water storage [harvest (June or July) to March], soil water depletion [March to harvest (June or July)], and water use efficiency under green pea in rotation with winter wheat, 1977 to 1982 and 1985, Columbia Basin Agricultural Re-search Center (CBARC), Pendleton, OR. Water storage and extraction data are shown as mm per 305 mm soil depth.
Tillage† 1977 1978 1979 1980 1981 1982 1985 Meanmm
Water storage MT 67.48ab‡ 214.44a 182.82a 209.81b 187.07ab 225.93a 162.75a 178.61b FP 47.67b 190.82a 209.99a 224.22ab 162.18b 193.29b 175.13a 171.90b SP 98.89a 211.14a 207.39a 245.75a 214.76a 211.20ab 170.18a 194.19a MinT 93.39a 197.04a 209.87a 211.77b 207.20a 241.24a 185.61a 192.30aWater depletion MT 91.38ab 107.76a 130.62a 144.78a 132.33a 119.95a 111.69a 119.79a FP 83.76b 104.71a 154.37a 121.22a 154.24a 124.02a 114.62a 122.42a SP 139.38a 118.04a 139.13a 141.79a 151.38a 111.44a 105.86a 129.58a MinT 86.93ab 92.71a 145.29a 133.29a 150.11a 129.67a 108.71a 120.96a
kg ha−1 mm−1
Water use effi ciency MT 5.88a 16.80a 16.10a 13.52b 16.83a 9.87a 12.32ab 13.04a FP 5.63a 18.22a 14.77ab 18.85a 14.52a 11.05a 11.28ab 13.47a SP 7.00a 15.07a 13.99ab 15.48ab 15.85a 7.86ab 13.67a 12.70a MinT 8.32a 15.09a 11.74b 16.43ab 17.16a 6.49b 10.09b 12.19a† MT, maximum tillage; FP, fall plow; SP, spring plow during pea phase; SP(FP), fall plow during wheat phase; MinT, minimum tillage.‡ Means within column groupings with similar letters are not significantly different from each other at the 0.05 prob-ability level.

Agronomy Journa l • Volume 100, Issue 1 • 2008 159
had less infl uence on pea yields (r = 0.53, P < 0.0001). Pea
yields in all treatments were low in 1977, 1982, and 1985
(Fig. 2). Both winter and growing season precipitation
were lowest in 1977. Low pea yields in 1982 were partly
attributed to pea leaf weevil (Sitona lineate) infestation
and partly to low growing season precipitation (Fig. 2).
In this year, both SP and MinT treatments produced the
lowest pea yields. In 1985, pea yields were low due both to
low winter and growing season precipitation and to frost
that damaged the fi fth, sixth, and seventh nodes. Th e frost
damage prevented weed spraying, resulting in heavy lambs-
quarters (Chenopodium berlandieri Moq.) infestation. High
pea yields were recorded from 1978 to 1981. Pea yields
were slightly lower in 1979 due both to low winter and
growing season precipitation and to heavy Russian thistle
(Salsola iberica Sennen) and lambsquarters infestation. Th e
FP and the MT treatments produced signifi cantly higher
yield than the SP and MinT in 1978 and 1979. Th e lowest
and highest yield was obtained under MT and FP, respec-
tively, in 1980. In 1981, when the highest precipitation
was received, the highest and lowest yield was obtained
under MinT and FP, respectively. On average, the highest
yield was obtained under FP although the yield was not
signifi cantly diff erent from yields obtained under MT and
SP treatments. MinT produced the lowest average yield
although this was not signifi cantly diff erent from the yield
of MT and the SP treatments.
Tillage Effects on Water Use Effi ciencyOverall there were no signifi cant tillage eff ects and tillage
by year interactions on WUE during the wheat phase (P =
0.09). However, a closer examination of the means indicated
that WUE in MT and SP(FP) was higher (P < 0.05) than
WUE in MinT (Table 2). Th ere were signifi cant year eff ects
on WUE. Th e WUE was highest in 1981 when grain yield
was highest and lowest in 1979 when yield was low (Table
2). Th e WUE was highly correlated with wheat grain yield
under all tillage treatments (Fig. 3a). Th e correlation was
highest under MinT.
Th ere were signifi cant tillage by year interactions on
WUE during the pea phase (Table 1). Tillage had no sig-
Fig. 2. Maximum tillage (MT), fall plow (FP), spring plow (SP) (FP for wheat), and minimum tillage (MinT) effects on grain yield of winter wheat and green pea in rotation at Columbia Basin Agricultural Research Center (CBARC), Pendleton, OR from 1977 to 1982 and 1985. The graphs also show crop-year precipitation (CYppt) (1 September–31 August), winter pre-cipitation (WTppt) (1 September–28 February), and growing season precipitation (GSppt) (1 March–31 August). Means (within each year) with the same letter are not significantly different at the 0.05 probability level.
Fig. 3. Maximum tillage (MT), fall plow (FP), spring plow (SP), and minimum tillage (MinT) effects on grain yield and water use efficiency of (a) winter wheat and (b) green pea in rotation at Columbia Basin Agricultural Research Center (CBARC), Pendle-ton, OR. Data shown are 7-yr means (1977–1982 and 1985).

160 Agronomy Journa l • Volume 100, Issue 1 • 2008
nifi cant eff ect on WUE in either 1977, the driest year of
the study period or in 1978, a year with twice as much
precipitation as 1977 (Table 3). In other years with high
precipitation, tillage eff ects were not consistent. On aver-
age, there were no signifi cant diff erences in WUE among
tillage treatments (Table 3). Th e WUE was highly corre-
lated with green pea yield (Fig. 3b). As during the wheat
phase, the correlation was highest under MinT during the
green pea phase.
Th e WUE of wheat and pea was remarkably similar (Fig.
4). Th e WUE was highly correlated with overall wheat and
green pea yields (Fig. 4). Payne et al. (2001) found similar
results. Th e regression line for green pea is above the regres-
sion line of wheat indicating that green pea had a higher
WUE than wheat. Th is was probably so because the pea was
harvested in an immature state (fresh or green) and used
less water than wheat. On average, however, WUE of wheat
and green pea was 13.27 and 12.85 kg ha−1 mm−1, respec-
tively. Th e average WUE of pea was lower than that of wheat
because of the wide spread of pea WUE values that included
the lowest and highest values (Fig. 4).
DISCUSSIONUnder dryland conditions, the primary challenge is to
develop cropping systems that increase WUE and grain yield
and protect the soil resource from degradation. Grain yield
of both wheat and pea was highly and positively correlated
with WUE (Fig. 3, 4) signifying that improvements in grain
yield will increase WUE. Th e WUE values obtained in this
study were similar to values determined by Rasmussen (1988)
at a nearby location and by Payne et al. (2001). In our study,
WUE was infl uenced by grain yield, soil water depletion,
and growing season precipitation (Eq. [1]). Agronomic prac-
tices that can change the value of these variables can change
the value of WUE. Among these variables, growing season
precipitation cannot be manipulated but its storage and use
can. Soil water depletion, a component of growing season
evapotranspiration, was not diff erent among tillage treat-
ments except in 1977. Th is implied that evapotranspiration
was more or less similar among the tillage treatments for both
wheat and pea during all other study years. It is, however, not
possible to estimate how much of the water depleted was lost
through soil evaporation and through the plant (transpira-
tion) using our data. Consequently, we were unable to deter-
mine how diff erent tillage treatments infl uenced soil water
evaporation and transpiration. However, tillage treatments
that reduce soil evaporation and increase transpiration will
likely increase grain yield and WUE. De Wit (1958) showed
that there was a strong and positive correlation between tran-
spiration and crop productivity. Furthermore, growing condi-
tions that are favorable for plant growth will likely increase
grain yield and, therefore, WUE.
One way to increase transpiration and reduce soil water
evaporation is to increase soil surface cover. Crop residues, left
on the surface, not only reduce evaporation but also increase
water infi ltration and storage (Unger et al., 1988; Schillinger
and Bolton, 1993; Hatfi eld et al., 2001; Nielsen et al., 2005).
In our study, MinT stored the least amount of water during
the wheat phase. Soil water loss through evaporation, reduced
infi ltration, and water depletion by downy brome probably
reduced the amount of water stored under MinT. Removal of
pea vines during harvest left about 1% surface residue cover
under MinT (Payne et al., 2001) that was not suffi cient to
curb soil water evaporation, particularly in July and August
when evaporative demand was highest. Furthermore, sweep-
ing of MinT plots after pea harvest may have created a pan
at the 8-cm depth zone that reduced water infi ltration. Data
on soil profi le water storage distribution (Fig. 2) supports
this conclusion. Higher water storage in the 0 to 30 cm zone
under MinT could not be attributed to mulching eff ect
because of very low residue cover after pea harvest. Reduced
water infi ltration probably resulted in the accumulation of
water in the top soil and less water in the 30 to 210-cm zone.
Water in the 0 to 30 cm zone was probably prone to evapo-
ration because of lack of surface residue cover under MinT.
Th e MT treatment was also cultivated with a sweep after har-
vesting green pea but was chisel plowed or ripped in the fall
before seeding wheat, possibly fracturing the pan created by
sweeping and increasing water infi ltration and storage under
this treatment. Similar studies have shown that sweeping cre-
ated a pan (Rasmussen and Smiley, 1994; Pikul and Aase,
2003; Gollany et al., 2005) that reduced water infi ltration
(Rasmussen and Smiley, 1994). Higher wheat yields were
obtained under FP which stored the most water. Rasmussen
and Smiley (1994) also showed that the moldboard plow
treatment had higher infi ltration rates than the sweep and
disc treatments in a nearby long-term tillage experiment con-
ducted on a Walla Walla silt loam. During the wheat growing
season, heavy downy brome infestations under MinT pre-
sumably increased competition for water thereby decreasing
the amount of water available for wheat transpiration and
productivity under this treatment. Deibert et al. (1986) also
showed that no-till grain yields were reduced in some years
by weed competition. A combination of low residue cover,
reduced water infi ltration caused by sweeping after green pea
harvest, and weed competition led to reduced grain yield and
WUE under MinT during the wheat phase.
In contrast to the wheat phase, plots under SP and MinT
stored more water than other tillage treatments during the
Fig. 4. Grain yield and water use efficiency of winter wheat and green pea in rotation at Columbia Basin Agricultural Research Center (CBARC), Pendleton, OR. Data shown are 7-yr means (1977–1982 and 1985).

Agronomy Journa l • Volume 100, Issue 1 • 2008 161
pea phase. Wheat stubble in plots under MinT was mowed
down to provide between 80 and 100% soil cover (Payne
et al., 2001; Karl Rhinhart, unpublished data, 2005). Large
amounts of surface residues form mulch that has been shown
to increase water infi ltration and reduce evaporation, result-
ing in increased soil water storage (Greb, 1966; Ramig et
al., 1983; Schillinger and Bolton, 1993; Bonfi l et al., 1999;
Halvorson et al., 1999; Hatfi eld et al., 2001, Lafond et al.,
2006). Th e mulching eff ect was clearly manifested in 1977,
the driest year. In this year, nearly double the amount of soil
water was stored under SP and MinT treatments compared to
MT and FP treatments. However, yield was not signifi cantly
higher than other treatments during this year or during wet
years and on average, MinT produced the lowest yield. Low
WUE under MinT during the pea phase was attributable to
low yields. Compared to dry pea, green pea is harvested in an
immature state and requires less water. Th erefore, during wet
years, the additional water stored under MinT made little or
no diff erence in yield. In wet years other factors, such as weed
infestation and growing conditions associated with heavy
surface residue cover, strongly infl uenced yield. Broadleaf
weeds were problematic in all treatments and likely reduced
yields uniformly across all treatments. Wet soils coupled with
thick residue cover under conservation tillage conditions
that include MinT have been shown to lower soil tempera-
tures. Cold and wet soils particularly in early spring have
been shown to slow down plant growth and development
under no-tillage (Allmaras et al., 1973; Ramig et al., 1983;
Schillinger and Bolton, 1993; Reicosky et al., 1995; Vyn et
al., 1998). Early slow growth may result in smaller plants that
may not compete well for light and water under increased
weed pressure in years with normal and above-normal precipi-
tation. Although lowest, MinT yield was not signifi cantly dif-
ferent from MT and SP yields. Th e FP produced the highest
yield because moldboard plowing and secondary cultivations
prepared a clean ( <5% residue cover) seedbed with good tilth
that was favorable for rapid pea emergence and growth.
During the wheat phase, WUE in MT and SP(FP) was sig-
nifi cantly higher than WUE in MinT largely because of lower
yields under MinT. High correlation between grain yield
and WUE under MinT indicates that practices or conditions
that can improve yield in MinT will increase WUE. Results
showed that MinT (after pea harvest during the wheat phase)
had low surface residues and stored less water than other
treatments. Th e role of sweeping soil immediately after pea
harvest should be re-examined to determine whether weed
control eff ects outweigh the reduction in the amount of water
stored. Sweeping in the absence of surface residues appeared
to reduce the amount of water stored in the soil profi le and
should be abandoned. Better weed control using herbicides is
needed to reduce the weed problem under MinT during both
the wheat and pea phases of the rotation. Th is would certainly
improve yield and WUE under this treatment. Furthermore,
the use of crop cultivars that are adapted to high residue con-
ditions under MinT should be evaluated.
CONCLUSIONSOur results showed that tillage practices and timing of till-
age operations aff ected water storage, water use, and yield of
winter wheat and green pea in rotation. However, in absolute
terms, diff erences for grain yield and soil water among till-
age practices were small. Th e choice of tillage practice for a
wheat–pea rotation should therefore be based on the interac-
tion of factors that increase WUE and yield. In this study,
many factors infl uenced water use. For example, crop residues
increased water storage under MinT during the pea phase.
Removal of green pea vines for threshing left the soil exposed
and prone to water evaporation. Pea vines should be left on
the soil surface to increase surface cover. Sweeping the soil
under low residue conditions hindered water storage under
MinT probably by reducing the rate of water infi ltration and
increasing evaporation. Leaving wheat stubble over-winter, as
in SP and MinT treatments during the pea phase, increased
soil water storage. However, storing the most water without
adequate weed control did not guarantee high yields as was
the case with MinT during the pea phase. Adequate weed
control under MinT should improve yields in this treatment.
Conservation attributes of MinT makes this treatment attrac-
tive. Under limited water conditions, as in eastern Oregon,
any improvement in agronomic practices that increase yield
will ultimately increase WUE.
ACKNOWLEDGMENTSThe authors acknowledge Susan Sisson for compiling the soil
water data and Robert Ramig and Les Ekin for their stewardship of
this trial for many years.
REFERENCESAase, J.K., and F.H. Siddoway. 1990. Stubble height eff ects on seasonal
microclimate, water balance, and plant development of no-till winter wheat. Agric. For. Meteorol. 21:1–20.
Allmaras, R.R., A.L. Black, and R.W. Rickman. 1973. Tillage, soil environment and root growth. p. 62–86. In Proc. Natl. Conserv. Tillage Conf.., Des Moines, IA. 28–30 March.Soil Conservation Soc. of Am., Ankeny, IA.
Bolton, F.E., and D.M. Glen. 1983. Fallow-cropping systems in the Pacifi c Northwest. Tech. Bull. 146, Oregon State Univ. Agric. Exp. Stn, Corvallis.
Bonfi l, D.J., I. Mufradi, S. Klitman, and S. Asido. 1999. Wheat grain yield and soil profi le water distribution in a no-till arid environment. Agron. J. 91:368–373.
Chen, C., W.A. Payne, R.W. Smiley, and M.A. Stoltz. 2003. Yield and water-use effi ciency of eight wheat cultivars planted on seven dates in northeastern Oregon. Agron. J. 95:836–843.
Cutforth, H.W., B.G. McConkey, D. Ulrich, P.R. Miller, and S.V. Angadi. 2002. Yield and water use effi ciency of pulses seeded directly into standing stubble in the semiarid Canadian Prairie. Can. J. Plant Sci. 82:681–686.
De Wit, C.T. 1958. Transpiration and crop yields. Versl. Landbouwk. Onderz. 64 (6), IBS, Wageningen, the Netherlands.
Deibert, E.J., E. French, and B. Hoag. 1986. Water storage and use by spring wheat under conventional tillage and no-till in continuous and alternate crop-fallow systems in the northern Great Plains. J. Soil Water Conserv. 41:53–58.
Franzluebbers, A.J. 2004. Tillage and residue management eff ects on soil organic matter. p. 227–268. In F. Magdoff and R.R. Weil (ed.) Soil organic matter in sustainable agriculture. CRC Press, New York.
Gollany, H.T., R.R. Allmaras, S.M. Copeland, S.L. Albrecht, and C.L. Douglas, Jr. 2005. Tillage and nitrogen fertilizer infl uence on carbon and soluble silica relations in a Pacifi c Northwest mollisol. Soil Sci. Soc. Am. J. 69:1102–1109.
Greb, B.W. 1966. Eff ect of surface-applied wheat straw on soil water losses by solar distillation. Soil Sci. Soc. Am. Proc. 30:786–788.
Halvorson, A.D., A.L. Black, J.M. Krupinsky, and S.D. Merrill. 1999. Dryland winter wheat response to tillage and nitrogen within an annual cropping system. Agron. J. 91:702–707.

162 Agronomy Journa l • Volume 100, Issue 1 • 2008
Hatfi eld, J.L., T.J. Sauer, and J.H. Prueger. 2001. Managing soils to archive greater water use effi ciency: A review. Agron. J. 93:271–280.
Lafond, G.P., W.E. May, F.C. Stevenson, and D.A. Derksen. 2006. Eff ects of tillage systems and rotations on crop production for a thin Black Chernozem in the Canadian Prairies. Soil Tillage Res. 89:232–245.
Lindsey, J.K. 1999. Models for repeated measurements. , 2nd ed. Oxford Univ. Press, Oxford, UK.
Littell, R.C., W.W. Stroup, G.A. Milliken, and R. Wolfi nger. 1996. SAS system for mixed models. SAS Publ., Cary, NC.
Logsdon, S.D., R.R. Allmaras, L. Wu, J.B. Swan, and G.W. Randall. 1990. Macroporosity and its relation to saturated hydraulic conductivity under diff erent tillage practices. Soil Sci. Soc. Am. J. 54:1096–1101.
Nielsen, D.C., P.W. Unger, and P.R. Miller. 2005. Effi cient water use in dryland cropping systems in the Great Plains. Soil Sci. Soc. Am. J. 97:364–372.
Norwood, C.A. 1999. Water use and yield of dryland row crops as aff ected by tillage. Agron. J. 91:108–115.
Payne, W.A. 1998. Hydraulic conductivity functions derived from soil water content data of a long-term experiment. p. 31–34. In Columbia Basin Agricultural Research Center Annual Report. Spec. Rep. 977. Oregon State Univ. Agric. Exp. Stn., Corvallis.
Payne, W.A., P.E. Rasmussen, C. Chen, R. Goller, and R.E. Ramig. 2000. Precipitation, Temperature and Tillage Eff ects upon Productivity of a Winter Wheat–Dry Pea Rotation. Agron. J. 92:933–937.
Payne, W.A., P.E. Rasmussen, C. Chen, and R.E. Ramig. 2001. Assessing simple wheat and pea models using data from a long-term tillage experiment. Agron. J. 93:250–260.
Pikul, J.L., and J.K. Aase. 2003. Water infi ltration and storage aff ected by subsoiling and subsequent tillage. Soil Sci. Soc. Am. J. 67:859–866.
Pikul, J.L., R.E. Ramig, and D.E. Wilkins. 1993. Soil properties and crop yield among four tillage systems in a wheat-pea rotation. Soil Tillage Res. 26:151–162.
Ramig, R.E., R.R. Allmaras, and R.I. Papendick. 1983. Water conservation:
Pacifi c Northwest. p. 105–124. In H.E. Dregne and W.O. Willis (ed.)
Dryland agriculture. ASA, CSSA, and SSSA, Madison, WI.
Ramig, R.E., and L.G. Ekin. 1987. Conservation tillage systems for annually
cropped wheat in the Pacifi c Northwest. J. Soil Water Conserv. 42:53–
55.
Rasmussen, P.E. 1988. Nitrogen and sulfur eff ects on water use effi ciency of
winter wheat. p. 473–475. In Proc. Int. Conf. on Dryland Farming,
Amarillo, Bushland, TX. 15–19 August.Texas Agric. Exp. Stn.,
College Station.
Rasmussen, P.E., and R.W. Smiley. 1994. Long-term management eff ects on
soil productivity and crop yield in semi-arid regions of eastern Oregon.
Stn. Bull. 675, Oregon State Univ. Agric. Exp. Stn. and USDA-ARS,
Corvallis, OR.
Reicosky, D.C., W.D. Kemper, G.W. Langdale, C.L. Douglas, Jr., and P.E.
Rasmussen. 1995. Soil organic matter changes resulting from tillage
and biomass production. J. Soil Water Conserv. 50:253–261.
Schillinger, W.F., and F.E. Bolton. 1993. Yield components and crop
characteristics of no-tillage winter wheat grown in wheat fallow
rotation. p. 50–54. In Columbia Basin Agricultural Research Center
Annual Report. Spec. Rep. 909. Agric. Exp. Stn. Oregon State Univ.,
Corvallis.
Unger, P.W., G.W. Langdale, and R.I. Papendick. 1988. Role of crop residues-
improving water conservation and use. p. 69–100. In W.L. Hargrove
(ed.) Cropping strategies for effi cient use of water and nitrogen. ASA,
CSSA, SSSA, Madison, WI.
Vyn, T.J., G. Opuku, and C.J. Swanton. 1998. Residue management and
minimum tillage systems for soybean following wheat. Agron. J.
90:131–138.
Related Documents


![Experimental screening of pea and wheat genotypes for ... · Leaf area (flag leaf + F-1) [cm 2] Title: Microsoft PowerPoint - Wheat-plasticity_poster.pptx Author: uk057598 Created](https://static.cupdf.com/doc/110x72/6037646d412b4c56162e7401/experimental-screening-of-pea-and-wheat-genotypes-for-leaf-area-flag-leaf-.jpg)