See discussions, stats, and author profiles for this publication at: https://www.researchgate.net/publication/273699298 Tidal characteristics and sounding datum variation in Lagos State Article · July 2014 CITATIONS 2 READS 9,225 3 authors, including: Some of the authors of this publication are also working on these related projects: Geoid Modelling View project Current Modelling and Prediction View project O.T.Badejo Badejo University of Lagos 13 PUBLICATIONS 191 CITATIONS SEE PROFILE Alfred Alademomi University of Plymouth 5 PUBLICATIONS 5 CITATIONS SEE PROFILE All content following this page was uploaded by Alfred Alademomi on 18 March 2015. The user has requested enhancement of the downloaded file.

Welcome message from author
This document is posted to help you gain knowledge. Please leave a comment to let me know what you think about it! Share it to your friends and learn new things together.
Transcript

See discussions, stats, and author profiles for this publication at: https://www.researchgate.net/publication/273699298
Tidal characteristics and sounding datum variation in Lagos State
Article · July 2014
CITATIONS
2READS
9,225
3 authors, including:
Some of the authors of this publication are also working on these related projects:
Geoid Modelling View project
Current Modelling and Prediction View project
O.T.Badejo Badejo
University of Lagos
13 PUBLICATIONS 191 CITATIONS
SEE PROFILE
Alfred Alademomi
University of Plymouth
5 PUBLICATIONS 5 CITATIONS
SEE PROFILE
All content following this page was uploaded by Alfred Alademomi on 18 March 2015.
The user has requested enhancement of the downloaded file.

Tidal Characteristics and Sounding Datum Variation
in Lagos State
Abstract: The need for water level monitoring has increased over the years. Water level monitoring
is among other things useful for oil and gas exploration and exploitation activities, and construction
of ports and harbour works. The mean sea level for Lagos, Nigeria is referenced to the Lagos datum
situated at the Office of the Surveyor General of the Federation at Lagos Island. This paper
examines correlation and variation in the mean water levels and sounding datums for twelve water
bodies in Lagos State. Water level observations were taken with the aid of tide gauges for twenty
nine days at 12 tidal stations strategically situated within Lagos State. The mean water levels and
other tidal characteristics for the various water bodies were calculated from the observed tidal
observations from the twelve tide gauge stations. The tide gauge station at the Lagos Harbour has a
known chart datum. Sounding datums were therefore determined for the eleven tide gauge locations
by sounding datum transfer technique using the Chart datum at the Lagos harbor. The result from
our study shows that there are variations in the tidal characteristics of the various water bodies in
Lagos State. There is also a need for the harmonization of the various tidal datum in Lagos State.
Keywords: Water Level Observations, Mean Water Level, Sounding Datum, Tidal Characteristics
O. T. Badejo
Senior Lecturer in Department of Surveying and
Geoinformatics, University of Lagos
J. B. Olaleye
Professor in the Department of Surveying & Geoinformatics,
University of Lagos
A. S. Alademomi
Lecturer in Department of Surveying and Geoinformatics,
University of Lagos, Nigeria
ISSN 2319-9725

July, 2014 www.ijirs.com Vol3 Issue 7
International Journal of Innovative Research and Studies Page 436
1. Introduction:
The Lagos lagoons lie behind the barrier beach and extend for 210 km along the coast. They
are flanked by tidal wetlands and swamps. We have about ten Lagoons in Lagos State, with
the Lagos and Lekki lagoons being the major lagoons among these lagoons. The other
lagoons are Yewa, Badagry, Ologe, Iyagbe, Kuramo, Apese, Epe, and Mahin lagoons
(Onyema, 2009b). Figure 1 and Figure 2 show the various Lagoons and Water Bodies in
Lagos State.
1.1. Lagos Lagoon:
The Lagos lagoon is more than 50 km long and 3 to 13 km wide. It is separated from the
Atlantic Ocean by a long sand spit to 5 km wide, which has swampy margins on the lagoon
side. Its surface area is approximately 6,354.7sq km. With the exception of the Commodore
channel, the lagoon is fairly shallow and is not plied by ocean-going ships, but by smaller
barges and boats. The Lagos Lagoon averages 2-4 m deep, but is 10 m deep in the entrance at
the Commodore channel. Lagos Lagoon empties into the Atlantic Ocean via Lagos Harbour.
The Lagos harbour or Commodore Channel is 0.5 km to 1 km wide and 10 km long. The
Lagos port is located at Apapa in a broad western branch off the main channel of the harbour.
The Lagos Lagoon is tidal, water from the Atlantic Ocean moves into the lagoon during high
tides and receeds during low tides. The Lagos lagoon is affected by a powerful longshore
drift. It is fed by several rivers, the most important of which are the Ogun, Ona/Ibu, Oshun,
Shasha and Oni.
1.2. Lekki Lagoon:
Lekki Lagoon, sometimes spelled Leeki, is located in Lagos and Ogun States in Nigeria. The
lagoon lies directly to the east of Lagos lagoon and is connected to it by a channel. The Lekki
lagoon is surrounded by many beaches (www.en.wikipedia.org/wiki/Lekki_Lagoon).
The mean depth of Lekki Lagoon is 3.1 m, and the maximum depth is 6.4 m at low tide. The
complex is isolated from the sea by the beach barrier ridges. The western channels approach
to within a few dozen metres to the sea, but in the east, much of Lekki Lagoon is situated 3-4
km inland. Tidal influence is not pronounced in Lekki Lagoon.
July, 2014 www.ijirs.com Vol3 Issue 7
International Journal of Innovative Research and Studies Page 437
1.3. Ologe Lagoon:
The Ologe lagoon is a brackish water body and is situated northwards of Badagry creek.
River Owo is the main fresh water supply point into the Ologe lagoon (Clarke et al., 2004).
Partially treated and untreated effluents from the Agbara industrial estate is also discharged
into Ologe lagoon. The Ologe Lagoon opens into the Atlantic Ocean via the Badagry creeks
and the Lagos harbour.
The Ologe lagoon meets several socio-economic needs (aquaculture, fishing, sand dredging
and drainage) of the various towns and villages bordering it. Apart from providing income for
fishermen in the satellite towns and villages; it is also a sinkhole for their domestic wastes.
The lagoon is bounded by heavy industries including paper and pulp, glass, plastics,
breweries, pharmaceutical and beverages. These partially/largely untreated discharges
coupled with domestic inputs from the Agbara residential estates and satellite communities
cause significant levels of pollution (Clarke et al., 2005).
1.4. Badagry Lagoon:
The Badagry Lagoon is approximately 60 km long and 3 km wide, and lies between
longitudes 3°0′and 3°45′E and latitudes 6°25′and 6°30′N. Its water depth ranges from 1 m to
3m. Most of the year, the Badagry lagoon is characterized by fresh and slightly brackish
water. The lagoon is influenced by tides and floods from the Lagos Lagoon and Cotonou
harbour through Lake Nokue and Lake Porto-Novo (Anyanwu & Ezenwa, 1988).
2. Water Level Observation In Nigeria:
Sea level monitoring activities in Nigeria started as far back as the colonial years early in the
20th century. The primary objective of sea level monitoring activities at that time was for safe
navigation into the ports of Lagos, Port Harcourt and Calabar. Tidal data were observed at
these stations using graduated tidal staff and later upgraded to float types. Tidal predictions at
that time were very crude but were sufficient to allow ships to navigate through the shallow
estuaries and creeks to the ports.
The Lagos tide gauge station is a GLOSS designated station tied to a bench mark BM I. The
station was located at the jetty of the Nigerian Institute for Oceanography and Marine
Research (NIOMR) Lagos before it was washed away by floods in July 2000.

July, 2014 www.ijirs.com Vol3 Issue 7
International Journal of Innovative Research and Studies Page 438
There is an international collaboration to monitor the sea level using tide gauges located all
around the coastal waters of the world. This network of tide gauges is called Global Sea
Level Observing System (GLOSS). The main component of GLOSS is the 'Global Core
Network' (GCN) of 290 sea level stations around the world for long term climate change and
oceanographic sea level monitoring. The present definition of the GCN (the definition is
modified every few years) is called GLOSS02 (JCOMM, 2011).
Nigeria is lagging behind as the nation is not within the GLOSS network. In the 1990s Shell
Nigeria made some effort to acquire tidal data along the Nigerian coastline. The data were
useful in tidal analysis and prediction. With sea level rising as a result of Global warming,
there is a need for Nigeria to acquire real time tidal measurements so as to be able to protect
our coastline. The entire Nigerian coastline, which is low-lying, is already experiencing the
adverse effects of sea level rise (SLR) through inundation and exacerbation of coastal
erosion. The impacts of SLR on the Nigerian coastal area were well articulated in
Vulnerability Assessment case study of the impacts of SLR on the Nigerian coast. (Awosika
et al., 1992, French and Awosika et al., 1995). For further reading on the history and science
of tides and sea level changes see Pugh(1987), Open University (1989), Emery and Aubrey
(1991), Bijlsmaet al. (1996), Pirazzoli (1996), Warricket al. (1996), Cartwright (1999) and
Douglas and Kearney (2000).
3. Lagos Datum:
Nineteenth and early twentieth century scientific studies of changes in sea level were
concerned primarily with vertical land movements in the belief that the average „real‟ level of
the sea is constant over long periods of time. Indeed, the original motivation for the
establishment of the IUGG Mean Sea Level Committee, which became the Permanent
Service for Mean Sea Level, was the requirement for a better sea level data set for the study
of post-glacial rebound in Scandinavia (Woodworth, 1993). Of course, it is now appreciated
that neither land nor sea levels are constant over long periods. There are vertical movements
of the land associated with a range of natural processes such as tectonics (e.g.,earthquakes) in
addition to post-glacial changes, and with a range of anthropogenic processes (e.g., ground
water pumping); for a review, see Emery and Aubrey (1991). Long term changes in mean sea
level relate to variations in ocean currents and to changes in the volume of water in the
oceans and therefore to climate change.
July, 2014 www.ijirs.com Vol3 Issue 7
International Journal of Innovative Research and Studies Page 439
Lagos 1955 is a vertical datum first defined in 1955 and is suitable for use in Nigeria. Lagos
1955 origin is Mean sea level at Lagos, 1912-1928. Lagos 1955 is a vertical datum for
Geodetic survey, topographic mapping and engineering survey. It was defined by information
from Ebong et al, AVN International, 1991 (Geomatics Solutions 2011, Uzodinma 2005,
http://georepository.com/datum_5194/Lagos-1955.html). The Lagos Datum is 2.8310m
above mean sea level (British Oceanic Data Centre, 2011).
4. Tidal Characteristics And Sounding Level Determination:
The following steps constitute the methodology employed for investigating the water level
variation in Lagos State:
i. Office and Field Reconnaissance
ii. Establishment of Horizontal and Vertical Controls
iii. Erection of Tide Gauge Stations and Tidal Observations
iv. Reduction of Tidal Data and Computation of Tidal Characteristics
v. Sea Level Determination and Transfer of Tidal Datum
vi. Analysis of Tidal Data
4.1. Office And Field Reconnaissance:
The reconnaissance for the project was divided into two phases namely office reconnaissance
and field reconnaissance.
Extensive literature search was done to put the project in the right course. We got information
on a set of first order control points located at Mushin, Lagos State.
Field visit was done to familiarize ourselves with the nature of the project area. Hand held
GPS and a service boat was used for the reconnaissance. We also located existing shore
controls around University of Lagos and East Mole. The suitability of the controls was done
by carrying out spirit leveling. The sites for the tide gauge locations was carefully selected
based on the tidal range of the water bodies at different locations within Lagos State.

July, 2014 www.ijirs.com Vol3 Issue 7
International Journal of Innovative Research and Studies Page 440
4.2. Horizontal And Vertical Control Establishment:
The Existing controls identified in section 5.1were used to establish 33 first order controls
around twelve tide gauge stations used for this study. Geodetic differential GPS observations
and levelling were used to determine the X, Y and Z coordinates of the 33 shore controls.
4.3. Erection Of Tide Gauge Stations And Tidal Observations:
Twelve tide gauge stations were established at the East Mole (Lagos Port) and at eleven other
stations. The tide gauges were located at tidally influenced water bodies that is on Lagos
lagoon, Lekki Lagon, Badagry creek and other lagoons within Lagos State. The zero level of
the tide gauges were also determined with the aid of spirit leveling and Total Station
traversing. The tide gauges were referenced to the shorecontrol stations.The Tidal
observations were carried out between October 3, 2008 and November 1, 2008. Figure 3
shows one of the established tide gauge stations.
4.4. Reduction Of Tidal Data And Computation Of Tidal Characteristics:
The observed tidal data at all the twelve tide gauge stations were reduced by applying the
zero level correction for all the tide gauge stations. The tidal curve was also smoothened by
removing spikes from the data. The spikes were either observation errors or errors in
converting the observed tidal data from analogue format to digital format.
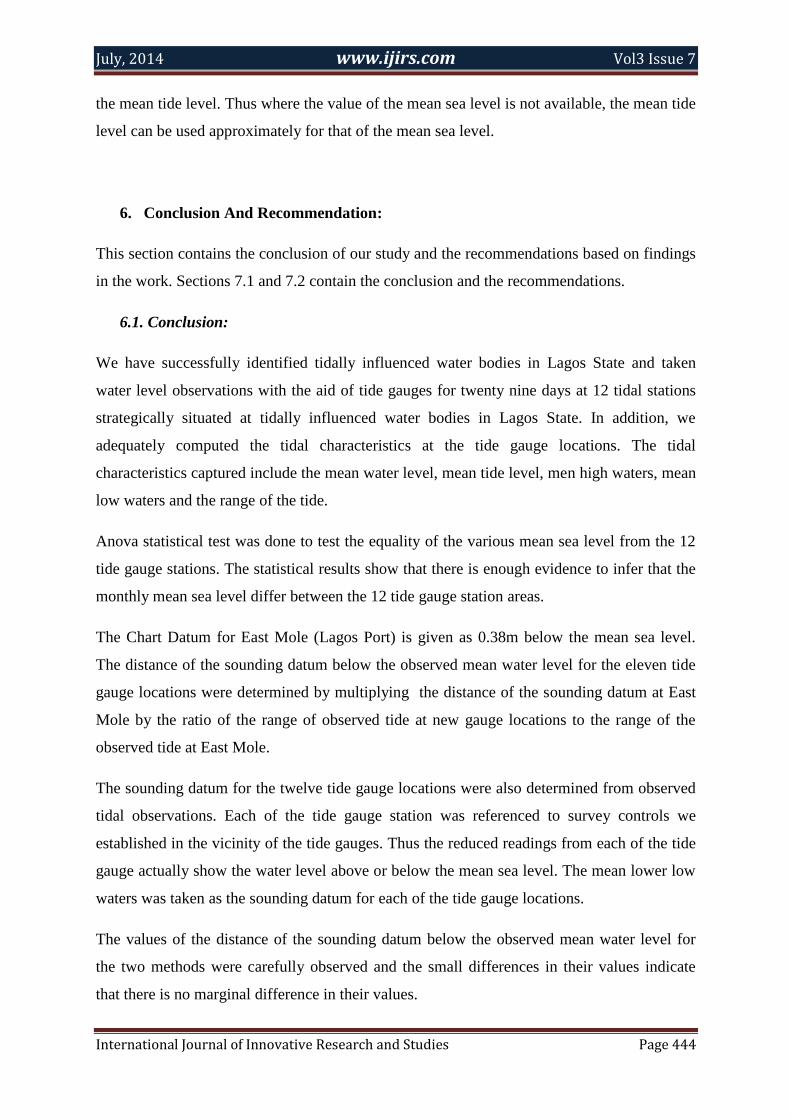
The tidal characteristics of the observed data were computed. The tidal characteristics
computed for each of the tide gauge locations are the mean sea level, the mean high water
level, the mean low water level, the mean tide level and the range of the tide.
4.5. Sea Level Determination And Sounding Datum Transfer:
The observed tidal observations were reduced to the mean sea level by applying the zero
level corrections for each of the tide gauge station. The mean water level for each tide gauge
locality was computed from the reduced 29 days tidal data.
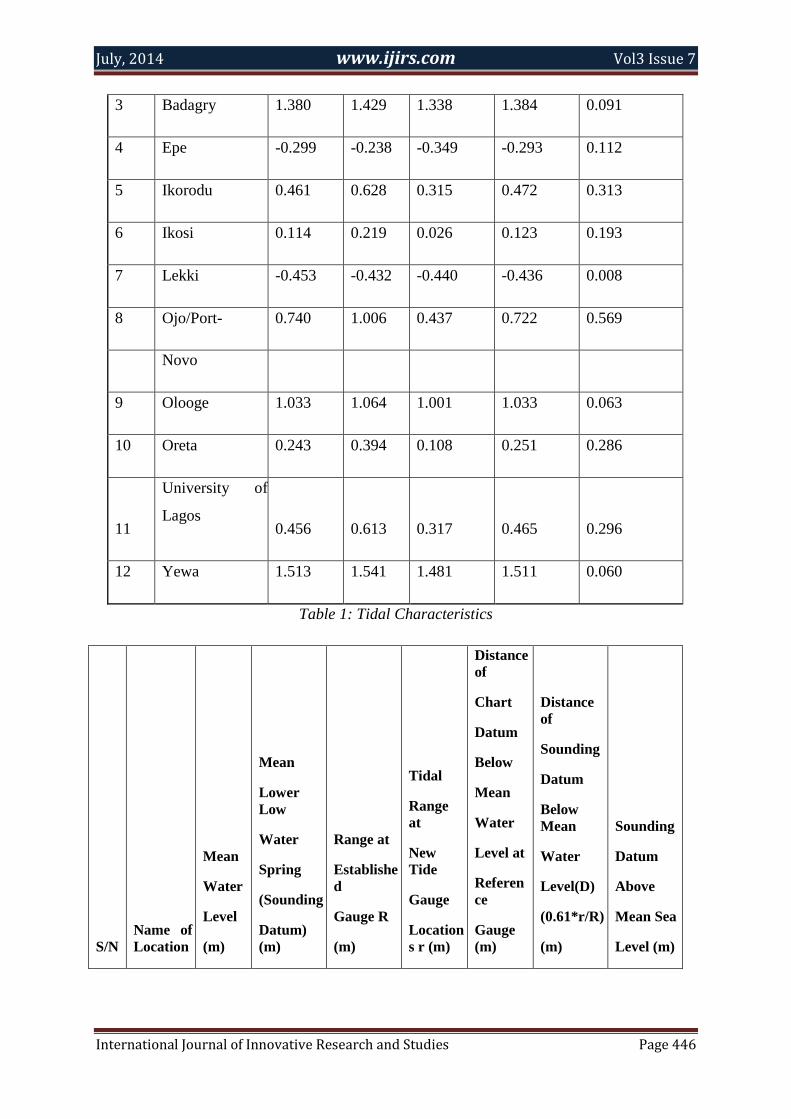
The sounding datum for each tide gauge vicinity was determined by computing the Mean
Low Water Springs for each tide gauge station. Since a limited tidal data was used to
compute the sounding datum, we transferred sounding datum from the standard port at East
Mole to the other tide gauge stations. The sounding datum transfer for each tide gauge

July, 2014 www.ijirs.com Vol3 Issue 7
International Journal of Innovative Research and Studies Page 441
locality was done by using simultaneous 29 days tidal observations from the reference site at
East mole and the eleven tide gauge stations.
The distance of sounding datum below the observed mean level at any of the new site is the
distance of chart datum below the mean level at the reference site times the range ratio
(new/reference). Subtracting the observed height of the mean level from the value of the
distance of the sounding datum below the observed mean level at any of the new sites gives
the distance of the sounding datum below the gauge zero at any of the new sites.
The range ratio method assumes that the ratio of the vertical distances from the respective
datum planes to mean high water springs (MHWS) at the reference and subordinate sites
(MHWS/mhws) is equal to the ratio of the observed mean tidal range at the same two sites
(MR/mr). Thus, the ratio is given as:
MHWS/mhws = MR/mr 5.1
Marshall (2007) gives the full details of the tidal datum transfer procedures used. This
method was chosen because of its proven accuracy. However, other methods may be better
suited to other sites depending on their physical and tidal characteristics. For example, in
some locations only part of the tidal range can be observed because of the influence of mud
flats. In this case the modified height difference method (Dewar and Hannah, 2005) could be
used. The least squares method (Grant and O'Reilly, 1986) may be particularly suited to the
high rate GPS buoy data, however this requires further investigation.
4.6. Analysis Of Data And Tidal Characteristics:
Tidal characteristics was done to determine the mean sea level, mean tide level range and
sounding datum of the water bodies in Lagos State. The analysis of the reduced tidal data was
also performed by testing the equality of the mean sea level for the twelve tide gauge stations.
Analysis of Variance (ANOVA) test was done for the test.
5. Results And Analysis Of Results:
The results and the analysis of the work carried out are presented in the followings sections.

July, 2014 www.ijirs.com Vol3 Issue 7
International Journal of Innovative Research and Studies Page 442
5.1. Results:
The results of our work are given in tables 1 to 6.
5.2. Analysis Of Results:
The analysis of the results for this work is presented as follows and also shown in table 6:
H0: µ1= µ2= µ3
H1: At least two means differ
The test statistics is F.
F = MST/MSE
MST= SST/K-1
Where MST is mean square for treatments MSE is mean of squares for error
SST is sum of squares for treatments
K is no of treatments
K = 12
MSE = SSE/n-k
n = n1+n2+n3+……+n12
Let α = 0.05
Rejection region = F>Fα, k-1,n-k
MST = SST/K-1
SST =6127.3685
K=12
MST = 557.0335
MSE = SSE/n-k
SSE=341.5285675

July, 2014 www.ijirs.com Vol3 Issue 7
International Journal of Innovative Research and Studies Page 443
n = n1+ n2 + n3+ ……+ n12
n = 16831
n-k =16819
MSE =0.02030612
F = MST/MSE
F = 27431.809
α = 0.05
Rejection region = F>Fα, k-1,n-k =1.75
There is enough evidence to infer that the monthly mean sea level differ between the 12 tide
gauge station areas.
Table 5 shows thedifference of observed and transferred sounding datums. A close
observation of table 7 shows that there is no marginal difference in the values of the sounding
datum from the observed tidal data and from the values transferred from East Mole. Except
for East Mole and Olooge Lagoon, the differences from the two sets of values are less than
0.1m. An error of 0.1m is tolerable for most hydrographic operations. The reason for the little
difference in the two set of values for the sounding datums is that the tidal observations
covered just one month. The highest difference in the two sets of observations is from the
values for East Mole which is -0.181m. Our finding from the one month observation is that
the value of 0.38m below the mean sea level adopted for East Mole as the Chart Datum is
actually not correct. We were able to get tidal observation that was as low as 0.561m below
the mean sea level. That means the chart datum of East Mole should be lower than 0.38m
below the mean sea level.
In this work, we actually use the difference in the observed mean water level and the lowest
observed water level at East Mole (instead of 0.38m below the sea level) for the transfer of
sounding datum to other tide gauge locations.
Table 6 shows thedifference of Mean Water Level and Mean Tide Level.A careful study of
table 8 shows that there is little or no difference in the values of the mean sea level and that of
July, 2014 www.ijirs.com Vol3 Issue 7
International Journal of Innovative Research and Studies Page 444
the mean tide level. Thus where the value of the mean sea level is not available, the mean tide
level can be used approximately for that of the mean sea level.
6. Conclusion And Recommendation:
This section contains the conclusion of our study and the recommendations based on findings
in the work. Sections 7.1 and 7.2 contain the conclusion and the recommendations.
6.1. Conclusion:
We have successfully identified tidally influenced water bodies in Lagos State and taken
water level observations with the aid of tide gauges for twenty nine days at 12 tidal stations
strategically situated at tidally influenced water bodies in Lagos State. In addition, we
adequately computed the tidal characteristics at the tide gauge locations. The tidal
characteristics captured include the mean water level, mean tide level, men high waters, mean
low waters and the range of the tide.
Anova statistical test was done to test the equality of the various mean sea level from the 12
tide gauge stations. The statistical results show that there is enough evidence to infer that the
monthly mean sea level differ between the 12 tide gauge station areas.
The Chart Datum for East Mole (Lagos Port) is given as 0.38m below the mean sea level.
The distance of the sounding datum below the observed mean water level for the eleven tide
gauge locations were determined by multiplying the distance of the sounding datum at East
Mole by the ratio of the range of observed tide at new gauge locations to the range of the
observed tide at East Mole.
The sounding datum for the twelve tide gauge locations were also determined from observed
tidal observations. Each of the tide gauge station was referenced to survey controls we
established in the vicinity of the tide gauges. Thus the reduced readings from each of the tide
gauge actually show the water level above or below the mean sea level. The mean lower low
waters was taken as the sounding datum for each of the tide gauge locations.
The values of the distance of the sounding datum below the observed mean water level for
the two methods were carefully observed and the small differences in their values indicate
that there is no marginal difference in their values.

July, 2014 www.ijirs.com Vol3 Issue 7
International Journal of Innovative Research and Studies Page 445
Our finding from the one month observation is that the value of 0.38m below the mean sea
level adopted for East Mole as the Chart Datum is actually not correct. We were able to get
tidal observation that was as low as 0.561m below the mean sea level. That means the chart
datum of East Mole should be lower than 0.38m below the mean sea level.
We also discovered that there is little or no difference in the values of the mean sea level and
that of the mean tide level. Thus where the value of the mean sea level is not available. The
mean tide level can be used.
6.2. Recommendation:
The following recommendations are made based on our study:
Further studies on tidal characteristics for the water bodies within Lagos State with at
least a year‟s tidal data should be carried out.
The information on the tidal characteristics from this work can in the interim be
adopted and made available to the public to assist in the various marine projects
within the state.
Governmental and non governmental agencies should work together with those in the
tertiary institutions to improve upon what has been done in this work especially to
harmonize the datums in Lagos State.
The Chart datum for Lagos Port should be redefined as the level chosen as the chart
datum is not low enough.
S/N
Name of
Location
Mean
Sea
Level
(m)
Mean
High
Water
(m)
Mean Low
Water (m)
Mean Tide
Level (m)
Range of
Tide(m)
1
East Mole
(Lagos Port) 0.232 0.657 -0.224 0.217 0.881
2 Ajido 1.128 1.215 1.058 1.137 0.157
July, 2014 www.ijirs.com Vol3 Issue 7
International Journal of Innovative Research and Studies Page 446
3 Badagry 1.380 1.429 1.338 1.384 0.091
4 Epe -0.299 -0.238 -0.349 -0.293 0.112
5 Ikorodu 0.461 0.628 0.315 0.472 0.313
6 Ikosi 0.114 0.219 0.026 0.123 0.193
7 Lekki -0.453 -0.432 -0.440 -0.436 0.008
8 Ojo/Port- 0.740 1.006 0.437 0.722 0.569
Novo
9 Olooge 1.033 1.064 1.001 1.033 0.063
10 Oreta 0.243 0.394 0.108 0.251 0.286
11
University of
Lagos 0.456 0.613 0.317 0.465 0.296
12 Yewa 1.513 1.541 1.481 1.511 0.060
Table 1: Tidal Characteristics
S/N
Name of
Location
Mean
Water
Level
(m)
Mean
Lower
Low
Water
Spring
(Sounding
Datum)
(m)
Range at
Establishe
d
Gauge R
(m)
Tidal
Range
at
New
Tide
Gauge
Location
s r (m)
Distance
of
Chart
Datum
Below
Mean
Water
Level at
Referen
ce
Gauge
(m)
Distance
of
Sounding
Datum
Below
Mean
Water
Level(D)
(0.61*r/R)
(m)
Sounding
Datum
Above
Mean Sea
Level (m)

July, 2014 www.ijirs.com Vol3 Issue 7
International Journal of Innovative Research and Studies Page 447
1
East
Mole
(Lagos
Port) 0.232
-0.561
0.881 0.612 -0.380
2 Ajido 1.128 0.97 0.157 0.109 1.018
3 Badagry 1.380 1.253 0.091 0.063 1.317
4 Epe
-
0.299
-0.404
0.112 0.078 -0.377
5 Ikorodu 0.461 0.206 0.313 0.217 0.244
6 Ikosi 0.114 -0.081 0.193 0.134 -0.020
7 Lekki
-
0.453
-0.547
0.008 0.006 -0.459
8
Ojo/Port
Novo 0.740
0.314
0.569 0.395 0.345
9 Olooge 1.033 0.886 0.063 0.044 0.989
10 Oreta 0.243 0.026 0.286 0.199 0.044
11
Universit
y of
Lagos 0.456
0.24
0.296 0.205 0.250
12 Yewa 1.513 1.388 0.060 0.042 1.471
Table 2: Results of Sounding Datum Determination
Bada
gry
East
Mole
Ep
e
Ikoro
du
Iko
si
Lek
ki
Oloo
ge
Ore
ta
Aji
do
Ojo Port
Novo
Unil
ag
Ye
wa
1.34 -0.12
-
0.3
3 0.45
0.1
5
-
0.49 1.01 0.26 1.11 0.74 0.45 1.46
1.34 -0.14
-
0.3
1 0.41
0.1
8
-
0.50 1.01 0.17 1.09 0.62 0.41 1.47
1.33 -0.12 -
0.36 0.2 -
1.01 0.13 1.06 0.52 0.37 1.47

July, 2014 www.ijirs.com Vol3 Issue 7
International Journal of Innovative Research and Studies Page 448
0.3
2
0 0.48
1.32 -0.07
-
0.3
4 0.32
0.1
7
-
0.48 1.00 0.12 1.04 0.46 0.34 1.47
1.30 0.13
-
0.3
5 0.32
0.1
3
-
0.47 0.99 0.11 1.01 0.49 0.33 1.46
1.28 0.23
-
0.3
6 0.34
0.0
6
-
0.47 0.98 0.12 1.00 0.60 0.36 1.44
1.27 0.38
-
0.3
7 0.39
-
0.0
1
-
0.48 0.97 0.19 1.00 0.73 0.41 1.44
1.28 0.43
-
0.3
8 0.47
-
0.0
1
-
0.47 0.96 0.25 1.03 0.83 0.48 1.43
1.30 0.43
-
0.4
0 0.54
0.0
4
-
0.48 0.97 0.30 1.07 0.90 0.54 1.43
1.32 0.33
-
0.3
8 0.58
0.1
0
-
0.49 0.98 0.35 1.11 0.94 0.57 1.43
1.35 0.18
-
0.3
2 0.58
0.1
6
-
0.50 0.99 0.36 1.14 0.94 0.57 1.44
1.37 0.03 -
0.20.54
0.2
0
-
0.51 1.02 0.34 1.15 0.88 0.50 1.47

July, 2014 www.ijirs.com Vol3 Issue 7
International Journal of Innovative Research and Studies Page 449
9
1.37 -0.17
-
0.2
6 0.47
0.2
2
-
0.51 1.03 0.27 1.13 0.77 0.46 1.49
1.35 -0.32
-
0.2
6 0.42
0.1
7
-
0.49 1.02 0.22 1.10 0.65 0.40 1.49
1.33 -0.34
-
0.2
5 0.37
0.1
4
-
0.49 1.03 0.15 1.07 0.52 0.34 1.48
1.32 -0.32
-
0.2
9 0.33
0.0
9
-
0.49 1.02 0.10 1.04 0.41 0.30 1.48
1.31 -0.17
-
0.3
2 0.28
0.0
6
-
0.48 1.02 0.07 1.02 0.36 0.27 1.47
1.28 -0.02
-
0.3
2 0.26
0.0
2
-
0.47 0.99 0.06 1.00 0.39 0.26 1.46
1.28 0.18
-
0.3
2 0.29
0.0
1
-
0.49 0.98 0.06 0.98 0.51 0.27 1.45
1.27 0.28
-
0.3
4 0.32
0.0
0
-
0.48 0.97 0.08 0.99 0.63 0.31 1.44
1.27 0.36
-
0.3
5 0.39
0.0
1
-
0.49 0.96 0.15 1.01 0.72 0.38 1.42

July, 2014 www.ijirs.com Vol3 Issue 7
International Journal of Innovative Research and Studies Page 450
1.28 0.38
-
0.3
6 0.43
0.0
2
-
0.48 0.96 0.23 1.03 0.78 0.44 1.42
1.28 0.25
-
0.3
7 0.47
0.0
6
-
0.48 0.96 0.26 1.05 0.82 0.48 1.42
1.30 0.08
-
0.3
5 0.52
0.1
1
-
0.48 0.96 0.28 1.07 0.82 0.47 1.43
Table 3: Tidal Readings for Water Bodies in Lagos State on October 5 2008
S/N
Name of
Location
No of
Observations
(n)
Summation
of
Observations
Mean
Water
Level
(m)
Grand
Mean
(m)
(Mean
Water
Level
-
Grand
Mean
)
(d)
(m)
n(Square
of d)
Sum(Square
(Xi-Mean
Water
Level))
1
East Mole
(Lagos Port) 1403 325.667 0.232 0.543 -0.311 135.59322 159.8831262
2 Ajido 1405 1584.490 1.128 0.543 0.585 480.41671 11.53449281
3 Badagry 1403 1936.839 1.380 0.543 0.837 984.06878 8.570718746
4 Epe 1405 -420.150 -0.299 0.543 -0.842 996.18704 6.885322848
5 Ikorodu 1403 647.038 0.461 0.543 -0.082 9.4411534 20.06662865
6 Ikosi 1405 160.695 0.114 0.543 -0.429 258.12735 10.48312883
7 Lekki 1426 -646.050 -0.453 0.543 -0.996 1414.7582 1.607778365
8 Ojo/PortNovo 1355 1002.490 0.740 0.543 0.197 52.503488 62.92210745
9 Olooge 1405 1450.920 1.033 0.543 0.490 336.90454 5.350544057

July, 2014 www.ijirs.com Vol3 Issue 7
International Journal of Innovative Research and Studies Page 451
10 Oreta 1426 346.366 0.243 0.543 -0.300 128.43122 18.6233378
11
University of
Lagos 1392 634.430 0.456 0.543 -0.087 10.59215
18.96097751
12 Yewa 1403 2123.054 1.513 0.543 0.970 1320.3446 16.64040428
Sum 16831 9146 7 SST= 6127.3685 341.5285675
Mean of Sea
Levels
0.5456
6
Grand
Mean =
0.543389519 SSE=
341.5285675
Table 4: Analysis of Observed Tides
S/N
Name of
Location
Sounding
Datum
Below
(Above)
Mean Sea
Level
Mean Lower
Low Water
Spring
(Sounding
Datum) MLLWS-S.D.
1
East Mole
(Lagos Port) -0.380
-0.561
-0.181
2 Ajido 1.018 0.970 -0.048
3 Badagry 1.317 1.253 -0.064
4 Epe -0.377 -0.404 -0.027
5 Ikorodu 0.244 0.206 -0.038
6 Ikosi -0.020 -0.081 -0.061
7 Lekki -0.459 -0.547 -0.088
8 Ojo/Port- 0.345 0.314 -0.031

July, 2014 www.ijirs.com Vol3 Issue 7
International Journal of Innovative Research and Studies Page 452
Novo
9 Olooge 0.989 0.886 -0.103
10 Oreta 0.044 0.026 -0.018
11
University
of Lagos 0.250
0.240
-0.010
12 Yewa 1.471 1.388 -0.083
Table 5: Difference of Observed and Transferred Sounding Datum
S/N
Name of
Location
Mean
Water
Level (m)
Mean Tide
Level (m)
M.T.L.-
M.W.L. (m)
1
East Mole
(Lagos Port) 0.232 0.217 -0.015
2 Ajido 1.128 1.137 0.009
3 Badagry 1.380 1.384 0.003
4 Epe -0.299 -0.293 0.006
5 Ikorodu 0.461 0.472 0.011
6 Ikosi 0.114 0.123 0.008
7 Lekki -0.453 -0.436 0.017
8 Ojo/Port-
Novo
0.740 0.722 -0.018
9 Olooge 1.033 1.033 0.000
10 Oreta 0.243 0.251 0.008
11 University of 0.456 0.465 0.009

July, 2014 www.ijirs.com Vol3 Issue 7
International Journal of Innovative Research and Studies Page 453
Lagos
12 Yewa 1.513 1.511 -0.002
Table 6: Difference of Mean Water Level and Mean Tide Level
Figure 2: Water Bodies in Lagos State
Figure 1: Lagoons and Water Bodies in Lagos State

July, 2014 www.ijirs.com Vol3 Issue 7
International Journal of Innovative Research and Studies Page 454
Figure 3: One of the Established Tide Gauge Stations used for the Study
Figure 4: Tidal Curve of Water Bodies in Lagos State on October 5 2008

July, 2014 www.ijirs.com Vol3 Issue 7
International Journal of Innovative Research and Studies Page 455
References:
1. Akinsoji, A., Adedoyin, J. and Adekanye, M. (2002). Aquatic macrophytes of three
selected sites in Lagos, Southwest Nigeria. Journal of Science, Technology &
Environment. 2(1): 9 – 15.
2. Anyanwu, A. J. &Ezenwa, B. I. O. (1988). Incidence of parasitic infection of pond
raised Tilapia spp. and some cultivable fish species from three ecological areas of
Lagos state.
3. Awosika, L. F., Gregory T. French; Robert J. Nicholls and Ibe, C. E. (1992). The
Impacts of Sea Level Rise on the Coastline of Nigeria: In Proc. IPCC Symposium on
the Rising Challenges of the Sea. Margaritta, Venezuela 14 - 19 March, 1992. p.123-
154.
4. French G. T., Awosika, L. F. and Ibe, C. E. Sea Level rise and Nigeria. (1995).
Potential impacts and consequences. Journal of Coastal Research Special issue No.
14. p.224-242.
5. British Oceanic Data Centre.(2011).GLOSS Station Handbook. Station information
sheet
6. Joint Technical Commission for Oceanography and Marine Meteorology
(JCOMM).(2011).The Global Sea Level Observation System.
7. British Oceanic Data Centre.(2011).GLOSS Station Handbook. Station information
sheet
(http://www.psmsl.org/train_and_info/training/reading/canadian_manual/chapter7.pdf
).
8. Intergovernmental Oceanic Commission. (2002). Manual on Sea Level Measurement
and Interpretation. Manuals and Guides No. 14 Volume III - page 32 UNESCO
9. Clarke, E.O, Anetekhai MA, Akin-Oriola GA, Onanuga AIS, Olarinmoye OM,
Adeboyejo OA, Agboola I. (2004). The Diatom (Bacillariophyta) diversity of an open
access lagoon in Lagos, Nigeria. J. Res. Rev. Sci. 3:70 – 77.
10. Clarke EO, Anetekhai MA, Onanuga OA, Olarinmoye MO, Adeboyejo O.A. (2005).
The population dynamics of Prorocentraceae,Gonyaulacaceae, Euglenophyceaeand
eratiaceae, in a lagoon bordering heavy industry in Lagos State, Nigeria. Proceedings
of the 4th Faculty of science annual conference, Lagos State University. 4. pp. 60 –
62.

July, 2014 www.ijirs.com Vol3 Issue 7
International Journal of Innovative Research and Studies Page 456
11. Coastal Profile of Nigeria.(1997). Large Marine Ecosystem Project for the Gulf of
Guinea. Center for Environment and Development in Africa. Federal Environmental
Protection Agency.
12. Dewar, P. and Hannah, J. (2005). An Assessment of the Accuracy of Three Tidal
Datum 16)Transfer Procedures in a Harbour Environment. The Hydrographic
Journal, (No.117), 3-7.
13. FAO. (1969). Fisheries Survey in the Western and Mid-western Regions of Nigeria.
FAO, Rome, SF74/NIR6.
14. Grant, S. T. and O'Reilly, C. T. (1986). A New Look at Tidal Datum Transfer
Procedures. In: Proceedings FIG XVIII International Congress of Surveyors. Toronto,
International Federation of Surveyors, pp.258-282.
15. Hill, M.B. and Webb, J.E. (1958). The ecology of Lagos lagoon II. The topography
and physical features of the Lagos harbour and Lagos lagoon. Philosophical
Transaction of Royal Society, London. 241: 307-417.
16. Marshall, A. (2007).Water Level Measurement and Tidal Datum Transfer using High
Rate GPS Buoys. B.Surv Dissertation, School of Surveying, Otago University,
Dunedin.
17. Nwankwo, D.I. (1996). Phytoplankton diversity and succession in Lagos lagoon,
Nigeria. Archiv Fur Hydrobiologie. 135(4): 529-542.
18. Nwankwo, D.I. (2004). The Microalgae: Our indispensable allies in aquatic
monitoring and biodiversity sustainability. University of Lagos Press. Inaugural
lecture series. 44pp.
19. Onyema, I.C. (2007). Mudflat microalgae of a tropical bay in Lagos, Nigeria. Asian
Journal of Microbiology, Biotechnology and Environmental Sciences. 9 (4): 877 –
883.
20. Onyema, I.C. (2008). Phytoplankton biomass and diversity at the Iyagbe lagoon
Lagos, Nigeria. University of Lagos, Akoka. Department of Marine Sciences. 266pp
21. Onyema, I.C. (2009a). Notes on the existence of an additional lagoon in South-
western Nigeria: Apẹsẹ Lagoon. Journal of American Science. 5(4):151-156.
22. Onyema, I.C. (2009b). The Water Chemistry, Phytoplankton Biomass (Chlorophyll
a), Episammic and Periphytic Algae of the Apese Lagoon, Lagos. Report and
Opinion. 1(5): 31 – 40.
23. Onyema, I.C. (2009c). Pollution and the ecology of coastal waters of Nigeria Dolps
and Bolps Investment Limited, Lagos, Nigeria. 216pp.

July, 2014 www.ijirs.com Vol3 Issue 7
International Journal of Innovative Research and Studies Page 457
24. Onyema, I.C. and Nwankwo, D.I. (2006). The epipelic assemblage of a polluted
estuarine creek in Lagos, Nigeria. Pollution Research. 25(3): 459 - 468.
25. Onyema, I.C. and Nwankwo, D.I. (2009b). Chlorophyll a dynamics and
environmental factors ina tropical estuarine lagoon. Academia Arena. 1(1) : 18 – 30.
26. Onyema, I.C. and Nwankwo, D.I. (2009). Chlorophyll a dynamics and environmental
factors in a tropical estuarine lagoon. Academia Arena. 1(1): 18 – 30.
27. Pugh, D.T. (1987). Tides, Surges and Mean Sea-Level: a handbook for engineers and
scientists. Chichester: Wiley. 472pp.
28. Sandison, E.E. (1966). The effect of salinity fluctuation on the life of
Balanuspallidusstrusburi(Darwin) in Lagos Habour, Nigeria. Journal of Animal
Ecology. 35: 365 – 378.
29. Sandison, E.E. and Hill, M.B. (1966). The distribution of BalanuspallidusStrusburi
(Darwin), Gryphaeagasar (Adanson) Dautzenbergi, Mercierellaenigmaticafarvel and
Hydroidesuncinata(Philippi) in relation to salinity in Lagos Harbour and adjacent
creek. Journal of Animal Ecology. 38: 235-258.
30. Uzodinma, V. N. (2005). “VLBI, SLR and GPS Data in the Nigerian Primary
Triangulation Network – What Benefits to Future Research and the National
Economy?” Proceedings of the 1st International Workshop on Geodesy and
Geodynamics, Toro, Nigeria, 10th – 11th February 2005.
31. Webb, J.E. (1958). The Ecology of Lagos lagoon. 1: The lagoons of the Guinea Coast.
Philosophical Transaction Royal Society London. Ser B: 241-283.
32. Yoloye, V. and Adegoke, O.S. (1977). A new species of Neritina(Archaeogastroda,
Neritidae) from the Lagos lagoon.
33. http://www.psmsl.org/train_and_info/training/reading/canadian_manual/chapter7.pdf
34. NOAA 2011 http://www.nauticalcharts.noaa.gov/mcd/learnnc_soundingdatum.html
35. http://www.gloss-sealevel.org/
36. http://georepository.com/datum_5194/Lagos-1955.html
37. Uzodinma, V. N. 2005. “VLBI, SLR and GPS Data in the Nigerian Primary
Triangulation
38. Network – What Benefits to Future Research and the National Economy?”
39. Proceedings of the 1st International Workshop on Geodesy and Geodynamics, Toro,
Nigeria, 10th – 11th February 2005.
View publication statsView publication stats
Related Documents