TIBCO BusinessWorks ™ Container Edition Application Monitoring and Troubleshooting Software Release 2.4.3 February 2019 Two-Second Advantage ®

Welcome message from author
This document is posted to help you gain knowledge. Please leave a comment to let me know what you think about it! Share it to your friends and learn new things together.
Transcript

TIBCO BusinessWorks™ Container EditionApplication Monitoring and TroubleshootingSoftware Release 2.4.3February 2019
Two-Second Advantage®

Important Information
SOME TIBCO SOFTWARE EMBEDS OR BUNDLES OTHER TIBCO SOFTWARE. USE OF SUCHEMBEDDED OR BUNDLED TIBCO SOFTWARE IS SOLELY TO ENABLE THE FUNCTIONALITY (ORPROVIDE LIMITED ADD-ON FUNCTIONALITY) OF THE LICENSED TIBCO SOFTWARE. THEEMBEDDED OR BUNDLED SOFTWARE IS NOT LICENSED TO BE USED OR ACCESSED BY ANYOTHER TIBCO SOFTWARE OR FOR ANY OTHER PURPOSE.
USE OF TIBCO SOFTWARE AND THIS DOCUMENT IS SUBJECT TO THE TERMS ANDCONDITIONS OF A LICENSE AGREEMENT FOUND IN EITHER A SEPARATELY EXECUTEDSOFTWARE LICENSE AGREEMENT, OR, IF THERE IS NO SUCH SEPARATE AGREEMENT, THECLICKWRAP END USER LICENSE AGREEMENT WHICH IS DISPLAYED DURING DOWNLOADOR INSTALLATION OF THE SOFTWARE (AND WHICH IS DUPLICATED IN THE LICENSE FILE)OR IF THERE IS NO SUCH SOFTWARE LICENSE AGREEMENT OR CLICKWRAP END USERLICENSE AGREEMENT, THE LICENSE(S) LOCATED IN THE “LICENSE” FILE(S) OF THESOFTWARE. USE OF THIS DOCUMENT IS SUBJECT TO THOSE TERMS AND CONDITIONS, ANDYOUR USE HEREOF SHALL CONSTITUTE ACCEPTANCE OF AND AN AGREEMENT TO BEBOUND BY THE SAME.
ANY SOFTWARE ITEM IDENTIFIED AS THIRD PARTY LIBRARY IS AVAILABLE UNDERSEPARATE SOFTWARE LICENSE TERMS AND IS NOT PART OF A TIBCO PRODUCT. AS SUCH,THESE SOFTWARE ITEMS ARE NOT COVERED BY THE TERMS OF YOUR AGREEMENT WITHTIBCO, INCLUDING ANY TERMS CONCERNING SUPPORT, MAINTENANCE, WARRANTIES,AND INDEMNITIES. DOWNLOAD AND USE OF THESE ITEMS IS SOLELY AT YOUR OWNDISCRETION AND SUBJECT TO THE LICENSE TERMS APPLICABLE TO THEM. BY PROCEEDINGTO DOWNLOAD, INSTALL OR USE ANY OF THESE ITEMS, YOU ACKNOWLEDGE THEFOREGOING DISTINCTIONS BETWEEN THESE ITEMS AND TIBCO PRODUCTS.
This document contains confidential information that is subject to U.S. and international copyright lawsand treaties. No part of this document may be reproduced in any form without the writtenauthorization of TIBCO Software Inc.
TIBCO, TIBCO ActiveMatrix BusinessWorks, TIBCO Rendezvous, TIBCO Enterprise Message Service,TIBCO Business Studio, TIBCO Enterprise Administrator, TIBCO ActiveSpaces, TIBCO Runtime Agent,TIBCO Designer, TIBCO BusinessWorks Container Edition, TIBCO BusinessWorks Studio ContainerEdition and Two-Second Advantage are either registered trademarks or trademarks of TIBCO SoftwareInc. in the United States and/or other countries.
Enterprise Java Beans (EJB), Java Platform Enterprise Edition (Java EE), Java 2 Platform EnterpriseEdition (J2EE), and all Java-based trademarks and logos are trademarks or registered trademarks ofOracle Corporation in the U.S. and other countries.
All other product and company names and marks mentioned in this document are the property of theirrespective owners and are mentioned for identification purposes only.
THIS SOFTWARE MAY BE AVAILABLE ON MULTIPLE OPERATING SYSTEMS. HOWEVER, NOTALL OPERATING SYSTEM PLATFORMS FOR A SPECIFIC SOFTWARE VERSION ARE RELEASEDAT THE SAME TIME. SEE THE README FILE FOR THE AVAILABILITY OF THIS SOFTWAREVERSION ON A SPECIFIC OPERATING SYSTEM PLATFORM.
THIS DOCUMENT IS PROVIDED “AS IS” WITHOUT WARRANTY OF ANY KIND, EITHER EXPRESSOR IMPLIED, INCLUDING, BUT NOT LIMITED TO, THE IMPLIED WARRANTIES OFMERCHANTABILITY, FITNESS FOR A PARTICULAR PURPOSE, OR NON-INFRINGEMENT.
THIS DOCUMENT COULD INCLUDE TECHNICAL INACCURACIES OR TYPOGRAPHICALERRORS. CHANGES ARE PERIODICALLY ADDED TO THE INFORMATION HEREIN; THESECHANGES WILL BE INCORPORATED IN NEW EDITIONS OF THIS DOCUMENT. TIBCOSOFTWARE INC. MAY MAKE IMPROVEMENTS AND/OR CHANGES IN THE PRODUCT(S)AND/OR THE PROGRAM(S) DESCRIBED IN THIS DOCUMENT AT ANY TIME.
2
TIBCO BusinessWorks™ Container Edition Application Monitoring and Troubleshooting
THE CONTENTS OF THIS DOCUMENT MAY BE MODIFIED AND/OR QUALIFIED, DIRECTLY ORINDIRECTLY, BY OTHER DOCUMENTATION WHICH ACCOMPANIES THIS SOFTWARE,INCLUDING BUT NOT LIMITED TO ANY RELEASE NOTES AND "READ ME" FILES.
Copyright © 2015-2018 TIBCO Software Inc. All Rights Reserved.
3
TIBCO BusinessWorks™ Container Edition Application Monitoring and Troubleshooting

Contents
TIBCO Documentation . . . . . . . . . . . . . . . . . . . . . . . . . . . . . . . . . . . . . . . . . . . . . . . . . . . . . . . . . . . . . . . . . . . . . . . . . . . . . .6
Application Monitoring Overview . . . . . . . . . . . . . . . . . . . . . . . . . . . . . . . . . . . . . . . . . . . . . . . . . . . . . . . . . . . . . . . . . . . . 7
Application Monitoring on Cloud Foundry . . . . . . . . . . . . . . . . . . . . . . . . . . . . . . . . . . . . . . . . . . . . . . . . . . . . . . . . . . . . . . . . . . . . . . . . . . . . . . .7
Configuring MySQL on Cloud Foundry . . . . . . . . . . . . . . . . . . . . . . . . . . . . . . . . . . . . . . . . . . . . . . . . . . . . . . . . . . . . . . . . . . . . . . . . . . . . .8
Configuring PostgreSQL on Cloud Foundry . . . . . . . . . . . . . . . . . . . . . . . . . . . . . . . . . . . . . . . . . . . . . . . . . . . . . . . . . . . . . . . . . . . . . . . . 9
Configuring MS SQL Server on Cloud Foundry . . . . . . . . . . . . . . . . . . . . . . . . . . . . . . . . . . . . . . . . . . . . . . . . . . . . . . . . . . . . . . . . . . .10
Configuring Oracle on Cloud Foundry . . . . . . . . . . . . . . . . . . . . . . . . . . . . . . . . . . . . . . . . . . . . . . . . . . . . . . . . . . . . . . . . . . . . . . . . . . . . 11
Creating nodeJs buildpack with Oracle client . . . . . . . . . . . . . . . . . . . . . . . . . . . . . . . . . . . . . . . . . . . . . . . . . . . . . . . . . . . . . . . . . 11
Creating User Provided Service for Oracle . . . . . . . . . . . . . . . . . . . . . . . . . . . . . . . . . . . . . . . . . . . . . . . . . . . . . . . . . . . . . . . . . . . 11
Configuring Monitoring Application . . . . . . . . . . . . . . . . . . . . . . . . . . . . . . . . . . . . . . . . . . . . . . . . . . . . . . . . . . . . . . . . . . . . . . . . . . .12
Setting up TIBCO BusinessWorks™ Container Edition Application Monitoring on Cloud Foundry . . . . . . . . . . . . . . . . . . . 12
Binding BusinessWorks Application to Monitoring Application on Cloud Foundry . . . . . . . . . . . . . . . . . . . . . . . . . . . . . . . . . . .13
Using CUPS . . . . . . . . . . . . . . . . . . . . . . . . . . . . . . . . . . . . . . . . . . . . . . . . . . . . . . . . . . . . . . . . . . . . . . . . . . . . . . . . . . . . . . . . . . . . . . . . 13
Using an Environment Variable . . . . . . . . . . . . . . . . . . . . . . . . . . . . . . . . . . . . . . . . . . . . . . . . . . . . . . . . . . . . . . . . . . . . . . . . . . . . . . 14
User Authentication using Cloud Foundry UAA . . . . . . . . . . . . . . . . . . . . . . . . . . . . . . . . . . . . . . . . . . . . . . . . . . . . . . . . . . . . . . . . . . . .15
Enabling User Account and Authentication for Pivotal Cloud Foundry . . . . . . . . . . . . . . . . . . . . . . . . . . . . . . . . . . . . . . . . . 15
Viewing Running Application . . . . . . . . . . . . . . . . . . . . . . . . . . . . . . . . . . . . . . . . . . . . . . . . . . . . . . . . . . . . . . . . . . . . . . . . . . . . . . . . . . . . . 17
Application Monitoring on Docker . . . . . . . . . . . . . . . . . . . . . . . . . . . . . . . . . . . . . . . . . . . . . . . . . . . . . . . . . . . . . . . . . . . . . . . . . . . . . . . . . . . . . 18
Setting Up TIBCO BusinessWorks™ Container Edition Application Monitoring on Docker . . . . . . . . . . . . . . . . . . . . . . . . . . 18
Configuring and running monitoring application with Oracle on Docker . . . . . . . . . . . . . . . . . . . . . . . . . . . . . . . . . . . . . . . 19
Using Docker Compose for MySQL . . . . . . . . . . . . . . . . . . . . . . . . . . . . . . . . . . . . . . . . . . . . . . . . . . . . . . . . . . . . . . . . . . . . . . . . . . 20
Using Docker Compose for PostgreSQL . . . . . . . . . . . . . . . . . . . . . . . . . . . . . . . . . . . . . . . . . . . . . . . . . . . . . . . . . . . . . . . . . . . . . 21
Binding BusinessWorks Application to Monitoring Application on Docker . . . . . . . . . . . . . . . . . . . . . . . . . . . . . . . . . . . . . . . . . . 23
Viewing Running Applications on Docker . . . . . . . . . . . . . . . . . . . . . . . . . . . . . . . . . . . . . . . . . . . . . . . . . . . . . . . . . . . . . . . . . . . . . . . . . 24
Monitoring an Application on Kubernetes . . . . . . . . . . . . . . . . . . . . . . . . . . . . . . . . . . . . . . . . . . . . . . . . . . . . . . . . . . . . . . . . . . . . . . . . . . . . . .24
Setting Up BWCE Application Monitoring on Kubernetes . . . . . . . . . . . . . . . . . . . . . . . . . . . . . . . . . . . . . . . . . . . . . . . . . . . . . . . . . .24
Binding BusinessWorks Application to Monitoring Application on Kubernetes . . . . . . . . . . . . . . . . . . . . . . . . . . . . . . . . . . . . . . 27
Viewing Running Applications on Kubernetes . . . . . . . . . . . . . . . . . . . . . . . . . . . . . . . . . . . . . . . . . . . . . . . . . . . . . . . . . . . . . . . . . . . . .29
Viewing Application Monitoring Dashboard . . . . . . . . . . . . . . . . . . . . . . . . . . . . . . . . . . . . . . . . . . . . . . . . . . . . . . . . . . . . . . . . . . . . . . . . . . . . 29
Application Statistics Collection . . . . . . . . . . . . . . . . . . . . . . . . . . . . . . . . . . . . . . . . . . . . . . . . . . . . . . . . . . . . . . . . . . . . . . . . . . . . . . . . . . 31
Monitoring Processes . . . . . . . . . . . . . . . . . . . . . . . . . . . . . . . . . . . . . . . . . . . . . . . . . . . . . . . . . . . . . . . . . . . . . . . . . . . . . 34
Enabling Process Monitoring . . . . . . . . . . . . . . . . . . . . . . . . . . . . . . . . . . . . . . . . . . . . . . . . . . . . . . . . . . . . . . . . . . . . . . . . . . . . . . . . . . . . . . . . . 34
OpenTracing . . . . . . . . . . . . . . . . . . . . . . . . . . . . . . . . . . . . . . . . . . . . . . . . . . . . . . . . . . . . . . . . . . . . . . . . . . . . . . . . . . . . . . 37
Binding BusinessWorks Application to Open Tracing on Cloud Foundry . . . . . . . . . . . . . . . . . . . . . . . . . . . . . . . . . . . . . . . . . . . . . . . . 38
Binding BusinessWorks Application to Open Tracing on Docker . . . . . . . . . . . . . . . . . . . . . . . . . . . . . . . . . . . . . . . . . . . . . . . . . . . . . . . .39
Troubleshooting . . . . . . . . . . . . . . . . . . . . . . . . . . . . . . . . . . . . . . . . . . . . . . . . . . . . . . . . . . . . . . . . . . . . . . . . . . . . . . . . . . 40
4
TIBCO BusinessWorks™ Container Edition Application Monitoring and Troubleshooting

Connecting to the Runtime by using HTTP Client . . . . . . . . . . . . . . . . . . . . . . . . . . . . . . . . . . . . . . . . . . . . . . . . . . . . . . . . . . . . . . . . . . . . . 40
OSGi Commands . . . . . . . . . . . . . . . . . . . . . . . . . . . . . . . . . . . . . . . . . . . . . . . . . . . . . . . . . . . . . . . . . . . . . . . . . . . . . . . . . . . . . . . . . . . . . . . . . . . . 40
5
TIBCO BusinessWorks™ Container Edition Application Monitoring and Troubleshooting

TIBCO Documentation
How to Access TIBCO Documentation
Documentation for TIBCO products is available on the TIBCO Product Documentation website, mainlyin HTML and PDF formats.
The TIBCO Product Documentation website is updated frequently and is more current than any otherdocumentation included with the product. To access the latest documentation, visit https://docs.tibco.com.
Product-Specific Documentation
Documentation for TIBCO products is not bundled with the software. Instead, it is available on theTIBCO Documentation site.
The following documents for this product can be found on the TIBCO Documentation site:
● Concepts
● Installation
● Getting Started
● Application Development
● Bindings and Palettes Reference
● Samples
● Error Codes
● Migration
● Conversion
● REST Implementation
● Application Monitoring and Troubleshooting
● Performance Benchmarking and Tuning
How to Contact TIBCO Support
You can contact TIBCO Support in the following ways:
● For an overview of TIBCO Support, visit http://www.tibco.com/services/support.
● For accessing the Support Knowledge Base and getting personalized content about products you areinterested in, visit the TIBCO Support portal at https://support.tibco.com.
● For creating a Support case, you must have a valid maintenance or support contract with TIBCO.You also need a user name and password to log in to https://support.tibco.com. If you do not have auser name, you can request one by clicking Register on the website.
How to Join TIBCO Community
TIBCO Community is the official channel for TIBCO customers, partners, and employee subject matterexperts to share and access their collective experience. TIBCO Community offers access to Q&A forums,product wikis, and best practices. It also offers access to extensions, adapters, solution accelerators, andtools that extend and enable customers to gain full value from TIBCO products. In addition, users cansubmit and vote on feature requests from within the TIBCO Ideas Portal. For a free registration, go to https://community.tibco.com.
6
TIBCO BusinessWorks™ Container Edition Application Monitoring and Troubleshooting

Application Monitoring Overview
You can run the monitoring component of TIBCO BusinessWorks™ Container Edition on the samecontainer platform where TIBCO BusinessWorks Container Edition applications are running. TIBCOBusinessWorks Container Edition applications can be registered with monitoring application to viewapplication metrics.
When BWCE application registration fails at container startup because of unhealthy monitoringcontainer, the monitoring register mechanism is implemented. To configure monitoring registermechanism, the following properties are used as environment variable:
● BW_APP_MON_REGISTER_ATTEMPTS(#) (Default : 5)
● BW_APP_MON_REGISTER_DELAY(ms) (Default: 5000)
Once the retry count exhausts, the monitoring application does not register and user needs to restartthe container.
To change log levels in application monitoring the following log level is used:
Property name: LOG_LEVEL
For example,
● LOG_LEVEL="debug"
● LOG_LEVEL="error"
● LOG_LEVEL="warning"
● LOG_LEVEL="info"
Health check for monitoring application is verified using the following API: http://host:port/api/v1/monitor/health.
If the monitoring container is healthy it returns 200K, else the returned response is 500 InternalServer Error.
When the monitoring services fails to connect to the database at container startup due to databaseunavailability, the connection retry mechanism is implemented. To configure database retrymechanism, the following properties are used as environment variable:
● DB_RETRY_COUNT : default set to 10
● DB_RETRY_INTERVAL: default set to 10000 ms.
Once the retry count exhausts, the monitoring application crashes automatically.
Application Monitoring on Cloud FoundryYou can simply deploy the BusinessWorks application on cloud foundry and enable the monitoring tomonitor the application. The monitoring dashboard displays the running application details and itsstatistics collection.
To display name from the manifest.yml file instead of application name from EAR file on monitoringdashboard, provide the property DISPLAY_ALIAS: true in monitoring manifest.yml file.
Procedure
1. Run the monitoring application on Cloud Foundry.
7
TIBCO BusinessWorks™ Container Edition Application Monitoring and Troubleshooting

2. Enable the monitoring by registering the TIBCO BusinessWorks™ Container Edition applicationwith the monitoring application by using CUPS or environment variable. Refer EnablingMonitoring on Cloud Foundry.
Configuring MySQL on Cloud FoundryFor persistence support with the monitoring application, you need to configure MySQL with eithermarketplace service or a user-provided service.
Creating Service from Marketplace
1. You can check the services available from the Cloud Foundry Marketplace by running the followingcommand:cf marketplace
2. Run the following command to create a service.cf create-service <SERVICE_NAME> <SERVICE_PLAN> <SERVICE_INSTANCE_NAME>
Define the <SERVICE_INSTANCE_NAME> as bwcemon_mysql
MySQL is now configured with the marketplace service on the Cloud Foundry environment.
Creating User Provided Service for MySQL
1. To create the User Provided Service (CUPS) for MySQL database, run the following command:cf cups <service_instances_name> -p "host,username,password,database"
8
TIBCO BusinessWorks™ Container Edition Application Monitoring and Troubleshooting

MySQL is now configured with the user provided service on the Cloud Foundry environment.
Configuring PostgreSQL on Cloud FoundryFor persistence support with the monitoring application, you can also configure PostgreSQL with user-provided service.
Creating User Provided Service for PostgreSQL
Procedure
● Run the following command to create the user provided service.cf cups <service_instances_name> -p "db_url,db_username,db_password"
Define the <SERVICE_INSTANCE_NAME> as bwcemon_postgres.
PostgreSQL is now configured with the user provided service on the Cloud Foundry environment.
9
TIBCO BusinessWorks™ Container Edition Application Monitoring and Troubleshooting
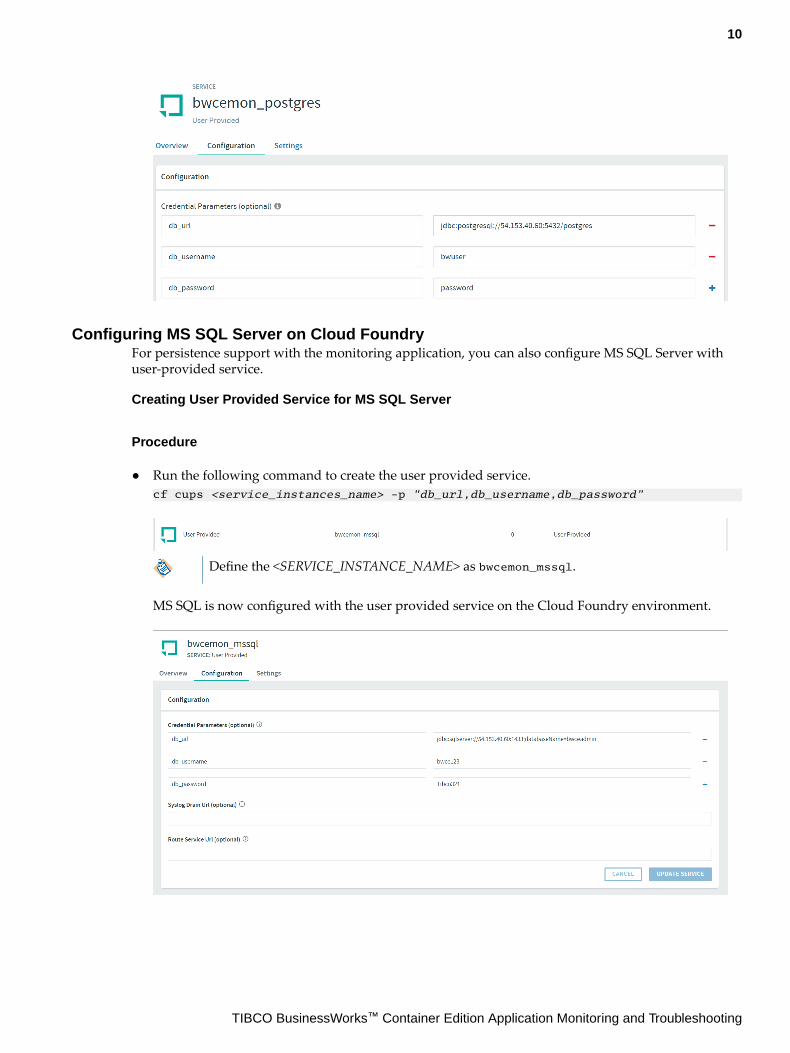
Configuring MS SQL Server on Cloud FoundryFor persistence support with the monitoring application, you can also configure MS SQL Server withuser-provided service.
Creating User Provided Service for MS SQL Server
Procedure
● Run the following command to create the user provided service.cf cups <service_instances_name> -p "db_url,db_username,db_password"
Define the <SERVICE_INSTANCE_NAME> as bwcemon_mssql.
MS SQL is now configured with the user provided service on the Cloud Foundry environment.
10
TIBCO BusinessWorks™ Container Edition Application Monitoring and Troubleshooting

Configuring Oracle on Cloud FoundryFor persistence support with the monitoring application, you need to configure Oracle with eithermarketplace service or a user-provided service.
Creating nodeJs buildpack with Oracle client
Procedure
1. Create a folder on the same level as the create-buildpack-nodejs-oracle.sh file with the namethe folder instantclient.
2. Download Oracle client libraries from https://www.oracle.com/technetwork/topics/linuxx86-64soft-092277.html .
3. Add the zip file to instantclient folder. For example, instantclient-basic-linux.x64-12.2.0.1.0.zip.
4. Open the create-buildpack-nodejs-oracle.sh file and on line 11, point the CLIENT_FILENAMEto the zip file name that is downloaded.
5. On line 19, change the libclntsh.so file name according to client download "ln -s \$build_dir/oracle/lib/libclntsh.so.12.1 \$build_dir/oracle/lib/libclntsh.so" for 18.x and delete line 19.
6. Run the create-buildpack-nodejs-oracle.sh file.This creates the nodejs build pack with oracle clientnodejs-buildpack-master-oracle.zipfile.
7. Upload the build pack to cloud foundry. For example, nodejs-oracle (cf create-buildpack nodejs-oracle nodejs-buildpack-master-oracle.zip 1)
Creating User Provided Service for Oracle
Procedure
● Run the following command to create the user provided service.cf cups <service_instances_name> -p "db_url,db_username,db_password"
Define the <SERVICE_INSTANCE_NAME> as bwcemon_oracle.
Oracle is now configured with the user provided service on the Cloud Foundry environment.
11
TIBCO BusinessWorks™ Container Edition Application Monitoring and Troubleshooting

Configuring Monitoring Application
Procedure
1. Open manifest.yml file and change belowbuildpack: nodejs-oracleservices: -bwcemon_oracle env: PERSISTENCE_TYPE: oracle
2. Push the monitoring application to Cloud Foundrycf push
Setting up TIBCO BusinessWorks™ Container Edition Application Monitoring on CloudFoundry
The following steps describe how to set up TIBCO BusinessWorks Container Edition application on theCloud Foundry.
Prerequisites
1. Ensure that Cloud Foundry Command Line Interface (CLI) is successfully installed and TIBCOBusinessWorks Container Edition buildpack is created and pushed to Cloud Foundry environment.
2. Download the TIBCO BusinessWorks Container Edition monitoring zip file, bwce_mon-<version>.zip from http://edelivery.tibco.com.
3. Ensure that the MySQL, PostgreSQL or MS SQL Server service is created on Cloud Foundry.
Procedure
1. Extract the bwce_mon-<version>.zip file.
2. Navigate to the bwce_mon directory.
3. Bind the service created earlier to the monitoring application. You must configure manifest.yml ofmonitoring application to persist node registry information. You have to specify a database serviceand an environment variable for the MySQL database.
12
TIBCO BusinessWorks™ Container Edition Application Monitoring and Troubleshooting

The environment variable for application monitoring has been changed frompersistence_DB to PERSISTENCE_TYPE.
For PostgreSQL or MS SQL or Oracle database, ensure that the PERSISTENCE_TYPEenvironment variable value is set to postgres or mssql or oracle.
For offline nodejs buildpack uploaded on Pivotal Cloud Foundry, edit the manifest.ymlfile with uploaded buildpack name. Eg: buildpack: nodejs_buildpack
4. Execute cf push -f manifest.yml to push the BWCE monitoring application on cloud foundry.After the BWCE application is running on Cloud Foundry, you can access the URL from a browserand monitor the application.
Binding BusinessWorks Application to Monitoring Application on Cloud FoundryTIBCO BusinessWorks™ Container Edition application can be bound to the monitoring application byusing Create User Provided Service (CUPS) or environment variable.
Using CUPS
You can monitor an application by using Create User Provided Service (CUPS).
Prerequisites
Ensure that you create CUPS for TIBCO BusinessWorks Container Edition monitoring.
Procedure
1. In cf CLI, execute the command cf cups <monitoring_app_name> -p "url".For example: http://comtibcobwcemonitoring.local.pcfdev.io
Ensure that the name of CUPS for monitoring application should be bwce-monitoring.
After the command is executed, you can see the service running on PCF management web UI.
13
TIBCO BusinessWorks™ Container Edition Application Monitoring and Troubleshooting

2. Create the manifest.yml file in the directory where the application EAR file is exported.
The application name displayed on the monitoring dashboard is provided by themanifest.yml file.
3. Add bwce-monitoring as a service in manifest.yml.
4. In cf CLI, run the cf push command to deploy the application on Cloud Foundry. After theapplication is deployed successfully, you can see the service running on PCF management web UI.
After the application is successfully started, the TIBCO BusinessWorks Container Editionapplication gets registered with the monitoring application.
Using an Environment Variable
You can monitor an application by using an environment variable.
Procedure
1. Create a manifest.yml in the same directory where the application EAR file is exported.
2. Set the environment variable to bind monitoring service. Add BW_APP_MONITORING_CONFIG" <url>as environment variable in manifest.yml file.applications: - name: RestBookStoreSample.application memory: 1024M path: tibco.bwce.sample.binding.rest.BookStore.application.ear timeout: 60 buildpack: bw-buildpack env: BW_LOGLEVEL: ERROR BW_APP_MONITORING_CONFIG: "{\"url\":\"http://monitoring.tibcopcf110.com\"}"
14
TIBCO BusinessWorks™ Container Edition Application Monitoring and Troubleshooting

The application name displayed on the monitoring dashboard is provided by themanifest.yml file.
3. In cf CLI, execute the command cf push to deploy the application on the Cloud Foundry.
4. After the application is deployed successfully, you can see the application running on the CloudFoundry management web UI.
User Authentication using Cloud Foundry UAACloud Foundry UAA (User Account and Authentication) is an open source identity server, whichprovides centralized identity management service with a standalone OAuth2 server.
Application monitoring in TIBCO BusinessWorks™ Container Edition helps you to authenticate yourCloud Foundry credentials to access the monitoring URL, and act as an Single Sign-On(SSO) service byusing those credentials. For more details about UAA, see the Pivotel Cloud Foundry documentation.
By default, the value for the AUTHENTICATION_MODE environment variable is set to none in the manifestfile. When set to none, the UAA is disabled for the application monitoring.
Enabling User Account and Authentication for Pivotal Cloud Foundry
You can use User Account and Authentication (UAA) to authenticate the user with their CloudFoundry user credential to access the application monitoring URL.
Prerequisites
Ensure that you have installed Cloud Foundry UAA Command Line Client (UAAC).
Procedure
1. Set the UAA target URL by running the following command:uaac target <UAA server path>
2. To authenticate and obtain an access token for the admin client from the UAA server, run thefollowing command:uaac token owner get
Enter the following details in the console:a) Client ID: Enter the client ID for UAA admin client. By default, the client ID is opsman.
15
TIBCO BusinessWorks™ Container Edition Application Monitoring and Troubleshooting

b) Client Secret: Enter the client secret for UAA. By default, the client secret is nullable.c) Username: Enter the Pivotal Cloud Foundry Ops Manager user name.d) Password: Enter the Pivotal Cloud Foundry Ops Manager password.
3. Create a client for the monitoring application on the UAA server by running the followingcommand:uaac client add <client_ID> --secret <client_secret> --authorities <authorities> --scope <allowed_scope_for_client> --autoapprove <auto_approve> --authorized_grant_types <grant_type_for_authorization_code> --redirect_uri <redirect_URL>
Ensure that the authorization grant type must be authorization_code.
Redirect URL must be in the following format, where <monitoring URL> is the URL for themonitoring application.<monitoring URL>/*
4. Create an user on UAA server by running the following command:uaac user add <username> -p <user_secret> --emails <emailID>
You can use these user credentials to log into the monitoring application.
You can also log into monitoring application using PCF ops manager credentials.
5. Create the Pivotal Cloud Foundry user provided service (CUPS) by configuring the followingCredential Parameter in the Configuration tab of the user provided service:
Ensure that the name of the service must bebwcemon_UAAClient.
Fields Description
client_id Enter the Client ID created in step 3.
client_secret Enter the password of the Client ID created instep 3.
url Ops manager UAA URL.
6. Bind the created user defined service to the monitoring application.
Ensure that the bwcemon_UAAClient service is created and the value for theAUTHENTICATION_MODE environment variable is set to UAA in the manifest file.
16
TIBCO BusinessWorks™ Container Edition Application Monitoring and Troubleshooting

7. After the monitoring application is deployed on Cloud Foundry, access the monitoring URL.
8. Enter the valid UAA user credentials and click SIGN IN to access the monitoring URL.You can log out from the monitoring UI by using the Log Out option available at the upper rightcorner of the monitoring UI.
Viewing Running ApplicationYou can monitor the running application on Cloud Foundry by accessing the routable URL.
Prerequisites
Ensure that the application is deployed on container environment.
Procedure
● Access the routable URL of monitoring application in browser to view the monitoring dashboard.You can view the following details for the running application:
● Application name
● Status of the application
● Version of the application
● Application Instances
17
TIBCO BusinessWorks™ Container Edition Application Monitoring and Troubleshooting

Application Monitoring on DockerYou can run BusinessWorks application on Docker and enable Application Monitoring to monitor theapplication. The monitoring dashboard displays the running application details and applicationstatistics.
Setting Up TIBCO BusinessWorks™ Container Edition Application Monitoring on DockerThe following steps describe how to set up TIBCO BusinessWorks Container Edition application onDocker.
Prerequisites
Download the bwce_mon-<version>.zip TIBCO BusinessWorks™ Container Edition monitoring zipfile, from http://edelivery.tibco.com.
Procedure
1. Extract the bwce_mon-<version>.zip file.
2. Navigate to the bwce_mon directory and build the docker image by running the followingcommand.docker build -t bwce/monitoring:latest .
3. Ensure that MySQL, PostgreSQL or MS SQL Server is running and the user is created with all theprivileges. You can use a standalone Docker to run the monitoring application by passing the twoenvironment variables.a) You must provide the following two environment variables to start the application monitoring
successfully.PERSISTENCE_TYPEDB_URL
b) To run the monitoring application on Docker container, run the following command.For MySQLdocker run -p 8080:8080 -e PERSISTENCE_TYPE="mysql" -e DB_URL="mysql://<user name:password>@<machine:port/database> --name <containerName> <monitoringImageName:tag>
For PostgreSQLdocker run -p 8080:8080 -e PERSISTENCE_TYPE="postgres" -e DB_URL="postgresql://<user name:password>@<machine:port/database> --name <containerName> <monitoringImageName:tag>
For MS SQL Serverdocker run -p 8080:8080 -e PERSISTENCE_TYPE="mssql" -e DB_URL="mssql://<user name:password>@<machine:port/database> --name <containerName> <monitoringImageName:tag>
18
TIBCO BusinessWorks™ Container Edition Application Monitoring and Troubleshooting

4. Run the following command to view the running container.docker ps -a
5. After the monitoring container runs successfully, you can access the monitoring UI by usingfollowing URL in the browser:http://<docker-host-ip>:8080
The environment variable for application monitoring has been changed toPERSISTENCE_TYPE.
Configuring and running monitoring application with Oracle on Docker
You can use Docker to run monitoring application along with the Oracle database on docker.
Procedure
1. Create a folder on the same level as the root directory and name the folder instantclient.
2. Download Oracle client libraries from https://www.oracle.com/technetwork/topics/linuxx86-64soft-092277.html .
3. Add the zip file to instantclient folder. For example, instantclient-basic-linux.x64-12.2.0.1.0.zip.
4. Open the Dockerfile.
1. Comment line number 1
2. Uncomment line number 2, 17, 19-28.
5. On line 19, change the ENV CLIENT_FILENAME according to the client download in step 2.
19
TIBCO BusinessWorks™ Container Edition Application Monitoring and Troubleshooting
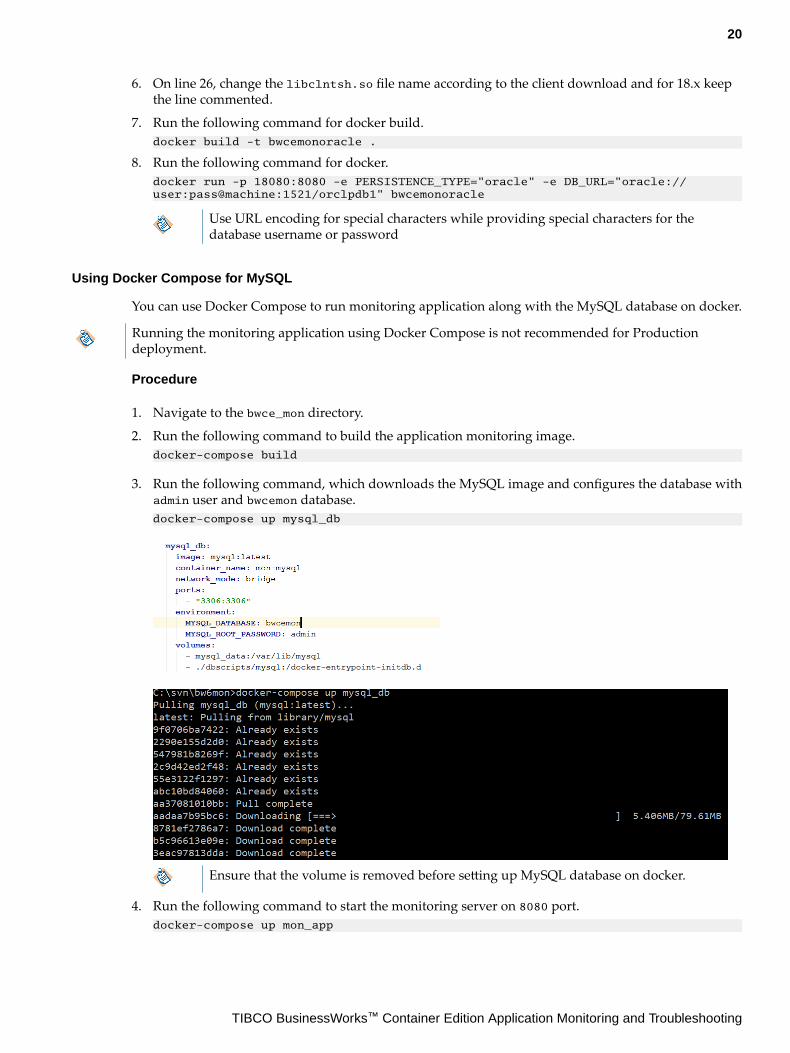
6. On line 26, change the libclntsh.so file name according to the client download and for 18.x keepthe line commented.
7. Run the following command for docker build.docker build -t bwcemonoracle .
8. Run the following command for docker.docker run -p 18080:8080 -e PERSISTENCE_TYPE="oracle" -e DB_URL="oracle://user:pass@machine:1521/orclpdb1" bwcemonoracle
Use URL encoding for special characters while providing special characters for thedatabase username or password
Using Docker Compose for MySQL
You can use Docker Compose to run monitoring application along with the MySQL database on docker.
Running the monitoring application using Docker Compose is not recommended for Productiondeployment.
Procedure
1. Navigate to the bwce_mon directory.
2. Run the following command to build the application monitoring image.docker-compose build
3. Run the following command, which downloads the MySQL image and configures the database withadmin user and bwcemon database.docker-compose up mysql_db
Ensure that the volume is removed before setting up MySQL database on docker.
4. Run the following command to start the monitoring server on 8080 port.docker-compose up mon_app
20
TIBCO BusinessWorks™ Container Edition Application Monitoring and Troubleshooting

Using Docker Compose for PostgreSQL
You can use Docker Compose to run monitoring application along with the PostgreSQL database ondocker.
Procedure
1. Navigate to the bwce_mon directory.
2. Run the following command to build the application monitoring image.docker-compose build
3. Run the following command, which downloads the PostgreSQL image and configures the databasewith admin user and bwcemon database.docker-compose up postgres_db
21
TIBCO BusinessWorks™ Container Edition Application Monitoring and Troubleshooting

Ensure that the volume is removed before setting up PostgreSQL database on docker.
4. Run the following command to start the monitoring server on 8080 port.docker-compose up mon_app
22
TIBCO BusinessWorks™ Container Edition Application Monitoring and Troubleshooting

Binding BusinessWorks Application to Monitoring Application on DockerTIBCO BusinessWorks™ Container Edition application can be bound to the monitoring application byusing the environment variable BW_APP_MONITORING_CONFIG.
Prerequisites
Ensure that the monitoring application is running on the Docker container.
Procedure
1. Create a Dockerfile to deploy TIBCO BusinessWorks Container Edition application on docker. Formore information about creating Dockerfile, see Application Development for Docker in theApplication Development guide.FROM tibco/bwce:latest MAINTAINER Tibco ADD <application name>.ear / EXPOSE 8080
2. Run the Docker terminal and navigate to the directory where the EAR and Docker file are stored.
3. Run the following command to build the application image:docker build -t <application name> .
4. In docker run command, set an environment variable BW_APP_MONITORING_CONFIG to enablemonitoring
5. Run the command in the docker terminal using docker machine IP or using link.a) Using Application Monitoring URL
docker run -d -p 18050:8080 -e BW_APP_MONITORING_CONFIG='{"url":"http://<docker-host-IP>:<port>"}'<appname>:<tag>
For Docker on Windows platform use the BW_APP_MONITORING_CONFIGenvironment variable changes to:'{\"url\":\"http://<docker-host-IP>:8080\"}'
To configure batchsize and publishtimer you can pass additonal parameters:-Dbw.monitor.batchsize=10-Dbw.monitor.publishtimer=15000
batchsize: This property specifies batchsize for the data. Process Monitoring data ispublished in batches
publishtimer: This property specifies the time interval for publishing ProcessMonitoring data.
b) Using Link on Same Docker Hostdocker run --link=<name or id>:alias -p 18080:8080 -e BW_APP_MONITORING_CONFIG='{"url":"http://<alias>:8080"}' <applicationName>
Use of links is deprecated by Docker.
For Docker on Windows platform, the BW_APP_MONITORING_CONFIGenvironment variable changes to:'{\"url\":\"http://<alias>:8080\"}'
23
TIBCO BusinessWorks™ Container Edition Application Monitoring and Troubleshooting

Viewing Running Applications on DockerYou can monitor the running application on Docker by accessing the Docker URL.
Prerequisites
Ensure that the application is deployed on the Docker environment.
Procedure
● Access the url http://<docker-host-ip>:8080 to monitor the application on TIBCOBusinessWorks Container Edition monitoring web UI. You can view the following details for therunning application:
● Application name
● Status of the application
● Version of the application
● Application Instances
Monitoring an Application on KubernetesYou can run BusinessWorks application on Kubernetes and enable Application Monitoring to monitorthe application. The monitoring dashboard displays the running application details and applicationstatistics.
Setting Up BWCE Application Monitoring on Kubernetes
The following steps describe how to set up TIBCO BusinessWorks Container Edition application onKubernetes.
24
TIBCO BusinessWorks™ Container Edition Application Monitoring and Troubleshooting
Prerequisites
Download the bwce_mon-<version>.zip TIBCO BusinessWorks™ Container Edition monitoring zipfile, from http://edelivery.tibco.com.
Procedure
1. Extract the bwce_mon-<version>.zip file.
2. Navigate to the bwce_mon directory and build the docker image by running the followingcommand.docker build -t bwce/monitoring:latest.
3. Tag the monitoring application image by running the following command:docker tag <monitoring_application_name> your_docker_container_registry/<your_project_name>/<monitoring_application_name>
4. Push your monitoring application image to the Docker Container Registry. For example, to pushyour monitoring application docker image on Google Cloud Registry, run the following command:gcloud docker push gcr.io/<your_project_name>/<monitoring_application_name>
5. Confirm that the image is present in the Docker Container Registry.
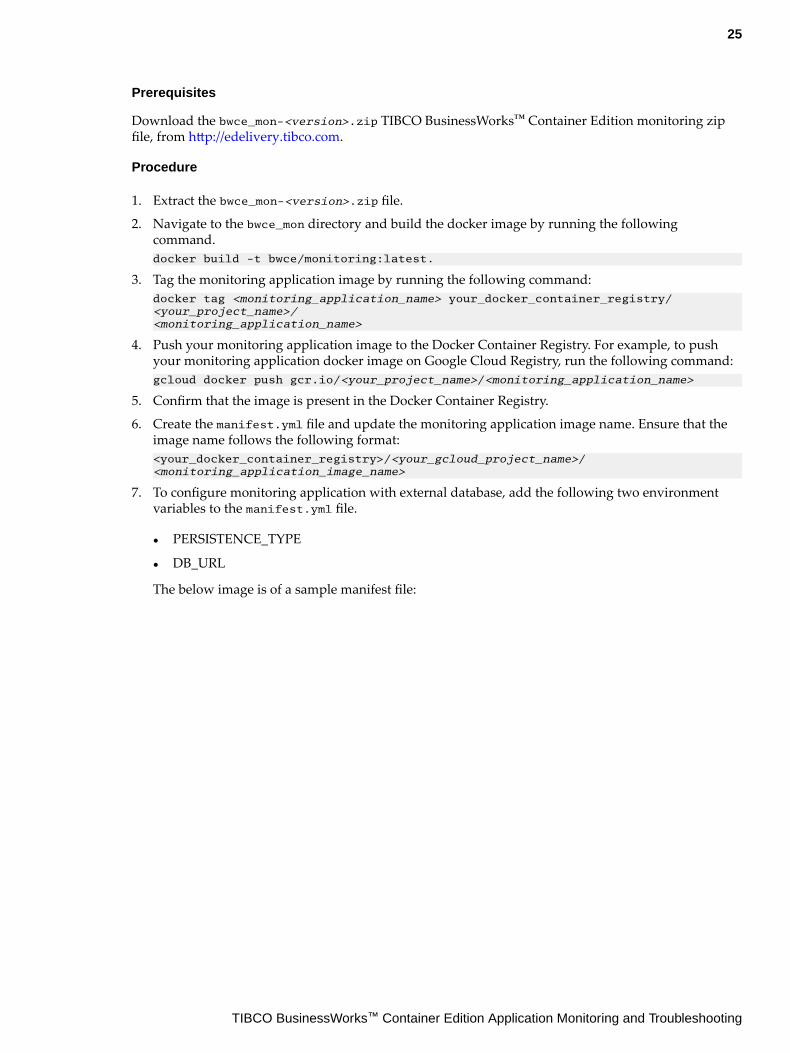
6. Create the manifest.yml file and update the monitoring application image name. Ensure that theimage name follows the following format:<your_docker_container_registry>/<your_gcloud_project_name>/<monitoring_application_image_name>
7. To configure monitoring application with external database, add the following two environmentvariables to the manifest.yml file.
● PERSISTENCE_TYPE
● DB_URL
The below image is of a sample manifest file:
25
TIBCO BusinessWorks™ Container Edition Application Monitoring and Troubleshooting

8. To create the monitoring service and replication controller, run the following command:kubectl create -f manifest.yml
Please find the monitoring sample manifest file for configuring the two environmentvariables.● PERSISTENCE_TYPE
● DB_URL
9. To verify that the monitoring application has started successfully, run the following command:kubectl logs pod-name
10. To get the external IP of running monitoring service, run the following command:kubectl get svc
Access the monitoring dashboard in the browser by using the external IP.
26
TIBCO BusinessWorks™ Container Edition Application Monitoring and Troubleshooting
Binding BusinessWorks Application to Monitoring Application on KubernetesYou can bind TIBCO BusinessWorks Container edition application.
Prerequisites
● Ensure that you have configured the database for application monitoring.
● Ensure that you have created the TIBCO BusinessWorks™ Container Edition base docker image. Formore information about creating base docker image, see Creating TIBCO BusinessWorksContainer Edition base docker image in the Application Development guide.
● Ensure that you have created the TIBCO BusinessWorks™ Container Edition application dockerimage. For more information about building application docker image, see Building the applicationdocker image in the Sample guide.
Procedure
1. Tag the application docker image by running the following command:
docker tag <application_image_name> your_docker_container_registry/<your_project_name>/<application_image_name>
2. Push your application image to the Docker Container Registry.For example: To push your application docker image on Google Cloud Registry, run the followingcommand:
gcloud docker push gcr.io/<your_project_name>/<application_image_name>
3. Confirm that the image is present in the Docker Container Registry.
4. Create the manifest.yml file and update the application image name. Ensure that the image namefollows the following format:
<your_docker_container_registry>/<your_gcloud_project_name>/<image_name>
To configure monitoring application with external database, add the following two environmentvariables to the manifest file and port 80 with monitoring URL.
● BW_APP_MONITORING_CONFIG
● BW_JAVA_OPTS
The below image is of a sample manifest file:
27
TIBCO BusinessWorks™ Container Edition Application Monitoring and Troubleshooting

5. To create the monitoring service and replication controller, run the following command:
kubectl create -f manifest.yml
28
TIBCO BusinessWorks™ Container Edition Application Monitoring and Troubleshooting

6. To verify that the application has started successfully, run the following command:
kubectl logs pod-name
7. To get the external IP of running monitoring service, run the following command:kubectl get svc
Access the monitoring dashboard in the browser by using the external IP.
Viewing Running Applications on KubernetesYou can monitor the running application on Kubernetes by accessing the external IP of running service.
Prerequisites
Ensure the application is deployed on the Kubernetes environment.
Procedure
● Access the web UI of the monitoring application by using the external IP of the running service ofmonitoring application. You can view the following details for the running application:
● Application name● Status of the application● Version of the application● Application Instances
Viewing Application Monitoring DashboardYou can view App Instances, Endpoints and Processes for a running application from the applicationmonitoring dashboard.
Procedure
1. View the application status on the Application page. The monitoring dashboard displays thefollowing information as per grouped in Cloud Foundry spaces:
● Total number of Application Instances, the application instances (container), and runningnumber of instances.
● Application version● REST Doc URL
The REST Doc URL is shown, if the application have swagger endpoint. REST DocURL for docker is an internal endpoint and cannot be access externally. If you areexposing the TIBCO BusinessWorks™ Container Edition application externally, thenthe REST Doc URL can be accessed at http://<External URL>/swagger.
● Number of created jobs, running jobs, faulted jobs, cancelled jobs and scheduled jobs.● To upload or download a logback file click the Upload or Download link, from the monitoring
dashboard.
29
TIBCO BusinessWorks™ Container Edition Application Monitoring and Troubleshooting
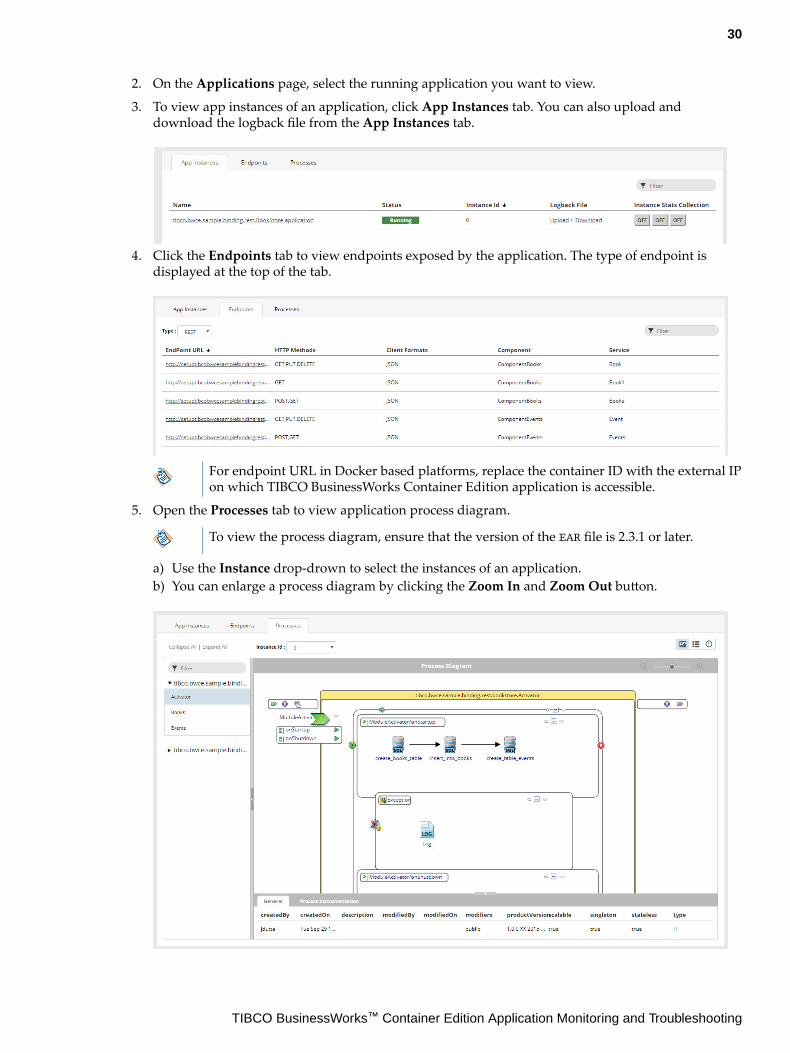
2. On the Applications page, select the running application you want to view.
3. To view app instances of an application, click App Instances tab. You can also upload anddownload the logback file from the App Instances tab.
4. Click the Endpoints tab to view endpoints exposed by the application. The type of endpoint isdisplayed at the top of the tab.
For endpoint URL in Docker based platforms, replace the container ID with the external IPon which TIBCO BusinessWorks Container Edition application is accessible.
5. Open the Processes tab to view application process diagram.
To view the process diagram, ensure that the version of the EAR file is 2.3.1 or later.
a) Use the Instance drop-drown to select the instances of an application.b) You can enlarge a process diagram by clicking the Zoom In and Zoom Out button.
30
TIBCO BusinessWorks™ Container Edition Application Monitoring and Troubleshooting

Application Statistics CollectionApplication statistics collection can be enabled or disabled from the monitoring dashboard by settingthe following property:
Property Description
Process Instrumentation To enable the monitoring of an applicationrunning on multiple app container, click theapplication name and click ON the ProcessInstrumentation property. ProcessInstrumentation statistics is collected for allapplications.
Process Monitor To enable process monitoring click ON to viewthe process instances. This will enable ProcessMonitoring for all the App Instances.
1. The App Stats Collection is ON or OFF, only when all the instances of an application are ON orOFF.
2. The newly registered instance shows the same statistics status as the App Stats Collection status.
3. The change in the App Stats Collection status triggers the same changes in all the instances of thatapplication.
View Process Data
To view process instrumentation data, click an individual process. The process diagram, along withprocess instrumentation data is displayed.
View Activity Data
Select the Processes tab to view the process diagram. From this point you can view the activityinstrumentation data by clicking an activity in the process diagram. You can view the activity
31
TIBCO BusinessWorks™ Container Edition Application Monitoring and Troubleshooting

instrumentation data for all activity by clicking the icon in the upper right corner of the Processestab.
Viewing Application Properties
You can view the application properties of an application along with its value.
32
TIBCO BusinessWorks™ Container Edition Application Monitoring and Troubleshooting

33
TIBCO BusinessWorks™ Container Edition Application Monitoring and Troubleshooting

Monitoring Processes
Using the process monitoring feature you can observe and check the status of process instances fromthe Monitoring UI.
All the process instances in the application are grouped by packages, and you can monitor the status ofthe process instances and subprocesses that were sucessfully executed, cancelled or faulted.
Details such as input data,output data, fault data and other configuration details for the activities arealso available by viewing the process diagram for the instances.
Enabling Process MonitoringProcess Monitoring can be configured by using the environment variable BW_APP_MONITORING_CONFIG.For more information, see Binding BusinessWorks Application to Monitoring Application on Docker or Binding BusinessWorks Application to Monitoring Application on CF or Binding BusinessWorksApplication to Monitoring Application on Kubernetes
To access the process monitoring landing page, go to the Application Level 2 page, navigate to the
Process tab, click the Process Instance icon .
All the instances, processes and subprocesses of the selected application are displayed on the landingpage.
You can begin monitoring your process instances once you enable the Process Monitor button afterdeploying the application.
By default, all the instances in the selected process are displayed.
In the above example, click the process Books. Job data releated to the Books process is displayed in atabular form, and the process diagram of the process is also displayed.
In the Monitoring UI the following details are displayed in the default view.
● Process Instance Id - displays all the (instance ids of the) process instances.
● DurationTime (ms) - displays the total time taken to execute the process instance (in milliseconds)
● EndTime- time when the process instance ended.
34
TIBCO BusinessWorks™ Container Edition Application Monitoring and Troubleshooting

The columns displayed in the default view can also be customized to display additional information
about the process instances. Use the Select Columns filter to add the columns, StartTime andEvalTime (ms).
The other filters provided in Monitoring UI are:
● Job Status filters - Job data can be filtered based on their completion status. Select the icon to
filter the jobs that were completed. The icon, displays only the jobs that were cancelled and
filters the jobs that faulted.
● Filter - This filter searches through the column for any values provided in this filter text boxavailable on that page.
The process diagram and activity details for each process instance is displayed in the extreme rightpanel. Click the process instance in the second panel, and the process diagram for that instance isdisplayed.
The Activity Details tab contains the ActivityName, State, Timestamp, StartTime, DurationTime andEvalTime (ms) of the particular activity selected.
The State of the selected activity can either be Completed, Faulted or Cancelled. If the activity is in aCancelled State, the details of only those activities will be displayed before the Cancelled state in theDetails tab.
The Details tab, Configuration, Input Data and Output Data tabs contain the configuration, input andoutput details of the process instance.
● When a process contains multiple constructors, the activities in the constructor are not visible in theMonitoring UI when the constructor is minimized while creating the EAR file. Expand theconstructors and regenerate the EAR file to view the activities inside constructors.
● Fix any ActivityID related warnings displayed in Studio , and then create the EAR file to ensure thatthe Input and Output data is displayed correctly.
35
TIBCO BusinessWorks™ Container Edition Application Monitoring and Troubleshooting

In the image above, the Ouput Data tab displays the error due to which the process faulted.
36
TIBCO BusinessWorks™ Container Edition Application Monitoring and Troubleshooting

OpenTracing
OpenTracing is an open, vendor neutral standard for distributed systems that can be used to keep trackof the current state of the job.
TIBCO BusinessWorks™ Container Edition supports Jaeger libraries to display span for each activityand process instance during job execution. Span corresponds to a process instance as well as an activityinstance that has information such as ActivityName, JobID, process instance ID etc. For every processinstance, root span is created and all the activity instances are child spans of it.
Trace represents multiple related process instance spans.
In case of HTTP palette, client and server process instances are shown in one trace, whereas for allother palettes, every process instance is a trace.
For more information about Jaeger, see Jaeger documentation.
Configure the following bwengine property in the BW_JAVA_OPTS environment variable while runningthe application to enable and disable OpenTracing at an AppNode level:
● bw.engine.opentracing.enable=true.
By default, the property is false.
Additionally you can configure a few more properties specific to Jaeger.
For obtaining Open Tracing via UDP connection, configure the following Jaeger properties:
Properties Description
JAEGER_SAMPLER_MANAGER_HOST_PORT The host name and port when using the remotecontrolled sampler.
JAEGER_AGENT_HOST The hostname for communicating with agent viaUDP.
JAEGER_AGENT_PORT The port for communicating with agent via UDP
For obtaining Open Tracing via HTTP connection, configure the following Jaeger properties:
Properties Description
JAEGER_SAMPLER_MANAGER_HOST_PORT The host name and port when using the remotecontrolled sampler.
JAEGER_ENDPOINT The traces endpoint, in case the client shouldconnect directly to the Collector. For example,http://<jaeger-collector>:<port>/api/
traces
For more information about the properties, see Configuration via Environment section at github.com.
Currently, the following tags are supported for quering on Jaeger UI.
37
TIBCO BusinessWorks™ Container Edition Application Monitoring and Troubleshooting

Tag Description
SpanInitiator Name of the process starter activity
DeploymentUnitName Name of the application
DeploymentUnitVersion Version of the application
AppnodeName Name of an AppNode on which an applicationis running.
Hostname Name of the machine on which a TIBCOBusinessWorks™ Container Edition applicationis running.
IP IP address
ActivityName Name of an activity in a process
ActivityID Id of an activity
ProcessInstanceId Process instance ID
JobId Job ID of the process.
Binding BusinessWorks Application to Open Tracing on Cloud FoundryYou can enable open tracing on cloud foundry using environment variable.
Prerequisites
Ensure the correct JAEGER agent is running.
Procedure
1. Create a manifest.yml in the same directory where the application EAR file is exported.
2. Add environment variables BW_JAVA_OPTS, JAEGER_AGENT_HOST, JAEGER_AGENT_PORT , andJAEGER_SAMPLER_MANAGER_HOST_PORT in manifest.yml file. The following is a sample of themanifest file:applications: -name: Httpapp memory: 1024M path: httpgreetings.application.ear timeout: 60 buildpack: opentracingenv: BW_LOGLEVEL: ERROR BW_PROFILE: default BW_JAVA_OPTS: "-Dbw.engine.opentracing.enable=true" JAEGER_AGENT_HOST: 18.207.139.80 JAEGER_AGENT_PORT: 6831 JAEGER_SAMPLER_MANAGER_HOST_PORT: 18.207.139.80:5778
3. In cf CLI, execute the command cf push to deploy the application on the Cloud Foundry.
4. After the application is deployed successfully, it is registered under <services> in JAEGER UI.
38
TIBCO BusinessWorks™ Container Edition Application Monitoring and Troubleshooting

Binding BusinessWorks Application to Open Tracing on DockerWe can enable Open Tracing forTIBCO BusinessWorks™ Container Edition application on docker usingthe environment variable BW_JAVA_OPTS, JAEGER_AGENT_HOST, JAEGER_AGENT_PORT, andJAEGER_SAMPLER_MANAGER_HOST_PORT.
Prerequisites
Ensure the correct JAEGER agent is running.
Procedure
1. Create a Dockerfile to deploy TIBCO BusinessWorks Container Edition application on docker. Formore information about creating Dockerfile, see Application Development for Docker in theApplication Development guide.FROM tibco/bwce:latestMAINTAINER TibcoADD <application name>.ear/EXPOSE 8080
2. Run the Docker terminal and navigate to the directory where the EAR and Docker file are stored.
3. Run the following command to build the application image:docker build -t <application name> .
4. In docker run command, set the environment variables BW_JAVA_OPTS, JAEGER_AGENT_HOST,JAEGER_AGENT_PORT , and JAEGER_SAMPLER_MANAGER_HOST_PORT to enable open tracing.
5. Run the command in the docker terminal using docker machine IP or using link.a) docker run -d -p 18050:8080
-e BW_JAVA_OPTS="-Dbw.engine.opentracing.enable=true"-e JAEGER_AGENT_HOST: 18.207.139.80-e JAEGER_AGENT_PORT: 6831-e JAEGER_SAMPLER_MANAGER_HOST_PORT: 18.207.139.80:5778 <application name>
39
TIBCO BusinessWorks™ Container Edition Application Monitoring and Troubleshooting

Troubleshooting
Connecting to the Runtime by using HTTP ClientYou can connect to the TIBCO BusinessWorks™ Container Edition runtime environment by usingHTTP Client. Preferred way of using is Curl.
Procedure
1. Open a terminal window to start an interactive session with the application container.Run the following command Cloud Foundrycf ssh <application_name>
Run the following command on Dockerdocker exec -it <container_id> bash
2. Execute the following OSGi commang in the container terminal window in the following format:curl -v localhost:8090/bw/framework.json/osgi?command=<osgi_command>
For Example:
● To print information about BWEngines:curl -v http://localhost:8090/bw/framework.json/osgi?command=le
● To pause all jobs of TIBCO BusinessWorks Container Edition applications:curl -v http://localhost:8090/bw/framework.json/osgi?command=pauseapp%20-v%201.0%20tibco.bw.sample.binding.rest.BookStore.application
OSGi CommandsYou can run commands to gather data about running AppNodes and applications. For moreinformation, see Using HTTP Client to Connect to the Runtime.
Command Reference
● To view all commands, usecurl -v http://localhost:8090/bw/framework.json/osgi?command=help
● To view command syntax, usecurl -v http://localhost:8090/bw/framework.json/osgi?command=help%20<command_name>
40
TIBCO BusinessWorks™ Container Edition Application Monitoring and Troubleshooting

For example,curl -v http://localhost:8090/bw/framework.json/osgi?command=help%20pauseapp
The following table lists some of the commands.
OSGi Commands
Command Description
bw:dsr Diagnoses shared resource issues.
bw:geticon Tests for availability of BW activity icons with a given ID andtype.
bw:lais Retrieves statistics for activities that have been executed in one ofthe processes for the application.
bw:lapi Retrieves information about active process instances for theapplication.
bw:las Lists all instantiated activities.
bw:lat Lists all registered activity types.
bw:lbwes Lists all subscribers that are currently listening to BW statisticsevents.
bw:le Prints information about BW engines.
bw:lec Prints information about BW engine configurations.
bw:lendpoints Lists endpoints exposed by the BW engine.
bw:les Lists all instantiated EventSources.
bw:lmetrics Prints job metrics for application(s) running on the AppNode.
bw:lpis Prints statistics of one of the processes that have been executed forthe application.
bw:lr Lists all resource details.
bw:lrhandlers Lists all resource handlers.
bw:lrproxies Lists all resource proxies.
bw:startesc Starts collection of execution statistics for a given entity (activity/process) for application(s).
bw:stopesc Stops execution statistics collection of given entity (process/activity) for application(s).
bw:startpsc Starts collection of process statistics for application(s).
41
TIBCO BusinessWorks™ Container Edition Application Monitoring and Troubleshooting

Command Description
bw:stoppsc Stops collection of process statistics for application(s).
bw:lapis Prints summary of active process instance.
frwk:appnodeprocessinfo Prints information about AppNode system processes.
frwk:dc Delete a configuration with a given PID.
frwk:dc Delete all configurations.
frwk:la Print information about all applications.
frwk:lap Print all application properties.
frwk:lb List installed bundles matching a substring.
frwk:lb List all installed bundles.
frwk:lcfg Print all CAS configuration details.
frwk:lp Print information about all known BW Processes.
frwk:ll Print information about all libraries.
frwk:lloggers Print all loggers currently configfured on the AppNode.
frwk:lp Print information about all known BW Processes.
frwk:pauseapp Stop the process starters and their bindings and pause all jobs of aBW Application.
frwk:resumeapp Start the process starters and their bindings and resume all jobs ofa BW Application.
frwk:setloglevel Sets the log level for a given logger.
frwk:startcomps Start all process starters and their bindings of a BW Application.
frwk:startps Start the process starters of a BW Application.
frwk:stopps Stop the process starters of a BW Application.
frwk:stopapp Stop an Application gracefully.
frwk:td Print a full thread dump.
To run some of the statistics retrieval commands such as lapi, you must first run the startpscstatistics activation command.
42
TIBCO BusinessWorks™ Container Edition Application Monitoring and Troubleshooting
Related Documents