Odne S. Burheim Department of Chemistry, NTNU, 7491 Trondheim, Norway e-mail: [email protected] Jon G. Pharoah 1 Fuel Cell Research Centre, Queens University, Kingston, ON, Canada K7L 3N6 e-mail: [email protected] Hannah Lampert RWTH Aachen University, 52074 Aachen, Germany e-mail: [email protected] Preben J. S. Vie IFE, 2027 Kjeller, Norway e-mail: [email protected] Signe Kjelstrup Department of Chemistry, NTNU, 7491 Trondheim, Norway e-mail: [email protected] Through-Plane Thermal Conductivity of PEMFC Porous Transport Layers We report the through-plane thermal conductivities of the several widely used carbon porous transport layers (PTLs) and their thermal contact resistance to an aluminum polarization plate. We report these values both for wet and dry samples and at different compaction pressures. We show that depending on the type of PTL and the existence of residual water, the thermal conductivity of the materials varies from 0.15 W K 1 m 1 to 1.6 W K 1 m 1 , one order of magnitude. This behavior is the same for the contact resistance varying from 0.8 m 2 KW 1 to 11 10 4 m 2 KW 1 . For dry PTLs, the ther- mal conductivity decreases with increasing polytetrafluorethylene (PTFE) content and increases with residual water. These effects are explained by the behavior of air, water, and PTFE in between the PTL fibers. It is also found that Toray papers of differing thickness exhibit different thermal conductivities. DOI: 10.1115/1.4002403 Keywords: thermal conductivity, PTL, GDL, fuel cell, PEMFC 1 Introduction As both modeled 1–3 and experimentally measured 4,5, the operating proton exchange membrane fuel cell PEMFC is not isothermal. This is due to the fact that virtually all of the heat is generated in the membrane electrode assembly MEA, which is literally insulated by carbon PTLs. In order to achieve effective control of cooling of fuel cells, knowledge of the through-plane thermal conductivity of these materials is vital. Measurement of the thermal conductivity of PTL materials is complicated for several reasons. A The in-plane thermal conduc- tivity is likely to be different from the through-plane 6–8. B The through-plane thermal conductivity, the thermal contact resis- tance 1 / h, and the thickness change with the applied compaction pressure 9. C Residual water in the pores significantly changes both the thermal conductivity and the thermal contact resistance 9. Therefore, care must be taken when measuring the thermal conductivity of PTLs. Several theoretical approaches have been made to calculate the thermal conductivities of PTL materials. Ramousse et al. 10 es- timated minimum and maximum thermal conductivities of carbon papers based on a previously developed model 7, connecting the thermal resistances of the solid and gas phases in parallel series, according to the Maxwell model. Sadeghi et al. 8 developed an analytical model to predict thermal conductivity from the materi- als structure, simplified by assuming a basic repeating cell struc- ture. The first in situ experimental results for the through-plane ther- mal conductivity were reported by Vie and Kjelstrup 4, giving a thermal conductivity of 0.19 0.05 W K -1 m -1 for an ETEK ELAT PTL. The experiments were carried out by inserting ther- mocouples inside the fuel cell, and results were obtained from a simplified thermal model. The relatively large thermocouples in- creased the uncertainty in the temperature gradient determination in these measurements. The first ex situ experiments of thermal resistance were reported by Ihonen et al. 11, giving the thermal impedance including both the bulk material and the apparatus contact resistance of compressed PTLs SIGRACET GDL 10-BC and Carbel CL. Khandelwal and Mench 12 reported the first ex situ measurements of PTL materials with a perspective on mea- suring the thermal conductivities and their thermal contacts to the apparatus, but the in situ thickness was not taken into consider- ation. This work also proposed that PTFE impairs the through- plane conductivity of PTLs. Ramousse et al. 10 used a similar approach. Their apparatus applied copper plates at the end of each cylinder, sandwiching the investigated sample. Using this experi- mental setup, different PTL materials provided by Toray three different thicknesses and SIGRACET were tested by measuring the thermal resistance of stacks of samples. The PTL bulk through-plane thermal conductivity was estimated based on the assumption that the PTL contact to the apparatus corresponded to a layer as thick as a fiber of 5–10 m and that the thermal con- ductivity of this layer would have to be between the values of carbon and air. However, Ramousse et al. did not consider the in situ thickness at applied compaction pressures. The first experi- mental report giving all of the three parameters required by Fou- rier’s law as a function of compaction pressures was that of Burheim et al. 9. In addition, the contact resistance toward the apparatus was accurately determined. We report here for the first time the through-plane conductivity along with the thermal contact resistance to a polarization plate for several different common PTL materials, both dry and contain- ing liquid water, following the procedure described in Ref. 9. 2 Experimental and Modeling Section 2.1 presents the experimental procedure, while Sec. 2.2 summarizes the thermal model used to give context to the data. 1 Corresponding author. Contributed by Advanced Energy Systems Division of ASME for publication in the JOURNAL OF FUEL CELL SCIENCE AND TECHNOLOGY. Manuscript received: July 1, 2010 final manuscript received: August 6, 2010 published online December 1, 2010 Editor: Nigel M. Sammes. Journal of Fuel Cell Science and Technology APRIL 2011, Vol. 8 / 021013-1 Copyright © 2011 by ASME Downloaded 01 Dec 2010 to 130.15.73.89. Redistribution subject to ASME license or copyright; see http://www.asme.org/terms/Terms_Use.cfm

Welcome message from author
This document is posted to help you gain knowledge. Please leave a comment to let me know what you think about it! Share it to your friends and learn new things together.
Transcript

1
oiglct
ctTtpb�c
ttptaaat
mtE
t2E
J
Downlo
Odne S. BurheimDepartment of Chemistry,
NTNU,7491 Trondheim, Norway
e-mail: [email protected]
Jon G. Pharoah1
Fuel Cell Research Centre,Queens University,
Kingston, ON, Canada K7L 3N6e-mail: [email protected]
Hannah LampertRWTH Aachen University,52074 Aachen, Germany
e-mail: [email protected]
Preben J. S. VieIFE,
2027 Kjeller, Norwaye-mail: [email protected]
Signe KjelstrupDepartment of Chemistry,
NTNU,7491 Trondheim, Norway
e-mail: [email protected]
Through-Plane ThermalConductivity of PEMFC PorousTransport LayersWe report the through-plane thermal conductivities of the several widely used carbonporous transport layers (PTLs) and their thermal contact resistance to an aluminumpolarization plate. We report these values both for wet and dry samples and at differentcompaction pressures. We show that depending on the type of PTL and the existence ofresidual water, the thermal conductivity of the materials varies from 0.15 W K�1 m�1 to1.6 W K�1 m�1, one order of magnitude. This behavior is the same for the contactresistance varying from 0.8 m2 K W�1 to 11�10�4 m2 K W�1. For dry PTLs, the ther-mal conductivity decreases with increasing polytetrafluorethylene (PTFE) content andincreases with residual water. These effects are explained by the behavior of air, water,and PTFE in between the PTL fibers. It is also found that Toray papers of differingthickness exhibit different thermal conductivities. �DOI: 10.1115/1.4002403�
Keywords: thermal conductivity, PTL, GDL, fuel cell, PEMFC
IntroductionAs both modeled �1–3� and experimentally measured �4,5�, the
perating proton exchange membrane fuel cell �PEMFC� is notsothermal. This is due to the fact that virtually all of the heat isenerated in the membrane electrode assembly �MEA�, which isiterally insulated by carbon PTLs. In order to achieve effectiveontrol of cooling of fuel cells, knowledge of the through-planehermal conductivity of these materials is vital.
Measurement of the thermal conductivity of PTL materials isomplicated for several reasons. �A� The in-plane thermal conduc-ivity is likely to be different from the through-plane �6–8�. �B�he through-plane thermal conductivity, the thermal contact resis-
ance �1 /h�, and the thickness change with the applied compactionressure �9�. �C� Residual water in the pores significantly changesoth the thermal conductivity and the thermal contact resistance9�. Therefore, care must be taken when measuring the thermalonductivity of PTLs.
Several theoretical approaches have been made to calculate thehermal conductivities of PTL materials. Ramousse et al. �10� es-imated minimum and maximum thermal conductivities of carbonapers based on a previously developed model �7�, connecting thehermal resistances of the solid and gas phases in parallel series,ccording to the Maxwell model. Sadeghi et al. �8� developed annalytical model to predict thermal conductivity from the materi-ls� structure, simplified by assuming a basic repeating cell struc-ure.
The first in situ experimental results for the through-plane ther-al conductivity were reported by Vie and Kjelstrup �4�, giving a
hermal conductivity of 0.19�0.05 W K−1 m−1 for an ETEKLAT PTL. The experiments were carried out by inserting ther-
1Corresponding author.Contributed by Advanced Energy Systems Division of ASME for publication in
he JOURNAL OF FUEL CELL SCIENCE AND TECHNOLOGY. Manuscript received: July 1,010 final manuscript received: August 6, 2010 published online December 1, 2010
ditor: Nigel M. Sammes.ournal of Fuel Cell Science and TechnologyCopyright © 20
aded 01 Dec 2010 to 130.15.73.89. Redistribution subject to ASME
mocouples inside the fuel cell, and results were obtained from asimplified thermal model. The relatively large thermocouples in-creased the uncertainty in the temperature gradient determinationin these measurements. The first ex situ experiments of thermalresistance were reported by Ihonen et al. �11�, giving the thermalimpedance including both the bulk material and the apparatuscontact resistance of compressed PTLs �SIGRACET GDL 10-BCand Carbel CL�. Khandelwal and Mench �12� reported the first exsitu measurements of PTL materials with a perspective on mea-suring the thermal conductivities and their thermal contacts to theapparatus, but the in situ thickness was not taken into consider-ation. This work also proposed that PTFE impairs the through-plane conductivity of PTLs. Ramousse et al. �10� used a similarapproach. Their apparatus applied copper plates at the end of eachcylinder, sandwiching the investigated sample. Using this experi-mental setup, different PTL materials provided by Toray �threedifferent thicknesses� and SIGRACET were tested by measuringthe thermal resistance of stacks of samples. The PTL bulkthrough-plane thermal conductivity was estimated based on theassumption that the PTL contact to the apparatus corresponded toa layer as thick as a fiber of 5–10 �m and that the thermal con-ductivity of this layer would have to be between the values ofcarbon and air. However, Ramousse et al. did not consider the insitu thickness at applied compaction pressures. The first experi-mental report giving all of the three parameters required by Fou-rier’s law as a function of compaction pressures was that ofBurheim et al. �9�. In addition, the contact resistance toward theapparatus was accurately determined.
We report here for the first time the through-plane conductivityalong with the thermal contact resistance to a polarization platefor several different common PTL materials, both dry and contain-ing liquid water, following the procedure described in Ref. �9�.
2 Experimental and ModelingSection 2.1 presents the experimental procedure, while Sec. 2.2
summarizes the thermal model used to give context to the data.
APRIL 2011, Vol. 8 / 021013-111 by ASME
license or copyright; see http://www.asme.org/terms/Terms_Use.cfm

pRstTwctcTtrrts
atntfi
tiwtwdtm
Ttr
tpP
0
Downlo
2.1 Measurement Procedure. The apparatus used in the ex-eriments is depicted in Fig. 1 and is described in greater detail inef. �9�. The thermal conductivity apparatus was designed to mea-
ure the variables that appear in Fourier’s law, i.e., the heat flux,he thickness, and the temperature drop over the sample thickness.he heat flux is measured on each side of the sample, togetherith the temperature drop over the sample and the thickness of the
ompressed material as used in Eq. �1�. Next, the thermal resis-ance of the sample stack and its contact to the apparatus werealculated from the heat flux and the measured temperature drop,4-T5. Our previous report showed that the thermal contact resis-
ance between two PTLs is negligible compared with the thermalesistance of a PTL and also compared with the thermal contactesistance between a PTL and the apparatus �6�. We also employhe same procedure as before to obtain reproducible residual wateraturation in the PTLs.
The thermal contact resistance between the samples and thepparatus was separated from the thermal conductivity by plottinghe total measured thermal resistance as a function of stack thick-ess and performing linear regression. Two times the thermal con-act resistance between a PTL and the apparatus �Al surface� wasound where the line crosses the ordinate. The thermal conductiv-ty is equal to the inverse slope of this line �9�.
The measurements were carried out at three different compac-ion pressures, 4.6 bars, 9.3 bars, and 13.9 bars. Liquid water wasntroduced by sucking water through the PTLs for 20–30 s. Thisas done as indicated in Fig. 1�b�. The water volume fraction of
he pore volume, s, in the PTLs was measured by comparing theeight of the PTLs before the measurements to the weight afterrying them after the measurements. The PTL water content, s, ishus the water volume fraction of the PTL pore volume. Each
aterial gave different water contents by this procedure,
qupper = ksteelT1 − T3
l1–3, qlower = ksteel
T6 − T8
l6–8qsample =
qupper + qlower
2
�1�he scanning electron microscopy �SEM� micrographs were ob-
ained using a Hitachi S-3400N ran in SE mode. The porosityeported is based on weight and thickness measurements.
2.2 Modeling the Temperature Distribution in PEMFC. Ahermal model �3� was used to compare how different PTLs trans-ort heat produced in the MEA, depending on PTL thickness and
Hot waterIntlet stream
Cold water
Aluminuim
Steel
Thermo-couples
1234
Thermo-couples
5678
Outlet
InsuTub
zsample0000
Tm
a)
Fig. 1 „a… The left figure depicts tthermal properties reported, while „bPTLs were exposed to water. The apously †9‡.
TL through-plane thermal conductivity. A brief summary is
21013-2 / Vol. 8, APRIL 2011
aded 01 Dec 2010 to 130.15.73.89. Redistribution subject to ASME
given.With reference to Fig. 2, the model considers steady state heat
conduction in the y- and x-directions. The heat sources in themodel are a function of the local current density, which is as-sumed to originate from parallel gas flow channels and hydrogen/air operation. The current profile was represented by a cosinefunction with the highest current density ten times the lowest andcentered on the gas channel �the lowest current density is thencentered on the rib/land where y=0�. This assumption for thecurrent density distribution has support from both modeling �6,13�and experimental work �14�. The data and parameters used in themodel are specified in Table 1.
The model was originally used with thermal conductivities ofcomponents provided by SolviCore and DuPont �3�. Here, wereplace the SolviCore PTLs with the ones in this report and usethe model to compare these materials. The electrochemical over-potential was �c=0.5+0.07 ln�j / jo� V in the cathode as measuredin our laboratory �15�. All the reversible heat to be generated wasallocated to the cathode, in agreement with Ref. �16�. Table 1gives the applied thermal and electric conductivities of the com-
ple
suring Arms
am
g
0000
nessrement
Water
PTLs
Sealing
Suction
b)
apparatus used for measuring thee setup to the right depicts how theratus to the left was reported previ-
L
AirH2
AlB.P.P
AlB.P.P
PTLPTL
MPL
MEMBRANE
CATHODE
ANODE
y
x
MPL
Fig. 2 The geometry used for the modeling in this report. The
Sam
Mea
stre
latinehickeasu
he… thpa
model is thoroughly described elsewhere †3‡.
Transactions of the ASME
license or copyright; see http://www.asme.org/terms/Terms_Use.cfm

ptcopt
=tec
tptp
3
cdpotmt
Rcg
Rc
T
J
Downlo
onents in this model. Due to uneven compaction pressure fromhe polarization plate flow fields, we model kPTL,through-plane as aosine function, where the thermal conductivity under the middlef the land corresponds to the values obtained at a 9.3 bar com-action pressure, and the center under the channels corresponds tohe values obtained at a 4.6 bar compaction pressure.
The boundary conditions used were Dirichlet conditions �Tout80°C� along the y-axis at the edges and insulating conditions at
he x-axis edges. As can be seen from Table 1, the model consid-rs the thermal conductivities to be independent of temperatureonsistent with the small temperature range investigated.
In using this thermal model here, we are mainly interested inhe different temperature profiles arising from the different PTLroperties of thickness and thermal conductivity. Other aspects ofhe thermal model and possible thermal scenarios are presentedreviously �3�.
ResultsWe report the through-plane thermal conductivity and thermal
ontact resistance of several different dry and wetted PTLs atifferent compaction pressures at room temperature. When com-aring the different materials, we refer to the k/Z ratio as the ratiof the PTL through-plane thermal conductivity divided by itshickness. This is the coefficient of heat transfer for the given
aterial, hi, and is helpful in characterizing the relative tempera-ure difference between the MEA and the flow field plate.
Table 1 Dimensions and properti
���m
egions of heatonduction andeneration
Membrane 50Cathode layer 20
Anode layer 20
egions of heatonduction
MPL 50Dry PTL, through-plane
Dry PTL, in-plane W=PTL-pol. plate Th. cont. resist 1
Air
able 2 Dimensions and thermal properties of Toray PTL pape
Compactionpressure
�bar�Thickness Z
��m�
DryPorosity
�%�RPTL-Al�
�10−4 m2 K W−1�
4.6 172�7 77�1 3.2�0.99.3 165�6 76�1 2.2�0.5
13.9 159�6 76�1 2.0�0.1
Dry4.6 275�6 78�1 3.5�0.89.3 265�5 77�1 2.7�0.5
13.9 256�3 77�1 2.0�0.5
Dry4.6 345�5 77�1 3.5�0.99.3 333�3 76�1 2.6�0.5
13.9 322�3 75�1 1.9�0.3
ournal of Fuel Cell Science and Technology
aded 01 Dec 2010 to 130.15.73.89. Redistribution subject to ASME
We give first the carbon paper results, then the carbon felt re-sults, and at last the results where the water content levels couldnot be repeated within each material. We distinguish between car-bon papers as one group and carbon felts and cloths as a secondgroup by saying that stiff hard and brittle materials are carbonpapers while soft and flexible materials are carbon felts/cloths.Finally, in the Appendix, we give a table of all the measuredthermal conductivities and contact resistances reported from ourmeasurements.
3.1 Carbon Papers. In this section, we report carbon paperPTLs from three manufacturers: Toray, SIGRACET, and Solvi-Core. In general, we shall see that introducing PTFE to the mate-rial will lead to decreased through-plane thermal conductivity,while the presence of residual water will increase the through-plane thermal conductivity. We were able to obtain reproduciblewater content and thus residual water PTL thermal conductivitiesonly for the carbon papers containing no or very little PTFE.Accordingly, the results for papers containing PTFE and water arepresented separately in Sec. 3.3.
3.1.1 Toray. Toray PTLs are available in different thicknesses.The material is also available with different PTFE contents, indi-cated by the term “% wet proof.” In this section, we present firstthe different thickness variations and next the different PTFEcontents.
Table 2 presents recorded dimensions and thermal properties ofthree different Toray TGP-H PTLs: 060, 090, and 120. The ther-
onsidered for the model in Fig. 2
k�W K−1 m−1� Electric heat sources
0.216 � /S m−1=8.70.5 �c /V=0.5+0.07 ln�j /1 A cm−2�
�S /J K−1 mol−1=3260.5 �a /V=0.1
j /A cm−2=1−0.8 cos� ·y ·10−3�
0.5�k�,9.3 bars+k�,4.6 bars� /2+ �k�,9.3 bars−k�,4.6 bars� /2·cos� ·y ·10−3�
10·k�,4.6 bars
RAl-PTL�0.024
at room temperature „5% wet proof and different thicknesses…
oray TGP-H-060 �5% wet proof�
Residual waterk�,PTL
�W K−1 m−1�s
�%�RPTL-Al�
�10−4 m2 K W−1�k�,PTL
�W K−1 m−1�
0.41�0.03 68�7 1.2�0.7 1.6�0.30.53�0.03 71�7 1.0�0.3 1.6�0.20.66�0.01 75�8 0.8�0.4 1.6�0.2
oray TGP-H-090 �5% wet proof�Residual water
0.50�0.02 61�8 1.2�0.2 1.4�0.10.65�0.02 71�2 1.3�0.2 1.5�0.10.73�0.03 70�4 0.7�0.2 1.4�0.1
oray TGP-H-120 �5% wet proof�Residual water
0.62�0.03 31�6 1�2 1.4�0.50.81�0.03 32�6 0.9�0.8 1.4�0.30.89�0.02 34�6 0.8�0.4 1.4�0.1
es c
�
103
rs
T
T
T
APRIL 2011, Vol. 8 / 021013-3
license or copyright; see http://www.asme.org/terms/Terms_Use.cfm

mdbPTspfctttiaacfi
dac
aHag=1
Fv
0
Downlo
al conductivity data are also plotted in Fig. 3 �dry�, while Fig. 4epicts SEM micrographs of the three different materials. It cane seen that the thermal conductivity increases with increasingTL thickness, while the porosity1 is approximately the same.here is hardly any visual difference between the three papers, yettructural differences must explain the variations in the through-lane thermal conductivity as the porosity is more or less the sameor the three products. This finding is consistent with recent X-rayomputed tomography �CT� investigations �17�, showing thathere are porosity variations throughout the thickness of these ma-erials. In fact, it appears that the thicker materials are manufac-ured by combining multiple layers of a thinner material resultingn a reduced porosity at each interface. This is a significant result,s it indicates a lack of homogeneity, independent of compression,t a scale that should be accounted for when considering thermalonditions in these materials and highlights the challenges of de-ning thermal conductivities in composite materials.At approximately 9 bar compaction pressure, the k/Z ratios of
ry 060, 090, and 120 are 3.2 kW K−1 m−2, 2.5 kW K−1 m−2,nd 2.4 kW K−1 m−2. The through-plane thermal conductivity in-reases with increasing compaction pressure, while the thermal
1From the tables reporting on the porosity of PTLs, one can see that the thicknessppear to change significantly more than the porosity. Take, for instance, the TGP--120 in Table 2. While the thickness �correspondingly total volume� is lowered by
pproximately 6%, the porosity changes only by 3%. The volume of the graphite isiven by the sample weight and the graphite density �0.0593 g /2.1�0.1 g cm−3
27�1 mm3�. The volumes of the entire disk of PTL are 119�2 mm3,15�1 mm3, and 111�1 mm3 at 4.6 bars, 9.3 bars, and 13.9 bars, respectively.
Applied Pressure [bar]
ThermalConductivity[W/mK]
2 4 6 8 10 12 14 160
0.1
0.2
0.3
0.4
0.5
0.6
0.7
0.8
0.9
1
TGP-60-DRYTGP-90-DRYTGP-120-DRY
ig. 3 „Dry… Variation in measured thermal conductivity witharying paper thickness. All materials had 5% PTFE.
Fig. 4 SEM micrographs of PTLs. From left: Toray TGP-
21013-4 / Vol. 8, APRIL 2011
aded 01 Dec 2010 to 130.15.73.89. Redistribution subject to ASME
contact thermal decreases with increasing compaction pressure.This is qualitatively in agreement with previous work �9�. Thevariation with compaction pressure differs between the three PTLproducts, however. This further supports the idea that there arestructural differences between the materials depicted in Fig. 4.The estimated porosity reported in Table 2 is in agreement withthe specification sheets �18�.
Figure 5 �wet� presents the same thermal conductivity data withaddition of the same materials in the presence of residual watersaturation. It is clear from the figure that the presence of liquidwater increases the thermal conductivity by up to a factor of 4 andremoves the dependence of thermal conductivity on applied pres-sure. This will be further discussed in Sec. 4.1.
Table 3 presents the through-plane thermal conductivity andresistance of TGP-H-090 with different PTFE loadings of 5%,10%, and 60%, while the thermal conductivity data are plotted inFig. 6 �PTFE�. SEM micrographs of the three samples are shownin Fig. 7. Whereas the thickness is more or less the same for thesepapers, 250–270 �m, the porosity decreases as the PTFE loadingincreases. Teflon and carbon have similar densities �approximately2.1�0.1 g cm−3�, so the weight and thickness measurement rep-resent the actual porosity to a good approximation, though thegraphite used for these materials have been reported to be some-what smaller �19�. The PTFE is clearly evident in Fig. 7 in thecase of the 60% PTFE loading. The PTFE content is also reflectedin the estimated porosity, dropping from 77% to 50%. In general,the thermal conductivity decreases with increasing PTFE loading.It is also clear from Fig. 6 �PTFE� that the dependence of thermal
Applied Pressure [bar]
ThermalConductivity[W/mK]
2 4 6 8 10 12 14 160
0.5
1
1.5
2
2.5 TGP-60-DRYTGP-90-DRYTGP-120-DRYTGP-60-WETTGP-90-WETTGP-120-WET
Fig. 5 „Wet… Variation in measured thermal conductivity in thepresence of residual water saturation
H-060, TGP-H-090, and TGP-H-120—all 5% wet proof.
Transactions of the ASME
license or copyright; see http://www.asme.org/terms/Terms_Use.cfm

cPad
5
FP
J
Downlo
onductivity on compaction pressure is reduced at the highestTFE loading. In the case of a 9.3 bar compaction pressure, theddition of a large amount of PTFE results in more than a 50%ecrease in the thermal conductivity.
Table 3 also presents the measured thermal conductivity of the% wet proof paper in the presence of residual water. The 5%
Table 3 Dimensions and thermal properties of Toray TGP-H
Compactionpressure
�bar�Thickness Z
��m�
DryPorosity
�%�RPTL-Al�
�10−4 m2 K W−1�
4.6 275�6 78�1 3.5�0.89.3 265�5 77�1 2.7�0.5
13.9 256�3 77�1 2.0�0.5
Toray TGP-H-090 10% w4.6 269�4 76�1 3.3�1.19.3 261�5 75�1 2.6�0.5
13.9 253�5 74�1 2.0�0.3
Toray TGP-H-090 60% w4.6 273�7 52�1 5.2�2.39.3 268�5 52�1 3.9�1.7
13.9 264�5 51�1 3.1�1.4
Applied Pressure [bar]
ThermalConductivity[W/mK]
2 4 6 8 10 12 14 160
0.2
0.4
0.6
0.8
1
TGP-90-5% PTFETGP-90-10%PTFETGP-120-60% PTFE
ig. 6 „PTFE… Variation in measured thermal conductivity withTFE loading. All substrates are TP-90.
Fig. 7 SEM. Micrographs of, from the left, Toray T
ournal of Fuel Cell Science and Technology
aded 01 Dec 2010 to 130.15.73.89. Redistribution subject to ASME
PTFE loading retains 70% residual water and has a thermal con-ductivity five times higher than the dry paper with a 60% PTFEloading.
3.1.2 SIGRACET. The SIGRACET GDL AA is a PTL, whichis not treated with PTFE while SIGRACET GDL BA is a PTLcontaining 5 wt % PTFE. The measured properties are given inTable 4, and SEM micrographs are given in Fig. 8, AA to the leftand BA to the right. It is clear from the figure that the SIGRACETmaterials have a radically different structure from the Toray ma-terials in that the fibers are no longer straight. The k/Z ratios at 9bars are 1.4 kW K−1 m−2, 1.3 kW K−1 m−2, and3.0 kW K−1 m−2 for the dry AA, BA, and wetted AA, respec-tively. Again, the through-plane thermal conductivity decreaseswith increasing PTFE content and increases with water content.An observation worth a comment is that while the Toray 5% wetproof could be repeatable wetted, SGL BA could not.
3.1.3 SolviCore. The through-plane thermal conductivities ofthe SolviCore PTL were previously reported �9� but are includedhere in Table 5 for comparison. The SEM micrograph was notshown earlier. This material readily retains residual water. Thisobservation indicates that the PTFE content is most likely low,though the charging in the SEM micrograph in Fig. 9 indicatesthat there may be some PTFE. The fibers are straight, as can beseen from the micrograph in Fig. 9. The thermal conductivityincreases with increasing compaction pressure and increasing wa-ter content. The k/Z ratios at 9.3 bar are 1.4�0.3 kW K−1 m−2
and 2.1�0.3 kW K−1 m−2 for the dry and wet samples, respec-tively. Even though the SolviCore PTL and the SIGRACET PTLshave very different carbon fiber structures, their through-plane
0 papers at room temperature „different wet proof abilities…
Toray TGP-H-090 5% wet proof
Residual waterk�,PTL
�W K−1 m−1�s
�%�RPTL-Al�
�10−4 m2 K W−1�k�,PTL
�W K−1 m−1�
0.50�0.02 61�8 1.2�0.2 1.4�0.10.65�0.02 71�2 1.3�0.2 1.5�0.10.73�0.03 70�4 0.7�0.2 1.4�0.1
proof0.48�0.030.60�0.020.69�0.02
proof0.28�0.030.30�0.030.32�0.02
-09
et
et
GP-H-090—5%, 10%, and 60% wet proof PTLs
APRIL 2011, Vol. 8 / 021013-5
license or copyright; see http://www.asme.org/terms/Terms_Use.cfm

tpcm
fbahccstAsi
ei
C
C
0
Downlo
hermal conductivities are similar. This is interesting in light ofredictions from a model of Danes and Bardon �7�, that fiberurvature structure differences could result in through-plane ther-al conductivity variations of a factor of 6 �e.g., 0.2 and 1.4�.
3.2 Carbon Cloths and Felts. The carbon felts are again dif-erent from carbon papers. Cloths are produced by wavingundles of fibers such that there is porosity within the bundles anddiffering pore structure between the bundles. Felts, on the other
and, are generally made from shorter carbon fibers. In bothases, the resulting product is much less brittle than the papers andan be bent, folded, and rolled without fracturing. In addition, asupported by neutron imaging �20�, the behavior of liquid water inhese materials is substantially different than in the case of papers.ccordingly, we were not able to saturate these materials to the
ame degree as the papers. This is interesting as they flood moren the neutron imaging �20�.
3.2.1 E-TEK. A classical PTL material used in many fuel cellxperiments is the E-TEK carbon cloth, depicted in Fig. 10 withts well known woven structure. As presented in Table 6, the ther-
Table 4 Dimensions and thermal pro
ompactionpressure
�bar�Thickness Z
��m�
DryPorosity
�%�RPTL-Al�
�10−4 m2 K W−1�
4.6 301�15 87�1 4.8�1.69.3 275�17 84�2 3.9�1.6
13.9 246�15 84�2 2.5�1.8
SIGRACET GDL 104.6 288�12 85�1 7.2�3.89.3 244�8 83�1 4.3�2.1
13.9 210�6 81�1 3.2�1.8
Table 5 Thermal conductiv
ompactionpressure
�bar�Thickness Z
��m�
DryPorosity
�%�RPTL-Al�
�10−4 m2 K W−1�
4.6 221–309 83�2 2.1�0.69.3 215–295 83�2 1.8�0.8
13.9 206–285 83�2 1.1�0.3
Fig. 8 SEM micrographs of the SIGRACET GDL AAPTFE, respectively
21013-6 / Vol. 8, APRIL 2011
aded 01 Dec 2010 to 130.15.73.89. Redistribution subject to ASME
mal conductivity varies little with changes in compaction pressurethough the thickness does. Accordingly, the k/Z ratio does varywith compaction, being 1.3 kW K−1 m−2, 1.6 kW K−1 m−2, and1.9 kW K−1 m−2 at 4.6 bars, 9.3 bars, and 13.9 bars, respectively.
3.2.2 Freudenberg FCCT. The Freudenberg H2315 is a car-bon felt available with and without added PTFE. The fiber struc-ture is similar to the one of the SIGRACET, as can be seen inFigs. 8 and 11. Except for the smaller porosity the PTFE treatmentintroduces no other difference, as can be seen from Table 7. It isinteresting to note that for this material, the thermal conductivitydoes not appear to be either a function of PTFE loading or ofcompaction pressure. This is also the material with the lowestmeasured through-plane thermal conductivity. The k/Z ratio is0.8 kW K−1 m−2.
3.3 Residual Water. As has been mentioned, some of thematerials with PTFE loadings were not amenable to reproducibleresults with regard to the water content. Therefore, we give onlythe results obtained at 9.3 bar compaction pressure, as they were
ties of SIGRACET PTL carbon papers
SIGRACET GDL 10 AA
Residual waterk�,PTL
�W K−1 m−1�s
�%�RPTL-Al�
�10−4 m2 K W−1�k�,PTL
�W K−1 m−1�
0.30�0.02 66�11 0.3�5.0 0.7�0.30.38�0.03 72�126 0.5�2.0 0.83�0.140.42�0.04 83�15 0.6�1.2 0.87�0.10
0.26�0.030.30�0.020.33�0.03
s of the SolviCore PTL †9‡
SolviCore PTL
Residual waterk�,PTL
�W K−1 m−1�s
�%�RPTL-Al�
�10−4 m2 K W−1�k�,PTL
�W K−1 m−1�
0.27�0.03 24�3 0.98�0.7 0.45�0.010.36�0.08 25�3 0.7�0.5 0.54�0.030.40�0.04 26�3 0.5�0.7 0.57�0.06
t… and BA „right… PTLs containing 0 wt % and 5 wt %
per
BA
itie
„lef
Transactions of the ASME
license or copyright; see http://www.asme.org/terms/Terms_Use.cfm

rdmtr
tdwvSas
Tc
Fp
J
Downlo
epresentative of the other pressures in that if the dry conductivityecreased by, e.g., 5%, then so did the wet conductivity. The totaleasured resistance is for �21 mm disks of material, and this
otal resistance includes two contacts to the apparatus and theesistance of the stack of materials.
3.3.1 Carbon Papers With Random Water Contents. It is likelyhat the differences in the behavior of water in these materials areue both to the PTFE loading and to the location of the PTFEithin the materials. Figure 12 presents the total sample resistanceersus the thickness for the Toray-H-090 10% wet proof and theIGRACET 10-BA material both for the case of a dry materialnd for the cases with residual water. The measured water content,, is noted in each case in the figure. While the Toray TGP-H-090
able 6 Dimensions and thermal properties of the E-TEK PTLarbon cloth
Compactionpressure
�bar�Thickness Z
��m�
E-TEK EC-CC1-060
Porosity �%�
RPTL-Al��10−4 m2 K W−1�
k�,PTL�W K−1 m−1�
4.6 211�9 72�1 5.2�2.3 0.28�0.039.3 184�11 69�1 3.9�1.7 0.30�0.03
13.9 170�11 66�1 3.1�1.4 0.32�0.02
ig. 9 A SEM micrograph SolviCore PTL untreated carbonaper
Fig. 10 A SEM micrograph of the E-TEK EC-CC1-060
ournal of Fuel Cell Science and Technology
aded 01 Dec 2010 to 130.15.73.89. Redistribution subject to ASME
10% wet proof paper achieves water content, s, of more than 17%,the SIGRACET GDL 10 BA only obtains a value of 10% or less.In addition, the low water contents in the SIGRACET materials donot substantially change the resistance, while the resistance is sig-nificantly reduced in the case of the Toray material.
3.3.2 Carbon Cloths, Felts and Papers With Varying WaterContent. The total resistances of stacks of E-TEK EC-CC1-060PTL are shown for dry and wet pieces in Fig. 13. The watercontent is indicated for the wetted samples. It can be seen that oneof the samples is fully soaked as the estimated water content valueis 104% �this number is obviously wrong and illustrates the un-certainty related to the determination of these values�.
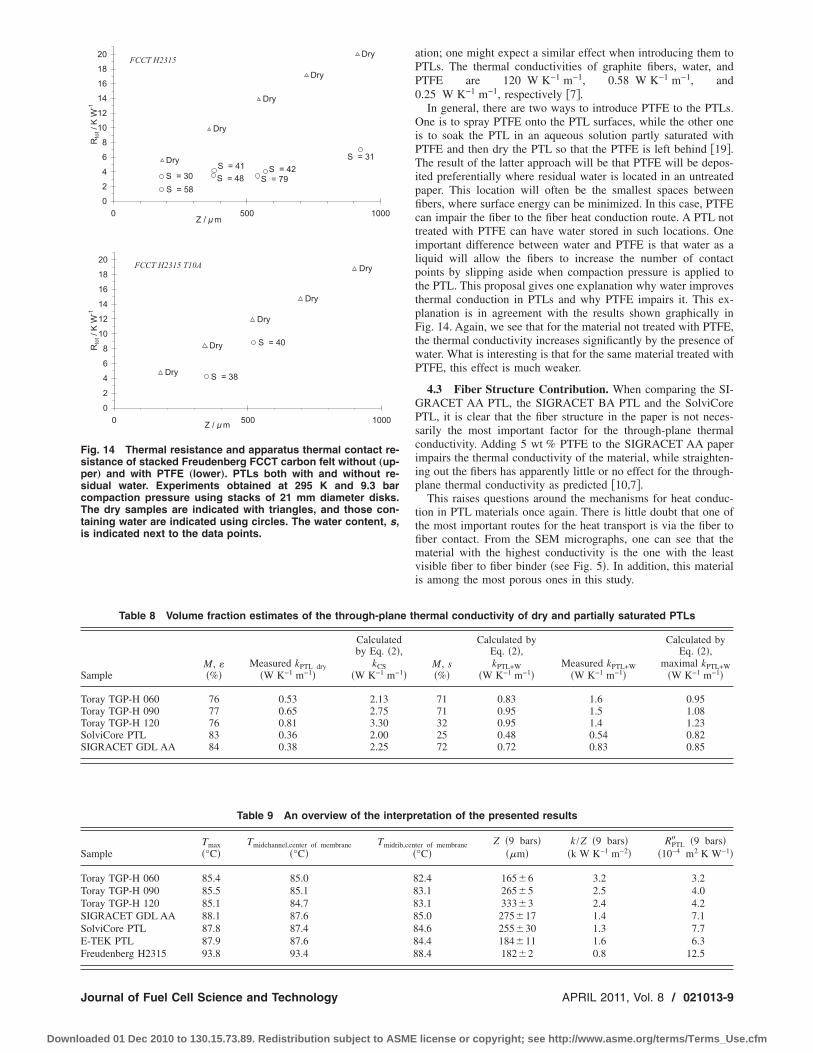
Similar results for the FCCT H2315 papers with and withoutPTFE are presented in Fig. 14. It appears that water has a strongerimpact in reducing the total measured thermal resistance whenPTFE is not present. This indicates that PTFE impairs thethrough-plane heat transfer also when water is present. This is animportant observation, which shall be discussed more thoroughlyin Secs. 4.1 and 4.2.
4 Discussion
4.1 Water Contribution. The results clearly show that thepresence of residual liquid water increases the through-plane ther-mal conductivity of the PTL. Historically, volume averaging hasbeen used to determine the effective conductivity of compositematerials such as these, and it is illustrative to compare the mea-sured results with such volume averages. This averaging shouldconsider a contribution from air in the pores �kair=0.025 W K−1 m−1�, another from the solid materials �carbon,PTFE, and binders, collectively referred to as kCS� and if present acontribution from liquid water �kwater=0.58 W K−1 m−1�. Thus, ifa volume average model is applicable, the thermal conductivity ofa PTL with residual water should be equal to the sum of thethermal conductivities weighted by their volume fractions, asshown in
k�,PTL =s
100·
100· kwater + �1 −
100� · kCS
+ �1 −s
100� ·
100· kair �2�
where s is the liquid water content and is the porosity. This isexplored in Table 8, where the conductivity of the solid material,kCS, is extracted from the measured dry value and the measuredporosity. This value is then used in Eq. �2� to predict the conduc-
Fig. 11 A SEM micrograph of the Freudenberg FCCT H2315carbon cloth
tivity for a given water content, s. If one consider a fully soaked
APRIL 2011, Vol. 8 / 021013-7
license or copyright; see http://www.asme.org/terms/Terms_Use.cfm

Pptauirifmrhataia
C
FsPtuict
0
Downlo
TL, i.e., s=100%, one obtains what we refer to as the maximalrediction, meaning that this is the largest thermal conductivityhat can be predicted by replacing air with water in the volumeverage estimate. It is clear from Table 8 that the volume averagenderpredicts the measured value in all cases, and significantly son the case of Toray papers. This result strongly suggests that theesidual water is preferentially located at the intersection of thendividual fibers, which is to be expected in minimizing the sur-ace energy. In the case of dry materials, the fiber to fiber contactust play a significant role in the thermal resistance, and this
esistance is greatly diminished by the presence of the relativelyigh conductivity water at precisely these contact locations. Thislso serves to explain why the dry papers exhibit a decreasinghermal contact resistance with increasing compaction pressuress additional fiber to fiber contacts are made. In other words, heats almost solely conducted via the fiber to fiber contact, and waterssists in this process by being present as droplets in these regions
Table 7 Dimensions and thermal pro
ompactionpressure
�bar�
FCCT H2315
Thickness Z��m�
Porosity �%�
RPTL-Al��10−4 m2 K W−1�
k�
�W K
4.6 190�3 75�1 11.1�5.5 0.149.3 182�2 74�1 8.8�4.6 0.15
13.9 177�2 70�1 7.9�4.0 0.15
Toray TGP-H-090 10% Wet Proof
Dry
Dry
Dry
DryS = 43S = 17S = 22
0
1
2
3
4
5
6
7
8
9
0 500 1000 1500Z / �m
Rtot/K
W-1
Sigracet GDL 10-BA
Dry
Dry
Dry
Dry
Dry
S = 8
S = 10
S = 5
S = 1
0
2
4
6
8
10
12
0 500 1000Z / �m
Rtot/KW-1
14
ig. 12 Thermal resistance and apparatus thermal contact re-istance of Toray „upper… and SIGRACET „lower… PTLs treatedTFE both with and without residual water. Experiments ob-
ained at approximately 295 K and 9.3 bar compaction pressuresing stacks of 21 mm diameter disks. The dry samples are
ndicated with triangles, and those containing water are indi-ated using circles. The water content, s, is indicated next to
he data points.21013-8 / Vol. 8, APRIL 2011
aded 01 Dec 2010 to 130.15.73.89. Redistribution subject to ASME
or cracks.This observation is important to FC modelers. In the first in-
stance, the thermal conductivity is appreciably higher in the fuelcell environment, as liquid water will almost certainly be present.In fact, several papers suggest that water tends to cluster and onlybe present in liquid form in specific regions in the fuel cells�21–23�, typically under the ribs next to the flow fields. This mightsuggest that different thermal conductivities should be employedin these different regions. It should, of course, be noted that thesmall amounts of water present at each fiber intersection may notbe resolved in neutron imaging, and perhaps the higher value isappropriate throughout the PTL.
The volume average estimates shown in Table 8 give a quanti-tative study of the effect that water has on the through-plane ther-mal conductivity of PTLs and are therefore unique in that sense.We were able to make this estimate because some of the materialswere amenable to give reproducible water contents. Some of theother materials, presented graphically in Sec. 3.3, did not showsuch behavior. However, we observed two clear trends. The firstone is in agreement with the results summarized in Table 9, wherethe thermal resistance of the stack and the contact to the apparatusis significantly lowered by the presence of residual water. Thesecond observation is that PTFE treatment of the PTL seems tolower the impact water has in reducing the thermal resistance ofthe PTL stack and the contact to the apparatus. This observationwas made from Fig. 14 and shall be further discussed in Sec. 4.2.
4.2 PTFE Contribution. From the results shown in Tables 3and 4 , one can see that the presence of PTFE clearly lowers thethermal conductivity of the dry PTLs. This has been reported pre-viously by Khandelwal and Mench �12�. What is surprising andseems a contradiction is that water and PTFE have opposite ef-fects on the through-plane thermal conductivity of the PTLs. Tak-ing the thermal conductivity of water and PTFE into consider-
ties of Freudenberg PTL carbon cloth
FCCT H2315 T10A �PTFE 10 wt %�
−1�Thickness Z
��m�Porosity
�%�RPTL-Al�
�10−4 m2 K W−1�k�,PTL
�W K−1 m−1�
.02 184�6 72�1 7.8�2.1 0.15�0.01
.02 175�5 71�1 6.2�2.1 0.15�0.01
.02 170�5 70�1 4.9�1.5 0.16�0.01
ETEK EC-CC1-060
Dry
Dry
Dry
Dry
Dry
S = 69S = 62
S = 60 S = 1040
2
4
6
8
10
0 500 1000Z / �m
Rtot/KW-1
Fig. 13 Thermal resistance and apparatus thermal contact re-sistance of stacked E-TEK EC-CC1-060 carbon cloth withoutPTFE. PTLs both with and without residual water. Experimentsobtained at 295 K and 9.3 bar compaction pressure usingstacks of 21 mm diameter disks. The dry samples are indicatedwith triangles, and those containing water are indicated usingcircles. The water content, s, is indicated next to the data
per
,PTL−1 m
�0�0�0
points.
Transactions of the ASME
license or copyright; see http://www.asme.org/terms/Terms_Use.cfm
S
TTTSS
S
TTTSSEF
FspscTtis indicated next to the data points.
Journal of Fuel Cell Science and Technology
Downloaded 01 Dec 2010 to 130.15.73.89. Redistribution subject to ASME
ation; one might expect a similar effect when introducing them toPTLs. The thermal conductivities of graphite fibers, water, andPTFE are 120 W K−1 m−1, 0.58 W K−1 m−1, and0.25 W K−1 m−1, respectively �7�.
In general, there are two ways to introduce PTFE to the PTLs.One is to spray PTFE onto the PTL surfaces, while the other oneis to soak the PTL in an aqueous solution partly saturated withPTFE and then dry the PTL so that the PTFE is left behind �19�.The result of the latter approach will be that PTFE will be depos-ited preferentially where residual water is located in an untreatedpaper. This location will often be the smallest spaces betweenfibers, where surface energy can be minimized. In this case, PTFEcan impair the fiber to the fiber heat conduction route. A PTL nottreated with PTFE can have water stored in such locations. Oneimportant difference between water and PTFE is that water as aliquid will allow the fibers to increase the number of contactpoints by slipping aside when compaction pressure is applied tothe PTL. This proposal gives one explanation why water improvesthermal conduction in PTLs and why PTFE impairs it. This ex-planation is in agreement with the results shown graphically inFig. 14. Again, we see that for the material not treated with PTFE,the thermal conductivity increases significantly by the presence ofwater. What is interesting is that for the same material treated withPTFE, this effect is much weaker.
4.3 Fiber Structure Contribution. When comparing the SI-GRACET AA PTL, the SIGRACET BA PTL and the SolviCorePTL, it is clear that the fiber structure in the paper is not neces-sarily the most important factor for the through-plane thermalconductivity. Adding 5 wt % PTFE to the SIGRACET AA paperimpairs the thermal conductivity of the material, while straighten-ing out the fibers has apparently little or no effect for the through-plane thermal conductivity as predicted �10,7�.
This raises questions around the mechanisms for heat conduc-tion in PTL materials once again. There is little doubt that one ofthe most important routes for the heat transport is via the fiber tofiber contact. From the SEM micrographs, one can see that thematerial with the highest conductivity is the one with the leastvisible fiber to fiber binder �see Fig. 5�. In addition, this materialis among the most porous ones in this study.
ermal conductivity of dry and partially saturated PTLs
M, s�%�
Calculated byEq. �2�,kPTL+W
�W K−1 m−1�Measured kPTL+W
�W K−1 m−1�
Calculated byEq. �2�,
maximal kPTL+W�W K−1 m−1�
71 0.83 1.6 0.9571 0.95 1.5 1.0832 0.95 1.4 1.2325 0.48 0.54 0.8272 0.72 0.83 0.85
etation of the presented results
ter of membrane°C�
Z �9 bars���m�
k /Z �9 bars��k W K−1 m−2�
RPTL� �9 bars��10−4 m2 K W−1�
2.4 165�6 3.2 3.23.1 265�5 2.5 4.03.1 333�3 2.4 4.25.0 275�17 1.4 7.14.6 255�30 1.3 7.74.4 184�11 1.6 6.38.4 182�2 0.8 12.5
Table 8 Volume fraction estimates of the through-plane th
ampleM, �%�
Measured kPTL dry�W K−1 m−1�
Calculatedby Eq. �2�,
kCS�W K−1 m−1�
oray TGP-H 060 76 0.53 2.13oray TGP-H 090 77 0.65 2.75oray TGP-H 120 76 0.81 3.30olviCore PTL 83 0.36 2.00IGRACET GDL AA 84 0.38 2.25
Table 9 An overview of the interpr
ampleTmax�°C�
Tmidchannel,center of membrane�°C�
Tmidrib,cen�
oray TGP-H 060 85.4 85.0 8oray TGP-H 090 85.5 85.1 8oray TGP-H 120 85.1 84.7 8IGRACET GDL AA 88.1 87.6 8olviCore PTL 87.8 87.4 8-TEK PTL 87.9 87.6 8reudenberg H2315 93.8 93.4 8
FCCT H2315
Dry
Dry
Dry
Dry
Dry
S = 58S = 30 S = 79S = 48
S = 42S = 41S = 31
0
2
4
6
8
10
12
14
16
18
20
0 500 1000Z / �m
Rtot/KW-1
FCCT H2315 T10A
Dry
Dry
Dry
Dry
Dry
S = 40
S = 38
0
2
4
6
8
10
12
14
16
18
20
0 500 1000Z / �m
Rtot/KW-1
ig. 14 Thermal resistance and apparatus thermal contact re-istance of stacked Freudenberg FCCT carbon felt without „up-er… and with PTFE „lower…. PTLs both with and without re-idual water. Experiments obtained at 295 K and 9.3 barompaction pressure using stacks of 21 mm diameter disks.he dry samples are indicated with triangles, and those con-
aining water are indicated using circles. The water content, s,
APRIL 2011, Vol. 8 / 021013-9
license or copyright; see http://www.asme.org/terms/Terms_Use.cfm

rbomrptgsrWptcuBtdpc
5
crcwts�
tpsTtmatr
lw
tct
T9
TTTTTSSSEFF
0
Downlo
4.4 Thermal Conductivity and Thickness. One of the pa-ameters frequently used in Sec. 3 of this chapter is the ratioetween the thickness and the through-plane thermal conductivityf a PTL. The k/Z ratio gives a fair comparison between theaterials’ ability to cool the fuel cell in the 1D perspective, the
egion under the land. The results in Table 9 show this. The heatroduced under the channel is conducted via the in-plane route inhe PTL; therefore, decreasing the thickness may not be such aood idea after all. We now use with the 2D thermal model de-cribed in Sec. 2.2, using the parallel flow channel imposed cur-ent density profile �increased j under the channel�, channel width,
, 1 mm, for all the materials presented in this study. The in-lane thermal conductivity is set to be ten times the through-planehermal conductivity, and the through-plane thermal conductivityorresponds to 4.6 bars underneath the center of channel and 9.3nderneath the center of the rib/land having a sine dependency.ased on these model results and the assumption that the in-plane
hermal conductivity is ten times the through-plane thermal con-uctivity, it is possible to say that the k/Z ratio offers a fair com-arison between the materials’ ability to cool all the regions in theell—both under the land and the gas channels.
ConclusionsThe through-plane thermal conductivities for several commer-
ially available PTLs are reported along with their thermal contactesistance to aluminum. These numbers are reported at differentompaction pressures, with and without residual liquid water andith different Teflon content. Through-plane thermal conductivi-
ies between 0.15 W K−1 m−1 and 1.6 W K−1 m−1 were mea-ured. The contact resistance varied between 0.7
10−4 K m2 W−1 and 11�10−4 K m2 W−1.Additional liquid water in the PTLs was found to increase the
hrough-plane thermal conductivity more than what should be ex-ected from a volume average estimation. This effect was ob-erved to be strongest in the absence of PTFE in the PTL material.his supports the suggestion that water improves the thermal con-
act between the fibers rather than a random improvement in theaterial. As PTFE lowers the through-plane thermal conductivity
nd is present between the PTL fibers, we conclude that it is inhis manner that PTFE impairs the heat transfer in the PTL mate-ial.
The carbon fiber structure and orientation were found to haveess impact on the thermal conductivity of the PTL compared withater, binder, and PTFE content.Finally, as evidenced by the various thicknesses of Toray paper,
here can be a lack of homogeneity through the thickness of aarbon paper, and this could be important for understanding the
able 10 Measured thickness, thermal contact resistance, and.3 bar and 13.9 bar compaction pressures
Thickness Z��m�
RP��10−4 m
oray TGP-H-060 �5% wet proof� 165–159 2.0oray TGP-H-090 �5% wet proof� 256–265 2.0oray TGP-H-090 �10% wet proof� 253–261 2.0oray TGP-H-090 �10% wet proof� 264–268 3.1oray TGP-H-120 �5% wet proof� 322–333 1.9IGRACET GDL 10 AA 246–275 2.5IGRACET GDL 10 BA 210–244 3.2olviCore PTL �9� 215–285 1.1-TEK EC-CC1-060 170–184 3.1CCT H2315 177–182 4CCT H2315 T10A �10 wt % PTFE� 170–175 4
hermal conditions.
21013-10 / Vol. 8, APRIL 2011
aded 01 Dec 2010 to 130.15.73.89. Redistribution subject to ASME
AcknowledgmentThe Norwegian Research Council is acknowledged for financial
support, Grant No. 164466/S30.
Nomenclature
Roman Lettershi � coefficient of heat transfer=1 /Ri�=ki /Z
�W K−1 m−2�ki � thermal conductivity �W K−1 m−1�l � distance between thermocouples �M�s � water volume fraction of PTL pore volumeq � heat flux �W m−2�
Ai � area m2
Ri � thermal resistance=Ri� /Ai �K W−1�Ri� � thermal resistance=Z /ki �m2 K W−1�
Z or l � thickness of stack when measured
Greek Letters� � thickness/length �m /�m� � porosity �volume fraction�� � electrochemical overpotential �V�
Appendix: Data SummaryTable 10 presents a summary of the thermal conductivities and
contact resistances reported in this paper.
References�1� Kjelstrup, S., and Røsjorde, A., 2005, “Local and Total Entropy Production
and Heat and Water Fluxes in a One-Dimensional Polymer Electrolyte FuelCell,” J. Phys. Chem. B, 109, pp. 9020–9033.
�2� Bapat, C. J., and Thynell, S. T., 2007, “Anisotropic Heat Conduction Effects inProton-Exchange Membrane Fuel Cells,” ASME J. Heat Transfer, 129, pp.1109–1118.
�3� Pharoah, J. G., and Burheim, O., 2010, “On the Temperature Distribution inPolymer Electrolyte Fuel Cells,” J. Power Sources, 195, pp. 5235–5245.
�4� Vie, P. J. S., and Kjelstrup, S., 2004, “Thermal Conductivities From Tempera-ture Profiles in the Polymer Electrolyte Fuel Cell,” Electrochim. Acta, 49, pp.1069–1077.
�5� He, S., Mench, M. M., and Tadigadapa, S., 2006, “Thin Film TemperatureSensor for Real-Time Measurement of Electrolyte Temperature in a PolymerElectrolyte Fuel Cell,” Sens. Actuators, A, 125, pp. 170–177.
�6� Pharoah, J. G., Karan, K., and Sun, W., 2006, “On Effective Transport Coef-ficients in PEM Fuel Cell Electrodes: Anisotropy of the Porous TransportLayers,” J. Power Sources, 161, pp. 214–224.
�7� Danes, F., and Bardon, J.-P., 1997, “Conductivité thermique des feutres decarbone, isolants à forte anisotropie: Modèle de conduction par la phase solide�Thermal Conductivity of the Carbon Felts, Strongly Anisotropic Insulants:Modelling of Heat Conduction by Solid Phase,” Rev. Gen. Therm., 36, pp.302–311.
�8� Sadeghi, E., Bahrami, M., and Djilali, N., 2008, “Analytic Determination of
rough-plane thermal conductivity of the measured materials at
Dry Residual water
lW−1�
k�,PTL�W K−1 m−1�
RPTL-Al��10−4 m2 K W−1�
k�,PTL�W K−1 m−1�
2 0.53–0.66 0.8–1.0 1.67 0.65–0.73 0.7–1.3 1.56 0.60–0.699 0.30–0.326 0.81–0.89 0.8–0.9 1.49 0.38–0.42 0.5–0.6 0.83–0.873 0.30–0.338 0.36–0.40 0.5–0.7 0.54–0.579 0.30–0.32
0.14–0.160.14–0.17
th
TL-A2 K
–2.–2.–2.–3.–2.–3.–4.–1.–3.–12–10
the Effective Thermal Conductivity of PEM Fuel Cell Gas Diffusion Layers,”
Transactions of the ASME
license or copyright; see http://www.asme.org/terms/Terms_Use.cfm

J
Downlo
J. Power Sources, 179, pp. 200–208.�9� Burheim, O., Vie, P. J. S., Pharoah, J. G., and Kjelstrup, S., 2010, “Ex Situ
Measurements of Through-Plane Thermal Conductivities in a Polymer Elec-trolyte Fuel Cell,” J. Power Sources, 195, pp. 249–256.
�10� Ramousse, J., Didjierjean, S., Lottin, O., and Maillet, D., 2008, “Estimation ofthe Effective Thermal Conductivity of Carbon Felts Used as PEMFC GasDiffusion Layers,” Int. J. Therm. Sci., 47, pp. 1–6.
�11� Ihonen, J., Mikkola, M., and Lindhberg, G., 2004, “Flooding of Gas DiffusionBacking in PEFCs,” J. Electrochem. Soc., 151, pp. A1152–A1161.
�12� Khandelwal, M., and Mench, M. M., 2006, “Direct Measurement of Through-Plane Thermal Conductivity and Contact Resistance in Fuel Cell Materials,” J.Power Sources, 161, pp. 1106–1115.
�13� Harvey, D., Pharoah, J. G., and Karan, K., 2008, “A Comparison of DifferentApproaches to Modelling the PEMFC Catalyst Layer,” J. Power Sources, 179,pp. 209–219.
�14� Reum, M., Freunberger, S. A., Wokaun, A., and Büchi, F. N., 2009, “Measur-ing the Current Distribution With Sub-Millimeter Resolution in PEFCs,” J.Electrochem. Soc., 156, pp. B301–B310.
�15� Burheim, O., Vie, P. J. S., Møller-Holst, S., Pharoah, J., and Kjelstrup, S.,2010, “A Calorimetric Analysis of a Polymer Electrolyte Fuel Cell and theProduction of H2O2 at the Cathode,” Electrochim. Acta, 55, pp. 935–942.
�16� Lampinen, M. J., and Fomino, M., 1993, “Analysis of Free Energy and En-tropy Changes for Half-Cell Reactions,” J. Electrochem. Soc., 140, pp. 3537–3546.
ournal of Fuel Cell Science and Technology
aded 01 Dec 2010 to 130.15.73.89. Redistribution subject to ASME
�17� Fishman, Z., Hinebaugh, J., and Bazylak, A., 2010, “Microscale TomographyInvestigations of Heterogeneous Porosity Distributions of PEMFC GDLs,” J.Electrochem. Soc., 157�11�, pp. B1643–B1650.
�18� Toray Carbon Fibre Paper, TGP-H, material specification sheet, 22.02.2010,http://fuelcellstore.com/products/toray/specs.pdf
�19� Mathias, M., Roth, J., Fleming, J., and Lehnert, W., 2003, Fuel Cell Technol-ogy and Applications �Handbook of Fuel Cells: Fundamentals, Technology andApplication�, Vol. 3, W. Vielstich, H. A. Gasteiger, and A. Lamm, Wiley, NewYork.
�20� Zhang, J., Kramer, D., Shimoi, R., Ono, Y., Lehman, E., Wokaun, A., Shino-hara, K., and Scherer, G. G., 2006, “In Situ Diagnostic of Two-Phase FlowPhenomena in Polymer Electrolyte Fuel Cells by Neutron Imaging: Part B.Material Variations,” Electrochim. Acta, 51, pp. 2715–2727.
�21� Turhan, A., Heller, K., Brenizer, J. S., and Mench, M. M., 2008, “PassiveControl of Liquid Water Storage and Distribution in a PEFC Through Flow-Field Design,” J. Power Sources, 180, pp. 773–783.
�22� Boillat, P., Kramer, D., Seyfang, B. C., Frey, G., Lehmann, E., Scherer, G. G.,Wokaun, A., Ichikawa, Y., Tasaki, Y, and Shinora, K., 2008, “In situ Obser-vation of the Water Distribution Across a PEFC Using High Resolution Neu-tron Radiography,” Electrochem. Commun., 10, pp. 546–550.
�23� Litster, S., Sinton, D., and Djilali, N., 2006, “Ex Situ Visualization of LiquidWater Transport in PEM Fuel Cell Gas Diffusion Layers,” J. Power Sources,154, pp. 95–105.
APRIL 2011, Vol. 8 / 021013-11
license or copyright; see http://www.asme.org/terms/Terms_Use.cfm
Related Documents