Hydrol. Earth Syst. Sci., 16, 2663–2683, 2012 www.hydrol-earth-syst-sci.net/16/2663/2012/ doi:10.5194/hess-16-2663-2012 © Author(s) 2012. CC Attribution 3.0 License. Hydrology and Earth System Sciences Threshold values and management options for nutrients in a catchment of a temperate estuary with poor ecological status K. Hinsby 1 , S. Markager 2 , B. Kronvang 3 , J. Windolf 3 , T. O. Sonnenborg 1 , and L. Thorling 4 1 Dept. Hydrology, Geological Survey of Denmark and Greenland, Copenhagen, Denmark 2 Dept. Bioscience, Aarhus University, Roskilde, Denmark 3 Dept. Bioscience, Aarhus University, Silkeborg, Denmark 4 Dept. Groundwater and Quaternary Geology Mapping, Geological Survey of Denmark and Greenland, Aarhus, Denmark Correspondence to: K. Hinsby ([email protected]) Received: 2 February 2012 – Published in Hydrol. Earth Syst. Sci. Discuss.: 20 February 2012 Revised: 4 July 2012 – Accepted: 6 July 2012 – Published: 13 August 2012 Abstract. Intensive farming has severe impacts on the chem- ical status of groundwater and streams and consequently on the ecological status of dependent ecosystems. Eutrophica- tion is a widespread problem in lakes and marine waters. Common problems are hypoxia, algal blooms, fish kills, and loss of water clarity, underwater vegetation, biodiversity and recreational value. In this paper we evaluate the nitrogen (N) and phosphorus (P) concentrations of groundwater and sur- face water in a coastal catchment, the loadings and sources of N and P, and their effect on the ecological status of an estuary. We calculate the necessary reductions in N and P loadings to the estuary for obtaining a good ecological sta- tus, which we define based on the number of days with N and P limitation, and the corresponding stream and ground- water threshold values assuming two different management options. The calculations are performed by the combined use of empirical models and a physically based 3-D integrated hydrological model of the whole catchment. The assessment of the ecological status indicates that the N and P loads to the investigated estuary should be reduced to levels corre- sponding to 52 and 56% of the current loads, respectively, to restore good ecological status. Model estimates show that threshold total N (TN) concentrations should be in the range of 2.9 to 3.1 mg l -1 in inlet freshwater (streams) to Horsens estuary and 6.0 to 9.3 mg l -1 in shallow aerobic groundwater (∼ 27–41 mg l -1 of nitrate), depending on the management measures implemented in the catchment. The situation for total P (TP) is more complex, but data indicate that ground- water threshold values are not needed. The stream threshold value for TP to Horsens estuary for the selected management options is 0.084 mg l -1 . Regional climate models project in- creasing winter precipitation and runoff in the investigated region resulting in increasing runoff and nutrient loads to the Horsens estuary and many other coastal waters if present land use and farming practices continue. Hence, lower threshold values are required in many coastal catchments in the future to ensure good status of water bodies and ecosystems. 1 Introduction Nutrient emissions from anthropogenic sources have severe impacts on the environment and cause significant problems with the chemical status of water resources and the eco- logical status of terrestrial, freshwater, and marine ecosys- tems in Denmark and the Baltic Sea region (Conley et al., 2000; HELCOM, 2007), as well as globally (Vitousek et al., 1997; Tilman et al., 2001; Galloway et al., 2004; Diaz and Rosenberg, 2008; Conley et al., 2009; Rockstrøm et al., 2009). Rockstrøm et al. (2009) identify the human impact on the biogeochemical cycle of nitrogen as one of the cur- rently most severe environmental problems globally and rec- ommend that the human fixation of nitrogen and emissions of reactive nitrogen species are reduced to 25 % of the present levels. Hence, there is a strong and increasing need to regu- late and reduce nutrient loadings, particularly in areas with intensive farming, in order to protect water resources and ecosystems (Tilman et al., 2001; Rockstrøm et al., 2009). The European Groundwater Directive (EU, 2006) stipu- lates that the European Union (EU) member states have to Published by Copernicus Publications on behalf of the European Geosciences Union.

Welcome message from author
This document is posted to help you gain knowledge. Please leave a comment to let me know what you think about it! Share it to your friends and learn new things together.
Transcript

Hydrol. Earth Syst. Sci., 16, 2663–2683, 2012www.hydrol-earth-syst-sci.net/16/2663/2012/doi:10.5194/hess-16-2663-2012© Author(s) 2012. CC Attribution 3.0 License.
Hydrology andEarth System
Sciences
Threshold values and management options for nutrients in acatchment of a temperate estuary with poor ecological status
K. Hinsby1, S. Markager2, B. Kronvang3, J. Windolf3, T. O. Sonnenborg1, and L. Thorling 4
1Dept. Hydrology, Geological Survey of Denmark and Greenland, Copenhagen, Denmark2Dept. Bioscience, Aarhus University, Roskilde, Denmark3Dept. Bioscience, Aarhus University, Silkeborg, Denmark4Dept. Groundwater and Quaternary Geology Mapping, Geological Survey of Denmark and Greenland, Aarhus, Denmark
Correspondence to:K. Hinsby ([email protected])
Received: 2 February 2012 – Published in Hydrol. Earth Syst. Sci. Discuss.: 20 February 2012Revised: 4 July 2012 – Accepted: 6 July 2012 – Published: 13 August 2012
Abstract. Intensive farming has severe impacts on the chem-ical status of groundwater and streams and consequently onthe ecological status of dependent ecosystems. Eutrophica-tion is a widespread problem in lakes and marine waters.Common problems are hypoxia, algal blooms, fish kills, andloss of water clarity, underwater vegetation, biodiversity andrecreational value. In this paper we evaluate the nitrogen (N)and phosphorus (P) concentrations of groundwater and sur-face water in a coastal catchment, the loadings and sourcesof N and P, and their effect on the ecological status of anestuary. We calculate the necessary reductions in N and Ploadings to the estuary for obtaining a good ecological sta-tus, which we define based on the number of days with Nand P limitation, and the corresponding stream and ground-water threshold values assuming two different managementoptions. The calculations are performed by the combined useof empirical models and a physically based 3-D integratedhydrological model of the whole catchment. The assessmentof the ecological status indicates that the N and P loads tothe investigated estuary should be reduced to levels corre-sponding to 52 and 56 % of the current loads, respectively,to restore good ecological status. Model estimates show thatthreshold total N (TN) concentrations should be in the rangeof 2.9 to 3.1 mg l−1 in inlet freshwater (streams) to Horsensestuary and 6.0 to 9.3 mg l−1 in shallow aerobic groundwater(∼ 27–41 mg l−1 of nitrate), depending on the managementmeasures implemented in the catchment. The situation fortotal P (TP) is more complex, but data indicate that ground-water threshold values are not needed. The stream thresholdvalue for TP to Horsens estuary for the selected management
options is 0.084 mg l−1. Regional climate models project in-creasing winter precipitation and runoff in the investigatedregion resulting in increasing runoff and nutrient loads to theHorsens estuary and many other coastal waters if present landuse and farming practices continue. Hence, lower thresholdvalues are required in many coastal catchments in the futureto ensure good status of water bodies and ecosystems.
1 Introduction
Nutrient emissions from anthropogenic sources have severeimpacts on the environment and cause significant problemswith the chemical status of water resources and the eco-logical status of terrestrial, freshwater, and marine ecosys-tems in Denmark and the Baltic Sea region (Conley et al.,2000; HELCOM, 2007), as well as globally (Vitousek etal., 1997; Tilman et al., 2001; Galloway et al., 2004; Diazand Rosenberg, 2008; Conley et al., 2009; Rockstrøm et al.,2009). Rockstrøm et al. (2009) identify the human impacton the biogeochemical cycle of nitrogen as one of the cur-rently most severe environmental problems globally and rec-ommend that the human fixation of nitrogen and emissions ofreactive nitrogen species are reduced to 25 % of the presentlevels. Hence, there is a strong and increasing need to regu-late and reduce nutrient loadings, particularly in areas withintensive farming, in order to protect water resources andecosystems (Tilman et al., 2001; Rockstrøm et al., 2009).
The European Groundwater Directive (EU, 2006) stipu-lates that the European Union (EU) member states have to
Published by Copernicus Publications on behalf of the European Geosciences Union.

2664 K. Hinsby et al.: Threshold values and management options for nutrients
derive groundwater threshold values for all relevant con-taminants in all groundwater bodies that may put associ-ated ecosystems at risk. These risks include harmful algalblooms, hypoxia, and loss of biodiversity and underwatervegetation in aquatic ecosystems (Cloern, 2001; Conley etal., 2002). Groundwater threshold values are concentrationswhich should not be exceeded in order to assure good chemi-cal and ecological status of groundwater associated or depen-dent ecosystems (Hinsby et al., 2008). If the threshold valuefor a given pollutant is exceeded, the groundwater body isclassified as having poor chemical status according to EU di-rectives (EU, 2000, 2006). Presently, the EU directives donot require a similar derivation of stream threshold valuesbased on the ecological status of their marine recipient. How-ever, we recommend that stream and groundwater thresh-old values be derived together, as stream threshold valuescan be calculated directly from estimated maximum nutri-ent loads to lakes and marine areas when the relative nutri-ent loads to these recipients directly from groundwater andstreams have been estimated. Groundwater threshold valuescan then be estimated based on the stream threshold valuesfrom the groundwater contributions to stream and estuary nu-trient loads as estimated by monitoring and modeling data. Itshould be noted that it may be necessary to set stricter nutri-ent threshold values for streams (e.g. Camargo and Alonso,2006) or even for groundwater in some cases (Griebler et al.,2010). In this paper, however, we solely derive groundwaterand stream threshold values based on the ecological status ofthe Horsens estuary.
An integrated assessment of threshold values for ground-water based on targets for protection of associated or depen-dent ecosystems is an interdisciplinary challenge that needscontributions from disciplines like marine and freshwaterecology, hydrology, hydrogeology, and hydrochemistry, aswell as data for all water bodies in the investigated hydro-logical system. To the authors’ knowledge, this is the firstinterdisciplinary study that estimates groundwater thresholdvalues based on targets for the ecological status of a marineecosystem. In this paper we (1) calculate total land based ni-trogen and phosphorus loads, (2) estimate maximum accept-able nitrogen and phosphorus loads to the estuary in order toensure a good ecological status of the estuary, (3) derive theequivalent nitrogen and phosphorus groundwater and streamthreshold values for protection of the estuary, and (4) as-sess the present chemical status of groundwater in the catch-ment to Horsens estuary relative to the derived groundwaterthreshold values.
Our aim is to provide and demonstrate a methodology forderivation of threshold values and integrated assessment ofnutrient transport across hydrological systems, from ground-water to estuaries, using Horsens estuary and its catchmentas an example. Further, our aim is to contribute to the knowl-edge base, system understanding and framework for futureassessments of the impacts of projected climate change on
the evolution of the quantitative, chemical and ecological sta-tus of coastal catchments.
2 Study area
2.1 The catchment
The area of investigation is a 518 km2 Danish coastal catch-ment including the small islands in the estuary (Fig. 1). Thecatchment consists of two major gauged sub-catchments withgauging stations just upstream of the two major lakes inthe area, discharging about 70 % of the freshwater from thetotal catchment through the two lakes into the inner west-ern part of the estuary. A number of smaller ungauged sub-catchments discharge to the estuary via a number of smallstreams on both sides of the estuary (Fig. 1). The dom-inant land use is agriculture (76 %). The remaining areasare forested (10 %), or lakes, wetlands and meadows (5 %)(BLST, 2010). The population in the area is about 110 000(136 inhabitants per km2), of which 73 % lives in munici-palities with sewer systems. The animal production is domi-nated by pigs (69 %) and cows (26 %), and the area currentlycontains 0.79 livestock animal units (AU) per hectare agri-cultural soil (BLST, 2010).
The geology and topography of the area was devel-oped by glacial processes during the last glaciation (Weich-selian/Wisconsinian). The deposits are mainly clay tills andoutwash sands constituting the main aquitards and aquifers,although some glaciolacustrine clay layers also exist. A con-ceptual model of the geological and hydrological setting inthe catchment with indication of the type of available data,nutrient sources, and transport is shown in Fig. 2.
There are five lakes located in the catchment (total sur-face area: 2.43 km2), around 1700 ponds (total surfacearea: 2.21 km2), and the catchment is drained by 595 kmof streams, of which 78 % are less than 2 m wide. Themean precipitation for the agro-hydrological years (April–March) 2000 to 2005, the period we model in this study, was695 mm yr−1, and the corresponding total discharge from thecatchment to the estuary was 299 mm yr−1.
2.2 The estuary
The Horsens estuary is a shallow estuary with a mean depthof 2.9 m and a surface area of 77.5 km2 (Stedmon et al.,2006; Markager et al., 2011). Tidal range is low and mix-ing is mainly wind driven (Gustafsson and Bendtsen, 2007).The estuary is connected to the Belt Sea and the Baltic Seatransitions zone through a deep (16 m) channel and is gen-erally well mixed with salinities from 12 to 26 %, which iscomparable to the salinity in the Belt Sea. Despite the wellmixed conditions, results from a 3-D ecological modelingstudy (Timmermann et al., 2010) showed that the ecologicalconditions in the estuary are mainly governed by local nu-trient inputs with the nutrient concentrations in the adjacent
Hydrol. Earth Syst. Sci., 16, 2663–2683, 2012 www.hydrol-earth-syst-sci.net/16/2663/2012/

K. Hinsby et al.: Threshold values and management options for nutrients 2665
Fig. 1. Location and delineation of the investigated estuary and catchment, including stream gauging stations (triangles) and national moni-toring site below farm land (square).
sea only playing a minor role. The nutrient concentrationsin the estuary are typical for Danish estuaries and similar toestuaries in the US such as the Patuxent river estuary andChesapeake Bay (Boynton and Kemp, 2008).
3 Materials and methods
3.1 Monitoring in the Horsens Fjord catchmentand estuary
The first Danish Action Plan for the Aquatic Environmentwas adopted in 1987, and the resulting monitoring programhas been in place since 1989. Hence, more than 20 yr of mon-itoring data are presently available for all major water bodiesin Denmark (Larsen et al., 1999; Conley et al., 2002; Kron-vang et al., 2008; Hinsby and Jørgensen, 2009; Markager etal., 2010; Hansen et al., 2011). In this study we use data fromthis program collected in the investigated catchment and datafrom a small agricultural research and monitoring site a fewkilometers outside the catchment with intensive monitoringof tile drainage water and upper groundwater (1 to 5 m belowground surface).
Discharge and nutrient concentrations are measured in theBygholm and Hansted streams at the two gauging stations(Fig. 1), covering the discharge and loadings from 56 % ofthe catchment area. Water sampling in streams was normally
conducted every second week and analyzed for TN, nitrate-nitrite-N, ammonium-N, TP, and dissolved orthophosphate.Instantaneous discharge (Q) was measured 12 to 20 timesper year using a low friction propeller, and daily dischargevalues were calculated using relationships betweenQ andcontinuously measured fluctuations in water level (H ) in thestreams.
Monitoring in the estuary was initiated in 1980, and sys-tematically collected data exists from 1985 to 2007. Mon-itored parameters included profiles of salinity, temperature,chlorophyll fluorescence, and light attenuation from CTD(conductivity, temperature, depth) casts, as well as nutrientand chlorophyll concentrations from discrete water samplesat two depths. Biomass measurements of underwater vege-tation and the benthic invertebrates were performed togetherwith enumeration of phytoplankton. The only rate measure-ment was made for phytoplankton primary production. Thesampling frequency varied from 12 to 46 times per year.Generally, sampling and analytical procedures follow Dan-ish and European standards and directives, i.e. most recentlythe requirements described in the EU’s Monitoring Directive(EU, 2009). Selected data from the monitoring programs areshown in Tables 1 and 2.
www.hydrol-earth-syst-sci.net/16/2663/2012/ Hydrol. Earth Syst. Sci., 16, 2663–2683, 2012

2666 K. Hinsby et al.: Threshold values and management options for nutrients
Field
Drain pipe
HorsensEstuaryAerobicAnaerobic
Regionalgroundwater body
Regionalgroundwater body
Con�ning layer (clayey till)Groundwater body (sand)Riparian Area Aquifer
AerobicAnaerobicRedox boundary
Deep groundwater body
Deep groundwater body
Terrestrialecosystem
Localgroundwater body
Localgroundwater body
© G
EUS
Horsens
Regionalgroundwater body
Regionalgroundwater body
Deep groundwater body
Deep groundwater body
Belt Sea
A
EC
Loading toestuary C
E
Values for max. acceptableloadings to the estuary
Corresponding discharge-weightedN and P TVs in streamsCorresponding TVs for
aerobic groundwaterin scenario 1
Corresponding TVs for aerobic groundwater
in scenario 2
Data source
Values
A
C
E
Measured concentrations and runo� in streams
Modeled stream nutrient loading to estuary validated by measurements at two gauging stations, Fig.1, (includingretention in lakes, etc.) by the model complex DK-QN
Measured values in the estuary and empirical models forrelationships between load, climate and concentrations
Model output for atmospheric deposition
Measured nutrient concentrations for the adjacent Belt Sea
N retention in streams, lakes and wetlands
Modeled N leaching from �eld blocks to drainsand groundwater, (expert judgement for P)
N loading from groundwater directly to estuary(negligible in this system based on DK-model estimate ofgroundwater �ow directly to estuary (13 % of net precipitation), and expert judgment)
Measured values
Modeled values
work�ow
G
B + D + H
D
G
F
B H
B
D
F
G
H
DG
G
Fig. 2.Conceptual model of the catchment of Horsens estuary with indication of data and nutrient sources. The work process in calculation ofthreshold values (TVs) for streams and groundwater is indicated. The “DK-QN” model complex (or NLES & DK-QN & DK-model complex)is a combination of an empirical N leaching model (NLES, Kronvang et al., 2009b), an empirical monthly flow-weighted N concentrationmodel from diffuse sources (DK-QN, Windolf et al., 2011), and a physically distributed integrated hydrological model (DK-model, Henriksenet al., 2003).
3.2 Data analysis and development of conceptual model
For the derivation of stream and groundwater threshold val-ues, we apply a stepwise approach (Fig. 2). Firstly, the cur-rent N and P loadings to the estuary were estimated. Basedon these values and empirical models for the relationships be-tween loadings and nutrient concentrations, acceptable N andP loadings to the estuary were estimated. Secondly, two sce-narios were constructed for achieving these values for annualnutrient loading. Finally, these annual loadings were con-verted to groundwater and stream threshold values using acatchment model and monitoring data for N and monitoringdata and expert judgment for P (Fig. 2).
3.2.1 Calculation of freshwater discharge, nutrientsources and loads
Monthly freshwater discharge and transport of nutrients (TNand TP) are calculated using a linear interpolation method
(Kronvang and Bruun, 1996) by multiplying daily nutrientconcentrations with mean daily discharge calculated fromstage–discharge relationships, developed for each of the twogauging stations situated in the main stream inlets (Fig. 1).Land-based monthly nutrient loadings and freshwater dis-charge from the entire catchment to the Horsens estuaryfor the period 1984 to 2009 have been estimated utiliz-ing data from the two gauged stations, and adding modeledmonthly freshwater discharge and nutrient loadings from theungauged part of the catchment by using the DK-QN modelcomplex according to Windolf et al. (2011) (Fig. 2). The pre-cision and bias of the estimated N loading from the gaugedcatchments is assessed to amount to 10 % and 0 %, respec-tively, based on Monte Carlo evaluations of sampling fre-quencies and load estimates (Kronvang and Bruhn, 1996).The DK-QN model is a combination of an empirical nu-trient loss model and the physically based, distributed andintegrated hydrological “DK-model” (“the Danish NationalWater Resources Model”, Henriksen et al., 2003), which is
Hydrol. Earth Syst. Sci., 16, 2663–2683, 2012 www.hydrol-earth-syst-sci.net/16/2663/2012/

K. Hinsby et al.: Threshold values and management options for nutrients 2667
Table 1.Average N and P concentrations in aerobic and anaerobic subsurface waters measured at agricultural monitoring sites (LOOP3 andLOOP4) for the period 2000–2005, compared to average N and P concentrations measured in the general groundwater monitoring programin the catchment of Horsens estuary for the monitoring period (1989–2009).
Sample/“well” type N NO3-N NH4-N DIN TN TPwellsa/analysesb mg l−1 mg l−1 mg l−1 mg l−1 mg l−1
Agricultural monitoring siteAverage 2000–2005UZ – suction cups (LOOP3)c – 8.4 – – 11d 0.013Drains (LOOP4)c – – – – 12d 0.050Drains/root zone leachate – – – – 15d –(modeled, this study)All wells, 1.5–5 m (LOOP3) 22/444 8.5 0.016 8.5 8.5 0.019Aerobic wells (LOOP3)e 20/414 9.1 0.014 8.1 9.0 0.018Anaerobic wells (LOOP3)e 2/30 0.052 0.049 0.12 0.23 0.029Groundwater monitoringAverage 1989–2009All wells with data in period 119/183 0.25 0.20 0.47 – 0.13Aerobic wells 7/12 2.9 0.051 3.4 – 0.16Anaerobic wells 112/171 0.068 0.21 0.28 – 0.13
a Number of wells;b maximum number of analyses;c data from Grant et al. (2007);d flow weighted concentrations – LOOP3 andLOOP4 are monitoring sites, which are located approximately 2 and 100 km from the investigated catchment, respectively, in areas withsimilar clayey soils; ande “aerobic” and “anaerobic” wells are here defined as wells with NO3 − N ≥ 0.25 mg l−1 andNO3 − N < 0.25 mg l−1.
based on the integrated hydrological modeling system MIKESHE (Abott et al., 1986; Graham and Butts, 2005), andcalibrated against groundwater heads and runoff. The lat-est version (second generation) of the DK-model is devel-oped with a grid size of 500 m× 500 m (the first setup was1000 m× 1000 m). In this study we have reduced the gridsize even further to 250 m× 250 m, and used this resolutionfor the discharge estimation in both gaged and ungauged sub-catchments. The surface/stream and subsurface water dis-charges from the catchment to the estuary, 87 % and 13 %,respectively, are derived from DK-model simulations of theHorsens catchment.
Monthly nitrogen loadings were also modeled for the twogauged catchments, thus allowing a validation of the appliedDK-QN model complex against measured nitrogen concen-trations at the two gauged stations. Moreover, the nitrateleaching from the root zone (upper 1 m) was calculated forthe entire catchment of the Horsens estuary using the Danishempirical NLES leaching model, which performed well in alarge inter-comparison with seven other well known nutrientmodels (Hejzlar et al., 2009; Kronvang et al., 2009b).
The total loadings were apportioned to sources accordingto Eq. (1) and Kronvang et al. (2005) (Table 3). The 9 dis-charges from point sources were measured at the outlets (in-dustrial plants (IPs), waste water treatment plants (WWTPs),and fish farms (FFs)), or calculated based on treatment facil-ities and number of houses in each sub-catchment, and ex-perience data for production of nutrients and reduction ef-ficiency of treatment (SD). The atmospheric depositions ofnitrogen to fresh surface waters (Afresh) and to the surface
area of the Horsens estuary (Amarin) were calculated basedon national models for transportation and deposition (http://www.air.dmu.dk). Natural background losses of TN (NB)were estimated as flow-weighted concentrations from sam-pling in streams draining uncultivated catchments. The grossnutrient emission to and load in streams (Ls) was calculatedby the established model and includes the loads described byEq. (1):
Ls = Lagri+ Lnb+ Lps+ Laf − Rslw (1)
whereLs is the average loading of nutrients to the Hors-ens estuary estimated from diffuse sources and accordingto the combined use of monitoring and modeling data (Bin Fig. 2), Lagri is the nutrient load from agriculture (G inFig. 2),Lnb is the natural background load of nutrients fromnon-agricultural areas,Lps is the nutrient load from pointsources,Laf is the direct atmospheric deposition on surfacefreshwater (D in Fig. 2), andRslw is the retention of nutrientsin the catchment after their emission to surface waters (F inFig. 2).
3.2.2 Estimating maximum acceptable nutrient loadsto Horsens estuary
The estimation of maximum acceptable loads to Horsens es-tuary was based on empirical models for relationships be-tween N and P loadings and resulting N and P concen-trations (effects) in the estuary (Fig. 4). The specific ef-fects (y-variable) evaluated were annual mean concentrationsof TN and P, and mean concentrations of DIN (dissolved
www.hydrol-earth-syst-sci.net/16/2663/2012/ Hydrol. Earth Syst. Sci., 16, 2663–2683, 2012

2668 K. Hinsby et al.: Threshold values and management options for nutrients
Table 2.Average N and P concentrations in streams and coastal waters, 2000–2005.
Surface water sampling stationDIN TN PO4-P TPmg l−1 mg l−1 mg l−1 mg l−1
Hansted Stream – (FWm/FWs)a 4.9/– 5.6/5.5b 0.041/– 0.10/–Bygholm Stream – (FWm/FWs)a 7.4/– 8.0/6.6b 0.072/– 0.14/–Streams ungauged catchm. (FWm/FWs)a –/– –/6.2b –/– –/–Horsens inner estuary 0.24 0.55 0.013 0.056Horsens outer estuary 0.14 0.39 0.011 0.046Belt Sea 0.04 0.25 0.012 0.040
a Flow weighted, FWm = measured concentration, FWs = simulated concentration;b measured and simulatedstream concentrations include diffuse and point sources.
Table 3.Nitrogen and phosphorus sources and loadings to the Horsens estuary, 2000–2005, (partly from BLST, 2010).
N P N Pt t % %
Natural background (NB) 179
48
1
Table 3. Nitrogen and phosphorus sources and loadings to the Horsens Estuary, 2000-2005, 2
[partly from BLST, 2010] 3
4
5
6
7
N P N P
Tonnes Tonnes
% %
Natural background (NB) 179
17
Agriculture (AGRI) 704
16.2 65 69
Scattered dwellings (SD) 15
1.4
Industrial plant discharges (IP) 0 0 0 0
Fish farming (freshwater) (FFfresh) 0.5
0.07
0.05 0.3
Fish farming (marine) (FFmarin) 11
1.39
1.0 5.9
Waste Water Treatment Plants (WWTP) 64
1.9
5.9 8.1
Urban stormwater runoff (USR) 15 3.5 1.4 15
Atmospheric deposition on freshwater bodies (Afresh) 4.1
0.08
0.4
0.3
Atmospheric deposition on marine waters (Amarin) 94
0.24
8.7 1.0
Sum all sources 1086
23.4
100 100
17
48
1
Table 3. Nitrogen and phosphorus sources and loadings to the Horsens Estuary, 2000-2005, 2
[partly from BLST, 2010] 3
4
5
6
7
N P N P
Tonnes Tonnes
% %
Natural background (NB) 179
17
Agriculture (AGRI) 704
16.2 65 69
Scattered dwellings (SD) 15
1.4
Industrial plant discharges (IP) 0 0 0 0
Fish farming (freshwater) (FFfresh) 0.5
0.07
0.05 0.3
Fish farming (marine) (FFmarin) 11
1.39
1.0 5.9
Waste Water Treatment Plants (WWTP) 64
1.9
5.9 8.1
Urban stormwater runoff (USR) 15 3.5 1.4 15
Atmospheric deposition on freshwater bodies (Afresh) 4.1
0.08
0.4
0.3
Atmospheric deposition on marine waters (Amarin) 94
0.24
8.7 1.0
Sum all sources 1086
23.4
100 100
Agriculture (AGRI) 704 16.2 65 69Scattered dwellings (SD) 15 1.4Industrial plant discharges (IP) 0 0 0 0Fish farming (freshwater) (FFfresh) 0.5 0.07 0.05 0.3Fish farming (marine) (FFmarin) 11 1.39 1.0 5.9Waste water treatment plants (WWTP) 64 1.9 5.9 8.1Urban stormwater runoff (USR) 15 3.5 1.4 15Atmospheric deposition on freshwater bodies (Afresh) 4.1 0.08 0.4 0.3Atmospheric deposition on marine waters (Amarin) 94 0.24 8.7 1.0
Sum of all sources 1086 23.4 100 100
Note! the unit t (tonne) is the metric tonne all through the manuscript.
inorganic nitrogen= NO2 − N + NO3 − N+NH4 − N) fromMay through October and DIP (dissolved inorganic phospho-rus= PO4 − P) from March through July (Table 4). The pe-riods for DIN and DIP correspond approximately to the pe-riods were N or P limitation of phytoplankton occur in theestuary (data not shown). The empirical models were devel-oped with an iterative multiple linear regression procedureworking on standardized time series (zero mean and a stan-dard deviation equal to one) for both dependent and indepen-dent variables. The explanatory variables (x-variables) wereN and P loads, water temperature, wind speed (cubed dailymean values), surface irradiance, salinity (used as a proxyfor water exchange with the adjacent Belt Sea) and the NorthAtlantic Oscillation Index (NAO,http://www.cru.uea.ac.uk/∼timo/projpages/naoupdate). These variables represent themajor external factors governing the conditions in the es-tuary, i.e. nutrient loadings, climatic forcing and water ex-change. Each explanatory variable was calculated as meanvalues for eleven different time periods prior to and/or in-cluding the period for the response variable in order to allowfor time lag between loads and resulting effects in the es-tuary. The eleven periods were periods 1 to 5, the periodsfor the response variable including 0, 1, 2, 4 and 8 months
before, and period 6, all months back to January in the pre-vious year; periods 7 to 11 were periods ending when the re-sponse period started and starting 1, 2, 4 and 8 month before,and January in the previous year. This method gave 7× 11potential explanatory variables. A forward selection proce-dure adopted from Broadhurst et al. (1997) was used to se-lect the explanatory parameters providing the best model fit.A jack-knifing procedure was used to test all variables andall combinations of years, and the best explanatory variableswere chosen based on root mean square error of cross vali-dation (RMSECV). RMSECV were also used to determinatethe maximum number of explanatory variables (between twoand five) without overparameterisation of the model. Outlierswhere identified from the jack-knifing procedure accordingto Martens and Dardenne (1998). Nitrogen and phosphorousloadings were always chosen as the first variable for their re-spective concentrations, and only one variable for each classof explanatory variables was chosen, but otherwise the selec-tion procedure for explanatory variables was based on RM-SECV. The procedure stopped when further explanatory vari-ables did not improve the model based on RMSECV (twoto four explanatory variables were used). Time series from1985 to 2006 were used, i.e. 22 yr, however, the last four
Hydrol. Earth Syst. Sci., 16, 2663–2683, 2012 www.hydrol-earth-syst-sci.net/16/2663/2012/

K. Hinsby et al.: Threshold values and management options for nutrients 2669
years where not used in the parameter selection procedurebut retained for validation. After validation of the explana-tory parameter selection, a final estimation of the regressioncoefficients was done including all 22 yr. The final resultsfrom the models are coefficients for the effects of changes inresponse variables per unit change in loadings (% change inresponse variable/% change in loading), adjusted for effectsof inter-annual variability in climatic conditions. These co-efficients were subsequently used to estimate the values forresponse variables under reduced loadings assuming averageclimatic conditions, i.e. the final model equations were usedas scenarios where N and P loads varied, but with climaticvariables set to their average value in the data set. Finally, themaximum acceptable loads to the estuary were estimated us-ing the calculated relationships between DIN and DIP meanconcentrations, and the percentage of days with N and P lim-itations in the estuary (see Sect. 4.3 and Fig. 8 for estima-tion of N and P limitations and Sect. 5.2 for a discussion ofgood ecological status). Nutrient limitations are assumed tooccur at 14 µg DIN l−1 and 6.2 µ g DIP l−1. These values areequivalent to Km values for growth in a Michaelis–Mentenexpression of 1 µmol l−1 for DIN and 0.2 µmol l−1 for DIP,based on values given by MacIsaac and Dugdale (1969), Ep-pley et al. (1969), Falkowski (1975) and Quile et al. (2011).
3.3 Scenarios of mitigation measures
The reduction targets for nutrient loadings calculated for theHorsens estuary can be accomplished by utilizing differentmitigation measures in the catchment, and it is importantto note that the actual selection of applied mitigation mea-sures will affect the calculated groundwater threshold valuefor TN. The reason for this is that the chosen measures mayinclude and take advantage of subsurface reduction (reten-tion) processes to various degrees. Generally, the most strictgroundwater threshold values would be established if sub-surface retention is not increased and the reduction in nutri-ent loading is solely to be obtained by reducing the nutrientsleaching from agricultural soils. Groundwater threshold val-ues can be allowed to be higher if in addition other measuressuch as introduction of uncultivated buffer zones, restora-tion of wetlands along streams and reduction in other signifi-cant nutrient sources were applied to help reduce the nutrientloading to streams and ultimately the estuary. We have eval-uated two possible scenarios to illustrate how the choice ofmitigation measure will influence the derived groundwaterthreshold value for TN:
Scenario 1: Assumes that the entire reduction target forN and P is directed against the diffuse sources in the catch-ment, i.e. losses from fields. This scenario results in the low-est (most strict) groundwater threshold values.
Scenario 2: Measures are imposed on point sources, directatmospheric deposition (through lower emission of ammoniafrom agriculture/manure) and diffuse sources. Furthermore,construction/restoration of wetlands and uncultivated buffer
zones along streams were included for additional removal ofnutrients. As this scenario utilizes further nitrogen reductionfrom other sources, it allows higher threshold values in aero-bic groundwater.
3.4 Derivation of stream threshold values
In contrast to groundwater threshold values, stream thresh-old values are not sensitive to the selected nutrient man-agement options in the investigated catchment. The flow-weighted stream concentrations simply have to be reducedby the same relative amount as required for the estuary as thestream inputs constitute approximately 90 % of the TN in-put to the estuary (Table 3), while the groundwater thresholdvalues depend on how and where remediation measures areapplied and nutrients are removed/immobilized (Sect. 3.5).Hence, groundwater thresholds for e.g. nitrate (or TN) de-rived to ensure a good ecological status of the associatedestuary, can be significantly higher if efficient wetlands forremoval of nitrate before discharge to streams or the estuaryare constructed (see discussions in Sects. 3.3 and 5.3).
To estimate the current TN loading from streams to the es-tuary and the required threshold values, we have applied anempirical model for estimating monthly flow-weighted TNconcentrations in freshwater discharge to minor streams. Themodel was developed based on nitrogen data for 83 smallagricultural catchments without lakes or wetlands and datafor the period 1990 to 2009 using an approach described byKronvang et al. (1995), Andersen et al. (2005), and Win-dolf et al. (2011). The retention of TN in streams, lakes andwetlands was calculated utilizing different models and ex-pert judgments as described in Windolf et al. (1996, 2011)and Kronvang et al. (2005). The modeling complex alloweda model estimation of gross and net stream flow-weightedconcentrations taking into consideration the nutrient reten-tion in the 5 larger lakes situated in the catchment, of whichthe 2 largest are situated downstream the two monitoring sta-tions just before river water enters the estuary (Fig. 1). Netinlet freshwater nitrogen threshold values for Horsens estu-ary were calculated utilizing this model complex for the twoscenarios. The threshold values for TP were calculated as netflow-weighted concentrations.
3.5 Derivation of groundwater threshold values
Groundwater threshold values depend on the application ofpossible mitigation measures as described in Sect. 3.3. Thethreshold value has to be calculated for aerobic groundwa-ter as the major nitrogen species in groundwater, nitrate, isreduced to unreactive N2 at the redox boundary.
Dissolved inorganic nitrogen (DIN =NO2−N+NO3−N+
NH4−N) in anaerobic groundwater in the investigated catch-ment is primarily present as ammonia at concentrations thatare generally 1–2 orders of magnitude lower than the DINconcentrations in aerobic groundwater, where nitrate is the
www.hydrol-earth-syst-sci.net/16/2663/2012/ Hydrol. Earth Syst. Sci., 16, 2663–2683, 2012
2670 K. Hinsby et al.: Threshold values and management options for nutrients
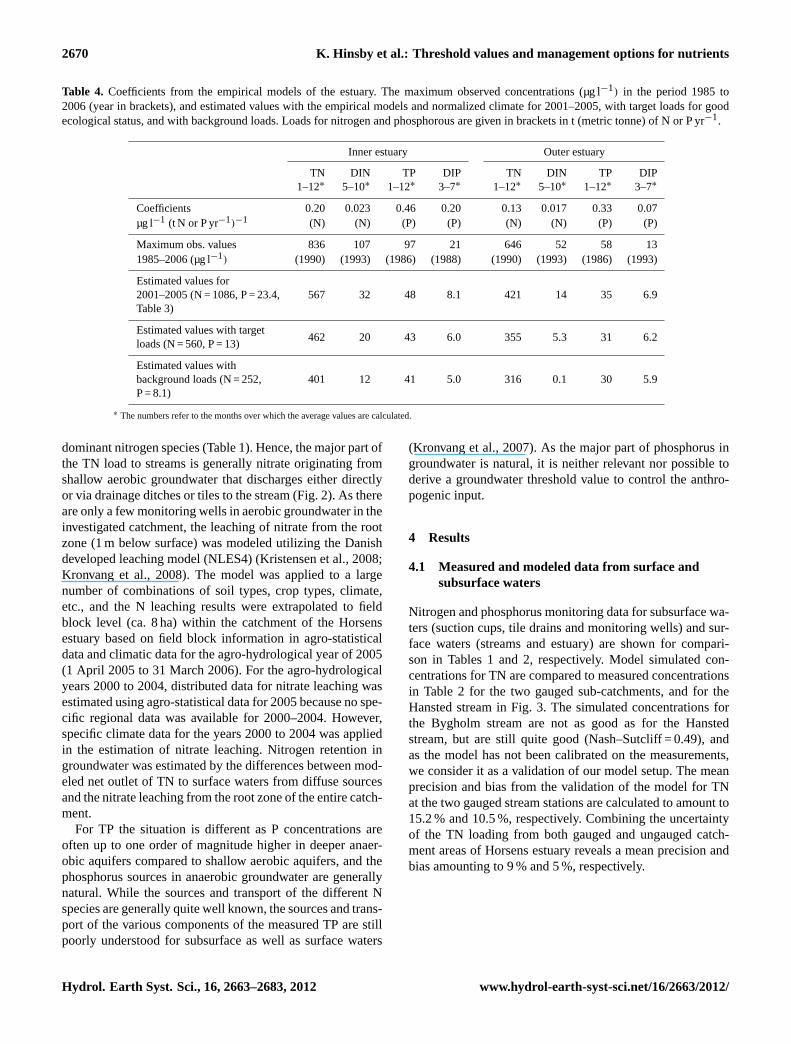
Table 4. Coefficients from the empirical models of the estuary. The maximum observed concentrations (µg l−1) in the period 1985 to2006 (year in brackets), and estimated values with the empirical models and normalized climate for 2001–2005, with target loads for goodecological status, and with background loads. Loads for nitrogen and phosphorous are given in brackets in t (metric tonne) of N or P yr−1.
Inner estuary Outer estuary
TN DIN TP DIP TN DIN TP DIP1–12∗ 5–10∗ 1–12∗ 3–7∗ 1–12∗ 5–10∗ 1–12∗ 3–7∗
Coefficients 0.20 0.023 0.46 0.20 0.13 0.017 0.33 0.07µg l−1 (t N or P yr−1)−1 (N) (N) (P) (P) (N) (N) (P) (P)
Maximum obs. values 836 107 97 21 646 52 58 131985–2006 (µg l−1) (1990) (1993) (1986) (1988) (1990) (1993) (1986) (1993)
Estimated values for2001–2005 (N = 1086, P = 23.4, 567 32 48 8.1 421 14 35 6.9Table 3)
Estimated values with target462 20 43 6.0 355 5.3 31 6.2
loads (N = 560, P = 13)
Estimated values withbackground loads (N = 252, 401 12 41 5.0 316 0.1 30 5.9P = 8.1)
∗ The numbers refer to the months over which the average values are calculated.
dominant nitrogen species (Table 1). Hence, the major part ofthe TN load to streams is generally nitrate originating fromshallow aerobic groundwater that discharges either directlyor via drainage ditches or tiles to the stream (Fig. 2). As thereare only a few monitoring wells in aerobic groundwater in theinvestigated catchment, the leaching of nitrate from the rootzone (1 m below surface) was modeled utilizing the Danishdeveloped leaching model (NLES4) (Kristensen et al., 2008;Kronvang et al., 2008). The model was applied to a largenumber of combinations of soil types, crop types, climate,etc., and the N leaching results were extrapolated to fieldblock level (ca. 8 ha) within the catchment of the Horsensestuary based on field block information in agro-statisticaldata and climatic data for the agro-hydrological year of 2005(1 April 2005 to 31 March 2006). For the agro-hydrologicalyears 2000 to 2004, distributed data for nitrate leaching wasestimated using agro-statistical data for 2005 because no spe-cific regional data was available for 2000–2004. However,specific climate data for the years 2000 to 2004 was appliedin the estimation of nitrate leaching. Nitrogen retention ingroundwater was estimated by the differences between mod-eled net outlet of TN to surface waters from diffuse sourcesand the nitrate leaching from the root zone of the entire catch-ment.
For TP the situation is different as P concentrations areoften up to one order of magnitude higher in deeper anaer-obic aquifers compared to shallow aerobic aquifers, and thephosphorus sources in anaerobic groundwater are generallynatural. While the sources and transport of the different Nspecies are generally quite well known, the sources and trans-port of the various components of the measured TP are stillpoorly understood for subsurface as well as surface waters
(Kronvang et al., 2007). As the major part of phosphorus ingroundwater is natural, it is neither relevant nor possible toderive a groundwater threshold value to control the anthro-pogenic input.
4 Results
4.1 Measured and modeled data from surface andsubsurface waters
Nitrogen and phosphorus monitoring data for subsurface wa-ters (suction cups, tile drains and monitoring wells) and sur-face waters (streams and estuary) are shown for compari-son in Tables 1 and 2, respectively. Model simulated con-centrations for TN are compared to measured concentrationsin Table 2 for the two gauged sub-catchments, and for theHansted stream in Fig. 3. The simulated concentrations forthe Bygholm stream are not as good as for the Hanstedstream, but are still quite good (Nash–Sutcliff = 0.49), andas the model has not been calibrated on the measurements,we consider it as a validation of our model setup. The meanprecision and bias from the validation of the model for TNat the two gauged stream stations are calculated to amount to15.2 % and 10.5 %, respectively. Combining the uncertaintyof the TN loading from both gauged and ungauged catch-ment areas of Horsens estuary reveals a mean precision andbias amounting to 9 % and 5 %, respectively.
Hydrol. Earth Syst. Sci., 16, 2663–2683, 2012 www.hydrol-earth-syst-sci.net/16/2663/2012/

K. Hinsby et al.: Threshold values and management options for nutrients 2671
Fig. 3. Measured and simulated TN concentrations at the gaugingstation on Hansted stream (see Fig. 1).
4.2 Development and current status for nutrientsources, loadings and sinks
The average land based nitrogen load to the estuary was1770 t yr−1 between 1984 and 1992, corresponding to an av-erage weighted concentration in the streams of 11.1 mg N l−1
(Fig. 4). This concentration is 8–10 times higher than the es-timated natural background loss. From 1993 the effects ofabatement measures for nitrogen losses in agriculture be-came visible as nitrogen concentrations were decreasing inthe freshwater discharge to the estuary, reaching 5.1 mg N l−1
in 2009 (the simulated annual average for the investigatedbaseline period 2000–2005 is 6.2 mg N l−1) (Fig. 4). Thisconcentration includes nitrogen from diffuse sources as wellas point sources (sewage).
The DK-model simulations estimate that approximately13 % of the net precipitation in the catchment to the Horsensestuary is discharged directly to the estuary via groundwater(Sect. 3.2.1). As the redox boundary generally is located afew meters below the water table in the catchment, we esti-mate that the major part of the groundwater that dischargesdirectly to the estuary is reduced and therefore is without ni-trate. Hence, we argue that the nitrogen loading to the estuarydirectly from groundwater most probably is insignificant.
The most important source of N was agriculture, being re-sponsible for 65 % of the TN loading (Table 3). The averageN loss from agricultural areas in the catchment amounted to56 kg ha−1 yr−1 during the period 2001 to 2005, the periodwith the most detailed data and modeling. The second mostimportant N source was the estimated loss of N from naturalbackground sources, which amounted to 17 %. The loadingsfrom point sources in the catchment and marine fish farmingamounted to 105 t N, or only 9.7 % of the TN loading (Ta-ble 3). Atmospheric deposition of N directly on the estuarinewaters amounted to 8.7 % of the TN loading.
TP loadings to the Horsens estuary were, on average,95 t P yr−1 from 1984 to 1987 (Fig. 4). Introduction of
tertiary treatment of wastewater caused a sharp decline in1988, and loadings continued to decline until 1995, reach-ing an average loading of 28 t P yr−1 during 1995 to 2006(Fig. 4). The average TP loading to the Horsens estuaryamounted to 23.4 t P during the period 2001 to 2005. Thediffuse sources of P (background, agriculture and scattereddwellings) were the dominant source, amounting to 16.2 t P,or 69 % of the total loading (Table 3). The second most im-portant P source was urban runoff (15 %), followed by dis-charges from waste water treatment plants (8 %), and fishfarming in the estuary (6 %).
The modeled average annual N leaching from the rootzone (1 m depth) on agricultural land in three sub-catchmentsto the Horsens estuary is shown in Table 5. The N leach-ing varies from year to year and from sub-catchment to sub-catchment, being dependent on factors such as climate, soiltypes, crop types, and the application of chemical fertilizerand manure. The total annual N leaching from both agri-cultural and non-agricultural land in the entire catchment tothe Horsens estuary is shown in Table 6. The N leachingvaries considerably from year to year, being lowest in 2005(1390 t N) and highest in 2001 (3384 t N). The N transportin the streams was considerably lower than the modeled Nleaching (Table 6) due to N removal in groundwater withinthe catchment. The average annual N removal in groundwa-ter amounts to 53 % of the average annual N leached fromthe root zone, compared to 21 % removal in surface waters(streams, lakes, and wetlands) (Table 6). The resulting mod-eled annual N loading and flow-weighted concentrations ininlet waters from diffuse sources to the Horsens estuary areshown in Table 6. These flow-weighted concentrations varybetween 4.4 and 6.0 mg N l−1 in the period 2000 to 2005 (theperiod with detailed modeling). The average annual N fluxesfrom fields to the estuary are shown in Fig. 5. An averageof 64 % of the N emissions from the diffuse sources are re-moved during the transport from field to estuary.
4.3 Relationships between nutrient loads andenvironmental status of Horsens estuary
Figure 7 illustrates the relation between observed and mod-eled DIN concentrations in the estuary and shows that 70 %of the variability in DIN concentrations can be explainedby N loadings and wind stress. The nutrient concentrationsin the estuary have declined concurrent with the decreasein loadings (Figs. 4 and 6). The patterns in the residuals(Fig. 6b) reveal that negative residuals are mainly found inthe beginning and the end of the period, and positive residu-als in the middle, starting in 1992 and continuing for about10 yr. This could indicate a non-steady state situation wherethe nutrient pool in the sediment, for a period of approxi-mately ten years, leaks nutrients to the water column (Lom-stein et al., 1998; Christensen et al., 2000) before a new equi-librium is established between external loadings and the sed-iment pool.
www.hydrol-earth-syst-sci.net/16/2663/2012/ Hydrol. Earth Syst. Sci., 16, 2663–2683, 2012

2672 K. Hinsby et al.: Threshold values and management options for nutrients
0
500
1000
1500
2000
2500
3000
1984 86 88 9290 94 96 98 00 0402 06 08 2010
1984 86 88 9290 94 96 98 00 0402 06 08 2010
1984 86 88 9290 94 96 98 00 0402 06 08 2010
1984 86 88 9290 94 96 98 00 0402 06 08 2010Q
(106 m
3ye
ar -1
)
TN lo
adin
g (t
yea
r -1)
TN loading Freshwater discharge
0
2
4
6
8
10
12
14
0
0.2
0.4
0.6
0.8
1.0
1.2
1.4
TN (m
g l -1
)
TN (m
g l -1
)
discharge weigthed inlet (from catchment) Horsens Estuarie, inner part 0 - 10 m
0
0.1
0.2
0.3
0.4
0.5
0.6
0.7
0.8
TP (m
g l -1
)
TP (m
g l -1
)
discharge weigthed inlet (from catchment)
0
50
100
150
200
250
300
Q (1
06 m3
year
-1)
0
30
60
90
120
150
180
TP lo
adin
g (t
yea
r -1)
Freshwater dischargeTP loading
0
50
100
150
200
250
300
0
0.02
0.04
0.06
0.08
0.10
0.12
0.14
0.16
Horsens Estuarie, inner part 0 - 10 m
Fig. 4. Historical development of freshwater discharge and TN and TP loadings to Horsens estuary (upper figures), discharge weightedconcentrations in the freshwater inlet to the estuary and annual average concentrations (0–10 m) in the inner part of the estuary (lowerfigures), 1984–2010.
HorsensEstuary
Agricultural land(2170 )
Non-agricultural land(64 )
N-removal in groundwater(1208 s)
N-removal in surface water(213 )
Atmospheric N-deposition
(90 )
(1026 )
Emission from point sources(90 )
Streams, wetlands and lakes
Net N-loading(903)
Leaching root zone
Fig. 5.Modeled nitrogen fluxes in the catchment of Horsens estuaryand the net loading to the estuary, showing annual averages for thebaseline period 2000–2005. Numbers in parenthesis are t N.
Decreasing chlorophyll concentrations were also observedin the inner part of the estuary for the spring periods (Marchto June) from 1985 to 1992 following the drop in phospho-rous loadings (data not shown). This is in agreement with in-dications of phosphorous as the primary limiting nutrient inthe spring. However, in the outer part of the estuary and forthe late summer period (July to October) the chlorophyll con-centrations did not respond to the decrease in loadings andnutrient concentrations. Water clarity improved from 1985 to1995 in both parts of the estuary in the spring period (Aprilto June). The diffuse attenuation coefficient (Kd) decreasedfrom 1.15 m−1 to 0.55 m−1 in the inner part of estuary and
from 0.81 to 0.33 m−1 in the outer part. Again, this is mostlikely a response to the lower phosphorous loadings and ageneral pattern observed in Danish estuaries where condi-tions in the spring are more directly influenced by loadings,compared to conditions later in the summer where availablenutrients are more governed by internal processes, e.g. re-lease from the sediments (Lomstein et al., 1998; Christensenet al., 2000). Since 1995Kd has shown an increasing trendfor the spring period, and Kd values from July to Septemberhave been variable with average values of 0.78 and 0.50 m−1
in the inner and outer part, respectively (Table 4), but notrends have been observed. Similarly, no positive develop-ments have been observed for underwater vegetation (mainlyeelgrass,Zostera marina, L.), which reached its lowest lev-els during the period 2000 to 2003. However, some improve-ments have been seen in 2007 to 2008 (Markager et al.,2010). Thus, despite significant reductions in nutrient loadsand concentrations we only observe minor positive effects onthe biological components in the ecosystem. Major improve-ments would require that the former eelgrass meadows comeback and that water clarity and oxygen conditions improvesubstantially (see Sect. 5.2 for a discussion of good ecologi-cal status).
Several mechanisms can explain the lack in biological re-sponse to the decrease in loads. A pool of nutrients in thesediment is probably the reason for a delay in the declineof nutrient concentrations as described above. Generally,
Hydrol. Earth Syst. Sci., 16, 2663–2683, 2012 www.hydrol-earth-syst-sci.net/16/2663/2012/

K. Hinsby et al.: Threshold values and management options for nutrients 2673
Table 5. Model calculated annual average N leaching and flow-weighted N concentrations in root zone water (1 m depth) from agri-cultural land within the three sub-catchments to the Horsens estuary.
Agro-hydrological Average N leaching Flow-weightedyears from root zone on N concentration from root
agricultural land zone on agricultural(kg ha−1 yr−1) land (mg l−1)
Hansted sub-catchment (136 km2)
2000 48.1 15.92001 85.3 18.72002 50.5 15.62003 52.8 22.72004 73.4 16.92005 35.1 22.6
Average 57.5 18.7
Bygholm sub-catchment (154 km2)
2000 48.2 16.52001 98.0 18.52002 53.3 15.02003 55.5 22.12004 78.0 17.52005 39.0 20.5
Average 62.0 18.4
Ungauged sub-catchment (228 km2)
2000 42.8 17.12001 73.0 19.82002 43.1 16.82003 42.6 26.92004 63.9 17.82005 31.3 23.8
Average 49.5 20.4
positive residuals for nitrogen, i.e. observed concentrationsthat are higher than expected from the models, were seenover nine years from 1992, when nitrogen concentrations inthe streams began to drop, until 2001 (Fig. 6). This could in-dicate a transition period where a positive net nitrogen fluxout of the sediments is important. Another important mech-anism is resuspension of sediment particles after the formerunderwater meadows of eelgrass are lost. A third factor canbe derived from Fig. 8 showing the relationship between con-centrations of inorganic nutrients and number of days withnutrient limitations as defined in Sect. 3.2.2; for average DINconcentrations (May–October) above 35 µg l−1, the percentof the time with N limitation is rather constant (Fig. 8). Thus,DIN is in surplus and only occasionally limits the growth ofphytoplankton during the growth season, particularly in theinner part of the estuary (Fig. 8a). Only when the averageDIN concentrations fall below about 35 µg l−1 will N limi-tation become significant. This pattern indicates that the re-ductions in N loads have removed a surplus of nitrogen inthe estuary, but have until recently not been sufficient to in-troduce significant N limitation of phytoplankton growth. Asimilar figure for P shows a more linear increase in the time
DIN
(µg
l-1),
N-lo
ads
(t m
onth
-1),
Win
d sp
eed
([m s
-1]-1
)
0
50
100
150
200
250
1985 1990 1995 2000 2005
Res
idua
ls, o
bs-e
st.,
(µg
l-1)
-20
0
20
40
a
b
Fig. 6. (a) Time series of inorganic nitrogen concentrations (DIN)from May to October (filled circles, response variable, the twoopen circles indicate outliers from the model, see Fig. 7), averageof monthly TN loads from January to October (open squares, x-variable, t month−1) and wind speed raised to the third (open trian-gles, x-variable, (m s−1)−1). (b) residual from model.
period with increasing limitation when average concentra-tions decline (Fig. 8b), and the inner and outer part of theestuary have approximately the same concentrations of DIP(Table 4).
4.4 Maximum acceptable N and P loads
Maximum acceptable total loads were defined on the basis ofFig. 8 and the assumption that nutrient limitation of phyto-plankton growth is necessary during most of the growth sea-son in order to achieve good ecological status (see Sect. 5.2for a discussion of good ecological status). We find it nec-essary to apply a “dual-nutrient reduction strategy” whereinboth N and P loads are reduced (Boynton and Kemp, 2008;Conley et al., 2009) in order to ensure good ecological status,and we have defined the average DIN and DIP concentrationswhere nutrient limitations occur during 2/3 of the growth sea-son as a reasonable threshold (Fig. 8). The correspondingthreshold values are 21 µg DIN l−1 and 7 µg DIP l−1 for theinner and outer estuary, respectively, calculated from the datain Figs. 8a and 7b. Once we have defined the target value,the corresponding loads can be calculated from the empirical
www.hydrol-earth-syst-sci.net/16/2663/2012/ Hydrol. Earth Syst. Sci., 16, 2663–2683, 2012

2674 K. Hinsby et al.: Threshold values and management options for nutrients
Table 6.Modeled N leaching and gross N emissions from diffuse sources within the catchment of Horsens estuary during the period 2000–2005. The TN removal in groundwater and surface water is also shown for the same period. Loadings are in t, concentrations in mg l−1.Numbers in parenthesis indicate the percentage of amount leached from the root zone.
AverageModeled streamgross Net flow-weighted
Agro- N leaching N emissions N removal N removal N loadingc N concentrationsd
hydrological from the from diffuse in ground in surface to Horsens at inlet toyears root zone sources watera waterb estuary estuary
2000 1851 1070 780 (42) 224 (21) 846 5.62001 3384 1519 1865 (55) 263 (17) 1256 6.02002 1952 1014 937 (48) 205 (20) 809 4.72003 1973 793 1180 (60) 189 (24) 605 5.02004 2856 1093 1763 (62) 233 (21) 860 5.12005 1390 669 721 (52) 168 (25) 501 4.4
Average 2234 1026 1208 (53) 213 (21) 813 5.1
a Percentage removed in groundwater is calculated as N removal divided by N leaching.b Percentage removed in surface water is calculatedas N removal divided by the sum of modeled gross N loss from diffuse sources and point source discharges of N (90 t yr−1). c Land-basedloading from diffuse sources (excluding N from atmospheric deposition and sewage outlets).d Excluding point source contributions.
models, assuming that climatic variables in the models areequal to their long term mean values. These are a N load of560 t yr−1 and a P load of 13 t P yr−1. These loadings result inestimated DIN concentrations of 20 and 5.3 µg N l−1 for theinner and outer parts of the estuary, respectively (Table 4).Thus, N limitation will occur during 2/3 of the time (Mayto October) in the inner part and for about 95 % of the timein the outer part. The estimated DIP concentrations corre-sponding to a TP load of 13 t yr−1 to the estuary are 6.0 and6.2 µg P l−1 for the inner and outer parts, respectively, whichare close to the values resulting in nutrient limitation for 2/3of the time from March to July. Please note that the con-centrations for DIN (20 and 5.3 µg N l−1) and DIP (6.0 and6.2 µg P l−1) are mean values over the season. Thus, higherconcentrations, allowing nutrient-replete growth of phyto-plankton, will still occur for approximately 1/3 of the time.
The considerations above only take DIN and DIP into ac-count despite the fact that dissolved organic matter is byfar the largest pool of nutrients, e.g. the ratio of TN:DINis about 150 (Figs. 4 and 6a). However, dissolved organicnitrogen (DON) is not readily taken up by phytoplankton,and is mainly used indirectly after mineralization of DON bybacteria. The concentrations of both inorganic and organic Nand P are determinated by loadings, biological processes andmixing with the marine end member. On an annual scale theestuary is a reactor transforming DIN (approximately 80 %of the loadings) to DON (Stedmon et al., 2006; Markager etal., 2011).
An alternative method for defining the target values forgood ecological status is to use the empirical models to cal-culate concentrations for TN and TP with the values for back-ground loadings. These will theoretically give the TN and TPconcentrations at pristine conditions. However, the empirical
models are then used for scenarios with loads far outsidethe range used for setting up the models and the outcomeis therefore uncertain. For TN the estimated pristine concen-tration is 398 µg l−1, when using the politically defined prac-tice of accepting a 26 % deviation from pristine conditions(Table 4). The corresponding load would be 743 t N yr−1, or33 % higher than the above mentioned 560 t N yr−1; however,given the uncertainty the two values are in reasonable agree-ment. For TP the model shows a low sensitivity betweenloadings and concentrations, and estimated pristine concen-trations are so high than an addition of 26 % will bring themabove the present concentrations, which clearly do not sup-port a good ecological status. Thus, this approach does notwork for TP. The reason for the low sensitivity of the empir-ical model with respect to TP is probably a high amount ofstored phosphorus in the sediments.
4.5 Calculated groundwater and stream thresholdvalues and groundwater chemical status inthe catchment of Horsens estuary
The maximum acceptable N and P loads (560 and 13 t) re-quired to ensure a good ecological status of the Horsens estu-ary were estimated in the previous section. These loads cor-respond to 52 and 56 % of the annual average TN and TPloads to the estuary for the period 2000 to 2005, respectively.To meet these reduction targets, we calculate the followingthreshold values in the two possible scenarios described pre-viously.
Hydrol. Earth Syst. Sci., 16, 2663–2683, 2012 www.hydrol-earth-syst-sci.net/16/2663/2012/

K. Hinsby et al.: Threshold values and management options for nutrients 2675
0
20
40
60
80
Observed DIN (µg l-1)
0 20 40 60 80 100 120
Mod
eled
DIN
(µg
l-1)
0
20
40
60
Mod
eled
DIN
(µg
l-1)
a
b
Fig. 7. (a) Observed and modeled values for inorganic nitrogen(DIN), average values from May to October from 1985 to 2006.Filled circles are values from 1985 to 2002, used in parameter se-lection. Open circles are values from 2003 to 2006, omitted andused for validation.+ values from 1993 and 1994 are identified asoutliers.(b) As (a), but all values from 1985 to 1992 and 1995 to2006 are used for estimation of coefficients. Model: DIN (May–October, normalized)= 0.5570· N load (January–October, normal-ized) +0.52· Wind3 (January the year before–October, normal-ized);R2 = 0.7.
4.5.1 Reduction targets and threshold values –scenario 1
The first scenario assumes that all reduction targets for Nand P are directed against the diffuse sources in the catch-ment (Table 7). The resulting TN and TP concentrationsin inlet freshwater to the estuary are calculated at 2.9 and0.084 mg l−1, respectively. The corresponding groundwaterthreshold value for TN in aerobic groundwater in the catch-ment is calculated at 6.0 mg l−1. No groundwater thresholdvalue in the catchment can be calculated for P as diffusesources such as soil erosion and stream bank erosion areimportant transport pathways which currently are not com-pletely quantified.
DIN concentration ( g l -1)
0 25 50 75 100 125
Per
cent
of d
ays
from
May
to O
ctob
er
0
25
50
75
100
DIP concentration ( g l -1)
0 4 8 12 16 20
Per
cent
of d
ays
from
Mar
ch to
Jul
y
0
25
50
75
100
a
b
Fig. 8. (a) Relationship between mean concentration and percentof days with limitation for inorganic nitrogen, DIN, and(b) inor-ganic phosphorous, DIP. Calculated annually from 1985 to 2006for Horsens estuary; filled circles (inner part), open circles (outerpart), respectively. For DIN the calculations are performed on datafrom May to October (184 days), and limitation is assumed to oc-cur when DIN < 14 µg l−1. For DIP the period is from Marchto July (153 days), and limitation is assumed to occur when DIP< 6.2 µg l−1. The vertical dashed lines indicate when limitationsoccur for 2/3 of the time, and the corresponding concentrations(DIN 21 µg l−1, DIP 7 µg l−1) are considered the target values forgood ecological status of the estuary. The vertical dotted line is theresulting DIN concentration for the outer part of the estuary with anannual N load of 560 t yr−1.
4.5.2 Reduction targets and threshold values –scenario 2
In the second scenario we are imposing reduction targetson point sources, direct atmospheric deposition (emissionfrom agriculture of ammonia), and diffuse sources (Table 8).The resulting N concentration in inlet freshwater to theestuary is 3.1 mg l−1, and the corresponding groundwaterthreshold value of N is calculated at 9.3 mg l−1, thus being
www.hydrol-earth-syst-sci.net/16/2663/2012/ Hydrol. Earth Syst. Sci., 16, 2663–2683, 2012

2676 K. Hinsby et al.: Threshold values and management options for nutrients
Table 7. Scenario for reductions in TN and TP in Horsens estuarywhere mitigation measures are only directed at diffuse sources inthe catchment. The required reduction is in t, the concentrations arein mg l−1.
Scenario 1
TN TP
Reduction in diffuse sources 526 10.4Current stream concentration 6.2 0.15Stream threshold concentration 2.9 0.084Current groundwater concentration 15a/0.3b 0.018a/0.13b
Groundwater threshold concentration 6.0 –
a Aerobic groundwater;b anaerobic groundwater.
considerably higher than in scenario 1. The reason is that re-duction in point sources, direct loads, and targeted mitigationmeasures such as restored wetlands and uncultivated bufferzones will assist in reducing the loadings to the estuary. Thescenario 2 calculations for P show that the reduction targetfor the estuary can be achieved in a longer term perspectiveby introducing targeted mitigation measures.
The calculated stream and groundwater threshold valuesfor the two scenarios are compared to current TN and TPconcentrations in Table 9. Note that the nitrate-N concentra-tions in streams is about 89 % of the TN concentration basedon measurements at monitoring stations; hence, the thresh-old value (TV) for nitrate-N is also 89 % of the TV for TNgiven here. The TV for nitrate-N in groundwater equals inpractice the TV for TN, based on measurements in moni-toring wells. The modeled groundwater concentrations arerecharge-weighted. The mean concentration of a sufficientnumber of monitoring wells in aerobic groundwater shouldequal this number if aerobic groundwater represents the samerecharge period as the modeled baseline period, i.e. 2000 to2005.
5 Discussion
5.1 Estimate of TN and TP loads from gauged and un-gauged catchments to the Horsens estuary
The model simulations of nitrogen leaching and the mod-eled gross and net nutrient emissions are believed to be ofrelatively high precision as the models applied are empiri-cal models developed based on the national monitoring datafrom agricultural fields in agricultural catchments (Grant etal., 2007) and stream monitoring data from 80 catchments(Windolf et al., 2011). This conclusion is corroborated bythe good fit to the measured stream concentrations in thegauged sub-catchments (Table 2). The simulated nitrogenconcentrations in the Hansted catchment equal the measuredvalues, whereas the simulated values in the Bygholm catch-ments are slightly lower than the measured values. The latter
deviation is the cause of the slightly lower estimate for theannual N loading to the estuary based on simulated values forthe Bygholm and Hansted catchments (1001 t for the period2001 to 2005) as compared to the estimate using measuredN loadings for these two catchments (1086 t). Of course, thiswill also affect the final computed threshold values for TN(Table 9). A previous inter-comparison of model estimateshas shown that the precision of N modeling in catchments israther high, whereas P modeling estimates currently have apoor precision (Kronvang et al., 2009b). It is worth noticingthat the simulated N concentrations, fluxes and retention inthe investigated catchment are comparable to what has beenfound in previous Danish studies in a coastal catchment ofthe Odense estuary about 50 km southeast of the Horsenscatchment. This catchment has a comparable setting and adata record of nearly 50 yr (e.g. Hinsby et al., 2008; Larsenet al., 2008).
5.2 Estimate of maximum acceptable loads
A key issue for management of an estuary is to establish max-imum acceptable loads. An assessment of this involves thedefinition of target values for one or several parameters in theestuary that describe good ecological status. Then, modelsfor quantitative relationships between loads and these param-eters are needed to estimate the maximum acceptable loadsrequired to reach these target values.
Recent research has demonstrated that dual-nutrient (N, P)reduction strategies are needed to alleviate eutrophication inestuaries and other coastal waters in the land–sea continuum(Boynton and Kemp, 2008; Conley et al., 2009; Paerl, 2009),and that the Redfield ratio for N and P in marine waters (16:
1, molar) cannot be considered a universally optimal ratiobetween N and P, but rather an average of species-specificN : P ratios (Klausmeier et al., 2004; Ptacnik et al., 2010).
Our approach has been to define good ecological status asaverage concentrations of inorganic nutrients, which ensurenutrient limited phytoplankton growth in 2/3 of the growthseason, taking into account the natural seasonal cycle wherephosphorous is limiting in the spring and nitrogen is limitinglater in the growth season.
The choice of 2/3 of the growth season may be debatable.Moreover, it is known that the Km value for growth of phyto-plankton varies between species (e.g. Falkowski, 1975) andthat growth rates are more closely coupled to the internal cellconcentrations than to external concentrations. However, westill find that the selected approach is based on reasonableecological rationales and that it gives a good indication ofthe nutrient concentration levels that ensure an acceptableecological status of the estuary. As recognized by Duarte etal. (2009), the definition of target loads and concentrationsfor achieving good ecological status of estuaries is probablythe most challenging part of the restoration process. In theend the definition of good ecological status will always havea political dimension, and our scientifically based definitions
Hydrol. Earth Syst. Sci., 16, 2663–2683, 2012 www.hydrol-earth-syst-sci.net/16/2663/2012/

K. Hinsby et al.: Threshold values and management options for nutrients 2677
Table 8. Scenario for reductions in TN and TP in Horsens estuary. Reduction targets are in t, concentrations are in mg l−1. Mitigationmeasures are directed both at point sources and atmospheric deposition from agriculture, and targeted as well as general mitigation measuresagainst diffuse sources are also utilized.
Scenario 2
TN TP
Total reduction target Horsens estuary 526 10.4
Reduction in point sourcesClosing of marine fish farm 11 1.3950 % reduction larger point sources 40 2.75Total 51 4.14
Reduction in atmospheric deposition25 % reduction atm. deposition 25 –Remaining reduction target Horsens estuary 450 5.90
Targeted mitigation measures in catchmentRestored riparian wetlands (300 ha) 60a 3.0a
10 m buffer zones with tree planting along 300 km watercourses2 24a 3.0b
Remaining reduction implemented as general mitigation366 0measures on diffuse sources
Stream threshold concentration 3.1 0.084Groundwater threshold concentration 9.3 –
a Immediate reduction;b longer term reduction (10–30 yr).
of good ecological status and implied targets for loadings canonly be guidelines for the political decision process.
The use of empirical models for relationships betweenloads and nutrient concentrations in the estuary works well.However, it is important to remember that empirical modelsdescribe the present conditions in the estuary and only have atime lag between loads and effects in the estuary of approxi-mately one year. Thus, effects with a longer time lag and pos-sible regime shifts (Scheffer et al., 2001) are not accountedfor. This is presumably the reason why changes in water clar-ity and depth limits of eelgrass give very weak models withlow sensitivity (data not shown). This is most likely due topools of nutrients stored in the sediments, which only slowly(presumably over decades) are released and emptied duringa phase with decreasing loadings. Predicting these time lagsand regime shifts, e.g. from the present phytoplankton dom-inated system back to an eelgrass dominated system, is ex-tremely difficult but clearly a major scientific challenge forthe coming years.
In conclusion, the empirical models applied here provide areasonably good prediction of nutrient concentrations duringchanges in loadings within the range of loadings for whichthey are developed. Effects of changes in loadings signifi-cantly outside this range or for other regimes of the ecosys-tem are very uncertain. The lowest loadings in the data setencompass the predicted targets for N and P, so the model isnot used outside the data range. However, additional effectsof processes with time lag of decades are not accounted for.
Table 9.Current groundwater and stream concentrations and calcu-lated threshold values (TV) for TN and TP. The TVs are computedfor the two scenarios (management options) described in the text.All values are in mg l−1.
Current TV TVconc. Scenario 1 Scenario 2
Groundwater TN 15a 6.0a 9.3a
(aerobic part) TP 0.018b –?c –?c
Streams TN 6.1d 2.9 3.1TP 0.15 0.084 0.084
a Based on the combined use of monitoring and modeling data for the period2000–2005;b based on monitoring data only;c estimation still not possible –more research is needed;d average of modeled concentrations in the threesub-catchments of Horsens estuary.
5.3 Scenarios and management options for N and P inHorsens estuary
The reduction targets for N (526 t) and P (10.4 t) can be ac-complished by different mitigation measures in the catch-ment and introducing improved treatment of sewage water atpoint sources discharging either to freshwater or directly tothe estuary. As described previously, we have developed twopossible management options that could be introduced to re-duce the N and P loadings to levels allowing good ecologicalstatus in the Horsens estuary.
www.hydrol-earth-syst-sci.net/16/2663/2012/ Hydrol. Earth Syst. Sci., 16, 2663–2683, 2012

2678 K. Hinsby et al.: Threshold values and management options for nutrients
The first scenario assumes that the entire N reduction is ob-tained by introducing mitigation measures, which reduce theN leaching from the root zone of agricultural fields. The inletTN and TP concentrations in freshwater discharging to theHorsens estuary has to be reduced from 6.2 to 2.9 mg l−1 and0.15 mg l−1 to 0.084 mg l−1, respectively, for obtaining goodecological status. The resulting model calculated thresholdvalue of TN in the root zone and aerobic groundwater atand below a depth of one meter is 6.0 mg l−1 (equivalentto 26.5 mg l−1 NO−
3 ) as an average for the entire catchmentarea (Table 7). However, the threshold value for TN underagricultural fields can be allowed to be higher (7.4 mg l−1,equivalent to 32.7 mg l−1 NO−
3 ) because approximately onethird of the catchment area is in a non-agricultural land covercategory, with a low background concentrations of TN ingroundwater (< 1 mg l−1 in some areas, Postma et al., 1991)and streams (approximately 1.2 mg l−1) (Kronvang et al.,2005). As phosphorus is derived via many hydrological path-ways (leaching, erosion, and surface runoff) to surface wa-ters (Kronvang et al., 2007), it is not possible to calculate agroundwater P threshold value with our current knowledge.
Our second reduction scenario for N and P involves reduc-tion in discharges of nutrients from point sources, enhancingN and P retention processes in surface waters (reestablishingriparian wetlands, introducing buffer strips, etc.), and reduc-tions in diffuse sources (Hejzlar et al., 2006; Hoffmann etal., 2009, 2011; Kronvang et al., 2009a). Such a catchmentmanagement plan allows the groundwater threshold value tobe higher (average for entire catchment area is 9.3 mg N l−1)
than in the first scenario. The threshold N concentration un-der agricultural fields in the catchment is then calculatedto 11.8 mg N l−1 (52 mg l−1 as nitrate). Note that the latteris above the US as well as the European drinking waterstandards of 10 mg l−1 nitrate-N (∼ 44 mg l−1 nitrate) and50 mg l−1 nitrate, respectively. In such a case the drinkingwater standard will have to be applied as a threshold valueaccording to European directives and guidelines. The secondscenario for P seems to be enough to reduce the P loadingsto the required target and reach the corresponding thresholdvalue of 0.084 mg l−1 for phosphorus in streams. This will,however, take some time as some of the surface water man-agement methods need a long period to work efficiently inreducing P (buffer strips, Table 7).
An additional management option for reduction of nutri-ent loadings to the estuary is linked to a spatial analysis ofnitrogen sources within the catchment of Horsens estuary,where the catchment is divided into sub-catchments (Win-dolf et al., 2011). Lumped results of model calculations ofgross N emissions and sinks within 27 sub-catchments areavailable for the Horsens estuary catchment. Eight of thesesub-catchments are located downstream of the larger lakesin the catchment (downstream from the two river monitoringstations), so management of N within agricultural produc-tion in this area will be most cost effective as no natural N
reduction takes place in lakes in these sub-catchments (Th-odsen et al., 2009).
The management option chosen is to transform land usefrom agricultural land to forest land in this 154 km2 sub-catchment. This will lead to a reduction of the N loading tothe estuary of 200 t N per year. The remaining 326 t N hasto be removed from the catchment upstream the two largerlakes. An annual N retention of 13 % of the incoming N loadto the two lakes (Bygholm and Nørrestrand) has been calcu-lated using the N retention model from Windolf et al. (2011).Thus, the N loading to these two lakes has to be reduced to409 t N per year. As the retention of N in groundwater andsurface waters within the catchment upstream the two lakesamounts to around 60 % of the N leached from the root zone,we can calculate that the threshold N concentration in uppergroundwater can be allowed to be approximately 10 % higherthan the threshold value of 7.4 mg N l−1 under agriculturalareas calculated in scenario 1.
5.4 Estimation of groundwater threshold values frommaximum acceptable loads and differentmanagement options
It has been demonstrated through the previous sections thatgroundwater threshold values derived based on maximum ac-ceptable loads to an associated aquatic ecosystem dependon technically and politically realistic management optionsto reduce nutrient loads to the ecosystem. Consequently,groundwater threshold values for nutrients derived to protectecosystems will never be universal as drinking water stan-dards typically are. Ecological driven groundwater thresh-old values should always be derived for a specific geolog-ical, climatological and agricultural setting. Values derivedfor similar settings may, however, be used if data on givenwater bodies and ecosystems are insufficient for derivationof groundwater threshold values. Groundwater threshold val-ues derived for a comparable setting should probably of-ten be preferred to drinking water standards, which are cur-rently used as the threshold value for nitrate by most Eu-ropean countries. The calculated groundwater thresholds inthis paper are average annual flow (recharge)-weighted con-centrations acceptable in aerobic groundwater discharging tostreams in the catchment. As the water table and the upperaerobic groundwater zone are very shallow in the investi-gated catchment (< 5 m), the aerobic groundwater generallyrecharged the aquifers within the last few years. Hence, aver-age concentrations in a representative number of monitoringscreens in the aerobic zone (if present) should not exceed theflow-weighted groundwater threshold values obtained by theconducted model simulations. Unfortunately, the number ofmonitoring wells in aerobic groundwater in the catchment isvery small and several of them are probably screened acrossthe redox boundary. The average TN concentration in aerobicgroundwater calculated from monitoring wells in the aerobic
Hydrol. Earth Syst. Sci., 16, 2663–2683, 2012 www.hydrol-earth-syst-sci.net/16/2663/2012/

K. Hinsby et al.: Threshold values and management options for nutrients 2679
Fig. 9. Nitrate-N concentrations (mg l−1) in groundwater monitoring wells (latest measurement). Most monitoring wells are located inanaerobic groundwater and therefore contain no nitrate and low dissolved inorganic nitrogen concentrations (DIN).
zone is therefore not considered to be representative for aer-obic groundwater in the catchment.
5.5 Groundwater chemical status
If a groundwater threshold value derived for protection ofan associated ecosystem is breached in a given groundwaterbody, the groundwater body or part of a groundwater bodyhas to be classified as having poor status. In the case of ni-trogen, for example, it is necessary to evaluate the concen-trations of the different nitrogen species separately for theaerobic and anaerobic parts of the groundwater bodies. Thisis important as nitrate, which represents practically the entireTN in aerobic groundwater, is reduced to the inactive, harm-less N2 in anaerobic groundwater (e.g. Appelo and Postma,2005). Consequently, TN concentrations are typically morethan an order of magnitude lower in the anaerobic zone thanin the aerobic zone, and the anaerobic zone thus contributesrelatively little to N loads.
Hence, the general groundwater chemical status in thecatchment based on nitrogen species should generally be as-sessed for the aerobic groundwater separately. Conceptualmodels of the extension of the aerobic groundwater and theirrole for surface water nitrogen loads as represented here(Fig. 2) should support the risk analysis. If data on aero-bic groundwater are missing or scarce, measured stream ni-trate or TN concentrations are useful indicators of the statusof the shallow aerobic groundwater in the catchment, when
wastewater and other nitrogen sources are taken into account.This is clearly illustrated when comparing results from Fig. 9and Table 9. Figure 9 leaves the impression that relativelyfew groundwater bodies have problems with nitrate, whiledata in Table 9 clearly demonstrate that nitrate concentra-tions are generally too high in the catchment. Hence, the con-ducted model simulations show that the groundwater chemi-cal status based on nitrate concentrations in aerobic ground-water is generally poor below farm lands in the area, and thatthe quality of shallow aerobic groundwater in the catchmentdoes not comply with European legislation.
5.6 Implications for integrated monitoring andmodeling of water bodies
The previous section clearly demonstrates that groundwaterand surface water monitoring should be integrated in orderto obtain as much information as possible on the chemicalstatus of both water body types, and in order to derive mean-ingful groundwater threshold values for protection of associ-ated and dependent aquatic and terrestrial ecosystems. As theecological status of surface waters depends on the nutrientloadings and the seasonality in nutrient loadings, water qual-ity monitoring programs should provide the necessary datato calculate and simulate these by coupled groundwater andsurface water models, not least when possible climate changeimpacts have to be assessed (Andersen et al., 2006; Sonnen-borg et al., 2012). In addition, reliable models and design of
www.hydrol-earth-syst-sci.net/16/2663/2012/ Hydrol. Earth Syst. Sci., 16, 2663–2683, 2012

2680 K. Hinsby et al.: Threshold values and management options for nutrients
efficient monitoring programs for assessment of groundwaterimpacts on ecosystems require a sound understanding of thesite specific hydrogeological, physical, and chemical condi-tions controlling the groundwater–surface water interaction(Dahl et al., 2007; Dahl and Hinsby, 2012). This challengesthe traditional and still very relevant groundwater monitoringof major aquifers, which is targeted at drinking water inter-ests. Furthermore, it may also challenge surface water moni-toring traditions, as models being able to simulate runoff andnutrient concentrations with a high spatial and temporal vari-ation and coverage are needed, and they require reliable mon-itoring data for calibration.
5.7 Climate change impact on N and P loadings tocoastal ecosystems
Before concluding this work a short note on the possibleeffect of projected climate change on groundwater thresh-old values in the investigated study area is called for. Muchresearch is currently undertaken in order to assess the pro-jected climate change impact on the hydrological cycle glob-ally. Previous work has indicated that winter precipitationand hence nutrient loadings to coastal waters may increasein Denmark, which is located in the western Baltic Sea (An-dersen et al., 2006; Jeppesen et al., 2009, 2011; Aquarius,2011; Sonnenborg et al., 2012), and in the Baltic Sea in gen-eral (Hagg et al., 2010), although significant uncertainties ex-ist, e.g. due to changes in crops and farming practices (Ole-sen et al., 2007). Furthermore, while increased temperaturesare expected to increase crop yields in the North Sea andBaltic Sea regions (Aquarius, 2011), the increased tempera-tures will render coastal ecosystems more prone to harmfulalgal blooms (Paerl and Huisman, 2009) and hypoxia as min-eralization accelerates with higher temperatures. In such ascenario groundwater threshold values will have to be lowerthan the values derived in this paper. Hence, for Denmarkand the other countries in the region the mitigation measures,which are implemented to assure good chemical and ecolog-ical status of water bodies, may not be sufficient in the fu-ture, as projected climate change may work against these.The present paper sets the scene and establishes the neededknowledge base for an integrated understanding of the Hors-ens estuary and catchment system for the assessment of cli-mate change impacts on groundwater threshold values andchemical status in the future. The approach presented in thispaper is applicable in many coastal catchments, globally.
6 Conclusions
As a result of the intensive agriculture in Denmark, the ma-jority of Danish coastal waters have poor ecological status.Hence, the development of catchment or river basin manage-ment plans for reduction of nutrient loads and determinationof threshold values in groundwater, streams, and estuaries are
becoming increasingly important. The present study analysesand presents (1) the historical and current nutrient loadingsfor the investigated Horsens estuary, (2) the current ecolog-ical conditions of the estuary, and (3) necessary reductionsin nutrient loadings for obtaining a good ecological statusin the estuary applying a combination of empirical loading-response models. We estimate that the TN and TP annualloads for the investigated baseline period (2000 to 2005)should be reduced to 560 and 13 t, respectively, correspond-ing to 52 and 56 % of the annual average for the investi-gated baseline period. Using different scenarios we demon-strate that especially the groundwater threshold values andmaximum acceptable concentrations are quite sensitive to thechoice of mitigation measures and management options inthe catchment. Depending on the selected management sce-nario, we estimate that groundwater threshold values for TNvary between 6.0 and 9.3 mg l−1, while the correspondingstream threshold values vary between 2.9 and 3.1 mg l−1.As the current modeled average concentrations in shallowaerobic groundwater and streams are 15 and 6.2 mg l−1, re-spectively, our investigation clearly shows that groundwaterand stream threshold values are breached in the catchment.Hence, the major part of the shallow aerobic groundwater inthe catchment of Horsens estuary is of poor chemical sta-tus due to farming practices and does not comply with theEuropean Water Framework and Groundwater Directives. Toobtain good chemical status for shallow aerobic groundwaterin the investigated catchment, our data show that the averageTN concentration should be lowered to approximately half(40 to 62 % – depending on the applied management option)of the present concentration. These reductions correspond toNO3-N threshold values in the range of 6–9 mg l−1 (or 27 to41 mg l−1 of nitrate), assuming that the nitrate species consti-tute the entire TN in shallow aerobic groundwater. Accordingto our evaluation, the flow-weighted annual average concen-tration of TP in streams in the catchment should be loweredfrom the present 0.15 to 0.084 mg l−1. However, the presentstudy indicates that it is not relevant to establish groundwaterthreshold values for TP in the investigated catchment as theelevated concentrations apparently occur only in anaerobicgroundwater due to dissolution from natural sources, and amajor and unknown part of the TP in streams originates frombrink erosion. The transport of TP is, however, not as wellunderstood as the transport of TN and should be investigatedfurther. It is interesting to note that one of the presented man-agement scenarios would allow aerobic groundwater nitrateconcentrations below farm lands even above drinking waterstandards if focusing solely on the good status objective forthe estuary. However, such high concentrations would jeop-ardize the chemical status of groundwater used for drinkingwater, and the ecological status of ecosystems in the catch-ment such as lakes and wetlands. Hence, an integrated as-sessment of acceptable loads and thresholds for both coastalwaters and surface and subsurface waters in the catchmentis imperative when thresholds have to cover other relevant
Hydrol. Earth Syst. Sci., 16, 2663–2683, 2012 www.hydrol-earth-syst-sci.net/16/2663/2012/

K. Hinsby et al.: Threshold values and management options for nutrients 2681
ecosystems in a catchment such as lakes and protected terres-trial ecosystems. The threshold values derived in this study toensure good ecological status of the Horsens estuary may notensure good ecological status for all ecosystems in the catch-ment. Furthermore, climate change impacts will most prob-ably require lower groundwater and stream threshold valuesin the future to ensure good ecological status of associatedaquatic ecosystems.
Appendix A
Calculation of precision and bias on TN loadingsin streams
The mean precision (Root Mean Square Error, RMSE) andbias from the validation of the model for TN loading atthe two gauged stream stations are calculated to amount to15.2 % and 10.5 %, respectively. Combining the uncertaintyof the TN loading from both gauged (precision: 10 %; bias:0 %; mean N loading: 726 t N yr−1) and ungauged catchmentareas (mean TN loading: 570 t N yr−1) of the Horsens estu-ary reveals a mean precision and bias, shown in Eqs. (A1)and (A2), respectively.
Precision of TN loading:√
(726× 0.1+ 570× 0.152)2
(726+ 570)× 100 %= 8.7 %. (A1)
Bias on TN loading:(726× 0+ 570× 0.105)
726+ 570× 100 %= 4.6 %. (A2)
The precision (RMSE) and bias calculated for the TN loadingcan be considered an estimate of the precision and bias of theTN loading estimates for the model scenarios.
Acknowledgements.This article is an outcome of the EU InterregIVB project CLIWAT. It has been co-funded by the North SeaRegion Program 2007–2013 under the ERDF of the EuropeanUnion, and supported by the Danish Strategic Research Foundationprojects MONITECH (104-08-0050) and MAFIA (09-067259).We acknowledge Lauren Paige Seaby for linguistic assistance, andDirk-Ingmar Muller-Wohlfeil for his constructive review, whichimproved the manuscript.
Edited by: A. Guadagnini
References
Abbott, M., Bathurst, J., Cunge, J., Oconnell, P., and Rasmussen, J.:An Introduction to the European Hydrological System – SystemeHydrologique Europeen, She. 2. Structure of a Physically-Based,Distributed Modeling System, J. Hydrol., 87, 61–77, 1986.
Andersen, H. E., Kronvang, B., and Larsen, S. E.: Development,validation and application of Danish empirical phosphorus mod-els, J. Hydrol., 304, 355–365, 2005.
Andersen, H. E., Kronvang, B., Larsen, S. E., Hoffmann, C. C.,Jensen, T. S., and Rasmussen, E. K.: Climate-change impacts onhydrology and nutrients in a Danish lowland river basin, Sci. To-tal Environ., 365, 223–237, 2006.
Appelo, C. A. J. and Postma, D.: Geochemistry, groundwater andpollution, Balkema, Leiden, 2005.
Aquarius: Main findings from Aquarius – Farmers as water man-agers in the North Sea region, Report from the Aquarius project,the Interreg IVB North Sea Region Programme, Knowledge Cen-tre for Agriculture, Aarhus, 2011.
BLST: Vandplan – Hovedopland 1.9 Horsens, Danish Agency forSpatial and Environmental Planning, Ministry of the Environ-ment, Copenhagen, 1–206, 2010.
Boynton, W. R. and Kemp, W. M.: Estuaries, in: Nitrogen in theMarine Environment, edited by: Capone, D. G., Bronk, D. A.,Mulholland, M. R., and Carpenter, E. J., Elsevier, Burlington,809–866, 2008.
Broadhurst, D., Goodacre, R., Jones, A., Rowland, J. J., and Kell, D.B.: Genetic algorithms as a method for variable selection in mul-tiple linear regression and partial least squares regression, withapplications to pyrolysis mass spectrometry, Anal. Chim. Acta,348, 71–86, 1997.
Camargo, J. A. and Alonso, A.: Ecological and toxicological effectsof inorganic nitrogen pollution in aquatic ecosystems: A globalassessment, Environ. Int., 32, 831–849, 2006.
Christensen, P. B., Rysgaard, S., Sloth, N. P., Dalsgaard, T., andSchwærter, S.: Sediment mineralization, nutrient fluxes, denitri-fication and dissimilatory nitrate reduction to ammonium in anestuarine fjord with sea cage trout farms, Aquat. Microb. Ecol.,21, 73–84, 2000.
Cloern, J.: Our evolving conceptual model of the coastal eutrophi-cation problem, Mar. Ecol.-Prog. Ser., 210, 223–253, 2001.
Conley, D. J., Kaas, H., Mohlenberg, F., Rasmussen, B., and Win-dolf, J.: Characteristics of Danish estuaries, Estuaries, 23, 820–837, 2000.
Conley, D. J., Markager, S., Andersen, J., Ellermann, T., and Svend-sen, L. M.: Coastal eutrophication and the Danish NationalAquatic Monitoring and Assessment Program, Estuaries, 25,848–861, 2002.
Conley, D. J., Paerl, H. W., Howarth, R. W., Boesch, D. F.,Seitzinger, S. P., Havens, K. E., Lancelot, C., and Likens, G. E.:Controlling Eutrophication: Nitrogen and Phosporus, Science,323, 114–115, 2009.
Dahl, M. and Hinsby, K.: Typology of groundwater – surface wa-ter interaction (GSI typology), in: Groundwater and Ecosystems,Selected papers on Hydrogeology 17, edited by: Ribeiro, L.,Stigter, T. Y., Chambel, A., Condesso de Melo, M. T., Monteiro,J. P., and Medeiros, A., Taylor and Francis, Oxon, in press, 2012.
Dahl, M., Nilsson, B., Langhoff, J. H., and Refsgaard, J. C.: Re-view of classification systems and new multi-scale typology ofgroundwater-surface water interaction, J. Hydrol., 344, 1–16,
www.hydrol-earth-syst-sci.net/16/2663/2012/ Hydrol. Earth Syst. Sci., 16, 2663–2683, 2012

2682 K. Hinsby et al.: Threshold values and management options for nutrients
2007.Diaz, R. J. and Rosenberg, R.: Spreading dead zones and conse-
quences for marine ecosystems, Science, 321, 926–929, 2008.Duarte, C. M., Conley, D. J., Carstensen, J., and Sanchez-Camacho,
M.: Return to Neverland: Shifting baselines affect eutrophicationrestoration targets, Estuar. Coast., 32, 29–36, 2009.
Eppley, R. W., Rogers, J. N., and McCarthy, J. J.: Half-saturationconstants for uptake of nitrate and ammonium by marine phyto-plankton, Limnol. Oceanogr., 14, 912–920, 1969.
EU, directive 2000/70/EC: The EU Water Framework Directive,2000.
EU, directive 2006/118/EC: The EU Groundwater Directive, 2006.EU, directive 2009/90/EC: The Monitoring Directive, 2009.Falkowski, P. G.: Nitrate uptake in marine phytoplankton: Com-
parison of half saturation constants from seven species, Limnol.Oceanogr., 20, 412–417, 1975.
Galloway, J. N., Dentener, F. J., Capone, D. G., Boyer, E. W.,Howarth, R. W., Seitzinger, S. P., Asner, G. P., Cleveland, C. C.,Green, P. A., Holland, E. A., Karl, D. M., Michaels, A. F., Porter,J. H., Townsend, A. R. and Vorosmarty, C. J.: Nitrogen cycles:past, present, and future, Biogeochemistry, 70, 153–226, 2004.
Gustafsson, K. E. and Bendtsen, J.: Elucidating the dynamics andmixing agents of a shallow fjord through age tracer modeling,Estuar. Coast. Shelf S., 74, 703–716, 2007.
Graham, D. N. and Butts, M. B.: Flexible, integrated watershedmodelling with MIKE SHE, in: Watershed models, edited by:Singh, V. P. and Frevert, D. K., CRC Press, Boca Raton, FL.,245–272, 2005.
Grant, R., Blicher-Mathiesen, G., Pedersen, L. E., Jensen, P. G.,Madsen, I., Hansen, B., Brusch, W., and Thorling, L.: Lan-dovervagningsoplande 2006, National Environmental ResearchInstitute, Aarhus University, Aarhus, 123 pp., 2007.
Griebler, C., Stein, H., Kellermann, C., Berkhoff, S., Brielmann, H.,Schmidt, S., Selesi, D., Steube, C., Fuchs, A., and Hahn, H. J.:Ecological assessment of groundwater ecosystems – Vision orillusion?, Ecol. Eng., 36, 1174–1190, 2010.
Hagg, H. E., Humborg, C., Morth, C. M., Medina, M. R., andWulff, F.: Scenario Analysis on Protein Consumption and Cli-mate Change Effects on Riverine N Export to the Baltic Sea, En-viron. Sci. Technol., 44, 2379–2385, 2010.
Hansen, B., Thorling, L., Dalgaard, T., and Erlandsen, M.: TrendReversal of Nitrate in Danish Groundwater – a Reflection ofAgricultural Practices and Nitrogen Surpluses since 1950, En-viron. Sci. Technol., 45, 228–234, 2011.
Hejzlar, J., Samalova, K., Boers, P., and Kronvang, K.: Modelingphosphorus retention in lakes and reservoirs, Water Air Soil Poll.,6, 487–494, 2006.
Hejzlar, J., Anthony, S., Arheimer, B., Behrendt, H., Bouraoui, F.,Grizzetti, B., Groenendijk, P., Jeuken, M. H. J. L., Johnsson, H.,Lo Porto, A., Kronvang, B., Panagopoulos, Y., Siderius, C., Sil-gram, M., Venohr, M. and Zaloudik, J.: Nitrogen and phosphorusretention in surface waters: an inter-comparison of predictionsby catchment models of different complexity, J. Environ Moni-tor., 11, 584–593, 2009.
HELCOM: HELCOM Baltic Sea Action Plan, HEE, 101 pp., 2007.Henriksen, H. J., Troldborg, L., Nyegaard, P., Sonnenborg, T. O.,
Refsgaard, J. C., and and Madsen, B.: Methodology for construc-tion, calibration and validation of a national hydrological modelfor Denmark, J. Hydrol., 280, 52–71, 2003.
Hinsby, K. and Jørgensen, L. F.: Groundwater monitoring in Den-mark and the Odense Pilot River Basin in relation to EU legisla-tion, in: Groundwater Monitoring, Ph. Quevauviller, AM Fouil-lac, edited by: Grath, J. and Ward, R., Wiley, Hoboken, 207–224,2009.
Hinsby, K., de Melo, M. T. C., and Dahl, M.: European case stud-ies supporting the derivation of natural background levels andgroundwater threshold values for the protection of dependentecosystems and human health, Sci. Total Environ., 401, 1–20,2008.
Hoffmann, C. C., Kjaergaard, C., Uusi-Kamppa, J., Hansen, H. C.B., and Kronvang, B.: Phosphorus Retention in Riparian Buffers:Review of Their Efficiency RID B-6714-2011, J. Environ. Qual.,38, 1942–1955, 2009.
Hoffmann, C. C., Kronvang, B., and Audet, J.: Evaluation of nutri-ent retention in four restored Danish riparian wetlands, Hydrobi-ologia, 674, 5–24, 2011.
Jeppesen, E., Kronvang, B., Meerhoff, M., Sondergaard, M.,Hansen, K. M., Andersen, H. E., Lauridsen, T. L., Liboriussen,L., Beklioglu, M., Ozen, A., and Olesen, J. E.: Climate ChangeEffects on Runoff, Catchment Phosphorus Loading and LakeEcological State, and Potential Adaptations, J. Environ. Qual.,38, 1930–1941, 2009.
Jeppesen, E., Kronvang, B., Olesen, J. E., Audet, J., Sondergaard,M., Hoffmann, C. C., Andersen, H. E., Lauridsen, T. L., Libo-riussen, L., Larsen, S. E., Beklioglu, M., Meerhoff, M., Ozen,A., and Ozkan, K.: Climate change effects on nitrogen loadingfrom cultivated catchments in Europe: implications for nitrogenretention, ecological state of lakes and adaptation, Hydrobiolo-gia, 663, 1–21, 2011.
Klausmeier, C., Litchman, E., Daufresne, T., and Levin, S.: Optimalnitrogen-to-phosphorus stoichiometry of phytoplankton, Nature,429, 171–174, 2004.
Kronvang, B. and Bruhn, J. A.: Choice of sampling strategy andestimation method when calculating nitrogen and phosphorustransport in small lowland streams, Hydrol. Process., 10, 1483–1501, 1996.
Kronvang, B., Grant, R., Larsen, S. E., Svendsen, L. M., and Kris-tensen, P.: Non-Point-Source Nutrient Losses to the Aquatic En-vironment in Denmark – Impact of Agriculture, Marine Fresh-water Res., 46, 167–177, 1995.
Kronvang, B., Jeppesen, E., Conley, D. J., Sondergaard, M., Larsen,S. E., Ovesen, N. B., and Carstensen, J.: Nutrient pressuresand ecological responses to nutrient loading reductions in Dan-ish streams, lakes and coastal waters, J. Hydrol., 304, 274–288,2005.
Kronvang, B., Vagstad, N., Behrendt, H., Bogestrand, J., andLarsen, S. E.: Phosphorus losses at the catchment scale withinEurope: an overview, Soil Use Manage., 23, 104–116, 2007.
Kronvang, B., Andersen, H. E., Borgesen, C., Dalgaard, T., Larsen,S. E., Bogestrand, J., and Blicher-Mathiasen, G.: Effects of pol-icy measures implemented in Denmark on nitrogen pollutionof the aquatic environment, Environ. Sci. Policy, 11, 144–152,2008.
Kronvang, B., Hoffmann, C. C., and Droge, R.: Sediment deposi-tion and net phosphorus retention in a hydraulically restored low-land river-floodplain in Denmark: combining field studies withlaboratory experiments, Marine Freshwater Res., 60, 638–646,2009a.
Hydrol. Earth Syst. Sci., 16, 2663–2683, 2012 www.hydrol-earth-syst-sci.net/16/2663/2012/

K. Hinsby et al.: Threshold values and management options for nutrients 2683
Kronvang, B., Behrendt, H., Andersen, H. E., Arheimer, B., Barr,A., Borgvang, S. A., Bouraoui, F., Granlund, K., Grizzetti, B.,Groenendijk, P., Schwaiger, E., Hejzlar, J., Hoffmann, L., Johns-son, H., Panagopoulos, Y., Lo Porto, A., Reisser, H., Schoumans,O., Anthony, S., Silgram, M., Venohr, M. and Larsen, S. E.: En-semble modelling of nutrient loads and nutrient load partitioningin 17 European catchments, J. Environ. Monitor., 11, 572–583,2009b.
Kristensen, K., Waagepetersen, J., Børgesen, C. D., Vinther, F.P., Grant, R., and Blicher-Mathiesen, G.: Reestimation and fur-ther development in the model N-LES N-LES3 to N-LES4,DJ F PLANT SCIENCE, 139, Faculty of Agricultural Sciences,Aarhus University, Denmark, 2008.
Larsen, M. A. D., Soegaard, H., and Hinsby, K.: Temporal trendsin N & P concentrations and loads in relation to anthropogeniceffects and discharge in Odense River 1964–2002, Hydrol. Res.,39, 41–54, 2008.
Larsen, S. E., Kronvang, B., Windolf, J., and Svendson, L. M.:Trends in diffuse nutrient concentrations and loading in Den-mark: Statistical trend analysis of stream monitoring data, WaterSci. Technol., 39, 197–205, 1999.
Lomstein, B. A., Jensen, A.-G. U., Hansen, J. W., Andreasen, J.B., Hansen, L. S., Berntsen, J., and Kunzendorf, H.: Budgets ofsediment nitrogen and carbon cycling in the shallow water ofKnebel Vig, Denmark, Aquatic Microbial Ecology, Vol. 14, 69–80, 1998.
MacIsaac, J. J. and Dugdale, C.: The kinetics of nitrate and am-monia uptake by natural populations of marine phytoplankton,Deep-Sea Res., 16, 45–57, 1969.
Markager, S., Bassompierre, M., and Petersen, D. J.: Analyse afMiljøtilstanden i Horsens Fjord fra 1985 til 2006 – empiriskmodellering, Nationals University, Aarhus, 1–90, 2010.
Markager, S., Stedmon, C. A., and Sondergaard, M.: Seasonal dy-namics and conservative mixing of dissolved organic matter inthe temperate eutrophic estuary Horsens Fjord, Estuar. Coast.Shelf S., 92, 376–388, 2011.
Martens, H. A. and Dardenne, P.: Validation and verification of re-gression in small data sets, Chemometr. Intell. Lab., 44, 99–121,1998.
Olesen, J. E., Carter, T. R., az-Ambrona, C. H., Fronzek, S., Heid-mann, T., Hickler, T., Holt, T., Minguez, M. I., Morales, P., Palu-tikof, J. P., Quemada, M., Ruiz-Ramos, M., Rubaek, G. H., Sau,F., Smith, B., and Sykes, M. T.: Uncertainties in projected im-pacts of climate change on European agriculture and terrestrialecosystems based on scenarios from regional climate models,Climatic Change, 81, 123–143, 2007.
Paerl, H. W.: Controlling Eutrophication along the Freshwater –Marine Continuum: Dual nutrient (N and P) Reductions are Es-sential, Estuar. Coast., 32, 593–601, 2009.
Paerl, H. W. and Huisman, J.: Climate change: a catalyst for globalexpansion of harmful cyanobacterial blooms, Environmental Mi-crobiology Reports, 1, 27–37, 2009.
Postma, D., Boesen, C., Kristiansen, H., and Larsen, F.: Nitrate re-duction in an unconfined sandy aquifer – water chemistry, reduc-tion processes and geochemical modeling, Water Resour. Res.,27, 2027–2045, 1991.
Ptacnik, R., Andersen, T., and Tamminen, T.: Performance of theRedfield Ratio and a Family of Nutrient Limitation Indicators asThresholds for Phytoplankton N vs. P Limitation, Ecosystems,13, 1201–1214, 2010.
Quile, K., Becker, A., Kirchesch, V., Schol, A., and Fisher, H.: In-fluence of global change on phytoplankton and nutrient cyclingin the Elba River, Reg. Environ. Change, 11, 405–442, 2011.
Rockstrom, J., Steffen, W., Noone, K., Persson, A., Chapin, F. S.,Lambin, E. F., Lenton, T. M., Scheffer, M., Folke, C., Schellnhu-ber, H. J., Nykvist, B., de Wit, C. A., Hughes, T., van der Leeuw,S., Rodhe, H., Sorlin, S., Snyder, P. K., Costanza, R., Svedin,U., Falkenmark, M., Karlberg, L., Corell, R. W., Fabry, V. J.,Hansen, J., Walker, B., Liverman, D., Richardson, K., Crutzen,P., and Foley, J. A.: A safe operating space for humanity, Nature,461, 472–475, 2009.
Scheffer, M., Straile, D., van Nes, E. H., and Hosper, H.: Cli-matic warming causes regime shifts in lake food webs, Limnol.Oceanogr., 46, 1780–1783, 2001.
Sonnenborg, T. O., Hinsby, K., van Roosmalen, L., and Stisen,S.: Assessment of climate change impacts on the quan-tity and quality of a coastal catchment using a coupledgroundwater-surface water model, Climatic Change, 113, 1025–1048,doi:10.1007/s10584-011-0367-3, 2012.
Stedmon, C. A., Markager, S., Sondergaard, M., Vang, T., Laubel,A., Borch, N. H., and Windelin, A.: Dissolved organic matter(DOM) export to a temperate estuary: Seasonal variations andimplications of land use, Estuar. Coast., 29, 388–400, 2006.
Thodsen, H., Kronvang, B., Andersen, H. E., Larsen, S. E., Windolf,J., Jørgensen, T. B., and Troldborg, L.: Modeling diffuse nitro-gen loadings of ungauged and unmonitored lakes in Denmark:application of an integrated modeling framework, InternationalJournal of River Basin Management, 7, 245–257, 2009.
Tilman, D., Fargione, J., Wolff, B., D’Antonio, C., Dobson, A.,Howarth, R., Schindler, D., Schlesinger, W. H., Simberloff, D.,and Swackhamer, D.: Forecasting agriculturally driven global en-vironmental change, Science, 292, 281–284, 2001.
Timmermann, K., Markager, S., and Gustafsson, K. E.: Streams oropen sea? Tracing sources and effects of nutrient loadings in ashallow estuary with a 3D hydrodynamic-ecological model, J.Marine Syst., 82, 111–121, 2010.
Vitousek, P. M., Aber, J. D., Howarth, R. W., Likens, G. E., Mat-son, P. A., Schindler, D. W., Schlesinger, W. H., and Tilman, G.D.: Human alteration of the global nitrogen cycle: Sources andconsequences, Ecol. Appl., 7, 737–750, 1997.
Windolf, J., Jeppesen, E., Jensen, J. P., and Kristensen, P.: Mod-elling of seasonal variation in nitrogen retention and in-lake con-centration: A four-year mass balance study in 16 shallow Danishlakes, Biogeochemistry, 33, 25–44, 1996.
Windolf, J., Thodsen, H., Troldborg, L., Larsen, S. E., Bogestrand,J., Ovesen, N. B., and Kronvang, B.: A distributed modellingsystem for simulation of monthly runoff and nitrogen sources,loads and sinks for ungauged catchments in Denmark, J. Envi-ron. Monitor., 13, 2645–2658, 2011.
www.hydrol-earth-syst-sci.net/16/2663/2012/ Hydrol. Earth Syst. Sci., 16, 2663–2683, 2012
Related Documents