Welcome message from author
This document is posted to help you gain knowledge. Please leave a comment to let me know what you think about it! Share it to your friends and learn new things together.
Transcript

Three Pollutants of Concern: Ozone, Particulate Matter, and Mercury
Presented to theTransportation and Environment Committee
October 25, 2010

2
Purpose of Presentation
Provide information on the pollutant Ozone and the current and proposed Ozone standard
Provide information on the pollutant Particulate Matter (PM)
Provide information on the pollutant Mercury
3
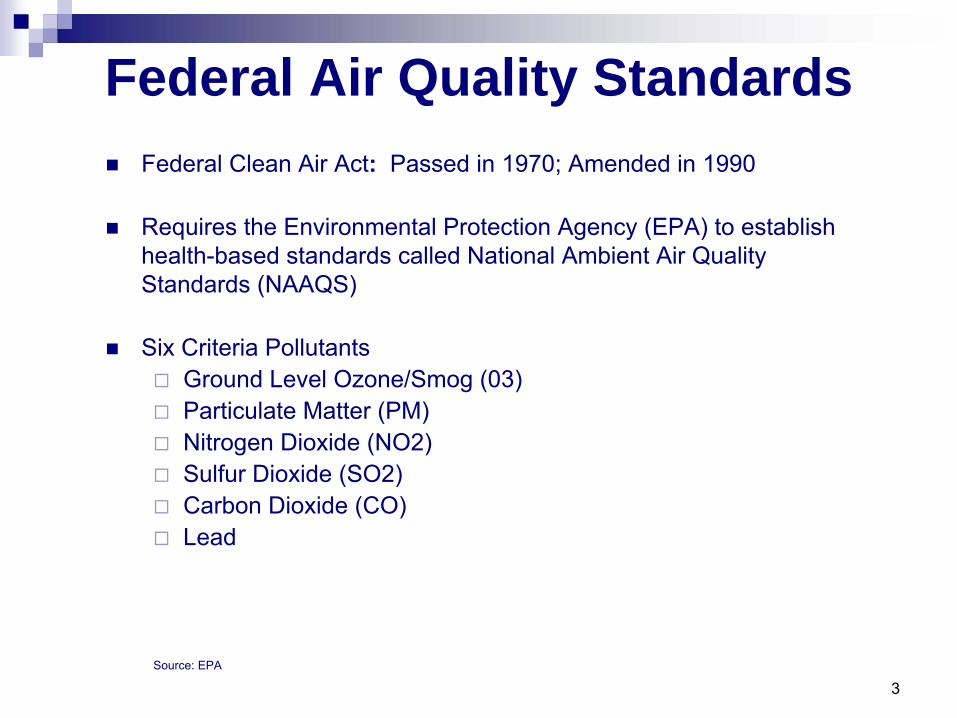
Federal Clean Air Act: Passed in 1970; Amended in 1990
Requires the Environmental Protection Agency (EPA) to establish health-based standards called National Ambient Air Quality Standards (NAAQS)
Six Criteria Pollutants
Ground Level Ozone/Smog (03)
Particulate Matter (PM)
Nitrogen Dioxide (NO2)
Sulfur Dioxide (SO2)
Carbon Dioxide (CO)
Lead
Source: EPA
Federal Air Quality Standards

4
Ozone and Air Quality Standard

5
Forms when nitrogen oxides (NOx
) and volatile organic compounds (VOCs) mix in the presence of sunlight
NOx + VOC + = Ozone
Ground-Level Ozone
6
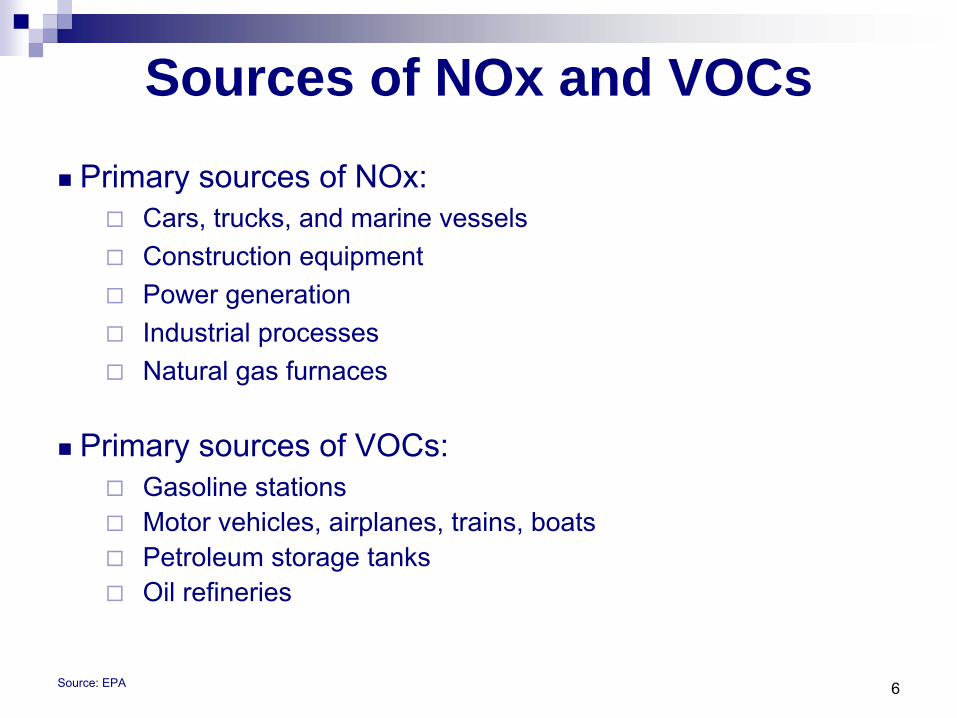
Sources of NOx and VOCs
Source: EPA
Primary sources of NOx:
Cars, trucks, and marine vessels
Construction equipment
Power generation
Industrial processes
Natural gas furnaces
Primary
sources of VOCs:
Gasoline stations
Motor vehicles, airplanes, trains, boats
Petroleum storage tanks
Oil refineries

7
Health effects can include:
Shortness of breath
Coughing or wheezing
Headaches
Nausea
Throat and lung irritation
Particularly impacts:
Children
People with lung disease
Active adults
Health Effects
Source: EPA

8
Eight-Hour Ozone Standard:
Current ozone standard set by the EPA is 85 parts per billion (ppb)
DFW Violation of Ozone Standard:
DFW 9-county region was a moderate non-attainment area for ozone and had until June 2010 to meet the standard
2007-2009 ozone season data evaluated = 86ppb
(3-year average of each year’s 4th
highest reading at any area monitor equals or exceeds 85 ppb)
August 9, 2010: EPA issued a determination of non-attainment for the DFW area and proposed the area be bumped up from moderate to severe with a new attainment date of June 15, 2013
2010-2012 ozone season data will be evaluated to determine attainment
DFW and Attainment of Ozone Standard
Source: EPA and NCTCOG

9

10
Reclassification from Moderate to Serious results in more stringent strategies for reducing emissions:
Sources that emit more than 50 tons per year required to add more technology to reduce emissions
Additional Volatile Organic Compound reductions required
Emission standards required for fleet vehicles (defined as 10 or
more vehicles) or State has option to implement a program resulting in equivalent emissions reductions
Advanced inspection and maintenance program for vehicles
Additional transportation control measures
More advanced monitoring
Significance of Moving from Moderate to Serious Non-Attainment Status

11
Purpose:
Plan to reduce pollution to meet health-based standards
Sets control strategies for reducing emissions
Applies to areas not meeting federal air quality standards
Sets technical/regulatory process for demonstrating attainment
State Implementation Plan

12
Components:
Monitoring Data
Emissions Inventory
Photochemical Modeling
Control Strategies
Area –
bakeries, paint shops, dry cleaners
Non-Road –
construction, aircraft, locomotive, lawn & garden
On-Road –
cars, trucks, and buses
Point –
cement and power plants
State Implementation Plan

13
Proposed Schedule for DFW Region Serious Non-Attainment Area
August 2010: Proposed rulemaking for determination of non-attainment and bump up to serious
December 2010: Final rulemaking
January 2012: State Implementation Plans (SIPs) due
March 2012: Implementation of all control measures in SIP
June 2013: Serious Area Attainment Date (Data from Ozone Seasons 2010, 2011, and 2012 to be evaluated)
Source: EPA
14
Loss of highway funds
Loss of Community Development Block Grant funds
Stricter permit limits
Health impacts
Potential Consequences of Violation

15
Next Ozone Standard
New ozone standard was published on January 6, 2010, for public comment
City of Dallas commented on standard
Final ozone standard will be issued in October 2010
Primary Ozone Standard
Designed to protect health
EPA proposal to lower the primary ozone standard to between .06-.07 ppm
(60 to 70 ppb)
Secondary Ozone Standard
Designed to protect vegetation and ecosystems
EPA proposal to establish a distinct “secondary”
standard at 7-15 ppm
Previously, primary and secondary standards were identical
Currently, Dallas County meets secondary ozone standard (14 ppm)
Other counties in DFW do not meet standard
Source: EPA
16
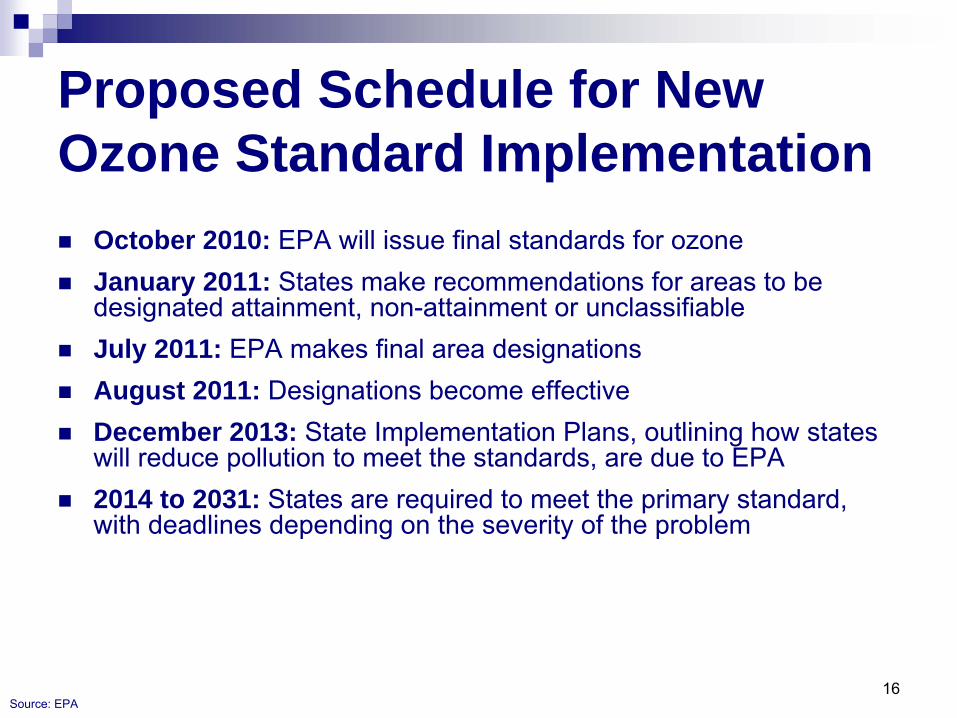
Proposed Schedule for New Ozone Standard Implementation
October 2010: EPA will issue final standards for ozone
January 2011: States make recommendations for areas to be designated attainment, non-attainment or unclassifiable
July 2011: EPA makes final area designations
August 2011: Designations become effective
December 2013: State Implementation Plans, outlining how states will reduce pollution to meet the standards, are due to EPA
2014 to 2031: States are required to meet the primary standard, with deadlines depending on the severity of the problem
Source: EPA

17
95
91
86
102 101 100 100 9996 96
60
65
70
75
80
85
90
95
100
105
1998-2000
1999-2001
2000-2002
2001-2003
2002-2004
2003-2005
2004-2006
2005-2007
2006-2008
2007-2009
- - - - - - - - - - - - - - - - - - - - - - - -
Consecutive 3-Year Periods
Source: NCTCOG TR Dept
Hig
hest
Ave
rage
at a
ny G
iven
Mon
itor (
ppb)
* 2010 Attainment Goal -
According to the US EPA National Ambient Air Quality Standards,
attainment is reached when, at each monitor, the three-year average of the annual fourth-highest daily maximum 8-hour average ozone concentration is less than 85 parts per billion (ppb).
** Primary
Ozone Standard is currently under reconsideration by the EPA and will likely be final in October 2010 to between 60 and 70 ppb.
1997 Standard < 85 ppb*
2010 OZONE SEASON UPDATE8-Hour Ozone Historical Trends
Proposed Revised Standard** = 60-70 ppb
18

19
2012 9-County NOx Emissions Inventory: Source Category Estimates
Total: 26.15 ppb
Low-Level Point Sources, 0.09,
0%
Biogenics, 0.4, 2%
High-Level Point Sources, 3.11,
12%
On-Road, 7.6, 29%
Off-Road, 7.11, 27%
Area, 1.57, 6%
Barnett Shale 6.27, 24%
Total: 26.15 ppb
Source: TCEQ

20
City Initiatives to Reduce Emissions Contributing to OzoneAlternative fuels/engines:
38% percent (approximately 1,900 vehicles) of City of Dallas fleet running on alternative or cleaner fuels, including compressed natural gas, biodiesel or hybrid
City operates two public access compressed natural gas (CNG) vehicle fueling facilities
City also uses biodiesel with an additive to reduce emissions of
Nitrogen Oxide (NOx)
Early user of Texas Low Emission Diesel (TxLED) and biodiesel

21
City Initiatives to Reduce Emissions Contributing to OzoneEnergy:
All new City facilities built over 10,000 square feet are LEED silver certified buildings
City has met the goal of 5% energy reduction per year for the past five years
For the past three years, the City has purchased 40% of the City’s power needs from renewable sources
City Council voted in June 2010 to continue purchasing 40% of the City’s power needs from renewable sources
City Council passed a green building policy for residential and commercial construction
Phase I began October 2009
Phase II begins October 2011

22
City Initiatives to Reduce Emissions Contributing to OzoneAir Quality:
Idling ordinance for vehicles over 14,000 pounds during ozone season
Cement purchasing policy
Texas Clean Air Cities Coalition
US Mayor’s Climate Change Agreement signatory
TERP/Air Check Texas staff member
Dallas Sustainable Skylines Initiative (DSSI) –
Partnership with EPA and Council of Governments
Green taxis (Grants will be awarded to fund 285 green taxi’s)
Green affordable homes
Renewable energy
Urban heat island
Lawn mower exchange program
City of Dallas ordinance provides a “head of the line”
incentive for taxicabs at Dallas Love Field Airport that run on compressed natural gas (cng) (~80 CNG cabs at Airport)

23
Particulate Matter

24
Particulate Matter (PM)
Defined as a mixture of solid particles and liquid droplets found in the air
Two Main types:
Primary Particles: emitted directly from sources such as construction sites, unpaved roads, fields, smokestacks or fires
Secondary Particles: forms in complicated reactions in the atmosphere of chemicals such as sulfur dioxides and nitrogen oxides that are emitted from power plants, automobiles, and industries
Particulate matter is measured by size of the suspended particles: 10 microns or less is referred to as PM
10
; 2.5 microns or less is referred to as PM 2.5
(Source: Environmental Protection Agency (EPA) )

25
Health and Environmental Effects of Particulate Matter
Health Effects
Irritation of the airways, coughing, or difficulty breathing
Decreased lung function
Aggravated asthma
Development of chronic bronchitis
Irregular heartbeat
Nonfatal heart attacks
Some cancers
Environmental Effects
Visibility reduction
Increased acidity of lakes and streams
Nutrient balance changes in coastal waters and river basins
Decreased levels of nutrients in soil
Damage to forests and crops
Decreased diversity in ecosystems
Damage to stone and other materials
Source: Environmental Protection Agency (EPA)
2626
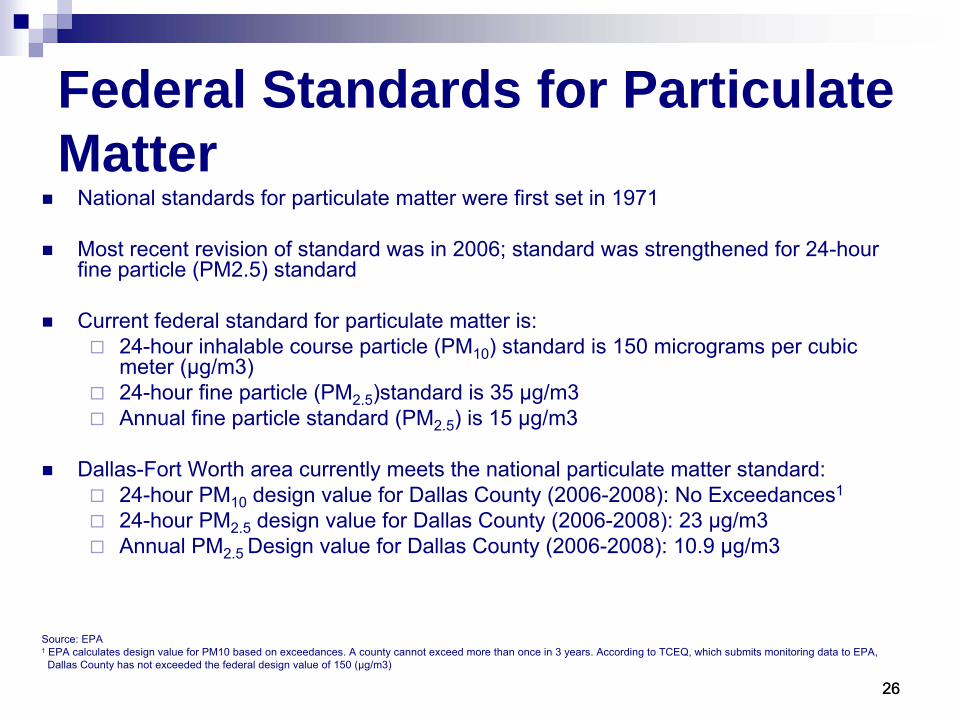
Federal Standards for Particulate Matter
National standards for particulate matter were first set in 1971
Most recent revision of standard was in 2006; standard was strengthened for 24-hour fine particle (PM2.5) standard
Current federal standard for particulate matter is:
24-hour inhalable course particle (PM10
) standard is 150 micrograms per cubic meter (μg/m3)
24-hour fine particle (PM2.5
)standard is 35 μg/m3
Annual fine particle standard (PM2.5
) is 15 μg/m3
Dallas-Fort Worth area currently meets the national particulate matter standard:
24-hour PM10
design value for Dallas County (2006-2008): No Exceedances1
24-hour PM2.5
design value for Dallas County (2006-2008): 23 μg/m3
Annual PM2.5 Design value for Dallas County (2006-2008): 10.9 μg/m3
Source: EPA 1
EPA calculates design value for PM10 based on exceedances. A county cannot exceed more than once in 3 years. According to TCEQ,
which submits monitoring data to EPA, Dallas County has not exceeded the federal design value of 150
(μg/m3)
27
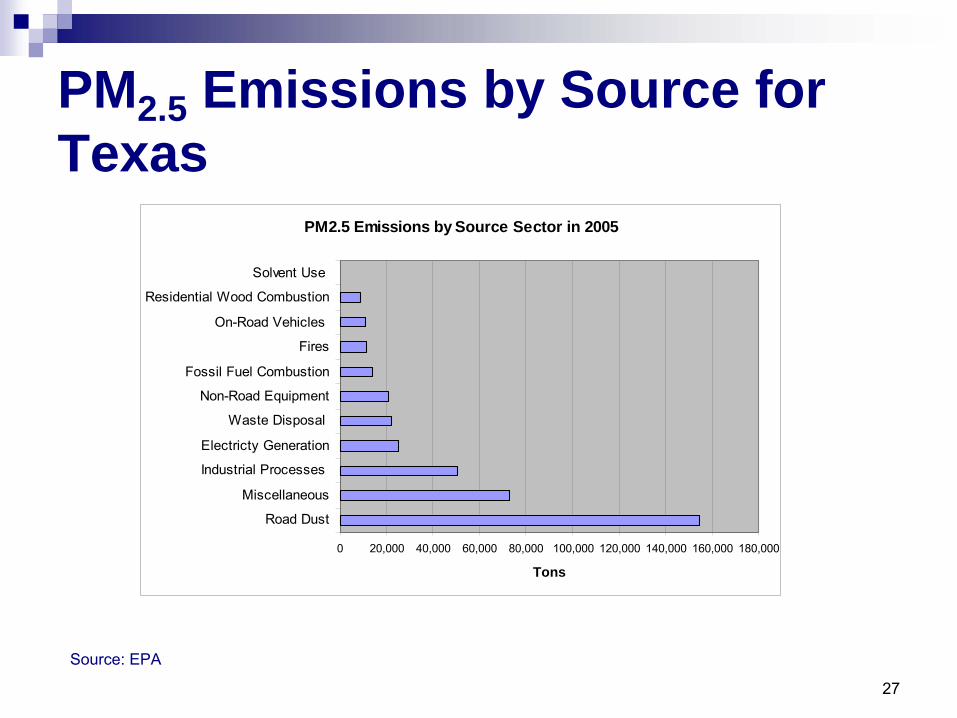
PM2.5 Emissions by Source for Texas
Source: EPA
PM2.5 Emissions by Source Sector in 2005
0 20,000 40,000 60,000 80,000 100,000 120,000 140,000 160,000 180,000
Road Dust
Miscellaneous
Industrial Processes
Electricty Generation
Waste Disposal
Non-Road Equipment
Fossil Fuel Combustion
Fires
On-Road Vehicles
Residential Wood Combustion
Solvent Use
Tons

28
PM10 Emissions by Source for Texas
PM10 Emissions by Source Sector in Texas in 2005
0 200,000 400,000 600,000 800,000 1,000,000 1,200,000 1,400,000 1,600,000 1,800,000
Road Dust
Miscellaneous
Industrial Processes
Fossil Fuel Combustion
Electricity Combustion
Waste Disposal
Non-Road Equipment
On-Road Equipment
Fires
Residential Wood Combustion
Solvent Use
Tons
Source: EPA

29
Do EPA Standards for Particulate Matter Protect Public Health?
In September 2006, EPA announced new air quality standards for particulate matter:
PM2.5: strengthened daily standard by almost 50% (from 65 μg/m3 to 35μg/m3); retained previous annual standard of 15 μg/m3
PM10: retained daily standard; revoked annual standard
American Medical Association, American Lung Association, pediatricians, environmentalists, had recommended annual PM2.5 standard of between 12 to 14 μg/m3
The Clean Air Scientific Advisory Committee (CASAC) provides scientific advice to the EPA before the agency revises standards; CASAC recommended annual PM2.5 standard of either 13 or 14 μg/m3 based on study showing that a reduction in the annual PM2.5 annual could prevent as many as 30,000 premature deaths
Environmental Community legally challenged EPA on standards:
February 2009, U.S. Court of Appeals for the D.C. Circuit held that
Scientific evidence did not support EPA’s PM standards, which violated the Clean Air Act
Proper reasoning was not provided for rejection of CASAC recommendations
Court did not annul standards29

30
Next Steps for PM Standards
EPA must review Clean Air Act Standards every 5 years
EPA has initiated review process of PM standards
Next standard expected to be published in Fall 2011
30

31
City of Dallas Initiatives for Reducing Particulate Matter
Alternative Fuels:
38% of the City’s fleet is alternative- fueled or hybrid
Idling Ordinance:
City Ordinance prohibiting vehicle operators with a gross weight over 14,000 pounds to idle for more than 5 minutes during ozone season

32
Mercury

33
Mercury
Naturally occurring element found in air, water, and soil
Largest source of mercury emissions is from coal burning power plants
Health Effects
Can harm the brain, heart, kidney, lungs and immune system
Can damage central nervous system of babies and young children
Source: EPA

34
Mercury-Specific Laws and Regulations
Mercury Export Ban of 2008 –
establishes provisions for mercury exports and long-term mercury management and storage
Mercury-Containing and Rechargeable Battery Act of 1996 –
phases out the use of mercury in batteries
Source: EPA

35
Mercury-Specific Laws and Regulations
Clean Air Act -
includes mercury standards for sources that emit toxics
These sources must obtain permits and comply with emissions standards set by EPA
To date there is no national regulation to limit mercury pollution like there is for Ozone and PM (which are criteria pollutants)
The EPA is working on a mercury reduction rule for power plants
Has agreed in a court settlement to complete rule by November 2011
The EPA is also working on regulations for mercury and other toxic air emissions from other sources, such as cement plants and industrial boilers
In 2005, the EPA adopted a cap-and-trade scheme of tradable mercury emission allowances but a federal court ruled that it did not comply with the Clean Air Act and threw it out in 2008
Source: McClatchey Newspapers Most power plants still spewing toxic mercury, report says 2010http://www.mcclatchydc.com/2010/03/17/90576/report-mercury-pollution-from.html

36
Permitting in Texas
Sources in Texas must obtain permits from the TCEQ and comply with emissions standards set by EPA
Entities report estimated emissions in the permit to TCEQ for criteria pollutants (NOx
and PM) as well as for Mercury on a lb/hr basis and/or yearly basis depending on source
June 2010: EPA announced final disapproval of TCEQ’s flexible permit program citing that it does not meet Clean
Air Act requirements to protect health and environment
Flexible permitting allows companies to avoid certain federal Clean Air Act requirements by lumping emissions from multiple units under a single “cap”
vs. setting specific emission limits for individual sources at plants
Source: “EPA Disapproves Texas Flexible Air Permit Programs, Law and the Environment

37
Emission Sources of Mercury in the U.S.
Source: EPA, 2005 data
Mercury Emissions in the U.S. by Source Category
Mobile, 1%
Utility Coal Boilers, 52%
Other Industrial Processes, 24%
Electric Arc Furnaces, 7%
Municipal Waste Combustors, 2%
Industrial, commerical, and
institutional boilers, 7%
Chlorine Production, 1%
Gold Mining, 2%
Hazardous Waste Incineration, 4%

38
39
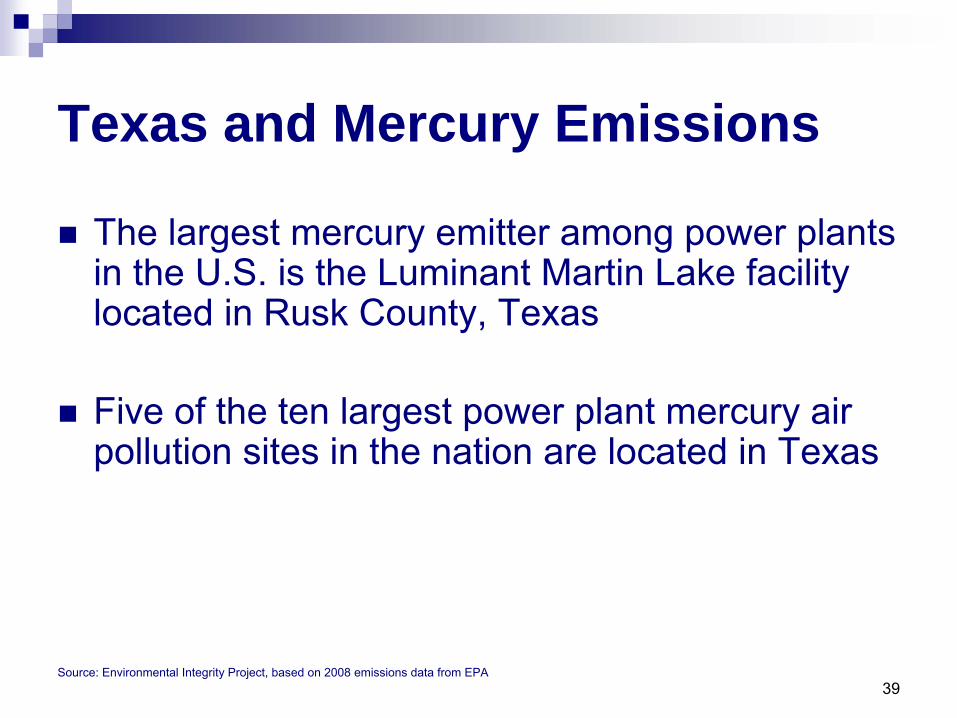
Texas and Mercury Emissions
The largest mercury emitter among power plants in the U.S. is the Luminant
Martin Lake facility
located in Rusk County, Texas
Five of the ten largest power plant mercury air pollution sites in the nation are located in Texas
Source: Environmental Integrity Project, based on 2008 emissions
data from EPA

40
41
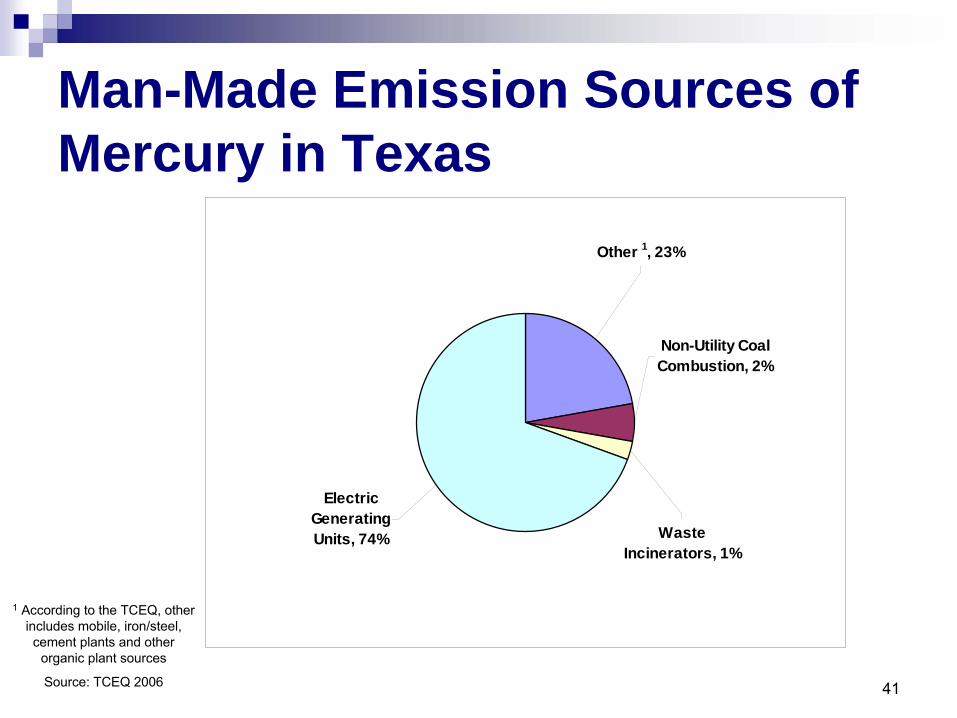
Man-Made Emission Sources of Mercury in Texas
Electric Generating Units, 74%
Other 1, 23%
Non-Utility Coal Combustion, 2%
Waste Incinerators, 1%
1
According to the TCEQ, other includes mobile, iron/steel, cement plants and other
organic plant sources
Source: TCEQ 2006

42
City of Dallas Initiatives for Reducing Mercury
Texas Clean Air Cities Coalition (TCACC)
37 Member Cities, Counties, and School Districts
Concerned about impacts of proposed power plants in their communities, the Mayors of Dallas and Houston formed a coalition
to participate in permitting process
Successes of Coalition
Formation of state’s first united coalition of local governmental entities and elected officials concerned with state’s air quality issues
National attention brought to environmental and health effects of pulverized coal fired power plants
First large scale cumulative ozone air modeling effort in Texas
Climate change and carbon dioxide allowed to be considered in permitting process
Milestone agreement with NRG resulting in commitments related to
emissions of greenhouse gas carbon dioxide, nitrogen oxide, sulfur dioxide, and mercury as well as reductions in water usage

43
Future Initiatives to Address Pollutants
Ozone:
City participates in Regional Air Quality Management Committee to work on SIP issues (North Texas Clean Air Steering Committee)
Particulate Matter and Ozone: City of Dallas is currently participating in the North Central Texas Council of Governments pilot program
to test a clean construction policy
in City bids
Mercury: City of Dallas to remain a leader of Texas Clean Air Cities Coalition (TCACC)
44
Questions?
Related Documents