THREE ESSAYS ON INEQUALITIES BETWEEN ETHNIC MINORITY AND MAJORITY POPULATIONS IN CHINA A Dissertation Presented to the Faculty of the Graduate School of Cornell University In Partial Fulfillment of the Requirements for the Degree of Doctor of Philosophy by Yusi Ouyang August, 2013

Welcome message from author
This document is posted to help you gain knowledge. Please leave a comment to let me know what you think about it! Share it to your friends and learn new things together.
Transcript
THREE ESSAYS ON INEQUALITIES BETWEEN ETHNIC MINORITY AND
MAJORITY POPULATIONS IN CHINA
A Dissertation
Presented to the Faculty of the Graduate School
of Cornell University
In Partial Fulfillment of the Requirements for the Degree of
Doctor of Philosophy
by
Yusi Ouyang
August, 2013

© 2013 Yusi Ouyang
THREE ESSAYS ON INEQUALITIES BETWEEN ETHNIC MINORITY AND
MAJORITY POPULATIONS IN CHINA
Yusi Ouyang, Ph. D.
Cornell University 2013
This dissertation explores the welfare status of China’s 114 million ethnic minority
people (Sixth National Census 2010) in three chapters. Chapter 1 finds that empirical
analyses are strongly needed in order to understand the well-being of China’s ethnic
minority population, as debate over this topic has turned into a war of wildly differing
visions yet few visions are based on micro data. Using data from the China Health and
Nutrition Survey (CHNS), Chapter 2 and 3 explore, respectively, health and education
inequalities between China’s ethnic minority and majority populations during the period
of 1989-2006. Chapter 2 finds statistically significant health inequalities against minority
Chinese of all age groups; whereas Chapter 3 finds little empirical evidence that minority
Chinese below 19 years of age are worse off than their majority counterparts in terms of
years of schooling received at formal schools, though it does find moderate and persistent
education gap disfavoring minority adults aged above 19. Both analyses find the
observed disparities to be related to inequalities in endowments such as location of
residence, water and sanitation, education, and household wealth; but only analysis in
Chapter 3 suggests that differences in the effects of endowments are also associated with
the observed education gap between the two groups.
iii
BIOGRAPHICAL SKETCH
Yusi Ouyang was born in February 1980 in China’s Yunnan province, where 25 ethnic
minority groups make up 35 percent of the province’s population. In her teen years she
spent three summers in an ethnic Dai village, where she watched her uncle making
ethnographic documentary films and became very interested in Dai people and
China’s ethnic minority population in general. This interest eventually became her
motivation to conduct the research presented in this dissertation since 2009, two years
after she entered Cornell University’s Department of Applied Economics and
Management for a doctoral study. Before entering Cornell, Yusi received a Master’s
degree in Economics and Management Science and a Master’s degree in British
Studies from Humboldt University in Berlin. Yusi also holds a Bachelor’s degree in
Accounting from North China University of Technology in Beijing, China.
iv
DEDICATION
To Nihong Ouyang, my mother and my source of courage.
To Shaobo Liu, my husband, for supporting me through all challenges of
graduate school and life.
To Austin Liu, my son and the sunshine of my life.
Words cannot express how much I love you all.
v
ACKNOWLEDGMENTS
I would like to thank my committee of Professors Per Pinstrup-Andersen, Erik
Thorbecke, and David Sahn, for the kindest support and extreme patience that they
have been giving me over the past five years. Their guidance has made this a
thoughtful and rewarding journey. Professor Pinstrup-Andersen gives me faith when I
suspect my research ideas are not worth exploring. Professor Thorbecke’s unwavering
encouragement is what keeps me up when frustration --- whether it is about my
research or my career prospects ---- takes over. Professor Sahn sets for me high
academic standards that I shall keep pursuing the rest of my career life. I would like to
thank Dr. Stephanie Divo at the Department of Asian Studies, for offering me a
teaching assistant position for two years, in which I not only earned the much needed
bread and milk but also discovered my passion and talent in teaching. I would also like
to thank Professor Per Pinstrup-Andersen for offering me assistantship and conference
travel grants whenever they are unavailable from other sources. Last but certainly not
least, I would like to thank Mary-Catherine French. Without her always timely and
effective assistance I would have had a much harder time in getting this far.
vi
TABLE OF CONTENTS
Biographical Sketch iiiDedication ivAcknowledgements vTable of Content viPreface ix Chapter 1. Ethnic Relations, Policies, and Practice in China: from ancient times to the present
1
1. Introduction 12. Ethnogenesis of Major Ethnic Groups in Contemporary China 3
2.1 Formation of the Han Ethnic Group 52.2 Formation of Major Ethnic Minority Groups 10
3. Important Ethno-political Ideologies in the History of China 143.1 Confucianism and “Celestial Empire” Mindset in Imperial China 14
3.1.1 Types of Ethnic Conflicts in Imperial China 15 3.1. 2 Confucianism: “Grand Union” Ideology and “Li is the Only Criterion for Judging One’s Character”
17
3.1.3 The “Celestial Empire” Mindset 20 3.1. 4 Specific Ethnic Strategies in Imperial China 23
3.2 Nationalism and Ethnic Strategies of the Chinese Nationalist Party: 1911-1949
25
3.3 Communism and Ethnic Strategies of the Chinese Communist Party: 1921 – 1949
28
4. Ethnic Policies and Their Practice in Contemporary China: 1949- the Present
30
4.1 Recognition of Nationalities Campaign 32 4.2 Minority Regional Autonomy 34 4.3 Other Pro-minority Policies 38 4.3.1 Subsidies, Investment, Tax Incentives, and Special Funds 38 4.3.2 Compulsory Schooling, Minority Bonus Points, Minority Schools and Classes, and Bilingual Education
41
4.3.3 Family planning 45 4.3.4 “Two Less One Lenient” Policy 46 4.4 A Down Time: Cultural Revolution Period (1966-1976) 48 5. People’s Response and Scholars’ Critiques 52 5.1 Development Caused Excessive Exploitation of Natural Resources 53
5.2 “I think we’d get more money if the Americans would take care of us” 56 5.3 Ethnic Minority Areas Need More Jobs 57 5.4 Education 59 5.4.1 Free Education? I would rather graze yaks and goats on horseback. 59
vii
5.4.2 Bilingual education is cultural invasion in disguise 61 5.4.3 Minority Bonus Points Policy: One Man’s Justice Is Another Man’s Injustice
64
5.4.4 Minority schools: Privilege or Ethnic Segregation? 65
5.5 Religious Freedom? “We cannot practice our religion freely.” 66 5.6 More Children: Government-bestowed Privilege or Allah’s Gift? 71
5.7 “Two Less One Lenience” Policy Encouraged Law-breaching Conducts among the Uyghurs
72
6. Scholars’ New Perspectives on China’s Ethnic Relations 75 7. Discussions and Conclusions 80 References 86 Chapter 2. Health Inequality between Ethnic Minority and Majority Population in China
95
1. Introduction 952. Literature Review 963. Data 994. Measuring Minority-Han Inequality 104
4.1 Minority-Han Inequality in Health 104 4.1.1 Health Measurements and References 104
4.1.2 Minority-Han Health Inequality Statistics 108 4.2 Minority-Han Inequalities in socioeconomic characteristics 117
5. Econometric Analysis 123 5.1 Econometric Models 123 5.2 Estimation Results 125
6. Oaxaca Decomposition of Minority-Han Health Inequality 132 6.1 Theory of Oaxaca Decomposition 133 6.1.1 Basic Oaxaca Decomposition 133 6.1.2 Sensitivity Issues and Oaxaca Decomposition with Heckman Correction for Selection Bias
134
6.2 Oaxaca Decomposition Results 135 6.2.1 Oaxaca Decomposition without Heckman Correction for Selection Bias
135
6.2.2 Oaxaca Decomposition with Heckman Correction for Selection Bias
139
7. Conclusions 1428. Limitations 146
References 148 Chapter 3. Education Inequality between Ethnic Minority and Majority Population in China
154
1. Introduction 1542. Literature Review 1583. Data 161
viii
4. Measuring and Decomposing Education Inequality 175 4.1 Education Inequality in Mean Levels and Oaxaca Decomposition 176 4.2 Inequality in the Distribution of Education and Its Decomposition
178
4.2.1 Education Gini Index 179 4.2.2 The Generalized Entropy (GE) Indices 181 4.2.3 Decomposing Overall Inequality 182 4.3 Inequality in Educational Opportunity 187 4.3.1 Why Inequality in Opportunity? 187 4.3.2 Measuring Inequality in Opportunity 192 4.3.2.1 Roemer and Van de Gaer’s Indices 192 4.3.2.2 Parametric approach by Bourguignon, Ferreira and Menéndez (2007)
193
4.3.2.3 Non-parametric approach by Checci and Peragine (2010) 194 4.3.2.4 Semi-parametric approach by Pistolesi (2009) 195 4.3.2.5 Gini Index of Inequality of Opportunity by Lefranc et al. (2008)
196
4.3.2.6 Human Opportunity Index (HOI) by Barros et al. (2009, 2010)
197
4.3.2.7 Dissimilarity Indices by Yalonetzky (2012) 198 4.3.3 Pearson-Cramer Index 198 4.4 Results 203 4.4.1 Inequality in level: Minority-Han Difference in Average Years of Schooling
203
4.4.2 Oaxaca Decomposition and Minority-Han Difference in Average Years of Schooling
209
4.4.3 Inequality in distribution: Education Gini and GE(2) Indices 213 4.4.4 Inequality of Educational Opportunity: Pearson-Cramer Index 219
5. Regression Analysis 223 5.1 Empirical Models 223 5.2 Regression Results 226
6. Conclusions 2307. Limitations 231
References 234
ix
PREFACE
Development economists interested in vulnerable populations in China have rarely
paid attention to its ethnic minority population. For most of the time in China’s long
history, however, ethnic minority Chinese are in vulnerable situations: they live in
remote areas where geographical and climate conditions are not suitable for
agricultural activities; their production technologies are primitive and so is their way
of living; most of them receive little formal education, whether it is offered by their
own intellectuals or at government-sponsored schools; and due to language and
cultural barriers, they are less likely to migrate to better developed areas and succeed
in finding employment there.
Regardless of the purpose, the Chinese Communist Party (CCP) has developed and
promulgated a series of pro-minority policies since it took the reins in the late 1940s.
Centered around the principle that “all ethnic groups are equal” and based on the core
practice of “regional autonomy for minorities”, China’s pro-minority policies span a
broad spectrum of aspects ranging from political status, religious freedom, minority
education, ethnic culture and language preservation, to economic development,
employment, health and nutrition, and family planning. Over the years, these policies
have been persistently implemented with the only exception being the Cultural
Revolution period, during which all Chinese suffered regardless of ethnicity. After all
these policy efforts, one question naturally arises: how have ethnic minority Chinese
x
been faring today compared to their ethnic majority counterparts, namely the Han
Chinese?
The very limited number of empirical studies currently available suggest that until the
most recent decade, ethnic minority Chinese are still at a disadvantage compared to
the Han Chinese in income (Gustaffson and Wei 2000; Gustaffson and Li 2003;
Gustaffson and Ding 2008, 2009; Hannum and Wang 2010; Sullivan 2011; Sato and
Ding 2012), representation in political leadership (Zang 1998), occupation (Hannum
and Xie 1998), education (Rong and Shi 2001; Hannum 2002; Hannum and Wang
2010), access to health care and social programs (Hannum and Wang 2010), and
health and nutrition status (Ouyang and Pinstrup-Andersen 2011). Empirical analysis
by Bhalla and Qiu (2006), however, suggests that socioeconomic disparities in favor
of the Han may only exist in rural areas, as they found that urban minorities are
actually better educated than urban Han Chinese within China’s five minority
autonomous regions.
In contrast to the scarcity of empirical studies on ethnic minority Chinese, studies
based on reflection and qualitative analysis of historical archives, field trip notes, and
interviews with ethnic minority individuals are abundant. These studies provided
mixed evidence regarding the current situation of China’s ethnic minority population.
Some found that ethnic minority people “lived in depressed economic conditions ….
while their Han neighbors rush to seize the advantage of a rapidly developing market
economy” (Kaup 2000, pp.3); had to “compete with [Han] immigrants for jobs,
xi
schools, state services, [central government] funds” and enjoyed fairly limited
religious freedom (Chung 2003); faced discriminating education and language policies
that make minority students underachievers (Nyima 1997, 2000; Bass 1998; Zhou
2004; Yi 2005; Wang 2007; Wang and Phillion 2009; Zhao 2009); or simply are
“colonized” (Bellér‐Hann 2008) or “ruled” by the Han “behind a façade of a socialist
multiculturalism” (Bellér‐Hann in Schlee (ed.) 2002, pp.57-81) . Other scholars,
however, acknowledged that ordinary minority people benefited from the CCP’s pro-
minority policies at least economically (Grunfeld 1996 Preface; Goldstein 1997, pp.
75, 93-94; Sautman 1999, 2007; Peissel 2003) and educationally (Stites 1999; Clothey
2003, 2004; Zhou and Sun 2004), if not politically and culturally.
As if this were not confusing enough, one also has political ideologies distorting any
attempt to gain an objective understanding of China’s ethnic situations. On one hand,
there is the China Bureau of Statistics announcing steady growth in minority
autonomous regions every year; and this claim is supported by research of many
Chinese scholars, Han or non-Han (Song and Wang 2005). One the other hand, there
are active nationalist organizations --- most notably the Tibetan exile government,
Southern Mongolian Democratic Alliance, and the World Uyghur Congress --- and
their followers who regularly portray ethnic minority people in China as having been
living in dire straits (Shakya 19991, Woeser 2008). The latter gained itself many
1 For example, Tsering Shakya, a historian and widely cited expert on Sino-Tibetan relationship from the University of British Columbia, stated in his book The Dragon in the Land of Snows: A History of Modern Tibet Since 1947(ColumbiaUniversityPress1999) that “For the Tibetans, the Chinese rule
xii
supporters in the West (O’Reilly and Habegger 2002, French 2004, Lonely Planet
2008, McGranahan 2010, Pistono 2011); though they too, like their Chinese
counterparts, are “highly emotional and often disingenuous” claims “intended to shape
international perceptions and win sympathy for their cause” (Goldstein 1997, Preface,
pp.x).
It has become clear that debate over minority well-being in China has turned into a
war of wildly differing visions. In a war like this, scholarship subject to considerable
political constraints and based on emotional moralism rather than historical realities
would certainly fail to touch the heart of the problem; whereas empirical analysis
based on up-to-date and objectively collected field data may be very useful in helping
us take a step closer to reality. Equally useful would be an intellectual effort dedicated
to understand why China’s ethnic strategy is what it is today, and for what reasons it is
disapproved by both the minorities and the Han. And these are the motivation of this
dissertation.
The plan of this dissertation is as follows: after the introduction section, Chapter 1
begins the analysis by discussing ethnogenesis of China’s major ethnic groups; ethnic
relations, ethno-political considerations, and ethnic strategies that Chinese government
in different historical periods faced and took; and CCP’s pro-minority policies and
their practice in contemporary China (1949-present). After a basic understanding of
meant not only destruction of Tibetan’s independent political identity but (they maintain) four-decades of near-genocide of the Tibetan people and their cultur” (Introduction, pp. xxii).
”
xiii
China’s ethnic groups and their relations and environment is established, two
empirical efforts are made in Chapter 2 and 3, respectively, to understand health and
education inequalities between China’s ethnic minority and majority populations
during the period of 1989-2006. Finally, a conclusion section that summarizes
conclusions and recommendations obtained in the previous three chapters brings an
end to this dissertation.
CHAPTER I
ETHNIC RELATIONS, POLICIES, AND PRACTICE IN CHINA
FROM ANCIENT TIMES TO THE PRESENT
1. Introduction
A considerable amount of scholarly efforts has been made in recent years to understand
China’s ethnic minority people, who currently make a population of 114 million and
account for 8.49 percent of the total Chinese population (Sixth National Census 2010).
These studies reached wildly different conclusions, yet less than a handful of them are
supported by empirical evidence. More empirical analysis is therefore strongly needed as
the heated debate continues. But before any empirical efforts are made, we need first
establish a basic understanding of our research subjects and their environment.
The objective of this paper is to document China’s ethnic situation and policy practice
from the western Zhou dynasty (1100 – 771 BC) --- when ethnic relations first started to
concern Chinese rulers --- to the present. To the best of our knowledge, this is a scholarly
effort that has not yet been made. This paper would therefore serve as a useful reference
for researchers interested in China’s ethnic situation. It should also interest Chinese
policy makers, as outbreaks of a number of ethnic unrests in recent years call for a need
to reflect on China’s current ethnic strategies. Other readers may also find this study
1
helpful in better understanding how Chinese lay people view the country’s ethnic
situation and what their concerns.
Sources used in this paper include historical archives, government documents, and a fair
amount of scholarly literature from multiple disciplines including economics, history,
political science, sociology, and anthropology. Non-scholarly materials released by the
media, whether it is Chinese or non-Chinese, governmental or non-governmental, are also
used in this paper. The author recognizes that media materials are narratives and therefore
limited to the perspectives of particular people and events, yet they help reveal feelings
and opinions of the lay people who are creators, executors, and bearers of any historical,
current, and future event.
The plan of this paper is as follows: Section 2 begins the analysis by discussing
ethnogenesis of major ethnic groups in China, including the Han and several ethnic
groups that have played important roles in shaping China’s current ethno-political
landscape. Section 3 discusses ethno-political ideologies and strategies Chinese
governments in different historical periods have taken. Section 4 examines major pro-
minority policies in contemporary China (1949 to the present) under the rule of the
Chinese Communist Party (CCP). Section 5 illustrates how current minority policies are
received by the Chinese people, from the perspectives of both Han and non-Han people.
Section 6 reviews scholarly critiques for the CCP’s minority strategies. Section 7
concludes.
2
2. Ethnogenesis of Major Ethnic Groups in Contemporary China
The definition and English translation of the Chinese notion of “mínzú” has been a
battlefield for many Chinese as well as foreign scholars. Some believe that “mínzú” in
China carries the same meaning as “ethnic group” in the West (Zhai, 1999; Ma, 2001).
Some argue “mínzú” carries a strong political implication and therefore should be
translated as “nationality” (Jin, Bi, and Han 2012; Jiang, 2002; Pan, 2003; Zhu, 2005). A
third opinion is that the Chinese notion of mínzú is unique and is best directly
transliterated as “mínzú” (Zhou, 1999; Shi, 1999; Li, 2002; Harrell, 2001; 2002). This
paper uses “ethnic group” to refer to the Chinese term “mínzú”, following the most recent
government white paper on ethnic relations and policies released by China’s Information
Office of the State Council (Chinese Government White Paper, 2009).
Currently China has 56 officially recognized ethnic groups, of which Han is the largest
with a population of 1.22 billion. The rest 55 ethnic groups account for only 8.49 percent
of China’s total population of 1.34 billion and are therefore referred to as “shǎoshù
mínzú” (meaning “minority ethnic groups); though in absolute terms, its population size
of 114 million has exceeded that of most countries in the world. Population of individual
ethnic groups vary from less than 4,000 (Luoba) to almost 17 million (Zhuang). While
Han Chinese mostly live in central China, ethnic minority groups mostly live in the
border areas. Figure 1 illustrated the geographical distribution of ethnic minority groups.
3
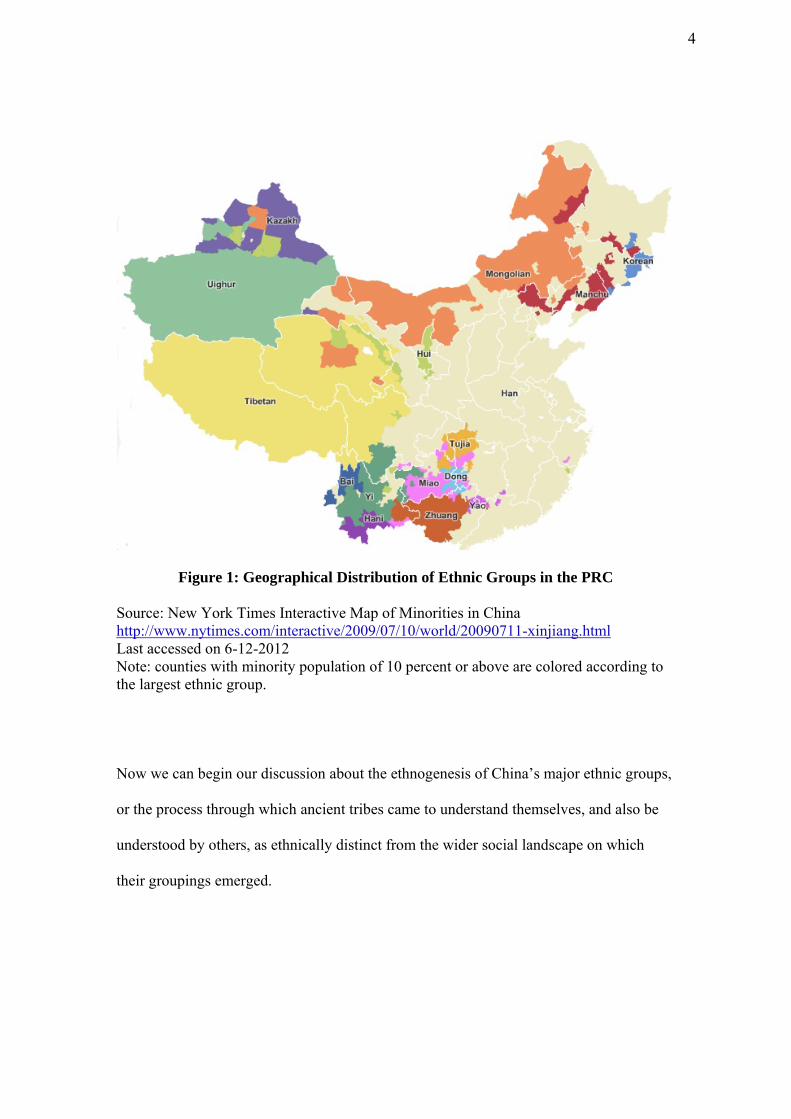
Figure 1: Geographical Distribution of Ethnic Groups in the PRC
Source: New York Times Interactive Map of Minorities in China http://www.nytimes.com/interactive/2009/07/10/world/20090711-xinjiang.html Last accessed on 6-12-2012 Note: counties with minority population of 10 percent or above are colored according to the largest ethnic group.
Now we can begin our discussion about the ethnogenesis of China’s major ethnic groups,
or the process through which ancient tribes came to understand themselves, and also be
understood by others, as ethnically distinct from the wider social landscape on which
their groupings emerged.
4
2.1 Formation of the Han Ethnic Group
With over 1.2 billion members, Han Chinese makes the largest ethnic group not only in
China but also in the world. According to archives of the State Ethnic Affairs
Commission (The Han Ethnic Group (in Chinese), n.d.), contemporary Han Chinese are
descendants of five primitive tribe alliances living in today’s central China during 7000 -
2100 BC. Among these five, Yan-Huang and Dong-Yi tribe alliances originating on the
Yellow River alluvial plains are considered major ethnic origins of contemporary Han
Chinese, which is why Yellow River is also called Mother River of the Chinese culture;
while the rest three --- Miao-Man and Bai-Yue tribe alliances originating from the
Yangtze River Valley to the south and east of the Yellow River Valley, and Rong-Di
tribe alliance from barren plateaus in the west and north1 ---- are considered minor ethnic
origins of today’s Han Chinese.
Preexistence of the Han ethnic group, namely the Huaxia ethnic group, came into being
during the three-dynasty or Xia-Shang-Zhou period, which started with the establishment
of China’s first dynasty Xia (2100-1600 BC) and ended with the demise of the Zhou
1 More specifically, Yan-Huang alliance originated in today’s Shaanxi province in the middle reaches of the Yellow River. Dong-Yi alliance originated in today’s Shandong, Henan, and Jiangsu provinces along the middle and lower reaches of the Yellow River including the Wei river, the largest tributary of the Yellow River. Miao-Man alliance originated in the middle reaches of the Yangtze River, which flows through today’s east Sichuan, Hubei, Hunan, Jiangxi and Anhui provinces. Bai-Yue alliance originated in today’s Yunnan-Guizhou Plateau and along the lower reach of the Yangtze River flowing through today’s Zhejiang, Guangdong, Guangxi, and Fujian provinces in southern China. Lastly, Rong-Di alliance lived in the north and northwest of central China, in today’s Three Northeastern Provinces (Heilongjiang, Jinlin, Liaoning), Inner Mongolia, Xinjiang, and the Qinghai-Tibet Plateau.
5
dynasty (1100-221 BC). According to Chronicle of Zuo2, the name “Huaxia” first
appeared in the western Zhou period (1100-770 BC) as Zhou people called themselves
“Huaxia” people, meaning civilized people in beautiful clothes according to Explanatory
Notes to the Five Classics (Kong Yingda, 642 AD); while referring to people living in
their south, east, west, and north as Man, Yi, Rong, Di, respectively (Records of the
Grand Historian: Annals of Zhou, Sima Qian, 91 BC3).
At this time, Huaxia people were mostly Yan-Huang and Dong-Yi descendants, since Xia,
Shang, and Zhou dynasties were established by either Yan-Huang or Dong-Yi primitive
tribe alliance. That said, unlike primitive tribes in which members were connected by
bloodlines, China’s first ethnic group Huaxia identified its members by a common culture
whose core is a set of social norms and ceremonial rituals that Confucius called “Lĭ”
(Spring and Autumn Annals, 722-481 BC4). This embracing attitude that ancient Huaxia
people held toward its Man, Yi, Rong, and Di neighbors opened way for ethnic
2 Chronicle of Zuo is a Chinese work of narrative history composed in the early 4th century BC and covering the period from 722 to 468 BC. Though its title suggests that it was written by someone with surname Zuo, its authorship has remained a matter of controversy even till today. That said, the book is one of the most important sources for the study of Chinese history and culture during the Spring and Autumn period (771-476 BC), and is widely consulted and cited by historians. 3 The Records of the Grand Historian, or Shiji, was written by Sima Qian (ca. 145 or 135 BC – 86 BC) during 104 – 91 BC. It consists of 130 volumes of which 12 are “basic annals” or “imperial biographies”, 10 are “tables” or timelines of events, 8 are “treaties” of economics and other topics of the time, 30 are “biographies of the feudal houses and eminent persons”, and 70 are “biographies and collective biographies” of important individuals such as Confucius. Shiji is China’s first historical chronicle and recounts China’s history since the time of the Yellow Emperor to Sima Qian’s own time in circa 100 BC. Despite critique that Sima could not be accurate in covering ancient events, scholars such as British embryology and sinologist Joseph Needham have agreed in the 1950s that his accounts are reliable at least back to the Shang dynasty (1600 – 1050 BC). Shiji’s importance also comes from the fact that it covers not only people of high rank but also those of lower classes. 4 Spring and Autumn Annals are official chronicles of different states produced during the Spring and Autumn period (771-476 BC). Most of them were lost long ago, and only the one covering historical events happened in the State of Lu (in today’s Shandong province) during 722 and 481 BC survived. Authorship is traditionally attributed to Confucius, though many scholars believe that credit goes to all court historians in the State of Lu. Since the text in the book is extremely concise, its content can only be appreciated with the aid of ancient commentaries, among them the most important is the Chronicle of Zuo.
6
assimilation and acculturation in the following years of nearly three millennia. See
Section 3.1.2 for more discussion on how the Confucian view that “Lĭ” is the only
criterion for judging one’s character has shaped Chinese emperors’ attitude toward non-
Han ethnic groups and their ethnic strategies.
During the Eastern Zhou period (770-221 BC), which historians often further separate
into the Spring Autumn period (770-476 BC) and the Warring States period (476-221BC),
the royal Zhou family had lost much of its power. As a result, its territory --- fertile
Yellow River alluvial plains that were then called zhōngyuán, meaning central plain ---
became the most coveted land and battlefield of both Zhou’s pervious vassal states and
states established by Zhou’s Man, Yi, Rong, and Di neighbors. After state conflicts and
mutual conquests that lasted for over 500 years and by the end of the Warring States
period, Huaxia people included not only the original Huaxia people who had descended
almost exclusively from the primitive Yan-Huang and Dong-Yi tribe alliances, but also a
ramification of the Miao-Man tribe alliance known as Chu, a ramification of the Bai-Yue
tribe alliance known as Yue, and many Rong-Di descendants.
In 221 BC, the State of Qin located on the western edge of the Yellow River plain re-
united China and established the Qin dynasty under the leadership of King Yingzheng of
Qin, or Emperor Qin Shihuang) , a Yan-Huang descendant5. The politically united China
5 Despite Qin’s geographical location, Qin emperors were Yan-Huang descendants: forefathers of Qin were asked to move to the west in the late 800 BC only to raise horses for the royal Zhou family (Records of the Grand Historian: Annals of Qin). Since its birth, Qin had been in constant conflicts and wars with Rong people, who were the earliest settlers in the west land. But by the time the State of Qin raised to power, many Rong people and also some Di people from the north had already mingled with the Qin through marriage, and thus became half-Huaxia (Discourses of the States: Discourses of Zhou; Chronicle of Zuo: Twenty-eighth year of Duke Zhuang of Lu; Chronicle of Zuo: Twenty-third years 23rd of Duke Xi of Lu).
7
greatly strengthened the Hanxia ethnic identity. Therefore, when the short-lived Qin
dynasty was replaced by the Han dynasty (202 BC – 220 AD) founded by Liu Bang (also
known as Emperor Gaozu of Han), a Chu descendant, Han emperors took pride in and
continued to strengthen the Huaxia ethnic identity.
Later, Emperor Wu of Han (in reign: 141 – 87 BC) canonized the “Grand Union”
ideology, which was first advocated by Confucius (551–479 BC) and contended that all
Huaxia people should remain politically as well as culturally united under the sole rule of
the emperor, or “the Son of Heaven”6. To demonstrate the united and advanced Huaxia
civilization, to develop commercial ties with neighboring states, and also to either
overawe neighboring states or seek military alliances against the Xiongnu Empire7,
Emperor Wu of Han also sent a team of imperial envoys led by the famous Chinese
diplomat Zhang Qian to today’s Xinjiang three times during 125-115 BC.
As the Silk Road was carved out and international commercial ties were established,
interactions between Huaxia people and members of their surrounding tribes and regimes
increased; and the former were often identified as “Han” by the latter, following the name
of their Empire. Finally, at around 100 BC, the name “Han” replaced the name “Huaxia”,
and the Han ethnic group came into being (Lü, 1941, pp.22; Lü, 1950, pp.19). A
consequence of Han Empire’s rise to wealth, power, and fame is the emergence of the
6 See more discussion about how the “Grand Union” ideology has influenced Chinese emperors’ view and handling of ethnic relations in Section 3.1.2. 7 The now extinct Xiongnu was a bellicose nomadic people that originated in the cold and barren Mongolian plateau to the north of central China in around 300 BC. Before the Empire collapsed in circa 50 AD, Xiongnu army had multiple wars with the Han army and was Han emperors’ largest ethnic concern. Xiongnu descendants had also made multiple efforts to recover the Empire before they eventually failed in the fifth century and were either assimilated by other ethnic groups or fled to the farther west and north.
8
“Celestial Empire” mindset. Han emperors gradually developed an unrealistic sense of
superiority toward its civilization, and believed that China is the “Celestial Empire” to
which any other civilization in the world would willingly submit. See more discussion
about how the “Celestial Empire” mindset has influenced Chinese emperors’ ethnic
strategies in Section 3.1.3.
By the end of the Han dynasty, thanks to Han society’s economic prosperity and Han
emperors’ embracing attitude toward non-Han residents and immigrants, the Han ethnic
group was further expanded to include not only the Huaxia people, but also members of
the surrounding ethnic groups8.
Up to this point we shall refrain from giving more details about how the Han ethnic group
evolved over time and became who they are today, as history repeats itself several times
in the following millennia. Suffice it to say that ethnic assimilation and acculturation
between the Han and its surrounding ethnic groups continued after the demise of the Han
dyn
8 By late Western Han period (202 BC – 220 AD), the Han Empire had already established suzerain-vassal relationship with Wuhuan and Xianbei people in the northeast, Qiang and a ramification of Xiongnu people in the northwest, Yi people in the southwest, three states founded by Yue people in the southeast, up to 55 regimes in Xiyu, meaning the Western Regions which include today’s Xinjiang in China and some areas in Central Asia. Parts of the Korean Peninsula were also brought into the Han realm with the establishment of four commanderies in 108 BC. Han dynasty was also when regimes established on the Japanese islands started to interact with China.
9
asty, and despite three very long periods of disunity and two dynasties during which
China were ruled by non-Han emperors9, the Han survived and remained the major ethnic
group in China.
This ends our discussion of the ethnogenesis of contemporary Han Chinese. Obviously,
they are descendants of not only early settlers of the Yellow River Valley, but also early
settlers in the surrounding areas. In Zhou people’s terms, ancestors of modern Han
Chinese include all Huaxia people, some Man people in the south, some Yi people in the
east, some Rong people from the west, and some Di people in the north.
2.2 Formation of Major Ethnic Minority Groups
When Yan-Huang and Dong-Yi tribe alliances were prospering in the Yellow River
valley and gradually evolving into the main body of the Huaxia ethnic group, Miao-Man,
Bai-Yue, and Rong-Di tribe alliances also emerged in the surrounding areas and evolved
into many different ethnic groups. Many members of these ancient ethnic groups were
assimilated into the Huaxia and later Han ethnic group in history (as discussed in Section
2.1), but some remained unsinicized.
9 In addition to the Eastern Zhou period (770-206 BC), China experienced another three periods of disunity. The first was from 220 to 589 AD, during which China experienced the Three-kingdom period, the Two-Jin period, and the period of Southern and Northern dynasties. The second period of disunity was from 907 to 1234 AD, during which China experienced the Five Dynasties and Ten Kingdoms period, the Northern Song dynasty, and the Southern Song dynasty. The most recent period of disunity was from 1894 to 1949, during which China experienced two Sino-Japanese Wars (1894-1895; 1937-1945) and civil wars between the Kuomingtang Party and the Chinese Communist Party. The two dynasties during which China was under the rule of non-Han rulers are the Mongol Yuan dynasty (1206-1388) and the Manchu Qing dynasty (1644-1911).
10
Descendants of the unsinicized Miao-Man tribes became today’s Miao (also known as
Hmong in the Western literature; population: 9.4 million), Yao (2.8 million), She (0.7
million), and Lisu (0.7 million)10 ethnic groups. Their place of residence remain close to
where their ancestors initially settled, namely the middle reach of the Yangtze river,
which flows through what is now China’s Yunnan, Guizhou, Hunan, Sichuan,
Guangdong, Zhejiang, Fujian provinces, and the Guangxi Zhuang Autonomous Region.
Descendants of the unsinicized Bai-Yue tribes originating in the lower reach of the
Yangtze River became today’s Zhuang (17 million), Buyi (2.9 million), Dai (a.k.a Thai,
1.16 million), Dong (2.9 million), Bai (1.9 million), and other southern and southwestern
ethnic minority groups in contemporary China.
Unsinicized Rong-Di tribes originating from cold and less fertile plateaus in today’s
western and northern China are forefathers of most northern and northwestern minority
groups in contemporary China. They are also ancestors of a number of southwestern
minority groups. Examples of ethnic minority groups with Rong-Di origins include the
Manchus (10 million), the Mongols (6 million) , and the Uyghurs (10 million) in the
north; Qinghai-Gansu-Sichuan Tibetans (thus named to distinguish from the TAR
Tibetans; population: 3.7 million) in the north- and southwest; and the Yi (8 million) and
many small minority groups in the southwest, such as the Hani (1.5 million), the Naxi
(310,000), the Lahu (450,000), the Pumi (34,000), the Qiang (310,000).
10 Population data are taken from the Sixth National Census (2010).
11
The rest Tibetans (2.5 million) currently living the Tibetan Autonomous Region (TAR) in
western China were not a people descended from any of the above-mentioned primitive
tribe alliance. Their forefathers had lived in the Tibetan plateau north-east of the
Himalayas from of old, though the first unified empire on the plateau --- the Tibetan
Empire --- did not emerge until the rule of Songtsän Gampo (604–650). Earliest
interactions between China and Tibet can only date back to the Songtsän Gampo era.
According to Chinese record, from the Tang (618-907) to the end of Qing dynasty (1644-
1911), the relationship between the two regimes alternated between that of vassal and
dominant state and that of intruders and the intruded, at times such as AD 763, when
Tibet and allied forces intruded China and grasped in hand large part of today’s Xinjiang,
Gansu, and Qinghai until the end of the 8th century. Chinese sources also claim that
before the People’s Liberation Army (PLA) entered Tibet in 1950, lay people in Tibet
suffered from feudal serfdom. This argument is supported by many Western scholars.
Melvyn Goldsten, for example, argued that "Tibet [before 1950] was characterized by a
form of institutionalized inequality that can be called pervasive serfdom" (Goldstein,
1971) and described pre-1950 Tibet as “a feudal theocratic society under the rule of
spiritual masters or heads of monasteries known as lama” (Goldstein, 1997, pp.56). The
Tibetan government in exile currently under the leadership of the 14th Dalai Lama Tenzin
Gyatso disagrees. It insists that Tibet be an independent regime since time immemorial;
and even the very good relationship between China and Tibet during the Mongol Yuan
dynasty (1271-1368) was nothing more than a priest-patron relationship. Supporters of
the Dalai Lama administration also argued that Tibetan people were happy, content, and
very much devoted to Buddhism (Powers, 2004, pp. 18-19), and that serfdom was a
12
misleading word to describe Tibet’s social structure, which should instead be described
as "a caste-like social hierarchy" (Fjeld, 2003). The Sino-Tibetan relationship remained
highly controversial till today. For our discussion here, suffice it to say that TAR
Tibetans, along with Tibetans in Qinghai, Gansu, and Sichuan provinces, are now
recognized by the Chinese government as an ethnically and culturally unique people that
are part of the modern Chinese population.
As seen from the above discussion, most modern ethnic minority groups in China
evolved from ancient tribes that were connected by bloodlines and concentrated in certain
areas. There exists, however, one exception: the Muslim Hui. With a population of 9.8
million, Hui people make the third largest ethnic minority group in China and the largest
Islam-practicing community in China, followed by the Uyghur11. Ancestors of modern
Hui Chinese are ancient immigrants from Arabia, Persia, and central Asia, who migrated
into China during three different periods for different reasons. The earliest Muslim
immigrants are Silk Road travelers, who entered China in as early as the Han dynasty
(202BC-8AD) to do business with the Chinese. The second period lasted throughout the
Tang dynasty (AD 618-907) and its following Song dynasty (AD 960-1279), during
which traders and business men from Arabia, Persia, and central Asia landed in the
coastal area in southeastern China and later settled down. The last mass immigration
happened in the Mongol Yuan dynasty (1271-1368, when several hundred thousand
Muslims in central and western Asia were conquered by the Mongol army and then
brought into China through today’s Xinjiang Uighur Autonomous Region to serve as
11 As both are Islam practitioners, the Hui and the Uyghur were used to be included under one umbrella name “the Hui” (during the Republic of China period). They were later named differently, with the Hui referring to the Chinese-speaking Muslims and the Uyghur referring to the Turkish-speaking Muslims.
13
army men. Therefore, common religious belief, rather than kinship, is what united these
people and eventually made them one single ethnic entity: the Muslim Hui Chinese. This
closes our discussion on the ethnogenesis of ethnic minority groups in modern China.
3. Important Ethno-political Ideologies in the History of China
Since Sima Qian (ca. 145 or 135 – 86 BC) wrote China’s first historical chronicle The
Records of the Grand Historian (91 BC) that recounts China’s history since the time of
the Yellow Emperor to his own time in circa 100 BC, rulers of every newly established
dynasty had ordered scholars and historians to write a detailed historical chronicle for the
previous dynasty in a structure that is very similar to that of the first one. Because of this
unique tradition, China has kept a continuous record of history covering successive
dynasties in a period of at least 3,000 years. According to these records, China has been a
multi-ethnic polity for over two thousand years. Like any multi-ethnic polity, China has
experienced multiple ethnic conflicts throughout its history. This section discusses the
perspectives that Chinese rulers of different historical periods have taken toward the
notion of ethnicity, and as a result, their ethnic strategies.
3.1 Confucianism and “Celestial Empire” Mindset in Imperial China
14
Imperial China refers to the period from China’s first imperial dynasty Qin (221-207 BC)
to its last one, the Qing dynasty (1644-1911) established by Manchu people of northern
nomadic descent. Before we discuss philosophies that had played fundamental roles in
shaping China’s ethnic policies throughout this long period of over two millennia, it is
necessary to first illustrate the types of ethnic conflicts facing Chinese emperors at that
time.
3.1.1 Types of Ethnic Conflicts in Imperial China
During the Imperial China period, ethnic conflicts happened at both the international and
the domestic levels.
At the international level, China was constantly invaded by nomadic regimes from the
north. Originating in the cold and remote deserts and barren plateaus in the far north,
these northern nomadic regimes rose through constant raids on surrounding areas and
military conquests of neighboring tribes. For them, obtaining dominion over the fertile
central plains was not an option but a necessity; as their own land was too lean to allow
sustainable development of their society. Among such nomadic regimes, the most famous
were the Xiongnu Empire, the Jurchen (proto-Manchu) regime, and the Mongol Empire.
Each of these ethnic groups had played an important role in China’s ethno-political
15
history. The now extinct Xiongnu was once the most bellicose people in the world12.
From around 300 BC when they first emerged in the Ordos dessert and steppe region in
what is today China’s Inner Mongolia Autonomous Region, to the demise of the last
Xiongnu regime (the Helian-Xia state) in 431 AD, Xiongnu people had played a role in
China’s history for over 500 years; and were actually the reason why Emperor Qin
Shihuang ordered the construction of the Great Wall in 214 BC. The Jurchen (proto-
Manchu) was also an ambitious and militarily talented nomadic people. In history they
have twice occupied central China: the first time they forced the Song imperial court to
secede vast land in northern China and for over a century; the second time they overthrew
emperors of the Ming dynasty (1368-1644) and established the Qing dynasty (1644-
1911), which then lasted for nearly 300 years. The Mongol regime founded the Yuan
dynasty (1271-1368), during which China’s territory was expanded to its largest in its
entire history, and with few exceptions Han Chinese were depressed economically and
politically as the lowest social caste.
At the domestic level, the major type of ethnic conflict that many Chines emperors had to
deal with were challenges or rebellions from China’s vassal states, especially those
located in remote and infertile areas. Many vassal states rebelled at certain points in time,
as they either wished to become independence, or wanted to ally with powerful regimes
in their closer neighborhood, with which they usually shared more similar cultures and
had more common interests.
12 French sinologist de Guignes (1721-1800) even linked them with the Huns that might have contributed in the collapse of the western Roman Empire (Ammianus 1922), though the linkage was denied by many (Sino 1990, pp.178).
16
Another type of domestic ethnic conflict pertains mainly to dynasties under the rule of
non-Han emperors, namely the Mongol Yuan and the Manchu Qing dynasties. Under the
rule of the Mongol Yuan, except for a few very wealthy Han landlords who either helped
the Mongols rise to power or were too rich that pressing them would inevitably hurt the
whole economy, Han people were of the lowest social class. Their socio-political status
was not only below that of the Mongols, but also below that of the so-called Semu people,
a name Mongol Yuan rulers used to call people who have colored eyes (in contrast to the
Han’s black eyes) but are also not Mongols. Resentment Han people held toward their
Mongol rulers naturally became a major source of ethnic conflict in the Yuan society.
Ethnic conflict of the same nature existed between Han people and their Manchu rulers
throughout the Qing dynasty. Compared to their Mongol counterparts, Manchu rulers
were more familiar with Confucianism and therefore made seemingly more placatory
ethnic policies; though in fact they had equally strong distrust in the Han and interfered
more extensively with Han people’s daily life.
3.1.2 Confucianism: “Grand Union” Ideology and “Lǐ is the Only Criterion for
Judging One's Character”
Two philosophical theories deeply influenced Chinese emperors’ viewing and handling
of ethnic conflicts during the Imperial China period. One is cultural nationalism which in
the Chinese context coincides with Confucianism. The other is ethnic nationalism, which
17
in the Chinese context corresponds to the “Celestial Empire” mindset. This sub-section
discusses Confucianism and its ethno-political influence.
Specifically, two Confucian perspectives were instructive when Chinese rulers
considered their ethnic strategies: the “Grand Union” ideology, and the Confucian view
of ethnicity, which argues that “Lǐ” is the only criterion for judging one's character.
Living in the Spring and Autumn period (770 – 476 BC) when China was in hands of
warlords, Confucius (551–479 BC) had been advocating for the establishment of a grand
unified polity his entire life. His political ideal of a grand, unified China was widely
applauded by intellectuals in his time. It was then widely advocated by his students and
followers, and eventually rose to the position of an official orthodoxy during the reign of
Emperor Wu of Han (in reign: 141-87 BC). Since then, to establish and maintain a grand
unified polity has been the ultimate political ideal of all Chinese rulers, whether they
were Han or non-Han, emperors or political parties.
Following the “Grand Union” ideology, Chinese emperors of all dynasties were supposed
to strive hard to keep their territory intact and their people united. Therefore, when a
vassal state, which seemed to be any regime that had once established tributary
relationship with the imperial court, when such a state decided to turn its back against the
Chinese imperial court, Chinese emperors would find it legitimate and also obligatory to
try to get the “rebels” back; though depending on the specific circumstances strategies
used could range from giving gifts and marrying out their princesses to military
18
deterrence or conquests. For some emperors who were particularly ambitious, such as
Emperor Wu of Han and Emperor Yang of Sui (in reign: 605-618), the “Grand Union”
ideology sometime could also provide justifications for China to initiate wars against its
neighbors.
The Confucian code of conduct and good practice known as “Li” also played an
important role in shaping Chinese emperors’ attitude toward non-Han, or ethnic minority,
groups. Different from other ancient civilizations that defines ethnicity based on physical
differences such as race, religion, language, and customs, imperial Chinese society in all
historical periods since the Zhou dynasty had a tradition to view people as belonging to
only two groups --- barbarians and the civilized --- depending on whether their behavior
were in accordance with social norms and behavior regulations, or “Li” in Pinyin, which
particularly refers to the Confucian ethical code of conduct originally developed from the
teachings of Confucius (551–479 BC). As Chinese historian Ge Jianxiong noted:
Before the modern term ‘nation’ was introduced in China by Liang Qichao13 in 1899, the notion of ethnicity had remained unclear…From the pre-Qin period to the end of the Qing dynasty, Chinese identified each other as either ‘barbarian’ or ‘civilized’ primarily --- if not exclusively --- depending on whether one properly interpreted and practiced the Confucian code of ethics and conduct. And for Chinese rulers of all dynasties including non-Han rulers who established regimes in central China, this [Confucian] view [of ethnicity] had provided a principal guideline for handling ethnic relations (Ge 1993).
Under the guidance of the “Grand Union” ideology and the Confucian view of ethnicity,
Chinese emperors’ first ethnic policy choice had always been cultivation, for they trusted
that ethnic conflicts would naturally disappear as long as the non-Han people were taught
13 Liang Qichao (1873-1929) is a Chinese scholar, journalist, philosopher, and reformist during the late Qing Dynasty and early Chinese Republic who inspired Chinese scholars with his writings and reform movements [note by the author].
19
to appreciate the Han culture and social values and were convinced to practice the
Confucian ethical code of conduct that the majority Han people had been practicing.
In contrast to Han emperors, Mongol Yuan and Manchu Qing emperors attached greater
importance to bloodlines and therefore implicitly encouraged social stratification by
ethnicity. But they had also the Confucian view of ethnicity expedient as it provided them
with moral justifications that they very much needed to ensure their rule over the Han:
despite their initial role of invaders, as long as the Mongol or Manchu rulers started to
follow the Confucian social norms and ceremonial rituals, they became good emperors,
and anyone who insisted not to submit to such a good emperor was behaving against the
Confucian norms and therefore barbarians.
3.1.3 The “Celestial Empire” Mindset
The other philosophy that had heavily influenced Chinese emperors’ understanding of
ethnic relations and their handling of ethnic issues is the “Celestial Empire” mindset.
Since Emperor Wu of Han (in reign: 141-87 BC), Chinese emperors of all dynasties had
believed that among all countries in the world, China had the most prosperous economy,
the most advanced technology, the most sophisticated culture and philosophy, and the
most civilized people. Therefore, China was the “Celestial Empire”, and Chinese
emperors were rulers of “all civilized mankind” (Fairbank, 1979), and “’all land in the
world belong to the Son of Heaven’” (Ge, 1993).
20
Equipped with the “Celestial Empire” mindset, Chinese emperors tended to view ethnic
people from surrounding areas uncivilized individuals or even inferior mankind (Dikötter,
1997); although such condescending mentality may be unconscious. When China was a
strong polity, the “Celestial Empire” mindset was reflected in the emperors’ eagerness to
cultivate China’s ethnic neighbors, given that they showed proper respect to the imperial
court. Various measures were taken to this end, such as offering to share with ethnic
groups advanced agricultural skills or financing their scholars to study at the China
imperial academy. Some ambitious emperors would even initiate wars against the
surrounding regimes, because after all, “when the [Chinese] emperor needed to expand
his territory, it was not invasion to another regime and people, but exploitation of the
emperor’s own land and his own subjects” (Ge, 1993).
But when China was in decline and invaded by military forces from neighboring non-Han
regime, at times such as the Song dynasty (960-1279), Han emperors would give up their
cultivation plan and turned to call the non-Han people ruthless and atrocious enemies,
untrustable and despicable individuals, and barbarians or even animals that would never
be civilized. Even if when the imperial court had to capitulate to the enemy force and had
to cede a piece of Chinese territory, the ruling class would deny the ethnic enemy’s
success because “it was not cession but a grant to the barbarians” (Ge, 1993).
It is worth noting that the “Celestial Empire” mindset was also shared by non-Han people
who seized power and became the rulers of China. In fact, it was out of the same
21
mentality, that Empress Cixi of the late Manchu Qing dynasty ceded pieces and pieces of
Chinese land to one after another industrialized powers. Another example showing how
the “Celestial Empire” mindset had also deeply influenced non-Han emperors is the
Macartney Mission. In 1793, George Macartney and his business fleet first visited China
to convince Emperor Qianlong of the Manchu Qing dynasty to lift trade bans between
Great Britain and China. Upon Macartney’s immediate arrival at the Tianjing port, local
officials placed a flag bearing the characters of “Tributary Envoy from England” on his
boat. The Macartney mission eventually failed badly though Qianlong was seen as one
of the wisest and open-minded Chinese emperors during the Qing dynasty, as the British
showed no respect to the court and refused to kneel down and kowtow. In Emperor
Qianlong’s mind, “when a foreigner came to visit China, even if he was king of his
regime, he would still be just an vassal of the [Chinese] Son of Heaven” (Ge, 1993).
Although the “Celestial Empire” mindset sounds ridiculously ignorant today, it had been
firmly believed for over two millennia. It was only until the late 19th century, when China
was forced open by Western arms, that this ungrounded sense of superiority lost its
ground and appeal.
Up to this point, one may have already noticed that the “Celestial Empire” mindset is
nothing but ethnic nationalism interpreted in the Chinese context. Since ethnic
nationalism stresses the importance of common ethnic ancestry, or bloodlines, in defining
a nation (Muller, 2008); it stands on the opposing side of Confucianism, which is in
essence cultural nationalism emphasizing that a nation is defined by a shared culture (Kai,
22
1999) . Indeed, throughout history, Chinese emperors of Han or non-Han ethnicity had
taken on these two opposing perspectives alternately on their way to achieve one ultimate
goal: a grand unified polity. It is exactly for this reason that historian Duara argued that
China’s ethno-political history is a “bifurcating linear history” (Duara, 1993; 1995).
3.1.4 Specific Ethnic Strategies in Imperial China
Ethnic strategies ancient Han imperial court took fall within two large groups:
appeasement strategies and military deterrence.
Towards ethnic groups who showed allegiance or ethnic regimes which became China’s
vassal states, the Han imperial court took multiple appeasement measures. Commonly
used strategies include (1) giving ethnic minority administrations a certain degree of
autonomy, including appointing indigenous people as heads and senior officials of their
own administrations; (2) giving ethnic people generous economic incentives and
abundant material provision to make redundant potential rebellions associated with
material scarcity; (3) waiving or cutting back vassal regimes’ tributary duties; (4)
arranging intermarriage between the royal families and also encouraging intermarriage
between the peoples; (5) promoting residential mixture by moving either the Han to the
minority-dominant areas in the peripheries, or the minority groups to Han-dominant
"core" regions in central China; (6) encouraging using of Han language and adoption of
Han dress and social norms in minority communities; (7) encouraging Han families to
adopt minority children; (8) granting royal surname to minority group leaders; (9)
23
encouraging minority people to change their real ethnic names to Han names. Because
Chinese are very much concerned about bloodlines and family names, being adopted by
another family or changing name is a very serious transition in people’s identity, and
would certainly lead to amalgamation and acculturation among ethnic groups.
The above appeasement strategies helped the Han imperial court to keep China a united
multi-ethnic polity without having to resort to military actions. However, if the submitted
ethnic regimes attempted to rebel or secede, Han emperors would find it legitimate to call
for a military crackdown on rebels.
Toward ethnic regimes that invaded the Chinese territory, Han emperors’ strategies were
still military deterrence and cultural assimilation; but they applied them in the opposite
order as they did when dealing with allies and vassal states. Han emperors would first
appeal to arms, and if the Chinese forces won, they would then try to “civilize the
barbarians” using the various assimilation measures listed above. If the Han emperors
lost the war to the invading ethnic regimes, they usually would have to resort to royal
marriage in which a Han princess would be married to the enemy. How long the
intermarriage between the Han court and its enemy regimes would last depended on
when the Han emperors felt his forces were strong enough to reclaim his lost land (and
daughter14.
14 Marriage alliance was first used by Liu Bang, founding emperor of the Han dynasty, who married a daughter of the Han royal family to the Xiongnu king in 200 BC in exchange for freedom of the Han army ---- who had been besieged by the Xiongnu army for seven days --- and time to recover and revive the then war-torn Chinese society. Though marriage alliance had been a popular ethnic strategy throughout the Imperial China period, it was never used by emperors of the Song dynasty (960-1279), who would rather pay tribute to the enemy or even cede their territory than marrying out their daughters. A main reason is that the rise of the Cheng-Zhu school, one of the most important philosophical schools of Neo-Confucianism, which viewed intermarriage between Han and non-Han peoples the highest degree of insult. See Cui (2007) for more discussion about the marriage alliance strategy in China.
24
Chinese scholars described nature of the various ethnic strategies Chinese emperors have
taken in history as “Jīmí”, meaning “bridle and millet”. As its name suggested, “Jīmí”
policy consists of two parts: the bridle part is military and political pressure to deter or
overawe ethnic minority administrations; and the millet part includes various
appeasement strategies to help the Han imperial court cultivate “the barbarians” and build
their trust toward the court. Emperor Qin Shihuang (in reign: 247 – 210 BC) was
probably the first Chinese emperor who used the “Jīmí” ideology to guide his ethnic
policies. Since then, “Jīmí” strategy had been repeatedly adopted by emperors of later
dynasties; and has not lost its appeal even till today.
3.2 Nationalism and Ethnic Strategies of the Chinese Nationalist Party: 1911-1949
Between the demise of the Qing dynasty in 1911 and the rise of the People’s Republic of
China 1949, Chinese society was exposed to two political ideologies imported from
Europe: Nationalism and Communism. These two philosophies have greatly impinged
the traditional Chinese view on ethnic relations. We shall discusses in this section how
nationalism shaped ethnic strategies of the Chinese Nationalist Party (also known as
Kuomingtang, or KMT), which governed China during 1912-1949 and is one of the two
leading political parties in Taiwan today. Section 3.3 examines how communism,
especially Marxism-Leninism, shaped ethnic strategies of the Chinese Communist Party
(CCP), which was founded in the early 1920s and came to power in 1949.
25
The modern concepts of “nationalism” and “nation state”15 were introduced into China in
the late 19th century, after Japan and Western powers invaded China and forced the Qing
imperial court to open China’s ports. Advocating the establishment of “nation states”
through “national self-determination”, nationalism was quickly accepted by many Han
intellectuals, who have long resented the discriminating reign of the Manchu Qing
government. Among these intellectuals, Sun Yat-sen, who later founded the Chinese
Nationalist Party or KMT, was the most influential. In 1905, Sun borrowed the western
nationalism concept and developed it into his notion of Chinese nationalism, which he
summarized into a sixteen-Chinese-character slogan: “Expel the Tartar16 barbarians;
revive our Zhonghua17; establish a Republic; distribute land equally among the people”
(The United Allegiance Society18 Manifesto, 1905).
As implied in this slogan, in initial Sun’s explanation, only Han Chinese were considered
Chinese nationals in the beginning of China’s nationalist movement. But after Sun was
appointed first president of the Provisional Republic of China (ROC) founded by KMT in
1912, he called the newly established polity “a republic for five ethnic groups”,
expanding the definition of "Chinese nationals" to include not only the Han but also the
Manchu, the Mongol, the Tibetan, and the Muslism Hui people. That said, leaders of the
15 The political ideology of “nationalism” had emerged as early as the 17th century and gained increasing popularity during the 18th and 19th century. Despite its long-term existence as an important concept, however, "all attempts to develop terminological consensus around nation resulted in failure" (Tishkov, 2000). That said, most scholars agree that a nation state is where a “state”, which is a political and geographical entity, serves as a sovereign entity for a “nation”, which is cultural and ethnic entity. 16 Tartar is a general term referring to all northern nomadic peoples in China at that time. But in this context it mainly refers to the Manchus ruling class. 17 zhōnghuá is a term widely used to refer China and the Chinese people. It has an implicit emphasis on Han Chinese as “zhōng” means central area, and “huá” relates to the Huaxia people. 18 Sun formed the United Allegiance Society in 1904 in replace of the Revive China Society that he founded earlier when he was in medical school in Japan. United Allegiance Society then became KMT in 1912. KMT remains one of the two leading political parties in Taiwan, or Republic of China.
26
new Republic did not seem to consider all ethnic groups equally capable of participating
in political affairs. This is implied in a speech Sun gave in Guangzhou in 1923, in which
he urged that the provisional Republican government must take proactive measures to
promote assimilation of non-Han people into the Han culture, as
The Manchus were under the de facto control of the Japanese, Mongols the Russians, and Tibetans the British. [This situation] suggests their lack of the ability to defend themselves/their own sovereignty. It is our mission to bring them out of such situation. We now think of a method, that is, we should help them assimilate into the Han people, and give them [non-Han ethnicities] an opportunity to build with us a republic… We should emulate the Americans and build a country in which the only people is the zhōnghuá mínzú (Sun, Speech at National Students Association in Guangzhou, 1923.8.15).
This speech demonstrates KMT’s ethnic view. First, KMT considered non-Han people
unenlightened, incapable, and politically dependent; and advocated their assimilation into
the Han for their own benefit. Second, KMT considered China’s northern and western
border regions strategically important and hence the recognition of ethnic groups living
there, though it was nothing more than a gesture of respect with little substance. Third,
KMT promoted the use of one single name “zhōnghuá mínzú” for all Chinese regardless
ethnicity, culture, and religion.
According to American political scientist Katherine P. Kaup, Chiang Ka-shik, who
became the sole leader of KMT after Sun died of liver cancer in 1925, even “repudiated
the notion that China is composed of numerous nationalities, each having the right to
maintain its uniqueness. [And] wrote [in his book China’s Destiny (1947, pp. 40)] that
‘the differentiation among China’s five people is due to regional and religious factors,
and not to race or blood’” (Kaup, 2000, pp.62).
27
Based on the above analysis, we find it reasonable to conclude that KMT held an ethnic
view similar to that held by Chinese emperors in the Imperial China period; and indeed,
with a stronger Han chauvinism tone.
3.3 Communism and Ethnic Strategies of the Chinese Communist Party: 1921 –
1949
Since its birth following English philosopher Thomas More and his book Utopia (1516),
communism has appeared as a radical political movement in Europe, advocating a
classless, moneyless, and stateless social order structured upon common ownership of the
means of production. In the late 1910s, a revised version of communism, Marxism-
Leninism gained appeal among some Chinese nationalists --- most notably Li Dazhao and
Chen Duxiu. In the hope that Marxism-Leninism could too save China as it did to Russia,
Chen and Li, who was then an important KMT member, founded the Chinese Communist
Party (CCP) in 1921.
Before the relationship between KMT and CCP turned sour in 1927, CCP’s ethnic
strategy was a copy of its former USSR counterpart with little details and also, of course,
little chance to be implemented. The only thing to note is that different from KMT, CCP
advocated that all ethnic groups in China should enjoy absolutely equal rights in all
aspects of social life (Second CCP National Congress Manifesto 1922) ; in particular,
28
CCP was adamant that ethnic minority groups should enjoy political self-determination
(CCP Constitution 1923).
When Chiang Kai-shek started to crack down on CCP members in 1927, Mao Zedong,
initially an avid follower of Chen Duxiu who co-founded but later left CCP, rose to
power. Between 1927 and 1949, except when the Japanese invaded, Mao-led CCP and
Chiang-led KMT fought over the rule of China19. However, as KMT ruled most part of
the country, CCP had to develop their “revolutionary bases” in rural areas.
CCP soon realized that it was strategically critical to further promote the Marxist-Leninist
ethnic policy in its bases, as the prospect of a society where all ethnic groups enjoy equal
political, cultural, and economic rights strongly appealed to ethnic minority Chinese, who
were (and are still) concentrated in China’s rural areas. CCP therefore quickly moved
from empty talks to real work, which included establishing ethnic minority schools,
distributing political leaflets printed in minority languages, appointing minority party
officials, sending minority party members to Moscow to study communism theory and
the Soviet experience, and even confiscating land from landlords, feudal aristocrats, and
monasteries and giving it to their landless tenants20. These efforts were not in vain as they
soon gained CCP trust and support of most minority Chinese.
19 Beginning in the early 1900s, numerous warlords also rose to power in different regions in China. But their activities and influence were mostly regional rather than nationwide. Both KMT and foreign powers tried to enlist their aid but the efforts were eventually in vain due to conflicts of interest. 20 Confiscating land from its owners and giving it to the proletariat was a strategy that CCP frequently used to gain support from the mass. But whenever serious situation such as the Japanese invasion called for, CCP would temporarily stop this practice as “The petty bourgeoisie is also demanding resistance. …. Like the peasants, they are small producers in their economic status, and their interests are irreconcilable with those of imperialism…Now, faced with the immediate danger of becoming slaves to a foreign nation, they have no alternative but to[unite and] resist” (Mao Zedong, 1935).
29
4.Ethnic Policies and Their Practice in Contemporary China: 1949- the Present
With widely recognized military talent and luck, Mao and CCP under his (almost sole)
leadership seized power and established the People’s Republic of China (PRC)
government in 1949; while Chiang and his KMT fled to Taiwan and continued there the
reign of the Republic of China (ROC) government.
During its early years, CCP-led Chinese government copied the Soviet model in almost
every aspect of political administration and social management; and established in China
“a centralized political administrative system, a state-owned planning economy, and
revolutionary educational and cultural systems” (Ma, 2006). And as far as ethnic
minority policy is concerned, CCP did write in the Chinese Constitution that minority
region autonomy is the “cornerstone” of the new government’s ethnic minority policy,
and therefore fulfilled the “self-determination and autonomy” promise it made to its
ethnic minority members long ago21.
21 As early as 1923, CCP had advocated “self-determination right” for each ethnic group (CCP Constitution 1923). In the Chinese Soviet Republic Constitution (1931), CCP promised for the first time that minority regions “can establish autonomy”. In the Political Action Program of the Shaanxi-Gansu-Ningxia Border Region Government promulgated in 1941, the CCP stated that “According to the principle of national equality, we shall enable the Mongols and the Uyghurs to enjoy political, economic, and cultural rights equal to those of the Han people; and allow them to establish Mongol and Uyghur autonomous regions”. This stipulation also stated that ethnic minority people must enjoy freedom to keep and practice their customs, languages, and religious beliefs.
30
CCP’s minority autonomous regions, however, are not exactly the same as their former
USSR counterparts known as the “Soviet Union Republic”22. In former USSR, political
rights including “self-dominion” of ethnic groups were highly emphasized. Though
appointed by the Moscow government, First Party Secretary of each Soviet Union
Republic (SUR) had full rights to manage internal affairs in his republic. The major
linkage between SURs was a common belief in Marxism-Leninism rather than political
institution. CCP’s minority regional autonomy, in contrast, requires regional minority
leaders Beijing report all major local affairs to the central government, and obtain
Beijing’s approval before any major decisions are made and any actions taken. Obviously,
the CCP leaders wanted to keep its promise and keep up with the former USSR standards,
but they have been more adamant that the Confucian ideology of “Grand Union”, which
had guided Chinese emperors’ ethnic strategies for over two millennia, must also be
carried forward.
Concerned that ethnic minority people may be unhappy, CCP leaders decided to push one
step further the traditional appeasement strategy and follow Lenin’s advice, who argued
that“[Ethnic equality] consists not only in the observance of the formal equality of
nations but even in an inequality of the oppressor nation, [and] the great nation must
make up for the inequality which obtains in actual practice” (Lenin, 1923). As Chinese
sociologist Ma Rong (2006) interpreted, Lenin’s contention requires the central
22 The former USSR was divided into fifteen ethnically-based administrative units known as the “Soviet Union Republic”: Russia, Ukraine, Uzbek, Kazakh, Byelorussia, Georgia, Tajikistan, Moldova, Kirghizstan, Lithuania, Turkmenistan, Armenia, Latvian, and Estonia. Several of these Union Republics themselves, most notably Russia, were further subdivided into Autonomous Soviet Socialist Republics (ASSRs) based on ethnic/cultural lines (Wikipedia).
31
government make policies that take ethnicity into consideration in order to benefit ethnic
minority people in every area of social life, from schooling and employment
opportunities to family planning and promotion of government officials.
Based on these considerations, Chinese government under the leadership of the Chinese
Communist Party put in place a series of micro and macro minority policies favoring
ethnic minority people in ultimately all social aspects, from employment, financial aids,
and official promotion, to language, education, family planning. This entire section is
devoted to discussing these policies.
4.1 Recognition of Nationalities Campaign
Emulating its former USSR counterpart23, Chinese government launched a nationwide
"Recognition of Nationalities Campaign" in the early 1950s to identify ethnic background
of each Chinese citizen. The Campaign lasted for more than two decades and did not end
until the late 1970s.
People in all Chinese provinces and autonomous regions were interviewed about their
ethnic background by expert teams made up of scholars and government officials, who
then identify the interviewee’s ethnicity using primarily Joseph Stalin’s “nationality”
23 In the former USSR, ethnic background of every USSR member was identified in a nationality recognition campaign and then formally printed on his or her internal passport in the “nationality status” column.
32
definition (Stalin, 1913)24 with necessary adjustments to historical and local
circumstances25. After this, his or her ethnicity was printed on his or her personal
identification card and also officially entered in the family’s Household Registration
Book (or Hùkǒu in Pinyin), a system of residency permits that was first put in place in
January 1958 to prevent rural population from migrating to urban areas, and still exists
today though more and more migratory controls have been lifted since the late 1970s in
response to urban industries’ demand for cheap labor.
Of the currently recognized 56 ethnic groups in China, 38 ethnic groups had been
recognized before the Nationality Recognition Campaign started in 1954; 15 were
recognized during 1954 and 1964, and two were recognized in 1965 (Luoba) and 1979
(Jinuo), respectively (Huang and Shi (Eds.), 2005). While nationwide ethnicity
recognition campaign was largely ended after 1979, about 0.7 million individuals --- of
whom 97% are from Guizhou province --- remained "unrecognized" in terms of ethnicity
by year 2000, as their requests to become independent "nationalities" have not received
enough support from scholars and the Chinese government.
24 In his work Marxism and the National Question (1913), which subsequently became the cornerstone of the Soviet policy towards nationalities, Joseph Stalin defined a nation as "a historically constituted, stable community of people, formed on the basis of a common language, territory, economic life, and psychological makeup manifested in a common culture". 25 As Ma (2006) noted, several groups have lost their distinct languages (e.g. Hui, Manchu), but they are still recognized as "nationalities" different from the Han mínzú; and “there was some "artificial" grouping that varied from one place to another in the process of identification. One group who lived crossing the Sichuan-Yunnan border was identified as ‘Mongolian’ in Sichuan Province, and as ‘Naxi’ in Yunnan Province, though they shared same language, life style, and customs and were relatives for a long time. Dongxiang, Sala, and Baoan used to be considered as the branches of the Hui group in the past, and the three became independent ‘nationalities’ during the recognition process” (Ma, 2006). This partly explains why scholars have so far not reached an agreement on how to translate the Chinese term “mínzú” in English, as neither “nationality” nor “ethnic group” seems to have exactly the same meaning as “mínzú” (see the beginning of Section 2).
33
Since the early 1950s, China’s ethnic minority population has increased from 35 million
or 6% of the total Chinese population in 1953 (First National Census) to 114 million or
8.49% of the total population in 2010 (Sixth National Census).
4.2 Minority Regional Autonomy
Of all ethnic policies of the CCP-led Chinese government, “regional autonomy for ethnic
minority people” (shǎoshù mínzú qūyù zìzhì) is the core. It was enshrined in China’s
Constitution since it was first ratified in year 1954; where one reads that "People's
Republic of China is a united multi-nationality country, and regional autonomy should be
in practice in the areas where minority population are concentrated". Though the 1954
Constitution was later replaced by the 1975, and then 1978 and 1982 Constitution,
Minority Regional Autonomy has always been recognized and emphasized as the
cornerstone of China’s ethnic strategy. The National Minority Regional Autonomy Law
enacted in 1984 further provides specific guidelines regarding the implementation of
regional autonomy in China’s minority areas.
According to the Ministry of Foreign Affairs (2000), minority autonomous regions are
places “where national minorities live in compact communities, autonomous organs of
self-government are established under the unified leadership of the Central Government”,
and where “minority people shall exercise autonomous rights, be masters in their own
areas, and administer the internal affairs of their ethnic group”. Currently, China has five
34
provincial-level autonomous regions. These minority autonomous regions were gradually
established. Inner Mongolia was founded as early as 1947, Xinjiang Uyghur
Autonomous Region in 1955, Guangxi Zhuang Autonomous Region and Ningxia Hui
Autonomous Region in1958, and Tibet Autonomous Region not until 1965. In addition
to these five provincial-level autonomous regions, China currently also has 30
autonomous prefectures, and120 autonomous counties (or “banners” in Inner Mongolia)
26. Further, over 1,100 autonomous minority townships have been established by the end
of 2008 as complements to China’s Minority Regional Autonomy system (Chinese
Government White Paper, 2009). According to the Fifth National Census (2000), 44 out
of the 55 officially recognized ethnic minority groups, or 71% of China’s minority
population, have established their own autonomous areas, which together occupy 64% of
the country’s territory.
Self-government in a minority autonomous area is carried out through local government
and people’s congress, which enjoyed “extensive self-government rights beyond those
held by other [Han] state organs at the same level” (Ministry of Foreign Affairs, 2000),
including the right to enact regulations based on local political, economic and cultural
needs, and the right to independently arrange and manage local construction, education,
science, culture, public health and other local undertakings. Minority autonomous
governments also receive from Beijing large quantities of financial aid and material
subsidies, to which they have full control.
26 For detailed statistics on the name, geographical location, date of establishment, and population data of each of the five autonomous regions and 30 autonomous prefectures, see Table 2 “Autonomous Regions and Prefectures in China” in Ma (2006, pp.96). See also Appendix “Basic Facts About the 155 Ethnic Autonomous Areas” in the Chinese government white paper “Regional Autonomy for Ethnic Minorities in China” (Chinese Government White Paper, 2005).
35
Different from Soviet Union Republics in the former USSR, however, minority
autonomous regions in China are never given the right of secession. There are several
considerations behind this arrangement. Firstly, while Han Chinese is dominant in terms
of population size, ethnic minority Chinese occupies the majority of the Chinese territory
which boasts abundant natural resources. As Mao Zedong noted in his famous speech
“On the Ten Major Relationships” delivered at an enlarged meeting of the Politburo of
the Central Committee of the CCP on April 25, 195627:
We say China is a country vast in territory, rich in resources and large in population; as a matter of fact, it is the Han nationality whose population is large and the minority nationalities whose territory is vast and whose resources are rich, or at least in all probability their resources under the soil are rich…… The air in the atmosphere, the forests on the earth, and the riches under the soil are all important factors needed for the building of socialism, but no material factor can be exploited and utilized without the human factor. We must foster good relations between the Han nationality and the minority nationalities and strengthen the unity of all the nationalities in the common endeavor to build our great socialist motherland (Mao 1956).
In this situation, if secession of ethnic minority autonomous regions were allowed and did
happen, China’s economy could collapse. Chinese government would certainly not take
such a risk. Indeed, which government in the world would?
Secondly, as shown in Figure 1, the majority of ethnic minority Chinese are concentrated
in China's border areas (colored areas). For the Chinese government, and indeed any
government in the world, security and control of borders are of the utmost importance as
27 Mao’s speech soon became the CCP’s outline of how it would strike to build the newly established People’s Republic of China into a strong socialist nation. This speech was again published on China Daily on December 26, 1976, suggesting that Mao’s ethnic strategy would be carried forward by his successors.
36
borders fend off dangerous people and goods, facilitate international trade and tourism,
and also enhance travel capability of citizens of the country. It is therefore not difficult to
understand why the CCP would not risk China’s border security by giving ethnic
minority areas absolute autonomy. Chinese ethnologist Zhu Lun even argued that
prioritizing national unification over minority autonomy is the very reason why the
Chinese government managed to maintain China a united and multi-ethnic polity long
after the USSR was dismantled (Zhu, 2001).
Thirdly, in the 1950s, many minority communities lived very primitive. They faced
material hardship that was more severe than that facing the majority of the Han, as
minority people had always been concentrated in areas where geographical conditions are
unsuitable for agricultural activities (though rich in minerals). Ethnic minority people
were also less enlightened than their Han counterparts in the sense that they knew very
little about the outside world. As Tan Bibo --- an ethnologist and major member of the
government-organized work team sent to minority villages in Yunnan province in the late
1950s --- recalls, salt and sickles were among the most demanded materials; and the main
job of the work team included not only establishing schools, and health clinics but also
teaching minority villagers how to use raise farm animals, plough, and use farming tools
(Wang, 2012). Under this circumstance, many Han people in the 1950s felt sympathized
and morally obliged to help their fellow citizens of non-Han ethnicities to develop and
thrive in the newly established socialist country.
37
From the above analysis, we see how the CCP’s Minority Regional Autonomy system is
the product of China’s ethno-political reality and the Party’s political ideal, which
advocates all-around self-determination for each ethnic group. As ethno-anthropologist
Tan Leshan summarized: “The CCP's minority policy does not simply address the
fundamental interests of minority people. Regional Autonomy is essentially a tactical
policy serving the ultimate goal of socialization, national integration, and political
stability in China” (Tan, 2000).
4.3 Other Pro-Minority Policies
To complement the Minority Regional Autonomy system, the central government has
enacted a series of pro-minority policies that span a broad spectrum of social issues, from
economy, education, employment, to culture and religion, health and nutrition, and
family planning. This section discusses the most influential ones among them.
4.3.1 Subsidies, Investment, Tax Incentives, and Special Funds
The Chinese government believes that a key to balance Han-minority relationship and to
foster social unity and stability is help ethnic minority areas to develop their economy. To
this end, Beijing has been providing substantial amount of financial aids to minority
autonomous areas each year. These financial aids take many forms, which include direct
38
government transfer, infrastructure investments, tax incentives, and special funds. Using
data from the Bureau of Statistics of China, Ma Rong calculated that each year during
1990 and 2002, central government subsidies accounted for at least one fourth and up to
one half of the total fiscal revenue of the autonomous government in Guangxi and Inner
Mongolia; and the percentage contribution central subsidies made to Xinjiang Uyghur,
Ningxia Hui, and the Tibetan autonomous government is 46%-63%, 56.9-76.9%, and
83.3-98.6% respectively (Ma, 2004a, pp. 524).
Among all autonomous regional governments, no one relies more on government transfer
than Tibet. Using data from the Tibetan Bureau of Statistics, Song and Wang (2005)
founded that central government subsidies covered over 90% and as high as 239.29% of
Tibetan government’s total fiscal revenue in every single year during 1953-2003, with the
only exception being years between 1960-1962, when Mao Zedong decided that any
mentioning of ethnic difference was separatism and anti-revolutionary, and therefore
Tibet was no inferior than any other Chinese province and did not need extra subsidy.
The Tibetan Autonomous Regional Department of Finance also revealed that the total
fiscal money at its disposal had increased to 46 billion in 2008 from 133 million yuan
(Chinese counterpart of the US dollar) in 1959 (Jia, 2009).
Infrastructure investment is another important channel through which the government in
Beijing subsidizes minority autonomous regions and helps them develop their community
and economy. According to the 2009 Government White Paper, Beijing has invested
about 1 trillion US dollars, or 7.8 trillion RBM yuan (or simply yuan), to build airports,
39
highways, and water facilities in ethnic minority areas. One such example is the
extension of the Qinghai-Tibetan Railway to Lhasa, capital of Tibet. This railway ended
Tibet’s no-railway history and connected Tibet with other parts of China, opening ways
for economic growth in Tibet. Infrastructure also includes temples and libraries. For
example, by the end of 2011, the central government has built 480 temple libraries in
Tibet, each including about 1052 books and CDs covering various topics from Buddhist
texts and Tibetan history to cultural education and health care (Chodron, 2011).
Another important channel through which Beijing subsidizes minority autonomous
regions is favorable tax policy. For example, if the autonomous governments are willing
to build infrastructure using local funds, they will receive a series of tax benefits known
as “three free and three half off”, meaning that the earnings of autonomous governments
from these infrastructure will be tax deductible for three years, and be taxed at one-half of
the regular tax rate during year four to six. Businesses in minority areas are exempt from
any tax for five years if they create jobs for minority people or are committed to
operating in environmental friendly ways. Extras tax benefits are also available for
businesses promoting minority cultural development. If a minority region exports natural
resources to other part of China, it enjoys lower income tax rate: up to 60% of the income
from export can be retained by the autonomous regional government, while only 50% can
be retained if the exporting area is not a minority autonomous area. Xinjiang Uyghur
Autonomous Region is a case in point. By exporting natural gas and petroleum to eastern
China, Xinjiang’s annual fiscal revenue has increased on average 3.2 billion yuan since
2004 (Hu and Zhang, 2010).
40
Special fund is also a major channel through which Beijing subsidizes minority
autonomous regions. For example, since the 1980s, the central government has
transferred 1.4 billion yuan to the Tibetan autonomous government for it to maintain and
preserve the area’s important historic sites and cultural heritage. Beijing has also
promised to invest over 1.7 billion yuan in a cultural relics preservation project in Tibet
during 2011-2015, which will give Tibet new museums, among others ("Tibet to receive
1.7 bln yuan for historic preservation in 2011-2015", 2011).
4.3.2 Compulsory Schooling, Minority Bonus Points, Minority Schools and Classes,
and Bilingual Education
According to the Nine-Year Compulsory Education Law enacted in the mid-1980s, all
Chinese children must receive at least nine years of education, which is offered for free
by the central government. Further, children from poor households will receive free
textbooks, free stationery, free room and boards (in case boarding school must be
attended), and some cost of living subsidies from the government. In addition to these
pro-education measures that are targeted to all Chinese children regardless of ethnicity,
Beijing has also taken a series of pro-minority education measures specifically targeting
ethnic minority students and aimed at promoting education at all levels in minority areas.
41
The most contentious among all pro-minority education measures of the government in
Beijing is perhaps the “Minority Bonus Points” policy designed to increase minority
students’ chance of getting into college. Each June, Chinese high school graduates will
take the National College Entrance Exam (NCEE), and the total score each of them
receives from the exam will be the only criterion determining whether he or she would be
accepted by any college, and also which university (at what rank) he or she can attend.
Under the “Minority Bonus Points” policy, a minority student would receive additional
points of up to 50, or 15 percent of the highest score one could possibly get from the
NCEE, which is 750; while a Han student would not receive such bonus points even if he
or she grows up in the same community and is taught by the same teachers as the
minority student in this example. Bonus points are not uncommon in China, but they are
usually given to students with exceptional ability in arts or sports; while in contrast,
minority bonus points are given based on ethnicity, which is not acquired through any
hard work.
The Chinese government also tries to promote minority education by building minority
schools, which include minority elementary schools; secondary schools including junior
secondary schools, vocational schools, and high schools; and higher education
institutions including national minority universities and regional colleges in minority
areas.
In principle, minority schools must exclusively or primarily serve non-Han students; in
reality, the percentage share of minority students in minority schools ranges from over 90
42
percent to less than 30 percent, depending on school types and local circumstances. Most
minority primary and secondary schools offer their teaching in ethnic language of their
minority students; many also offer teaching in Mandarin. Teachers are required to pay
particular attention to their ethnic minority students and tailor teaching to their needs.
National minority universities and regional colleges in ethnic minority areas also offer a
variety of degree and certificate programs specifically designed to fit the needs of
students with minority cultural and language backgrounds.
Through minority schools, the Chinese government expects to narrow the education gap
between the Han and minority populations in China faster and more effectively, as
minority schools allows the government to better target its aids to those who need them
most. That said, regular schools in which Han students make up a major proportion of the
student population must also take minority students, as long as they choose to attend
them.
By the end of 2008, China had built 20,906 minority elementary schools and 3,536
minority middle schools, which, respectively, 10.71 and 6.8 million enrolled students;
accounting for 10.36% and 8.45% of all elementary and secondary school students in
China, respectively. China also has 15 national minority universities and 167 regional
colleges in minority areas. About 1.34 million minority students are enrolled in these
universities and colleges, accounting for about 6.23% of all enrolled college students in
China (Government White Paper, 2009).
43
In addition to building minority schools in ethnic autonomous regions, the central
government has also established minority secondary schools in major municipalities or
large cities. Another similar measure is to set up minority classes in regular high schools
in selected cities. Minority students who get to attend these schools and classes are
selected by the minority autonomous regional government.
The first such school was established in Beijing in year 1984 for Tibetan students. Since
then, the central government has opened Tibetan Classes or Tibetan Schools in Beijing,
Tianjin, Chengdu, and Zhengzhou. By 2009, Tibetan classes have admitted over 70,000
middle school and high school students from Tibet, who were selected by the Tibetan
Autonomous Regional government; and all these students eventually entered college with
a number of government supports including the “minority bonus points” policy and the
“College Preparatory Class” program.
Since 2000, classes for Xinjiang Uyghur high school students (Grade 9 to 12) were
opened in 13 schools that belong to 12 major cities including Beijing and Shanghai. The
number of Xinjiang classes was later increased to 50 in 50 schools that belong to 28 cities
across 12 Chinese provinces and municipalities. The Chinese government has also
opened classes for Xinjiang Uyghur middle school students (Grade 7 to 9) in 8 cities
within the Xinjiang Uyghur Autonomous Region; and 80% of these students children of
local herdsmen and farmers. By 2008, these Uyghur classes have admitted in total 24,000
students.
44
In an effort to preserve ethnic cultural and language heritages and to improve cross-
cultural communication and understanding between the Han and non-Han ethnic groups,
the government in Beijing is committed to promoting use of ethnic languages. Specific
measures include establishing ethnic publishers, producing ethnic-language
telecommunication programs, and mandating bilingual education in minority autonomous
regions.
Currently, 53 out of China’s 55 officially recognized ethnic minority groups have their
own spoken language, and 22 use 28 ethnic written languages on a regular basis. By 2009,
over 60 percent of China’s ethnic minority population speaks their own language, and
about 30 percent can read and write in their native language. China Central Television
(CCTV) and 154 telecommunication stations in minority autonomous regions broadcast
in 21 ethnic languages every day. The number of publishers committed to publishing in
ethnic languages has also increased from 17 in year 1978 to 38 by year 2009. The central
government also requires bilingual education in all education institutions in minority
areas since the 1950s. By 2007, over 6 million students in 10,000 education institutions in
China were taught in 29 ethnic languages, which are frequently used by 21 major ethnic
minority groups.
4.3.3 Family Planning
45
Following the promulgation of the highly controversial “One-child Policy” in the late
1970s, urban Han Chinese couples were no longer allowed to have more than one child;
and upon approval of the local government, rural Han couples could have a second child
if their first baby was a girl. During the past four decades, the policy has often been
adjusted to local circumstances and social realities, but the ban was never really lifted,
and has been implemented with “many enforceable measures” (Ma, 2006). This strict
family planning policy, however, has been largely irrelevant to the ethnic minority
population.
Since the majority of the Han population are rural residents who live on agricultural
activities that appreciate male labor more than female labor, they have very strong son
preference and believe that they could only rely on their son(s) when they get old since
“Daughters married out are like spilled water” (Chinese proverb). As such, in order to
enjoy the same family planning privilege as their ethnic minority fellow citizens, many
Han people attempted to change their ethnic status from Han to non-Han in their Hukou
(Household Registration Book). This, according to Ma (2006), “may explain why the
population of Manchu and Tujia doubled in size during 1982-1990 when the
administration loosened the control of ‘status change’ after the ‘Cultural
Revolution’…[and why] all the children of [Han-non Han] intermarriages were registered
as minorities”.
4.3.4 “Two Less and One Lenient” Policy
46
As early as the 1950s, the government has suggested local criminal courts “take into
consideration local circumstances when handling minority cases” (Several Specific
Policies Regarding Smuggling Goods into China, 1952, Clause 4 Item 3). Later, in
Central Government Documents No.5 released in 1984, the Chinese government
stipulated that the “Two Less One Lenience” principle should be applied to criminal
defendants of minority ethnicity. Scholars and legal professionals in China generally
agree that this policy requires the police arrest as few minority criminals as possible, the
court punish them as lightly as possible, and the entire law enforcement agency be more
lenient to ethnic minority criminals as their culture and customs are different from that of
the Han (Xiao, 1996; pp. 263). Similar pro-minority policy is specified in the Criminal
Law of the People’s Republic of China currently in practice, which was promulgated in
1997:
In situations where the ethnic autonomous regions cannot completely apply the provisions of this Law, the People’s Congress of the autonomous region or of the province may formulate alternative or supplementary provisions based upon the political, economic, and cultural characteristics of the local ethnic groups and the basic principles of provisions of this Law, and submit them to the Standing Committee of the National People’s Congress for approval and implementation (Part 1, Chapter 5, Article 90).
Chinese scholars held different opinions toward the “Two Less One Lenience” policy.
Some argued that such flexibility is necessary as otherwise the ethnic tension may be
intensified (Wu, 2007, pp.453; Mo, 2001; Zhang, Zang, and Sun, 1991). Some scholars
are concerned that “Two Less One Lenience” policy would cause legal and social
injustice if used without caution; and argue that ethnic minority defendants should not be
given favorable consideration unless wrongful acts are proven to be indeliberate (Lei,
47
2008). No matter what scholars have said, Chinese policy makers have not seemed to
care enough to change it; and this policy has been frequently practiced since its
promulgation.
4.4 A Down Time: Cultural Revolution Period (1966-1976)
Mao Zedong has been a very prestigious leader of the CCP since the 1930s. After the
CCP assumed power in 1949, Mao further became the most influential political figure in
the newly established People’s Republic of China. A communist, Mao views ethnic and
cultural conflicts as “class struggles” in essence (Connor, 1984). He therefore decided to
handle China’s ethnic relations the same way he treated class struggle, to which Mao had
extensive experience as he had spent the most part of his life in “class struggles” with the
Chinese warlords, the Japanese invaders, and the KMT government under the leadership
of Chiang Kai-shek (Selected Works of Mao, Vol.1, 1993: pp.4).
Specifically, Mao continued to view all mankind as either people or enemies, and took a
dual strategy. On the one hand, he stressed that ethnic minority people are trustful fellow
citizens, and to prevent Han chauvinism that may occur as Han people accounted for over
90 percent of the total Chinese population, minority people must enjoy favorable
considerations over the Han in all aspects of social life. This policy gained Mao and the
48
CCP wide respect and trust among the minorities28. On the other hand, however, Mao
claimed that class enemies still existed among the minorities, and anyone who asked for
ethnic interests must be “member or ‘agent’ of the previous oppressive class among the
minorities, and anti-revolutionary against the proletariat leadership” (Ma, 2006).
Mao became more adamant that class enemies existed among the people in the late 1960s
and early 1970s, when the CCP experienced a significant ideological breakdown with the
Communist Party of the Soviet Union. Mao called for young people to form teams of
“Red Guards” to protect communism and Maoist orthodoxy in 1966. This marked the
official start of the notorious Cultural Revolution, a social-political movement whose
stated goal was to enforce communism and Maoist orthodoxy in the country by
discarding dregs of the feudal society and removing people’s enemies29.
28 Before the Cultural Revolution started in 1966, the CCP was highly respected by the Chinese people regardless of ethnicity, who appreciated the party for establishing a peaceful country after several decades of wars. An old Uyghur man (Kurban Tulum) in Xinjiang, for example, was so appreciative of the CCP that he rode more than 1,500 km around the Taklamakan Desert in Xinjiang to the its capital of Urumqi on his donkey (or donkey cart) to bring grapes/raisins (or, in other versions, melons) -- symbolic of the agricultural wealth of this large desert river oasis -- as a symbol of appreciation for Mao. After realizing that Urumqi is still over 3,000 km away from Beijing where Mao lives, he insisted that he would continue his journey on donkey cart until he reached Beijing. The government eventually arranged for him to be flown to Beijing to meet with Mao. 29 In response to Mao’s appeal for “Red Guards”, Chinese teenagers soon abandoned school and gathered to “protect Chairman Mao”. Later, nation-wide school closure happened as Mao said that “the more knowledge one has, the more retroactive he becomes”. The Red Guards also burned books, insulted their teachers, and tore down Confucius statues. To show their loyalty to Chairman Mao and the proletariate under his leadership, many children officially broke up with their “anti-revolutionary” families to show their loyalty to the Revolution and Chairman Mao. Incited by the Gang of Four, the Red Guards even alleged senior government officials --- of which the most famous was Liu Shaoqi, first Vice Chairman of the People’s Republic of China --- as “anti-revolutionary”; and privately penalized these adults with various shocking and appalling methods, of which many were their own “invention”, and literally killed or handicapped them.
49
Ethnic relations turned sour during this period (1966-1976). The Gang of Four
announced that all pro-minority policies were wrong and capitulations to the enemies.
The system of minority autonomy was criticized as divisive, and many autonomous
regional governments were dismantled overnight and many minority officials persecuted.
All other government organs set up to handle ethnic-related issues were also removed and
many government officials including Liu Shaoqi, a Han and new China’s first Vice
Chairman, were put into prison or privately interrogated and made either dead or
handicapped. In response to Marx’s comment that "Religion is the opium of the people" (
(Marx, 1844) which Mao endorsed, the Red Guards tore down temples and Buddha;
burned precious scriptures; and charged minority religious leaders as “nationalist
separatists” (Ma, 2006). Any recognition of ethnic differences was ill attempt to create
ethnic conflicts and oppose ethnic unification. The Gang of Four even claimed that
different ethnic groups could not exist in a socialist society.
Wu Xiaohua, a Mongolian Chinese scholar, described what happened during the Cultural
Revolution period in Inner Mongolia Autonomous Region as the follows:
Schools were shut down and books in both Chinese and Mongolian were burned. People were banned to speak their own languages as they were ‘primitive and useless’. Ethnic festivals were ‘exotic’ and therefore not allowed. People could not dance and sing, either; because dancing and singing are ‘despicable bourgeois activities (Wu, 2003).
The Cultural Revolution movement paralyzed China politically, economically, and
socially; demoralized and traumatized an entire generation of idealistic youth; and caused
the CCP to lose the trust it used to enjoy among its people, whether they are Han or non-
Han, though some CCP leaders, most notably Zhou Enlai, had tried to put things back to
50
the normal track before himself was made redundant by the Gang of Four and died of
cancer in early 1976.
Fortunately, the CCP leaders who managed to survive the Cultural Revolution ---- among
them Deng Xiaoping (1904-1997) was the leader ----- were determined to abandon the
rigid planned economy and strict politics of the Mao era; and replaced them with more
pragmatic economic plans and flexible political arrangements. Deng Xiaoping then
selected Hu Yaobang (1915-1989) to help him implement his economic reform plans.
Among things for which Hu was remembered are his ethnic minority policies. Hu
sympathized with ethnic minority people he met in Tibet and Xinjiang shortly after 1976,
and advocated for higher level of self-determination in minority autonomous regions. In
1980, he enacted and enforced the famous the “Six-point preferential policy” in Tibet and
“Three-60% policy” in Xinjiang30. These policies were opposed by many people and
have remained highly controversial even till today. However, they were abandoned
before they could prove themselves good or inappropriate, as Hu was forced to resign in
January 1987 for moving too fast towards economic liberalization and being too lenient
to students who organized public protests across Chinese cities in December 1986 asking
for greater political freedoms (Kristof, 1989). Though Hu’s ethnic policies were no 30 “Three-60% policy” requires that ethnic minorities should constitute at least 60% of students in local schools, 60% of employees in local enterprises, and 60% of soldiers in local enlistment (Shan and Weng, 2013). “Six-point preferential policy” says (1) Beijing stops taxing Tibet for at least two years; (2) Tibetan people are allowed to conduct whatever production activities they think will best serve their interest; (3) central government must heavily subsidize Tibet; (4) central government must help revive Tibetan culture, including language; (5) Han cadres sent to Tibet in the previous decades should leave Tibet as their mission there was done; (6) Tibetans must be given freedom to manage their own affairs as they know their situation better (Selected Important Documents for Tibetan Autonomous Region, Volume 1, 1983, pp.97), Note that while Hu advocated for Tibetan autonomy, he also pointed out that Tibet would not have a separate government as it had before. Rather, Tibetan government is the local representative of the central government but a special representative since at least two thirds of its officials must be Tibetans (Goldstein, 1997, pp. 63-66),
51
longer in practice, the Chinese government corrected the mistakes it made during the
Cultural Revolution period and continued to promote minority regional autonomy and
restored pro-minority policies.
To summarize this section (Section 4), for the most part of the past six decades (1949 -
the present), the Chinese government has firmly implemented Minority Regional
Autonomy and carried out a series of pro-minority policies for the benefit of ethnic
minority people. One question that naturally follows is: how well are the central
government’s pro-minority policies received by the Chinese people? The following
section (Section 5) picks up this question and tries to answer it
5. People’s Response and Scholar’s Critiques
As seen from the above analysis, the CCP-led Chinese government has made a
considerable amount of efforts to foster cross-cultural understanding and help ethnic
minority regions to develop their own economy. Unfortunately, these efforts seem to
have disappointed both the Han and the ethnic minority people.
Before we move into details, we would like to note that the discussion presented in this
section is based equally heavily on scholarly documents and on media sources. Ideally,
we would like to minimize use of non-scholarly materials as they are narratives and
therefore limited to the perspectives of particular individuals and events our discussions
52
on scholarly documents. Unfortunately, despite the abundance of scholarly literature on
China’s ethnic minority peoples, most studies focused on cultural analysis ---- for
example the study on ethnic Zhuang people by Kaup (2000), ethnic Yi people by Harrell
(2000), and Hmong or ethnic Miao people by Diamond (1997) --- while not many of
them examined the impact of pro-minority policies on the socio-economic welfare of the
ethnic group under examination. In contrast, we found a large number of media reports
providing first-hand and many times insightful feedbacks on how Chinese people receive
pro-minority policies and why. We therefore based discussions in this section on both
scholarly and non-scholarly documents.
5.1 Economic Development Caused Excessive Exploitation of Natural Resources
As discussed in Section 4.3.1, in order to promote economic development in minority
areas, the central government has built a number of social infrastructures, put in place
various public development projects, and given local businesses multiple tax incentives
and benefits. Unfortunately, these costly did not seem to make the minority people feel
better off, if not worse off.
Many minorities believe that the central government’s economic development policies
resulted in over exploitation of their natural resources, caused deterioration of their
environment and ecosystem, contaminated their culture, and increased minority-majority
53
inequality as the government returned only a small amount of the huge profits it earned
from exploiting minority resources to the minority people.
For example, the Mongolian people in Inner Mongolia blamed the government for
excessively exploiting the Mongolia Steppe, causing desertization, and consequently
depriving of local herdsmen their only means of subsistence. In May 2011, an ethnic
Mongol herdsman was killed by a drunken truck driver, who was later found out to be
employee a mining company, as he tried to obstruct the truck from passing onto his
pastureland. The local Mongolian people, of which some 2,000 were college and
secondary school students, were greatly angered by this incident and organized several
protests in front of local government buildings. These were the first large-scale ethnic
protests that the Chinese government had to face in Inner Mongolia since it took the reins.
Interviewed by Epoch Times in 2011, Haiming, chairman of the Mongolian Human
Rights Confederation headquartered in Germany complained that more and more
Mongolian herdsmen had lost their homeland because of desertization, and that they
could no longer raise horses but had to rely on motorcycles for transportation. During the
same interview with Epoch Times, Hebatu, director of the New York based Southern
Mongolia Human Rights Information Center told the interviewer:
Inner Mongolia is the largest energy base in China, but whatever the Steppe used to have, from minerals to rare herbal plants, everything was taken away by the large influx of Hans. The government dismissed the local herdsmen with several thousand RMB and then left them unattended. The environment has been destroyed and many people became sick and died, but no one cares (Hua, 2011).
54
Similar complaints are not uncommon to hear in Xinjiang Uyghur Autonomous REgion.
A reporter named (or perhaps pen-named) Dubu from Uighurbiz.net, an influential online
community where Uyghur and Han youths in Xinjiang meet to discuss human rights and
ethnicity issues, wrote in his article “The Uyghurs remain discontent and are more
estranged from the Hans”:
The current government implements a ‘carrots and sticks’ policy in Xinjiang. ‘Carrot’ is economic development. Urumqi used to be a city with a charmingly exotic culture. But it has now become a Han-dominant metropolis. Some people therefore blame the Hans for taking away all benefits of their massive exploitation [in Xinjiang] and causing the ever widening income inequality between the Han and the Uyghur people. On the other hand, the government used the 9.11 event [in the U.S.] as an excuse to wield ‘sticks’ toward the Uyghur people in Xinjiang, and raised their [domestic] ethnic independence movements to the higher plane of international terrorism (Dubu, 2012).
Chinese economist He Qinglian also documented similar complaint, which she heard
from the Uyghurs during her visit in Xinjiang:
We have been living on this land for many generations. Every mountain each river here belongs to us. By what right did the Hans swarm into our homeland? By what right did they do nuclear testings on our land? By what right did they export our petroleum to the Han areas? (He, 2009)
Some Tibetan intellectuals are also deeply concerned about the excessive exploitation of
natural resources in Tibet. For example, Woeser, a Tibetan activist and poet living in
Beijing and writing in Chinese, wrote in her blog:
Various ‘development’ activities currently ongoing in Tibet, such as mineral-mining, dam-building, and tourism, are demolishing the divine mountains and lakes of our Tibetan religion and culture and destroying the ecological system in Tibet. Such destructions are beyond redemption…. Concerning this [the current environmental issues in Tibet], His Holiness [the 14th Dalai Lama] said: ‘Personally, my greatest concern, is that it would be extremely difficult to recover a demolished eco-system. Especially the eco-system in Tibet, its deterioration will bring trouble to headwaters of all big rivers and lakes in Asia, and lives of billions of people will be threatened (Woeser, 2011).
55
It is worthy to note that many Han activists and scholars have also expressed concerns
about the environmental degradation in Tibet and China in general. For example, in the
“Democratic China and Future Tibet” seminar held in Washington, D.C. in July 2011, Li
Jianglin, an ethnic-Han historian currently living in America after her book 1959 Lasha!
was banned in mainland China, expressed her disapproval of the deal between the
government of the Tibet Autonomous Region and a tourism company headquartered in
Beijing, which plan to turn into tourist resort one of the nine Tibetan divine mountains
and a nearby divine lake. More than a decade earlier, Wang Lixiong, an ethnic-Han
specialist of Tibet from Beijing, has written in his book Sky Burial: The Fate of Tibet
(1998):
Tibet is like a man who has lost the ability to move himself, lying on the roof of the word. Vulture from different directions circle over him and scavenge for what they need --- be it sovereignty, public supports, or applause from international society. And also there are those greedy businessmen, gunmen hunting for wild animals, tourists looking for excitement, and westerners tired of modern civilization…they all swarm into Tibet and then take away what they need. In its entire history, Tibet had never been manipulated to such an extent and against its own will (Wang, 1998, p. 281).
5.2 “I think we would get more money if the Americans would take care of us”
Many Han people complained that the central government has given ethnic minorities too
much subsidies and made them lazy and overly dependent on the central government.
Though such complaints do not seem to have been formally documented, perhaps partly
because they are not politically correct; they could be found almost everywhere on the
56
Internet. But what do the minority subsidy recipients think? The following anecdote
from Tan Leshui, director of the East Asia Institute of Visual Anthropology at Yunnan
University, may allow a glimpse of their mind:.
For over a decade, I have been visiting Zhongdian, a Tibetan autonomous county in Yunnan province in southwestern China, at least once per year. During my most recent visit there, I met a local Tibetan man sitting on his front steps spinning a prayer wheel. We started to chat. I asked him how he thinks the Chinese government has been treating him. The man answered: the government gives me this house and some money for living --- but it’s very little money, never been enough. I think we would get more money if the Americans would take care of us (L. Tan, personal communication, February 14, 2013).
5.3 Ethnic Minority Areas Need More Jobs
Many minority people believe that the government should give them more jobs. In
Xinjiang, most Uyghur people feel that they are qualified for many jobs which are
however given to the Han simply because they speak better Mandarin; and this is unfair.
Mongolians and Tibetans also feel that the job market is not fair to minorities. For
example, after the 2008 Tibetan Unrest, Tibetan youth interviewed by New Zurich Times,
a German-language daily newspaper published in Swiss, complained about not having
equal access to jobs and education.
Based on his field study in Inner Mongolia, Ma Rong also noted that “Some Mongolians
also have complaints; they said that, on average, the share of scientists, engineers, doctors,
and CEOs in the Mongolian Chinese population is lower than that in the Han population.
Since Lenin emphasized absolute equality between ethnic majority and minority groups,
57
the present favoring policies should be further strengthened to reach that goal” (Ma,
2006).
As to what caused underemployment among the young minority people and thereby who
should be held accountable for it, scholars held different opinions. Ma (2006), who
himself is a Muslim-practicing Hui Chinese, believed that inadequate language ability is
the main reason for underemployment among minority youth; and therefore minority
youth should improve their Mandarin if they want a job. Han scholar Yao Xinyong,
however, argued that the underemployment in minority areas is a structural problem: both
the supplies of minority graduates from vocational schools and colleges have far
exceeded the number of jobs the economy can offer for such graduates (Yao, 2012).
IIham Tohti, a Uyghur professor of economics from Minzu University of China (also
known as Central University for Nationalities) in Beijing and founder of Uighurbiz.net,
seems to agree with neither the language inadequacy argument nor the oversupply of
labor argument, though both Ma (2006) and Yao (2012) based their arguments on
multiple field trips in Xinjiang. Instead, IIham Tohti believes that the underemployment
among young Uyghur people in Xinjiang is because Han people from other parts of
China moved into Xinjiang and took away local jobs. Citing official media report that
1.2 million workers migrated to Xinjiang from elsewhere in China in 2008, IIham Tohti
said in an interview with Radio Free Asia in early 2009:
Unemployment has existed in Xinjiang since the 1950s. Unemployment rate for the Uyghur population in China is among the highest in the world. This [fact that 1.2 million workers migrated to Xinjiang from elsewhere in China in 2008] suggests that there are abundant employment opportunities in Xinjiang. But why are these opportunities not given to the local Uyghur people? We do not object to migration, but we need to re-evaluate it. Currently Xinjiang does not need
58
migrants the way it needed them in the 1950s and 1960s, so why bring in migrant workers? If there’s really no unemployment in Xinjiang, why transfer young Uyghur women to inland China as cheap labor? [Asked about the current Xinjiang governer, Nur Bekri, who is also a Uyghur] He doesn’t care about Uyghurs. He only cares about social stability and security of Xinjiang and always threatened the Uyghur people. Xinjiang has developed, but people there, especially the Uyghur people, still live in poverty. Laws that should have been applied in the Uyghur Autonomous Region have never been implemented” (Hoshur and Jackson-Han, 2009).
Tibetans also seem disturbed by migrant workers from outside, who currently own many
of the city's small businesses. According to an article published in The Economist on
March 14, 2008, Tibetans in Lhasa believed that these small businesses caused
intolerable increase in food and consumer goods prices. Local people are also angered by
the construction of a railroad linking Lhasa and Xigaze, believing that it has brought
more migrants to the city and caused further inflation (“Fire on the roof of the world”,
2008). Interestingly, the government in Beijing described the same railroad as “having
greatly improved public transportation in Tibet, and consequently greatly improved the
standard of living of local Tibetans” (Chinese Government White Paper, 2009).
5.4 Education
5.4.1 Free education? “I would rather graze yaks and goats on horseback.”
Although the central government has made a number of efforts to promote education in
minority areas, especially Tibet and Xinjiang; things did not seem to go quite the way it
had hoped.
59
Based on his year-long geological investigation in Tibet, Lu Jingshi, a young Chinese
geologist, wrote in his dairy that “From chat with local people, we learned that local kids
find schools boring, and would rather go out to graze yaks or goats on horsebacks” (Lu
2006). Unwillingness to go to Han schools and learn the Han language had been
prevalent among Tibetans since the 18th century, when the Qing imperial court attempted
to establish public schools in Tibet. Many scholars have noticed and studied this issue
(Yan, 2006; Li, 2011). In his research on how Tibetan parents would rather hire people
to go to Han school for their children in the late Qing dynasty, ethnologist Yan Qiyan
quoted historical archives prepared by local Tusi (chieftains in Tibet under the Qing rule)
discussing this issue:
To promote education and ensure that children attend school, the Qing Bureau of Education regulates: ‘Tibetan children aged six or seven above must be sent to school, regardless gender and household wealth level. Those who do not attend, their fathers or older brothers will be fined 5 to 50 tael31 of silver. Once children are sent to school, they must not drop and can only leave with a completion certificate; unless they were suspended by the school’. Enforcing education was strongly opposed by local Tibetans. Many local chieftains requested that the schools be canceled. Tusi Mashu reported to the Bureau of Education: ‘Unfortunately local people are stubborn and ignorant. They are used to their own language and only willing to learn that. They never know the benefits of learning the Han language. We have tried many times to convince them, but they did not listen. We have no way but to report to you Sir [Tusi Mashu’s senior official], and hope you would grant my request of cancellation [of schools]’. Tusi Zhuwo also reflected: ‘To my surprise, villagers not only did not understand your kindness, but even blame me for using their children as tools to gain political credits in front of you. They said that if they must send their children to school, they as parents would rather commit suicide by jumping into the river’. In order to not to send children to school, head of Sanyasa village even confronted the [Qing imperial] court and caused injury of government soldiers (Yan, 2006).
31 Tael is a weight unit used in China and the Far East, originally of varying amount but later fixed at about 38 grams (113 oz.). In this text Tael is a monetary unit based on the value of this weight of standard silver.
60
5.4.2 Bilingual education is culture invasion in disguise
The bilingual education system in minority autonomous regions has also been
controversial. Some minorities feel that learning Mandarin is a betrayal to their native
language and culture. Based on his multiple field studies in Xinjiang, Yao Xinyong (2012)
observed that “in Xinjiang, many ethnic minority intellectuals, especially the Uyghur
intellectuals, are very unhappy with bilingual education; some even go extreme and think
their own cultures are under destruction” (Yao, 2012). Xu Duohui (2010) heard similar
comments during his field trip in Hetian, a prefecture-level city in Xinjiang, where many
Uyghur people worry that learning the Han language will cause them lose their own
cultural and ethnic identity. During her visit in a Tibetan autonomous county in Qinghai
province shortly after a Tibetan peasant set himself on fire to raise Beijing’s attention and
petition for the return of the 14th Dalai Lama (the 13th self-immolated Tibetan since
February 2009), French journalist Ursula Gauthier heard a local teacher complain: “But
look at what is happening: the Tibetan language is being crushed in our own schools, we
are drowning in Chinese immigrants. They have basically decided to eradicate our
population” (Gauthier, 2012).
Such concern is endorsed by many scholars. As early as the 1980s, multicultural theorists
have warned that a multiethnic society, massive use of the language of the dominant
ethnicity in ethnic minority regions would have devastating effects on the learning, using,
and maintenance of minority languages; and would cause a loss of the minority heritage
as well as an abandonment of minority identity (Cummins, 1989). More recently, Dwyer
61
(2005) suggested that while China claims its language policy pro-minority, “its covert
language policy has become increasingly assimilative, and tied to geopolitical
considerations”; and “this trend has been particularly salient in the Xinjiang…. [and] has
served to reinforce both Uyghur nationalism and small separatist movements”. Wang
and Phillion (2009) also contended that the purpose of the Chinese government’s
educational practices is to “take away minority students’ home language, culture, and
identity; legitimate Han knowledge and Mandarin Chinese; and reproduce and instill the
dominant [Han] ideology among minority elementary students; and commented that “the
treatment received by Tibetans and other minority groups resonates with the treatment
received by Native Americans in the United States and Indigenous people globally”.
But not all minority people find learning Mandarin a bad idea. According to Nima
(2001), some Tibetans wanted to learn Mandarin because they wanted to get well-paid
government jobs after graduation (Nima, 2001, pp. 95). In some extreme cases, in order
to avoid conflicts between Tibetan and Han officials, “some Tibetans are actually
working against those who advocate Tibetan language education, punishing lower
officials who do so” (Nima, 2001, pp. 98). Smith (2002) also noted that many Uyghurs
had to become fluent in Chinese and well versed in Han culture in order to get hired by
Han-dominated work units and companies; though they were also “activating and
exaggerating certain religio-cultural difference as means of ensuring symbolic, spatial
and social segregation from the Han.”
62
Many scholars took the same practical standpoint and stressed that teaching ethnic
minority students Mandarin is critical for improving their employment opportunity and
increase their earnings. For example, sociologist Ma Rong, who is a Muslim Hui, once
noted that “Rural areas in Xinjiang have relatively less land than labor, [therefore] most
secondary school students could not go back to farming after they graduate; [however]
since they mostly use the Uyghur language at school and lack the ability to communicate
in Mandarin, they find little employment opportunities in the secondary and tertiary
industries in urban areas. Their having to stay home and stay unemployed is a direct
cause for their low income” (Ma, 2007b; 2008). Yao (2012) agreed that mastering
Mandarin is critical for the “survival and development of the ethnic minority people”; but
he worried that forcing Han language education would raise further resistance among the
Uyghurs, especially when the education turns out to be not very useful in solving the
underemployment problem in the short term. Earlier, Stites (1999) also recognized that
attending Mandarin-only elementary schools help students find jobs or adapt to education
in secondary schools more easily.
Other than the legitimacy of promoting Mandarin study in minority autonomous regions,
the effective implementation of bilingual education in minority areas is also questioned.
Zhou (2004), for example, noted that ethnic minority areas, and China in general, suffer
from serious scarcity of qualified bilingual teachers, and many schools cannot find
enough teachers to offer bilingual curriculum on a regular basis. He therefore argued that
the central government’s bilingual education system is a mere political gesture with little
63
substance, and is out of political concerns rather than a true willingness to help minority
languages thrive (Zhou, 2004).
5.4.3 Minority Bonus Points Policy: One Man’s Justice Is Another Man’s Injustice
To make it easier for minority students to enter college, the central government has been
giving them “Minority Bonus Points” to be added to their National College Entrance
Exam (NCEE) score, which is the only thing colleges consider when deciding whether an
applicant could be admitted. Under the current “Minority Bonus Points” policy, a
minority student could receive additional points of up to 50 out of the total 750 in the
NCEE. In contrast, a Han student growing up in exactly the same community would
receive no additional points. Here is a more specific example from Ma Rong (2006):
A han Chinese student in Inner Mongolia failed university admission because his score in the national examinations was 5 points lower than the ‘admission standard score’, but his Mongolian classmate with 9 points lower than that standard still can enter university because he received 10 additional scores by his ‘minority status’. This han student complained about the discrimination against him since the two live in the same neighborhood, and went through kindergarten, primary school, and middle school together (Ma, 2006)
In this case, when social justice and equality is enjoyed by one member of the society,
they are taken away from another member. While this might be necessary to realize
macro-level (between-group) social equality, it certainly is not fair at the micro level, and
therefore may hurt feelings of individual citizens.
64
The minority bonus-points policy even became a cause of inequality between Han people
endowed with different social resources. Specifically, because ethnicity-based bonus
points are not like talent-based bonus points, which are only granted after the applicant’s
talent is tested and approved by a third party; some Han parents managed to change their
children’s ethnic status from Han to non-Han and consequently get them some free points
in the NCEE. As changing ethnic status requires social resources such as chance to meet
with household registration official and money to bribe him or ability to make him do the
requested favor, it further hurts Han students whose parents have little social resources to
manipulate their children’s scores in any way.
Many Han people, therefore, are against the minority bonus-points policy. In response to
their opposition, some Chinese provinces, such as Shandong and Zhejiang, recently
decided to cut back minority bonus points. Nevertheless, it is still in practice in most
Chinese provinces. For example, in Sichuan province where China’s second largest
Tibetan community reside, minority students from selected poor counties are still given
additional points of up to 50 out of the total 750 in the 2012 NCEE, in contrast to 25
given to Han students from the same counties32.
5.4.4 Minority schools: Privilege or Ethnic Segregation?
In recent decades, many scholars have also expressed their concerns about minority
schools. Some argued that minority schools make minority students underachievers, as 32 Sichuan province 2012 http://www.sczsxx.com/html/gkkx/zc/2012/0603/1188.html
65
minority school curriculum are designed based on the presumption that the Han culture is
superior to the ethnic minority culture, and therefore deprived of minority children pride
in their own culture and consequently self-confidence in aiming higher and doing better
in school (Bass, 1998; Nelson, 2005). Wang and Phillion (2009) criticized “the uniform
curriculum and under-representation and misrepresentation of minority knowledge,
culture, and language in elementary school textbooks demonstrate the hegemonic control
over minority language, culture, and knowledge and the imposition of dominant ideology,
language, culture, and knowledge on minority students”. Some argue that the
inappropriate curriculum used in minority schools is the key reason why minority parents
wanted to send their children to mosques or temples for literacy education (Mackerras,
1994; Gladney, 1999; Postiglione, 1999). In an interview with South Review magazine on
June 5, 2010, Qiang Shigong, director from the Center of Studies for Politics and Law at
Peking University in Beijing, commented that minority schools unnecessarily
strengthened ethnic difference and cause ethnic segregation (Shen and Chen, 2010).
5.5 Religious Freedom? “We cannot practice our religion freely.”
While the Chinese Constitution stipulates that “Citizens of the People's Republic of
China enjoy freedom of religious belief” (Article 36 of the Constitution) and the
government has repeatedly stated that “In China, all normal religious activities, including
those of ethnic minorities, are protected by law” (Chinese Government White Paper,
66
2009); Beijing’s intolerant attitude towards religious gatherings in Tibet and Xinjiang has
been complained by many Tibetan-Buddhists and Uyghur Muslims.
Many Uyghur people feel that the central government does not make enough efforts to
understand their culture and interferes with their religious freedom. Among them there is
IIham Tohti, who received education in a Han-dominant university and is currently a
professor of economics at Minzu University of China (also known as Central University
for Nationalities) in Beijing. He expressed his disappointment and concerns to journalist
from Uighurbiz.net:
After the 2009 Ürümqi riots, the government administered Islam more strictly, imposed more restrictions on renovation and construction of mosques, and watched the Muslims more closely, causing increased worships and other religious activities outside the mosques. We was originally hoping that the [central] government would make adjustments to their policy, but things just went the opposite way and the administrations are now stricter. Among the [central government] leaders no one really understands the Uyghur people. Now the conflicts fall into a vicious circle (Dubu, 2012).
Many Tibetans probably feel the same way. In February 2009, a young monk set himself
on fire in a marketplace close to his monastery Kirti Gompa, a Tibetan Buddhist
monastery built in the 15th century and serving Tibetan-Buddhists from both inside and
outside China despite its location in China’s Sichuan province. By March 2013, the
number of self-immolators has increased to 109, of which at least 78 have died (statistics
from the Tibetan government in exile based in India). More than half of these self-
immolators came from Aba, a Tibetan autonomous county in Sichuan and where Kirti
Gompa is located. Most self-immolators were monks, but there were also nuns and a few
civilians, including a young mother of four.
67
While Beijing called self-immolations “criminal acts premeditated, plotted, and
manipulated by overseas separatist forces” (China Daily, 2013-06-21), Kyabje Kirti
Rinpoche working for the Tibetan government in exile based in India claimed on March
22, 2013 that “the key reason for self-immolation is Beijing’s [intolerant] policies toward
Tibet over the past six decades” (Kyabje Kirti Rinpoche: Chinese government policies
are the cause of the immolations - BBC Chinese Edition, 2013). He has also made the
same comment when interviewed by BBC English Edition on November 1st, 2011
(Grammaticas, 2011).
Tibetan activist Woeser posted in her blog the last words of 31 self-immolators,
suggesting that all self-immolations are related to the Chinese government’s restrictions
on religious freedom in Tibet. For example, Tapey, the first self-immolator, said that he
would commit suicide if the government did not allow his monastery to perform a
planned religious ceremony; and he set himself on fire half hour later (Woeser, 2012b).
During her interviews with families and friends of a civilian self-immolator in Qinhai
province, French journalist Ursula Gauthier also learned from a local monk:
We also protested here. What do we want? Freedom. We are not free. We cannot practice our religion freely. We cannot meet our spiritual leader. We cannot study our language in schools, where more and more classes are taught in Mandarin. We cannot even set fire to ourselves without putting our family or monastery in danger… In Lhasa, a monastery cannot have more than 30 monks, whereas there were thousands of us in the past! They want to slowly kill off the monastery system which is the pillar of our existence (Gauthier, 2012).
A group of deeply shocked scholars have also tried to intellectually make sense of these
self-immolations (McGranahan and Litzinger, 2012) ; and their research are collectively
68
published in Self-Immolation as Protest in Tibet, a special issue of Cultural Anthropology,
which is a highly ranked peer-reviewed journal in the field of anthropology.
In contrast to Tibetan activists and Western intellectuals who had strong and emotional
reactions to self-immolation in Tibet, Han intellectuals in China remained largely silent
(Jacobs, 2012). One reason may be that they dare not say anything since “their
commentaries could bring them life-threatening troubles, even if they were posted on
Twitter which is normally inaccessible from mainland China” (Xia, 2012). But perhaps
the more important reason is that they found it difficult to understand the self-
immolators’ motivation. Yao Xinyong (2012), for example, expressed sympathy for the
self-immolated Tibetans, but suggested that they overreacted, as “No matter how
unhappy they are with the rule of the Chinese Community Party, at least Tibetans are not
deprived of any right to live an ordinary life; they can still pray in their temples; and
neither their culture nor their eco-system will go extinct immediately”. Such opinion
echoed that of the majority Han people in China. After all, two thousand years ago
Confucius had already preached that “One’s body, hair, and skin have all been received
from the parents; One dare not damage them, and this is the beginning of filial piety”
(Confucius, Classic of Filial Piety).
Yao (2012) also blamed the Tibetan government in exile: “Independence of Tibet and the
return of the 14th Dalai Lama are unlikely to happen any time soon, and perhaps they
will never happen during his life time. But none of this makes convincing reason for self-
immolation. Some Tibetans said they wanted to say nothing at the moment, and they
69
were waiting for the number of deaths to reach 2,000; by that time they will do something
to really overthrow the Chinese rule. But those who wait and count must be either coward
or ruthless and narrow-minded nationalists”. Wang Lixiong, a Han scholar and Woeser’s
husband, also believed that the Tibetan government in exile should be held accountable
for the increasing number of self-immolations in Tibet: “The Tibetan government in exile
did not do its job. It claims to be representing [the benefits of] six million Tibetans, but
why did not we see it do anything for its people, other than making a powerless comment
that self-immolation is not encouraged? If it insists that whether self-immolation would
stop is totally up to the Chinese Communist Party and refuses to make any effort itself,
one would find it hard not to suspect that the self-immolators were manipulated” (Woeser,
2012b).
Several Han intellectuals (Xia, 2012; Wang, 2012; Chang, 2012) also urged the
government Beijing to reevaluate its ethnic policies in Tibet and seek alternative ways to
handle the Tibet issue. Their articles were published on December 13, 2012 in
iSunAffairs, a Hong Kong-based weekly magazine known for shocking covers and high
quality journalism but banned in mainland China. On the same day, Chinese human
rights activist and lawyer Xu Zhiyong published “Tibet is Burning” in the New York
Times, in which he said “I am sorry we Han Chinese have been silent as Nangdrol [an
18-year old self-immolator from Aba county in Sichuan province] and his fellow
Tibetans are dying for freedom. We are victims ourselves, living in estrangement,
infighting, hatred and destruction. We share this land. It’s our shared home, our shared
responsibility, our shared dream — and it will be our shared deliverance” (Xu, 2012).
70
Before I end this section, I would like to tell another anecdote from Tan Leshui, director
of the East Asia Institute of Visual Anthropology at Yunnan University and a regular
visitor of the Zhongdian Tibetan Autonomous County in Yunnan Province:
Since the local Tibetan man told me that government subsidies are little and money has never been enough, I suggested that he spin his prayer wheel less and use the time to work longer hours or to get more education. The man asked: Why should I work hard or do more school? I said: So you can find a well-paid job and be financially better off. But the Tibetan man said: Why bother? I am happy now. I do not quite care about money. I just need pray. The more I pray, the better my afterlife will be. Praying for a better afterlife is the most important purpose of my this life (L. Tan, personal communication, February 14, 2013).
Tan’s story suggests that religion has been playing an extremely important role in Tibetan
people’s daily life, and both education and wealth lose their appeal when compared to
religious freedom. In contrast, the Han Chinese have always valued education and
wealth, while view religious life as of much less importance. This is probably why the
majority of Han people were silence toward self-immolation tragedies in Tibet.
5.6 More Children: Government-bestowed Privilege or Allah’s Gift?
While the one-child policy has been strictly implemented among the Han people with
sometimes enforceable measures, it does not apply to the ethnic minority people. The
minorities, however, do not think it as a government-bestowed privilege. Economist He
Qinglian documented the following comments that she heard during her visit in Xinjiang:
71
“Children are Allah’s gifts. How many children we will have is Allah’s order. Why do
we need the government’s permission? ” (He, 2009)
5.7 “Two Less One Lenience” Policy Encouraged Law-breaching Conducts among
the Uyghurs
Among all pro-minority policies, the “Two Less One Lenience” principle stipulated in
the Criminal Law and widely practiced in real life seemed to have frustrated the Han
Chinese most. They believed that the existence of such policy encouraged law-breaching
conducts among the minorities, particularly the Uyghurs.
Economist He Qinglian is so concerned that she openly blamed the government for
practicing dual standards. To support her point, she documented an incident which she
witnessed right on the spot:
In many large cities in China, we see Uyghurs street vendors. Toward street vendors, the city administration department is in general very intolerant. Ruthless measures including violent ones are taken to drive Han street vendors off. But toward Uyghur vendors, the city administrators are very polite. I have witnessed such an incident on North Huaqiang street in the city of Shenzhen: A young woman wanted to buy some walnuts from a Uyghur vendor, who said it is 25 RMB per jin [one jin is about a pound]. After the walnuts are packed and she was ready to pay, the vendor insisted it was 125 RMB per jin. She wanted to cancel the purchase, but immediately faced violent attack from the vendor, who was soon joined by all his fellow Uyghur vendors on the street. A policeman came and wanted to stop the attack, but his efforts were in vain. The next day, over one hundred Uyghur vendors organized a protest in front of the city hall, claiming that they are discriminated. The Shenzhen city government apologized and compensated all these Uyghur vendors for their ‘losses’; but in the meantime notified the media to not to report and sent out oral notice to civilians through
72
their employers asking them to refrain from purchasing goods from the Uyghur vendors (He, 2009)
Documents on similar incidents are abundant on the Internet, but unlike He (2009), most
authors chose to remain anonymous. The sheer number of such posts and their wide
circulation, however, may shed light on how the government’s dual legal standards have
deeply hurt the Hans and brought no benefits to the minorities. In a post widely circulated
on the Internet titled "Complaint from a cybernaut: the miserable life of Han people in
Xinjiang (in Chinese)" (2009), the anonymous author wrote:
“Even till today, I would still shiver when I recall the tragedy that happened in Kashi city, Xinjiang in year 1993. In Xinjiang, a Han civilian’s life is worth nothing. A mother laid off by her factory set up a small table-golf business in the local public park. One afternoon, she went home for lunch and left the business to her two daughters – one 14 years old, and the other a college student home for her summer vacation. Several Uyghur men came to play table golf. One of them started to harass the 14-year-old. Her older sister raised a cry in order to stop him, but before she could finish her sentence, a dagger was stabbed into her chest, causing her death right on the spot. The murderer walked away with his friends. All witnesses were Uyghur and remained silent. When the police finally came and tried to ask the witnesses what happened, no one admitted to have seen the murderer or any of his friends! The next day, police found the murder while he was home drinking, but he said he did not remember what he had done as he was drunk at that time. The court then charged the murderer with misfeasance and sentenced him two years in prison. The mother refused to accept the verdict and the unfairness of the case caused a public outcry. Government officials started to visit her repeatedly, promising compensations including money and employment and threatening that her stubbornness may stir social upset and wreck ethnic unification. She eventually gave in and gave up further appeal. We originally thought the murderer has special background, but found out after investigation that his parents are just kebab-sellers at a bazaar, and he himself a jobless hooligan. On an August day in 1998, still in Kashi,two Han women went to bazaar to buy kebabs. After seeing one vendor’s kebabs, one of them pointed at another vendor and suggested they buy from the other vendor. Before she could finish her sentence, the first vendor ranted: ‘You black-hearted Han! Dare say my kebab is not good. I will kill you Hans’. He then stabbed his knife at the two women. They immediately left and started to run, but he followed them and stabbed at any Han he passed by on the way. Five or six Han fell to the ground. Someone tried to call
73
the police but did not make it until he managed to run out of the bazaar, where the public phone service was controlled by a Uyghur. When two policemen finally came, the kebab seller turned to them, killing the younger Han policeman who came unarmed and tried to talk him out of his wrongful act. His senior colleague was also wounded and a few more Han civilians were hurt. By law, under that circumstance, the policeman could have killed the criminal right on the spot if he were a Han; but facing a Uyghur criminal, he had to first get approval from his boss. In Xinjiang, facing a Muslim Uyghur criminal, even the police can do little, not to mention Han civilians! Almost the entire Han population in Kashi went to convey condolence at the young police officer’s funeral. This is a silent protest against the Uyghur murderer. But it is more a protest against the government, which connives at the Uyghur’s wanton murder of an unarmed Han police office!
In stark contrast, the drunken Han driver who trespassed on the pastureland of an ethnic
Mongolian herdsman in Inner Mongolia and indeliberately killed him --- which we
discussed in Section 5.1 --- soon received death sentence and was immediately executed.
Whom to blame then? We may not be able to offer an objective and totally impersonal
answer, but we would like to bring to attention a point He Qinglian made in her article
“What is the apple of discord in the Uyghur-Han ethnic conflicts in Xinjiang?” published
on China Human Rights Biweekly (Vol.4, 2009-7-16):
The Uyghurs are unhappy with the Chinese government. But they dare not confront it. Instead, they vent their spleen on armless Han civilians, and the government’s pro-minority-criminal policy is their shield. The central government scarified the interests of the Han people and hoped it could bring ethnic unity and social stability; but at such a high price all Beijing gets are resentment [from both the Han and the Uyghur communities] (He, 2009).
To summarize Section 5, neither the ethnic minority people nor the Han people seemed
happy with the central government’s minority policies. The Han people complained that
they suffered from unnecessary inequality, greatly contributed to economic development
of the ethnic minority areas, but harvested only hatred from their ethnic minority fellow
74
citizens. The minorities complained that “the PRC government is lenient on trivial
matters but dictatorial on important issues; restricts religious activities but promotes
Mandarin; let the Han reign the government and centers everything around the Party’s
interests; bestows petty favors to minority people but exports all their resources to the
Han dominant regions; pushes sinicization and then claims a unified and harmonious
society” (Woeser Twitter). Under such circumstances, what should the Chinese
government do to ease ethnic tensions and maintain social stability? Section 6 examines
scholars’ opinions on this issue.
6. Scholars’ New Perspectives on China’s Ethnic Relations
Many scholars have offered opinions on what the Chinese government should do to ease
ethnic tensions in Tibet and Xinjiang. Roughly speaking, they advise the government to
try tackling the problem from either a cultural perspective or an economic perspective.
Currently at the center of the debate is the “de-politicization” strategy was proposed by
sociologist Ma Rong (Ma, 2001; 2004b; 2007a), a Muslim Hui born in Shanghai. Ma
believes that the Chinese government should abandon its current practice of emphasizing
and trying to treat different ethnic groups as different political entities ---- which he calls
“politicization of ethnicity” --- because “this policy orientation might provide an
institutional basis for national disintegration when internal and external powers work
together” (Ma, 2007a). A better alternative, he suggests, is to treat different ethnic
groups as different cultural entities which share one single political identity ---
75
“Zhonghua Minzu”, a term first used by Sun Yat-sen in 1912 to refer to all Chinese
regardless of ethnicity. Ma calls this “a framework of ‘political unity-cultural pluralism’”,
and argues that it shall “strengthen the ‘national identity’ of all citizens at the national
level while promoting cultural characteristics at the ethnic group level” (Ma, 2007a). To
support his argument, Ma gives two examples ---- the United States and India ---- to
illustrate how the cultural (as opposed to political) approach to ethnic relations can help
build a united multi-ethnic polity; while gave the former USSR, former Yugoslavia, and
Chechnya Republic in the Russian Federation as an counterexamples proving how the
political approach to ethnic relations could lead to disintegration of a multi-ethnic polity.
A similar but less radical approach known as “jointonomy” is proposed by Chinese
ethnologist Zhu Lun (2001). Like Ma, Zhu also believed that it is important to prioritize
national identity over ethnic identity, arguing that “If Italy did not manage its ethnic
affairs bearing in mind D'Azelio’s wisdom that ‘Now we already have Italy, and we
should make the Italians’ (Massimo D’Azelio, 1870), there would not be the Italian
nationals we see today”. But different from Ma, Zhu believed that the Chinese
government already “views and handles ethnic difference based on the precondition that
the ethnic groups together make one single nation”; and he disapproved such practice and
proposed “jointnomy”, a term he coined and meaning “joint management of all ethnic
groups” (Zhu, 2001).
Another similar but more radical approach toward China’s ethnic relations was
recommended by Western scholars, who believed that the solution to any ethnic tensions
76
must include at least real cultural autonomy, including linguistic and religious autonomy.
Dwyer (2005), for example, suggested that “the PRC [government] should realize that
supporting the maintenance of Uyghur language and identity is not antithetical to the
Chinese goal of nation building. In fact, it would ultimately support that goal”.
Bovingdon (2004) also suggested that “careful attention to the modern political history of
Xinjiang demonstrated that” Beijing must lax its rigid policies and crackdowns on
minority dissidents in order to reduce ethnic tensions in the area. He therefore pitied that
the Chinese leaders’ decision to tighten its grip on the region and further diminish
autonomy as a response to 9.11 and global “war on terror” will certainly exacerbate
discontent. Ji (2009) also urged the Chinese government to keep down its circumspection
about religious matters.
Since Ma (2007), the proposal to de-politicize ethnic identity has triggered heated debates
among scholars. Many disagree with Ma’s proposal. Hao Weimin, an ethnic-Mongol
historian, commented that Ma and Zhu’s propositions “are in essence similar to the leftist
view prevalent during the 1960s and the extreme leftist view prevailing during the
Cultural Revolution period”; and argued that “acknowledging ethnic and regional
differences will provide a foothold for further development in ethnic areas” (Hao, 2005).
Wu Rui (2009), an ethnic-Tujia Chinese ethnologist, argued that to identify all Chinese
people as “Zhonghua Minzu” is “Han chauvinism” as “Zhonghua” only refers to central
China, whereas ancestors of modern Chinese also originated from surrounding areas. Wu
also rebuked that “Ma’s suggestion of removing the regional autonomy system for
minorities is totally against the Universal Declaration of Human Rights and the UN
77
Declaration on the Rights of Indigenous Peoples” (Wu, 2009). Pan Jiao, an ethnic-Yi
ethnologist, also disapproved of “de-politicization of ethnicity” as “Ma and Zhu were
misled by Western scholars who self-righteously criticize China’s ethnic minority groups
for being Beijing’s puppets. What these critics do not understand, is that China’s ethnic
minority groups wanted to be politically recognized, wanted their cultural and political
rights to be protected by law, and wanted to be able to communicate with the government
and to decide their own fate” (Pan, 2009). Unfortunately, none of these opponents of “de-
politicization” made any constructive suggestions on how China’s current ethnic situation
can be improved.
Though the “de-politicization of ethnicity” proposal upsets many scholars, it also gained
some proponents. For example, political scientist Yan Xutong (Yan, 2009), law professor
Qiang Shigong (Shen and Chen, 2010), and Buddhism scripture professor Ji Yun (2009)
all agreed that the Chinese government should adopt a “melting pot” strategy toward
ethnic relations and phase out pro-minority policies as they artificially exacerbate ethnic
tensions (Ji, 2009). Shichor (2005) supported Zhu (2001) and noted that one way to solve
the ethnic tensions in Xinjiang is to give Xinjiang an updated autonomy, which contains
self-determination but not necessarily independence. Shichor (2005) also noted that
“[while] Old-guard Uyghurs tend to reject this idea instinctively, the younger generation
of overseas Uyghur leaders tend to accept this idea as a basis for a dialogue”.
Some scholars proposed an alternative solution to China’s ethnic conflicts, which is to
bridge the income gap between the Han and the minority populations. For example,
78
Smith (2002) argued that “it is not religio-cultural differences per se that lie at the root of
increased tensions between Uyghurs and Han Chinese, but changing social, political and
economic contexts: on the one hand, growing Uyghur perceptions of socio-economic
inequalities between themselves and the Han (the 'internal factor') and, on the other, the
vast changes within the international political arena since the late 1980s (the 'external
factor')”. Ji (2009) also believed that the key reason for increasing ethnic tensions in
China is income inequality, and “once the income gap is closed, ethnic tensions will
naturally disappear”.
Interestingly, economist He Qinglian does not seem to believe that economic reform can
be of any help with China’s ethno-political dilemma, because “when economic
interactions between Xinjaing and inland China increase as a result of economic reform
or marketization, local minorities will face competition from Han migrants in all venues”.
She also disapproved of the “de-politicization” approach and the suggestion to “carry
forward minority autonomy and further promote economic development”:
The stupidity of the CCP is that it still uses ethnic policies designed 60 years ago to manage today’s Xinjiang, which is under great pressure and extrusion of marketization. What worse is that the CCP thinks that helping minority youth ‘be assimilated into’ the Han community can ease ethnic tension and improve the circumstances of minority people. For example, [the CCP] offers more Han language education and sends Uyghur youths to inland China to work, uses the Great Western Development strategy to attract a large number of Han people to Xinjiang. What [the CCP] does not know, is that all these actually heightened the Uyghurs’ sense of crisis, making them feel hard to survive from multiple perspectives including economic, population, and cultural (He, 2009).
Instead, He Qinglian proposes that the key to solve problems in Xinjiang and other
minority areas alike is to seek bottom lines that both the Han and the Uyghur people can
79
accept, and start work from there (He, 2009). However, she did not make it clear on what
she meant by “bottom lines”, how these bottom lines may be identified, and what to do
afterwards.
To summarize, scholars gave Beijing two suggestions regarding what it should do to
improve ethnic relations in China. One advice is that the central government takes on a
“de-politicization of ethnicity approach” and treat different ethnic groups as different
cultural entities, while gradually phasing out minority regional autonomy. This advice
was applauded by many Western scholars and some Chinese scholars; but Chinese
ethnologists almost unanimously disapproved it, arguing that politicization is the political
pursuit of ethnic minority groups, and as vulnerable people they need extra support in
order to move out of the disadvantaged circumstances that they were born into. The other
advice is that Beijing should focus on sustainable economic development and the
reduction of Han-minority income gaps in ethnic regions.
7. Discussions and Conclusions
This paper examines ethnic situation in China from the pre-Qin period to the present. The
purpose is to gain a comprehensive understanding of the ethno-political dilemma
currently facing the Chinese government. To this end, we explored five issues: How did
different ethnic groups come into being and how have they interacted with each other in
China’s long history to become what they are today? How did Chinese rulers in different
80
historical periods view and handle ethnic relations, and why? What ethnic strategies has
the Chinese Communist Party taken since 1949, when the People’s Republic of China
was founded? How do Chinese people like China’s current ethnic policies, and why?
What suggestions have scholars given to the Chinese government in order to improve
ethnic tensions in Tibet and Xinjiang Uyghur Autonomous Regions, and China in general?
Our findings and thoughts are summarized as follows:
First, modern Han Chinese were descendants of several primitive tribes originating on the
Yellow River and Yangtze River alluvial plains in central China; while modern ethnic
minority Chinese were descended from ancient tribes originating in today’s northern,
western, eastern, and southern China. Since the soil in central China was suitable for
agricultural activities, ancient Han Chinese first developed into an affluent society, which
then attracted people from surrounding areas. For millennia, Han and non-Han ethnic
groups co-inhabited China, assimilated and acculturated into each other voluntarily or
involuntarily (during wars), and together shaped China’s current ethnic landscape.
Throughout history, Han Chinese has always made the dominant group in terms of
population size; and consequently, the Han language was also the most spoken and the
Han culture most influential in most historical periods, including times when the ruling
class consists of non-Han people, such as the Yuan and Qing dynasties.
Second, most of the times in China’s history, China was ruled by Han emperors. They
took on dual attitudes towards ethnic minority groups. At times when China was strong
and their rule faced no challenge from surrounding ethnic regimes, they respected and
81
embraced any ethnic group who would applaud and practice the Han culture, of which
Confucianism is the core. Bloodlines did not seem to be of any importance. Reflections
of this “culturalism” attitude include the “Grand Union” ideology, the Confucian view of
“Lǐ is the only criterion for judging one’s character”, and the “Celestial Empire” mindset.
The culturalism attitude, however, would be abandoned whenever the central imperial
court declined and were to lose their power to non-Han regimes. At such times, Han
emperors would view ethnic minorities as atrocious invaders, untrustable and
unrespectable individuals, and barbarians that could never be civilized. While such
“nationalism” attitude was often taken on unconsciously and only during times of crisis,
it was widely advocated and accepted during the late 19th ; and eventually led to the
establishment of the Chinese Nationalist Party (as known as Kuomingtang). During its
reign from 1912 to 1949, Kuomingtang viewed ethnic minority groups as peoples who
were incapable of participating in domestic affairs but must be united to keep China a
grand unified polity.
Third, the approach that the Chinese Communist Party (CCP) took toward ethnic
minority groups can be roughly called a “modified socialist approach”. It is based on
three considerations: (1) the ethnic theories of Stalin (1913) and Lenin (1923) that
advocates recognizing ethnic minority groups as independent political entities and giving
them rights to determine their own affairs, including right of secession; (2) the Confucian
ideology of “Grand Union”; and (3) a number of practical considerations including (3a)
ethnic minority regions occupy over half of China’s territory and abound with natural
resources; (3b) ethnic minorities are concentrated in border areas which are strategically
82
critical for national defense. Based on these considerations, the Chinese government
implemented the Minority Regional Autonomy system so that the minority areas can
manage their own affairs under the leadership of the central government; and
promulgated a series of pro-minority policies so that ethnic minority individuals can
receive favorable considerations in virtually all aspects of social and political life.
Fourth, since scholarly documents on whether China’s ethnic minority policy have been
effective in improving the welfare of its ethnic minority population, we had to rely on
media reports despite their drawback of being narratives and therefore limited to the
perspectives of particular individuals and events. The main message we elicited from the
abundant media reports --- which were mostly written by anonymous individuals and
exclusively aired through foreign media ---is that neither the ethnic minority people nor
the Han people in China are happy with the ethnic policies currently in practice. Several
points are worth noting: (1) Han people who were greatly disappointed by China’s
ethnic policies lived almost exclusively in the Xinjiang Uyghur Autonomous Region; and
their frustration was mainly related to the “Two Less One Lenient” policy in favor of
minority criminals, which they felt has made some parts of Xinjiang unsafe to live. (2)
Frustrated minority people were members of the Uyghur, Tibetan, or Inner Mongolia
ethnic groups. Much of the Tibetan and Uyghur people’s grievance was related to
Beijing’s intolerant attitude towards religious activities and underemployment of their
people due to competition from the Han migrant workers. In contrast, the Mongolians
worried more about the desertization of their pastureland as a consequence of
irresponsible economic development activities. (3) Other ethnic minority groups --- who
83
together make a population of about 80 million --- remained largely silent. It is likely that
these people are overall happy with the government’s ethnic policies. However, it is also
possible that they also had something to complain about, such as environmental
degradation and income inequality; but when they were airing their concerns, they did not
emphasize their ethnic identity because they realized that they were not the only victims
of such problems. Indeed, income gaps widely existed in today’s Chinese society. It may
exist between a group of Han and a group of ethnic minority people; but it may also ---
and actually more likely --- exist between two Han or two ethnic minority groups from
different geographical locations. Environmental degradation may deeply concern a
Mongolian herdsman who makes a living from his pastureland; but it may also greatly
concern a Han businessman whose young children need uncontaminated milk. Based on
these observations and thoughts, we conclude that (1) The Chinese government should
lift restrictions on religious activities; create more jobs for ethnic minority people, but
also for other socially disadvantaged people; and make efforts to bridge income gaps
between not just the Han and the minority people, but all socially advantaged and
disadvantaged groups. (2) It may be biased to conclude from the Tibetan and Uyghur
experiences that China’s ethnic policies have failed to benefit any ethnic minority groups
in China. Instead, it is still likely that most ethnic groups actually benefited from the pro-
minority policy. (3) More scholarly efforts, including qualitative studies and empirical
analysis, must be performed to obtain a comprehensive understanding of the welfare
status of China’s ethnic minority people.
84
Fifth, scholars recommended two solutions to China’s ethnic conflicts in Tibet and
Xinjiang. The “de-politicization of ethnicity” solution suggests that the government treat
ethnic groups as cultural entities and phase out pro-minority policies including the
Minority Regional Autonomy system as all cultural entities should belong to one single
political entity (Zhu, 2001; Ma, 2001, 2004b, 2007a; Bovingdon, 2004; Dwyer, 2005;
Shichor, 2005; Ji, 2009; Yan, 2009; Qiang 2010). Opponents of the “de-politicization of
ethnicity” approach suggests that the Chinese government should carry forward its
current ethnic policies, because politicization is the political pursuit of ethnic minority
groups and pro-minority policies help protect minority people’s basic rights (Hao, 2005;
Pan, 2009; Wu, 2009). The “income inequality” approach suggests that the government
bridge Han-minority incomes as that is where the minority people’s grievance really
came from (Smith, 2002; Ji, 2009).
85
REFERENCES Bass, C. (1998). Education in Tibet: Policy and practice since 1950. London: Zed Books. Bovingdon, G. (2004). Autonomy in Xinjiang: Han nationalist imperatives and Uyghur
discontent. Policy Studies, 11. Washington, D.C.: East-West Center Washington. http://hdl.handle.net/10125/3504. Last accessed on 2-20-2012.
Chang, P. (2012, December 13). Listening to the Hearts of the Self-Immolated Tibetans
(in Chinese) | iSunAffairs Weekly. http://www.isunaffairs.com/?p=12063. Last accessed on 4-20-2013.
Chiang, K. (1947). China's destiny & Chinese economic theory (p. 40). New York: Roy
Publishers. Chinese Government White Paper (2009). China's Ethnic Policy and Common Prosperity
and Development of All Ethnic Groups - china.org.cn. Retrieved from Information Office of the State Council of the People's Republic of China website: http://www.china.org.cn/government/whitepaper/node_7078073.htm. Last accessed on 2-20-2012.
Chinese Government White Paper (2005). Regional Autonomy for Ethnic Minorities in
China,Govt. White Papers - china.org.cn. Retrieved from Information Office of the State Council of the People's Republic of China website: http://www.china.org.cn/e-white/20050301/index.htm . Last accessed on 2-20-2012.
Chodron, T. (2011, December 30). Tibet has established 480 temple libraries --
Chinatibetnews.com. http://english.chinatibetnews.com/Culture/2011-12/30/content_852845.htm . Last accessed on 2-20-2012.
Connor, W. (1984). The National Questions in Marxist-Leninist Theory and Strategy.
Princeton: Princeton University Press. Complaint from a cybernaut: the miserable life of Han people in Xinjiang (in Chinese).
(2009, July 7). http://www.chinasmile.net/forums/showthread.php?t=414676. Last accessed 1-20-2013.
Cui, M. (2007). History of Marriage Alliance in China (in Chinese). Beijing: People's
Publishing House.
86
Diamond, N. (1997). Defining the Miao: Ming, Qing, and Contemporary Views. In S. Harrell (Ed.), Cultural Encounters on China's Ethnic Frontiers (pp. 92-116). Seattle: University of Washington Press.
Dikötter, F. (1997). Racial Discourse in China:Continuities and Permutations. In F.
Dikötter (Ed.), The construction of racial identities in China and Japan (pp. 12-33). Hong Kong: Hong Kong University Press.
Duara, P. (1995). Rescuing history from the nation: Questioning narratives of modern
China. Chicago: University of Chicago Press. Duara, P. (1993). Bifurcating Linear History: Nation and Histories in China and India.
Positions, 1(3), 779-804. doi:10.1215/10679847-1-3-779 Dubu (2012, August 8). The Uyghurs remain discontent and are more estranged from the
Hans (in Chinese). Retrieved May 10, 2013, from http://www.uighurbiz.net/archives/4724
Dwyer, A. M. (2005). The Xinjiang conflict: Uyghur identity, language policy, and
political discourse. Policy Studies, 15. Washington, D.C.: East-West Center Washington. http://hdl.handle.net/10125/3504. Last accessed 5-20-2012.
Fairbank, J. K. (1979). The United States and China (4th ed.). Cambridge, Mass: Harvard
University Press. Fire on the roof of the world. (2008, March 14). The Economist. Retrieved from
http://http://www.economist.com/node/10870258 Fjeld, H., & Nordic Institute of Asian Studies (2003). Commoners and nobles:
Hereditary divisions in Tibet (p. 5). Copenhagen: NIAS. Gauthier, U. (2012, April 12). Tibet: How Many More Sacrifices?.
http://www.worldcrunch.com/tibet-how-many-more-sacrifices/world-affairs/tibet-how-many-more-sacrifices-/c1s5064/ . Last accessed 4-10-2013.
Ge, J. (1993). Open China in Celestial Empire Mindset. Twenty-First Century, (15), 11-
16. Gladney, D. C. (1999). Making Muslims in China: Education, Islamicization and
representation. In G. A. Postiglione (Ed.), China's national minority education: Culture, schooling, and development (pp. 55-94). New York: Falmer Press.
Goldstein, M. C. (1997). The snow lion and the dragon: China, Tibet, and the Dalai
Lama. Berkeley: University of California Press.
87
Goldstein, M. C. (1971). Serfdom and Mobility: An Examination of the Institution of "Human Lease" in Traditional Tibetan Society. The Journal of Asian Studies, 30(3), 521-34.
Grammaticas, D. (2011, November 17). BBC News - Abbot hits out over Tibetan self-
immolations. http://www.bbc.co.uk/news/world-asia-15770024. Last accessed 6-10-2012.
Grunfeld, A. T. (1985). In search of equality: Relations between China’s ethnic
minorities and the Majority Han. Bulletin of Concerned Asian Scholars, 17(1), 54-67. The Han Ethnic Group (in Chinese). (n.d.). Retrieved from State Ethnic Affairs
Commission of the People's Republic of China website: http://www.seac.gov.cn/col/col578/index.html . Last accessed 7-1-2012.
Harrell, S. (2001). On Histories and Translations of Some Terms in Anthropology. World
Ethno-National Studies, (4). doi:10.3969/j.issn.1006-8287.2001.04.008 Harrell, S. (2002). Re-Thinking "Nationality" and "Ethnic Group": A Response to
Professor Li Shaoming. World Ethno-National Studies, (6). doi:10.3969/j.issn.0256-1891.2002.06.005
He, Q. (2009, July 16). What is the apple of discord in the Uyghur-Han ethnic conflicts in
Xinjiang?. Human Rights Biweekly, (4). http://http://biweekly.hrichina.org/article/59 . Last accessed 1-20-2012.
Hu, Z., & Zhang, L. (2010, October 27). Energy Tax Savings Give Xinjiang Additional
Revenue of 3.2 Billion RMB Each Year. http://gb.cri.cn/27824/2010/10/27/110s3035232.htm. Last accessed 4-12-2012.
Hua, M. (2011, April 10). Dirge of the Steppe: The Diminishing Mongolian Culture (in
Chinese). http://www.epochtimes.com/gb/11/4/10/dailypost.htm. Last accessed 4-12-2012.
Jacobs, A. (2012, November 9). Educated Chinese Are Silent Amid Tibetan Self-
Immolations - NYTimes.com. http://www.nytimes.com/2012/11/10/world/asia/educated-chinese-are-silent-amid-tibetan-self-immolations.html?_r=0. Last accessed 4-12-2013.
Ji, Y. (2009, July 9). Reasons and Solutions for Ethnic Riots in Xinjiang, China (in
Chinese). http://www.china-week.com/html/5168.htm. Last accessed 4-12-2012. Jia, L. (2009, January 10). Tibet Regional Fiscal Revenue Has Increased 346 Times in 50
Years. http://tibet.news.cn/gdbb/2009-01/10/content_15412771.htm. Last accessed 4-12-2012.
88
Jiang, D. (2002). How to Render the Chinese Word "Minzu":The Solutions of Transliteration and Translation (in Chinese). World Ethno-National Studies, (5). doi:10.3969/j.issn.1006-8287.2002.05.011
Jin, B., Bi, Y., & Han, Y. (2012). Nationality and Ethnicity: Complementary or
Conflicting Concepts? (in Chinese). Heilongjiang National Series, (127), 4-15. doi:10.3969/j.issn.1004-4922.2012.02.002
Kaup, K. P. (2000). Early CCP Minority Policy: The Decision to Recognize the Zhuang.
In Creating the Zhuang: Ethnic politics in China (p. 62). Boulder, Colo: L. Rienner. Kyabje Kirti Rinpoche: Chinese government policies are the cause of the immolations -
BBC Chinese Edition. (2013, March 22 http://www.bbc.co.uk/zhongwen/simp/china/2013/03/130322_tibet_kirti_rinpoche_china.shtml. Last accessed 4-12-2013.
Lenin, V. I. (1923). The Question of Nationalities or "Autonomisation" in ""Last
Testament" Letters to the Congress”. http://marxists.org/archive/lenin/works/1922/dec/testamnt/index.htm. Last accessed 4-12-2012.
Li, H. (2011). A Commentary on the Phenomenon of Hire to Schooling in Tibetan
Education of Western Sichuan Province in the Period of the Republic of China (in Chinese). Journal of Tibet University, 26(2). doi:10.3969/j.issn.1005-5738.2011.02.014
Li, S. (2002). An Approach to the Ethnic Theory from the Identity of the Yi
Nationality:A Discussion with Prof. Stevan Harrel (in Chinese). World Ethno-National Studies, (2). doi:10.3969/j.issn.0256-1891.2002.02.004
Lǚ, S. (1941). Pre-Qin History (in Chinese) (p. 22). Shanghai: Shanghai Ancient Books
Publishing House. Lǚ, Z. (1950). Compact History of Chinese Nationalities (in Chinese) (p. 19). Beijing:
Sanlian Publishing House. Ma, R. (2008). The Development of Minority Education and the Practice of Bilingual
Education in Xinjiang (in Chinese). Peking University Education Review, 6(2). doi:10.3969/j.issn.1671-9468.2008.02.001
Ma, R. (2007a). A New Perspective in Guiding Ethnic Relations in the 21st Century:
‘De-politicization’ of Ethnicity in China. Asian Ethnicity, 8(3), 199=217. Ma, R. (2007b). Bilingual Education for China’s Ethnic Minorities. Chinese Education
and Society, 40(2), 9-24.
89
Ma, R. (2006). Ethnic Relations in Contemporary China: Cultural Tradition and Ethnic Policies in China since 1949. Policy and Society, 25(1), 85-108.
Ma, R. (2004a). Ethnic Sociology: Sociology Race Relations (in Chinese). Beijing:
Peking University Press. Ma, R. (2004b). New Perspectives in Understanding Ethnic Relations: "De-Politicization
of Ethnicity" (in Chinese). Journal of Peking University(Philosophy and Social Sciences), (6), 122-133.
Ma, R. (2001). On Anthony Smith's Discussion on "Nation" (in Chinese). Social Sciences
in China (Chinese Edition), (1) Mackerras, C. (1994). China's minorities: Integration and modernization in the twentieth
century. Hong Kong: Oxford University Press. Mao, Z. (1935, December 27). On Tactics Against Japanese Imperialism.
http://www.marxists.org/reference/archive/mao/selected-works/volume-1/mswv1_11.htm. Last accessed 4-12-2012.
Mao, Z. (1956, April 25). On the Ten Major Relationships.
http://www.marxists.org/reference/archive/mao/selected-works/volume-5/mswv5_51.htm. Last accessed 4-12-2012.
Marx, K. (1844). Marx, A Contribution to the Critique of Hegel's Philosophy of Right
1844. http://www.marxists.org/archive/marx/works/1843/critique-hpr/intro.htm. Last accessed 4-12-2012.
McGranahan, C., & Litzinger, R. (2012). Introduction. Hot Spot Forum, Cultural
Anthropology Online. http://culanth.org/?q=node/526. Last accessed 4-12-2013. Mo, Z. (2001). On the Legalization of “Two Less, One Lenience” (in Chinese). Modern
Law Science, (1). doi:10.3969/j.issn.1001-2397.2001.01.023 Ministry of Foreign Affairs of the People's Republic of China (2000). Regional Autonomy
for Minority Peoples. http://www.fmprc.gov.cn/eng/premade/9052/autonomy.htm. Last accessed 4-12-2012.
Muller, J. Z. (2008). Us and Them: The Enduring Power of Ethnic Nationalism. Foreign
Affairs. http://www.foreignaffairs.com/articles/63217/jerry-z-muller/us-and-them. Last accessed 4-12-2013.
Nelson, K. (2005). Language policies and minority resistance in China. In Z. Zakharia ,
& A. Arnstein (Ed.), Languages, Communities, and Education (pp. 25-31). Department of International and Transcultural, Teachers College, Columbia University.
90
http://www.teacherscollege.edu/students/sie/journal/Volume_3/Nelson.pdf . Last accessed 4-12-2012.
Nima, B. (2001). Problems related to bilingual education in Tibet. Chinese Education &
Society, 34(2), 91-102. Pan, J. (2009). Deconstructing the Ethnic Minorities of China: De-orientalism or Re-
orientalism (in Chinese). Journal of Guangxi University for Nationalities (Philosophy and Social Science Edition), 31(2), 11-17.
Pan, J. (2003). The Permutation of "Ethnic Group" and the Concepts related in the West
(in Chinese). Journal of Guangxi University for Nationalities (Philosophy and Social Science Edition), 25(5). doi:10.3969/j.issn.1673-8179.2003.05.011
Selected Important Documents of Tibet Autonomous Region, Volume 1 (in Chinese)
(p. 97). (1983). Policy Research Office of the Chinese Communist Party Tibet Committee.
Postiglione, G. A. (1999). Introduction: State schooling and ethnicity in China. In G. A.
Postiglione (Ed.), China's National Minority Education: Culture, Schooling, and Development (pp. 3-19). New York: Falmer Press.
Powers, J. (2004). History As Propaganda: Tibetan Exiles versus the People's Republic
of China. Oxford Scholarship Online. Self-immolations in Tibet manipulated | chinadaily.com.cn. (2013, June 21).
http://www.chinadaily.com.cn/china/2013-06/21/content_16644960.htm. Last accessed 7-1-2013.
Shan, W., & Weng, C. (2013). China’s ‘New Deal’ in Xinjiang and its Challenges. In G.
Wang, & Y. Zheng (Ed.), China: Development and governance (pp. 71-80). Singapore: World Scientific Publishing Co. Pte. Ltd.
Shen, X., & Chen, Y. (2010, June 5). Ethnic Assimilation is the Ultimate Goal of
Xinjiang Policy -- Interview with Professor Qiang Shigong from the Center of Studies for Politics and Law at Peking University. South Review, (12). http://http://www.nfcmag.com/article/2144.html. Last accessed 4-12-2012.
Shi, Y. (1999). On the Difference in Meaning between "Ethnic Group" in English and
"Minzu" in the Han Language (in Chinese). World Ethno-National Studies, (4). doi:10.3969/j.issn.1006-8287.1999.04.012
Shichor, Y. (2005). Blow Up: Internal and External Challenges of Uyghur Separatism
and Islamic Radicalism to Chinese Rule in Xinjiang. Asian Affairs, 32(2), 119-135.
91
Hoshur, S. (original reporter), & Jackson-Han, S. (English translation) (2009, March 6). Uyghur Scholar Calls for Jobs. http://www.rfa.org/english/news/uyghur/tohti-03062009130647.html. Last accessed 4-12-2012.
Smith, J. (2002). 'Making Culture Matter': Symbolic, Spatial and Social Boundaries
between Uyghurs and Han Chinese. Asian Ethnicity, 3(2), 153-174. Song, C., & Wang, Y. (2005). Financial Support for Industries′ Development and
Structure Adjustment in Tibet (in Chinese). Journal of Tibet University, 20(2), 69-76. doi:10.3969/j.issn.1005-5738.2005.02.016
Stalin, J. V. (1913). Marxism and the National Question.
http://www.marxists.org/reference/archive/stalin/works/1913/03.htm. Last accessed 4-12-2012.
Stites, R. (1999). Writing cultural boundaries: National minority language policy, literacy
planning, and bilingual education. In G. A. Postiglione (Ed.), China's national minority education: Culture, schooling, and development (pp. 95-130). New York: Falmer Press.
Tan, L. (2000, January 1). Autonomy is not what it was | China Development Brief.
http://www.chinadevelopmentbrief.com/node/242. Last accessed 4-12-2012. Tibet to receive 1.7 bln yuan for historic preservation in 2011-2015. (2011, October 26).
http://news.xinhuanet.com/english2010/china/2011-10/26/c_131214291.htm. Last accessed 4-12-2012.
Wang, Y., & Phillion, J. (2009). Minority language policy and practice in china: The
need for multicultural education. International Journal of Multicultural Education, 11(1), 1-14.
Wang, L. (1998). Sky Burial: The Fate of Tibet. Hong Kong: Mirror Books Ltd. Wang, N. (2012, May 28). Tan Bibo: A Centenarian Who Had Heard Mao's Talks at the
Yenan Forum on Literature and Arts. Yunnan Daily [Kunming]. http://http://dangshi.people.com.cn/GB/17928331.html. Last accessed 4-12-2013..
Woeser, T. (2012a, December 11). Last Words of 31 Self-Immolated Tibetans [Web log
post]. http://woeser.middle-way.net/2012/12/27.html. Last accessed 4-12-2013. Woeser, T. (2012b, November 22). Thinking in the Wide Region Between Should and
Shouldn't (in Chinese) – Radio Free Asia. http://www.rfa.org/mandarin/pinglun/weise/ws-11222012093857.html. Last accessed 4-12-2012.
92
Woeser, T. (2011, July 10). Petition: Please Stop "Exploiting" Divine Mountains and Lakes for Profits [Web log post]. http://woeser.middle-way.net/2011/07/blog-post_2345.html. Last accessed 4-12-2012.
Wu, D. (2007). An International Study on Crime Policy for Ethnic MInority People (in
Chinese). In W. Xie, & X. Zhang (Ed.), Report on China's Crime Policy (Volume 1) (p. 453). Beijing: China Legal Publishing House.
Wu, X. (2003). Ethnic Policy during the Cultural Revolution Period (in Chinese).
Heilongjiang National Series, (3), 23-24. Xia, M. (2013, January 7). Discussing Self-Immolation with Chinese Intellectuals |
iSunAffairs Weekly. http://www.isunaffairs.com/?p=12667. Last accessed 4-12-2013. Xiao, Y. (1996). Criminal Policy and Strategy in China (in Chinese) (p. 263). Beijing:
Law Press. Xu, D. (2010). A Study of the Reform of Training Bilingual Teachers in Minority
Natinality Community (in Chinese). Language and Translation (Chinese Edition), (1). doi:10.3969/j.issn.1001-0823.2010.01.015
Xu, Z. (2012, December 22). A Han's Condolence for A Self-immolated Tibetan (in
Chinese) - NYTimes Chinese Edition. http://cn.nytimes.com/opinion/20121222/c22xu/. Last accessed 4-12-2013.
Xu, Z. (2012, December 13). Tibet Is Burning - NYTimes.com.
http://www.nytimes.com/2012/12/13/opinion/tibet-is-burning.html?_r=0. Last accessed 4-12-2013.
Yan, Q. (2006). The Exploration of the Tibetan "Gudu" in Modern Xikang (in Chinese).
Ethno-National Studies, (6). doi:10.3969/j.issn.0256-1891.2006.06.009 Yan, X. (2009, July 3). Ten Scholars On the China Way (in Chinese) | People.com.cm.
http://theory.people.com.cn/GB/49150/49152/9591710.html. Last accessed 4-12-2012.
Yao, X. (2012, December 24). Could Not The Chinese Communist Party Government and
the 14th Dalai Lama Really Stop the Self-Immolation? | iSunAffairs Weekly. http://www.isunaffairs.com/?p=12584. Last accessed 4-12-2013.
Yao, X. (2010, May 1). Confusions and Concerns about "Bilingual Education": A Case
Study in Xinjiang (in Chinese) [Web log post]. http://blog.sina.com.cn/s/blog_60f25ed70100ioa0.html. Last accessed 4-12-2012.
Zhai, S. (1999). Some Views on the Translation of the Term of "Minzu" (in Chinese).
World Ethno-National Studies, (4). doi:10.3969/j.issn.1006-8287.1999.02.011
93
Zhang, J., Zhang, Z., & Sun, M. (1991). "Two Less One Lenient" Policy Must Apply for
Minority Criminals. Journal of Qinghai University of Nationalities (Social Sciences), (1).
Zhong, Z. (2006, July 6). Lu Jingshi: My Service Life in the Geology Team (in Chinese).
http://vweb.youth.cn/cms/2006/2006news/xbfc/qwbd/200607/t20060706_338166.htm. Last accessed 4-12-2012.
Zhou, X. (1999). Summary of 1998 Seminar of Concept and Related Theories of "Minzu".
World Ethno-National Studies, (1). Zhu, L. (2001). On Ethno-national Jointnomy--A Study on the Inter-ethno-national
Political Realities in the Contemporary Nation with Multiple Ethno-national (in Chinese). World Ethno-National Studies, (4). doi:10.3969/j.issn.1006-8287.2001.04.001
Zhu, L. (2005). On the Wrong Application of Western Concept of "Ethnicity" (in
Chinese). Social Sciences in China (Chinese Edition), (4).
94
CHAPTER 2
HEALTH INEQUALITY BETWEEN ETHNIC MINORITY
AND HAN POPULATIONS IN CHINA
1. Introduction
Since China abandoned the socialist planned economy and switched to a market-
oriented economy in 1978, the international community has become increasingly
familiar with this country and its people. Consequently, abundant empirical studies
have been conducted to understand China’s economic development and the well-
being of the Chinese people.
Most of these studies, however, have focused only on the Han, the dominant ethnic
group in China, which accounts for about 91.6% of the country’s total population. In
contrast, there exist surprisingly few English-language empirical studies on the
remaining 8.4%, representing 114 million individuals (Sixth National Population
Census of 2010 (NBS communiqué on 2010 population census (No 1)) who belong to
55 ethnic minority tribes. These minority tribes are different from the Han in many
important aspects, including culture and religion, language and education, geographic
location and natural endowments, means of sustenance, diet, and health and nutrition.
The central government in China has always stressed that all minority territories are
“inalienable parts of China” and that “Han chauvinism” in any form will be firmly
opposed (Article 4 of the 1982 State Constitution of China). The central government
has also enacted a series of policies in favor of its ethnic minority population,
95
spanning a broad spectrum of aspects from education to family planning. In addition,
many local governments have designed programs and undertaken measures to benefit
local ethnic minority communities. In recent years, an increasing number of
nongovernmental organizations (NGOs), both domestic and international, have also
initiated efforts to help improve the well-being of ethnic minority Chinese.
It is thus natural to ask: How do minority Chinese fare compared with Han Chinese?
Using health as a proxy measure of human welfare, we examine whether minorities
have become better off than the Han during the 17 years from 1989 to 2006, and if not,
what could contribute to their welfare disadvantage.
2. Literature Review
An abundance of English-language studies on China’s ethnic minority population
have been conducted by both Chinese and non-Chinese demographers, ethnologists,
anthropologists, and sociologists. Most of these analyses were based on field studies
carried out in specific ethnic minority residential areas and thus focused on specific
minority nationalities. Several studies took advantage of national census data and
examined major ethnic groups with a population of more than 1 million (Poston and
Shu, 1987; Hannum, 2002; Li, Luo, and de Klerk, 2008). Altogether, these studies
provide detailed histories and current accounts of various aspects of the life of ethnic
minority: education (Postiglione, 1999; Hannum, 2002; Postiglione, 2006),
occupational differences (Hannum and Xie, 1998), language policies and linguistic
practices (Zhou and Sun, 2004; Clothey, 2004; Nelson, 2005; Wang and Phillion,
96
2009), demographic and socioeconomic composition (Poston and Shu, 1987), family
planning and fertility patterns (Park and Han, 1990; Poston, Chang, and Hong, 2006),
religious and cultural orientations (Mackerras, 1999; Gladney, 1999; Yi, 2005; Cheung,
2003), ethnic self-identification (Gladney, 1991; Harrell, 1995; Hsieh, 1996; Litzinger,
2000; Kaup, 2002), infant mortality and life expectancy at birth (Li, Luo, and de
Klerk, 2008), and even prevention of drug use among young minority men (Li and
Tilt, 2007).
In contrast to the abundance of social studies focusing on Chinese minorities based on
narrative accounts and survey and census data, we found few peer-reviewed economic
studies of these groups. The most recent study is Gustafsson and Li’s analysis of the
minority-majority income gap in rural China (Gustafsson and Li 2003). They found
that minorities in their sample had lower average incomes than their Han counterparts
and that the income gap had widened during 1988-1995 in all but two (Guizhou and
Yunnan) out of the 19 provinces studied. Further, they found that having larger
families and living in poorer provinces are strongly associated with less household
income; while border trade and ethnic tourism might explain why minority
households in Yunnan and Guizhou earned more than their Han counterparts. These
findings echoed a previous study by Gustaffson and Wei (Gustafsson and Wei, 2000)
and two later studies by Gustaffson and Ding (Gustafsson and Ding, 2006; Gustafsson
and Ding, 2008).
Even scarcer are peer-reviewed and English-language empirical studies of the health
and nutrition status of ethnic minority Chinese. We are aware of only two studies,
both focusing on minority health in Yunnan province. Yunnan is the most ethnically
97
diverse province in China, with 55 minority nationalities accounting for 33.5% of the
province’s total population (Li, Luo, and de Klerk, 2008; Li and Tilt, 2007).
A number of interesting studies on the health status of minority individuals, however,
have been conducted by Chinese researchers and published only in Chinese. These
studies fall into two categories: those focusing on the physical health of ethnic
minority Chinese and those focusing on the mental health of ethnic minority Chinese.
Representative work in the first category is Liu’s study of a random sample of 722
ethnic minority individuals at least 15 years old drawn from Guizhou province in
southwest China. Guizhou is one of the country’s poorest provinces and has a
minority population accounting for about 37% of its total population (Liu 2007). Liu
studied three aspects of health: physical health, measured by absence of disease;
knowledge of health and nutrition, measured by each subject’s total score on a health
and nutrition questionnaire; and quality of life, based on the definition of the World
Health Organization (WHO), which emphasizes an individual’s subjective feeling
about personal health and is measured by a WHO-developed instrument WHOQOL-
1001. She found that compared with the Han, ethnic minority people in general have
worse physical health and poorer awareness and knowledge of health and nutrition,
but higher quality of life.
Because the Chinese government consistently emphasizes the importance of mental
health education among ethnic minority youth, Chinese researchers have performed
many studies of the mental health status of young ethnic minority people, particularly
1 Details about this instrument can be found in WHO (1997).
98
in provinces with large ethnic minority populations, such as Guizhou, Sichuan, and
Yunnan. Representative work in this category is a study of the mental health status of
ethnic minority college students in China by Yang et al. (2009). Data come from a
random sample of 900 ethnic minority students drawn from colleges in nine border
provinces that serve as a good representation of the entire ethnic minority community
in China. Yang et al. measured each subject’s mental health status using the total score
he or she received from four categories of questions on Cattell’s 16 Personality
Factors (16PF) Questionnaire: emotional stability, liveliness, apprehension, and
tension. They found that on average, the mental health status of ethnic minority
college students is significantly (at the 1% level) lower than that of Han college
students. Moreover, female ethnic minority students have lower mental health status
than male ethnic minority students. Field studies performed in three ethnic minority
counties and villages in Yunnan suggest that the statistically significant mental health
disadvantage may be attributed to cultural background and social values, poor
Mandarin education in elementary and secondary schools resulting in a serious
language barrier between minority youth and the outside world, higher job market
pressure due to limited labor market opportunities and the relatively weak academic
background of ethnic minority college graduates, parents’ education level,
overexpectations of parents, and even sibling effects.
3. Data
Our research is based on data from the China Health and Nutrition Survey (CHNS)
99
collected in nine2 Chinese provinces during 1989–2006: Guangxi, Guizhou,
Heilongjiang, Henan, Hubei, Hunan, Jiangsu, Liaoning, and Shandong. Although
these nine provinces are not evenly distributed across the country, as shown in Figure
1, they formed a reasonably good representation of mainland China (excluding
Beijing, Shanghai, and Tianjin) as they include provinces at different economic
levels3: Jiangsu represents developed provinces whose annual gross domestic product
(GDP) per capita exceeds 30,000 RMB yuan; Liaoning and Shandong represent
above-average provinces whose annual GDP per capita falls between 20,000 and
30,000 RMB yuan; Guangxi, Heilongjiang, Henan, Hubei, and Hunan represent
average provinces whose annual GDP per capita falls between 10,000 and 20,000
RMB yuan; Guizhou represents underdeveloped provinces, whose annual GDP per
capita falls below 10,000 RMB yuan. These are 2006 data from the National Bureau
of Statistics, but the ranking was about the same in the 1990s and early 2000s.
2 Before 1997, eight provinces were surveyed: Guangxi, Guizhou, Henan, Hubei, Hunan, Jiangsu, Liaoning, and Shandong. In 1997, Liaoning province was replaced by Heilongjiang province; but it returned (with Heilongjiang staying in the survey) in 2000 and stayed for the following surveys. 3 Here we use province-level GDP per capita, instead of income per capita, as a proxy for the economic development level of a province. This is because income data are collected and reported separately for rural and urban areas because of the severe rural-urban dichotomy in China, and a single income per capita figure for all residents in a province does not exist.
100
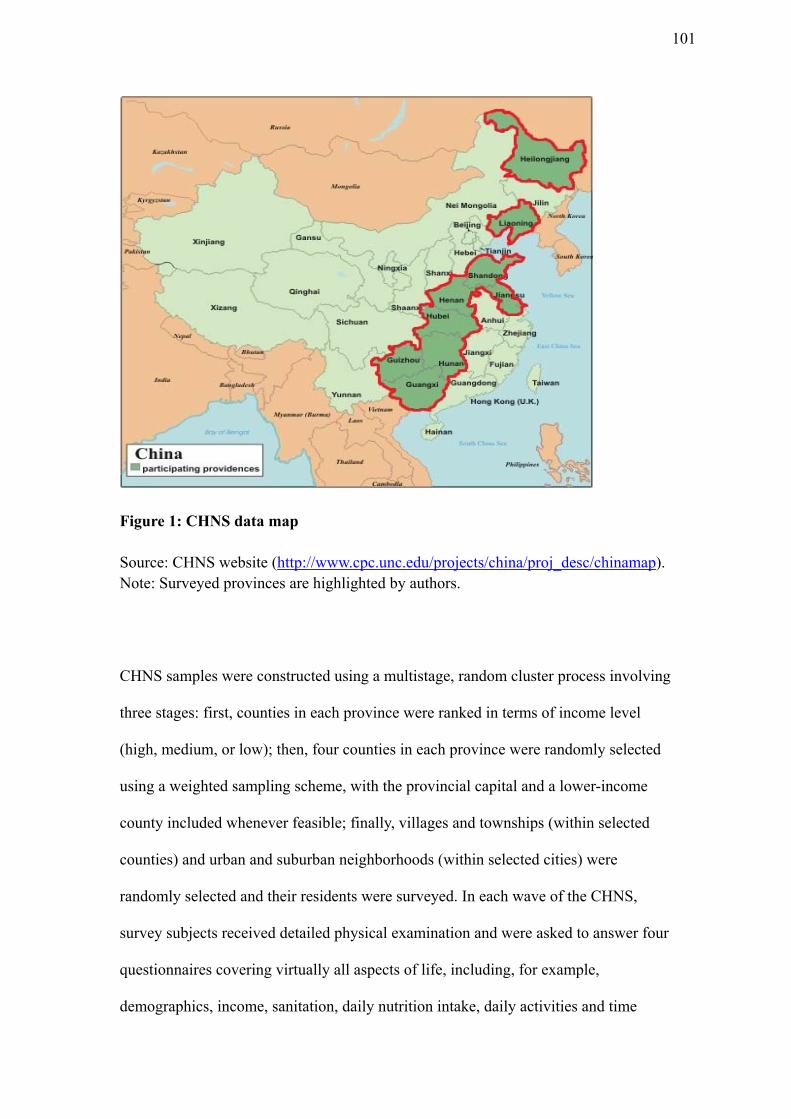
Figure 1: CHNS data map Source: CHNS website (http://www.cpc.unc.edu/projects/china/proj_desc/chinamap). Note: Surveyed provinces are highlighted by authors.
CHNS samples were constructed using a multistage, random cluster process involving
three stages: first, counties in each province were ranked in terms of income level
(high, medium, or low); then, four counties in each province were randomly selected
using a weighted sampling scheme, with the provincial capital and a lower-income
county included whenever feasible; finally, villages and townships (within selected
counties) and urban and suburban neighborhoods (within selected cities) were
randomly selected and their residents were surveyed. In each wave of the CHNS,
survey subjects received detailed physical examination and were asked to answer four
questionnaires covering virtually all aspects of life, including, for example,
demographics, income, sanitation, daily nutrition intake, daily activities and time
101
allocation, health status indicators, and health services received.
As the only publicly available data set containing both individual anthropometric data
and data on individual ethnicity background and socioeconomic status, CHNS is
particularly suitable for examining the health and nutrition gap between minority and
Han Chinese and for exploring possible household and individual characteristics
contributing to the observed gap.
As reported in Table 1, the CHNS began with 15,936 people from 4,020 households
in 1989, and it was followed with six follow-up surveys in 1991, 1993, 1997, 2000,
2004, and 2006.4 By 2006 the pooled sample size was 115,316 at the individual level
and 28,921 at the household level. Since our interest is a minority-Han comparison,
we limit our analysis to individuals who have valid information on ethnicity status. As
a result, our pooled analysis sample size is 81,506 individuals from 27,187
households, of which 10,846 are minorities (coming from 3,040 households).
4 The seventh round of the CHNS was conducted in 2009, and an eighth is planned for 2012.
102
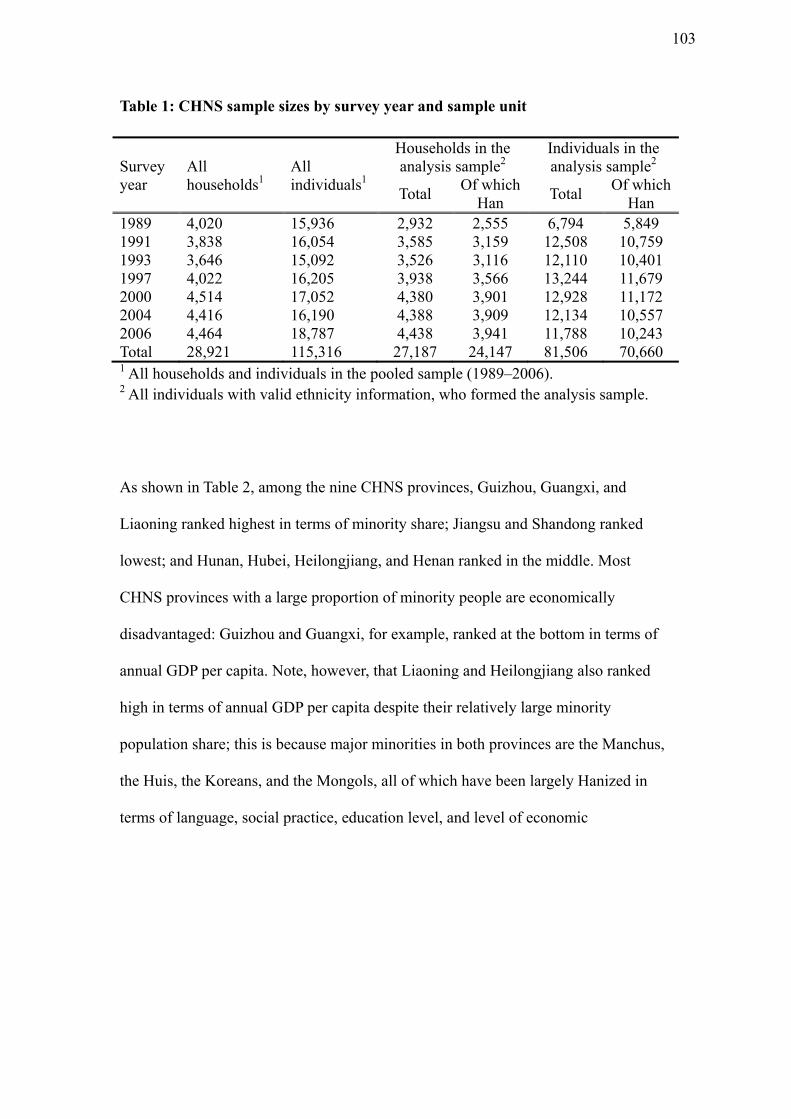
Table 1: CHNS sample sizes by survey year and sample unit
Survey year
All households1
All individuals1
Households in the analysis sample2
Individuals in the analysis sample2
Total Of which
Han Total
Of which Han
1989 4,020 15,936 2,932 2,555 6,794 5,849 1991 3,838 16,054 3,585 3,159 12,508 10,759 1993 3,646 15,092 3,526 3,116 12,110 10,401 1997 4,022 16,205 3,938 3,566 13,244 11,679 2000 4,514 17,052 4,380 3,901 12,928 11,172 2004 4,416 16,190 4,388 3,909 12,134 10,557 2006 4,464 18,787 4,438 3,941 11,788 10,243 Total 28,921 115,316 27,187 24,147 81,506 70,660 1 All households and individuals in the pooled sample (1989–2006). 2 All individuals with valid ethnicity information, who formed the analysis sample.
As shown in Table 2, among the nine CHNS provinces, Guizhou, Guangxi, and
Liaoning ranked highest in terms of minority share; Jiangsu and Shandong ranked
lowest; and Hunan, Hubei, Heilongjiang, and Henan ranked in the middle. Most
CHNS provinces with a large proportion of minority people are economically
disadvantaged: Guizhou and Guangxi, for example, ranked at the bottom in terms of
annual GDP per capita. Note, however, that Liaoning and Heilongjiang also ranked
high in terms of annual GDP per capita despite their relatively large minority
population share; this is because major minorities in both provinces are the Manchus,
the Huis, the Koreans, and the Mongols, all of which have been largely Hanized in
terms of language, social practice, education level, and level of economic
103
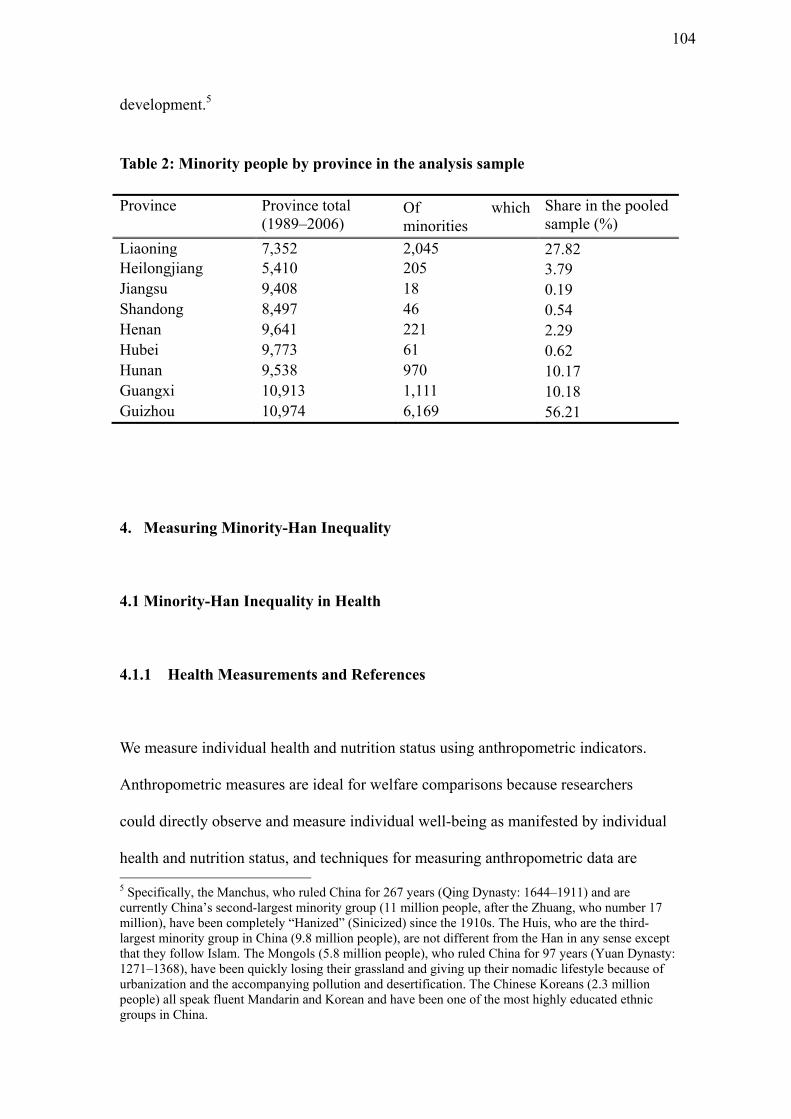
development.5
Table 2: Minority people by province in the analysis sample Province Province total
(1989–2006) Of which minorities
Share in the pooled sample (%)
Liaoning 7,352 2,045 27.82 Heilongjiang 5,410 205 3.79 Jiangsu 9,408 18 0.19 Shandong 8,497 46 0.54 Henan 9,641 221 2.29 Hubei 9,773 61 0.62 Hunan 9,538 970 10.17 Guangxi 10,913 1,111 10.18 Guizhou 10,974 6,169 56.21
4. Measuring Minority-Han Inequality
4.1 Minority-Han Inequality in Health
4.1.1 Health Measurements and References
We measure individual health and nutrition status using anthropometric indicators.
Anthropometric measures are ideal for welfare comparisons because researchers
could directly observe and measure individual well-being as manifested by individual
health and nutrition status, and techniques for measuring anthropometric data are 5 Specifically, the Manchus, who ruled China for 267 years (Qing Dynasty: 1644–1911) and are currently China’s second-largest minority group (11 million people, after the Zhuang, who number 17 million), have been completely “Hanized” (Sinicized) since the 1910s. The Huis, who are the third-largest minority group in China (9.8 million people), are not different from the Han in any sense except that they follow Islam. The Mongols (5.8 million people), who ruled China for 97 years (Yuan Dynasty: 1271–1368), have been quickly losing their grassland and giving up their nomadic lifestyle because of urbanization and the accompanying pollution and desertification. The Chinese Koreans (2.3 million people) all speak fluent Mandarin and Korean and have been one of the most highly educated ethnic groups in China.
104
similar across surveys (O'Donnell et al. 2008).
We used different anthropometric indicators for people of different age groups:
height-for-age z-score (HAZ), weight-for-height z-score (WHZ), and weight-for-age
z-score (WAZ) are used for children younger than 6 years of age; body mass index
(BMI) for adults 19 years old and older; and BMI-for-age z-score (BAZ) for older
children and adolescents aged between 6 and 18.99 years, as recommended by the
WHO.
Height-for-age, weight-for-height, and weight-for-age are all standard measures for
health and nutrition status of infants and children younger than 6 years of age, but
they are not all the same. Height-for-age is used to assess long-term health and
nutrition status; it also measures risk of frequent exposure to unfavorable conditions
such as illness or improper feeding practices. Weight-for-height, in contrast, is
considered an indicator of short-term health and nutrition status. Weight-for-age
measures body mass of infants and preschoolers relative to chronological age and in
general provides similar information as height-for-age. It is, however, less useful than
height-for-age because it is affected by both a child’s height-for-age and his or her
weight-for-height, making its interpretation complicated (de Onis and Blössner 1997).
BMI is widely used to measure adult health. Its validity is sometimes questioned,
however, because it is not sensitive to many health problems and indicates quality of
life only partially. Unfortunately, constructing more advanced health measures all
require data that are not available in the CHNS (Lohr 2000; Patrick and Chiang 2000).
In contrast, BMI requires only individual height and weight data and is easy to
105
calculate. Another justification for using BMI in this research is related to the public
health situation in China: according to the WHO Global Report 2005, chronic
diseases such as cancer, diabetes, cerebral and cardiovascular disease have become
major public health issues in China. BMI assumes a linear relation with percentage of
body fat, which is a risk factor for all these diseases.
Because z-score is the difference between the value for an individual and the median
value of the reference population for the same gender and age (or height) divided by
the standard deviation (SD) of the reference population, we needed to choose a
reference population before calculating and assessing anthropometric z-scores. In this
study, we used the WHO Child Growth Standards (WHO Multicentre Growth
Reference Study Group 2006) for infants and children younger than 5 years of age
and the WHO Growth Reference Data for 5–19 years (de Onis et al. 2007).
Many researchers have concerns about whether the WHO reference data are suitable
for people across all populations. The answer depends on the age group of the
subjects in the study. For children from birth to 6 years old, it is generally agreed that
the WHO Child Growth Standard 2007 can be applied to children from all
populations, regardless of genetic or ethnic background (Habicht et al. 1974;
Martorell and Habicht 1985). Many studies, however, suggest that the WHO growth
standard may not be appropriate for school-age and adolescent populations in Asia
106
(Haas and Campirano, 2006; Ulijaszek, 1994, 2001; Butte et al., 2007).6
Unfortunately, a commonly accepted (not to mention widely adopted) Chinese
reference does not seem to exist for this age group.7 Therefore, the WHO growth data
represent our only choice.
Calculating BMI, in contrast to z-scores, does not require reference data. It is simply
an individual’s weight in kilograms divided by the square of his or her height in
meters (kg/m2). Assessing individual BMI values, however, relies on some BMI
6 In their study of interpopulation variation in the achieved height of prepubescent and pubescent children (aged 7 to 18 years) across 53 populations experiencing favorable conditions that support linear growth, Haas and Campirano (2006) found that the mean height of prepubescent children differs by 3 to 5 centimeters (cm). Further, they found that the mean height of non-European populations is about 5 cm shorter than the WHO reference height at puberty and the mean height of northern European populations is about 5 cm taller than the reference height. In two earlier studies, Ulijaszek (1994, 2001) found that Asian 7-year-olds are about 1.0–1.7 cm shorter than 7-year-olds in Africa, Europe, North America, and Latin America. Therefore, when studying health and nutrition status of Asian populations aged 5 years or older, researchers should consider an alternative non-WHO or non-NCHS reference. More recently, Butte et al. (2007, p. 153) pointed out, “A [WHO] working group of experts in growth and development and representatives from international organizations concluded that subpopulations exhibit similar patterns of growth when exposed to similar external conditioners of growth. However, based on available data, we cannot rule out that observed differences in linear growth across ethnic groups reflect true differences in genetic potential rather than environmental influences. . . . The [WHO] working group agreed that existing growth references for school-aged children and adolescents have shortcomings, particularly for assessing obesity, and that appropriate growth standards for these age groups should be developed for clinical and public health applications.” 7 We did an extensive search for reference data suitable for Chinese school-aged children and adolescents and found the following: (1) The Families with Children from China (FCC) website has a set of widely available growth charts for China (http://fwcc.org/index.php?option=com_content&view=article&id=301:growth-charts-for-chinese-children&catid=15:health&Itemid=23 last accessed on 2-23-2012). These growth charts are quite out of date, however, because they are derived from measurements of ethnic Chinese girls and boys in Hong Kong in the early 1960s (Chang et al., 1965). At that time, parents of Hong Kong children were almost exclusively immigrants from southern China, mostly Guangdong Province. Hong Kong boy and girl growth charts, including weight, height, and head circumference, are also available online (http://www.hk-doctor.com/tool/html/TOC_E.htm last accessed on 2-1-2012), and more information about these charts is also available (http://www.cuhk.edu.hk/proj/growthstd/english/gs_surve.htm last accessed on 2-1-2012). (2) A reference was developed based on data from the 1993 Hong Kong Growth Survey conducted by the Faculty of Medicine at the Chinese University of Hong Kong in collaboration with the Department of Health and the Hospital Authority in Hong Kong (http://www.cuhk.edu.hk/proj/growthstd/english/gs_surve.htm last accessed on 2-1-2012). (3) A study by Leung and Davies (1994) tracked the growth of 174 full-term, healthy, and formula-fed Hong Kong Chinese infants for two years and found that at 2 years old, infants were -0.6 standard deviations (SDs) lighter and -0.4 SDs shorter than US growth data, even with similar protein and calorie intakes as Caucasian infants. (4) A study by Fok et al. (2003) based on preterm and term births in Hong Kong provided weight, height, and head circumference charts. (5) A study by Hui et al. (2008) provided evidence that the WHO infant growth standard may not be appropriate for Hong Kong Chinese infants from birth to 36 months. Obviously, none of these is commonly agreed by researchers as a better option than the WHO reference.
107
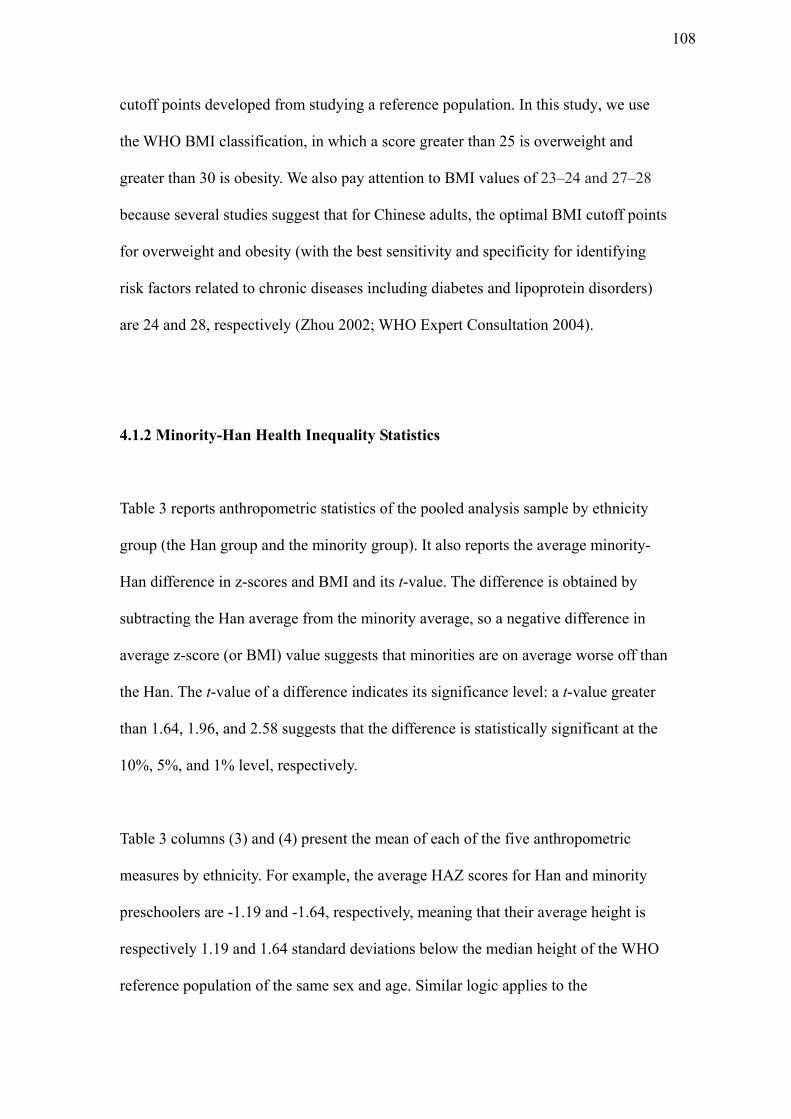
cutoff points developed from studying a reference population. In this study, we use
the WHO BMI classification, in which a score greater than 25 is overweight and
greater than 30 is obesity. We also pay attention to BMI values of 23–24 and 27–28
because several studies suggest that for Chinese adults, the optimal BMI cutoff points
for overweight and obesity (with the best sensitivity and specificity for identifying
risk factors related to chronic diseases including diabetes and lipoprotein disorders)
are 24 and 28, respectively (Zhou 2002; WHO Expert Consultation 2004).
4.1.2 Minority-Han Health Inequality Statistics
Table 3 reports anthropometric statistics of the pooled analysis sample by ethnicity
group (the Han group and the minority group). It also reports the average minority-
Han difference in z-scores and BMI and its t-value. The difference is obtained by
subtracting the Han average from the minority average, so a negative difference in
average z-score (or BMI) value suggests that minorities are on average worse off than
the Han. The t-value of a difference indicates its significance level: a t-value greater
than 1.64, 1.96, and 2.58 suggests that the difference is statistically significant at the
10%, 5%, and 1% level, respectively.
Table 3 columns (3) and (4) present the mean of each of the five anthropometric
measures by ethnicity. For example, the average HAZ scores for Han and minority
preschoolers are -1.19 and -1.64, respectively, meaning that their average height is
respectively 1.19 and 1.64 standard deviations below the median height of the WHO
reference population of the same sex and age. Similar logic applies to the
108
interpretation of WAZ, WHZ, and BAZ; note however that the WHZ score is
compared to the median weight of the WHO reference population of the same sex and
height, not age. The average BMI scores for both groups fall within the normal range
according to the WHO classification and the Chinese BMI cut-off points. Overall,
these statistics suggest that by the WHO standard, during the period 1989–2006, both
the minority and Han preschoolers suffered from moderate and chronic malnutrition;
both the minority and Han school-age children were slightly undernourished; but both
the minority and Han adults were healthy and faced low risk of overweight- and
obesity-related health problems.
Table 3: Average minority-Han difference in health indicators (pooled sample, including all people with valid ethnicity information)
Health indicators
(1) (2) (3) (4) (5) (6) N total N minority Avg.
age in years
Han average
Minority average
Minority-Han difference
t value
Height-for-age z-score (HAZ)
5,402 846 3.408 -1.190 -1.640 -0.450 -8.520
Weight-for-age z-score (WAZ)
5,402 846 3.408 -0.450 -0.830 -0.380 -8.610
Weight-for-height z-score (WHZ)
5,402 846 3.408 0.430 0.280 -0.150 -2.980
BMI-for-Age z-score (BAZ)
14,154 2155 12.279 -0.390 -0.530 -0.140 -5.500
Body mass index
(BMI)
56,596 7271 44.420 22.610 21.810 -0.800 -20.670
Notes: HAZ, WAZ, and WHZ are calculated for children aged 0–5.99 years; BAZ is calculated for
children and adolescents aged 6–18.99 years; BMI is calculated for adults aged 19 and older. Exclusion
ranges recommended by WHO are applied; that is, we dropped observations with HAZ > 3 or HAZ < -
5, WAZ > 5 or WAZ < -5, or WHZ > 5 or WHZ < -4. Also, while WHO did not recommend exclusion
ranges for BAZ and BMI, we excluded observations with BAZ > 5 or BAZ < -4 and observations with
BMI < 12 or BMI > 45. As a result, we actually have fewer than 81,506 (Table 1) individuals for our
calculations in Table 3. The average age in years is for both minorities and the Han. As reported in
Table 5, there exists a significant difference (at the 5% significance level) in average age between Han
adults and their minority counterparts: the former are 0.42 years older than the latter. There is no
statistically significant (at the 10% or higher significance level) minority-Han age difference among
small children and children aged between 6 and 18.99 years old.
109
Table 3 columns (5) and (6) present the average minority-Han differences in z-scores
and BMI and their t-values. The HAZ score of minority children younger than 6 years
is on average 0.45 lower than the average HAZ score of Han children of the same age
and sex. This corresponds to a height difference (in centimeters) equal to the product
of 0.45 and the standard deviation of height in the reference population, which
depends on the child’s age and sex and is available on the WHO website. For example,
assume we have a group of 4-year-old minority girls and a group of 4-year-old Han
girls; because the standard deviation of height is 4.3075 for 4-year-old girls in the
reference population, the average difference in height between the two groups of 4-
year-old girls would be about 1.94 centimeters. Similar logic applies to the
interpretation of differences in other anthropometric indicators listed. The key
message of the statistics in Table 3 columns (5) and (6) is that during the period 1989–
2006, minority Chinese of all age groups, particularly children from birth to 5.99
years of age, remained significantly (at the 1% level) worse off than their Han
counterparts in terms of health and nutrition. However, the minority-Han gap in BMI
reported here is likely to be upward biased for two reasons. First, there is a significant
difference (at the 5% level) in average age between minority and Han adults (see
Table 5.1): Han adults are on average 0.42 years older than minority adults, and older
people tend to have higher BMI scores. Second, Table 2 shows that about 67% of
minority people in this analysis sample live in Guizhou and Guangxi, where people
are generally shorter and thinner than people (both Han and minority) living
elsewhere in China.
The health gap between Han and minority Chinese is further illustrated in Figure 2,
110
which shows minority-Han difference in average HAZ, WAZ, HAZ, BAZ, and BMI.
Because the CHNS data were collected in multiple years and the sampling frame has
been based on the same population, we were able to examine the minority-Han gap in
health and nutrition by year and see how it changed during the period 1989–2006
(Table 4).
111
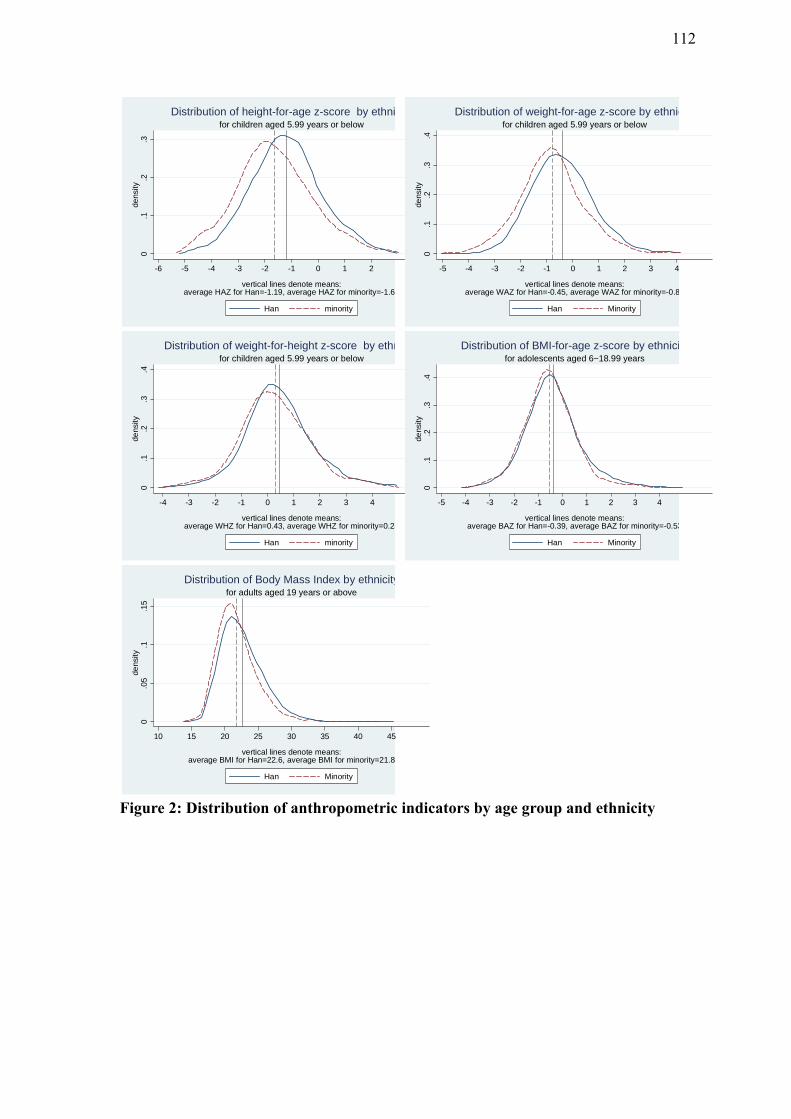
0.1
.2.3
dens
ity
-6 -5 -4 -3 -2 -1 0 1 2
vertical lines denote means:average HAZ for Han=-1.19, average HAZ for minority=-1.64
Han minority
for children aged 5.99 years or belowDistribution of height-for-age z-score by ethni
0.1
.2.3
.4de
nsity
-5 -4 -3 -2 -1 0 1 2 3 4
vertical lines denote means:average WAZ for Han=-0.45, average WAZ for minority=-0.8
Han Minority
for children aged 5.99 years or belowDistribution of weight-for-age z-score by ethnic
0.1
.2.3
.4de
nsity
-4 -3 -2 -1 0 1 2 3 4
vertical lines denote means:average WHZ for Han=0.43, average WHZ for minority=0.28
Han minority
for children aged 5.99 years or belowDistribution of weight-for-height z-score by ethn
0.1
.2.3
.4de
nsity
-5 -4 -3 -2 -1 0 1 2 3 4
vertical lines denote means:average BAZ for Han=-0.39, average BAZ for minority=-0.53
Han Minority
for adolescents aged 6~18.99 yearsDistribution of BMI-for-age z-score by ethnici
0.0
5.1
.15
dens
ity
10 15 20 25 30 35 40 45
vertical lines denote means:average BMI for Han=22.6, average BMI for minority=21.8
Han Minority
for adults aged 19 years or aboveDistribution of Body Mass Index by ethnicity
Figure 2: Distribution of anthropometric indicators by age group and ethnicity
112
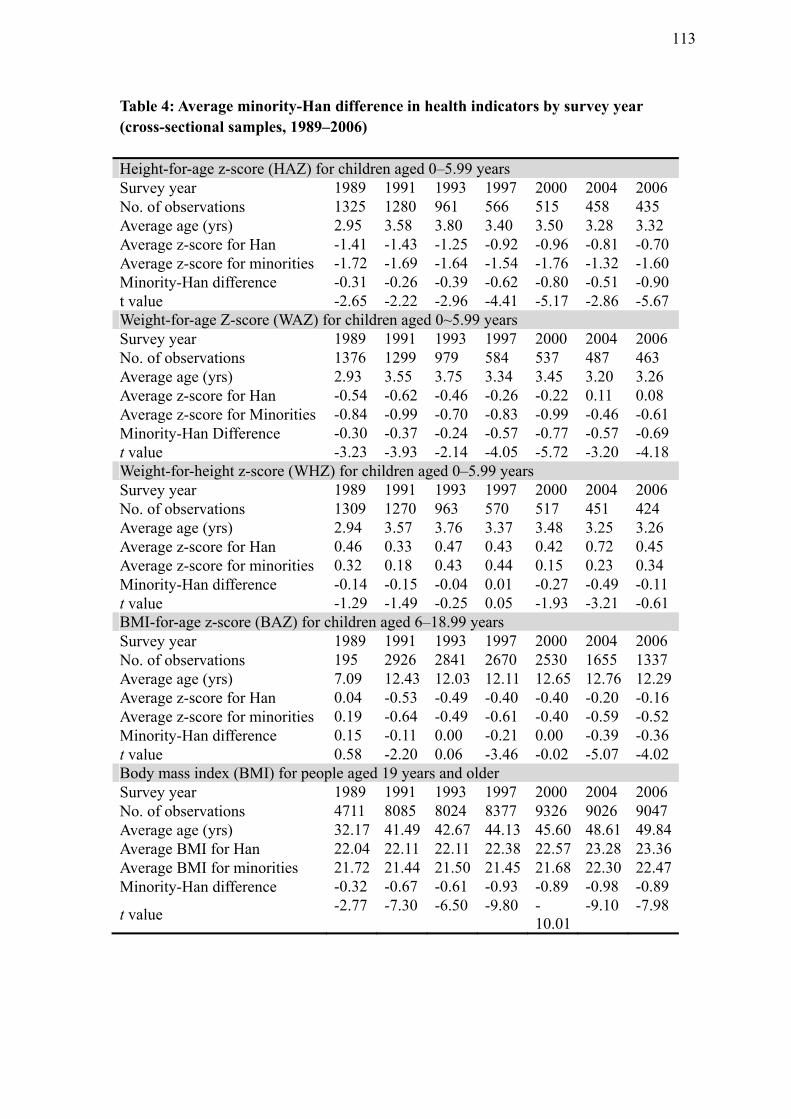
Table 4: Average minority-Han difference in health indicators by survey year (cross-sectional samples, 1989–2006) Height-for-age z-score (HAZ) for children aged 0–5.99 years Survey year 1989 1991 1993 1997 2000 2004 2006 No. of observations 1325 1280 961 566 515 458 435 Average age (yrs) 2.95 3.58 3.80 3.40 3.50 3.28 3.32 Average z-score for Han -1.41 -1.43 -1.25 -0.92 -0.96 -0.81 -0.70 Average z-score for minorities -1.72 -1.69 -1.64 -1.54 -1.76 -1.32 -1.60 Minority-Han difference -0.31 -0.26 -0.39 -0.62 -0.80 -0.51 -0.90 t value -2.65 -2.22 -2.96 -4.41 -5.17 -2.86 -5.67 Weight-for-age Z-score (WAZ) for children aged 0~5.99 years Survey year 1989 1991 1993 1997 2000 2004 2006 No. of observations 1376 1299 979 584 537 487 463 Average age (yrs) 2.93 3.55 3.75 3.34 3.45 3.20 3.26 Average z-score for Han -0.54 -0.62 -0.46 -0.26 -0.22 0.11 0.08 Average z-score for Minorities -0.84 -0.99 -0.70 -0.83 -0.99 -0.46 -0.61 Minority-Han Difference -0.30 -0.37 -0.24 -0.57 -0.77 -0.57 -0.69 t value -3.23 -3.93 -2.14 -4.05 -5.72 -3.20 -4.18 Weight-for-height z-score (WHZ) for children aged 0–5.99 years Survey year 1989 1991 1993 1997 2000 2004 2006 No. of observations 1309 1270 963 570 517 451 424 Average age (yrs) 2.94 3.57 3.76 3.37 3.48 3.25 3.26 Average z-score for Han 0.46 0.33 0.47 0.43 0.42 0.72 0.45 Average z-score for minorities 0.32 0.18 0.43 0.44 0.15 0.23 0.34 Minority-Han difference -0.14 -0.15 -0.04 0.01 -0.27 -0.49 -0.11 t value -1.29 -1.49 -0.25 0.05 -1.93 -3.21 -0.61 BMI-for-age z-score (BAZ) for children aged 6–18.99 years Survey year 1989 1991 1993 1997 2000 2004 2006 No. of observations 195 2926 2841 2670 2530 1655 1337 Average age (yrs) 7.09 12.43 12.03 12.11 12.65 12.76 12.29Average z-score for Han 0.04 -0.53 -0.49 -0.40 -0.40 -0.20 -0.16 Average z-score for minorities 0.19 -0.64 -0.49 -0.61 -0.40 -0.59 -0.52 Minority-Han difference 0.15 -0.11 0.00 -0.21 0.00 -0.39 -0.36 t value 0.58 -2.20 0.06 -3.46 -0.02 -5.07 -4.02 Body mass index (BMI) for people aged 19 years and older Survey year 1989 1991 1993 1997 2000 2004 2006 No. of observations 4711 8085 8024 8377 9326 9026 9047 Average age (yrs) 32.17 41.49 42.67 44.13 45.60 48.61 49.84Average BMI for Han 22.04 22.11 22.11 22.38 22.57 23.28 23.36Average BMI for minorities 21.72 21.44 21.50 21.45 21.68 22.30 22.47Minority-Han difference -0.32 -0.67 -0.61 -0.93 -0.89 -0.98 -0.89
t value -2.77 -7.30 -6.50 -9.80 -
10.01 -9.10 -7.98
113
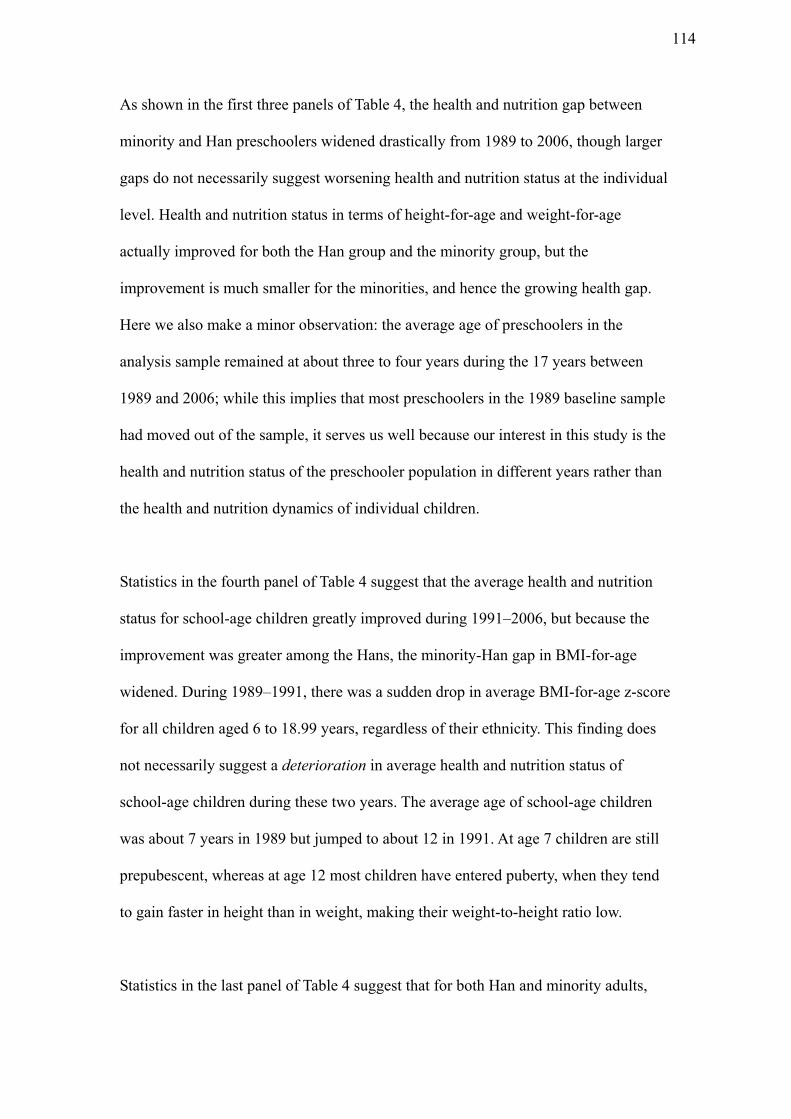
As shown in the first three panels of Table 4, the health and nutrition gap between
minority and Han preschoolers widened drastically from 1989 to 2006, though larger
gaps do not necessarily suggest worsening health and nutrition status at the individual
level. Health and nutrition status in terms of height-for-age and weight-for-age
actually improved for both the Han group and the minority group, but the
improvement is much smaller for the minorities, and hence the growing health gap.
Here we also make a minor observation: the average age of preschoolers in the
analysis sample remained at about three to four years during the 17 years between
1989 and 2006; while this implies that most preschoolers in the 1989 baseline sample
had moved out of the sample, it serves us well because our interest in this study is the
health and nutrition status of the preschooler population in different years rather than
the health and nutrition dynamics of individual children.
Statistics in the fourth panel of Table 4 suggest that the average health and nutrition
status for school-age children greatly improved during 1991–2006, but because the
improvement was greater among the Hans, the minority-Han gap in BMI-for-age
widened. During 1989–1991, there was a sudden drop in average BMI-for-age z-score
for all children aged 6 to 18.99 years, regardless of their ethnicity. This finding does
not necessarily suggest a deterioration in average health and nutrition status of
school-age children during these two years. The average age of school-age children
was about 7 years in 1989 but jumped to about 12 in 1991. At age 7 children are still
prepubescent, whereas at age 12 most children have entered puberty, when they tend
to gain faster in height than in weight, making their weight-to-height ratio low.
Statistics in the last panel of Table 4 suggest that for both Han and minority adults,
114
average BMI increased slightly but remained below the overweight cutoff point of 25
(WHO classification) or 23 (Chinese classification). The BMI gap between the two
groups also increased slightly during 1989–2006. There are two possible explanations
for this change: first, Han adults are more likely to live in urban areas, where people’s
meat and fat intake increased more than in rural areas; second, Han adults are more
likely to take non-agricultural jobs than minority adults.
Figure 3 further illustrates the time trend in BMI by ethnicity. It shows an increasing
trend in BMI for obese (BMI ≥ 30) and overweight (24.99 < BMI < 30) people and a
decreasing trend in BMI for normal (18.49 < BMI ≤ 24.99) and underweight (BMI ≤
18.49) people. Specifically, the prevalence of obesity increased slightly during the
period 1989–2000 but doubled for both the Han and the minority groups during the
four-year period 2000–2004. This rapid increase continued for minorities during the
subsequent two years while the Han population leveled off. The rate of increase in the
prevalence of overweight was high in the Han population throughout the study period
while minorities kept a low and constant prevalence until 1997, after which they too
experienced a rapid increase in the prevalence of overweight. The prevalence of
underweight among minority people increased during 1989–1991, stayed constant at
10–12% until 2004, and then fell to about 9%. In contrast, the prevalence of
underweight among Han people also increased during 1989–1991, but then kept
decreasing and was about 5% by 2006. In all survey years, the sample contains more
overweight and obese Han adults and more healthy and underweight minority adults.
115
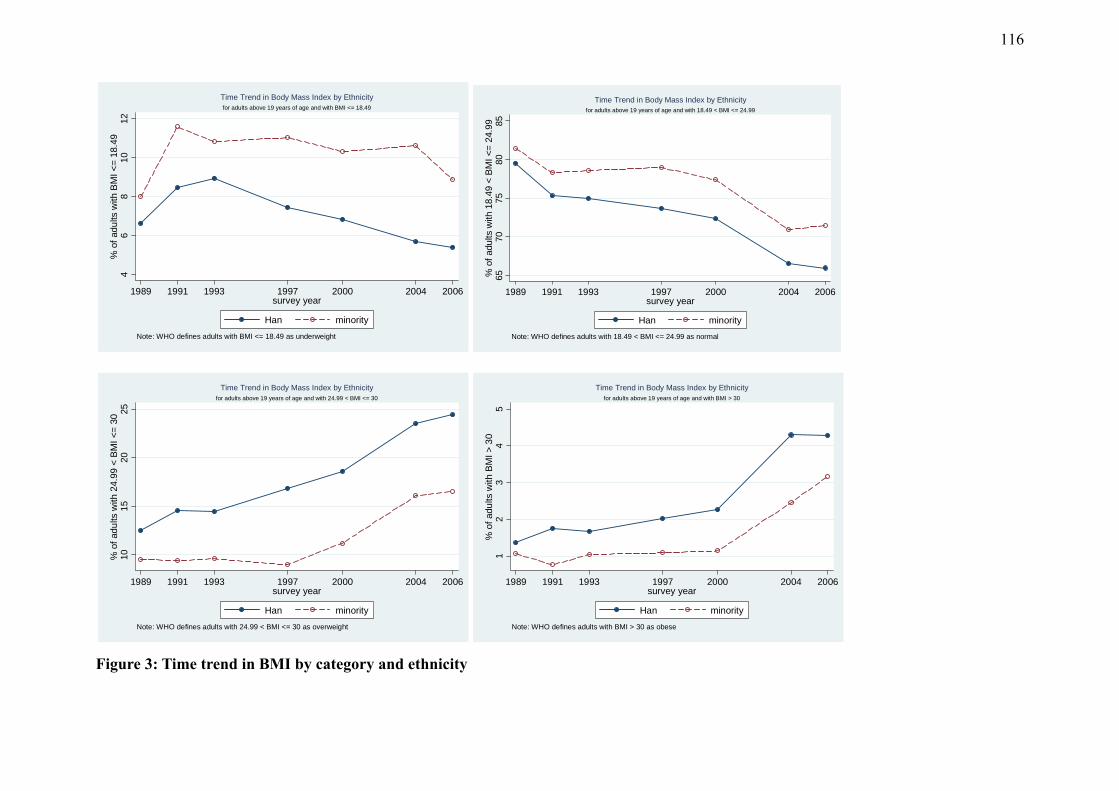
46
810
12%
of
adu
lts w
ith B
MI <
= 1
8.49
1989 1991 1993 1997 2000 2004 2006survey year
Han minority
Note: WHO defines adults with BMI <= 18.49 as underweight
for adults above 19 years of age and with BMI <= 18.49
Time Trend in Body Mass Index by Ethnicity
6570
7580
85%
of
adu
lts w
ith 1
8.49
< B
MI
<=
24.
99
1989 1991 1993 1997 2000 2004 2006survey year
Han minority
Note: WHO defines adults with 18.49 < BMI <= 24.99 as normal
for adults above 19 years of age and with 18.49 < BMI <= 24.99
Time Trend in Body Mass Index by Ethnicity
1015
2025
% o
f ad
ults
with
24.
99 <
BM
I <
= 3
0
1989 1991 1993 1997 2000 2004 2006survey year
Han minority
Note: WHO defines adults with 24.99 < BMI <= 30 as overweight
for adults above 19 years of age and with 24.99 < BMI <= 30
Time Trend in Body Mass Index by Ethnicity
12
34
5%
of
adu
lts w
ith B
MI >
30
1989 1991 1993 1997 2000 2004 2006survey year
Han minority
Note: WHO defines adults with BMI > 30 as obese
for adults above 19 years of age and with BMI > 30
Time Trend in Body Mass Index by Ethnicity
Figure 3: Time trend in BMI by category and ethnicity
116
4.2 Minority-Han inequality in socioeconomic characteristics
In addition to significant health inequality between minority and Han Chinese, we
found significant socioeconomic differences between the two groups. These
differences are shown in Tables 5.1–5.3, by age group.
Most variables listed in the tables are self-explanatory and are directly available from
the data. We constructed the “province code” variable and the “asset index” variable
to serve as proxies for a province’s economic development level and a household’s
wealth level, respectively.
We constructed the ordinal variable “province code” in two steps: first we ranked the
nine (eight before 1997) CHNS provinces by GDP per capita data available at the
National Bureau of Statistics website. We then created an ordinal variable “province
code” that takes a value of 1 to 9 for the province with the highest to the lowest GDP
per capita value, respectively. Assuming that provincial GDP per capita has a linear
relationship with a province’s economic development, our ordinal variable “province
code” would also have a linear relationship with provincial economic development
and hence serves as a good proxy for it. In China, GDP per capita data are widely
used as a proxy for provincial economic development level. As mentioned in note 3,
income data are collected and reported separately for rural and urban areas because of
the severe rural-urban dichotomy in China, and a single income per capita figure for
all residents in a province does not exist. By construction, the province code is
smaller for more-developed (higher GDP per capita) provinces and larger for less-
117
developed provinces.
The asset index (AI), believed to be a reliable predictor of poverty, serves as a good
proxy for long-term wealth with less error than not only pure income data, but also
data on expenditures (Sahn and Stifel 2003). In this study, the AI is the weighted
average of 19 assets dummies: whether the household has a high-quality roof, floor,
wall, tricycle, bicycle, motorcycle, car, radio, VCR, black-and-white television, color
television, washer, refrigerator, sewing machine, microwave, electric cooker,
telephone, computer, and camera. Weights are determined using the Principal
Component Procedure proposed by Filmer and Pritchett (2001), which in mathematics
terms are simply elements of the unit eigenvector corresponding to the largest
eigenvalue of the correlation matrix of our asset variables (all normalized by mean
and standard deviation). The weight an asset dummy receives depends on how much
information ownership of this asset conveys about ownership of the rest of the assets:
it receives a positive value, zero, or a negative value if its ownership suggests
ownership of most other assets, ownership of few other assets, or little information
about ownership of other assets, respectively.8 As a result, the AI may take any value:
a positive AI suggests that the household owns most of the 19 assets and has an
above-average level of wealth; a negative AI suggests that the household owns few of
the 19 assets and has a below-average level of wealth; and a near zero AI suggests
that a household’s wealth level is in the middle.
As shown in Table 5.1, among children younger than 6 years old, we found significant
8 Here is an example from Moser and Felton (2007, p. 4): “wealthy households are more likely to own a computer than poor ones, but radio ownership is spread evenly across the spectrum. Therefore, knowing that one household owns a computer provides us with more information about that household’s wealth than a radio does, and it receives a higher weighting.”
118
minority-Han differences in most of the listed socioeconomic characteristics.
Specifically, young minority children are worse off than young Han children in terms
of parents’ presence at home (at the 5% significance level), parents’ education,
economic development of provinces in which they reside, household’s access to flush
toilet (all at the 1% level). We also found that young minority children are worse off
than their Han counterparts in terms of household wealth, though the difference is less
significant. We did not find any significant minority-Han difference in the percentage
of female children: for both subsamples the boy-girl ratio is much greater than 105
(the natural sex ratio at birth), potentially reflecting a son preference in both Han and
minority societies. Similarly, we found no minority-Han difference in the percentage
of children living in rural areas: both subsamples contain about 26% urban residents.
The only area in which minority children are better off than Han children is access to
electricity: 97% of minority households with young children in the analysis sample
enjoyed access to electricity, compared with 92% for their Han counterparts.
Table 5.2 shows that minority-Han inequalities in socioeconomic characteristics also
existed among school-age children and adolescents from 6 to 18.99 years: compared
with their Han counterparts, minority people aged between 6 to 18.99 years are
significantly worse off in terms of parents’ presence at home (at the 5% significance
level), parental education, economic development level of the provinces in which they
reside, household wealth, sanitation including access to free water, treated water, and
flush toilet, and percentage of urban residents (all at the 1% level). Little difference in
access to electricity is found between minority and Han households having children in
this age group.
119
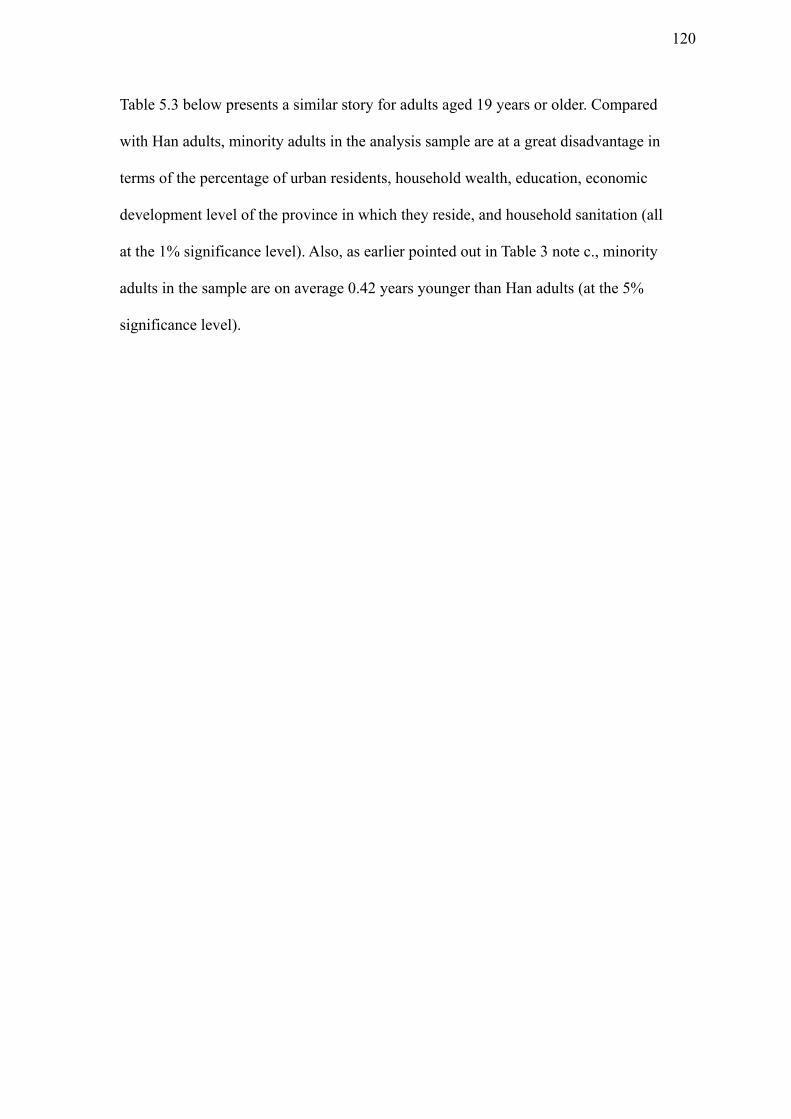
Table 5.3 below presents a similar story for adults aged 19 years or older. Compared
with Han adults, minority adults in the analysis sample are at a great disadvantage in
terms of the percentage of urban residents, household wealth, education, economic
development level of the province in which they reside, and household sanitation (all
at the 1% significance level). Also, as earlier pointed out in Table 3 note c., minority
adults in the sample are on average 0.42 years younger than Han adults (at the 5%
significance level).
120
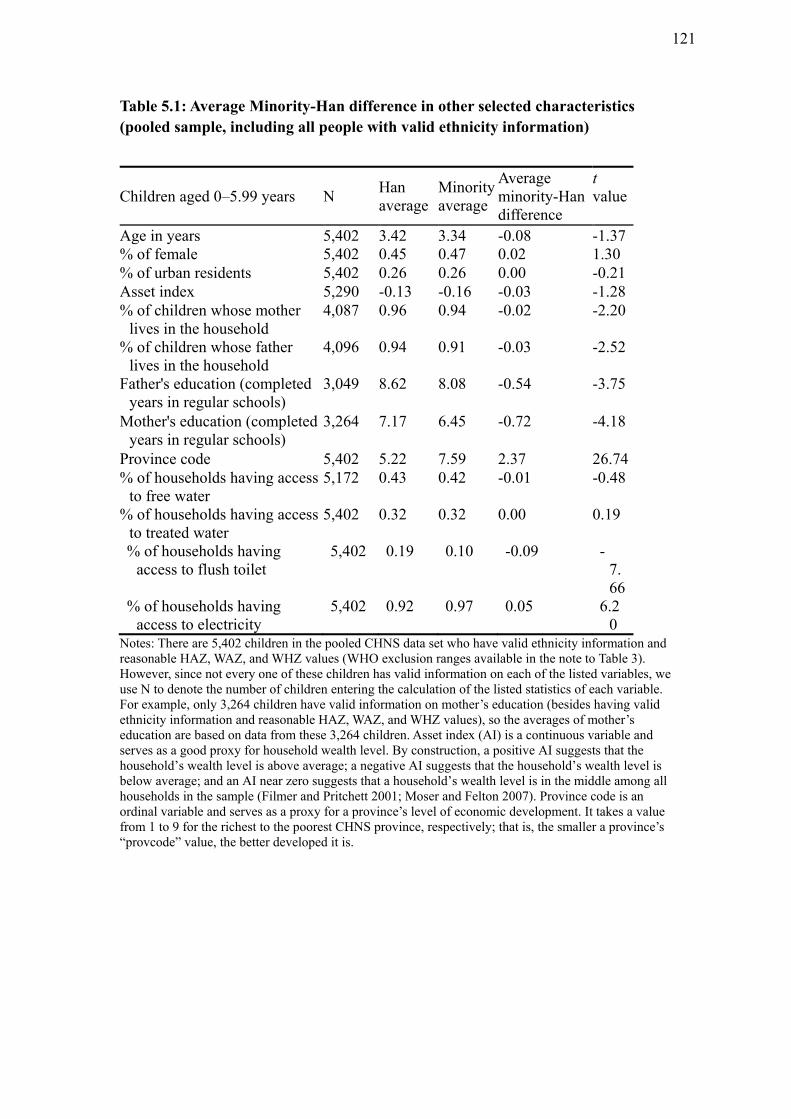
Table 5.1: Average Minority-Han difference in other selected characteristics (pooled sample, including all people with valid ethnicity information)
Notes: There are 5,402 children in the pooled CHNS data set who have valid ethnicity information and reasonable HAZ, WAZ, and WHZ values (WHO exclusion ranges available in the note to Table 3). However, since not every one of these children has valid information on each of the listed variables, we use N to denote the number of children entering the calculation of the listed statistics of each variable. For example, only 3,264 children have valid information on mother’s education (besides having valid ethnicity information and reasonable HAZ, WAZ, and WHZ values), so the averages of mother’s education are based on data from these 3,264 children. Asset index (AI) is a continuous variable and serves as a good proxy for household wealth level. By construction, a positive AI suggests that the household’s wealth level is above average; a negative AI suggests that the household’s wealth level is below average; and an AI near zero suggests that a household’s wealth level is in the middle among all households in the sample (Filmer and Pritchett 2001; Moser and Felton 2007). Province code is an ordinal variable and serves as a proxy for a province’s level of economic development. It takes a value from 1 to 9 for the richest to the poorest CHNS province, respectively; that is, the smaller a province’s “provcode” value, the better developed it is.
Children aged 0–5.99 years N Han average
Minority average
Average minority-Han difference
t value
Age in years 5,402 3.42 3.34 -0.08 -1.37 % of female 5,402 0.45 0.47 0.02 1.30 % of urban residents 5,402 0.26 0.26 0.00 -0.21 Asset index 5,290 -0.13 -0.16 -0.03 -1.28 % of children whose mother
lives in the household 4,087 0.96 0.94 -0.02 -2.20
% of children whose father lives in the household
4,096 0.94 0.91 -0.03 -2.52
Father's education (completed years in regular schools)
3,049 8.62 8.08 -0.54 -3.75
Mother's education (completed years in regular schools)
3,264 7.17 6.45 -0.72 -4.18
Province code 5,402 5.22 7.59 2.37 26.74 % of households having access
to free water 5,172 0.43 0.42 -0.01 -0.48
% of households having access to treated water
5,402 0.32 0.32 0.00 0.19
% of households having access to flush toilet
5,402 0.19 0.10 -0.09 -7.66
% of households having access to electricity
5,402 0.92 0.97 0.05 6.20
121
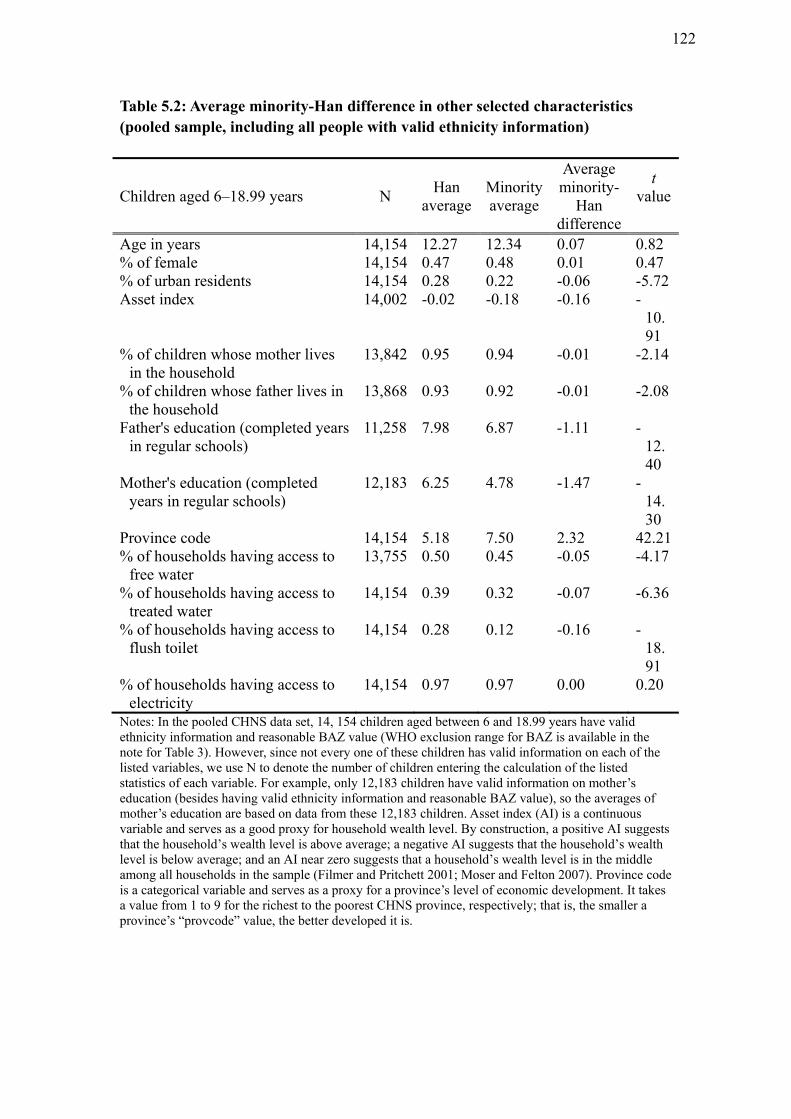
Table 5.2: Average minority-Han difference in other selected characteristics (pooled sample, including all people with valid ethnicity information)
Children aged 6–18.99 years N Han
averageMinorityaverage
Average minority-
Han difference
t value
Age in years 14,154 12.27 12.34 0.07 0.82 % of female 14,154 0.47 0.48 0.01 0.47 % of urban residents 14,154 0.28 0.22 -0.06 -5.72 Asset index 14,002 -0.02 -0.18 -0.16 -
10.91
% of children whose mother lives in the household
13,842 0.95 0.94 -0.01 -2.14
% of children whose father lives in the household
13,868 0.93 0.92 -0.01 -2.08
Father's education (completed years in regular schools)
11,258 7.98 6.87 -1.11 -12.40
Mother's education (completed years in regular schools)
12,183 6.25 4.78 -1.47 -14.30
Province code 14,154 5.18 7.50 2.32 42.21% of households having access to
free water 13,755 0.50 0.45 -0.05 -4.17
% of households having access to treated water
14,154 0.39 0.32 -0.07 -6.36
% of households having access to flush toilet
14,154 0.28 0.12 -0.16 -18.91
% of households having access to electricity
14,154 0.97 0.97 0.00 0.20
Notes: In the pooled CHNS data set, 14, 154 children aged between 6 and 18.99 years have valid ethnicity information and reasonable BAZ value (WHO exclusion range for BAZ is available in the note for Table 3). However, since not every one of these children has valid information on each of the listed variables, we use N to denote the number of children entering the calculation of the listed statistics of each variable. For example, only 12,183 children have valid information on mother’s education (besides having valid ethnicity information and reasonable BAZ value), so the averages of mother’s education are based on data from these 12,183 children. Asset index (AI) is a continuous variable and serves as a good proxy for household wealth level. By construction, a positive AI suggests that the household’s wealth level is above average; a negative AI suggests that the household’s wealth level is below average; and an AI near zero suggests that a household’s wealth level is in the middle among all households in the sample (Filmer and Pritchett 2001; Moser and Felton 2007). Province code is a categorical variable and serves as a proxy for a province’s level of economic development. It takes a value from 1 to 9 for the richest to the poorest CHNS province, respectively; that is, the smaller a province’s “provcode” value, the better developed it is.
122
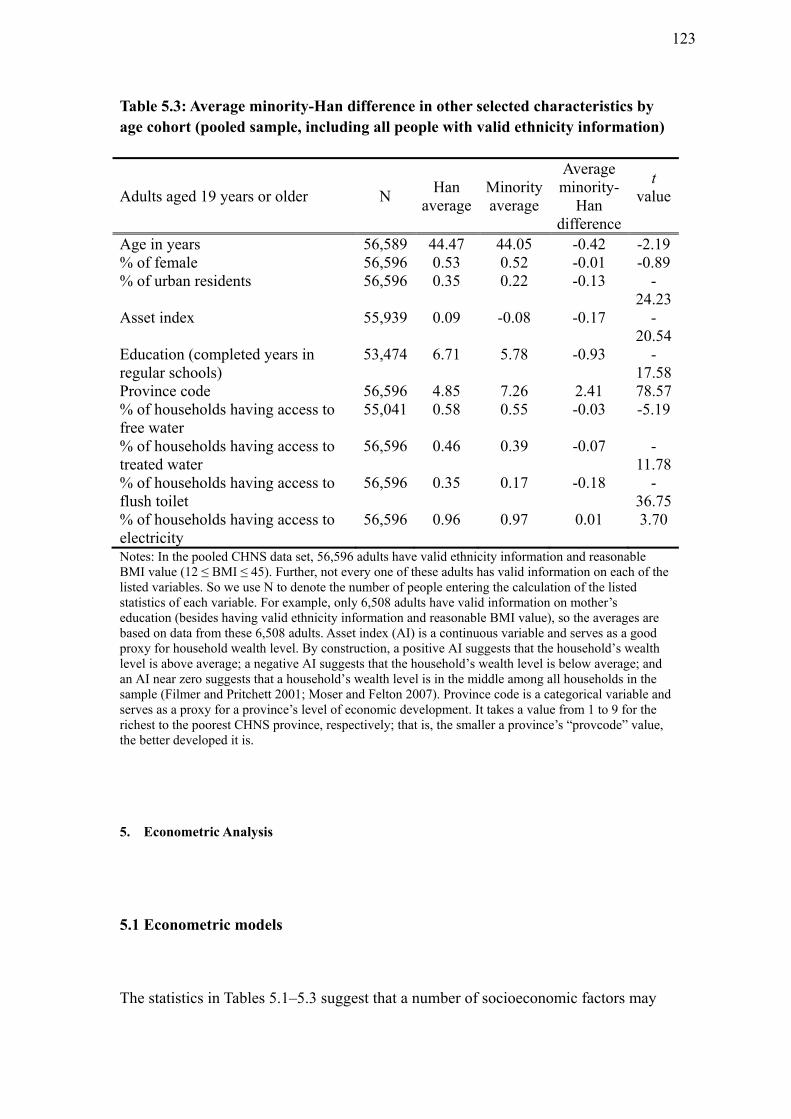
Table 5.3: Average minority-Han difference in other selected characteristics by age cohort (pooled sample, including all people with valid ethnicity information)
Adults aged 19 years or older N Han
averageMinority average
Average minority-
Han difference
t value
Age in years 56,589 44.47 44.05 -0.42 -2.19 % of female 56,596 0.53 0.52 -0.01 -0.89 % of urban residents 56,596 0.35 0.22 -0.13 -
24.23Asset index 55,939 0.09 -0.08 -0.17 -
20.54Education (completed years in regular schools)
53,474 6.71 5.78 -0.93 -17.58
Province code 56,596 4.85 7.26 2.41 78.57% of households having access to free water
55,041 0.58 0.55 -0.03 -5.19
% of households having access to treated water
56,596 0.46 0.39 -0.07 -11.78
% of households having access to flush toilet
56,596 0.35 0.17 -0.18 -36.75
% of households having access to electricity
56,596 0.96 0.97 0.01 3.70
Notes: In the pooled CHNS data set, 56,596 adults have valid ethnicity information and reasonable BMI value (12 ≤ BMI ≤ 45). Further, not every one of these adults has valid information on each of the listed variables. So we use N to denote the number of people entering the calculation of the listed statistics of each variable. For example, only 6,508 adults have valid information on mother’s education (besides having valid ethnicity information and reasonable BMI value), so the averages are based on data from these 6,508 adults. Asset index (AI) is a continuous variable and serves as a good proxy for household wealth level. By construction, a positive AI suggests that the household’s wealth level is above average; a negative AI suggests that the household’s wealth level is below average; and an AI near zero suggests that a household’s wealth level is in the middle among all households in the sample (Filmer and Pritchett 2001; Moser and Felton 2007). Province code is a categorical variable and serves as a proxy for a province’s level of economic development. It takes a value from 1 to 9 for the richest to the poorest CHNS province, respectively; that is, the smaller a province’s “provcode” value, the better developed it is.
5. Econometric Analysis
5.1 Econometric models
The statistics in Tables 5.1–5.3 suggest that a number of socioeconomic factors may
123
contribute to the observed health inequality between minority and Han Chinese as
reported in Table 3. To better understand the association between individual health
and socioeconomic characteristics, we performed multivariate analysis.
We first considered the following OLS regression model:
In (Eq.1), Healthi is either individual i’s anthropometric z-score (HAZ, WAZ, or
WHZ if individual i is under age 6, BAZ if he or she is between 6 and 18.99 years old,
or BMI if the individual is older than 19 years old). X is a vector of individual and
household level control variables including minorityi dummy (1 if individual i is not
Han and 0 if individual i is Han); gender dummy (1 male, 0 female); age (continuous
variable, 2 decimal points, in years); province code (discrete variable taking values 1–
9 and serving as a proxy for a province’s economic development level); rural dummy
(1 rural, 0 urban); asset index (continuous variable serving as a proxy for household
wealth level); years of schooling (of parents for child and adolescent sample, and of
oneself for adult sample); access to public sanitation dummies: free water (yes/no:
1/0), treated drinking water (yes/no: 1/0), flush toilet (yes/no: 1/0), and electricity
(yes/no: 1/0); parent’s presence dummies relevant for children only: whether a child
lives in a household with mother’s presence (yes/no: 1/0), whether a child lives in a
household with father’s presence (yes/no: 1/0). We also included gender interaction
terms (Genderi×X) and ethnicity interaction terms (Minorityi×X) because coefficients
of these terms would allow us to check whether a certain explanatory variable’s
impact differs between male and female or between minority and Han.
Next we considered a province fixed-effects model. The consideration here is that
iiii XMinorityXGenderX Health Eq )×()×()1 . (
124
individuals from the same province have similar provincial background, including the
province’s economic development level; access to public sanitation; access to
qualified health care facilities, health workers, and public health education programs;
convenient public transportation; climate and agriculture that affects one’s diet; and so
on. All these variables may play a role in determining one’s health and nutrition status,
but they are largely unobserved. The province fixed-effects regression controls for
these confounders. The province fixed regression equation is the following:
In (Eq.2), the first term in parentheses is the province fixed effects (same for all
individuals within one province); λi is the individual effect (individual characteristics
may affect the outcome); and vector X includes observed covariates including
ethnicity, age, gender, location, schooling, household wealth, public sanitation, and
parental presence at home for children. Gender and minority interaction terms are
included to show whether and to what extent a certain explanatory variable’s health
effect differs by gender and by ethnicity status. Standard errors are clustered at the
provincial level. Compared with model (Eq.1), model (Eq.2) has the advantage of
eliminating bias associated with province-invariant unobservables.
5.2 Estimation results
Table 6 shows the estimated OLS coefficients and their significance level when the
outcome variable is height-for-age z-score (HAZ), weight-for-age z-score (WAZ),
weight-for-height z-score (WHZ), BMI-for-age z-score (BAZ), and body mass index
(BMI), respectively.
ipi iipipX MinorityXGenderXAHealth Eq )×()×()()2.(
125
Table 6 column (1) shows the association between the listed socioeconomic factors
and HAZ, which assesses the long-term health and nutrition status of children
younger than 6 years of age and measures their risk of frequent exposure to
unfavorable conditions such as illness or improper feeding practices. A higher HAZ is
strongly associated with more household wealth (higher asset index value), mother’s
presence at home, a better-educated mother, a child’s living in a better-developed
province (smaller value of province code), and a child’s living in a household with
access to free water, flush toilet, and electricity. On the other hand, a child is likely to
have a lower HAZ if he or she lives in a household with access to treated drinking
water. This result may occur because of tap water contamination and contamination
during water treatment, both of which are common in rural China. Estimated
coefficients of gender interaction terms (Genderi×X) are mostly insignificant,
suggesting that the height-for-age impact of most of the listed covariates does not
differ significantly between minority and Han children younger than 6 years of age.
The exceptions are province’s economic development and access to treated water. The
negative and significant coefficient of (Genderi×provcode) suggests that living in a
better-developed province (smaller “provcode” value) has a significantly larger
positive impact on male children’s height-for-age level than on that of female children.
The positive coefficient of (Minorityi×treated water) suggests that having access to
treated water has a significantly more negative impact on female children’s height-
for-age. Several estimated coefficients of minority interaction terms (Minorityi×X) are
significant (at the 5% or 10% level), suggesting that the health impact of these factors
differs significantly between minority and Han children younger than 6 years of age.
Specifically, mother’s presence at home has a significantly smaller positive impact on
126
the height-for-age of minority children than on that of Han children; both father’s
presence at home and access to treated water have a significantly less negative impact
on minority children’s height-for-age; and both living in a better-developed province
and having access to electricity benefit minority children more than they do Han
children.
Table 6 column (2) presents the association between the same set of socioeconomic
factors and WAZ, which measures the body mass of infants and preschoolers relative
to chronological age. All factors associated with a higher HAZ are also significantly
associated with a higher WAZ. Besides, ethnicity and age matter: being Han and
younger are strongly related to higher WAZ. Estimated coefficients of interaction
terms suggest the following: age has a significantly more negative impact on the
weight-for-age level of female children than on that of male children; father’s
presence at home and education both have a significantly less negative impact on the
weight-for-age level of Han children than on minority children; living in a better-
developed province and having access to electricity both benefit minority children
more than they do Han children. The significance of the constant term suggests that
part of the observed minority-Han gap in WAZ cannot be explained by the listed
factors. In fact, because of the composite nature of WAZ as discussed in Section 4 (a)
(i), it is always not easy to explain WAZ.
Table 6 column (3) presents association between socioeconomic factors and WHZ,
which reflects short-term changes in health and nutrition status of children younger
than 6 years of age. A higher WHZ is significantly associated with being younger in
age, living with father’s presence but mother’s absence at home, and living in a more-
127
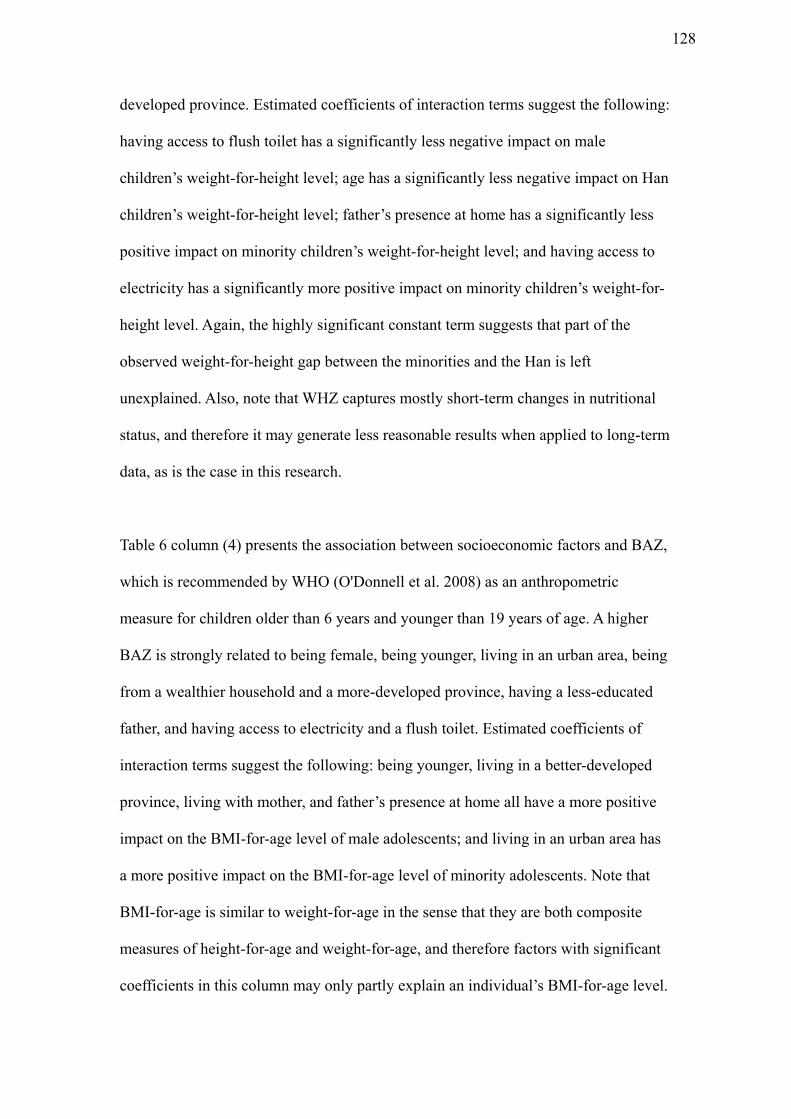
developed province. Estimated coefficients of interaction terms suggest the following:
having access to flush toilet has a significantly less negative impact on male
children’s weight-for-height level; age has a significantly less negative impact on Han
children’s weight-for-height level; father’s presence at home has a significantly less
positive impact on minority children’s weight-for-height level; and having access to
electricity has a significantly more positive impact on minority children’s weight-for-
height level. Again, the highly significant constant term suggests that part of the
observed weight-for-height gap between the minorities and the Han is left
unexplained. Also, note that WHZ captures mostly short-term changes in nutritional
status, and therefore it may generate less reasonable results when applied to long-term
data, as is the case in this research.
Table 6 column (4) presents the association between socioeconomic factors and BAZ,
which is recommended by WHO (O'Donnell et al. 2008) as an anthropometric
measure for children older than 6 years and younger than 19 years of age. A higher
BAZ is strongly related to being female, being younger, living in an urban area, being
from a wealthier household and a more-developed province, having a less-educated
father, and having access to electricity and a flush toilet. Estimated coefficients of
interaction terms suggest the following: being younger, living in a better-developed
province, living with mother, and father’s presence at home all have a more positive
impact on the BMI-for-age level of male adolescents; and living in an urban area has
a more positive impact on the BMI-for-age level of minority adolescents. Note that
BMI-for-age is similar to weight-for-age in the sense that they are both composite
measures of height-for-age and weight-for-age, and therefore factors with significant
coefficients in this column may only partly explain an individual’s BMI-for-age level.
128
Table 6 column (5) presents the association between socioeconomic factors and BMI,
which measures adult health. Higher BMI is strongly associated with being minority,
male, and older; living in a wealthier household and a more-developed province;
having access to free water, electricity, and a flush toilet; and having no access to
treated drinking water. Note that the estimated coefficient of the minority dummy
presented in this column suggests that minority adults would have a higher BMI than
Han adults, whereas the statistics we reported in Tables 3 and 4 show that Han people
on average had a higher BMI than minority people during 1989–2006. This implies
that BMI may be determined more by socioeconomic characteristics than by ethnicity.
Estimated coefficients of interaction terms suggest the following: being minority has a
less positive impact on the BMI level of male adults; being older has a less positive
impact on both the BMI level of male adults and that of minority adults; living in a
wealthier household and a more-developed province and having access to a flush
toilet all have a more positive impact on the BMI level of male adults; living in a rural
area has a less negative impact on the BMI level of minority adults; having access to
free water has a less positive impact on the BMI level of minority adults; and having
access to treated water has a more negative impact on the BMI level of Han adults.
Estimation results of the province fixed-effects regression are very similar to those of
the OLS regression in both magnitude and significance level. Therefore we chose not
to report them here. They are available upon request.
Lastly, it is worth mentioning that ethnic minorities living in the south (Guangxi and
Guizhou) and the north (Liaoning and Heilongjiang) can be very different. As
129
mentioned in Section 3 and also note 5, most northern minority groups, especially
those with a population greater than 1 million, including the Manchus, the Huis, the
Mongols, and the Koreans, have become highly Hanized. After centuries of mutual
conquest and assimilation, they resemble Hans in a number of aspects, including
language, social practices, education level, and level of economic development. In
contrast, most southern minority groups, especially those living in southwest China,
such as the Zhuang (17 million), the Miao (9 million), and the Yi (8 million), have
remained separate from Han society. They keep their own languages, and some have
their own scripts, which they use in education and publishing. Many of them follow
animalism and ancestor worship, and they have their own ceremonies and rituals,
taboos, social etiquette, medicines, and even calendars.
130
Table 6: OLS regressions on various health indicators, pooled sample
Variable Height-for-age z-score
Weight-for-age z-score
Weight-for-height z-score
BMI-for-age z-score
Body Mass Index
Minority (yes/no: 1/0) -3.346*** 2.880*** Gender (male/female: 1/0)
-3.106*** 0.461**
Age in years (2 decimal points)
-0.210*** -0.172*** -0.016*** 0.031***
Rural (yes/no: 1/0) -0.065* -0.009 Asset index (AI) 0.386*** 0.333*** 0.125*** 0.542*** Mother at home (yes/no: 1/0)
1.191*** 0.483*** -0.511*** 0.015
Father at home (yes/no: 1/0)
-2.134*** -0.312* 1.628*** 0.294
Mother’s education (years)
0.038*** 0.021**
Father’s education (years) -0.007 0.001 -0.017*** Province code -0.092*** -0.132*** -0.109*** -0.082*** -0.220*** Free water (yes/no: 1/0) 0.247** 0.129* Treated water (yes/no: 1/0)
-0.486*** -0.199* -0.281***
Flush toilet (yes/no: 1/0) 0.274** 0.176* -0.145 0.105** 0.186*** Electricity (yes/no: 1/0) 0.343* 0.329* 0.055 0.220* 0.893*** Gender × minority -0.230** Gender × age in years 0.067** -0.038*** -0.015*** Gender × AI 0.290*** Gender × mother at home 1.139* Gender × father at home 2.487*** Gender × province code -0.032* -0.036*** -0.038*** Gender × treated water 0.266* Gender × flush toilet 0.259* 0.301*** Minority × age in years 0.084* -0.016*** Minority × rural -0.435*** -0.967*** Minority × mother at home
-4.793***
Minority × father at home 4.352*** 1.774*** -1.045*** Minority × father’s education
0.059***
Minority × province code -0.078** -0.065** -0.123*** Minority × free water -0.322** Minority × treated water 0.394** 0.234* Minority × electricity 0.923** 1.228*** 0.985** Constant 0.512* 0.533* 21.577*** N 2,778 2,852 2,752 10,386 55,161 Adjusted R-squared .15 .21 .06 .076 .062 Notes: A larger asset index value indicates higher household wealth level. A smaller province code value indicates higher provincial economic development level. Asterisks indicate significance level: *, **, and *** indicate 1%, 5%, and 10% significance level, respectively.
The estimation results presented in Table 6 are based on data from all minority groups.
131
We did, however, limit the regressions to data from the southern provinces (Hunan,
Hubei, Guangxi, Guizhou) to check whether the north-south heterogeneity among
different minority groups would change the estimation results, and we obtained
similar results as presented in Table 6 (analysis results are available upon request).
6. Oaxaca Decomposition of Minority-Han Health Inequality
We have examined minority-Han differences in health and nutrition status (Tables 3
and 4) and in a number of socioeconomic factors that may contribute to the observed
health gap (Tables 5.1–5.3). Our regression analyses suggest that provincial economic
development, household wealth, sanitation, and education (of parents for children and
adolescents and of oneself for adults) are all strongly associated with the minority-
Han difference in health (Table 6). Several questions naturally follow: To what extent
is the health gap due to differences in these explanatory variables? And further, how
much of the overall gap is attributable to differences in the magnitude of the
explanatory variables (the x’s, sometimes called the explained component) rather than
difference in the effect of these variables (the β’s, sometimes called the unexplained
component)?
These questions can be answered by Oaxaca decomposition (Oaxaca 1973).
Originally devised to look at wage discrimination in the labor market, Oaxaca
decomposition is used in a variety of settings to help explain the gap between two
groups in the means of an outcome variable. In our case, the two groups are the ethnic
minority Chinese group and the Han Chinese group, and the outcome variable is any
132
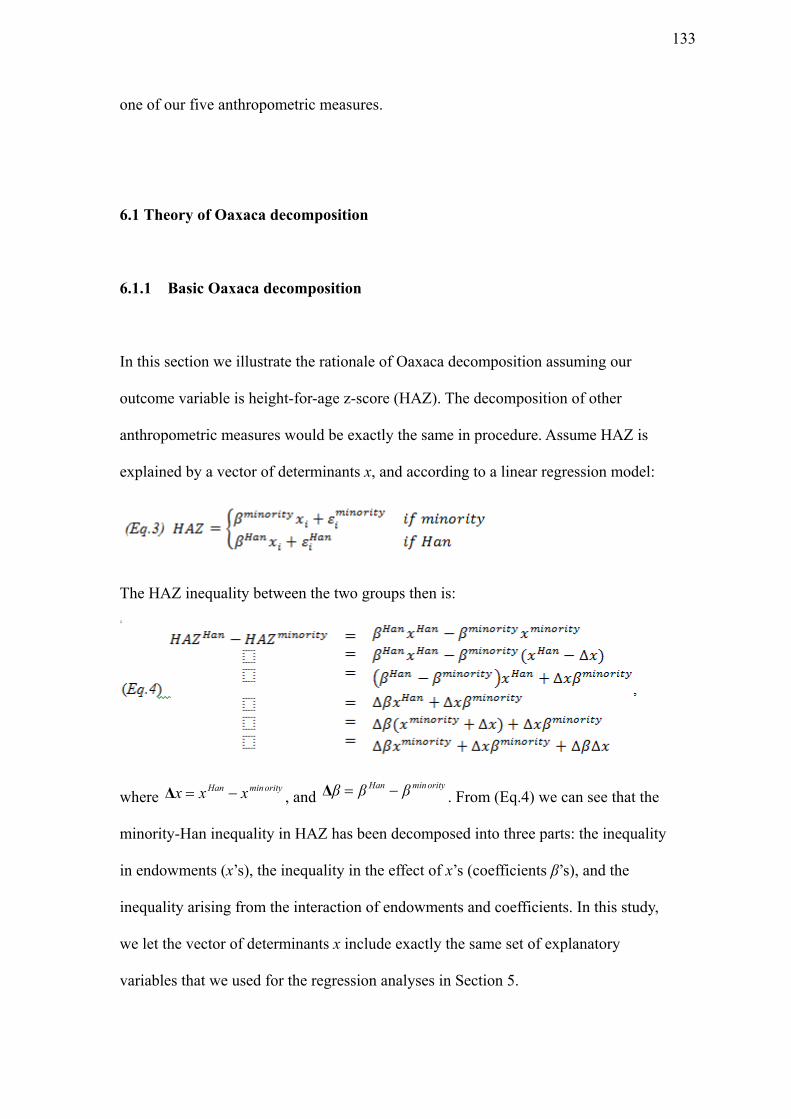
one of our five anthropometric measures.
6.1 Theory of Oaxaca decomposition
6.1.1 Basic Oaxaca decomposition
In this section we illustrate the rationale of Oaxaca decomposition assuming our
outcome variable is height-for-age z-score (HAZ). The decomposition of other
anthropometric measures would be exactly the same in procedure. Assume HAZ is
explained by a vector of determinants x, and according to a linear regression model:
The HAZ inequality between the two groups then is:
where orityminHan xxx Δ , and
orityminHan βββ Δ . From (Eq.4) we can see that the
minority-Han inequality in HAZ has been decomposed into three parts: the inequality
in endowments (x’s), the inequality in the effect of x’s (coefficients β’s), and the
inequality arising from the interaction of endowments and coefficients. In this study,
we let the vector of determinants x include exactly the same set of explanatory
variables that we used for the regression analyses in Section 5.
133
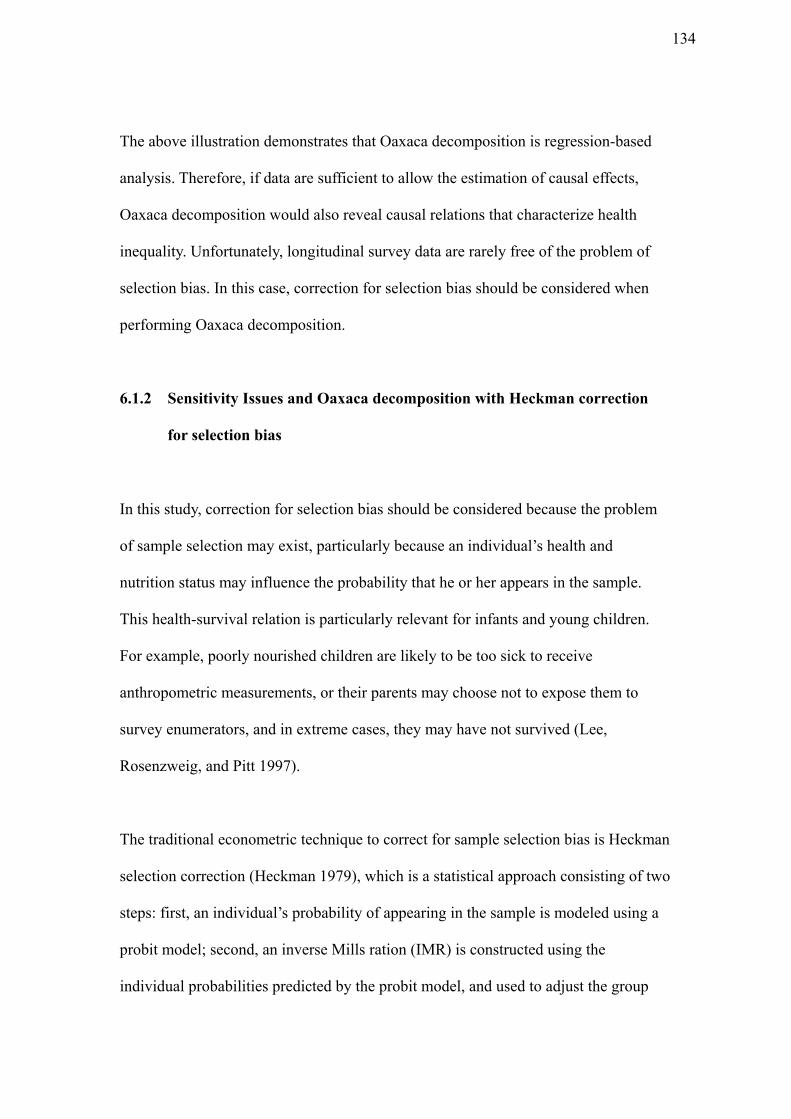
The above illustration demonstrates that Oaxaca decomposition is regression-based
analysis. Therefore, if data are sufficient to allow the estimation of causal effects,
Oaxaca decomposition would also reveal causal relations that characterize health
inequality. Unfortunately, longitudinal survey data are rarely free of the problem of
selection bias. In this case, correction for selection bias should be considered when
performing Oaxaca decomposition.
6.1.2 Sensitivity Issues and Oaxaca decomposition with Heckman correction
for selection bias
In this study, correction for selection bias should be considered because the problem
of sample selection may exist, particularly because an individual’s health and
nutrition status may influence the probability that he or her appears in the sample.
This health-survival relation is particularly relevant for infants and young children.
For example, poorly nourished children are likely to be too sick to receive
anthropometric measurements, or their parents may choose not to expose them to
survey enumerators, and in extreme cases, they may have not survived (Lee,
Rosenzweig, and Pitt 1997).
The traditional econometric technique to correct for sample selection bias is Heckman
selection correction (Heckman 1979), which is a statistical approach consisting of two
steps: first, an individual’s probability of appearing in the sample is modeled using a
probit model; second, an inverse Mills ration (IMR) is constructed using the
individual probabilities predicted by the probit model, and used to adjust the group
134
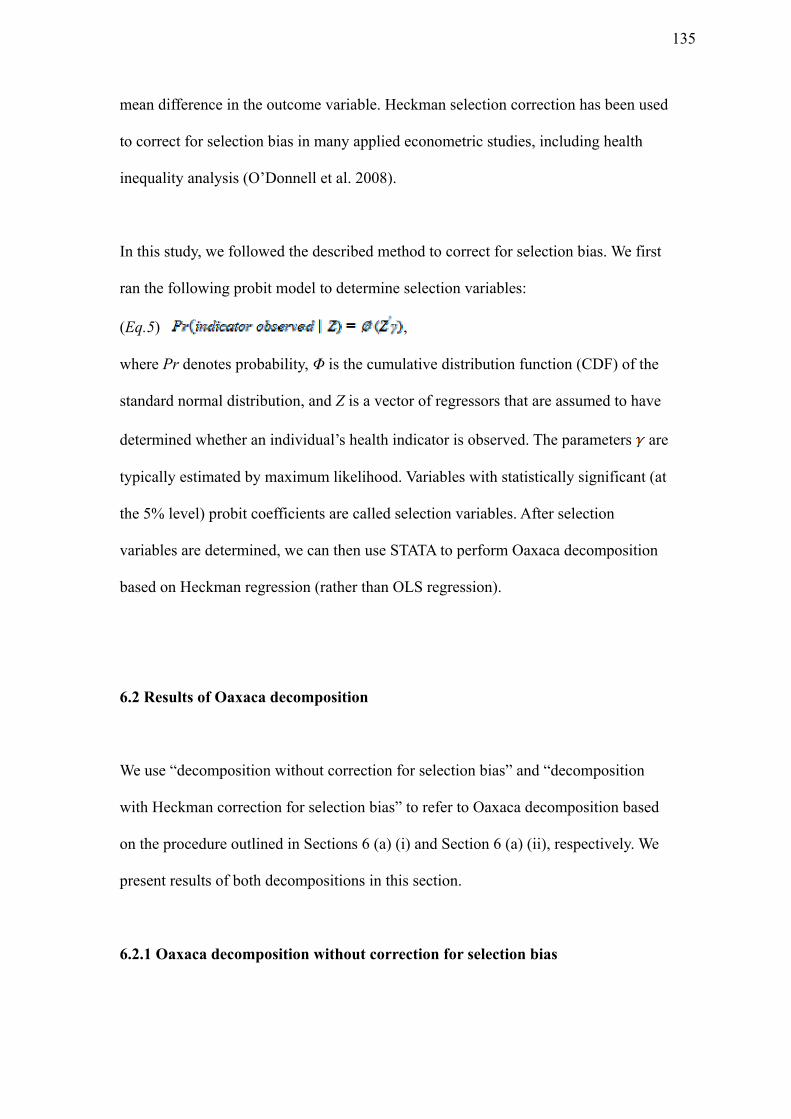
mean difference in the outcome variable. Heckman selection correction has been used
to correct for selection bias in many applied econometric studies, including health
inequality analysis (O’Donnell et al. 2008).
In this study, we followed the described method to correct for selection bias. We first
ran the following probit model to determine selection variables:
(Eq.5) ,
where Pr denotes probability, Φ is the cumulative distribution function (CDF) of the
standard normal distribution, and Z is a vector of regressors that are assumed to have
determined whether an individual’s health indicator is observed. The parameters are
typically estimated by maximum likelihood. Variables with statistically significant (at
the 5% level) probit coefficients are called selection variables. After selection
variables are determined, we can then use STATA to perform Oaxaca decomposition
based on Heckman regression (rather than OLS regression).
6.2 Results of Oaxaca decomposition
We use “decomposition without correction for selection bias” and “decomposition
with Heckman correction for selection bias” to refer to Oaxaca decomposition based
on the procedure outlined in Sections 6 (a) (i) and Section 6 (a) (ii), respectively. We
present results of both decompositions in this section.
6.2.1 Oaxaca decomposition without correction for selection bias
135
We first ran an F-test to see whether the two groups of coefficients differ
systematically, which is necessary for the Oaxaca decomposition to make sense. As
the p-value returned is 0.0214, we continued with the Oaxaca decomposition. Results
are reported in Table 7.1.
Overall minority-Han differences in each of our five anthropometric indicators
(indicating the health and nutrition status of different age groups) are explained
largely by the differences in endowments (upper panel of Table 7.1). For each age
group, health difference in endowments is largely explained by provincial economic
development (lower panel of Table 7.1). For example, the overall difference in HAZ
between the Han and minority children in the analysis sample is predicted (from the
linear regression model in Eq.4) to be 0.40, and it is explained largely by the
differences in endowments rather than the differences in their effects (coefficients), as
the total difference due to the endowment gap is 0.48, whereas the total difference due
to the effect gap is only 0. 07. Further, the total endowment gap of 0.48 is all
explained by the gap in provincial economic development, which is also 0.48.
Table 7.1 also presents the contribution to health gap in the effect of each endowment
(column C) and health gap arising from the interaction between each endowment and
its effects (column EC), but their contribution to the overall gap is minor compared
with that of endowments. For example, the total HAZ difference arising from the
interaction of endowments and their effects is only -0.16, and it actually favors the
minority group.
136
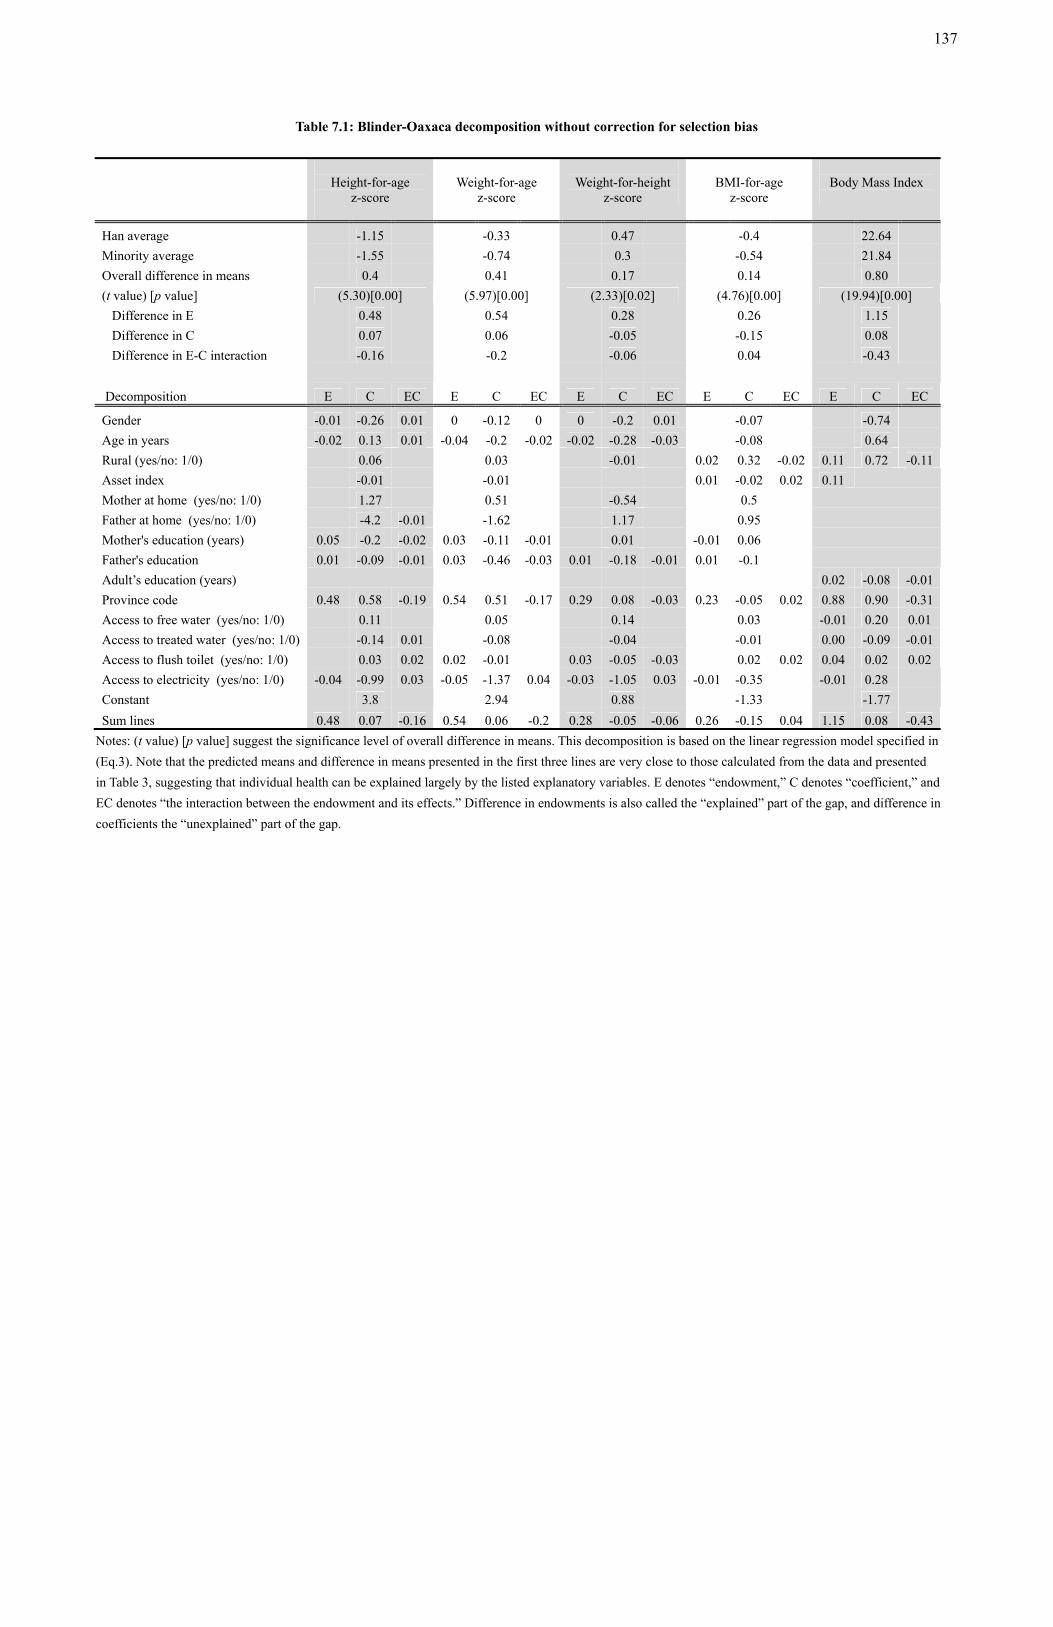
Table 7.1: Blinder-Oaxaca decomposition without correction for selection bias
Height-for-age
z-score
Weight-for-age
z-score
Weight-for-height
z-score
BMI-for-age
z-score
Body Mass Index
Han average -1.15 -0.33 0.47 -0.4 22.64
Minority average -1.55 -0.74 0.3 -0.54 21.84
Overall difference in means 0.4 0.41 0.17 0.14 0.80
(t value) [p value] (5.30)[0.00] (5.97)[0.00] (2.33)[0.02] (4.76)[0.00] (19.94)[0.00]
Difference in E 0.48 0.54 0.28 0.26 1.15
Difference in C 0.07 0.06 -0.05 -0.15 0.08
Difference in E-C interaction -0.16 -0.2 -0.06 0.04 -0.43
Decomposition E C EC E C EC E C EC E C EC E C EC
Gender -0.01 -0.26 0.01 0 -0.12 0 0 -0.2 0.01 -0.07 -0.74
Age in years -0.02 0.13 0.01 -0.04 -0.2 -0.02 -0.02 -0.28 -0.03 -0.08 0.64
Rural (yes/no: 1/0) 0.06 0.03 -0.01 0.02 0.32 -0.02 0.11 0.72 -0.11
Asset index -0.01 -0.01 0.01 -0.02 0.02 0.11
Mother at home (yes/no: 1/0) 1.27 0.51 -0.54 0.5
Father at home (yes/no: 1/0) -4.2 -0.01 -1.62 1.17 0.95
Mother's education (years) 0.05 -0.2 -0.02 0.03 -0.11 -0.01 0.01 -0.01 0.06
Father's education 0.01 -0.09 -0.01 0.03 -0.46 -0.03 0.01 -0.18 -0.01 0.01 -0.1
Adult’s education (years) 0.02 -0.08 -0.01
Province code 0.48 0.58 -0.19 0.54 0.51 -0.17 0.29 0.08 -0.03 0.23 -0.05 0.02 0.88 0.90 -0.31
Access to free water (yes/no: 1/0) 0.11 0.05 0.14 0.03 -0.01 0.20 0.01
Access to treated water (yes/no: 1/0) -0.14 0.01 -0.08 -0.04 -0.01 0.00 -0.09 -0.01
Access to flush toilet (yes/no: 1/0) 0.03 0.02 0.02 -0.01 0.03 -0.05 -0.03 0.02 0.02 0.04 0.02 0.02
Access to electricity (yes/no: 1/0) -0.04 -0.99 0.03 -0.05 -1.37 0.04 -0.03 -1.05 0.03 -0.01 -0.35 -0.01 0.28
Constant 3.8 2.94 0.88 -1.33 -1.77
Sum lines 0.48 0.07 -0.16 0.54 0.06 -0.2 0.28 -0.05 -0.06 0.26 -0.15 0.04 1.15 0.08 -0.43
Notes: (t value) [p value] suggest the significance level of overall difference in means. This decomposition is based on the linear regression model specified in
(Eq.3). Note that the predicted means and difference in means presented in the first three lines are very close to those calculated from the data and presented
in Table 3, suggesting that individual health can be explained largely by the listed explanatory variables. E denotes “endowment,” C denotes “coefficient,” and
EC denotes “the interaction between the endowment and its effects.” Difference in endowments is also called the “explained” part of the gap, and difference in
coefficients the “unexplained” part of the gap.
137
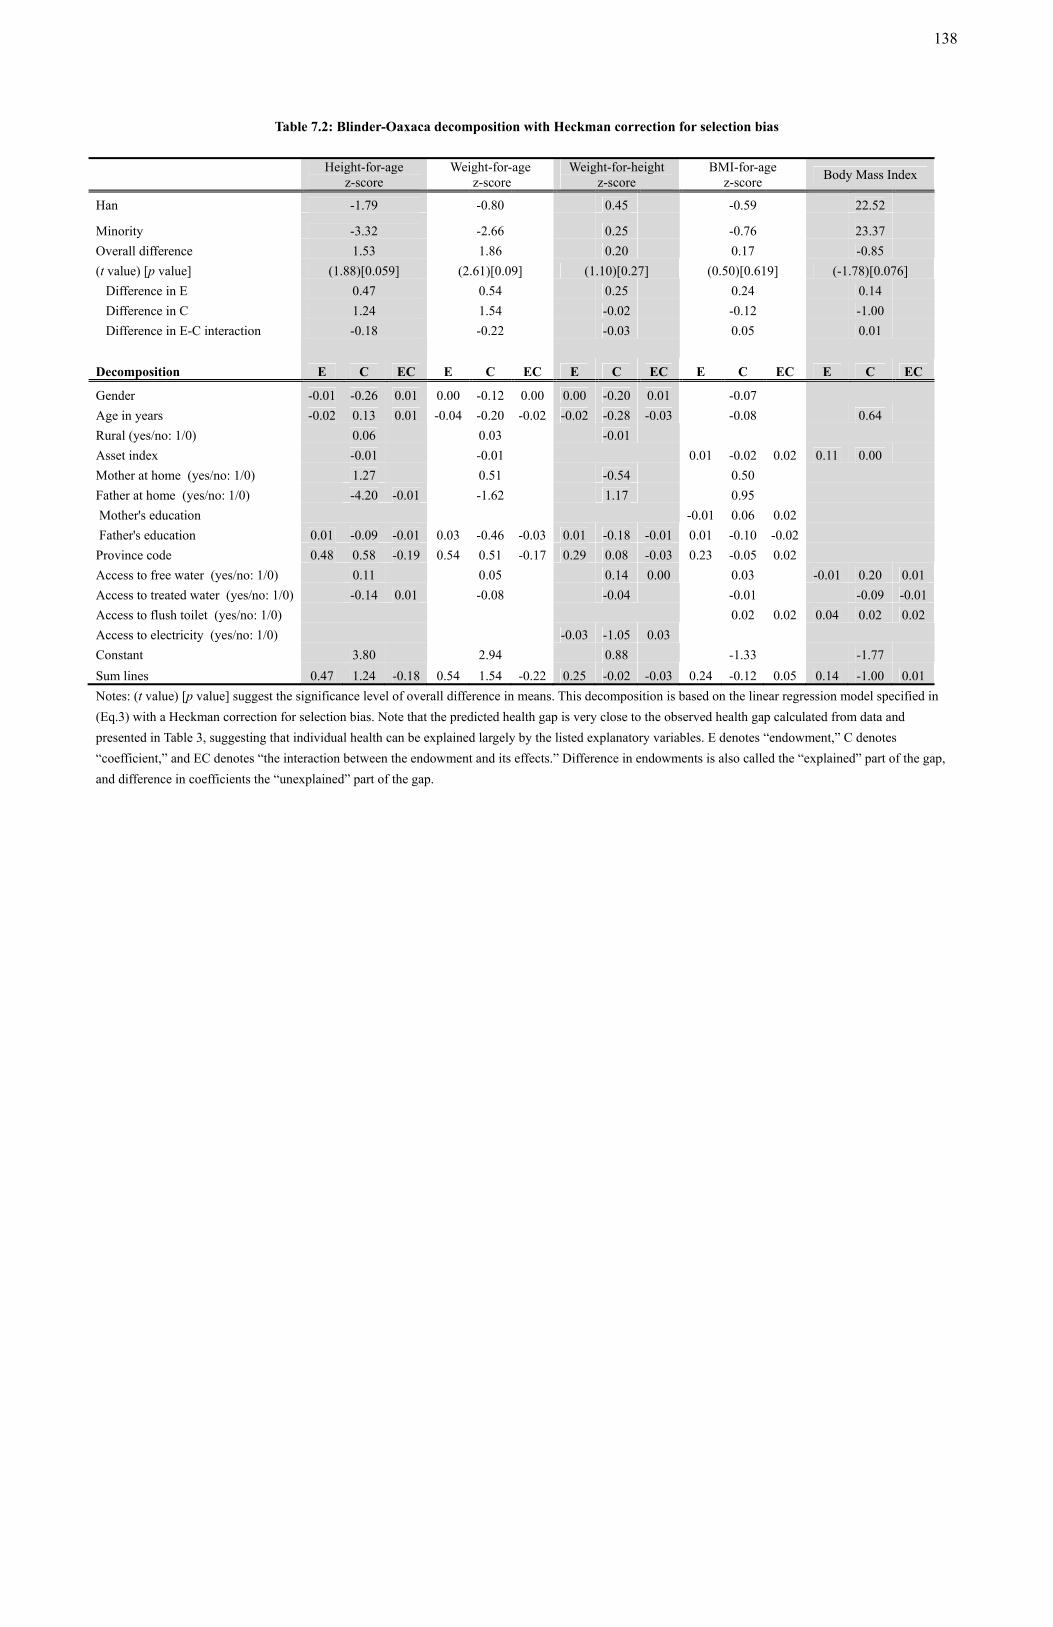
Table 7.2: Blinder-Oaxaca decomposition with Heckman correction for selection bias
Height-for-age
z-score Weight-for-age
z-score Weight-for-height
z-score BMI-for-age
z-score Body Mass Index
Han -1.79 -0.80 0.45 -0.59 22.52
Minority -3.32 -2.66 0.25 -0.76 23.37
Overall difference 1.53 1.86 0.20 0.17 -0.85
(t value) [p value] (1.88)[0.059] (2.61)[0.09] (1.10)[0.27] (0.50)[0.619] (-1.78)[0.076]
Difference in E 0.47 0.54 0.25 0.24 0.14
Difference in C 1.24 1.54 -0.02 -0.12 -1.00
Difference in E-C interaction -0.18 -0.22 -0.03 0.05 0.01
Decomposition E C EC E C EC E C EC E C EC E C EC
Gender -0.01 -0.26 0.01 0.00 -0.12 0.00 0.00 -0.20 0.01 -0.07
Age in years -0.02 0.13 0.01 -0.04 -0.20 -0.02 -0.02 -0.28 -0.03 -0.08 0.64
Rural (yes/no: 1/0) 0.06 0.03 -0.01
Asset index -0.01 -0.01 0.01 -0.02 0.02 0.11 0.00
Mother at home (yes/no: 1/0) 1.27 0.51 -0.54 0.50
Father at home (yes/no: 1/0) -4.20 -0.01 -1.62 1.17 0.95
Mother's education -0.01 0.06 0.02
Father's education 0.01 -0.09 -0.01 0.03 -0.46 -0.03 0.01 -0.18 -0.01 0.01 -0.10 -0.02
Province code 0.48 0.58 -0.19 0.54 0.51 -0.17 0.29 0.08 -0.03 0.23 -0.05 0.02
Access to free water (yes/no: 1/0) 0.11 0.05 0.14 0.00 0.03 -0.01 0.20 0.01
Access to treated water (yes/no: 1/0) -0.14 0.01 -0.08 -0.04 -0.01 -0.09 -0.01
Access to flush toilet (yes/no: 1/0) 0.02 0.02 0.04 0.02 0.02
Access to electricity (yes/no: 1/0) -0.03 -1.05 0.03
Constant 3.80 2.94 0.88 -1.33 -1.77
Sum lines 0.47 1.24 -0.18 0.54 1.54 -0.22 0.25 -0.02 -0.03 0.24 -0.12 0.05 0.14 -1.00 0.01
Notes: (t value) [p value] suggest the significance level of overall difference in means. This decomposition is based on the linear regression model specified in
(Eq.3) with a Heckman correction for selection bias. Note that the predicted health gap is very close to the observed health gap calculated from data and
presented in Table 3, suggesting that individual health can be explained largely by the listed explanatory variables. E denotes “endowment,” C denotes
“coefficient,” and EC denotes “the interaction between the endowment and its effects.” Difference in endowments is also called the “explained” part of the gap,
and difference in coefficients the “unexplained” part of the gap.
138
6.2.2 Oaxaca decomposition with correction for selection bias
Estimation results (not reported, available upon request) of the probit regression model
(Eq.5) suggested that selection on a number of variables exists.9 Based on this
information, we performed Oaxaca decomposition with correction for selection bias and
reported the decomposition results in Table 7.2.
As shown in the upper panel of Table 7.2, after selection bias is taken into account, the
health gap between minority and Han children younger than 6 years of age has become
significantly larger (compared with results in Table 7.1) and has remained statistically
significant. However, differences in effects (coefficients) rather than in endowments (x’s)
explains the bulk of the overall gap. For example, the difference in average HAZ is now
1.53 (0.40 in Table 7.1) with a p-value of 0.059 (significant at the 5.9% level), and 1.24
of which is due to the difference in coefficients. The health gap between minority and
Han adolescents also becomes slightly larger after sample selection is taken into account
(0.17 compared with 0.14 in Table 7.1), and it is still mostly explained by the difference
in endowments; however, it is no longer significant (p-value = 0.619). Lastly, the BMI
gap between Han and minority adults changed from 0.80 with a p-value of 0.00
(significant at the 1% level) in Table 7.1 to -0.85 with a p-value of 0.076 (significant at
9 Selection variables are different with respect to different outcome variables: for HAZ and WAZ, selection variables are ethnicity, mother’s education, and access to flush toilet and electricity; for WHZ, selection variables are mother’s education and access to flush toilet; for BAZ, selection variables are minority, rural, and access to electricity; for BMI, selection variables are rural, gender, minority, province economic development, and access to electricity.
139
the 7.6% level) in Table 7.2; this is explained mainly by a rather large negative difference
in effects (-1.00).
The lower panel of Table 7.2 shows that the effects of mother’s presence at home, father’s
presence at home, and provincial economic development are all highly accountable for
the health gap between minority and Han preschoolers in the sample. However, parents’
presence at home explains a much larger part of the gap than provincial economic
development. For example, the overall difference in mean HAZ is 1.24, and the
difference in the effects of mother’s presence at home, father’s presence at home, and
provincial economic development are 1.27, -4.20, and 0.58, respectively. Similarly, both
the effects of education and provincial economic development are highly accountable for
the minority-Han gap in adult health (BMI), but the former overrides the latter. For
adolescents, the overall health gap (0.24) is still explained largely by the difference in
endowments, especially provincial economic development (0.23).
To summarize this section, the Oaxaca decomposition with correction for selection bias
confirms our previous finding that minority preschoolers in the CHNS sample are
significantly worse off than their Han counterparts in health and nutrition status
(particularly height-for-age and weight-for-age). Further, it predicts a health gap larger in
magnitude than that predicted by Oaxaca decomposition with no correction for sample
selection bias; given that the latter is very close to the health gap we calculated from the
data (presented in Table 3), this may suggest that the actual health gap between minority
and Han preschoolers in China is larger than what we actually observed. However, the
140
majority of the overall gap is explained by differences in effects (β’s) rather than in
endowments (x’s), and the effect of parents’ presence at home overrides the effect of
provincial economic development.
For school-age children and adults, Oaxaca decomposition with correction for selection
bias predicts an overall gap much less significant than what we observed from the data, or
it may even have an opposite sign (for adults). That said, we should not hasten to
conclude that health inequality does not exist between minority and Han people 6 years
or older. The reason is that Heckman’s method (upon which the results in Table 7.2 are
based) has several significant drawbacks, and one is particularly relevant in our case:
Heckman’s model assumes normal distribution on the disturbances. According to Puhani
(2000), when the same explanatory variables appear in the selection equation and the
equation of interest—as is true in this case—identification will be tenuous. To generate
credible estimates in this case, we need to have at least one variable that appears in the
selection equation but not in the equation of interest, and this variable must have a
statistically significant coefficient in the selection equation. If no such variable is
available—as in this case—it would be difficult to correct for sampling selectivity. Some
more recently developed econometric techniques may help avoid the problems of the
traditional approach. One such technique is the structural-equations semi-parametric
model, which can generate consistent estimates without imposing any distributional
assumptions on disturbances (Ichimura and Lee, 1991; Lee, Rosenzweig, and Pitt 1997
Powell, 1987; Robinson, 1988). Applying these methods, however, would require data
that is not available in CHNS.
141
7. Conclusions
This research examines health and nutrition inequality between minority and Han
Chinese of different age groups during the period 1989–2006 across nine Chinese
provinces that vary substantially in economic development level, natural endowments,
pillar industries, climate and agriculture, minority population share, social infrastructure,
and so on. As far as we are aware, this is the first empirical study that measures, evaluates,
and characterizes the health and nutrition disparities between minority and Han Chinese
of different ages and in multiple years.
We divided our sample by ethnicity (Han or minority) and into three age groups: infants
and preschoolers younger than 6 years of age, school-age children and adolescents aged 6
to 18.99 years, and adults aged 19 years or older. For each age group, we found a
significant health and nutrition gap between the minority and the Han, with the minorities
suffering from poorer health and worse nutrition. Examining data by survey year, we also
found that while the average health and nutrition status of the entire sample improved, it
remained below the WHO standard for people younger than 19 years of age. Further, we
found that the health and nutrition gap between minority and Han people not only
persisted, but also widened drastically during the period under study. All these findings
are particularly relevant and highly significant for the age group of 5.99 years or younger,
whose health and nutrition status are measured by both long-term indicator that assesses
142
exposure to unfavorable chronic conditions such as frequent illness or improper feeding
practices and short-term indicators that assess exposure to acute conditions such as
starvation or severe disease (in particular, diarrhea).
Both OLS and province fixed-effects regressions suggest that in general, an individual’s
health and nutrition status is significantly associated with the economic development
level of the province in which he or she resides, household wealth level, and sanitation,
including access to flush toilet, treated water, and electricity. For children younger than 6
years of age, having a better-educated mother and her presence at home are also strongly
related to better health and nutrition status, in both the long term and the short term. In
fact, mother’s presence at home is the most important among all factors that may affect
the health and nutrition of prescholers. For school-age children and adolescents, better
health is also associated with being female, younger in age, living in an urban area, and
having a less-educated father. Gender and age also matter for the BMI of adults older
than 19 years of age, with being male and older strongly associated with higher BMI.
Oaxaca decomposition based on a linear regression model and therefore without
correction for sample selection bias suggests that the overall minority-Han difference in
health and nutrition status is explained largely by the difference in endowments,
particularly the difference in provincial economic development level. Since probit
regression suggests the existence of sample selection on some explanatory variables, we
also performed Oaxaca decomposition with Heckman correction for sample selection bias.
For infants and small children younger than 6 years of age, this second decomposition
143
predicted a health difference that remains significant (p-value = 0.059) but is much larger
than that predicted by our first Oaxaca decomposition as well as the gap we calculated
from the data. This result suggests that the actual health and nutrition difference between
minority and Han infants and preschoolers may be larger than what we observed in the
data, where selections on ethnicity, mother’s education, and sanitation exist.
This research contributes to the study of social inequality in China in several ways. First,
it documents the average health and nutrition status of the Chinese population by both
age group and ethnicity (Han or minority) during the years between 1989 and 2006.
During this period, China experienced rapid economic growth, and the average health and
nutrition status of the Chinese population also greatly improved. Literature can be found
on the measurement and assessment of the health and nutrition status of the Chinese, but
none has focused on China’s minority population.
Second, this research provides individual-level evidence of health and nutrition inequality
between minority and Han Chinese during 1989–2006. It analyzes the associations that
characterize the health disparity using regression analyses and Oaxaca decomposition
with and without correction for selection bias. China’s rapid economic growth during the
1990s and early 2000s was accompanied by equally rapid growth in income inequality
and the rural-urban dichotomy in Chinese society. Many studies have examined income
inequality in China, with a few focusing on the minority-Han income disparity
(Gustafsson and Li 2003; Gustafsson and Wei 2000; Gustafsson and Ding 2006;
Gustafsson and Ding 2008) and most focusing on the urban-rural income disparity.
144
Several studies on health disparities in China have also been published (Zimmer et al.
2010; Zimmer et al. 2007), focusing on the urban-rural difference. We found no literature
on minority-Han health disparities.
Third, this research reveals a statistically significant and robust, persistent, and growing
health and nutrition disadvantage among minority children younger than 6 years of age.
This is a new finding that has never been documented. However, it has important policy
implication: if this health gap is left unattended, in the coming decades China’s minority
population may be less healthy and less productive than their Han counterparts and
eventually less able to escape from the poverty trap. This finding also contradicts a
relevant conclusion reported by the Chinese Ministry of Health, which says that by 2005,
“the physical development of the children seven years or younger in [nine] surveillance
cities has reached the level of their counterparts in developed countries,” and “the growth
difference between urban and rural children is being narrowed” during 1995–2005
(Report on Women and Children’s Health Development in China (2011) pp.12). In this
context, our findings about the significant, persistent, and growing health and nutrition
disadvantage facing minority infants and small children might be particularly alarming,
because it not only suggests that minority children are being left behind urban Han
children, but it may also imply that they are being left behind rural Han children—if rural
minority children in the sample the Ministry of Health used to reach its conclusion
accounts for a smaller share of the entire population of rural children, which is likely
given the small minority share in the population.
145
Overall, this study makes a meaningful addition to the research on inequality and China’s
disadvantaged population.
8. Limitations
While we have tried our best to illustrate and explain the health disparity between China’s
Han majority and minority populations from 1989 to 2006, this research is subject to
several limitations.
First, this analysis does not distinguish between minority nationalities, which vary greatly
in a number of demographic and socioeconomic aspects. The CHNS questionnaire asked
the minority interviewees to specify their nationality, but over the period of 17 years, only
1,582 Tujia, 1,969 Man, 2,494 Buyi, 2,931 Miao, and 709 other minorities were
interviewed, compared with about 80,000 Han individuals interviewed during the same
period. Further, many of these observations have missing information on a number of
household and socioeconomics factors needed for regression analysis. As a result, when
we differentiated among minority nationalities and split the minority samples by age
cohort, we ended up with sample sizes that were too small (around 100 and even less) to
give reliable estimates. We did, however, repeat our analysis, limiting it to data from
southern provinces (Guangxi, Guizhou, Hubei, and Hunan). The results were similar to
what we obtained using CHNS data from all nine provinces, and the analysis results are
available upon request.
146
Second, China has five minority autonomous regions, but the CHNS surveys included
data on only one of them (the Guangxi Zhuang minority autonomous region; the Zhuang
have a population of 17 million, making them China’s largest ethnic minority group).
Consequently, our findings may not apply to several important and large minority
populations, such as the Uygurs, the Mongols, and the Tibetans, which are the fifth,
eighth, and ninth largest minority nationalities in China, respectively.
Third, like most longitudinal surveys, the CHNS is affected by sample attrition. In our
analysis sample, approximately 25% of the sample (Han and minority together) dropped
out in the first three years of the survey, and only 25.2% of the original 1989 sample
stayed from the first survey (1989) to the final survey (2006). This represents an attrition
rate of 74.8% for the 17-year CHNS panel data (1989–2006). However, as discussed in
Section 4 (a) (ii), validity of this study does not rely on low attrition of the CHNS panel
data. Our interest here is the health and nutrition inequality and transition at the
population level, not the health and nutrition dynamics in individuals; therefore, as long
as there is no fundamental changes in the sample’s demographic and socioeconomic
characteristics, the data serve us well. To this end, the CHNS team made the following
efforts: replacement households were either those formed by members of old households
and stayed in the same areas, or those sharing similar socioeconomic backgrounds and
natural endowments with those who attrite.
147
REFERENCES
Butte, N., Garza, C., & de Onis, M. (2007). Evaluation of the feasibility of international growth standards for school-aged children and adolescents. Journal of Nutrition, 137: 153–157.
Chang, K. S. F., Lee, M. M. C., Low, W. D., Chui, S., & Chow, M. 1965. Standards of
height and weight of southern Chinese children. Far East Medical Journal, 1, 101–109.
Cheung, W. C. (2003). Narrating ethnic identities: A comparative study of education and
ethnic identity construction of a minority group. Paper presented at the meeting on Chinese Education, Chinese University of Hong Kong.
Clothey, R. (2004). Preferential policies: Expanding educational opportunities for China's
minorities. EdPitt An Online Journal from School of Education University of Pittsburgh, 1(1). http://www.pitt.edu/~edpitt/currentissueCLOTHEY.html. Last accessed on 2-17-2012.
de Onis, M., & Blössner, M. (1997). WHO Global Database on Child Growth and
Malnutrition. Program of Nutrition. Geneva: World Health Organization. http://libdoc.who.int/hq/1997/WHO_NUT_97.4.pdf. Last accessed on 2-17-2012.
de Onis, M., Onyango, A.W., Borghi, E., Siyam, A., Nishida, C., and Siekmann, J. (2007).
Development of a WHO growth reference for school-aged children and adolescents. Bulletin of the World Health Organization, 85, 660–667.
Filmer, D., & Pritchett, L. (2001). Estimating wealth effects without expenditure data–or
tears: An application to educational enrollments in states of India. Demography, 38(1), 115–132.
Fok, T., So, H., Wong, E., Ng, P., Chang, A., Lau, J., Chow, C., & Lee, W. (2003).
Updated gestational age specific birth weight, crown-heel length, and head circumference of Chinese newborns. Archives of Disease in Childhood: Fetal and Neonatal Ed, 88(3): F229–F236.
Gladney, D. C. (1991). Muslim Chinese: Ethnic nationalism in the People’s Republic.
Cambridge, Mass.: Harvard University Press. Gladney, D. C. (1999). Making Muslims in China: Education, Islamicization, and
representation. In Postiglione, G. A. (Ed.), China’s national minority education: Culture, schooling, and development (pp. 55–94). New York: Falmer Press.
148
Gladney, D. C. (2004). Dislocating China: Muslims, minorities, and other subaltern
subjects. London: Hurst & Company. Gustafsson, B., & Li, S. (2003). The ethnic minority-majority income gap in rural China
during transition. Economic Development and Cultural Change, 51, 805–822. Gustafsson, B., & Wei, Z. (2000). How and why has poverty in China changed? A study
based on microdata for 1988 and 1995. China Quarterly, 164(4), 983–1006. Gustafsson, B., & Ding, S. (2006). Villages where China's ethnic minorities live.
Discussion Paper No. 2418. Bonn: Institute for the Study of Labor. Gustafsson, B., & Ding, S. (2008). Temporary and persistent poverty among ethnic
minorities and the majority in rural China. Discussion Paper No. 3791. Bonn: Institute for the Study of Labor.
Haas, J. D., & Campirano, F. (2006). Interpopulation variation in height among children 7
to 18 years of age. Food and Nutrition Bulletin, 27 (supplement) (No. 4), S212–S223. Habicht J. P., Yarbrough C., Martorell, R., Malina, R., & Klein, R.E. (1974). Height and
weight standards for preschool children: How relevant are ethnic differences in growth potential? Lancet, 303(7858), 611-615.
Hannum, E., & Xie, Y. (1998). Ethnic stratification in Northwest China: Occupational
differences between Han Chinese and national minorities in Xinjiang, 1982–1990. Demography, 35(3), 323–333.
Hannum, E. (2002). Educational stratification by ethnicity in China: Enrollment and
attainment in the early reform years. Demography, 39 (1), 95–117. Harrell, S. (Ed.) 1995. Cultural encounters on China’s ethnic frontiers. Seattle:
University of Washington Press. Heckman, J. (1979). Sample selection bias as a specification error. Econometrica, 47(1),
153–61. Hsieh, S. (1996). On the dynamics of Tai/Dai-Lue ethnicity: An ethnohistorical analysis.
In Constable, N. (Ed.), Guest people: Hakka identity in China and abroad. Seattle: University of Washington Press.
Hui, L. L., Schooling, C. M., Cowling, B. J., Leung, S. S. L., Lam, T. H., & Leung, G. M.
(2008). Are universal standards for optimal infant growth appropriate? Evidence from a Hong Kong Chinese birth cohort. Archives of Disease in Childhood, 93(7): 561–565.
149
Ichimura, H., & Lee, L. F. (1991). Semiparametric estimation of multiple index models:
Single equation estimation. In Barnett, W. A., Powell, J., & Tauchen, G. (Eds.), Nonparametric and semiparametric methods in econometrics and statistics. New York: Cambridge University Press.
Ichimura, H. (1993). Semiparametric least squares (SLS) and weighted SLS estimation of
single-index models. Journal of Econometric, 58, 71–120. Kaup, K. P. (2002). Regionalism versus ethnicnationalism in the People’s Republic of
China. China Quarterly, No. 172: 863–884. McKhann, C. F. (1996). The Naxi and the nationalities question. In Constable, N. (Ed.),
Guest people: Hakka identity in China and abroad. Seattle: University of Washington Press.
Lee, L.F., Rosenzweig, M., & Pitt, M. (1997). The effects of improved nutrition,
sanitation, and water quality on child health in high-mortality populations. Journal of Econometrics, 77, 209–235.
Leung, S., & Davies, D. P. 1994. Infant feeding and growth of Chinese infants: Birth to 2
years. Pediatric and Perinatal Epidimeology 8(3), 301–13. Li, J., Luo, C., & de Klerk, N. (2008). Trends in infant/child mortality and life expectancy
indigenous populations in Yunnan Province, China. Australian and New Zealand Journal of Public Health, 32(3), 216–223.
Li, Y., & Tilt, B. (2007). In Search of solvency: Changing agricultural governance in an
ethnic minority autonomous region of southwest China. International Journal of Agricultural Resources, Governance, and Ecology, 6(6), 626–641.
Li, Z. (1997). China’s ethnic geography (in Chinese). Shanghai: Shanghai Education
Press. Litzinger, R. (2000). Other Chinas: The Yao and the politics of national belonging.
Durham, N.C.: Duke University Press. Liu, G. (2007). Study on life quality of ethnic minority people (in Chinese). Unpublished
doctoral dissertation, School of Public Health, Sichuan University, Chengdu, China. Lohr, K. N. (2000). Health Outcomes Methodology Symposium: Summary and
recommendations. Medical Care, 38, (9) (Supplem.II), II194-II208. Mackerras, C. (1999). Religion and the education of China’s minorities. In Postiglione, G.
(Ed.), China’s national minority education: Culture, schooling and development (pp. 23–54). New York: Falmer Press.
150
Martorell, R., & Habicht, J. P. (1985). Growth in early childhood in developing countries. In Falkner F., & Tanner J. M. (Eds.), Human growth: a comprehensive treatise. Vol 3. (2nd ed., pp. 241–262). New York: Plenum.
Ministry of Health, People’s Republic of China. (2011). Report on women and children’s
health development in China. Beijing. http://www.moh.gov.cn/publicfiles/business/cmsresources/mohfybjysqwss/cmsrsdocument/doc12910.pdf. Last accessed on 2-18-2012.
Moser, C., & Felton, A. (2007). The construction of an asset index measuring asset
accumulation in Ecuador. Chronic Poverty Research Centre Working Paper No. 87. University of Manchester.
National Bureau of Statistics of China. (2011). NBS communiqué on 2010 population
census (No 1). Beijing. http://www.stats.gov.cn/english/newsandcomingevents/t20110428_402722244.htm. Last accessed on 2-18-2012.
Nelson, K. (2005). Language policies and minority resistance in China. In Zakharia, Z.,
& Arnstein, T. (Eds.), Languages, communities, and education (pp. 25–30). New York: Society for International Education Teachers College, Columbia University.
Oaxaca, R. (1973). Male-female wage differentials in urban labor markets. International
Economic Review, 14(3), 693–709. O’Donnell, O., van Doorslaer, E., Wagstaff, A., & Lindelow, M. (2008). Explaining
differences between groups: Oaxaca decomposition (pp.147–157). In Analyzing health equity using household survey data: A guide to techniques and their implementation. Washington, D.C.: World Bank.
Park, C., & Han, J. (1990). A minority group and China’s one-child policy: The case of
the Koreans. Studies in Family Planning, 21(3), 161–170. Patrick, D. L., & Y.-P. Chiang. (2000). Health outcomes methodology: Symposium
proceedings. Medical Care, 38(9) (Supplement II), II1–II209. Postiglione, G. A. (Ed.). (1999). China’s national minority education: Culture, schooling,
and development. New York: Falmer Press. Postiglione, G. A. (Ed.). (2006). Education and social change in China: Inequality in a
market economy. New York: M. E. Sharpe. Poston, D. L., Jr., & Shu, J. (1987). The demographic and socioeconomic composition of
China’s ethnic minorities. Population and Development Review, 13(4), 703–722. Poston, D. L., Jr., Chang, C., & Hong, D. (2006). Fertility differences between the
151
majority and minority nationalities in China. Population Research and Policy Review, 25(1), 67–101.
Poston, D. L., Jr., & Micklin, M. (1993). Spatial segregation and social differentiation of
the minority nationalities from the Han majority in the People’s Republic of China. Sociological Inquiry, 63, 150–165.
Powell, J. L. (1987). Semiparametric estimation of bivariate latent variable models.
Discussion Paper No. 8704. Social Systems Research Institute, University of Wisconsin.
Puhani, P. (2000). The Heckman correction for sample selection and its critique. Journal of Economic Surveys 14(1), 53–68.
Robinson, P. M. (1988). Root-n-consistent semiparametric regression. Econometrica 56,
931–954. Sahn, D., & Stifel, D. (2003). Exploring alternative measures of welfare in the absence of
expenditure data. Review of Income and Wealth, 49(4), 463–489. Starfield, B. (1992). Child and adolescent health status measures. The Future of Children,
2(2), 25–39. Ulijaszek, S. (1994). Between-population variation in pre-adolescent growth. European
Journal of Clinical Nutrition, 48(Supplement1), 5–14. Ulijaszek, S. (2001). Ethnic differences in patterns of human growth in stature. In
Martorell, R., & Haschke, F., (Eds.), Nutrition and Growth (pp. 1–15). Nestle Nutrition Workshop Series, Pediatric Program, Volume 47. Philadelphia: Lippincott, Williams & Wilkins.
Wang, Y., & Phillion, J. (2009). Minority language policy and practice in China: The
need for multicultural education. International Journal of Multicultural Education, 11(1), 1–14.
WHO (World Health Organization) Expert Consultation. (2004). Appropriate body-mass index for Asian populations and its implications for policy and intervention strategies. Lancet, 363, 157–163.
WHO. (1997). WHOQOL: Measuring quality of life. Geneva: Division of Mental Health
and Prevention of Substance Abuse, WHO. http://www.who.int/mental_health/media/68.pdf. Last accessed on 2-20-2012.
WHO. (2005). Preventing chronic diseases: A vital investment. Geneva: World Health
Organization Press. WHO Multicentre Growth Reference Study Group. (2006). WHO child growth standards:
Length/height-for-age, weight-for-age, weight-for-length, weight-for-height and body mass index-for-age: Methods and development. Geneva: World Health Organization
152
Press. Yang, J., Qin, Q., & Li, D. (2009). Research on mental health of minority university
students in frontier (in Chinese). Journal of Yunnan Agricultural University, 3(3), 55–59.
Yi, L. (2005). Muslim narratives of schooling, social mobility, and cultural difference: A
case study in multi-ethnic northwest China. Japanese Journal of Political Science, 6(1), 1–28.
Zhou, B. F. (2002). Predictive values of body mass index and waist circumference for risk
factors of certain related diseases in Chinese adults: Study on optimal cut-off points of body mass index and waist circumference in Chinese adults. Asia Pacific Journal of Clinical Nutrition, 11 (Issue Supplement 8), s685–s693.
Zhou, M. L., & Sun, H. K. (Eds.). (2004). Language policy in the People's Republic of
China: Theory and practice since 1949. Norwell, Mass.: Kluwer Academic Press. Zimmer, Z., Kaneda, T., & Spess, L. (2007). An examination of urban versus rural
mortality in China using community and individual level data. Journal of Gerontology: Social Sciences, 62(5), 349–357.
Zimmer, Z., Wen, M., and Kaneda, T. (2010). A multi-level analysis of urban/rural and
socioeconomic differences in functional health status transition among older Chinese. Social Science and Medicine, 71(3), 559–567.
153
CHAPTER 3
INEQUALITY OF EDUCATIONAL OPPORTUNITY AND EDUCATION
INEQUALITY BETWEEN MINROITY AND HAN POPULATIONS IN CHINA
1. Introduction
China has 56 recognized ethnic groups. Besides the ethnic majority known as the Han,
there are 55 ethnic minority groups whose populations range in size from a few thousand
(the Hezhe) to about 15 million (the Zhuang). Together, ethnic minority Chinese make a
population of 114 million (No.1 Communiqué Sixth National Census 2010), which
exceeds the population size of many countries in the world.
Concentrated in the less fertile heartlands along the border areas where the economy is
less developed1 (Figure 1), ethnic minority Chinese are believed to have been at a
disadvantage in many ways compared to their Han counterparts. In addition to
documents written by journalists, field workers of various non-governmental
organizations (NGOs), and other observers, several studies based on micro data also
suggest the existence of Han-Minority inequality in various social aspects, including
representation in political leadership (Zang, 1998), occupation (Hannum and Xie, 1998),
1 China has five provincial-level Minority Autonomous Regions (MARs): Xinjiang Uyghur MAR (61% of the population are ethnic minorities) , Tibet (96.44%) , and Ningxia (32.53%) in the west of China; Inner Mongolia (16.43%) in the north; and Guangxi (38.99%) in the southwest. Other Chinese provinces with large minority populations include: Liaoning (48.72%), Jilin (34.16%), and Heilongjiang (18.18%) in the northeast; Gansu (52.71%) and Qinghai (53.42%) in the northwest; Hunan (64.76%) and Hubei (41.30%) in central China; Yunnan (51.87%), Sichuan (51.44%), and Guizhou (51.75%) in the southwest (Data obtained from 1986 Statistics Yearbook (1987), Beijing, State Statistical Bureau, p.79).
154
income (Gustaffson and Wei, 2000; Gustaffson and Li, 2003; Gustaffson and Ding 2008,
2009, 2011; Sullivan, 2011; Sato and Ding, 2012), and heath and nutrition status (Ouyang
and Pinstrup-Andersen, 2012).
Education has been documented to be an effective pathway through which individuals
with disadvantaged backgrounds can move of out poverty. Over the years, the Chinese
government has designed and implemented a series of pro-minority policies2 to promote
minority education of various forms and at different levels. Many NGO and local
government efforts are also made to bridge the education gap between the minorities and
the Hans. Despite these efforts, Han-Minority education inequality is still believed to
have widely existed. Two empirical studies also seem to support this belief (Hannum and
Xie, 1998; Hannum 2002). The notion, however, has remained largely untested,
particularly since research of Hannum et al. used either data on children at young age (7-
14 years) or data on the Uyghur population in Xinjiang, while the Uyghur Chinese
account for less than ten percent of China’s minority population, and long-standing and
fierce ethnic tensions and acute religious conflicts in Xinjiang are largely unseen in any
other minority areas in China (except perhaps Tibet).
2 Some are controversial and are criticized to be achieving equality for the minorities at the price of imposing inequality on the Han people (Ma 2006). One example is the “bonus point policy”. Each June, Chinese high school graduates take the National College Entrance Exam (NCEE), and the total score each of them receives from the exam is the only criterion determining whether he or she would be accepted by any college, and also which university (at what rank) he or she can attend. Under the “minority bonus points” policy, a minority student would receive additional points of up to 50 (the total is 750) in the NCEE simply because of his or her ethnicity background; while a Han student would not receive these “minority points”, even if he or she grows up in the same community and are taught by the same teachers. China also has policy to give bonus points to students with special skills such as piano playing or sports, but only the minority bonus points are given based on ethnicity, which is not acquired through any hard work.
155
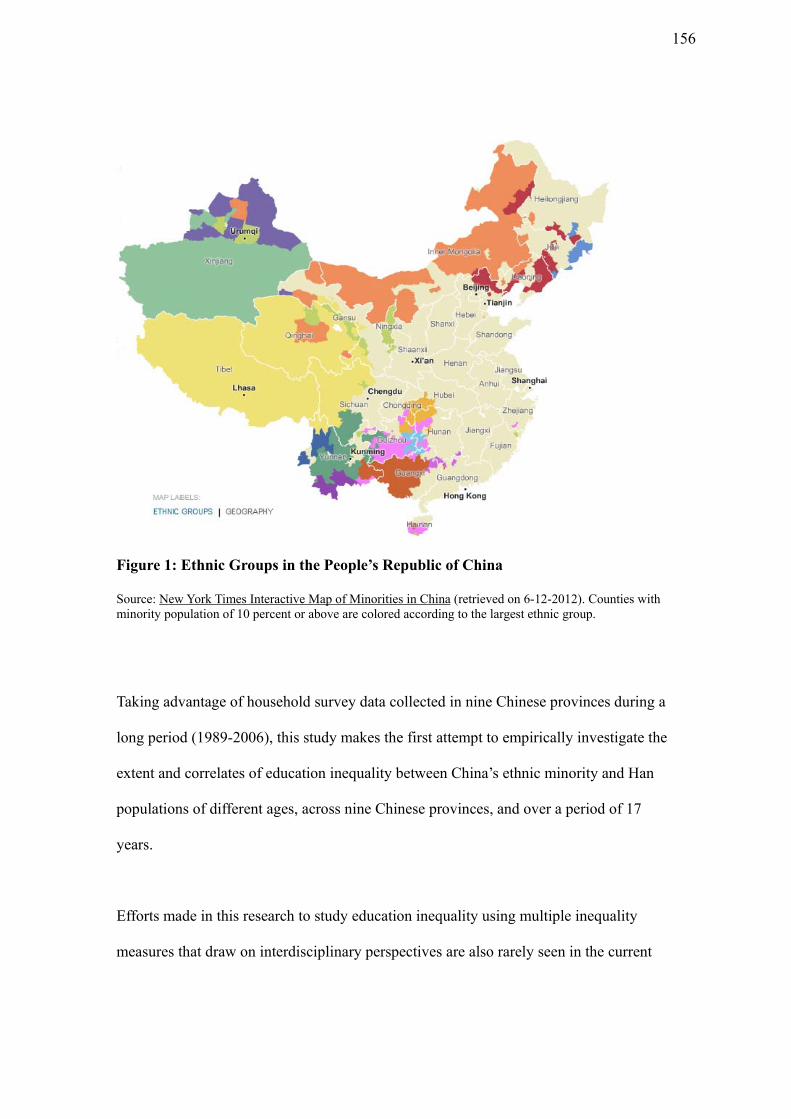
Figure 1: Ethnic Groups in the People’s Republic of China
Source: New York Times Interactive Map of Minorities in China (retrieved on 6-12-2012). Counties with minority population of 10 percent or above are colored according to the largest ethnic group.
Taking advantage of household survey data collected in nine Chinese provinces during a
long period (1989-2006), this study makes the first attempt to empirically investigate the
extent and correlates of education inequality between China’s ethnic minority and Han
populations of different ages, across nine Chinese provinces, and over a period of 17
years.
Efforts made in this research to study education inequality using multiple inequality
measures that draw on interdisciplinary perspectives are also rarely seen in the current
156
literature on education inequality in China. Besides traditional inequality indices that
measure inequalities in mean levels and distributions of education, this study also
measures inequality in educational opportunity using a dissimilarity index based on
Pearson’s chi-square statistic developed by Yalonetzky (2012), which has become
available only recently. Inequality of opportunity is a concept that has long earned its
place in the theories of social justice. According to Roemer (1998), inequality of
opportunity exists when the distribution of individual outcome is associated with
characteristics that are beyond individual control, such as ethnicity, gender, parental
education, and place of birth. Literature on inequality income opportunity has burgeoned
following the work of Roemer (1993; 1998), Checchi and Peragine (2010), Bourguignon,
Ferreira, and Menéndez (2007), and Lefranc, Pistoleni, and Trannoy (2008), who have all
made seminal contributions to the measurement of inequality of opportunity. Empirical
studies on inequality of educational opportunity, however, remained scarce. One reason,
perhaps, is that individual-level educational variables are mostly ordered, discrete
variables, while indices currently available for the measurement of inequality of
opportunity, such as Lefranc et al. (2008)’s Gini of Inequality of Opportunity (GIO),
mostly deal with continuous variables such as income and expenditure. To the best of
our knowledge, this is the first research that explores inequality of educational
opportunity in China.
The plan of this paper is as follows: Section 2 reviews literature on ethnic disparities in
China. Section 3 begins the analysis by describing the data and presenting basic sample
statistics. Section 4 explains the inequality measures to be examined, presents estimates
157
of various inequality indices, discusses their patterns, and tracks possible correlates of the
observed Han-Minority education gap using different decomposition techniques. Section
5 moves to regression analysis that further explores the associations between individual
educational outcome and socio-demographic background. Section 6 summarizes the
empirical findings and discusses the contributions of this research. Section 7 concludes
with a brief discussion of limitations and future research directions.
2. Literature Review
While literatures on social inequalities in China abound, few paid attention to China’s
ethnic minority population. The limited number of studies focused on mainly three issues:
income inequality, health and nutrition inequality, and inequality in occupation and
education. Several recent studies also try to analyze ethnic disparities in multiple welfare
measures and through the lens of urban-rural dichotomy (Gustaffson and Ding, 2011;
Sato and Ding, 2012).
Gustafsson and Li (2003) studied the majority-minority income gap in rural China using
panel data collected in 19 Chinese provinces through the Chinese Household Income
Project Survey (CHIPS) in 1988 and 1995. They found significantly negative and
widening minority-majority income gap in all but two of the 19 provinces, and concluded
that the gap may be largely explained by family size and geographical location. This
finding echoed that of a previous study by Gustaffson and Wei (2000) using the same
158
data; it is also consistent with several later studies on minority-majority income
inequality by Gustaffson et al. using cross-sectional data collected in the Ningxia Hui
Autonomous Region in 2006 (Gustafsson and Ding, 2008; Gustafsson and Ding, 2009).
Sullivan (2011) analyzed variations in family income between the Han and the minorities
using panel data collected in nine Chinese provinces from 1989 to 2006 and argued a
similar point: income inequality along ethnic lines in China may be better understood as
consequences of growing regional disparities; and Chinese minorities are worse off
because they disproportionately live in poorer, rural regions of China, instead of ethnicity
per se, though regional inequalities may increase ethnic disparities.
A recent study by Ouyang and Pinstrup-Andersen (2012) is probably, by now, the only
peer-reviewed and English-written empirical analysis devoted to minority-Han health
inequality in China. Using panel data collected in nine Chinese provinces through the
China Health and Nutrition Surveys (CHNS) from 1989 to 2006, they found significantly
negative and widening gaps between minority and Han Chinese in a set of
anthropometric indicators for people of all ages, from preschoolers to adults. They also
found that individual health and nutritional status are mostly related to household wealth
and the economic development level of the province of residence, though mother’s
presence at home is also important for children below six years of age to avoid stunting
and wasting.
Based on review of official statistics (particularly census data) and qualitative research
written in Chinese, Kwong and Xiao (1989) examined educational equity status among
159
China’s minorities, calling it “a subject [that] has never been done [analyzed] before”.
They argued that despite progress in the expansion of access to educational facilities in
minority areas during the period of 1952-1982, the Chinese government had failed to
achieve Han-minority education equity “even in the minimal sense”3. Using the 1990
census data, Rong and Shi (2001) found that illiteracy rate had dropped among both
minority and Han people above 15 years of age during 1990-2000, but minority illiteracy
rate was still about twice of the Han illiteracy rate (31% versus18%), with ethnic-Korean
Chinese being the only exception. Based on multivariate analyses using the 1982 and
1990 census data, Hannum and Xie (1998) argued that educational disadvantage faced by
ethnic minority people in Xinjiang Uyghur Autonomous Region explained much of the
observed Han-minority inequality in high-status occupational attainment observed in the
region. Analyzing data from a 1992 children’s survey and the 2000 census, Hannum
(2002) found substantial ethnic disparities in enrollment among rural 7-14 year olds and
increasing ethnic disparities in junior high school transitions during 1982-1990; and
argued that the education gap is mainly related to differences in geographic location of
residence, along with other socioeconomic disparities. In their book on poverty and
inequality among Chinese minorities, Bhalla and Qiu (2006) studied a wide range of
inequality issues using both macro-data and household survey data. Interestingly, the
3 Citing examples from Pan (1982) and Wei and Zhou (1984), Kwong and Xiao (1989) noted that while the number of schools in minority areas was already comparable with the rest of the nation by the early 1980s, statistics might be misleading because most schools were poorly-facilitated (to such an extent that many school buildings were unsafe, yet educational funding received by a xiàn in the southwest region was only 40-50 RMB yuan per school per year according to Pan(1982)); and had unqualified teachers (“in one extreme case, a grade three primary school graduate was teaching a grade four class” according to Wei and Zhou (1984)). Kwong and Xiao (1989) also noted that while school attendance increased faster among the minorities than among the Han, and the proportion of the minorities in the school population also increased, the minorities “were [still] under-represented at all levels of education throughout this period (1952-1982)”. PAN Wen (1982), “Exert all efforts in education work among the minorities”, Research in Theories of National Minorities, 2, pp. 37-41. WEI Shiyuan and ZHOU Guangde (1984), “Develop Education in the mountain areas to raise cultural level”, Research in Theories of National Minorities, 3, pp. 67-75.
160
found that within China’s five minority autonomous regions (MARs), urban minorities
are actually better educated than their Han counterparts; while the illiteracy rate among
rural minorities is still much larger than that among rural Hans.
More recently, several studies try to analyze ethnic disparities in multiple welfare
measures and through the lens of urban-rural dichotomy. Based on cross-sectional data
collected in the Ningxia Hui Autonomous Region in 20064, Gustaffson and Ding (2011)
find education and household wealth gap disfavoring the Hui in both rural and urban
Ningxia; a sizable income gap in urban Ningxia but no ethnic income gap in rural
Ningxia, where Hui are more likely to migrate to urban areas in seek of off-farm
employment than their counterpart Han respondents. Using the same data set, Sato and
Ding (2012) focused on Han-Hui difference in income returns of three endowments:
education, ethnic- and religion-related social capital, and ethnicity per se. They found that
Hui-Han income gap related to education and ethnic-related social capital favors the
Musilim Hui in rural Ningxia and was negligible in urban Ningxia; and Hui-Han income
gap related to ethnicity per se favors urban Hui and disfavors rural Hui. Sato and Ding
(2012)’s analysis confirms that ethnic dichotomy is better revealed through the lens of
urban-rural dichotomy, as is suggested in Sullivan (2011).
3. Data
4 Nationwide, China has about 1,000 million (Sixth National Census 2010) Muslim-Hui people; one fifth of them lives in Ningxia and accounts for over one third of the local population. Except that they all practice Islam, the Hui share a common language and physical appearance with the Han, which allows better investigation of the income effect of ethnicity per se In addition, like the Korean Chinese, Muslim Hui Chinese is known to be better educated compared to the other ethnic groups including the Han; and they are not concentrated in rural areas. As Sato and Ding (2012) suggested, this facilitates multifaceted comparisons cross both ethnicity and region (rural versus urban).
161
This research uses the China Health and Nutrition Survey (CHNS) data collected during
1989–2006 in nine Chinese provinces: Guangxi, Guizhou, Heilongjiang, Henan, Hubei,
Hunan, Jiangsu, Liaoning, and Shandong5. As shown in Figure 2, these nine provinces
are not evenly distributed across the country. Nevertheless, they formed a reasonably
good representation of mainland China in terms of economic development level proxied
by annual gross domestic product (GDP) per capita at provincial level: Jiangsu represents
developed provinces whose annual per capita GDP exceeds 30,000 RMB yuan; Liaoning
and Shandong represent above-average provinces whose annual GDP per capita falls
between 20,000 and 30,000 RMB yuan; Guangxi, Heilongjiang, Henan, Hubei, and
Hunan represent average provinces whose annual GDP per capita falls between 10,000
and 20,000 RMB yuan; lastly, Guizhou represents underdeveloped provinces, whose
annual GDP per capita falls below 10,000 RMB yuan6.
Table 1.1 and Table 1.2 presents sample sizes by survey year, ethnicity, and respectively,
age group and province. Since the 1989 sample has very few observations aged between
12 and 19 years, as shown in Table 1.1, it is not used in any of the following analyses
where children from this age group and this year are the subjects of study (Tables 2.1, 2.2,
and 4). Table 1.2 shows that most minority people in the sample are from Liaoning,
Hunan, Guangxi, and Guizhou; while the rest five provinces all have only a small number
5 Heilongjiang was not in the survey before 1997. Liaoning participated in all surveys except the 1997 survey. 6 These are 2006 data from the National Bureau of Statistics of China. The ranking was about the same in the 1990s and early 2000s. Province-level GDP per capita, instead of income per capita, is used as a proxy for a province’s economic development level. This is because income data are collected and reported separately for rural and urban areas due to the severe rural-urban dichotomy in China, and therefore a single per capita income figure for all residents in a province does not exist.
162
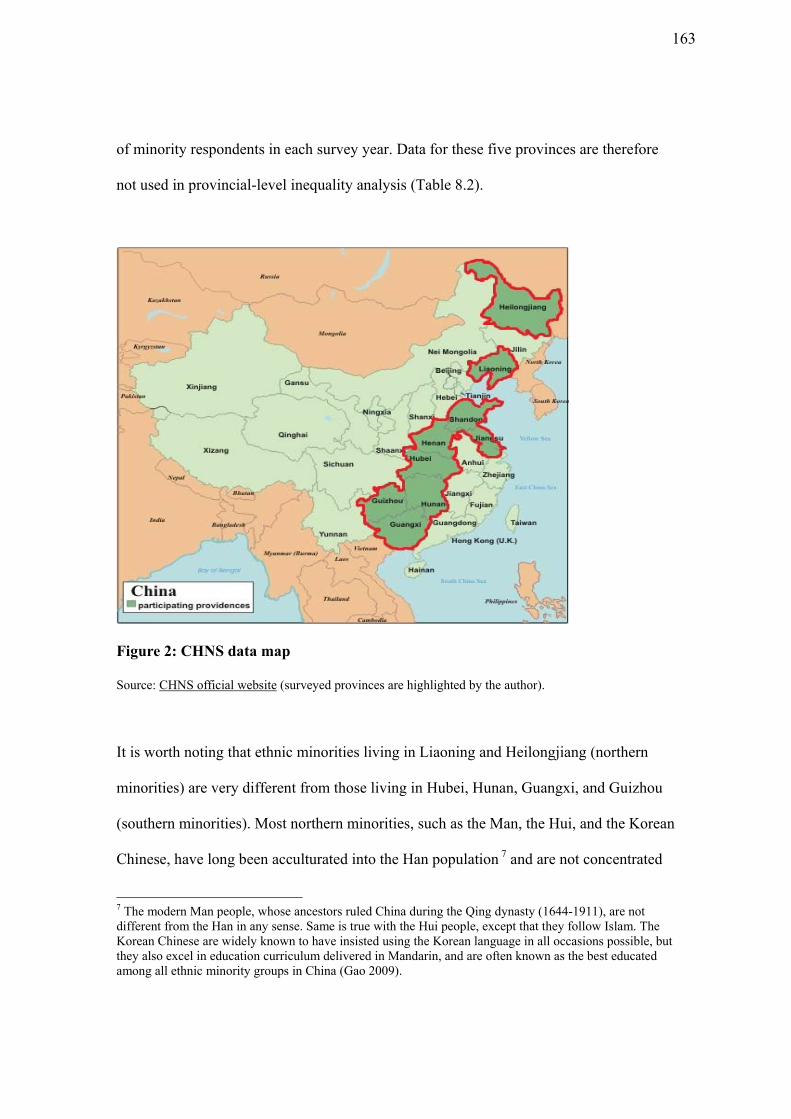
of minority respondents in each survey year. Data for these five provinces are therefore
not used in provincial-level inequality analysis (Table 8.2).
Figure 2: CHNS data map
Source: CHNS official website (surveyed provinces are highlighted by the author).
It is worth noting that ethnic minorities living in Liaoning and Heilongjiang (northern
minorities) are very different from those living in Hubei, Hunan, Guangxi, and Guizhou
(southern minorities). Most northern minorities, such as the Man, the Hui, and the Korean
Chinese, have long been acculturated into the Han population 7 and are not concentrated
7 The modern Man people, whose ancestors ruled China during the Qing dynasty (1644-1911), are not different from the Han in any sense. Same is true with the Hui people, except that they follow Islam. The Korean Chinese are widely known to have insisted using the Korean language in all occasions possible, but they also excel in education curriculum delivered in Mandarin, and are often known as the best educated among all ethnic minority groups in China (Gao 2009).
163
in rural areas. Southern minorities such as the Buyi, the Miao, the Tujia, and the Yi
Chinese, in contrast, have mostly kept their own unique cultures and customs, and are
concentrated in remote mountain areas; with only a few exceptions such as the Zhuang,
the Bai, and the Dai, who are skilled rice farmers living on fertile plains. A closer look at
the data (not reported) suggests that southern minorities account for over 90 percent of
the CHNS minority sample, while their share in the total minority population in China is
less than a quarter. Since sample attrition is found to be unrelated to ethnic background
(not reported, available upon request), over-representation of the southern minority
people in the CHNS sample is desired in this study, since comparing the highly sinicized
northern minority people with the Han would probably reveal little education inequality
and mask possible gap between the minority and the Han populations in China.
Table 2.1 and Table 2.2 present, respectively, the average years of schooling and the
proportions of people at different educational levels by age group, ethnicity, and survey
year. Statistics in these two tables suggest that regardless of age and ethnicity, both
minority and Han people received more years of schooling in 2006 than their
counterparts (same age and ethnicity) in 1991. For example, the average years of
schooling the nine-year-olds received increased from 2.73 to 3.16 years for Han children
and 2.81 years to 3.02 for minority children; and the proportion of illiterate nine-year-
olds dropped by 50% (from 8 in 1991 to 4% in 2006) for the minorities and 40% for the
Han (from 10% in 1991 to 6% in 2006); both suggesting that parents did not delay
children’s elementary school enrollment as much as they used to. That said, an education
gap disfavoring the minorities still existed during 1991-2006 in the surveyed area, and it
164
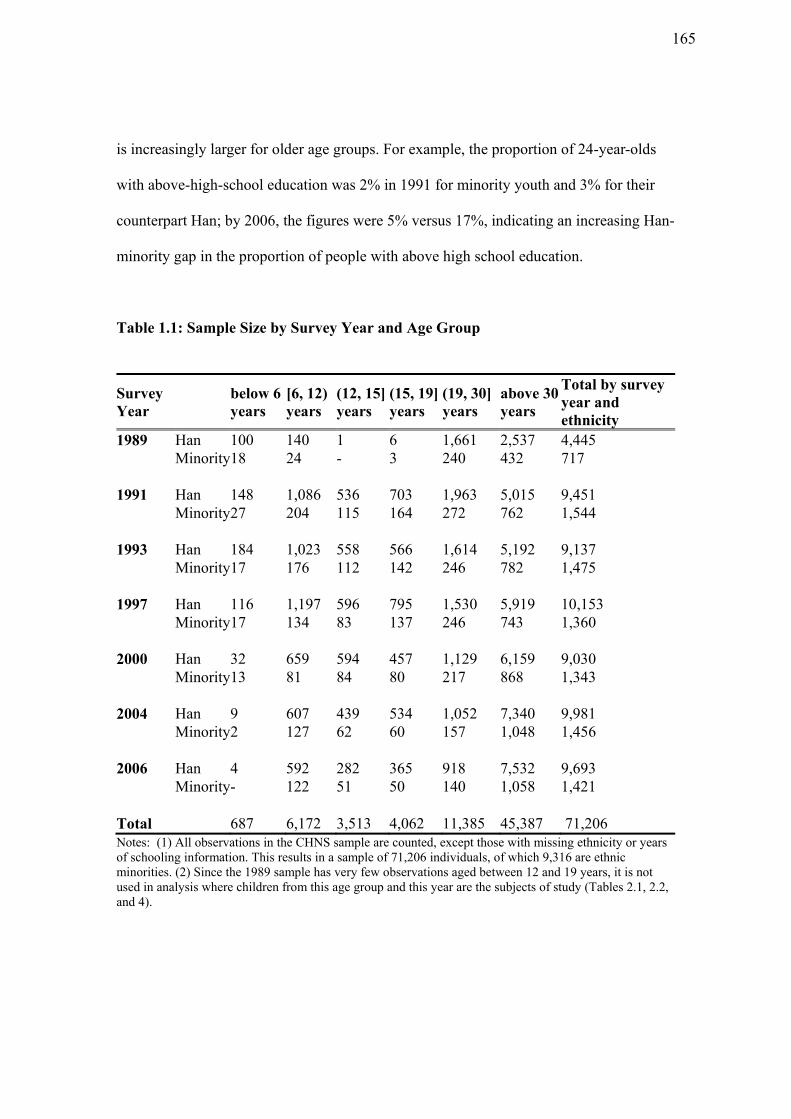
is increasingly larger for older age groups. For example, the proportion of 24-year-olds
with above-high-school education was 2% in 1991 for minority youth and 3% for their
counterpart Han; by 2006, the figures were 5% versus 17%, indicating an increasing Han-
minority gap in the proportion of people with above high school education.
Table 1.1: Sample Size by Survey Year and Age Group
Survey Year
below 6 years
[6, 12) years
(12, 15] years
(15, 19] years
(19, 30] years
above 30 years
Total by survey year and ethnicity
1989 Han 100 140 1 6 1,661 2,537 4,445 Minority 18 24 - 3 240 432 717
1991 Han 148 1,086 536 703 1,963 5,015 9,451 Minority 27 204 115 164 272 762 1,544
1993 Han 184 1,023 558 566 1,614 5,192 9,137 Minority 17 176 112 142 246 782 1,475
1997 Han 116 1,197 596 795 1,530 5,919 10,153 Minority 17 134 83 137 246 743 1,360
2000 Han 32 659 594 457 1,129 6,159 9,030 Minority 13 81 84 80 217 868 1,343
2004 Han 9 607 439 534 1,052 7,340 9,981 Minority 2 127 62 60 157 1,048 1,456
2006 Han 4 592 282 365 918 7,532 9,693 Minority - 122 51 50 140 1,058 1,421
Total 687 6,172 3,513 4,062 11,385 45,387 71,206 Notes: (1) All observations in the CHNS sample are counted, except those with missing ethnicity or years of schooling information. This results in a sample of 71,206 individuals, of which 9,316 are ethnic minorities. (2) Since the 1989 sample has very few observations aged between 12 and 19 years, it is not used in analysis where children from this age group and this year are the subjects of study (Tables 2.1, 2.2, and 4).
165
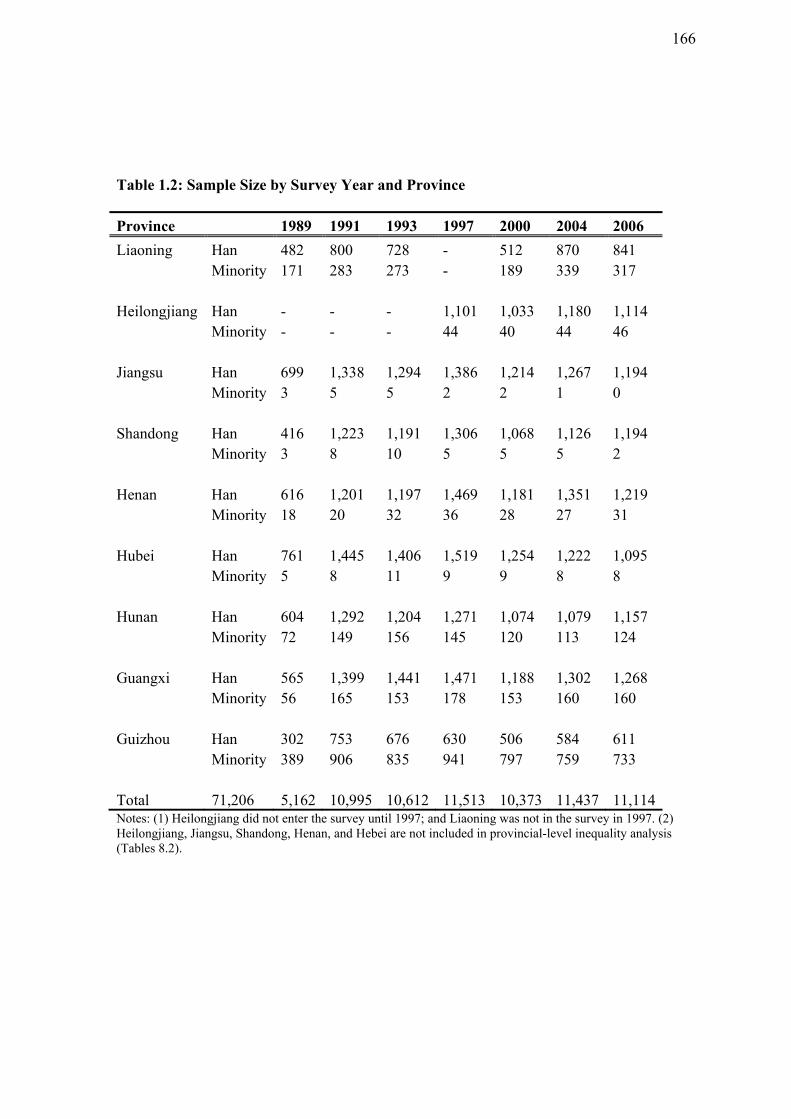
Table 1.2: Sample Size by Survey Year and Province
Province 1989 1991 1993 1997 2000 2004 2006
Liaoning Han 482 800 728 - 512 870 841 Minority 171 283 273 - 189 339 317
Heilongjiang Han - - - 1,101 1,033 1,180 1,114 Minority - - - 44 40 44 46
Jiangsu Han 699 1,338 1,294 1,386 1,214 1,267 1,194 Minority 3 5 5 2 2 1 0
Shandong Han 416 1,223 1,191 1,306 1,068 1,126 1,194 Minority 3 8 10 5 5 5 2
Henan Han 616 1,201 1,197 1,469 1,181 1,351 1,219 Minority 18 20 32 36 28 27 31
Hubei Han 761 1,445 1,406 1,519 1,254 1,222 1,095 Minority 5 8 11 9 9 8 8
Hunan Han 604 1,292 1,204 1,271 1,074 1,079 1,157 Minority 72 149 156 145 120 113 124
Guangxi Han 565 1,399 1,441 1,471 1,188 1,302 1,268 Minority 56 165 153 178 153 160 160
Guizhou Han 302 753 676 630 506 584 611 Minority 389 906 835 941 797 759 733
Total 71,206 5,162 10,995 10,612 11,513 10,373 11,437 11,114Notes: (1) Heilongjiang did not enter the survey until 1997; and Liaoning was not in the survey in 1997. (2) Heilongjiang, Jiangsu, Shandong, Henan, and Hebei are not included in provincial-level inequality analysis (Tables 8.2).
166
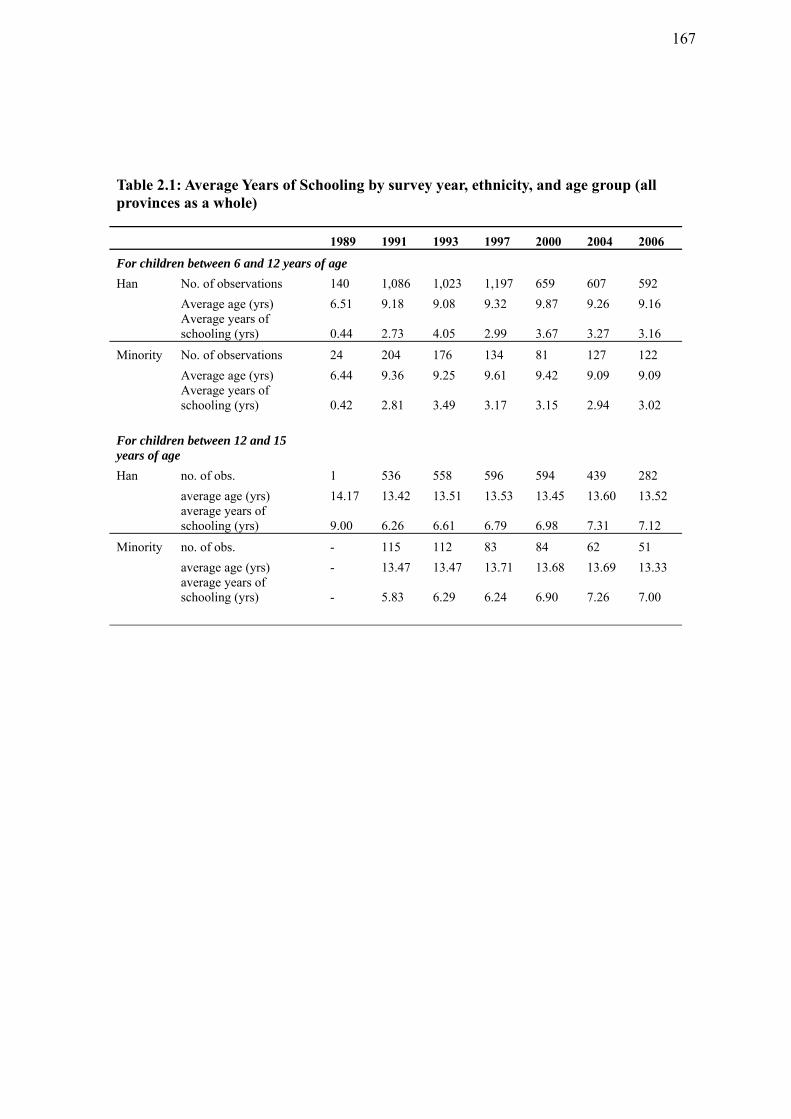
Table 2.1: Average Years of Schooling by survey year, ethnicity, and age group (all provinces as a whole)
1989 1991 1993 1997 2000 2004 2006
For children between 6 and 12 years of age
Han No. of observations 140 1,086 1,023 1,197 659 607 592
Average age (yrs) 6.51 9.18 9.08 9.32 9.87 9.26 9.16 Average years of schooling (yrs) 0.44 2.73 4.05 2.99 3.67 3.27 3.16
Minority No. of observations 24 204 176 134 81 127 122
Average age (yrs) 6.44 9.36 9.25 9.61 9.42 9.09 9.09 Average years of schooling (yrs) 0.42 2.81 3.49 3.17 3.15 2.94 3.02
For children between 12 and 15 years of age
Han no. of obs. 1 536 558 596 594 439 282
average age (yrs) 14.17 13.42 13.51 13.53 13.45 13.60 13.52 average years of schooling (yrs) 9.00 6.26 6.61 6.79 6.98 7.31 7.12
Minority no. of obs. - 115 112 83 84 62 51
average age (yrs) - 13.47 13.47 13.71 13.68 13.69 13.33 average years of schooling (yrs) - 5.83 6.29 6.24 6.90 7.26 7.00
167
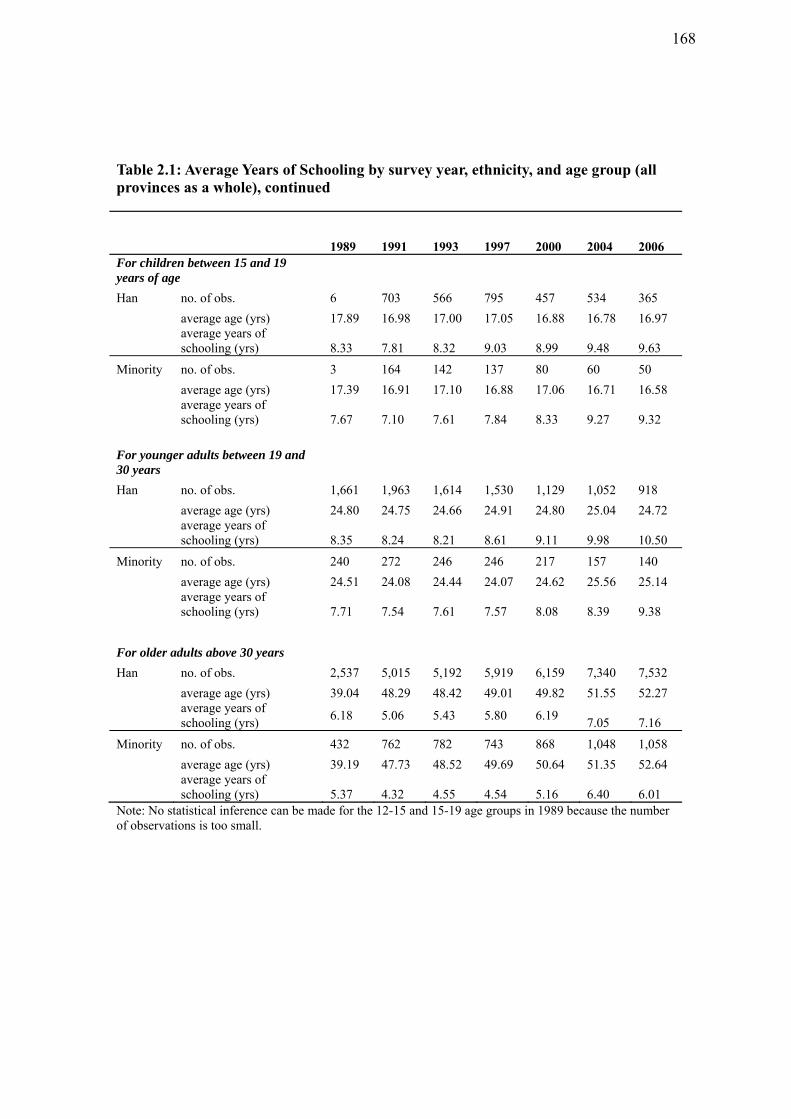
Table 2.1: Average Years of Schooling by survey year, ethnicity, and age group (all provinces as a whole), continued
1989 1991 1993 1997 2000 2004 2006 For children between 15 and 19 years of age
Han no. of obs. 6 703 566 795 457 534 365
average age (yrs) 17.89 16.98 17.00 17.05 16.88 16.78 16.97 average years of schooling (yrs) 8.33 7.81 8.32 9.03 8.99 9.48 9.63
Minority no. of obs. 3 164 142 137 80 60 50
average age (yrs) 17.39 16.91 17.10 16.88 17.06 16.71 16.58 average years of schooling (yrs) 7.67 7.10 7.61 7.84 8.33 9.27 9.32
For younger adults between 19 and 30 years
Han no. of obs. 1,661 1,963 1,614 1,530 1,129 1,052 918
average age (yrs) 24.80 24.75 24.66 24.91 24.80 25.04 24.72 average years of schooling (yrs) 8.35 8.24 8.21 8.61 9.11 9.98 10.50
Minority no. of obs. 240 272 246 246 217 157 140
average age (yrs) 24.51 24.08 24.44 24.07 24.62 25.56 25.14 average years of schooling (yrs) 7.71 7.54 7.61 7.57 8.08 8.39 9.38
For older adults above 30 years
Han no. of obs. 2,537 5,015 5,192 5,919 6,159 7,340 7,532
average age (yrs) 39.04 48.29 48.42 49.01 49.82 51.55 52.27 average years of schooling (yrs)
6.18 5.06 5.43 5.80 6.19 7.05 7.16
Minority no. of obs. 432 762 782 743 868 1,048 1,058
average age (yrs) 39.19 47.73 48.52 49.69 50.64 51.35 52.64 average years of schooling (yrs) 5.37 4.32 4.55 4.54 5.16 6.40 6.01
Note: No statistical inference can be made for the 12-15 and 15-19 age groups in 1989 because the number of observations is too small.
168
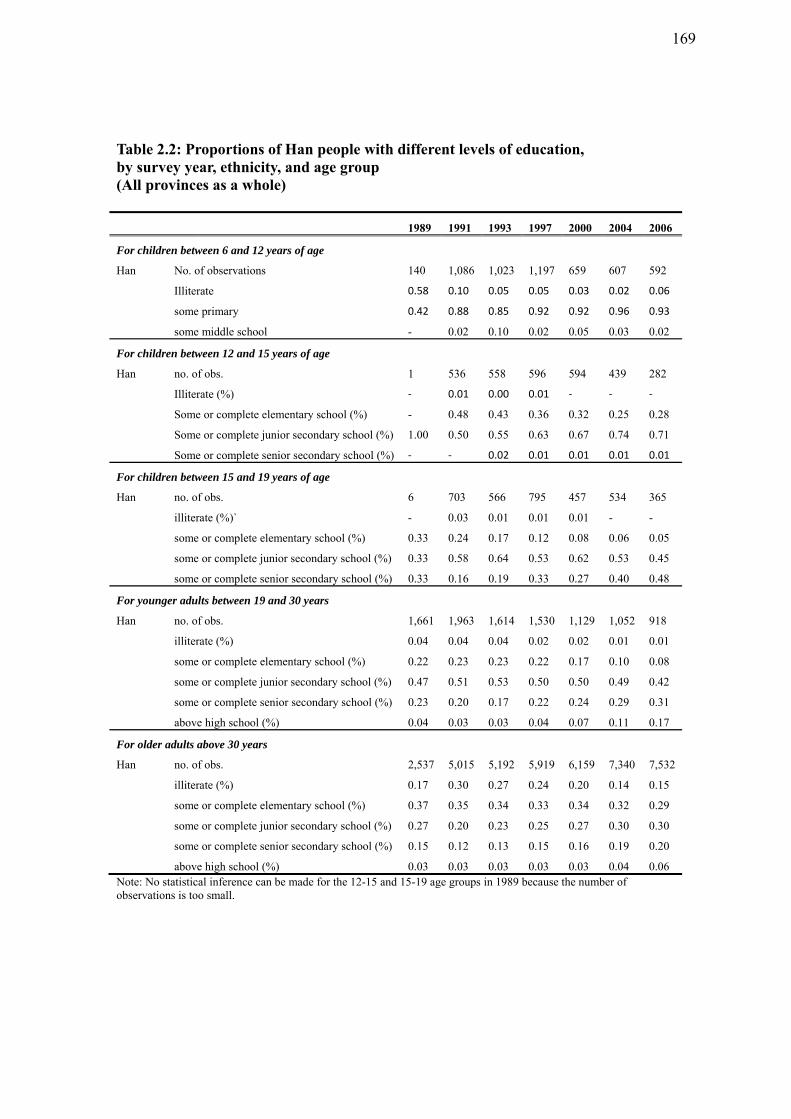
Table 2.2: Proportions of Han people with different levels of education, by survey year, ethnicity, and age group (All provinces as a whole)
1989 1991 1993 1997 2000 2004 2006
For children between 6 and 12 years of age
Han No. of observations 140 1,086 1,023 1,197 659 607 592
Illiterate 0.58 0.10 0.05 0.05 0.03 0.02 0.06
some primary 0.42 0.88 0.85 0.92 0.92 0.96 0.93
some middle school - 0.02 0.10 0.02 0.05 0.03 0.02
For children between 12 and 15 years of age
Han no. of obs. 1 536 558 596 594 439 282
Illiterate (%) ‐ 0.01 0.00 0.01 ‐ ‐ ‐
Some or complete elementary school (%) - 0.48 0.43 0.36 0.32 0.25 0.28
Some or complete junior secondary school (%) 1.00 0.50 0.55 0.63 0.67 0.74 0.71
Some or complete senior secondary school (%) ‐ ‐ 0.02 0.01 0.01 0.01 0.01
For children between 15 and 19 years of age
Han no. of obs. 6 703 566 795 457 534 365
illiterate (%)` - 0.03 0.01 0.01 0.01 - -
some or complete elementary school (%) 0.33 0.24 0.17 0.12 0.08 0.06 0.05
some or complete junior secondary school (%) 0.33 0.58 0.64 0.53 0.62 0.53 0.45
some or complete senior secondary school (%) 0.33 0.16 0.19 0.33 0.27 0.40 0.48
For younger adults between 19 and 30 years
Han no. of obs. 1,661 1,963 1,614 1,530 1,129 1,052 918
illiterate (%) 0.04 0.04 0.04 0.02 0.02 0.01 0.01
some or complete elementary school (%) 0.22 0.23 0.23 0.22 0.17 0.10 0.08
some or complete junior secondary school (%) 0.47 0.51 0.53 0.50 0.50 0.49 0.42
some or complete senior secondary school (%) 0.23 0.20 0.17 0.22 0.24 0.29 0.31
above high school (%) 0.04 0.03 0.03 0.04 0.07 0.11 0.17
For older adults above 30 years
Han no. of obs. 2,537 5,015 5,192 5,919 6,159 7,340 7,532
illiterate (%) 0.17 0.30 0.27 0.24 0.20 0.14 0.15
some or complete elementary school (%) 0.37 0.35 0.34 0.33 0.34 0.32 0.29
some or complete junior secondary school (%) 0.27 0.20 0.23 0.25 0.27 0.30 0.30
some or complete senior secondary school (%) 0.15 0.12 0.13 0.15 0.16 0.19 0.20
above high school (%) 0.03 0.03 0.03 0.03 0.03 0.04 0.06 Note: No statistical inference can be made for the 12-15 and 15-19 age groups in 1989 because the number of observations is too small.
169
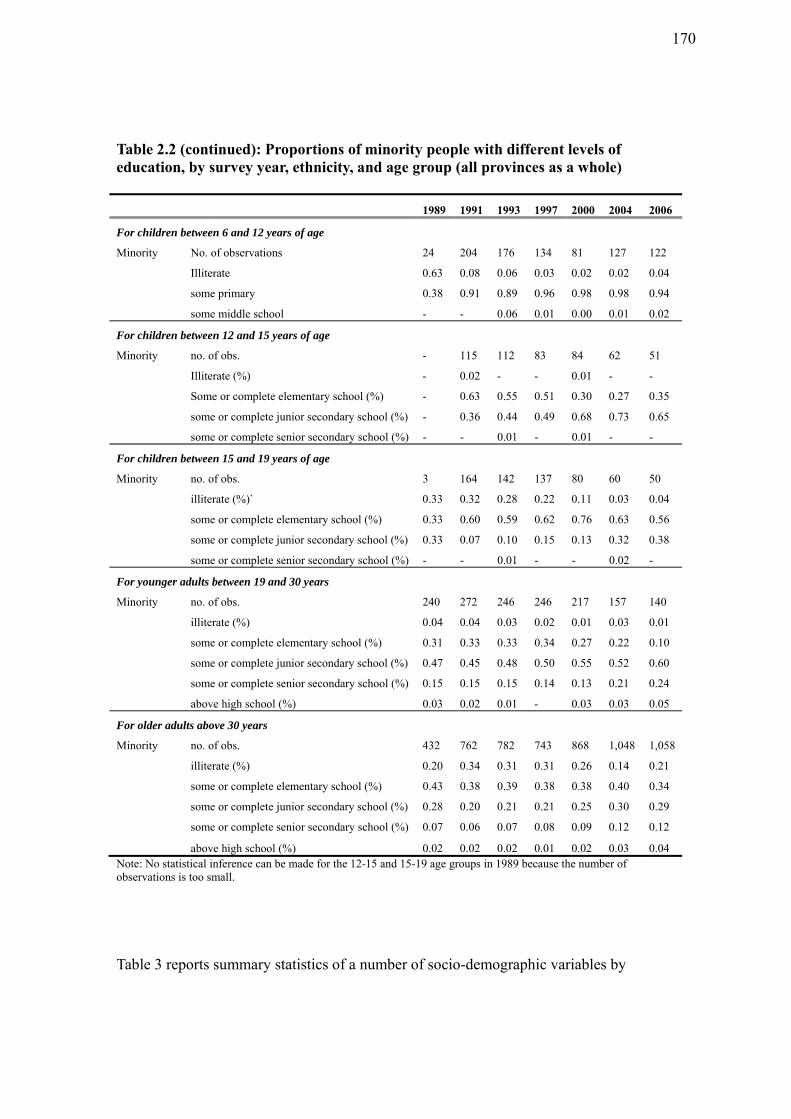
Table 2.2 (continued): Proportions of minority people with different levels of education, by survey year, ethnicity, and age group (all provinces as a whole)
1989 1991 1993 1997 2000 2004 2006
For children between 6 and 12 years of age
Minority No. of observations 24 204 176 134 81 127 122
Illiterate 0.63 0.08 0.06 0.03 0.02 0.02 0.04
some primary 0.38 0.91 0.89 0.96 0.98 0.98 0.94
some middle school - - 0.06 0.01 0.00 0.01 0.02
For children between 12 and 15 years of age
Minority no. of obs. - 115 112 83 84 62 51
Illiterate (%) - 0.02 - - 0.01 - -
Some or complete elementary school (%) - 0.63 0.55 0.51 0.30 0.27 0.35
some or complete junior secondary school (%) - 0.36 0.44 0.49 0.68 0.73 0.65
some or complete senior secondary school (%) - - 0.01 - 0.01 - -
For children between 15 and 19 years of age
Minority no. of obs. 3 164 142 137 80 60 50
illiterate (%)` 0.33 0.32 0.28 0.22 0.11 0.03 0.04
some or complete elementary school (%) 0.33 0.60 0.59 0.62 0.76 0.63 0.56
some or complete junior secondary school (%) 0.33 0.07 0.10 0.15 0.13 0.32 0.38
some or complete senior secondary school (%) - - 0.01 - - 0.02 -
For younger adults between 19 and 30 years
Minority no. of obs. 240 272 246 246 217 157 140
illiterate (%) 0.04 0.04 0.03 0.02 0.01 0.03 0.01
some or complete elementary school (%) 0.31 0.33 0.33 0.34 0.27 0.22 0.10
some or complete junior secondary school (%) 0.47 0.45 0.48 0.50 0.55 0.52 0.60
some or complete senior secondary school (%) 0.15 0.15 0.15 0.14 0.13 0.21 0.24
above high school (%) 0.03 0.02 0.01 - 0.03 0.03 0.05
For older adults above 30 years
Minority no. of obs. 432 762 782 743 868 1,048 1,058
illiterate (%) 0.20 0.34 0.31 0.31 0.26 0.14 0.21
some or complete elementary school (%) 0.43 0.38 0.39 0.38 0.38 0.40 0.34
some or complete junior secondary school (%) 0.28 0.20 0.21 0.21 0.25 0.30 0.29
some or complete senior secondary school (%) 0.07 0.06 0.07 0.08 0.09 0.12 0.12
above high school (%) 0.02 0.02 0.02 0.01 0.02 0.03 0.04 Note: No statistical inference can be made for the 12-15 and 15-19 age groups in 1989 because the number of observations is too small.
Table 3 reports summary statistics of a number of socio-demographic variables by
170
ethnicity (Han and minority) and age group. Most variables listed are self-explanatory
and directly available from the data. Variables “province code” and “asset index” are
constructed and serve as proxies for provincial economic development level and
household wealth level, respectively.
Specifically, “province code” is an ordinal variable that takes value 1 for the province
with the lowest per capita GDP and 9 for the province with the highest annual GDP per
capita. Assume per capita GDP level of a province has a linear relationship with its
economic development, the ordinal variable “province code” would also have a linear
relationship with provincial economic development and hence serves as a good proxy for
it. In China, per capita GDP, instead of per capita income, is widely used as a proxy for
provincial economic development level; as income data are collected and reported
separately for rural and urban areas due to the severe rural-urban dichotomy, and a single
income per capita figure for all residents in a province does not exist. By construction,
the province code is larger for richer (higher GDP per capita) provinces and smaller for
poorer provinces.
Asset index (AI) is believed to be a reliable predictor of poverty and is viewed as a good
proxy for long-term wealth with less error than both pure income data and data on
expenditures (Sahn and Stifel, 2003). In this study, AI is the weighted average of 19
assets (household durables) dummies: whether the household has a high-quality roof,
floor, wall, tricycle, bicycle, motorcycle, car, radio, VCR, black-and-white television,
color television, washer, refrigerator, sewing machine, microwave, electric cooker,
171
telephone, computer, and camera. Weights are determined using the Principal Component
procedure (Hammer, 1998; Filmer and Pritchett, 2001), which in mathematics terms are
simply elements of the unit eigenvector corresponding to the largest eigenvalue of the
correlation matrix of the asset variables (all normalized by mean and standard deviation)8.
The weight an asset dummy receives depends on how much information ownership of
this asset conveys about ownership of the rest of the assets: it receives a positive value,
zero, or a negative value if its ownership suggests ownership of most other assets,
ownership of few other assets, or little information about ownership of other assets,
respectively9. As such, the AI may take any value: a positive AI suggests that the
household owns most of the 19 assets and has an above-average level of wealth; a
negative AI suggests that the household owns few of the 19 assets and has a below-
average level of wealth; and a near zero AI suggests that a household’s wealth level is in
the middle.
Statistics in Table 3 suggest that in general, ethnic minorities live in poorer households
and less developed provinces compared to their counterpart Han people. They also
receive less years of schooling than the Han, and the education gap is larger in both
magnitude and significance level for older age groups. For example, the Han-minority
8 Sahn and Stifel (2003) used factor analysis instead of principal component analysis because the latter forces all of the components to accurately and completely explain the correlation structure between the assets, while the former does not impose the strong assumption. Nonethless, the two methods create indices that rank households similarly, as suggested by the Spearman rank correlation (0.98) between the asset indices generated separately following the two procedures. Ferguson et al. (2002) also developed an alternative approach based on a variant of the hierarchical ordered probit model which they find to give similar results to the principle components asset index (Sahn and Stifel, 2003: footnote 8). 9 Here is an example from Moser and Felton (2007: pp. 4): “wealthy households are more likely to own a computer than poor ones, but radio ownership is spread evenly across the spectrum. Therefore, knowing that one household owns a computer provides more information about that household’s wealth than a radio does, and it receives a higher weighting.” See also Sahn and Stifel (2003: pp. 469) for another example.
172
difference in average years of schooling is only 0.19 years with t-statistic less than 3 for
elementary school students, but it is close to one year with t-statistic close to or larger
than 10 for people above 15 years old. Minority parents of all ages are also less educated
than their counterpart Han parents; and the parental education gaps tend to be larger for
younger generations below 19 years of age. Regardless of ethnicity, over 90 percent of
the surveyed children (below 19 years of age) live with at least on parent (more likely the
mother), while less than 10 percent surveyed adults aged 30 year or above live with at
least one of their elderly parents, suggesting perhaps the disintegration of the traditional
notion of filial piety in modern rural society in China. No significant Han-Minority
difference in age is found. Han-Minority difference in sex ratio is also little except
between minority and Han adults 19 -30 years old: a slightly larger male ratio is found
among the minorities (57%, versus 51% among the Han); and the difference is significant
at the 1% level (t-statistic = 4.38). Both the Han and the minority samples in the CHNS
consist of mostly (over 65%) rural residents, though the proportion of rural residents is
still significantly larger among minority people of all ages, except among children
between 6 and 12 years.
173
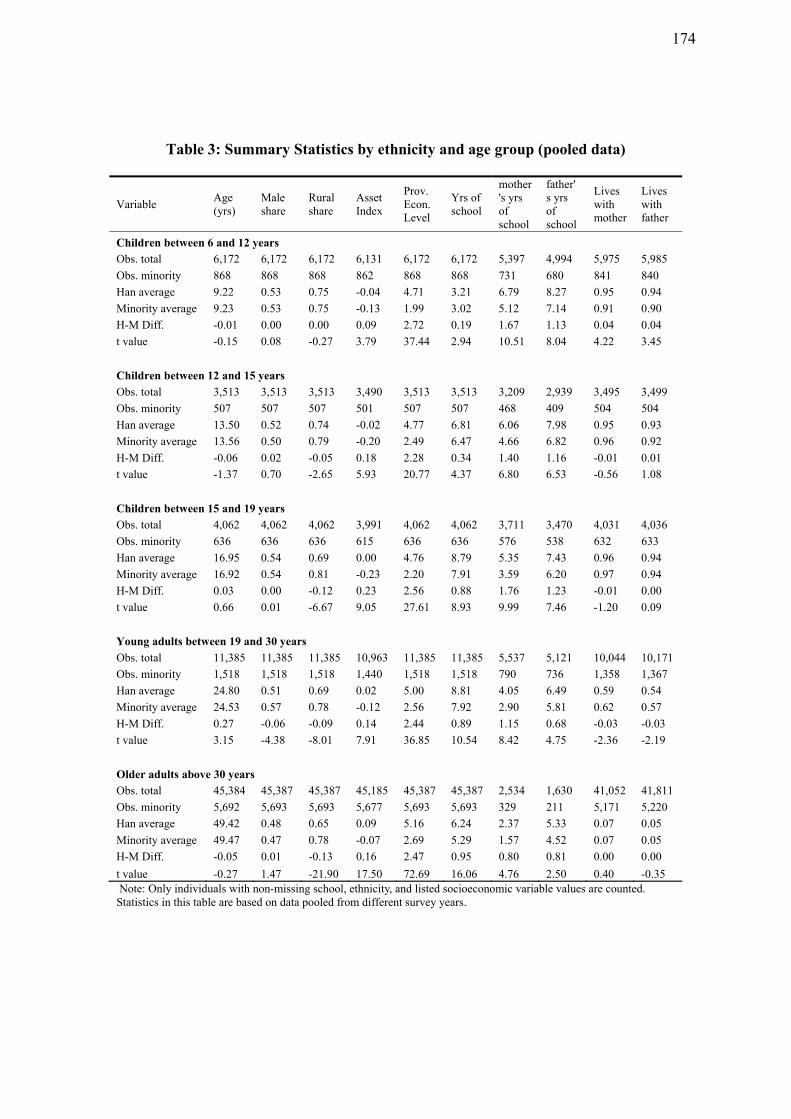
Table 3: Summary Statistics by ethnicity and age group (pooled data)
Variable Age (yrs)
Male share
Rural share
Asset Index
Prov. Econ. Level
Yrs of school
mother's yrs of school
father's yrs of school
Lives with mother
Lives with father
Children between 6 and 12 years
Obs. total 6,172 6,172 6,172 6,131 6,172 6,172 5,397 4,994 5,975 5,985
Obs. minority 868 868 868 862 868 868 731 680 841 840
Han average 9.22 0.53 0.75 -0.04 4.71 3.21 6.79 8.27 0.95 0.94
Minority average 9.23 0.53 0.75 -0.13 1.99 3.02 5.12 7.14 0.91 0.90
H-M Diff. -0.01 0.00 0.00 0.09 2.72 0.19 1.67 1.13 0.04 0.04
t value -0.15 0.08 -0.27 3.79 37.44 2.94 10.51 8.04 4.22 3.45
Children between 12 and 15 years
Obs. total 3,513 3,513 3,513 3,490 3,513 3,513 3,209 2,939 3,495 3,499
Obs. minority 507 507 507 501 507 507 468 409 504 504
Han average 13.50 0.52 0.74 -0.02 4.77 6.81 6.06 7.98 0.95 0.93
Minority average 13.56 0.50 0.79 -0.20 2.49 6.47 4.66 6.82 0.96 0.92
H-M Diff. -0.06 0.02 -0.05 0.18 2.28 0.34 1.40 1.16 -0.01 0.01
t value -1.37 0.70 -2.65 5.93 20.77 4.37 6.80 6.53 -0.56 1.08
Children between 15 and 19 years
Obs. total 4,062 4,062 4,062 3,991 4,062 4,062 3,711 3,470 4,031 4,036
Obs. minority 636 636 636 615 636 636 576 538 632 633
Han average 16.95 0.54 0.69 0.00 4.76 8.79 5.35 7.43 0.96 0.94
Minority average 16.92 0.54 0.81 -0.23 2.20 7.91 3.59 6.20 0.97 0.94
H-M Diff. 0.03 0.00 -0.12 0.23 2.56 0.88 1.76 1.23 -0.01 0.00
t value 0.66 0.01 -6.67 9.05 27.61 8.93 9.99 7.46 -1.20 0.09
Young adults between 19 and 30 years
Obs. total 11,385 11,385 11,385 10,963 11,385 11,385 5,537 5,121 10,044 10,171
Obs. minority 1,518 1,518 1,518 1,440 1,518 1,518 790 736 1,358 1,367
Han average 24.80 0.51 0.69 0.02 5.00 8.81 4.05 6.49 0.59 0.54
Minority average 24.53 0.57 0.78 -0.12 2.56 7.92 2.90 5.81 0.62 0.57
H-M Diff. 0.27 -0.06 -0.09 0.14 2.44 0.89 1.15 0.68 -0.03 -0.03
t value 3.15 -4.38 -8.01 7.91 36.85 10.54 8.42 4.75 -2.36 -2.19
Older adults above 30 years
Obs. total 45,384 45,387 45,387 45,185 45,387 45,387 2,534 1,630 41,052 41,811
Obs. minority 5,692 5,693 5,693 5,677 5,693 5,693 329 211 5,171 5,220
Han average 49.42 0.48 0.65 0.09 5.16 6.24 2.37 5.33 0.07 0.05
Minority average 49.47 0.47 0.78 -0.07 2.69 5.29 1.57 4.52 0.07 0.05
H-M Diff. -0.05 0.01 -0.13 0.16 2.47 0.95 0.80 0.81 0.00 0.00
t value -0.27 1.47 -21.90 17.50 72.69 16.06 4.76 2.50 0.40 -0.35 Note: Only individuals with non-missing school, ethnicity, and listed socioeconomic variable values are counted. Statistics in this table are based on data pooled from different survey years.
174
4. Measuring and decomposing education inequality
This section is devoted to the measurement and decomposition of Han-Minority
education inequality for people of different age groups (children between 6-12 years, 12-
15 years, 15-19 years, and adults between 19-30 years and above 30 years) and in
different survey years (1989, 1991, 1993, 1997, 2000, 2004, and 2006). Individual
educational outcome is measured by years of schooling (AYS)10. Four inequality indices
that draw on different perspectives are estimated. Difference in average years of
schooling measures education inequality in mean levels. Gini coefficient and the
Generalized Entropy index measure education inequality in distributions, which should
be examined because the average level of educational attainment alone is not sufficient to
reflect the characteristics of a society's human capital, as education is a good that cannot
be freely traded across individuals and its marginal product cannot be equalized through
free-market mechanism. Pearson-Cramer index (Yalonetzky, 2012) measures the
association between years of schooling and one’s ethnic background and other
characteristics that would affect education outcome but are beyond individual control,
which are called “circumstances” by Roemer (1998). Since Roemer (1998) defines
inequality of educational opportunity as correlation between the distributions of
individual educational outcome and circumstances, Pearson-Cramer index measures
inequality of educational opportunity.
10 Other education variables available in the CHNS data are educational attainment level (from illiterate to master’s degree) and whether the interviewee is still in school (from which dropout rate can be calculated). Individual educational outcome can also be measured by standardized test scores, which may better reflect one’s academic performance. Some researchers also use the types of schools one attends to measure the quality of education one receives (Yalonetzky 2012). At the cohort or district level, enrollment rate, literacy rate, cohort survival rate, and dropout rate are often used to measure education outcome.
175
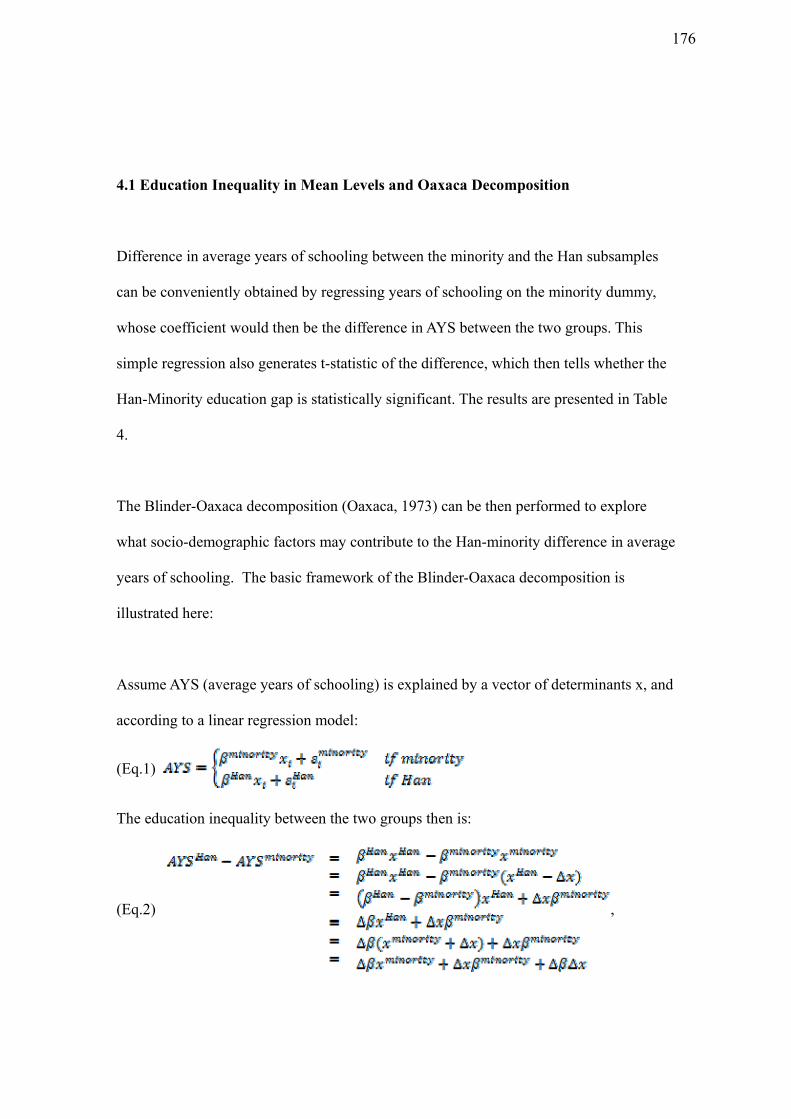
4.1 Education Inequality in Mean Levels and Oaxaca Decomposition
Difference in average years of schooling between the minority and the Han subsamples
can be conveniently obtained by regressing years of schooling on the minority dummy,
whose coefficient would then be the difference in AYS between the two groups. This
simple regression also generates t-statistic of the difference, which then tells whether the
Han-Minority education gap is statistically significant. The results are presented in Table
4.
The Blinder-Oaxaca decomposition (Oaxaca, 1973) can be then performed to explore
what socio-demographic factors may contribute to the Han-minority difference in average
years of schooling. The basic framework of the Blinder-Oaxaca decomposition is
illustrated here:
Assume AYS (average years of schooling) is explained by a vector of determinants x, and
according to a linear regression model:
(Eq.1)
The education inequality between the two groups then is:
(Eq.2) ,
176
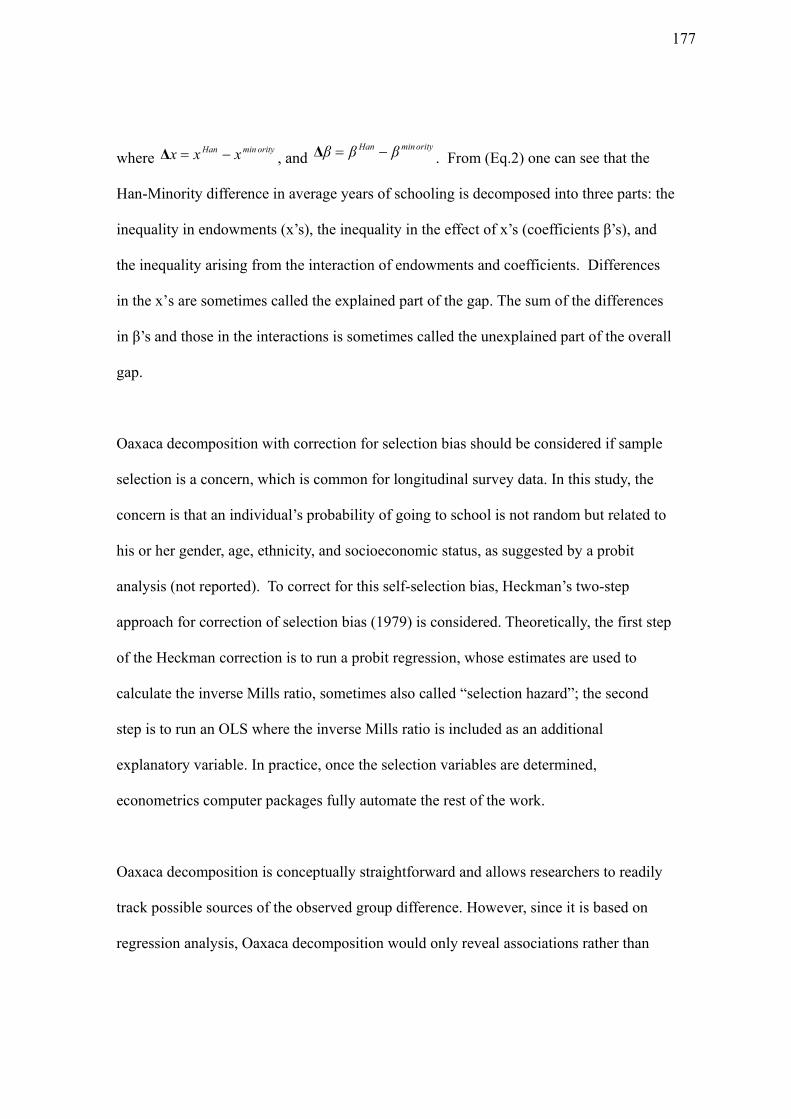
where orityminHan xxx Δ , and
orityminHan βββ Δ . From (Eq.2) one can see that the
Han-Minority difference in average years of schooling is decomposed into three parts: the
inequality in endowments (x’s), the inequality in the effect of x’s (coefficients β’s), and
the inequality arising from the interaction of endowments and coefficients. Differences
in the x’s are sometimes called the explained part of the gap. The sum of the differences
in β’s and those in the interactions is sometimes called the unexplained part of the overall
gap.
Oaxaca decomposition with correction for selection bias should be considered if sample
selection is a concern, which is common for longitudinal survey data. In this study, the
concern is that an individual’s probability of going to school is not random but related to
his or her gender, age, ethnicity, and socioeconomic status, as suggested by a probit
analysis (not reported). To correct for this self-selection bias, Heckman’s two-step
approach for correction of selection bias (1979) is considered. Theoretically, the first step
of the Heckman correction is to run a probit regression, whose estimates are used to
calculate the inverse Mills ratio, sometimes also called “selection hazard”; the second
step is to run an OLS where the inverse Mills ratio is included as an additional
explanatory variable. In practice, once the selection variables are determined,
econometrics computer packages fully automate the rest of the work.
Oaxaca decomposition is conceptually straightforward and allows researchers to readily
track possible sources of the observed group difference. However, since it is based on
regression analysis, Oaxaca decomposition would only reveal associations rather than
177
causations that characterize inequality, unless the set of observables is sufficiently rich to
remove all selections on observables and bias from unobservables. Further, Elder,
Goddeeris, and Heider (2010) recently showed that the commonly-used Oaxaca
decomposition based on pooled regression without group-specific intercepts
systematically overstates the contribution of observable characteristics to mean outcome
differences and understates unexplained group differences. In this study, as Oaxaca
decomposition is based on simple OLS using pooled panel data that ignores serial
correlation and underestimates standard errors (Cameron and Trivedi, 2005, p.729), the
explained part of the gap may be further overestimated. Nevertheless, Oaxaca
decomposition is performed to provide a benchmark decomposition result against which
results from other analysis of the sources of Han-Minority education inequality can be
compared. The results are reported in Table 5.
4.2 Inequality in the Distribution of Education and its Decomposition
There are many indices for the measurement of inequality in distributions; each of them
has some intuitive or mathematical appeal (Cowell, 1995), though some can behave in
perverse fashions11 (Lichtfield, 1999). Among the well-behaved inequality measures12,
the Gini coefficient and the Generalized Entropy (GE) indices are probably the most
11 For example, the Standard Deviation of Schooling (SDS), which must be one of the simplest measures of education inequality, is not scale independent: by definition of variance, doubling everyone’s years of schooling would quadruple the estimate of education inequality [var(λy)= λ2var(y), λ=2] 12 Namely inequality measures that conform to a set of axioms: (1) the Pigou-Dalton Transfer Principle (Pigou, 1912; Dalton, 1920); (2) Scale Independence; (3) Principle of Population; (4) Anonymity (sometimes also referred to as “Symmetry”; (5) Decomposability (Shorrocks, 1980). See Litchfield (1999) for more details.
178
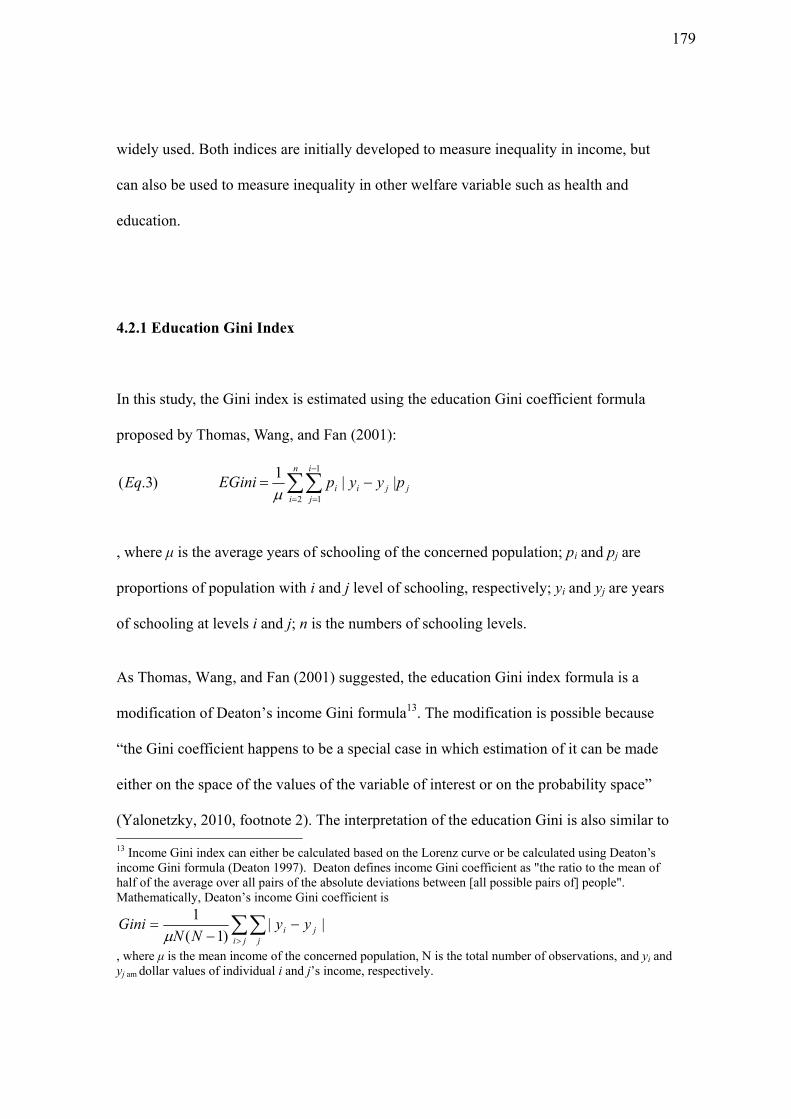
widely used. Both indices are initially developed to measure inequality in income, but
can also be used to measure inequality in other welfare variable such as health and
education.
4.2.1 Education Gini Index
In this study, the Gini index is estimated using the education Gini coefficient formula
proposed by Thomas, Wang, and Fan (2001):
)3.(Eq
j
n
i
i
jjii pyypEGini
2
1
1
||1
, where μ is the average years of schooling of the concerned population; pi and pj are
proportions of population with i and j level of schooling, respectively; yi and yj are years
of schooling at levels i and j; n is the numbers of schooling levels.
As Thomas, Wang, and Fan (2001) suggested, the education Gini index formula is a
modification of Deaton’s income Gini formula13. The modification is possible because
“the Gini coefficient happens to be a special case in which estimation of it can be made
either on the space of the values of the variable of interest or on the probability space”
(Yalonetzky, 2010, footnote 2). The interpretation of the education Gini is also similar to 13 Income Gini index can either be calculated based on the Lorenz curve or be calculated using Deaton’s income Gini formula (Deaton 1997). Deaton defines income Gini coefficient as "the ratio to the mean of half of the average over all pairs of the absolute deviations between [all possible pairs of] people". Mathematically, Deaton’s income Gini coefficient is
ji j
ji yyNN
Gini ||)1(
1
, where μ is the mean income of the concerned population, N is the total number of observations, and yi and yj am dollar values of individual i and j’s income, respectively.
179
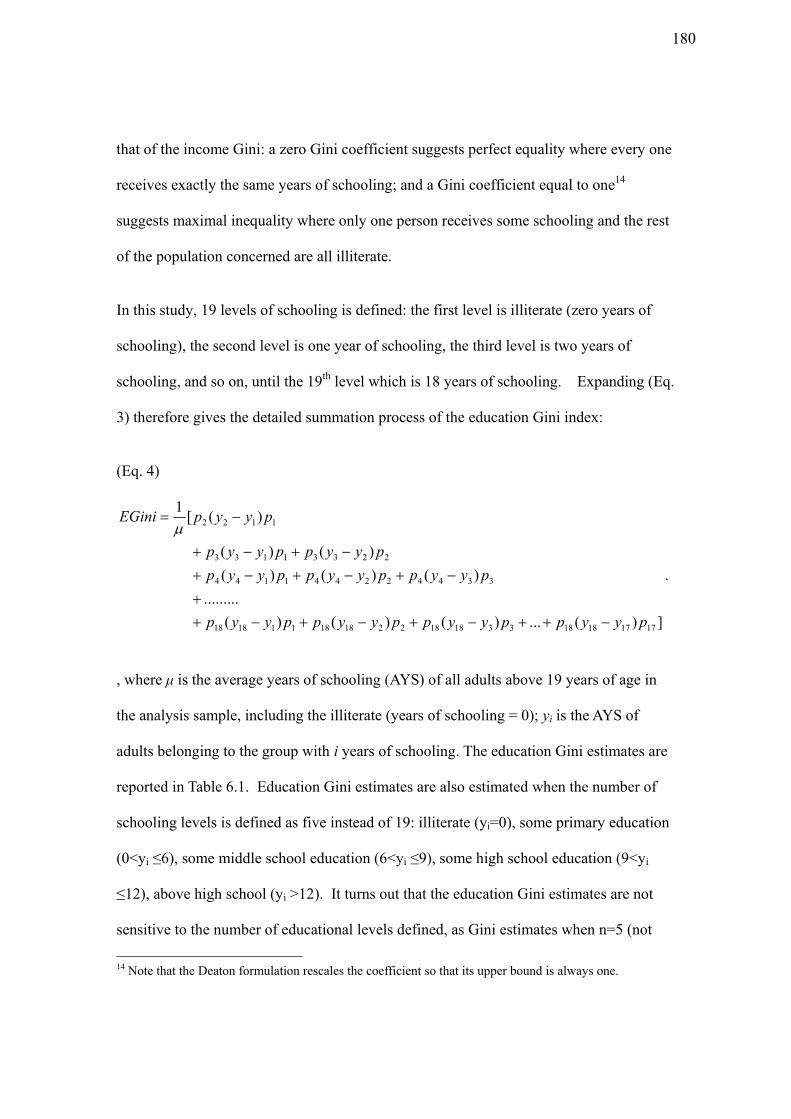
that of the income Gini: a zero Gini coefficient suggests perfect equality where every one
receives exactly the same years of schooling; and a Gini coefficient equal to one14
suggests maximal inequality where only one person receives some schooling and the rest
of the population concerned are all illiterate.
In this study, 19 levels of schooling is defined: the first level is illiterate (zero years of
schooling), the second level is one year of schooling, the third level is two years of
schooling, and so on, until the 19th level which is 18 years of schooling. Expanding (Eq.
3) therefore gives the detailed summation process of the education Gini index:
(Eq. 4)
])(...)()()(
.........
)()()(
)()(
)([1
17171818331818221818111818
334422441144
22331133
1122
pyyppyyppyyppyyp
pyyppyyppyyp
pyyppyyp
pyypEGini
.
, where μ is the average years of schooling (AYS) of all adults above 19 years of age in
the analysis sample, including the illiterate (years of schooling = 0); yi is the AYS of
adults belonging to the group with i years of schooling. The education Gini estimates are
reported in Table 6.1. Education Gini estimates are also estimated when the number of
schooling levels is defined as five instead of 19: illiterate (yi=0), some primary education
(0<yi ≤6), some middle school education (6<yi ≤9), some high school education (9<yi
≤12), above high school (yi >12). It turns out that the education Gini estimates are not
sensitive to the number of educational levels defined, as Gini estimates when n=5 (not
14 Note that the Deaton formulation rescales the coefficient so that its upper bound is always one.
180
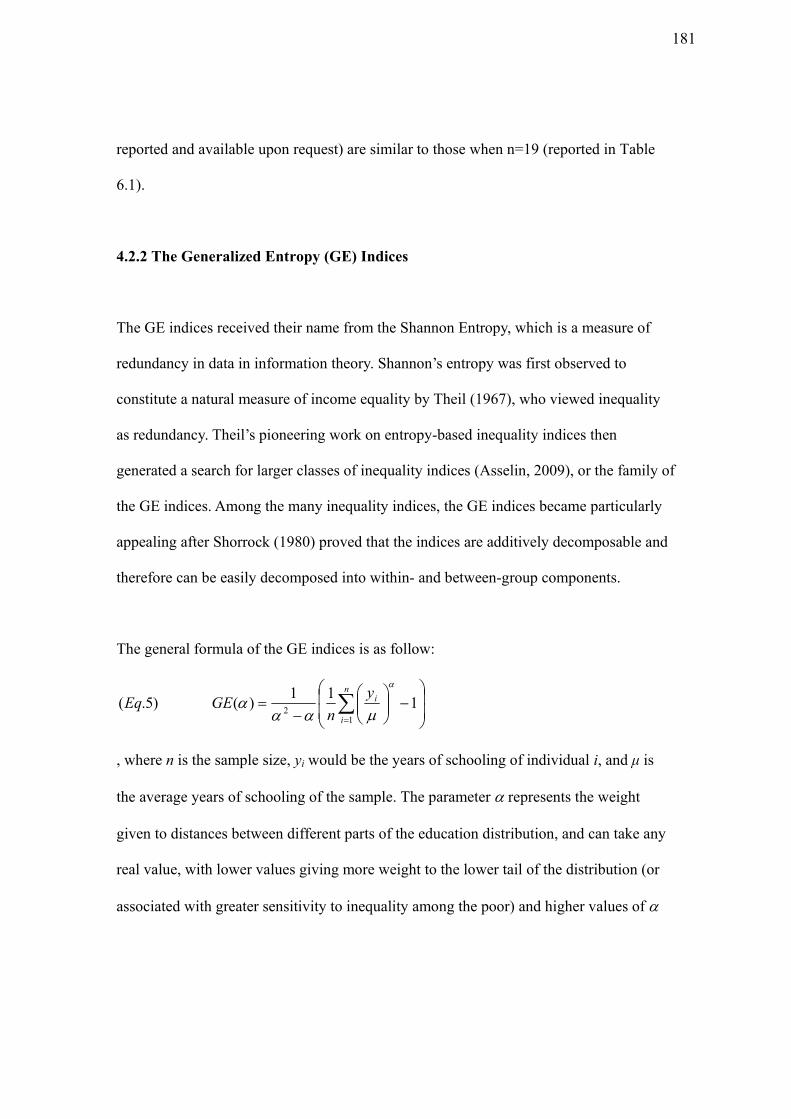
reported and available upon request) are similar to those when n=19 (reported in Table
6.1).
4.2.2 The Generalized Entropy (GE) Indices
The GE indices received their name from the Shannon Entropy, which is a measure of
redundancy in data in information theory. Shannon’s entropy was first observed to
constitute a natural measure of income equality by Theil (1967), who viewed inequality
as redundancy. Theil’s pioneering work on entropy-based inequality indices then
generated a search for larger classes of inequality indices (Asselin, 2009), or the family of
the GE indices. Among the many inequality indices, the GE indices became particularly
appealing after Shorrock (1980) proved that the indices are additively decomposable and
therefore can be easily decomposed into within- and between-group components.
The general formula of the GE indices is as follow:
111
)()5.(1
2
n
i
iy
nGEEq
, where n is the sample size, yi would be the years of schooling of individual i, and μ is
the average years of schooling of the sample. The parameter represents the weight
given to distances between different parts of the education distribution, and can take any
real value, with lower values giving more weight to the lower tail of the distribution (or
associated with greater sensitivity to inequality among the poor) and higher values of
181
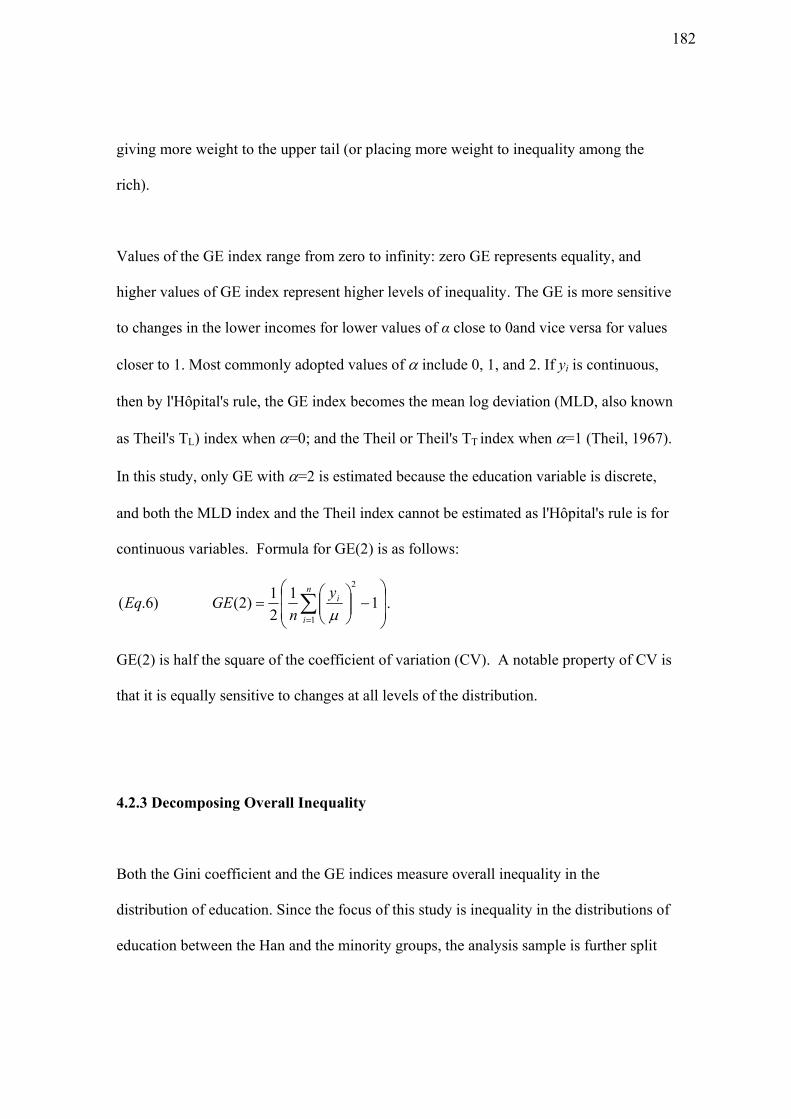
giving more weight to the upper tail (or placing more weight to inequality among the
rich).
Values of the GE index range from zero to infinity: zero GE represents equality, and
higher values of GE index represent higher levels of inequality. The GE is more sensitive
to changes in the lower incomes for lower values of α close to 0and vice versa for values
closer to 1. Most commonly adopted values of include 0, 1, and 2. If yi is continuous,
then by l'Hôpital's rule, the GE index becomes the mean log deviation (MLD, also known
as Theil's TL) index when =0; and the Theil or Theil's TT index when =1 (Theil, 1967).
In this study, only GE with =2 is estimated because the education variable is discrete,
and both the MLD index and the Theil index cannot be estimated as l'Hôpital's rule is for
continuous variables. Formula for GE(2) is as follows:
11
2
1)2()6.(
2
1
n
i
iy
nGEEq
.
GE(2) is half the square of the coefficient of variation (CV). A notable property of CV is
that it is equally sensitive to changes at all levels of the distribution.
4.2.3 Decomposing Overall Inequality
Both the Gini coefficient and the GE indices measure overall inequality in the
distribution of education. Since the focus of this study is inequality in the distributions of
education between the Han and the minority groups, the analysis sample is further split
182
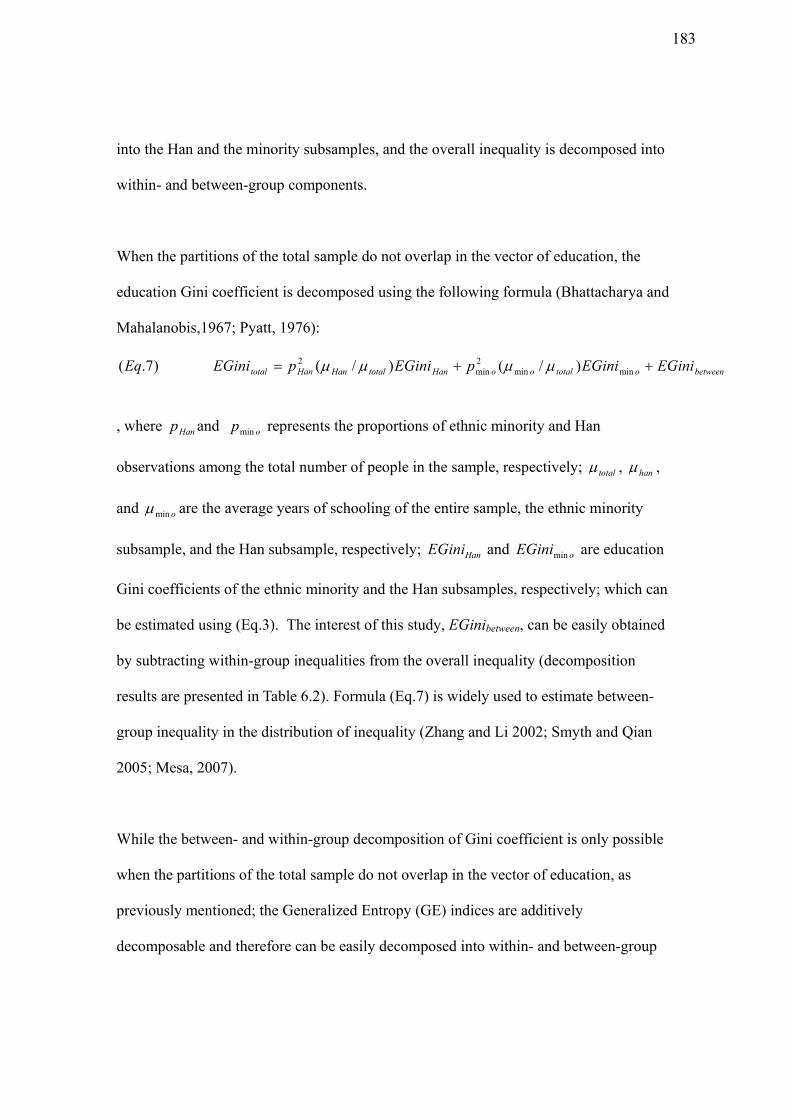
into the Han and the minority subsamples, and the overall inequality is decomposed into
within- and between-group components.
When the partitions of the total sample do not overlap in the vector of education, the
education Gini coefficient is decomposed using the following formula (Bhattacharya and
Mahalanobis,1967; Pyatt, 1976):
betweenototalooHantotalHanHantotal EGiniEGinipEGinipEGiniEq minmin2min
2 )/()/()7.(
, where Hanp and opmin represents the proportions of ethnic minority and Han
observations among the total number of people in the sample, respectively; total , han ,
and omin are the average years of schooling of the entire sample, the ethnic minority
subsample, and the Han subsample, respectively; HanEGini and oEGinimin are education
Gini coefficients of the ethnic minority and the Han subsamples, respectively; which can
be estimated using (Eq.3). The interest of this study, EGinibetween, can be easily obtained
by subtracting within-group inequalities from the overall inequality (decomposition
results are presented in Table 6.2). Formula (Eq.7) is widely used to estimate between-
group inequality in the distribution of inequality (Zhang and Li 2002; Smyth and Qian
2005; Mesa, 2007).
While the between- and within-group decomposition of Gini coefficient is only possible
when the partitions of the total sample do not overlap in the vector of education, as
previously mentioned; the Generalized Entropy (GE) indices are additively
decomposable and therefore can be easily decomposed into within- and between-group
183
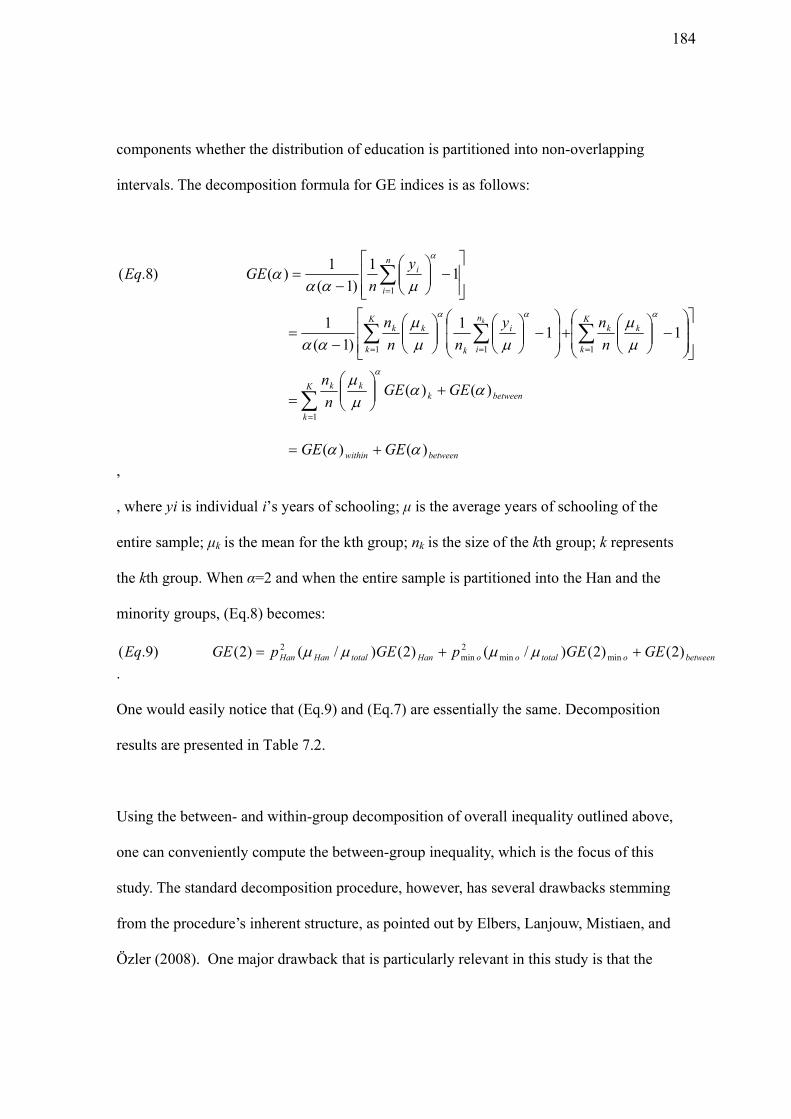
components whether the distribution of education is partitioned into non-overlapping
intervals. The decomposition formula for GE indices is as follows:
betweenwithin
K
k
betweenkkk
K
k
kkK
k
n
i
i
k
kk
n
i
i
GEGE
GEGEn
n
n
ny
nn
n
y
nGEEq
k
)()(
)()(
111
)1(
1
11
)1(
1)()8.(
1
11 1
1
,
, where yi is individual i’s years of schooling; μ is the average years of schooling of the
entire sample; μk is the mean for the kth group; nk is the size of the kth group; k represents
the kth group. When α=2 and when the entire sample is partitioned into the Han and the
minority groups, (Eq.8) becomes:
betweenototalooHantotalHanHan GEGEpGEpGEEq )2()2()/()2()/()2()9.( minmin2min
2 .
One would easily notice that (Eq.9) and (Eq.7) are essentially the same. Decomposition
results are presented in Table 7.2.
Using the between- and within-group decomposition of overall inequality outlined above,
one can conveniently compute the between-group inequality, which is the focus of this
study. The standard decomposition procedure, however, has several drawbacks stemming
from the procedure’s inherent structure, as pointed out by Elbers, Lanjouw, Mistiaen, and
Özler (2008). One major drawback that is particularly relevant in this study is that the
184
standard procedure gives everyone within a group the average outcome of the group,
which is group-specific average years of schooling in this study; it then compares group-
average education inequalities against the total education inequality and asks how much
the former contribute to the latter. Assuming that everyone within a group has identical
years of schooling is obviously unrealistic. It is especially problematic if there exists a
high level of inequality within each of the two non-overlapping groups, which is exactly
the case in China: whether it is with the Han or the minority population, high levels of
education inequality exist (as we will see in Table 6.1).
Another problem, though less relevant in this study, is that the standard decomposition
procedure has the mathematical property that between-group inequality will never
decrease with a greater number of groups, as demonstrated by Elbers et al. (2008). This
also may cause problem as a population may be partitioned into different groups in a
variety of ways. For example, in China, the population can be simply divided into two
groups: Han and non-Han; but it may also be desirable to partition the population into
four groups: Han, minorities who are highly sinicized, minorities who have largely kept
their own cultures and customs but still identify themselves as Chinese, and minorities
who have a stronger sense of ethnic identity and tend to feel that they do not belong in the
Han culture. The standard procedure would give a larger, or at least no smaller, between-
group differences in the second case; yet researchers would not be able to judge whether
it is because the more refined partition really better captures the true between-group
difference, or it is just because of the mathematical property of the standard
decomposition procedure.
185
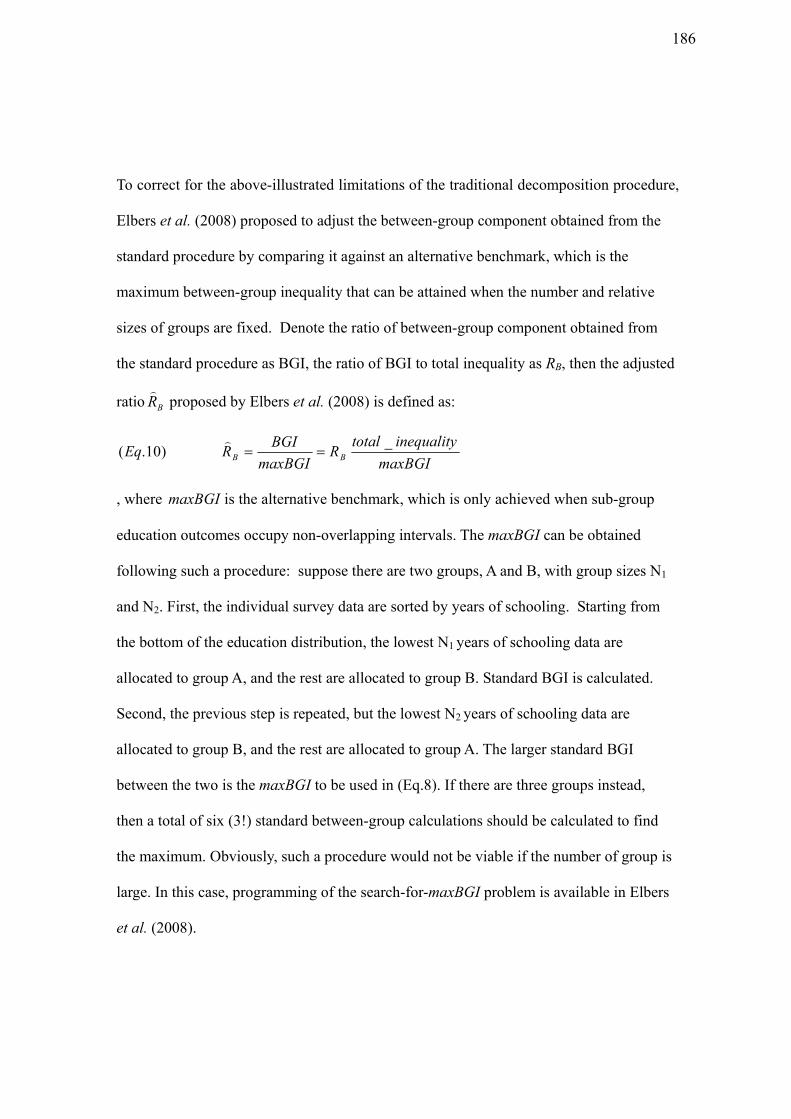
To correct for the above-illustrated limitations of the traditional decomposition procedure,
Elbers et al. (2008) proposed to adjust the between-group component obtained from the
standard procedure by comparing it against an alternative benchmark, which is the
maximum between-group inequality that can be attained when the number and relative
sizes of groups are fixed. Denote the ratio of between-group component obtained from
the standard procedure as BGI, the ratio of BGI to total inequality as RB, then the adjusted
ratio BR
proposed by Elbers et al. (2008) is defined as:
GIBmax
inequalitytotalR
GIBmax
BGIREq BB
_)10.(
, where GIBmax is the alternative benchmark, which is only achieved when sub-group
education outcomes occupy non-overlapping intervals. The maxBGI can be obtained
following such a procedure: suppose there are two groups, A and B, with group sizes N1
and N2. First, the individual survey data are sorted by years of schooling. Starting from
the bottom of the education distribution, the lowest N1 years of schooling data are
allocated to group A, and the rest are allocated to group B. Standard BGI is calculated.
Second, the previous step is repeated, but the lowest N2 years of schooling data are
allocated to group B, and the rest are allocated to group A. The larger standard BGI
between the two is the maxBGI to be used in (Eq.8). If there are three groups instead,
then a total of six (3!) standard between-group calculations should be calculated to find
the maximum. Obviously, such a procedure would not be viable if the number of group is
large. In this case, programming of the search-for-maxBGI problem is available in Elbers
et al. (2008).
186
Elbers et al. (2008) illustrated the significant difference such a mild adjustment may
make by applying it to South Africa data. They showed that income inequality between
the white and the non-white groups only accounts for 27% of the total inequality if the
traditional decomposition procedure is used, but becomes 80% after their adjustment.
Lanjouw and Rao (2011) applied the adjustment to data on two Indian villages and found
that it offers additional insights in explaining between-group inequality in one village but
not in the other.
In this study, Elbers et al. (2008)’s adjustment is applied to the between-group
components of overall education inequality measured by Gini and GE(2). Results are
discussed in section 4.4.3.
4.3 Inequality in Educational Opportunity
4.3. 1 Why Inequality in opportunity?
While scholars in the sociology and political philosophy disciplines have been interested
in the notion of “inequality of opportunity” and tried to measure it since the 1960s (Blau
and Duncan, 1962; Duncan, 1969; Rawls, 1971; Dworkin, 1981a, 1981b; Cohen, 1989,
1990; Arneson, 1989, 1990); few economists seemed to be interested in the normative
concepts of justice and equality of opportunity before the 1990s, though Kenneth Arrow
(1973), John Harsanyi (1973) and Armatya Sen (1980, 1985) have offered critiques to
187
Rawls’ theory of justice (1971). Particularly, Sen argued that egalitarians should seek not
only equality in the distribution of resources necessary for one to achieve higher social
status, but equality in “basic capabilities” to effectively use resources. Examples of basic
capabilities could be “the ability to move about, the ability to meet one’s nutritional
requirements, the wherewithal to be clothed and sheltered, the power to participate in the
social life of the community” (Sen, 1980).
While Sen’s work on “basic capability equality” is perhaps the earliest effort among
economists to study equality of opportunity, John Roemer is the first to propose the
conception of “equality of opportunity” (1993) and to expand the theory of equality of
opportunity in years to follow (1996, 1998, 2002, 2003, 2006, 2008, 2012). Incidentally,
both Roemer and Sen’s first work on equality of opportunity was published in a political
philosophy journal (Philosophy & Public Affairs) rather than a journal in the field of
economics.
Convinced by his own work on exploitation (1982) that the fundamental cause of
economic inequality was inequality of ownership of productive assets, and under the
influence (large or small) of all philosophers mentioned above including Sen, Roemer
(1993) proposed that “equality of opportunity for an outcome holds when the values of
the outcome for all those who exercised a comparable degree of responsibility/efforts are
equal, regardless of their circumstances”; where circumstances are a set of socioeconomic
and genetic characteristics decided/chosen by society so that they could reflect society’s
view of factors that will affect one’s choices but over which he or she has no control
188
(Roemer 1993). Roemer then expanded his theory of equal opportunity in two books
(1996, 1998) and three journal articles (2002, 2003, 2012), where he offered a more
specific explanation of what he meant by equal opportunity and the equalization of
opportunity:
The theory of equal opportunity as I have expounded it in Roemer (1993, 1996, 1998, 2002) uses a language comprising five words: objective, circumstance, type, effort, and policy. The objective is the kind of outcome or well-being or advantage for whose acquisition one wishes to equalize opportunities, in a given population. Circumstances are the set of environmental influences, beyond the individual's control, that affect his or her chances of acquiring the objective. A type is the group of individuals in the population with a given set of circumstances. Effort is autonomously chosen action within the individual's control which, if expended in greater amounts, will increase the degree to which the individual acquires the objective. A policy is a social intervention that is used to influence the degree to which individuals acquire the objective. The equal-opportunity policy is (roughly speaking) the one from the set of feasible policies that will make it the case that the degree to which individuals acquire the objective is independent of their circumstances, and sensitive only to their effort (Roemer, 2003).
It is noteworthy that Roemer advocates compensating people against poor outcomes that
are caused by factors beyond personal control, but he also wants to hold people
responsible for their choices/efforts. This is probably most clearly pointed out in the
definition of “equality of opportunity” Roemer himself offered in the Palgrave Dictionary
of Economics (2008), which states the following:
Whereas the ethic of equality of outcome does not hold individuals responsible for actions that may create inequality of outcomes, equality of opportunity ‘levels the playing field’ so that all have potential to achieve equal outcomes; inequalities of outcome that then transpire are not compensable at the bar of justice. The influences on the outcome a person experiences comprise circumstances (for which he should not be held responsible) and effort (for which he should be). Equal-opportunity policy compensates persons for their disadvantaged circumstances, ensuring that, finally, only effort counts in achieving outcomes (Roemer, 2008).
189
According to Ferreira and Gignoux (2011), such a distinction between inequalities due to
differences in personal efforts (“fair inequality”) and those due to predetermined
socioeconomic and genetic characteristics (“unfair inequality”) has “become central to
the literature on social justice in political philosophy, social choice, and increasingly, in
mainstream economics”.
Indeed, economists’ interest in the concept of equality of opportunity increased greatly
after Roemer. Marc Fleurbaey (2008), for example, offered a similar concept which he
calls “circumstance neutralization”: a situation in which an individual’s well-being can
only be expressed as a function of his or her responsibility or dedication characteristics
(i.e. Romer’s effort), and not of circumstances. Lefranc, Pistolesi, and Trannoy (2008)
provided a weaker criterion and define equality of opportunity as in existence whenever
there is no second-order stochastic dominance across the outcome distributions
conditional on different circumstances. Despite (trivial) differences between these
definitions, economists have now reached a general agreement on what equality of
opportunity refers to (Brunori, Ferreira, and Peragine, 2013), which is sufficiently
captured by Roemer’s definition, the most stringent and empirically demanding amongst
all (Yalonetzky. 2012).
Compared to the traditional concept of inequality of outcomes, inequality of opportunity
appeals to economists for at least three sets of reasons. First, public policies could and
therefore should only try to eliminate economic inequalities arising from unequal
opportunities (“unfair inequalities”); once the playing field is leveled off, it is up to each
190
individual how much effort he/she wants to exert and consequently what outcome he/she
will achieve.
Second, people usually accept inequalities arising from different effort levels as they are
fair, but they are discouraged by inequalities due to unequal opportunities. People’s
distinction between “fair inequalities” and “unfair inequalities” has at least three
consequences. Firstly, it will deviate individual behaviors from what models based on
assumption of purely self-regarding preferences would predict, as behavioral economists
have confirmed in their research (Fehr and Schmidt, 1999; Fehr and Gachter, 2000; Fehr
and Fischbacher, 2003). Secondly, it affects people’s assessment to distribution outcomes
(Almås et al., 2010). Thirdly, it affects how redistributions are actually implemented in
society (Alesina and Angeletos, 2005; Benabou and Tirole, 2006). Hence, it would be
useful to measure the extent to which inequality of outcome is unfair “even to the purist
positive economists” who have little interest in normative concepts such as justice
(Brunori, Ferreira, and Peragine, 2013).
Third, while inequality of outcome may be less relevant than poverty in retarding
economic growth (Ravallion, 2012), inequality of opportunity is likely to be a cause of
lack of growth, as there has been empirical evidence suggesting that when effect of
inequality of opportunity is eliminated, other components of outcome inequality actually
have a positive effect on growth (Bourguignon, Ferreira and Menéndez, 2007; Marrero
and Rodriguez, 2009). Banerjee and Duflo (2003) also once suggested that failure to
distinguish between inequality of opportunity and the traditional inequality of outcome
191
may one of the reasons why cross-country empirical literature on growth and inequality is
so inconclusive (Banerjee and Duflo, 2003).
4.3.2 How to measure inequality in opportunity?
Literature on the measurement of inequality of opportunity is part of the broader
literature on the measurement of between-group inequality.
4.3.2.1 Roemer and Van de Gaer’s Indices
The earliest theoretical contributions to the measurement of inequality of opportunity
were made by Roemer (1993). Roemer views an individual’s acquisition of an outcome
(income, education, etc.) as influenced by three factors: circumstances beyond his or her
control, the efforts he or she exerts, and the policy environment. If two individuals facing
different sets of circumstances (Roemer calls individuals facing the same set of
circumstances the same “type”) but expending the same levels of efforts cannot acquire
the same values of outcome, then the difference between their values of outcome must be
attributed to differences in the opportunities they are exposed to. But since effort levels of
individuals of different types are not directly comparable, Roemer uses relative effort
level, which he defines as a person’s effort level as the percentile at which he or she sits
in the effort distribution of his or her type. In another word, relative effort level is a
192
measure of effort that is normed by type. Roemer then measures inequality of opportunity
by comparing individuals who each sits at the same percentile of the effort distribution of
his or her type. An alternative index also based on the Rawlsian maximin principle is
proposed by Van de Gaer (1993). Applications (and comparison) of these two indices are
now abundant (Cogneau and Mesplé-Somps, 2008; Schuetz, Ursprung, and Woessmann;
2008; Björklund, Jäntti and Roemer, 2012)15.
4.3.2.2 Parametric approach by Bourguignon, Ferreira and Menéndez (2007)
Bourguignon, Ferreira and Menéndez (for simplicity, hereafter I shall refer them as BFM)
(2007) departs from Roemer's theory of equality of opportunities and seek to determine
what part of observed outcome inequality may be attributed to differences in observed
circumstances using a microeconometric technique: they first estimate a linear model of
advantage (earnings) as a function of circumstances and efforsts; then they use it to
simulate counterfactual distributions where the effect of circumstances is suppressed; and
by comparing the actual and counterfactual earnings distributions, they are able to
decompose overall earnings inequality into a circumstances component and a residual
(the effort component). BFM (2007) then applied their approach to Brazilian data. This
15 Roemer has also proposed a framework to compute policy that is needed in order to achieve equality of opportunity, or to assess such a policy. Roughly speaking, policy to achieve equal opportunity in outcome is found by maximizing the minimum value of the outcome, or alternatively, the minimum average outcome value across types. Both a general equilibrium approach --- which considers change in outcome due to policy effect --- and a partial equilibrium approach are possible. For an application of the partial equilibrium approach, see Betts and Roemer (2007). For an application of the general equilibrium approach, see Keane and Roemer (2009). For more empirical studies using Roemer’s framework to assess policies designed to increase equality of opportunity or to compute such a policy, see Roemer et al. (2001) and Llavador and Roemer (2001).
193
approach has also been used to examine Chilian data (Nunez and Tartakowsky, 2007) and
Chinese data (Zhang and Eriksson, 2009).
4.3.2.3 Non-parametric approach by Checci and Peragine (2010)
Checchi and Peragine (2010) proposed to measure inequality of opportunity based on
traditional between- and within-group inequality decompositions, where overall
inequality is computed using traditional indices such as Gini and the Generalized Entropy
indices. They show that if groups are defined by Roemer’s types (which are determined
by circumstances), then the between-group component of overall inequality can be
interpreted as an “ex-ante” measure of inequality of opportunity. Alternatively, if groups
are defined in terms of relative effort levels, then the within-group component of overall
inequality corresponds to an “ex-post” measure of inequality of opportunity. For the
conceptual distinction between ex-ante and ex-post approaches to inequality of
opportunity, see Fleurbaey and Peragine (2009), Ferreira and Gignoux (2011), and Ramos
and Van de Gaer (2012). Checchi and Peragine (2010) applied their new method to Italian
data and found that less developed regions in southern Italy are characterized by greater
incidence of inequality of opportunity for income acquisitions.
Ferreira and Gignoux (2011) then extended BFM (2007)’s approach to a parametric
framework and showed that under a certain interpretation, a variant of the parametric
approach in BFM (2007) gives the same estimate as the non-parametric ex-ante approach
194
of Checchi and Peragine (2010). Ferreira and Gignoux (2011) then used their method to
studied inequality of opportunity in six Latin American countries with high level of
income inequality as measured by the Gini coefficient (Brazil, Colombia, Ecuador,
Guatemala, Panama and Peru). They found that inequality of opportunity for income
acquisition accounts for 20% (Columbia) to 35% (Brazil) of the total income inequality
in these countries; and parental education is the most important factor that contributes to
the inequality of opportunity.
4.3.2.4 Semi-parametric approach by Pistolesi (2009)
Pistolesi (2009) assessed inequality of opportunity for earnings acquisition using a semi-
parametric statistical framework built on duration models and panel data collected
through the Michigan Panel Study of Income Dynamics from 1968 to 2001.
Following Pistolesi (2009), the above-mentioned methods can be distinguished into a
direct and an indirect approach to equality of opportunity. Methods taken by Roemer
(1993), Van de Gaer (1993), and Ferreira and Gignoux (2011) are direct; and approaches
taken by BFM (2007), Pistolesi (2009), and Checchi and Peragine (2010) are indirect. To
distinguish these methods from the ex-ante and ex-post perspective, Van de gaer (1993)
is ex-ante; Roemer (1993), Bourguignon, Ferreira and Menéndez (2007), Pistolesi (2009),
and Ferreira and Gignoux (2011) take an ex-post approach to the measurement of
equality of opportunity; and Checchi and Peragine (2010) can be both, depending on how
195
the groups are defined. For details on the categorization, see Ramos and Van de Gaer
(2012).
4.3.2.5 Gini Index of Inequality of Opportunity by Lefranc et al. (2008)
All the above methods are based on a discrete number of types --- and in case some
circumstance variables are continuous (such as parental income, IQ, or health status as
measured by BMI), they are simply divided into percentile groups (for instance, quartiles
or quantiles --- see Björklund, Jäntti and Roemer (2012) for an example). The problem
with this practice is that it may ignore some within-type variation in circumstances, thus
underestimate the circumstance component of inequality (fair inequality) and overstate
the effort component of inequality (unfair inequality). To this end, approaches based on
stochastic dominance are proposed.
The first effort is made by O’Neill, Sweetman, and Van de Gaer (2000). They propose to
use a Kernel density estimator to estimate the distribution of income conditional on
parental income. The same procedure is used to depict the incomes of children
conditional on the income percentile of their parents, which then gives the opportunity set
of a child whose parent was at a particular percentile in the income distribution of his or
her generation. One limitation of this procedure is that it takes only one circumstance
variable into account.
196
Another application of the use of stochastic dominance is Lefranc, Pistolesi and Trannoy
(2008). They calculated a Gini index of Inequality of Opportunity (GIO) and are the first
to use rigorous statistical test for stochastic dominance, using the non-parametric
stochastic dominance tests developed by Davidson and Duclos (2000). They showed that
GIO results can differ from those offered by traditional Gini index by showing that the
two indices gave very different rankings when applied to data from nine OECD countries.
For example, GIO and Gini are negatively related in Belgium but positively related in
Germany.
4.3.2.6 Human Opportunity Index (HOI) by Barros et al. (2009, 2011)
In their book on inequality of opportunities in Latin America and the Caribbean, Barros et
al. (2009) proposed the Human Opportunity Index (the HOI). The original intention to
develop HOI was to measure the extent to which children in various developing countries
have access to basic opportunities. HOI therefore is not a measure of inequality of
opportunity per se. However, since HOI could be viewed as “an example of the ex-ante
approach applied to a multidimensional advantage space, with each dimension
corresponding to access to a particular service – such as water or schooling – and the
valuation of the opportunity set of each type being given by the coverage of the service in
that type”, HOI has become a popular measure of inequality of opportunity; though
empirical evidence is found that HOI’s internal measure of inequality of opportunity
yields very different country rankings from the ex-ante measures of inequality of
197
economic opportunity (Brunori, Ferreira, and Paregine, 2013).
4.3.2.7 Dissimilarity Indices by Yalonetzky (2012)
Most literature on quantitative tools for the measurement of inequality of opportunities,
however, deal with continuous outcome variables such as income or expenditure; or at
least an outcome variable that stems from a continuous latent variable. Few literatures on
measurement of inequality of opportunity are devoted to the case when the outcome
variable is ordered, discrete variable such as years of schooling or educational attainment
levels. As a result, despite the burgeoning empirical literature on inequality of
opportunity in different countries, empirical studies on inequality of opportunity remain
scarce.
Drawing on literature on segregation indices and contingency tables (Reardon and
Firebaugh 2002), Silber and Yalonetzky expanded Roemer’s conditional approach and
proposed what Yalonetzky calls “a family of dissimilarity indices” to quantify inequality
of opportunity in discontinuous outcome variable, mostly notably education (Silber and
Yalonetzky 2011; Yalonetzky, 2010, 2012). Dissimilarity indices are then applied to data
from India (Asadullah and Yalonetzky, 2012) and Peru (Yalonetzky, 2012).
4.3.3 Pearson-Cramer Index
198
Taking advantage of the two Pearson-Cramer indices proposed by Yalonetzky (2012,
formula (7)), this study presents (as part of this effort to explore Han-minority education
inequality in China) the first attempt to investigate the extent and correlates of inequality
of educational opportunity in China. The results are presented in Tables 8.1-8.2.
Since years of schooling is a discrete variable, this study measures inequality in
educational opportunity with the Pearson-Cramer index proposed in Yalonetzky (2012),
formula (7). This index is so named because it equals to the Pearson statistic divided by
its maximum possible value, or Cramér's V, a popular measure of association between
two discrete variables (Cramér, 1946). The framework for the PCI is as follows:
First, assume that there are z circumstances, each being a factor over which individuals
cannot exert control. In this study, only one circumstance (ethnicity) is assumed; more
circumstances that may affect one’s educational opportunity, such as gender, rural/urban
residence, parental education, and religion, may be included in future studies to
investigate the correlates of equality of educational opportunity across provinces in China.
Then, assume that circumstance i includes gi situations (for i=1, 2, …, z). Further, assume
that people in a society can be partitioned into a number of types; and each type is
defined by a combination of gi. The vector of types, G={1, 2, …, T}, then has T= izi g1
types of people.
199
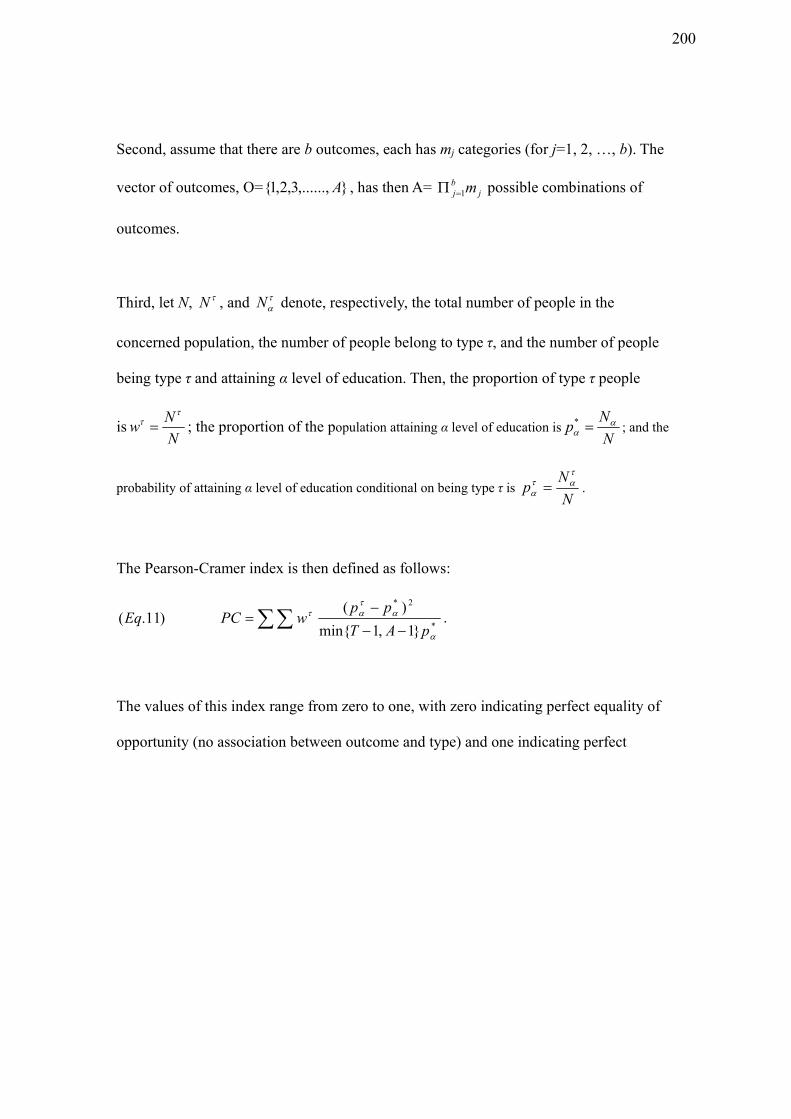
Second, assume that there are b outcomes, each has mj categories (for j=1, 2, …, b). The
vector of outcomes, O= },......,3,2,1{ A , has then A= jbj m1 possible combinations of
outcomes.
Third, let N, N , and N denote, respectively, the total number of people in the
concerned population, the number of people belong to type τ, and the number of people
being type τ and attaining α level of education. Then, the proportion of type τ people
isN
Nw
; the proportion of the population attaining α level of education is
N
Np * ; and the
probability of attaining α level of education conditional on being type τ is N
Np
.
The Pearson-Cramer index is then defined as follows:
*
2*
}1,1min{
)()11.(
pAT
ppwPCEq .
The values of this index range from zero to one, with zero indicating perfect equality of
opportunity (no association between outcome and type) and one indicating perfect
200
inequality of opportunity (complete or absolute association between outcome and type16).
Like the Gini index and the GE indices, the Pearson-Cramer indices also conform to a set
of axioms such as the scale Independence and the Principle of Population. A unique
feature of the PC indices is that they highlight the association between types and
therefore relate to what called Yalonetzky (2012) called a “literalist definition” of
Roemer’s equality of opportunity (1998): equality of opportunity is achieved when the
conditional distributions of outcome are equal across types, or circumstance sets in
Roemer’s terminology. Yalonetzky (2012) therefore declares that the Pearson-Cramer
indices are appropriate for the measurement of inequality of opportunity. Another
advantage of the Pearson-Cramer Indices is that they work on probability space and are
therefore suitable for discrete outcome variables, such as years of schooling and levels of
educational attainment. This trait of the PC indices is particularly relevant in this study.
The PC indices, however, also have some drawbacks, which are all mentioned in
Yalonetzky (2012). One problem that is relevant in this study is that the indices, like other
between-group inequality measures, tend to account for a larger proportion when the
number of types increases, that is, when the population is split into more groups based on
16 Complete association and absolute association (proposed by Kendall and Stuart 1973) are two notions of maximal association in the context of a contingency table having two variables with two states each. Literature on contingency table and segregation indices are highly relevant in Yalonetzky (2012), who declare that a major advantage of his dissimilarity indices is that they are readily applicable to comparisons of multidimensional distributions of outcomes, whereas indices explicitly dealing with multiple circumstances are not uncommon in segregation literatures. When T>A or T<A, perfect inequality is attained if and only if there is complete association between outcome and type, meaning that all people belonging to the same type have the same outcome, though all people facing the same outcome do not necessarily belong to the same type; when T=A, perfect inequality is attained if and only if there is absolute association between outcome and type, meaning all people belonging to the same type have the same outcome and viceversa (Yalonetzky 2012).
201
their circumstances. More specifically, a finer partition of types leads to unambiguously
larger value of the PC index (and therefore higher between-group inequality) when there
are more types than the categories of the outcome; otherwise the result is ambiguous.
Ferreira and Gignoux (2011), however, argue that empirical estimates provide “lower
bounds” of the true degree of inequality of opportunity, as it is difficult to gather full
information on circumstances determining types.
In this study, two cases are considered. In both cases, the outcome variable is years of
schooling, which takes value 0-18 representing, respectively, illiterate (years of
schooling=0), one year of schooling, two years of schooling, and so on. The two cases
differ in the number of circumstance, and hence types, they define. In the first case, there
is only one circumstance (either ethnicity or location of residence) with two categories
(Han and non-Han; or rural versus urban). The sample is therefore partitioned into two
groups. The PC index in (Eq.11) is then calculated. It measures Han-Minority inequality
of educational opportunity conditional on ethnicity or location of residence. In the
second case, there are four circumstances, each with two categories: ethnicity (Han or
non-Han), location (rural or urban), mother’s education (below versus above primary
school), and father’s education (below versus above primary school). The sample is
therefore divided into eight groups corresponding to eight types. In this case, the PC
index calculated using (Eq.11) measures Han-Minority inequality of educational
opportunity conditional on not only ethnicity, but also parental education and location of
residence. Since the number of types (eight) does not exceed the number outcome
categories (19), whether the finer partition will lead to larger value of the PC index and
202
therefore higher between-group inequality is not known a priori. The results are
presented in Tables 8.1 and 8.2
4.4 Results
4.4.1 Inequality in level: Han-Minority Differences in Average Years of Schooling
Table 4 presents Han-Minority differences in average years of schooling by survey year
for people of different age groups. The following patterns are noted:
First, Han-minority difference in years of schooling was small in both magnitude and
significance level among people 15 years of age or below; and it had greatly decreased
among people between 15-19 years after 1997 (1.19 year with t-stat=5.62 in 1997 versus
0.31 year with t-stat=1.06 in 2006).
These suggest two things: for one thing, divergence is likely to start in the later stage of
junior secondary education but not before. By age 15, children showing little interest or
promise to enter college tend to leave school, and parents usually acquiesce in the drop-
out decision as an additional three years of senior secondary education would not
improve labor market outcome anyway. For another, more children tend to continue
schooling after junior secondary school, in the hope that they would eventually enter
college. This may be related to China’s higher education reform, which was started in
203
the mid-1990s, and has since lowered college admission threshold and improved high
school graduates’ chance of entering college17.
Second, for adults aged above 19 years, the Han-Minority disparity in average years of
schooling had remained at about one year and statistically significant at 1% level
throughout the period of study. That said, the absolute years of schooling received by all
adults, regardless of ethnicity, have significantly increased over time. For example, in
1989, average Han adults aged between 19 and 30 years had only 8.53 years of school,
but by 2006, Han adults at this age had on average 10.5 years of school. Similarly, years
of school received by average minority adults aged between 19 and 30 years had
increased from 7.71 years in 1989 to 9.38 years in 200618.
The increase in absolute years of schooling and the drop of Han-Minority education
inequality at the primary and secondary school level may be related to the successful
17 In year 1994, higher education institutions in China started to charge tuition and give students right to choose between state-allocated and self-selected jobs after graduation. In 1999, as a means to boost domestic demand and stimulate economic growth, China reformed its higher education system: universities previously fully taken care of by the government are left to manage their own finance. In order to survive and also to make profits, they started to charge tuition. Following the enact ion of the “College Admission Expansion Policy”, colleges lowered academic threshold for college admission but greatly lifted its financial threshold. One consequence of the reform is that college education becomes even more unaffordable for college students from rural households, although a small amount of subsidies may be available and rural households nationwide had more or less benefited from China’s remarkable economic growth and experienced significant improvement in household wealth in the past two decades. Another consequence of the reform, is that return on college education has fell sharply in China, as labor market cannot absorb the large number of college graduates produced by the nationwide “College Admission Expansion” policy put in place since 1999. 18 The improvement in absolute years of schooling one received over time can also be seen through comparisons across different blocks of Table 4, which compares education outcome of people from different generations. Take year 2006 column of Table 4 as an example, older Han adults received only 7.16 years of schooling on average, while younger Han adults received 10.5 years on average; similarly, older minority adults received 6.02 years of schooling on average, while younger minority adults received 9.38 years on average.
204
enforcement of China’s “Law of Nine-Year Compulsory Education” enacted in 1986,
which stipulates that all children six years old or above, regardless of family and
socioeconomic background, must stay in school before they finish at least nine years of
school education (or finish middle school), which is offered for free to all school-age
children by the government. Further, to ensure the enforcement of the compulsory
education law among children from poor rural and/or minority households, the
government also offered “Two Exemptions and One Subsidy”, meaning free books, free
fees, and free room and board subsidies to children who must live in schools because
their villages are located in places where public transportations are not available.
Third, despite the improvement in absolute years of schooling, college education was still
not common among the surveyed adults. Regardless of ethnicity, the average years of
schooling received by young adults between 19 and 30 years had not exceeded 11 years,
suggesting that a majority of the survey population never entered college.
This is probably because over 65 percent of the CHNS sample is rural (as shown in Table
3), which conforms to the rural population share in the entire Chinese population. For
many rural children in China who still suffer from inadequate access to qualified
educational facilities including good teachers, college education is still beyond their
academic limit, despite the higher education reform that greatly lowers college admission
threshold. Further, college education has become more expensive for most rural
households, since universities also greatly lift their tuition threshold.
205
Perhaps more important is that rural children and their parents no longer value higher
education as much as they used to. Since the higher education reform, college graduates
previously receiving state-allocated jobs upon graduation are left on their own to find a
job. But since college admission is greatly expanded, supply of college graduates quickly
exceeded the labor market demand, and many fresh graduates have to take on jobs
previously taken by secondary school graduates. Rural youth and their parents are
tremendously de-motivated when they find that with a middle school diploma, they
would still earn about the same wages as people with a college degree, and start earning
money at least seven years earlier if they drop out from middle school.
Figure 3 presents the distribution of years of schooling by ethnicity and by age group.
Clearly, Han advantage in education is only obvious for people of older ages. Therefore,
in the following inequality analyses, I focused on people above 19 years of age.
206
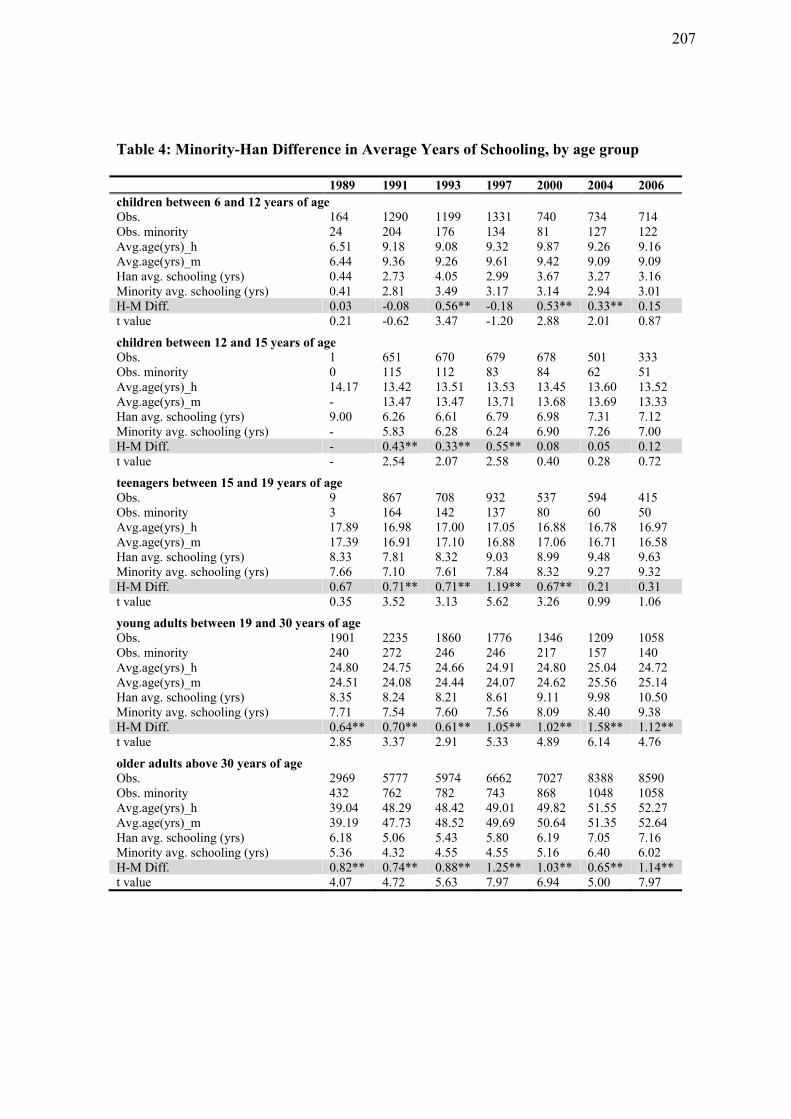
Table 4: Minority-Han Difference in Average Years of Schooling, by age group 1989 1991 1993 1997 2000 2004 2006 children between 6 and 12 years of ageObs. 164 1290 1199 1331 740 734 714 Obs. minority 24 204 176 134 81 127 122 Avg.age(yrs)_h 6.51 9.18 9.08 9.32 9.87 9.26 9.16 Avg.age(yrs)_m 6.44 9.36 9.26 9.61 9.42 9.09 9.09 Han avg. schooling (yrs) 0.44 2.73 4.05 2.99 3.67 3.27 3.16 Minority avg. schooling (yrs) 0.41 2.81 3.49 3.17 3.14 2.94 3.01 H-M Diff. 0.03 -0.08 0.56** -0.18 0.53** 0.33** 0.15 t value 0.21 -0.62 3.47 -1.20 2.88 2.01 0.87
children between 12 and 15 years of ageObs. 1 651 670 679 678 501 333 Obs. minority 0 115 112 83 84 62 51 Avg.age(yrs)_h 14.17 13.42 13.51 13.53 13.45 13.60 13.52 Avg.age(yrs)_m - 13.47 13.47 13.71 13.68 13.69 13.33 Han avg. schooling (yrs) 9.00 6.26 6.61 6.79 6.98 7.31 7.12 Minority avg. schooling (yrs) - 5.83 6.28 6.24 6.90 7.26 7.00 H-M Diff. - 0.43** 0.33** 0.55** 0.08 0.05 0.12 t value - 2.54 2.07 2.58 0.40 0.28 0.72
teenagers between 15 and 19 years of age Obs. 9 867 708 932 537 594 415 Obs. minority 3 164 142 137 80 60 50 Avg.age(yrs)_h 17.89 16.98 17.00 17.05 16.88 16.78 16.97 Avg.age(yrs)_m 17.39 16.91 17.10 16.88 17.06 16.71 16.58 Han avg. schooling (yrs) 8.33 7.81 8.32 9.03 8.99 9.48 9.63 Minority avg. schooling (yrs) 7.66 7.10 7.61 7.84 8.32 9.27 9.32 H-M Diff. 0.67 0.71** 0.71** 1.19** 0.67** 0.21 0.31 t value 0.35 3.52 3.13 5.62 3.26 0.99 1.06
young adults between 19 and 30 years of age Obs. 1901 2235 1860 1776 1346 1209 1058 Obs. minority 240 272 246 246 217 157 140 Avg.age(yrs)_h 24.80 24.75 24.66 24.91 24.80 25.04 24.72 Avg.age(yrs)_m 24.51 24.08 24.44 24.07 24.62 25.56 25.14 Han avg. schooling (yrs) 8.35 8.24 8.21 8.61 9.11 9.98 10.50 Minority avg. schooling (yrs) 7.71 7.54 7.60 7.56 8.09 8.40 9.38 H-M Diff. 0.64** 0.70** 0.61** 1.05** 1.02** 1.58** 1.12** t value 2.85 3.37 2.91 5.33 4.89 6.14 4.76
older adults above 30 years of age Obs. 2969 5777 5974 6662 7027 8388 8590 Obs. minority 432 762 782 743 868 1048 1058 Avg.age(yrs)_h 39.04 48.29 48.42 49.01 49.82 51.55 52.27 Avg.age(yrs)_m 39.19 47.73 48.52 49.69 50.64 51.35 52.64 Han avg. schooling (yrs) 6.18 5.06 5.43 5.80 6.19 7.05 7.16 Minority avg. schooling (yrs) 5.36 4.32 4.55 4.55 5.16 6.40 6.02 H-M Diff. 0.82** 0.74** 0.88** 1.25** 1.03** 0.65** 1.14** t value 4.07 4.72 5.63 7.97 6.94 5.00 7.97
207
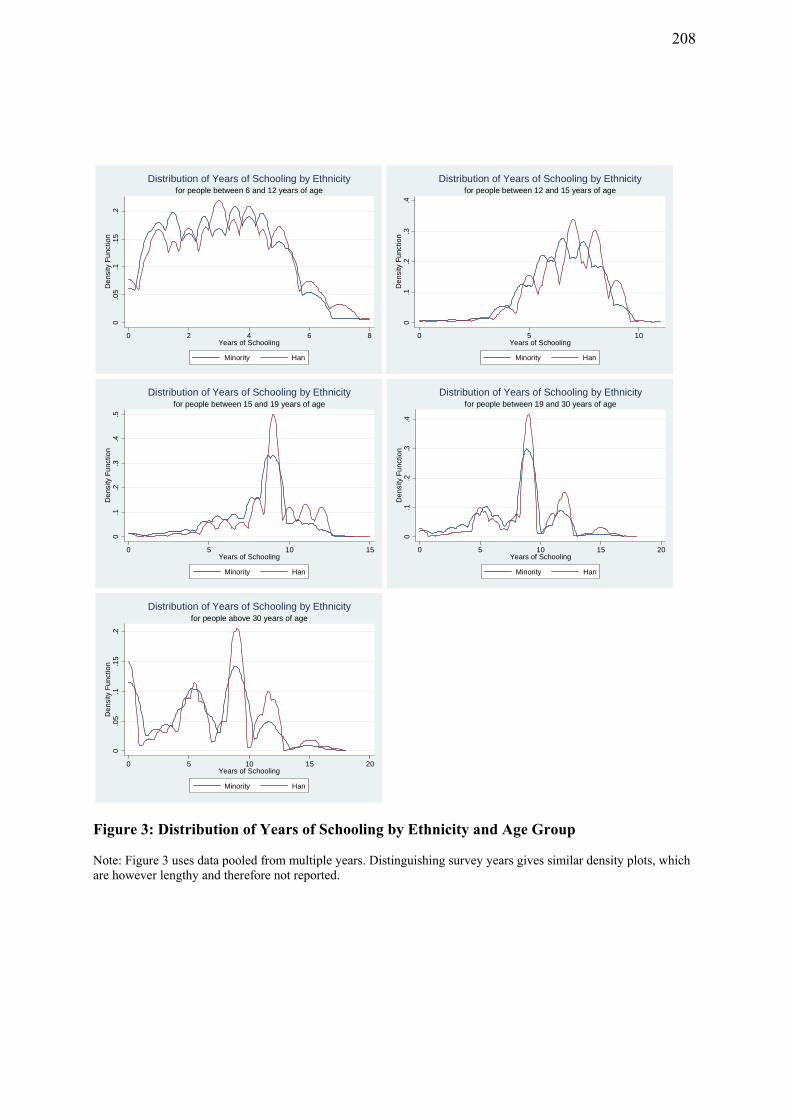
0.0
5.1
.15
.2D
ens
ity F
unc
tion
0 2 4 6 8Years of Schooling
Minority Han
for people between 6 and 12 years of ageDistribution of Years of Schooling by Ethnicity
0.1
.2.3
.4D
ens
ity F
unc
tion
0 5 10Years of Schooling
Minority Han
for people between 12 and 15 years of ageDistribution of Years of Schooling by Ethnicity
0.1
.2.3
.4.5
De
nsity
Fu
nctio
n
0 5 10 15Years of Schooling
Minority Han
for people between 15 and 19 years of ageDistribution of Years of Schooling by Ethnicity
0.1
.2.3
.4D
ens
ity F
unc
tion
0 5 10 15 20Years of Schooling
Minority Han
for people between 19 and 30 years of ageDistribution of Years of Schooling by Ethnicity
0.0
5.1
.15
.2D
ens
ity F
unc
tion
0 5 10 15 20Years of Schooling
Minority Han
for people above 30 years of ageDistribution of Years of Schooling by Ethnicity
Figure 3: Distribution of Years of Schooling by Ethnicity and Age Group Note: Figure 3 uses data pooled from multiple years. Distinguishing survey years gives similar density plots, which are however lengthy and therefore not reported.
208
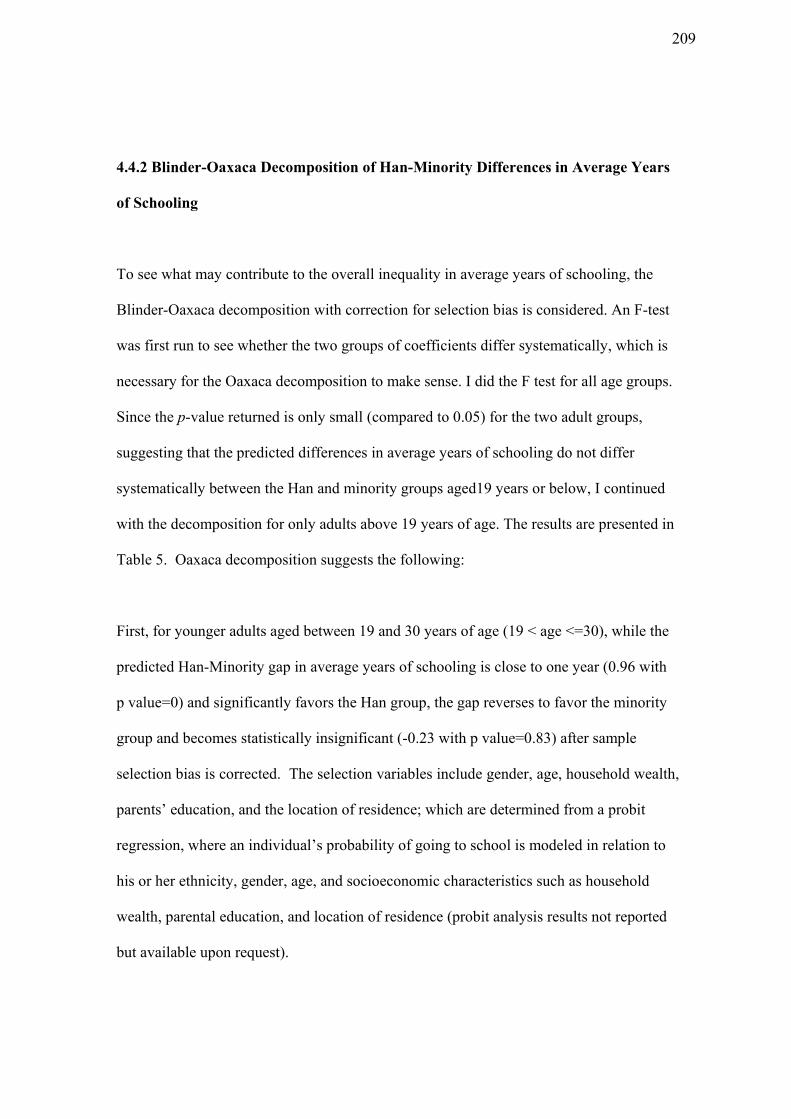
4.4.2 Blinder-Oaxaca Decomposition of Han-Minority Differences in Average Years
of Schooling
To see what may contribute to the overall inequality in average years of schooling, the
Blinder-Oaxaca decomposition with correction for selection bias is considered. An F-test
was first run to see whether the two groups of coefficients differ systematically, which is
necessary for the Oaxaca decomposition to make sense. I did the F test for all age groups.
Since the p-value returned is only small (compared to 0.05) for the two adult groups,
suggesting that the predicted differences in average years of schooling do not differ
systematically between the Han and minority groups aged19 years or below, I continued
with the decomposition for only adults above 19 years of age. The results are presented in
Table 5. Oaxaca decomposition suggests the following:
First, for younger adults aged between 19 and 30 years of age (19 < age <=30), while the
predicted Han-Minority gap in average years of schooling is close to one year (0.96 with
p value=0) and significantly favors the Han group, the gap reverses to favor the minority
group and becomes statistically insignificant (-0.23 with p value=0.83) after sample
selection bias is corrected. The selection variables include gender, age, household wealth,
parents’ education, and the location of residence; which are determined from a probit
regression, where an individual’s probability of going to school is modeled in relation to
his or her ethnicity, gender, age, and socioeconomic characteristics such as household
wealth, parental education, and location of residence (probit analysis results not reported
but available upon request).
209
Second, for adults aged above 30 years, after correction for selection bias, Han-Minority
difference in average years of schooling greatly increased and remained significant,
though only at 10% rather than the 1% significance level when sample selection bias was
not adjusted. Further, only a small portion of the overall gap (0.10 out of 3.52) is
explained by differences in endowments (mother’s education and living in rural areas)19.
Together, the above two observations suggest that ethnicity weakly associated with
individual educational outcome, which is also implied by statistics in Table 4.
Third, for both adult groups, the predicted Han-Minority difference in average years of
schooling is not explained by differences in endowments, even though Oaxaca
decomposition based on pooled OLS tends to overstate the explained part of the
educational gap as OLS using pooled panel data may ignore serial correlation (Cameron
and Trivedi, 2005, p.729). Rather, it is more related to the “unexplained” part, which
includes mostly differences in the effects of endowments (especially rural residence and
mother’s education); but also subsumes the effects of group differences in unobserved
predictors, or “group membership” (Jones and Kelley, 1984). In another word, minority
adults are perhaps not less educated because they were endowed with fewer resources,
but mostly because they benefited less from the endowed resources compared to their
19 For categorical predictors, such as gender, ethnicity, parental years of schooling, decomposition results would depend on the choice of the omitted base category (Jones 1983; Jones and Kelley 1984; Oaxaca and Ransom 1999; Nielsen 2000; Horrace and Oaxaca 2001; Gardeazabal and Ugidos 2004; Polavieja 2005; Yun 2005b). To obtain Oaxaca decomposition results independent of the choice of the omitted category, I computed the decomposition based on "normalized effects", which are expressed as deviations from the grand mean. For mechanism behind this method, see Suits (1984) and Yun (2005b). For how the method is implemented in STATA, see Jann (2008).
210
Han counterparts who were not significantly better endowed. Possible reasons could be
that many ethnic minority communities do not value school education as much as the Han
communities. For example, the ethnic-Dai people in southwestern China prefer to send
their children to monasteries for education. Unwillingness to attend regular schools (as
opposed to monasteries) and learn the Han language (i.e. Mandarin) also has a long
history in Tibet. In the late 19th century, when the Qing imperial court made the first
attempt to enforce free basic school education in Tibet, compulsory education was
strongly opposed by local people. Many Tibetan parents would rather hire someone to
attend government-sponsored school for their children than sending them in to “suffer”
(Yan, 2006; Li, 2011). Minority girls also tend to delay school enrollment or to drop out
early because school education carries no weight in the marriage market.
211
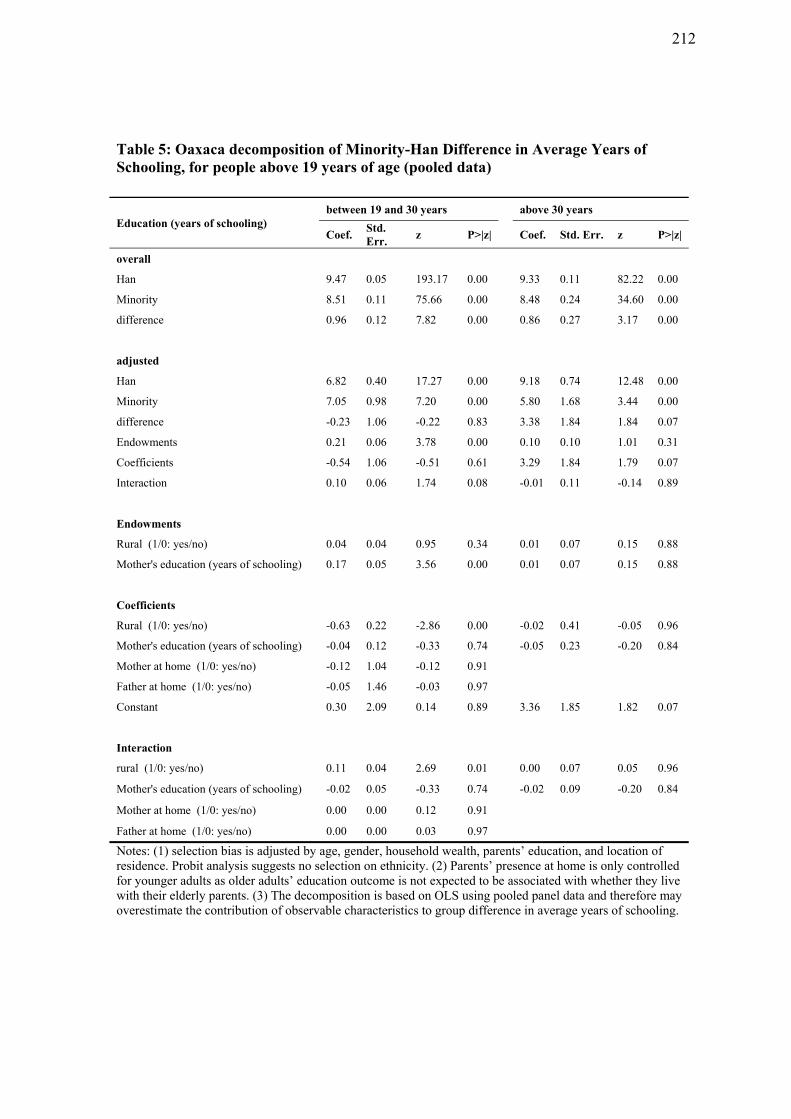
Table 5: Oaxaca decomposition of Minority-Han Difference in Average Years of Schooling, for people above 19 years of age (pooled data)
Education (years of schooling) between 19 and 30 years above 30 years
Coef. Std. Err.
z P>|z|
Coef. Std. Err. z P>|z|
overall
Han 9.47 0.05 193.17 0.00 9.33 0.11 82.22 0.00
Minority 8.51 0.11 75.66 0.00 8.48 0.24 34.60 0.00
difference 0.96 0.12 7.82 0.00 0.86 0.27 3.17 0.00
adjusted
Han 6.82 0.40 17.27 0.00 9.18 0.74 12.48 0.00
Minority 7.05 0.98 7.20 0.00 5.80 1.68 3.44 0.00
difference -0.23 1.06 -0.22 0.83 3.38 1.84 1.84 0.07
Endowments 0.21 0.06 3.78 0.00 0.10 0.10 1.01 0.31
Coefficients -0.54 1.06 -0.51 0.61 3.29 1.84 1.79 0.07
Interaction 0.10 0.06 1.74 0.08 -0.01 0.11 -0.14 0.89
Endowments
Rural (1/0: yes/no) 0.04 0.04 0.95 0.34 0.01 0.07 0.15 0.88
Mother's education (years of schooling) 0.17 0.05 3.56 0.00 0.01 0.07 0.15 0.88
Coefficients
Rural (1/0: yes/no) -0.63 0.22 -2.86 0.00 -0.02 0.41 -0.05 0.96
Mother's education (years of schooling) -0.04 0.12 -0.33 0.74 -0.05 0.23 -0.20 0.84
Mother at home (1/0: yes/no) -0.12 1.04 -0.12 0.91
Father at home (1/0: yes/no) -0.05 1.46 -0.03 0.97
Constant 0.30 2.09 0.14 0.89 3.36 1.85 1.82 0.07
Interaction
rural (1/0: yes/no) 0.11 0.04 2.69 0.01 0.00 0.07 0.05 0.96
Mother's education (years of schooling) -0.02 0.05 -0.33 0.74 -0.02 0.09 -0.20 0.84
Mother at home (1/0: yes/no) 0.00 0.00 0.12 0.91
Father at home (1/0: yes/no) 0.00 0.00 0.03 0.97
Notes: (1) selection bias is adjusted by age, gender, household wealth, parents’ education, and location of residence. Probit analysis suggests no selection on ethnicity. (2) Parents’ presence at home is only controlled for younger adults as older adults’ education outcome is not expected to be associated with whether they live with their elderly parents. (3) The decomposition is based on OLS using pooled panel data and therefore may overestimate the contribution of observable characteristics to group difference in average years of schooling.
212
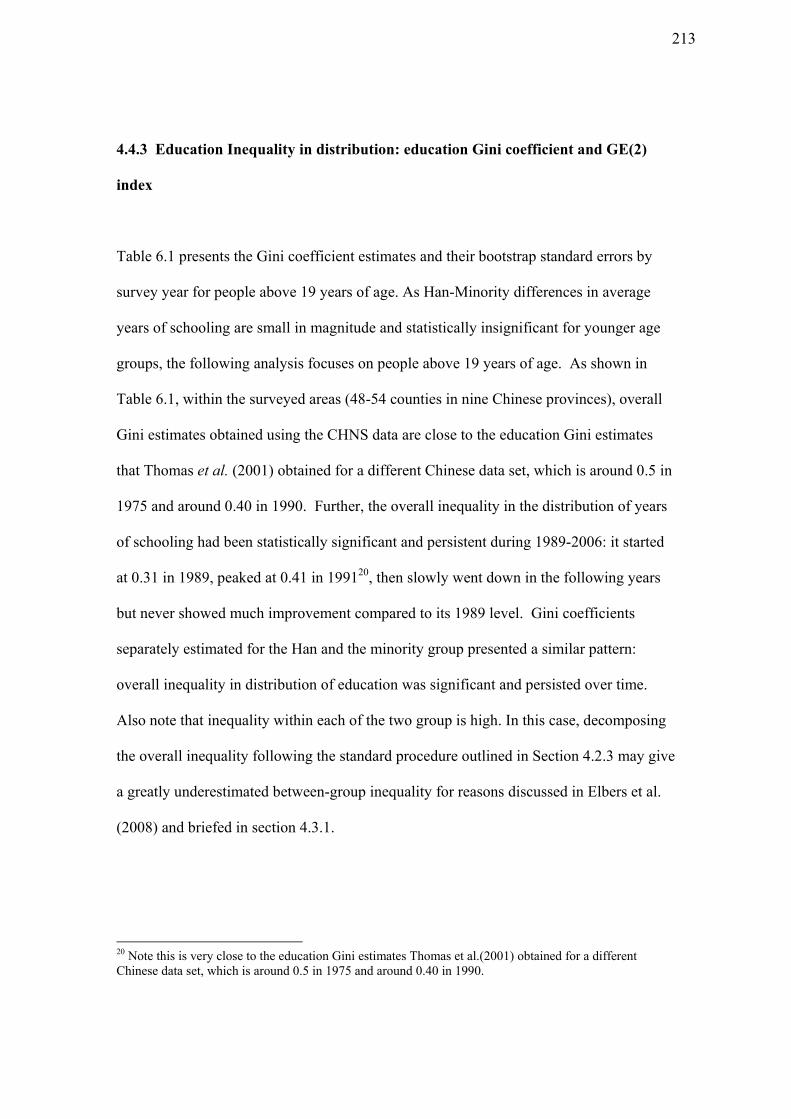
4.4.3 Education Inequality in distribution: education Gini coefficient and GE(2)
index
Table 6.1 presents the Gini coefficient estimates and their bootstrap standard errors by
survey year for people above 19 years of age. As Han-Minority differences in average
years of schooling are small in magnitude and statistically insignificant for younger age
groups, the following analysis focuses on people above 19 years of age. As shown in
Table 6.1, within the surveyed areas (48-54 counties in nine Chinese provinces), overall
Gini estimates obtained using the CHNS data are close to the education Gini estimates
that Thomas et al. (2001) obtained for a different Chinese data set, which is around 0.5 in
1975 and around 0.40 in 1990. Further, the overall inequality in the distribution of years
of schooling had been statistically significant and persistent during 1989-2006: it started
at 0.31 in 1989, peaked at 0.41 in 199120, then slowly went down in the following years
but never showed much improvement compared to its 1989 level. Gini coefficients
separately estimated for the Han and the minority group presented a similar pattern:
overall inequality in distribution of education was significant and persisted over time.
Also note that inequality within each of the two group is high. In this case, decomposing
the overall inequality following the standard procedure outlined in Section 4.2.3 may give
a greatly underestimated between-group inequality for reasons discussed in Elbers et al.
(2008) and briefed in section 4.3.1.
20 Note this is very close to the education Gini estimates Thomas et al.(2001) obtained for a different Chinese data set, which is around 0.5 in 1975 and around 0.40 in 1990.
213
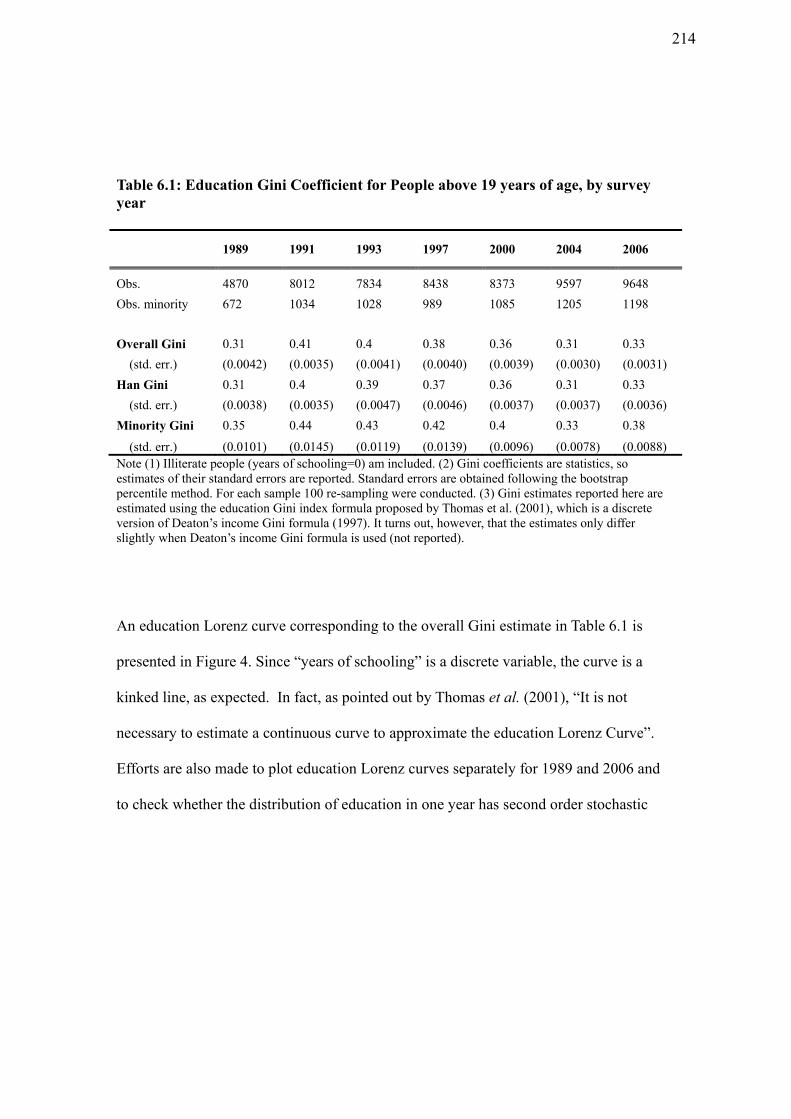
Table 6.1: Education Gini Coefficient for People above 19 years of age, by survey year
1989 1991 1993 1997 2000 2004 2006
Obs. 4870 8012 7834 8438 8373 9597 9648
Obs. minority 672 1034 1028 989 1085 1205 1198
Overall Gini 0.31 0.41 0.4 0.38 0.36 0.31 0.33
(std. err.) (0.0042) (0.0035) (0.0041) (0.0040) (0.0039) (0.0030) (0.0031)
Han Gini 0.31 0.4 0.39 0.37 0.36 0.31 0.33
(std. err.) (0.0038) (0.0035) (0.0047) (0.0046) (0.0037) (0.0037) (0.0036)
Minority Gini 0.35 0.44 0.43 0.42 0.4 0.33 0.38
(std. err.) (0.0101) (0.0145) (0.0119) (0.0139) (0.0096) (0.0078) (0.0088) Note (1) Illiterate people (years of schooling=0) am included. (2) Gini coefficients are statistics, so estimates of their standard errors are reported. Standard errors are obtained following the bootstrap percentile method. For each sample 100 re-sampling were conducted. (3) Gini estimates reported here are estimated using the education Gini index formula proposed by Thomas et al. (2001), which is a discrete version of Deaton’s income Gini formula (1997). It turns out, however, that the estimates only differ slightly when Deaton’s income Gini formula is used (not reported).
An education Lorenz curve corresponding to the overall Gini estimate in Table 6.1 is
presented in Figure 4. Since “years of schooling” is a discrete variable, the curve is a
kinked line, as expected. In fact, as pointed out by Thomas et al. (2001), “It is not
necessary to estimate a continuous curve to approximate the education Lorenz Curve”.
Efforts are also made to plot education Lorenz curves separately for 1989 and 2006 and
to check whether the distribution of education in one year has second order stochastic
214
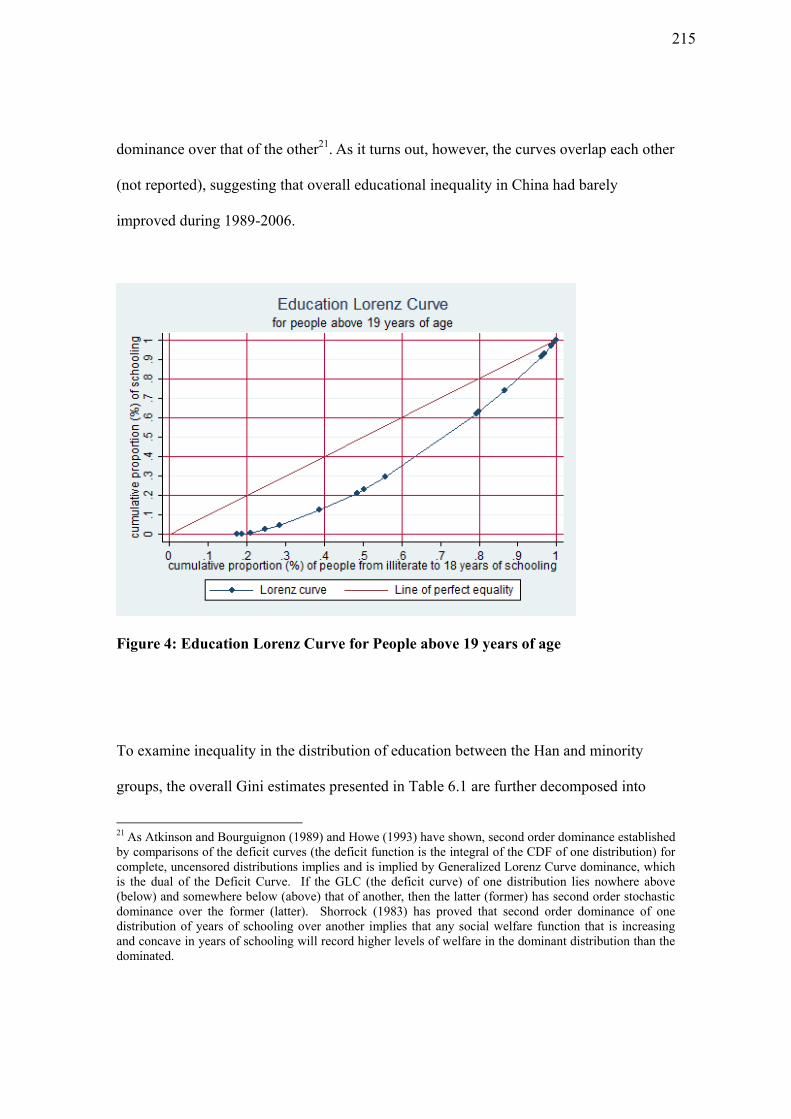
dominance over that of the other21. As it turns out, however, the curves overlap each other
(not reported), suggesting that overall educational inequality in China had barely
improved during 1989-2006.
Figure 4: Education Lorenz Curve for People above 19 years of age
To examine inequality in the distribution of education between the Han and minority
groups, the overall Gini estimates presented in Table 6.1 are further decomposed into
21 As Atkinson and Bourguignon (1989) and Howe (1993) have shown, second order dominance established by comparisons of the deficit curves (the deficit function is the integral of the CDF of one distribution) for complete, uncensored distributions implies and is implied by Generalized Lorenz Curve dominance, which is the dual of the Deficit Curve. If the GLC (the deficit curve) of one distribution lies nowhere above (below) and somewhere below (above) that of another, then the latter (former) has second order stochastic dominance over the former (latter). Shorrock (1983) has proved that second order dominance of one distribution of years of schooling over another implies that any social welfare function that is increasing and concave in years of schooling will record higher levels of welfare in the dominant distribution than the dominated.
215
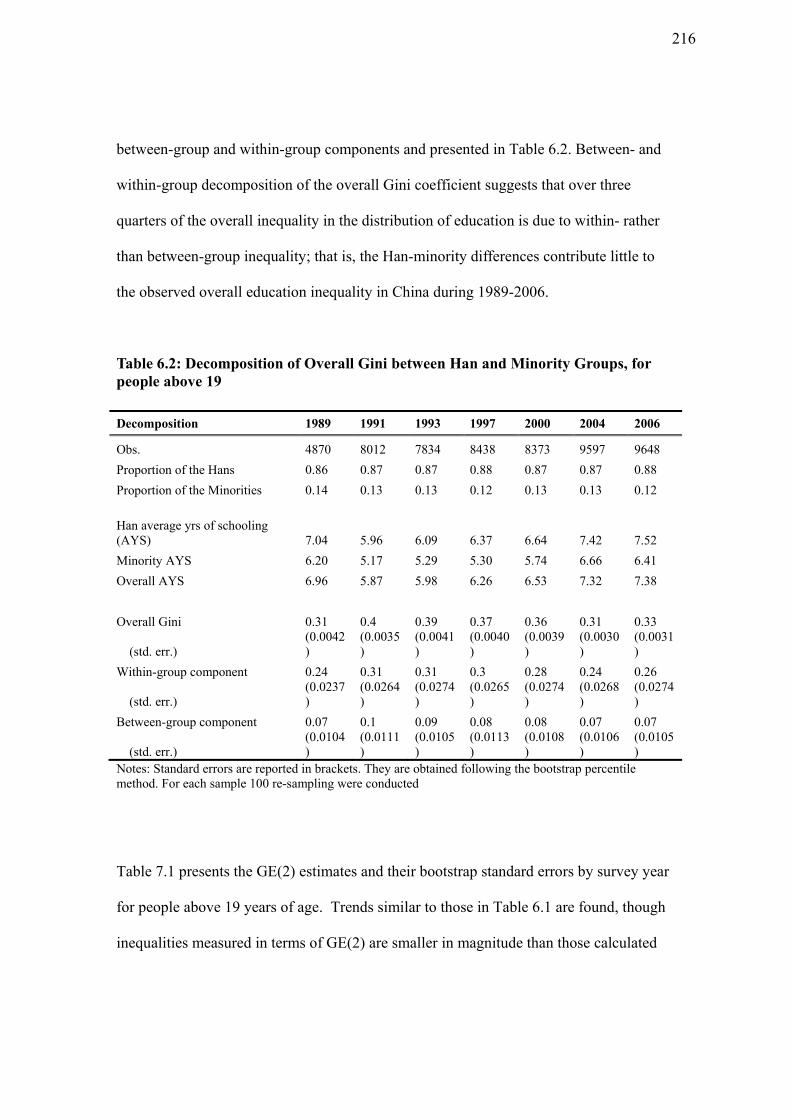
between-group and within-group components and presented in Table 6.2. Between- and
within-group decomposition of the overall Gini coefficient suggests that over three
quarters of the overall inequality in the distribution of education is due to within- rather
than between-group inequality; that is, the Han-minority differences contribute little to
the observed overall education inequality in China during 1989-2006.
Table 6.2: Decomposition of Overall Gini between Han and Minority Groups, for people above 19
Decomposition 1989 1991 1993 1997 2000 2004 2006
Obs. 4870 8012 7834 8438 8373 9597 9648
Proportion of the Hans 0.86 0.87 0.87 0.88 0.87 0.87 0.88
Proportion of the Minorities 0.14 0.13 0.13 0.12 0.13 0.13 0.12
Han average yrs of schooling (AYS) 7.04 5.96 6.09 6.37 6.64 7.42 7.52
Minority AYS 6.20 5.17 5.29 5.30 5.74 6.66 6.41
Overall AYS 6.96 5.87 5.98 6.26 6.53 7.32 7.38
Overall Gini 0.31 0.4 0.39 0.37 0.36 0.31 0.33
(std. err.) (0.0042)
(0.0035)
(0.0041)
(0.0040)
(0.0039)
(0.0030)
(0.0031)
Within-group component 0.24 0.31 0.31 0.3 0.28 0.24 0.26
(std. err.) (0.0237)
(0.0264)
(0.0274)
(0.0265)
(0.0274)
(0.0268)
(0.0274)
Between-group component 0.07 0.1 0.09 0.08 0.08 0.07 0.07
(std. err.) (0.0104)
(0.0111)
(0.0105)
(0.0113)
(0.0108)
(0.0106)
(0.0105)
Notes: Standard errors are reported in brackets. They are obtained following the bootstrap percentile method. For each sample 100 re-sampling were conducted
Table 7.1 presents the GE(2) estimates and their bootstrap standard errors by survey year
for people above 19 years of age. Trends similar to those in Table 6.1 are found, though
inequalities measured in terms of GE(2) are smaller in magnitude than those calculated
216
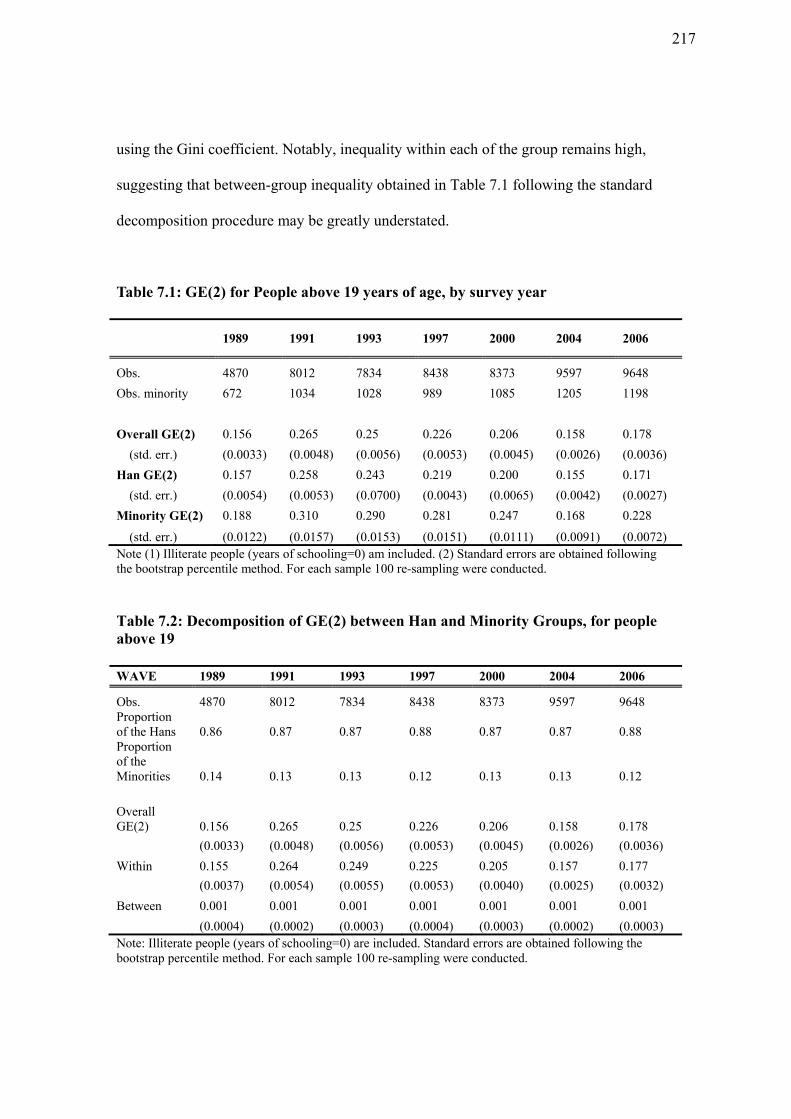
using the Gini coefficient. Notably, inequality within each of the group remains high,
suggesting that between-group inequality obtained in Table 7.1 following the standard
decomposition procedure may be greatly understated.
Table 7.1: GE(2) for People above 19 years of age, by survey year
1989 1991 1993 1997 2000 2004 2006
Obs. 4870 8012 7834 8438 8373 9597 9648
Obs. minority 672 1034 1028 989 1085 1205 1198
Overall GE(2) 0.156 0.265 0.25 0.226 0.206 0.158 0.178
(std. err.) (0.0033) (0.0048) (0.0056) (0.0053) (0.0045) (0.0026) (0.0036)
Han GE(2) 0.157 0.258 0.243 0.219 0.200 0.155 0.171
(std. err.) (0.0054) (0.0053) (0.0700) (0.0043) (0.0065) (0.0042) (0.0027)
Minority GE(2) 0.188 0.310 0.290 0.281 0.247 0.168 0.228
(std. err.) (0.0122) (0.0157) (0.0153) (0.0151) (0.0111) (0.0091) (0.0072) Note (1) Illiterate people (years of schooling=0) am included. (2) Standard errors are obtained following the bootstrap percentile method. For each sample 100 re-sampling were conducted.
Table 7.2: Decomposition of GE(2) between Han and Minority Groups, for people above 19 WAVE 1989 1991 1993 1997 2000 2004 2006
Obs. 4870 8012 7834 8438 8373 9597 9648 Proportion of the Hans 0.86 0.87 0.87 0.88 0.87 0.87 0.88 Proportion of the Minorities 0.14 0.13 0.13 0.12 0.13 0.13 0.12
Overall GE(2) 0.156 0.265 0.25 0.226 0.206 0.158 0.178
(0.0033) (0.0048) (0.0056) (0.0053) (0.0045) (0.0026) (0.0036)
Within 0.155 0.264 0.249 0.225 0.205 0.157 0.177
(0.0037) (0.0054) (0.0055) (0.0053) (0.0040) (0.0025) (0.0032)
Between 0.001 0.001 0.001 0.001 0.001 0.001 0.001
(0.0004) (0.0002) (0.0003) (0.0004) (0.0003) (0.0002) (0.0003) Note: Illiterate people (years of schooling=0) are included. Standard errors are obtained following the bootstrap percentile method. For each sample 100 re-sampling were conducted.
217
Table 7.2 presents decomposition of GE(α=2) for adults above 19 years of age by survey
year. Compared to the overall Gini estimates, GE(2) estimates are smaller, suggesting
lower levels of inequality in the distribution of education. Similar to the Gini estimates,
GE(2) estimates are statistically significant, persistent over time, and largely explained by
with- rather than between-group inequality.
The very small contribution of between-group inequality to the overall inequality is not
surprising. For one thing, a large proportion of the analysis sample (68%) consists of
rural residents, and Han farmers are not expected to be significantly different from
minority farmers in educational attainment. For another, as shown in Table 6.1 and Table
7, the levels of inequality within each of the two groups are high. In this case,
decomposing the overall inequality following the standard procedure outlined in Section
4.2.3 may give a greatly underestimated between-group inequality for reasons discussed
in Elbers et al. (2008) and briefed in section 4.3.1. Efforts are made to adjust between-
group inequality estimates presented in Tables 6.2 and 7.2 following procedure proposed
by Elbers et al. (2008). After adjustments, the between-group components of both the
Gini estimates and the GE(2) estimates become significantly larger. In the GE(2) case,
post-adjustment between-group inequality accounts for about 8% of the overall inequality,
compared to less than 1% before adjustment. In the Gini case, post-adjustment between-
group inequality accounts for over 90% of the overall inequality, compared to less than
25% before adjustment. Since the overall inequalities measured by GE(2) are
significantly smaller than those measured by the Gini coefficient, and Elbers et al.
218
(2008)’s adjustment tend to find higher shares of between-group contributions for higher
levels of overall inequality, the adjusted results are only suggestive and therefore not
reported (available upon request).
4.4.4 Inequality of Educational Opportunity: Pearson-Cramer Index
Figure 5 reports the Pearson-Cramer index for all Chinese adults over age 19 during
1989-2006. The plot suggests a modest decline in inequality of opportunity over time.
The point estimates (reported in Table 8.1) are surrounded by narrow confidence
intervals (not reported), as is to be expected from the large sample size. The magnitude of
the index, however, is small (between 0.09 and 0.13), indicating that the ethnicity is
largely unrelated to years of schooling in China during 1989-2006.
A question that naturally follows is what factors are related to the distribution of
education. To explore this, the following alternative cases are considered. First, people
are partitioned not by ethnicity but by location of residence (rural versus urban). Second,
suppose people are partitioned not only by ethnicity (Han versus non-Han), but also by
residence of location (rural versus urban), mother’s education (below versus above
primary school), and father’s education (below versus above primary school). Then, in
Roemer’s vocabulary, there are four circumstances, each with two categories. The sample
can therefore be divided into eight types.
219
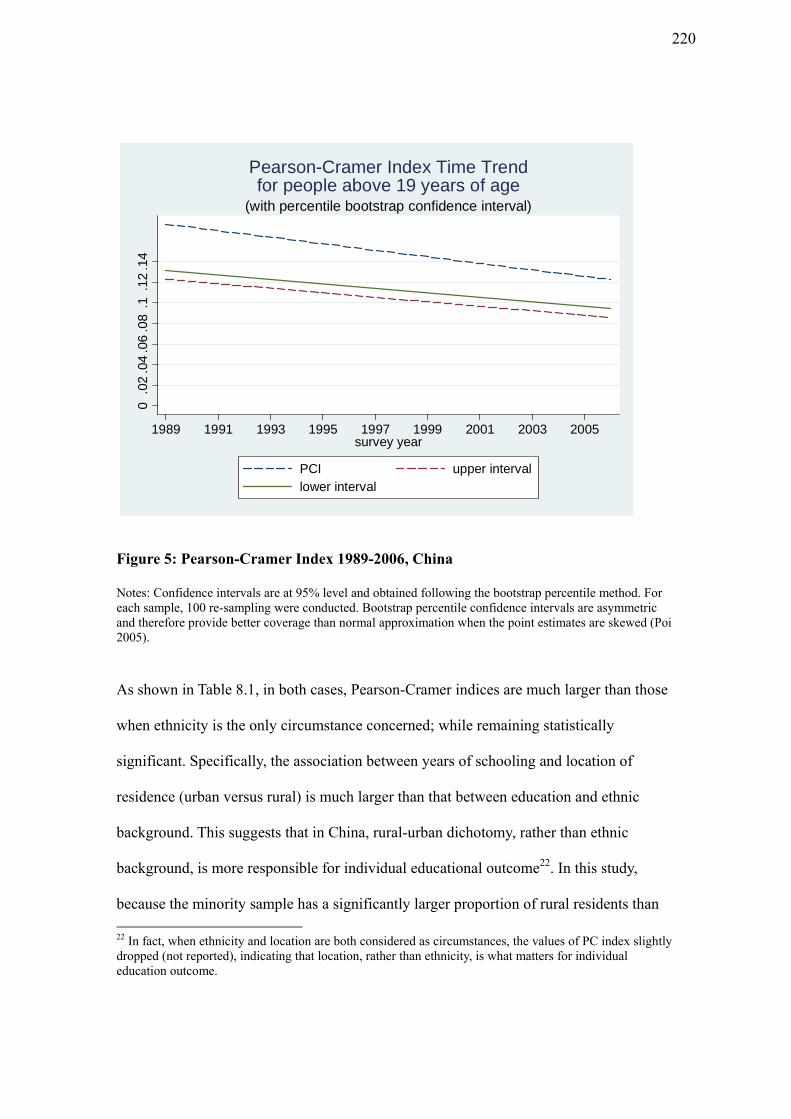
0.0
2.0
4.0
6.0
8.1
.12
.14
1989 1991 1993 1995 1997 1999 2001 2003 2005survey year
PCI upper intervallower interval
(with percentile bootstrap confidence interval)
Pearson-Cramer Index Time Trendfor people above 19 years of age
Figure 5: Pearson-Cramer Index 1989-2006, China
Notes: Confidence intervals are at 95% level and obtained following the bootstrap percentile method. For each sample, 100 re-sampling were conducted. Bootstrap percentile confidence intervals are asymmetric and therefore provide better coverage than normal approximation when the point estimates are skewed (Poi 2005).
As shown in Table 8.1, in both cases, Pearson-Cramer indices are much larger than those
when ethnicity is the only circumstance concerned; while remaining statistically
significant. Specifically, the association between years of schooling and location of
residence (urban versus rural) is much larger than that between education and ethnic
background. This suggests that in China, rural-urban dichotomy, rather than ethnic
background, is more responsible for individual educational outcome22. In this study,
because the minority sample has a significantly larger proportion of rural residents than
22 In fact, when ethnicity and location are both considered as circumstances, the values of PC index slightly dropped (not reported), indicating that location, rather than ethnicity, is what matters for individual education outcome.
220
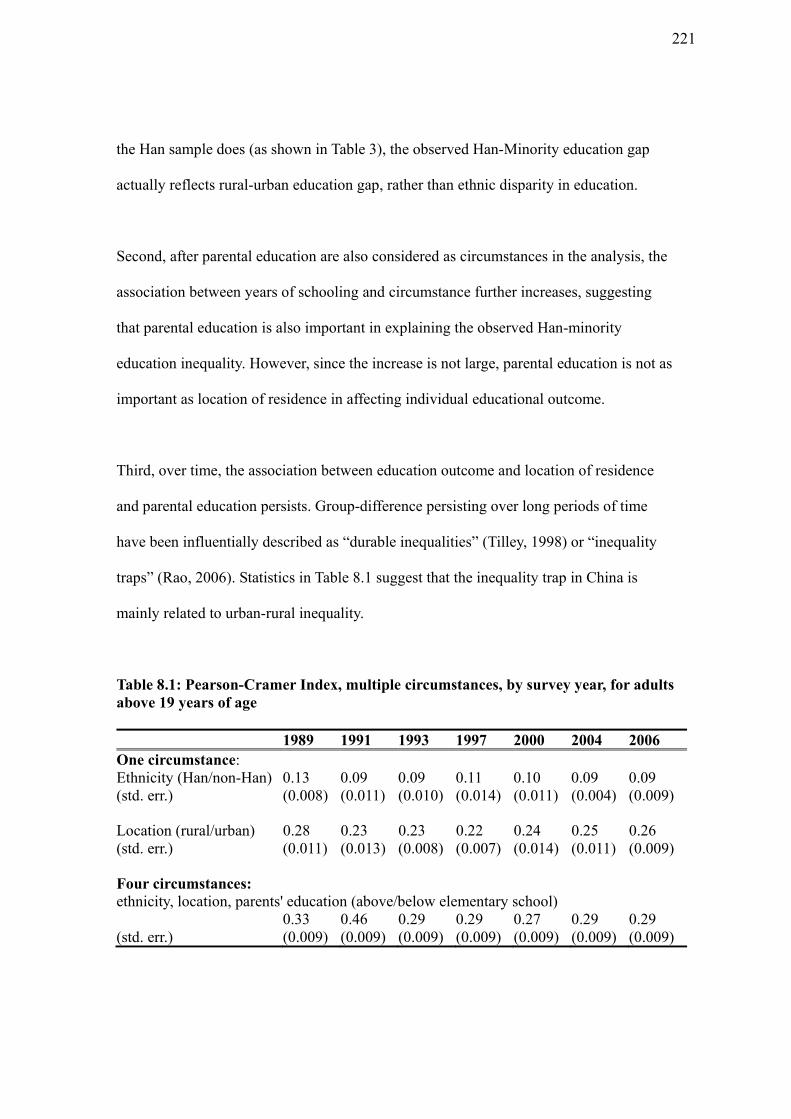
the Han sample does (as shown in Table 3), the observed Han-Minority education gap
actually reflects rural-urban education gap, rather than ethnic disparity in education.
Second, after parental education are also considered as circumstances in the analysis, the
association between years of schooling and circumstance further increases, suggesting
that parental education is also important in explaining the observed Han-minority
education inequality. However, since the increase is not large, parental education is not as
important as location of residence in affecting individual educational outcome.
Third, over time, the association between education outcome and location of residence
and parental education persists. Group-difference persisting over long periods of time
have been influentially described as “durable inequalities” (Tilley, 1998) or “inequality
traps” (Rao, 2006). Statistics in Table 8.1 suggest that the inequality trap in China is
mainly related to urban-rural inequality.
Table 8.1: Pearson-Cramer Index, multiple circumstances, by survey year, for adults above 19 years of age
1989 1991 1993 1997 2000 2004 2006 One circumstance: Ethnicity (Han/non-Han) 0.13 0.09 0.09 0.11 0.10 0.09 0.09 (std. err.) (0.008) (0.011) (0.010) (0.014) (0.011) (0.004) (0.009)
Location (rural/urban) 0.28 0.23 0.23 0.22 0.24 0.25 0.26 (std. err.) (0.011) (0.013) (0.008) (0.007) (0.014) (0.011) (0.009)
Four circumstances: ethnicity, location, parents' education (above/below elementary school)
0.33 0.46 0.29 0.29 0.27 0.29 0.29 (std. err.) (0.009) (0.009) (0.009) (0.009) (0.009) (0.009) (0.009)
221
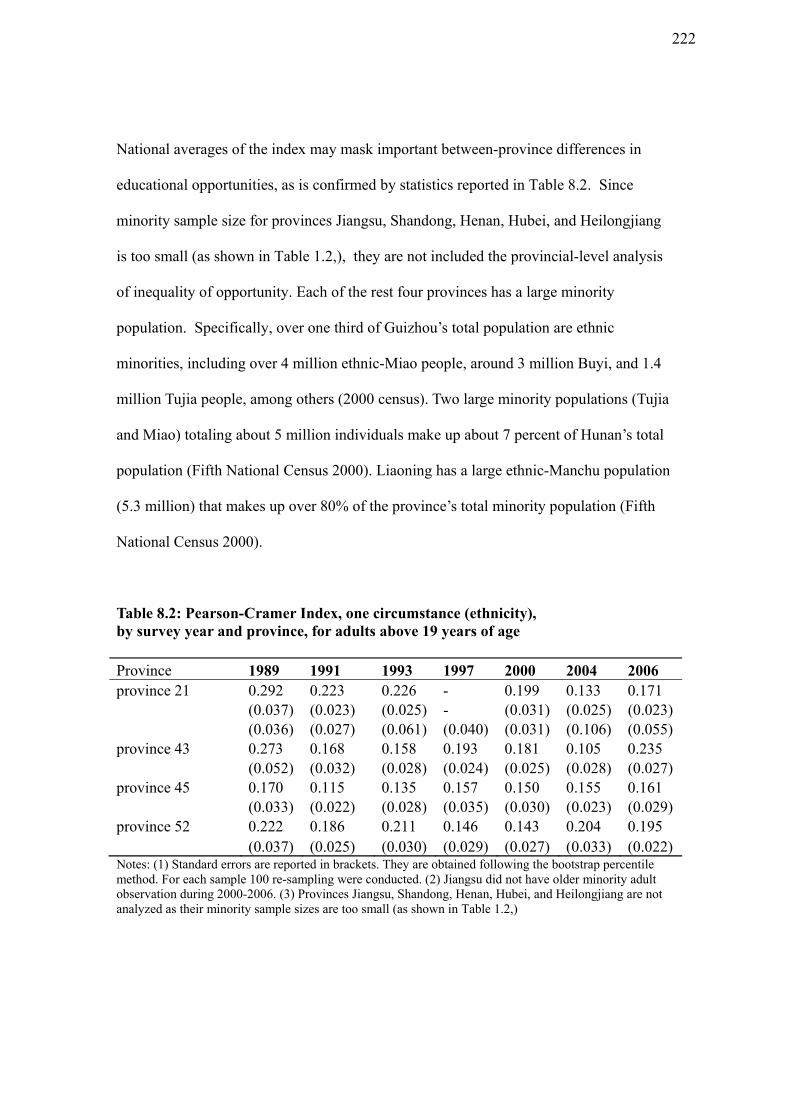
National averages of the index may mask important between-province differences in
educational opportunities, as is confirmed by statistics reported in Table 8.2. Since
minority sample size for provinces Jiangsu, Shandong, Henan, Hubei, and Heilongjiang
is too small (as shown in Table 1.2,), they are not included the provincial-level analysis
of inequality of opportunity. Each of the rest four provinces has a large minority
population. Specifically, over one third of Guizhou’s total population are ethnic
minorities, including over 4 million ethnic-Miao people, around 3 million Buyi, and 1.4
million Tujia people, among others (2000 census). Two large minority populations (Tujia
and Miao) totaling about 5 million individuals make up about 7 percent of Hunan’s total
population (Fifth National Census 2000). Liaoning has a large ethnic-Manchu population
(5.3 million) that makes up over 80% of the province’s total minority population (Fifth
National Census 2000).
Table 8.2: Pearson-Cramer Index, one circumstance (ethnicity), by survey year and province, for adults above 19 years of age
Province 1989 1991 1993 1997 2000 2004 2006 province 21 0.292 0.223 0.226 - 0.199 0.133 0.171
(0.037) (0.023) (0.025) - (0.031) (0.025) (0.023) (0.036) (0.027) (0.061) (0.040) (0.031) (0.106) (0.055)
province 43 0.273 0.168 0.158 0.193 0.181 0.105 0.235 (0.052) (0.032) (0.028) (0.024) (0.025) (0.028) (0.027)
province 45 0.170 0.115 0.135 0.157 0.150 0.155 0.161 (0.033) (0.022) (0.028) (0.035) (0.030) (0.023) (0.029)
province 52 0.222 0.186 0.211 0.146 0.143 0.204 0.195 (0.037) (0.025) (0.030) (0.029) (0.027) (0.033) (0.022) Notes: (1) Standard errors are reported in brackets. They are obtained following the bootstrap percentile method. For each sample 100 re-sampling were conducted. (2) Jiangsu did not have older minority adult observation during 2000-2006. (3) Provinces Jiangsu, Shandong, Henan, Hubei, and Heilongjiang are not analyzed as their minority sample sizes are too small (as shown in Table 1.2,)
222
As shown in Table 8.2, given any survey year, provincial-level PC indices listed in Table
8.2 are much larger than the national-level estimates reported in Table 8.1. This suggests
that the relatively high association between ethnicity and educational outcome within
Liaoning, Hunan, Guizhou, and Guangxi are largely masked by the low ethnicity-
education association in Jiangsu, Shandong, Henan, Hubei, and Heilongjiang. In terms of
the rankings of the level of opportunity inequality, Guangxi Zhuang Autonomous Region
is the most equal in most years while Guizhou tends to be the most unequal in most years.
5. Regression Analysis
5.1 Empirical Models
This section is devoted to regression analysis that further explores what socio-
demographic factors may be associated with individual education outcome as measured
by years of schooling, and how they are associated. First, a simple ordinary least square
(OLS) model is applied to the pooled panel data to provide a simple benchmark to which
results of more sophisticated regressions can be compared. Next, a time and province
fixed effects (FE) model taking advantage of the panel features of the CHNS data is
applied to provide consistent and more precise estimates of the socio-demographic effects
on education.
Due to data limitation and the complex, multifaceted nature of inequality, no attempt is
223
made to establish any causal link between years of schooling and an individual’s socio-
economic background in this study. That said, regression analysis, coupled with
decompositions in the section 4, should allow glimpse of interesting patterns and shed
light on the correlates of education in China.
I start with a simple OLS regression using pooled panel data.
ii XSEq )12.(
In (Eq.12), Si is individual i’s completed years of schooling in formal schools. X is a
vector of individual and household level control variables including: ethnicity dummy
(1/0: minority/Han), gender dummy (1/0: male/female), age in years (to 2 decimal points),
location dummy (1/0: rural/urban), asset index which serves as proxy for household
wealth level, province economic development level which is an ordinal variable taking
values 1-9 for nine CHNS provinces from the poorest to the richest (that is, larger values
indicate provinces with higher economic development level). For children aged 19 years
or below, years of schooling received by their parents and a dummy for parental absence
from/presence at home are also controlled23.
Pooled OLS regression is conceptually straightforward and generates simple benchmark
results. However, it has several drawbacks. For one thing, pooled estimators are often
inconsistent since the assumption that individual heterogeneity is uncorrelated with the
23 In recent years, more and more young farmers moved to urban areas in seek of off-farm employment as they could hardly eke out a basic living on their small plots of state-allocated land. Left behind in villages are their young children, usually taken care of by grandparents, sometimes other relatives. More and more observers have concerned that parental absence from home may have negatively affected school enrollment of these left-behind children, who have totaled 58 million by 2009, making up about one fifth of the total child population in China.
224
regressors is usually not supported by the data. For another, pooled OLS regression
ignores serial correlation that will almost certainly arise because the pooled model treats
multiple observations of a same individual as independent observations. The usual
formula for OLS standard errors in a pooled OLS regression therefore underestimates
standard errors and inflates t-statistic. For consistent and more precise estimates of the
effects of the explanatory variables, panel data are collected and panel data regression
models exploiting their panel features should be used to analyze them.
Taking advantage of the panel features of the CHNS data, this study estimates the
following fixed effects model:
ipttpipt XSEq )13.(
In (Eq.13), Sipt is years of schooling received by individual i in province p during survey
year t. It is a function of: province fixed effects μp which control for time-invariant
heterogeneity between provinces, such as geographical characteristics (for example land
suitability for agricultural activities); year fixed effects ρt which control for changes over
time that affect all individuals similarly, for example the national higher education
reforms introduced in the late 1990s; and a number of socioeconomic characteristics that
vary by individual, including ethnicity, age, male dummy, rural dummy, household
wealth, and parental education and parental presence at home for children aged 19 or
below. All standard errors are clustered at the province level.
The fixed effects (FE) model is perhaps the most widely used panel regression model. It
greatly reduces the serially correlation in error terms and generates consistent estimates
225
without assuming independence between unobservable individual heterogeneity and the
regressors, which, in contrast, is the key assumption for both the pooled OLS and the
random effects (RE) model, another commonly used panel regression model, to generate
consistent estimates. In this study, F-tests comparing the FE and the RE models fitted to
the CHNS data indicate that province- and time-specific fixed effects are present (F-
statistics not reported but available upon request), and therefore suggest that the FE
model is the correct model to be applied to the CHNS data.
The pooled OLS and the RE models, however, have a desirable property that is not
possessed by the FE model: they permit identification of all regressors regardless of the
value of T (Greene also said: 575 none of the desirable features of the RE estimators
relies on T going to infinity), while the FE model does not permit identification of the
marginal effects of time-invariant regressors such as gender and ethnicity in short panels
with large N but limited T (Cameron and Trivedi, 2005, p.697; Nerlove, 2002, p.284).
This study therefore reports both pooled OLS and FE estimates (the RE estimates are
very similar to the pooled estimates, and are available upon request).
5.2 Regression Results
Table 9 presents pooled OLS and province- and year-fixed effects regression results by
age group. FE models better fit the data, as suggested by the larger R2 and to be expected
from discussions in the previous subsection. Several patterns are noteworthy:
226
First, ethnicity is not associated with years of schooling for all age groups except adults
above 30 years of age. This is consistent with inequality analysis results reported in
Section 4.4, where multiple inequality measures and their decompositions suggest that
ethnicity is not important in explaining the observed Han-minority gap in average years
of schooling and its distribution.
Second, regardless of age and the econometric model used to fit the data, household
wealth and parental education are significantly (at the 1% or 5% level) and positively
related to more years of education one receives. This is consistent with the literature,
which have reached agreement on similar conclusions using different research methods
including the conventional education production function (EPF) approach, the newer
methods based on randomized controlled trials or natural experiments, and good
qualitative methods (Boissiere, 2004).
Third, some variables are important in explaining educational outcomes for people of
certain age groups. Children between 6 and 12 years of age, for example, tend to receive
more schooling if they live with their mother, as suggested by the significant FE
estimator of the marginal effect of mother’s presence of home presented in column (2),
line (6); whereas parents’ presence at home has no significant impact on years of
schooling received by children aged between 12 and 19 once province- and year-fixed
effects are controlled. Ways through which mother’s presence may affect younger child’s
schooling are imaginable. Early enrollment is one of them, as mother is usually keen on
227
enrolling her child in elementary school as soon as he or she seems ready, while other
caregivers including the father may not be as eager as she is. Being older in age is
strongly associated with more years of schooling for all age groups except adults 30 years
or above in the survey year, which is expected as at age 30 or older, most people in any
society must have finished schooling. Living in rural areas negatively affects years of
schooling received by young people aged between 19 and 30 years.
228
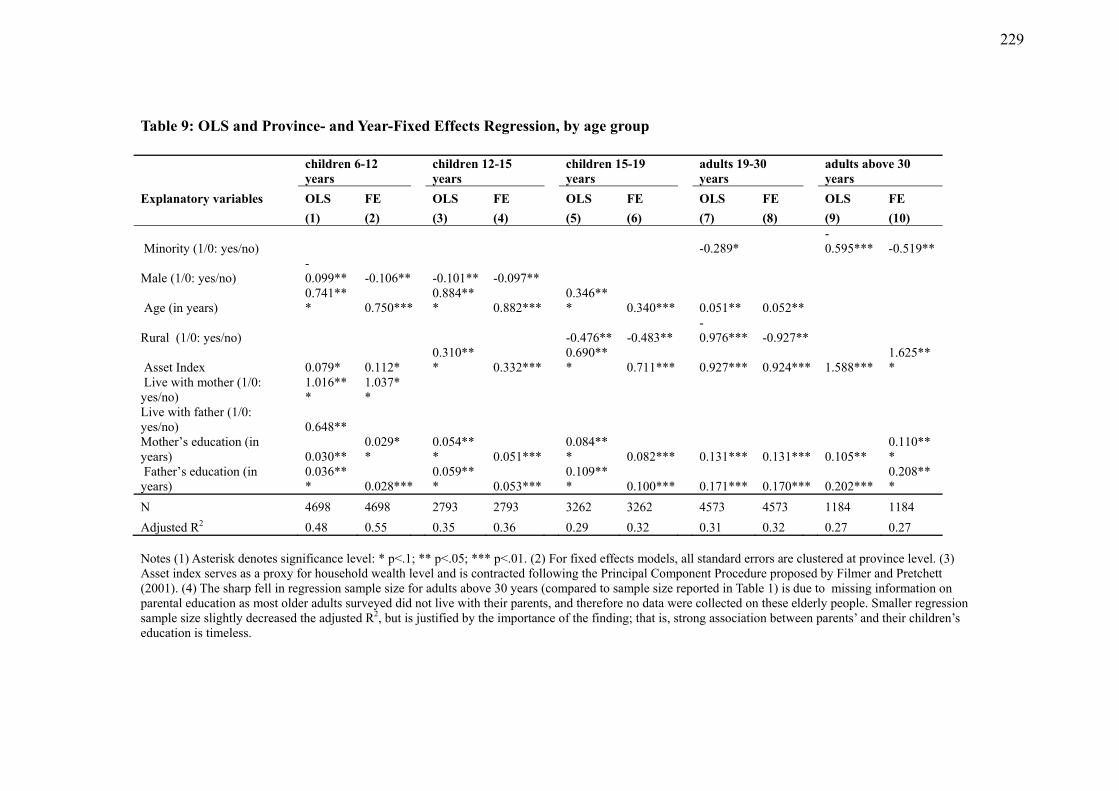
Table 9: OLS and Province- and Year-Fixed Effects Regression, by age group
children 6-12 years
children 12-15 years
children 15-19 years
adults 19-30 years
adults above 30 years
Explanatory variables OLS FE OLS FE OLS FE OLS FE OLS FE
(1) (2) (3) (4) (5) (6) (7) (8) (9) (10)
Minority (1/0: yes/no) -0.289* -0.595*** -0.519**
Male (1/0: yes/no) -0.099** -0.106** -0.101** -0.097**
Age (in years) 0.741*** 0.750***
0.884*** 0.882***
0.346*** 0.340*** 0.051** 0.052**
Rural (1/0: yes/no) -0.476** -0.483** -0.976*** -0.927**
Asset Index 0.079* 0.112* 0.310*** 0.332***
0.690*** 0.711*** 0.927*** 0.924*** 1.588***
1.625***
Live with mother (1/0: yes/no)
1.016***
1.037**
Live with father (1/0: yes/no) 0.648** Mother’s education (in years) 0.030**
0.029**
0.054*** 0.051***
0.084*** 0.082*** 0.131*** 0.131*** 0.105**
0.110***
Father’s education (in years)
0.036*** 0.028***
0.059*** 0.053***
0.109*** 0.100*** 0.171*** 0.170*** 0.202***
0.208***
N 4698 4698 2793 2793 3262 3262 4573 4573 1184 1184
Adjusted R2 0.48 0.55 0.35 0.36 0.29 0.32 0.31 0.32 0.27 0.27 Notes (1) Asterisk denotes significance level: * p<.1; ** p<.05; *** p<.01. (2) For fixed effects models, all standard errors are clustered at province level. (3) Asset index serves as a proxy for household wealth level and is contracted following the Principal Component Procedure proposed by Filmer and Pretchett (2001). (4) The sharp fell in regression sample size for adults above 30 years (compared to sample size reported in Table 1) is due to missing information on parental education as most older adults surveyed did not live with their parents, and therefore no data were collected on these elderly people. Smaller regression sample size slightly decreased the adjusted R2, but is justified by the importance of the finding; that is, strong association between parents’ and their children’s education is timeless.
229
6. Conclusions
This study makes the first attempt to empirically investigate the extent and correlates of
education inequality between China’s ethnic minority and Han populations of different
ages, across nine Chinese provinces , and during a period of 17 years. Taking advantage
of a very recently-developed dissimilarity index especially suitable for the measurement
of inequality of educational opportunity, this study also makes the first attempt to explore
inequality of educational opportunity in China, a concept that has long earned its place in
the theories of social justice but has been rarely tested by applied economists.
Efforts made in this research to study education inequality using multiple inequality
measures and to explore possible sources of the observed Han-minority education gap
using multiple decomposition and regression techniques are also unseen in the current
literature on education inequality in China. First, Han-minority inequality in the levels of
education is estimated. Blinder-Oaxaca decomposition with Heckman correction for
selection bias is then performed to break the gap into the part attributable to differences in
observable endowments and the part attributable to differences in the effects of the
observables and also differences in the unobservables. Second, Gini coefficient and the
Generalized Entropy index are estimated and broken into between- and within-group
components. Adjustment proposed by Elbers et al. (2008) to overcome drawbacks stemming
from the inherent structure of the standard decomposition technique is applied to better reveal Han-
minority inequality in the distribution of education. Third, Pearson-Cramer index is estimated to
measure the extent of inequality of educational opportunity. The index also allows examination of
the associations between education inequality and circumstances that affect educational
230
outcome but are beyond one’s control, such as ethnicity, location of residence, and
parental education. Finally, pooled OLS and province- and time-fixed effects regressions
are run to further explore education correlates.
The main findings of this research are summarized as follows: First, Han-Minority
education gap was small in magnitude and statistically insignificant among children
between 6 and 19 years of age; though it was sizable, statistically significant, and
persistent over time for adults. Second, difference in ethnic background explains little of
the observed educational gap between minority and Han adults in the CHNS sample.
Instead, urban-rural dichotomy, parental education, and household wealth level are
strongly associated with individual educational outcome for people of all ages. Age,
gender, location of residence, and mother’s presence at home are important for young
children’s education outcome, too.
7. Limitations
Despite efforts made, this research is subject to several limitations. First, about three
quarters of the people in the CHNS sample are rural residents; and the average years of
schooling completed by both the minority and the Han groups in the analysis had not
exceeded ten years. Therefore, this research has little to say about Han-minority
education inequality in urban areas and at tertiary education levels.
231
Second, the quality of education is beyond the scope of this paper. Education equality the
Chinese government has strived to promote during the decades after 1949 has been
focused on the provision of educational facilities and a minimal number of years of
formal schooling. Therefore, while the number of schools in minority areas was already
comparable with the rest of the nation as early as the 1980s, the quality of teachers and
the learning experience of students still vary greatly across regions and probably also
across ethnicity (Pan, 1982; Wei and Zhou, 1984;24Kwong and Xiao, 1989). It is
uncommon to see primary school graduates teaching primary school, secondary school
graduates teaching secondary, and some extreme cases, a grade three primary school
graduate may be teaching a grade four class (Wei and Zhou, 1984).
Third, as is true with most longitudinal data, the CHNS sample has attrition that is
concentrated on individuals who are female, older in age, less educated, and living in
rural areas or less developed provinces. Further, weights to make the data representative
are not available, as clearly stated on the CHNS website
(http://www.cpc.unc.edu/projects/china/data/datasets/data_downloads/longitudinal/weigh
ts-chns.pdf/view). That said, attrition should not be a major concern in this study. Firstly,
In order to mitigate the effects of attrition, the CHNS team replaced observations that had
dropped out with new observations randomly sampled from the original population.
Hirano et al. (2001) proved that “refreshment samples can improve inference under
conventional models by providing additional sample information”. Secondly, ethnicity is
found to be largely unrelated to attrition in the CHNS sample (not reported, available
24 PAN Wen (1982), “Exert all efforts in education work among the minorities”, Research in Theories of National Minorities, 2, pp. 37-41. WEI Shiyuan and ZHOU Guangde (1984), “Develop Education in the mountain areas to raise cultural level”, Research in Theories of National Minorities, 3, pp. 67-75.
232
upon request). Thirdly, the focus of this study is measurement of education inequality and
the associations, rather than causations, between individual outcome and socio-
demographic factors. Kempen and van Sonderen (2002) have shown that in this case,
attrition should not be a serious problem. Lastly, socio-demographic variables that are
found to be associated with attrition turned out to have explained very little of the
attrition in the sample. Fitzgerald, Gottschalk and Moffit (1998) have demonstrated that
in this case, attrition should not seriously distort the representativeness of the longitudinal
data, and its cross-sectional representativeness should remain roughly intact.
Finally, the CHNS questionnaire allows identification of four ethnic minority groups
(Tujia, Man, Buyi, and Miao), however, as the sample size for each of them is very small,
this study examines the four groups as a whole. Ignoring group differences among the
Chinese minorities may generate less precise results. This highlights the needs for future
research to revisit this study using better data on ethnic minority Chinese, which is yet to
be collected.
233
REFERENCES
Abul Naga, R. H., & Yalcin, T. (2008). Inequality Measurement for Ordered Response Health Data. Journal of Health Economics, 27(6), 1614-25.
Alesina, A., & Angeletos, G. M. (2005). Fairness and redistribution. American Economic
Review, 960-980. Allison, R. A., & Foster, J. (2004). Measuring Health Inequalities Using Qualitative Data.
Journal of Health Economics, 23(3), 505-24. Almås, I., Cappelen, A. W., Sørensen, E. Ø., & Tungodden, B. (2010). Fairness and the
development of inequality acceptance. Science, 328(5982), 1176-1178. Arneson, R. J. (1989). Equality of Opportunity for Welfare. Philosophical Studies, (56),
77-93. Arneson, R. J. (1990). Liberalism, Distributive Subjectivism, and Equal Opportunity for
Welfare. Philosophy & Public Affairs, 19(2), 158-94. Arrow, K. J. (1973). Some ordinalist-utilitarian notes on Rawls's theory of justice.
Journal of Philosophy, 70(9), 245-63. Asadullah, N., & Yalonetzky, G. (2012). Inequality of opportunity in India: changes over
time and across states. World Development, 40(6), 1151-63. Asselin, L. -M., Ki, J. -B., & Anh, V. T. (2009). Analysis of multidimensional poverty:
Theory and case studies. Dordrecht: Springer Verlag. Atkinson, A. B., & Bourguignon, F. (1990). The design of direct taxation and family
benefits. Journal of Public Economics, 41(1), 3-29, 41(1), 3-29. Banerjee, A. V., & Duflo, E. (2003). Inequality and growth: what can the data say?.
Journal of economic growth, 8(3), 267-299. Barros, R. P., Ferreira, F., Molinas, F., & Saavedra, J. (2009). Measuring inequality of
opportunities in Latin America and the Caribbean. Washington DC: World Bank. Benabou, R., & Tirole, J. (2006). Belief in a just world and redistributive politics. The
Quarterly Journal of Economics, 121(2), 699-746. Betts, J. R., & Roemer, J. (2007). Equalizing opportunity for racial and socioeconomic
groups in the United States through educational finance reform. In L. Woessmann, & P. E. Peterson (Ed.), Schools and the equal opportunity problem (pp. 209-38).
234
Cambridge, Mass: MIT Press. Bhalla, A. S., & Qiu, S. (2006). Poverty and inequality among Chinese minorities.
London: Routledge. Bhattacharya, N., & Mahalanobis, B. (1967). Regional disparities in household
consumption in India. Journal of the American Statistical Association, 62(317), 143-61.
Björklund, A., Jäntti, M., & Roemer, J. E. (2012). Equality of opportunity and the
distribution of long-run income in Sweden. Social Choice and Welfare, 39(2-3), 675-696.
Blau, P. M., & Duncan, O. D. (1967). The American occupational structure. New York:
Wiley. Boissiere, M. (2004). Determinants of primary education outcomes in developing
countries. World Bank, Independent Evaluation Group (IEG), Washington, DC. Bourguignon, F., Ferreira, F. H., & Menéndez, M. (2007). Inequality of outcomes and
inequality of opportunities in Brazil. Review of Income and Wealth, 53(4), 585-618. doi:10.1111/j.1475-4991.2007.00247.x
Brunori, P., Ferreira, F. H., & Paregine, V. (2013). Inequality of Opportunity, Income
Inequality and Economic Mobility: Some International Comparison. Policy Research Working Paper WPS6304. The World Bank.
Cameron, A. C., & Trivedi, P. K. (2005). Microeconometrics: Methods and applications.
Cambridge: Cambridge University Press. Checchi, D., & Peragine, V. (2010). Inequality of opportunity in Italy. The Journal of
Economic Inequality, 8(4), 429-50. Cohen, G. A. (1989). On the Currency of Egalitarian Justice. Ethnics, (99), 906-44. Cohen, G. A. (1990). Equality of What? On Welfare, Goods, and Capabilities. Recherches
economiques de Louvain, (56), 357-82. Cogneau, D., & Mesplé-Somps, S. (2009). Inequality of opportunity for income in five
countries of Africa. In B. Zheng, & J. A. Bishop (Ed.), Inequality and poverty II: Papers from the second Ecineq society meeting (pp. 99-128). Bingley: Emerald Group Publishing Limited.
Cowell, F. A. (1995). Measuring inequality (2nd ed.). New York: Oxford University Press
Inc. Cramér, H. (1946). Mathematical methods of statistics. Princeton: Princeton University
Press.
235
Dardanoni, V., Fields, G. S., Roemer, J., & Puerta, M. L. (2006). How demanding should
equality of opportunity be, and how much have we achieved?. In S. L. Morgan, D. B. Grusky, & G. S. Fields (Ed.), Mobility and inequality: Frontiers of research from sociology and economics (pp. 59-84). Stanford, Calif: Stanford University Press.
Davidson, R., & Duclos, J. Y. (2000). Statistical inference for stochastic dominance and
for the measurement of poverty and inequality. Econometrica, 68(6), 1435-1464. Duncan, O. D. (1969). Inequality and opportunity. Population Index, 35(4), 361-366,
35(4), 361-66. Dutta, I., & Foster, J. (2011). Inequality of happiness in the U.S.: 1972-2008. School of
Economics Discussion Paper No.1110, The University of Manchester. Dworkin, R. (1981a). What Is Equality? Part I: Equality of Welfare. Philosophy & Public
Affairs, 10(3), 185-246. Dworkin, R. (1981b). What Is Equality? Part 2: Equality of Resources. Philosophy &
Public Affairs, 10(4), 283-345. Dwyer, A. M. (2005). The Xinjiang conflict: Uyghur identity, language policy, and Elbers, C., Lanjouw, P., Mistiaen, J. A., & Özler, B. (2008). Reinterpreting between-
group inequality. Journal of Economic Inequality, 6(3), 231-45. Elder, T. E., Goddeeris, J. H., & Heider, S. J. (2010). Unexplained gaps and Oaxaca–
Blinder decompositions. Labour Economics, 17(1), 284-290. Labour Economics, 17(1), 284-90.
Everitt, B. (1992). The Analysis of Contingency Tables (2nd ed.). London: Chapman and
Hall. Fehr, E., & Fischbacher, U. (2003). The nature of human altruism. Nature, 425(6960),
785-791. Fehr, E., & Gächter, S. (2000). Fairness and retaliation: The economics of reciprocity.
The journal of economic perspectives, 14(3), 159-81. Fehr, E., & Schmidt, K. M. (1999). A theory of fairness, competition, and cooperation.
The quarterly journal of economics, 114(3), 817-68. Ferguson, B. D., Tandon, A., Gakidou, E., & Murray, C. J. (2003). Estimating permanent
income using indicator variables. Health systems performance assessment: debates, methods and empiricism. Geneva: World Health Organization, 747-60.
Ferreira, F. H., & Gignoux, J. (2011). The measurement of inequality of opportunity:
236
theory and application to Latin America. Review of Income and Wealth, 57(4), 622-57.
Filmer, D., & Pritchett, L. (2001). Estimating wealth effects without expenditure data–or
tears:An application to educational enrollments in states of India. Demography, 38(1), 115-32.
Fitzgerald, J., Gottschalk, P., & Moffitt, R. A. (1998). An analysis of sample attrition in
panel data: The Michigan Panel Study of Income Dynamics. NBER Technical Working Paper No. 220.
Fleurbaey, M., & Peragine, V. (2013). Ex ante versus ex post equality of opportunity.
Economica, 80(317), 118-130. Fleurbaey, M. (2008). Fairness, responsibility, and welfare. Oxford: Oxford University
Press. Gustaffson, B., & Ding, S. (2011). Assessing Ethnic Disparities in Economic Well-Being
in China: The Case of Han and Hui in Ningxia. Workshop on Economy and Society Development in China and the World.
Gustaffson, B., & Ding, S. (2009). Villages where China’s ethnic minorities live. China
Economic Review, 20(2), 193-207. Gustaffson, B., & Wei, Z. (2000). How and why has poverty in China changed? A study
based on microdata for 1988 and 1995. China Quarterly, 164(4), 983-1006. Gustafsson, B., & Ding, S. (2008). Temporary and persistent poverty among ethnic
minorities and the majority in rural China. Discussion Paper No. 3791. Bonn: Institute for the Study of Labor.
Gustafsson, B., & Li, S. (2003). The ethnic minority–majority income gap in rural China
during transition. Economic Development and Cultural Change, 51(4), 805-22. Hammer, J. (1998). Health outcomes across wealth groups in Brazil and India.
Development Research Group, World Bank, Washington, DC Processed. Hannum, E., & Xie, Y. (1998). Ethnic stratification in Northwest China: Occupational
Differences Between Han Chinese and National Minorities in Xinjiang, 1982-1990. Demography, 35(3), 323-33.
Hannum, E. (2002). Educational Stratification by Ethnicity in China: Enrollment and
Attainment in the Early Reform Years. Demography, 39(1), 95-117. Harsanyi, J. C., & University of California, B. (1973). Can the maximin principle serve
as a basis for morality?: A critique of John Rawls's theory. Berkeley: Center for
237
Research in Management Science, University of California, Berkeley. Heckman, J. J. (1979). Sample selection bias as a specification error. Econometrica:
Journal of the econometric society, 153-161. Hirano, K., Imbens, G. W., Ridder, G., & Ruben, D. B. (2001). Combining Panel Data
Sets with Attrition and Refreshment Samples. Econometrica, 69(6), 1645-59. Howe, D. (1993). An introduction to social work theory. Ashgate Publishing. Jones, F. L., & Kelley, J. (1984). Decomposing Differences between Groups A
Cautionary Note on Measuring Discrimination. Sociological Methods & Research, 12(3), 323-343, 12(3), 323-43.
Keane, M. P., & Roemer, J. E. (2007). Assessing policies to equalize opportunity using an
equilibrium model of educational and occupational choices. Journal of Public Economics, 93(7-8), 879-898.
Kempen, G. I., & Van Sonderen, E. (2002). Psychological attributes and changes in
disability among low-functioning older persons: Does attrition affect the outcomes?. Journal of clinical epidemiology, 55(3), 224-29.
Kwong, J., & Xiao, H. (1989). Educational equality among China's minorities.
Comparative Education, 25(2), 229-43. Lanjouw, P., & Rao, V. (2011). Revisiting between-group inequality measurement: An
application to the dynamics of caste inequality in two Indian villages. World Development, 39(2), 174-87.
Lefranc, A., Pistolesi, N., & Trannoy, A. (2008). Inequality of opportunities vs. inequality
of outcomes: Are Western societies all alike?. Review of Income and Wealth, 54(4), 513-46.
Li, H. (2011). A Commentary on the Phenomenon of Hire to Schooling in Tibetan
Education of Western Sichuan Province in the Period of the Republic of China (in Chinese). Journal of Tibet University, 26(2). doi:10.3969/j.issn.1005-5738.2011.02.014
Litchfield, J. A. (1999). Inequality: methods and tools. Text for World Bank's Website on
Inequality, Poverty, and Socio-economic Performance. http://www.clsbe.lisboa.ucp.pt/docentes/url/analeco2/Papers%5CLitchfield_Inequality_Methods_Tools.pdf. Last accessed 5-20-2013.
Llavador, H., & Roemer, J. E. (2001). An equal-opportunity approach to the allocation of
international aid. Journal of Development Economics, 64, 147-171.
238
Ma, R. (2006). Ethnic Relations in Contemporary China: Cultural Tradition and Ethnic Policies in China since 1949. Policy and Society, 25(1), 85-108.
Marrero, G. A., & Rodríguez, J. G. (2013). Inequality of opportunity and growth. Journal
of Development Economics, 104, 107-122. Mesa, E. P. (2007). Measuring education inequality in the Philippines (No. 2007, 04).
Discussion paper//School of Economics, University of the Philippines. Moser, C., & Felton, A. (2007). The Construction of an Asset Index Measuring Asset
Accumulation in Ecuador. Chronic Poverty Research Centre Working Paper 87. The Brookings Institution.
Nerlove, M. (2002). Essays in panel data econometrics. New York: Cambridge
University Press. Núñez, J., & Tartakowsky, A. (2007). Inequality of outcomes vs inequality of
opportunities in a developing country: An exploration analysis for Chile. Estudios de economía, 34(2), 185-202.
Oaxaca, R. (1973). Male-female wage differentials in urban labor markets. International
Economic Review, 14(3), 693-709. O'Donnell, O., Van Doorslaer, E., Wagstaff, A., & Lindelow, M. (2008). Chapter 12.
Explaining differences between groups: Oaxaca decomposition. In Analyzing health equity using household survey data: A guide to techniques and their implementation (pp. 147-57). Washington, D.C: World Bank.
O'Neill, D., Sweetman, O., & Van de Gaer, D. (2000). Equality of Opportunity and
Kernel Density Estimation: An Application to Intergenerational Mobility. In B. Thomas, R. Fomby, & C. Hill (Ed.), Advances in Econometrics, Volume 14 (pp. 259-274). Stanford: JAI Press Incorporated.
Ouyang, Y., & Pinstrup-Andersen, P. (2011). Health Inequality between Ethnic Minority
and Han Populations in China. World Development, 40(7), 1452-1468. Pistolesi, N. (2009). Inequality of opportunity in the land of opportunities, 1968–2001.
The Journal of Economic Inequality, 7(4), 411-33. Pyatt, G. (1976). On the interpretation and disaggregation of Gini coefficients. The
Economic Journal, 86(342), 243-255, 86(342), 243-55. Ramos, X., & Van de Gaer, D. (2012). Empirical approaches to inequality of opportunity:
principles, measures, and evidence. Working Paper, Department of Economics, University of Gent, Belgium.
239
Rao, Vijayendra. 2006. On “Inequality Traps” and Development Policy. © World Bank, Washington, DC. https://openknowledge.worldbank.org/handle/10986/9588.
Ravallion, M. (2012). Why Don’t We See Poverty Convergence?. American Economic
Review. http://www.cgdev.org/doc/events/3.09.10/Martin_Ravallion.pdf. Rawls, J. (1971). A theory of justice. Cambridge, MA: Belknap Press of Harvard
University Press. Reardon, S. F., & Firebaugh, G. (2002). Measures of Multi-group Segregation.
Sociological Methodology, 32(1), 33-67. Reardon, S. F. (2009). Measures of Ordinal Segregation. In Y. Flückiger, S. F. Reardon, &
J. Silber (Ed.), Occupational and residential segregation, Volume 17 of Research on Economic Inequality Series (pp. 129-155). Bingley: Emerald Group Publishing.
Roemer, J. E., Aaberge, R., Colombino, U., Fritzell, J., Jenkins, S. P., Lefranc, A., ... &
Zubiri, I. (2003). To what extent do fiscal regimes equalize opportunities for income acquisition among citizens?. Journal of Public Economics, 87(3), 539-65.
Roemer, J. E. (2006). Democracy, education, and equality: Graz-Schumpeter lectures.
Cambridge: Cambridge University Press. Roemer, J. E. (1998). Equality of opportunity. Cambridge, Mass: Harvard University
Press. Roemer, J. E. (1982). A general theory of exploitation and class. Cambridge, MA:
Harvard University Press. Roemer, J. (1993). A pragmatic theory of responsibility for the egalitarian planner.
Philosophy and Public Affair, 22(2), 146-166. Roemer, J. E. (2006). 2003, “Defending Equality of Opportunity. The Monist, 86(2), 261-
82. Roemer, J. E. (2002). Equality of opportunity: A progress report”,. Social Choice and
Welfare, 19(2), 455-71. Roemer, J. E. (2008). equality of opportunity : The New Palgrave Dictionary of
Economics. Retrieved February 12, 2013, from http://www.dictionaryofeconomics.com/article?id=pde2008_E000214.
Rong, X., & Shi, T. (n.d.). Educational Inequality in China. Contemporary China, 10(26),
107-24. Sahn, D. E., & Stifel, D. C. (2003). Exploring Alternative Measures of Welfare in the
Absence of Expenditure Data. Review of Income and Wealth, 49(4), 463-89.
240
Sato, H., & Ding, S. (2012). Ethnicity and Income in China: The Case of Ningxia. Center for Research on Contemporary Economic Systems Discussion Paper Series, No.46. Graduate School of Economics, Hitotsubashi University.
Schütz, G., Ursprung, H. W., & Wößmann, L. (2008). Education policy and equality of
opportunity. Kyklos, 61(2), 279-308. Sen, A. (1980). Equality of What?. In The Tanner lectures on human values, Volume 1
(pp. 353-369). Salt Lake City: University of Utah Press. Sen, A. (1985). Well-being, Agency, and Freedom: The Dewey Lectures 1984,". Journal
of Philosophy, (82), 169-221. Shorrock, A. F. (1980). The Class of Additively Decomposable Inequality Measures.
Econometrica, 48(3), 613-25. Silber, J., & Yalonetzky, G. (2011). Chapter 4 Measuring Inequality in Life Chances with
Ordinal Variables. In J. G. Rodríguez (Ed.), Inequality of opportunity: Theory and measurement (pp. 77-98). Bingley, U.K: Emerald.
Smyth, R., & Qian, X. (2008). Inequality and happiness in urban China. Economics
Bulletin, 4(23), 1-10, 4(23), 1-10. Sullivan, C. (2011). Ethnicity and Income Inequality in China. Paper Prepared for the
Population Association of America’s Annual Conference. Theil, H. (1967). Economics and information theory. Amsterdam: North-Holland Pub. Co. Thomas, V., Wang, Y., & Fan, X. (2001). Measuring education inequality: Gini
coefficients of education. World Bank Working Paper, No. 2525. Thorbecke, E., & Charumilind, C. (2002). Economic Inequality and Its Socioeconomic
Impact. World Development, 30(9), 1477-95. Tilly, C. (1998). Durable inequality. Berkeley: University of California Press. Van de Gaer, D. (1993). Equality of opportunity and investment in human capital. Ph.D.
thesis, K.U. Leuven. Wei, S., & Zhou, G. (1984). Develop dducation in the mountain areas to raise cultural
level. Research in Theories of National Minorities, (3), 67-75. Weitzman, M. S. (1970). Measures of overlap of income distributions of white and Negro
families in the United States (Vol. 22). US Bureau of the Census. Yalonetzky, G. (2012). A dissimilarity index of multidimensional inequality of
opportunity. The Journal of Economic Inequality, 10(3), 343-373, 10(0), 343-73.
241
Yalonetzky, G. (2010). A Comparison between the Pearson—based dissimilarity index and the multiple—group overlap index. mimeo OPHI Oxford University.
Yan, Q. (2006). The Exploration of the Tibetan "Gudu" in Modern Xikang (in Chinese).
Ethno-National Studies, (6). doi:10.3969/j.issn.0256-1891.2006.06.009 Zang, X. (1998). Ethnic representation in the current Chinese leadership. The China
Quarterly, (153), 107-27. Zhang, Y., & Eriksson, T. (2010). Inequality of Opportunity and Income Inequality in
Nine Chinese Provinces, 1989-2006. China Economic Review, 21(4), 607-16. Zhang, J., & Li, T. (2002). International Inequality and Convergence in Educational
Attainment. Review of Development Economics, 6(3), 383-92. Zhang, H., Zhang, L., Luo, R., & Li, Q. (2008). Does Education Still Pay Off in Rural
China: Revisit the Impact of Education on Off‐farm Employment and Wages. China & World Economy, 16(2), 50-65.
242
Related Documents