Research paper − 74 − Synthesiology - English edition Vol.9 No.2 pp.74–86 (Sep. 2016) is easy to use from the viewpoint of the users” was discussed, and it was proposed that a geoinformation organization considering secondary use Term 1 would be promoted in the Intellectual Infrastructure Plan. Based on this plan, AIST set the data of the drilling surveys that it originally conducted as standards, conducted a wide range of strata correlation using the borehole data of public works and others disclosed by the local governments, and engaged in research for analyzing the 3D distribution of strata by computer processing for the urban areas. We are working on a method that allows anyone to browse and use such a 3D geological model on the web, as well as construction of a system that also allows browsing and use of the original borehole data used in 3D analysis. In this paper, we introduce our efforts on geoinformation organization for urban areas. 2 Awareness of the current situation Recently, data of drilling surveys conducted in the public civil engineering and construction projects are being disclosed on the websites as database because there is increased awareness that geoinformation is important. Tokyo Metropolitan [3] and Chiba Prefecture [4] have disclosed their borehole data from an early stage, and the Ministry of Land, Infrastructure, Transport and Tourism (MLIT) has started to disclose the borehole data of national projects. [5] A portal site that allows browsing such databases was developed by the National Research Institute for Earth Science and Disaster Prevention. [6] In accordance with the recent Government’s open government data strategy, the local governments are also enthusiastic in disclosing borehole data. However, these borehole databases that have been prepared so far simply 1 Introduction The 2011 Off the Pacific Coast of Tohoku Earthquake brought about serious tsunami damage, and also caused liquefaction of the ground occurred in some coastal and riverside areas in Chiba and other places. [1] In this earthquake, there were not much residential collapse caused by the seismic motion despite the magnitude of the earthquake, yet there was much damage of falling roof tiles in the Tohoku and Kanto regions. According to a study in the Tsukuba and Tsuchiura areas, the distribution of the damage was very distinctive. [2] Such damage depends on the epicenter, magnitude, and characteristic of the seismic wave such as the dominant frequency, but are also greatly affected by geological conditions of the area. The general public became aware to some extent of this fact through the mass media, and their interest in geology has increased. Also, geological survey is essential for civil engineering and construction works, and if one can obtain prior information of the geology on which the construction will take place, the planning and estimation of the geological survey can be done easily and the process of actual construction may go smoothly. However, the current methods of understanding the subsurface geological condition of the urban plain areas are not sufficient. With this background, in the Phase II of Measurement Standards and Intellectual Infrastructure Plan of the Ministry of Economy, Trade and Industry (METI) for 2013, we decided to work on the organization of geoinformation of the urban areas through the integration of borehole data as our priority issue. In the “Special Committee on Measurement Standards and Intellectual Infrastructure,” the “use of a new intellectual infrastructure that can be easily understood and —New style of geoinformation in an urban area— Although geoinformation pertaining to urban areas is very important, paper-based geological maps do not adequately describe the subsurface geological conditions of urbanized plains. A three-dimensional geological map, available via the Internet, is expected to provide intelligible, highly reliable, and easily utilizable geoinformation for urban areas. In this case, a three-dimensional geological model needs to be constructed on the basis of reliable borehole data using an advanced modeling tool. We are now developing a prototype of a three-dimensional geological map of the northern part of Chiba Prefecture as a new form of urban geoinformation which contributes to estimating the risk of geological disasters. Three-dimensional urban geological map Keywords : Geoinformation, three-dimensional geological model, borehole data, subsurface geology, geological map [Translation from Synthesiology, Vol.9, No.2, p.73–85 (2016)] Tsutomu NAKAZAWA * , Susumu NONOGAKI and Yoshinori MIYACHI Research Institute of Geology and Geoinformation, AIST Tsukuba Central 7, 1-1-1 Higashi, Tsukuba 305-8567, Japan * Original manuscript received August 31, 2015, Revisions received October 22, 2015, Accepted October 26, 2015

Welcome message from author
This document is posted to help you gain knowledge. Please leave a comment to let me know what you think about it! Share it to your friends and learn new things together.
Transcript

Research paper
−74−Synthesiology - English edition Vol.9 No.2 pp. 74–86 (Sep. 2016)
is easy to use from the viewpoint of the users” was discussed, and it was proposed that a geoinformation organization considering secondary useTerm 1 would be promoted in the Intellectual Infrastructure Plan. Based on this plan, AIST set the data of the drilling surveys that it originally conducted as standards, conducted a wide range of strata correlation using the borehole data of public works and others disclosed by the local governments, and engaged in research for analyzing the 3D distribution of strata by computer processing for the urban areas. We are working on a method that allows anyone to browse and use such a 3D geological model on the web, as well as construction of a system that also allows browsing and use of the original borehole data used in 3D analysis. In this paper, we introduce our efforts on geoinformation organization for urban areas.
2 Awareness of the current situation
Recently, data of drilling surveys conducted in the public civil engineering and construction projects are being disclosed on the websites as database because there is increased awareness that geoinformation is important. Tokyo Metropolitan[3] and Chiba Prefecture[4] have disclosed their borehole data from an early stage, and the Ministry of Land, Infrastructure, Transport and Tourism (MLIT) has started to disclose the borehole data of national projects.[5] A portal site that allows browsing such databases was developed by the National Research Institute for Earth Science and Disaster Prevention.[6] In accordance with the recent Government’s open government data strategy, the local governments are also enthusiastic in disclosing borehole data. However, these borehole databases that have been prepared so far simply
1 Introduction
The 2011 Off the Pacific Coast of Tohoku Earthquake brought about serious tsunami damage, and also caused liquefaction of the ground occurred in some coastal and riverside areas in Chiba and other places.[1] In this earthquake, there were not much residential collapse caused by the seismic motion despite the magnitude of the earthquake, yet there was much damage of falling roof tiles in the Tohoku and Kanto regions. According to a study in the Tsukuba and Tsuchiura areas, the distribution of the damage was very distinctive.[2] Such damage depends on the epicenter, magnitude, and characteristic of the seismic wave such as the dominant frequency, but are also greatly affected by geological conditions of the area. The general public became aware to some extent of this fact through the mass media, and their interest in geology has increased. Also, geological survey is essential for civil engineering and construction works, and if one can obtain prior information of the geology on which the construction will take place, the planning and estimation of the geological survey can be done easily and the process of actual construction may go smoothly. However, the current methods of understanding the subsurface geological condition of the urban plain areas are not sufficient.
With this background, in the Phase II of Measurement Standards and Intellectual Infrastructure Plan of the Ministry of Economy, Trade and Industry (METI) for 2013, we decided to work on the organization of geoinformation of the urban areas through the integration of borehole data as our priority issue. In the “Special Committee on Measurement Standards and Intellectual Infrastructure,” the “use of a new intellectual infrastructure that can be easily understood and
—New style of geoinformation in an urban area—
Although geoinformation pertaining to urban areas is very important, paper-based geological maps do not adequately describe the subsurface geological conditions of urbanized plains. A three-dimensional geological map, available via the Internet, is expected to provide intelligible, highly reliable, and easily utilizable geoinformation for urban areas. In this case, a three-dimensional geological model needs to be constructed on the basis of reliable borehole data using an advanced modeling tool. We are now developing a prototype of a three-dimensional geological map of the northern part of Chiba Prefecture as a new form of urban geoinformation which contributes to estimating the risk of geological disasters.
Three-dimensional urban geological map
Keywords : Geoinformation, three-dimensional geological model, borehole data, subsurface geology, geological map
[Translation from Synthesiology, Vol.9, No.2, p.73–85 (2016)]
Tsutomu Nakazawa*, Susumu Nonogaki and Yoshinori Miyachi
Research Institute of Geology and Geoinformation, AIST Tsukuba Central 7, 1-1-1 Higashi, Tsukuba 305-8567, Japan *
Original manuscript received August 31, 2015, Revisions received October 22, 2015, Accepted October 26, 2015

Research paper : Three-dimensional urban geological map (T. NAKAZAWA et al.)
−75−
Synthesiology - English edition Vol.9 No.2 (2016)
store data (although we greatly appreciate such information), and there is no case that shows geological interpretation such as subsurface geological structures in an easy to understand manner.
The borehole data is a point data that merely shows one part of the strata that are distributed spatially. The geology of the urban areas can be understood only when many borehole data are used to show the spatial distribution of the strata. However, such geological interpretation can only be done by someone with advanced expert knowledge, and it is necessary to organize standard data with which the strata can be compared. While the 1:50,000 geological maps published by AIST show such distribution of strata and geological structures based on the survey and research by geologists, in the case of the geological maps of the urban plains, there is a limit to expressing the subsurface geoinformation planimetrically because the landform is flat. Therefore, we created and inserted many geological cross-section diagrams compared to the maps of mountainous and hill zones (Fig. 1),[7]–[9] but there were limits to such paper-based map publication. Also, the disclosure of fundamental borehole
data was limited to the major ones due to the limitations of space or disclosure conditions, and they are not sufficient. It is necessary to display highly reliable interpretation of subsurface geological structures in an easy to understand manner, and to allow people to browse and use the borehole data that is the basis of such interpretation, in terms of reproducibility of the research and promotion of secondary data use.
Recently, the computer processing technology has advanced, and delivery of various information over the Internet has become easy, and the Internet environment for the general public is widening. Assuming the delivery on the website, the degree of freedom of expression of the subsurface geological structure of urban plain areas will increase, and three-dimensional displays will be possible if necessary. It can be said that the organization of geoinformation that goes with the times is demanded.
3 Scenario and elemental technologies for the 3D geological maps
Considering the aforementioned awareness of the current situation, we started to study “3D geological maps” to be delivered on the web (Fig. 2) as urban geoinformation that is easy to understand, easy to use, and above all, highly reliable. Using as standard the data of drilling survey conducted originally by geologists, the borehole logs for public works disclosed by the local governments are correlated, and the 3D distribution of strata is analyzed by computer processing. A method is considered that allows a 3D geological model to be easily viewed on the web by anyone, and a system is constructed that allows browsing and use of the borehole data that is the original data used for 3D analysis. We thought this would enable the organization of geoinformation that is easy to understand, easy to use, and highly reliable. The scenario of the geoinformation for urban areas (Fig. 3) is composed mainly of six elemental technologies: use of the borehole data of public works of the local governments, basic drilling surveys, correlation of the strata, landform classification, 3D modeling technology, and data management and display technology. Our research group is working on the integration of these six elemental technologies taking into consideration the usability and reliability of geoinformation. Below is the explanation of the individual elemental technologies.
3.1 Use of the borehole data of the public works possessed by the local governmentsThe local governments conduct geological surveys when engaging in public works such as civil engineering and construction projects in their administrative areas. The main method of their geological surveys is drilling. The conducted drilling surveys are normally the standard penetration tests defined by the common specifications for geological survey work by the local governments (Table 1), and the
Fig. 1 Conventional style of geoinformation for urban areas“Noda” sheet of 1:50,000 geological maps. Since the urban area in a plain has f lat landform, there is little geoinformation that can be presented on a sheet map. Although this geological map contains several geological cross-section diagrams, there is a limit to how much can be printed on paper.

Research paper : Three-dimensional urban geological map (T. NAKAZAWA et al.)
−76−Synthesiology - English edition Vol.9 No.2 (2016)
results are presented as borehole logs[10] according to the specifications of the Japan Construction Information Center (JACIC). When conducting the standard penetration tests, the samples available are not undisturbed all-core samples, and in many cases, the person entering the data is not a geological expert but a civil engineer or an on-site drilling operator, and therefore, the description of the strata is simple. Drilling surveys for civil engineering and construction work are basically terminated at the point when the depth of the stratum that is the support base of the structure is reached. Although the depth varies according to the geological conditions, many are about 10 to several tens of meters deep. Therefore, most construction borehole data are only to the depth of several tens of meters.
Recently, the massive borehole data of the civil engineering
and construction work have been accumulated by the Government and local governments as mentioned before, and are being organized as electronic databases. Currently, the electronic borehole data format that has become a de facto standard is set by the MLIT.[11] This is the XML format of the JACIC specified borehole logs that includes the standard penetration test data explained earlier. Since the borehole data that are electronically delivered as geological survey reports to the local governments of prefectures or major cities are in this format, the electronically delivered borehole data can be stored in the database as they come, as long as the database is unified to this file format. Therefore, recently many databases store the borehole data in the JACIC spec XML format, but there are still databases with various data formats. In order to make secondary use easy, it is desirable to convert the data with other formats to the JACIC spec XML format to create the database. At any rate, to conduct the organization of borehole data and the use of borehole data for the geological structure analysis, it is necessary to gain the understanding and cooperation from the local governments for the geoinformation organization effort. Also, for the management and conversion of the local governments’ borehole data to the standard format, it is important that AIST provide technical support if needed.
3.2 Drilling surveyThe local governments have aggregated enormous amount of borehole data for public works from the past, and these may be great merit for geoinformation organization. On the other hand, since the main purpose of such data, as mentioned before, is the presentation of engineering data (standard penetration test data), they normally do not include the descriptions of volcanic ash layers or chronological data that are the basis of a wide range strata correlation (Table 1). The descriptions of strata are extremely simple, and the sedimentary structure, fossil occurrence, and detailed
Fig. 2 Outline of 3D geological maps for urban areas
Table 1. Comparison of standard borehole data and borehole data of public works
Standard borehole data: data originally surveyed by AIST Existing borehole data: display all database from local governments and other institutions Outcrop log: show boring logs published in papers
(Topographic map: Geospatial Information Authority of Japan)
Determine landform based on elevation data etc. Reflect distribution of surface sediments
Cross-section, contour map, 3D display
【Basic content】
Geological
map
Establish a new style of geological maps that enables visualization of subsurface geological structures
Organization of easy to understand, easy to use, and highly reliable geoinformation, assuming delivery over web
Provide data in easy-to-use format
Landform classification
3D geological model
Borehole and outcrop logs (data archive)
Fault
Fault
Hill HillLowlandUpland Upland
Mountain
About 10~60 m
Basic survey for civil engineering and construction work
Borehole data of public works
Engineering data Rock and soil classification Observation Standard penetration test data Water level in borehole etc.
About 40~120 m
Geological data + engineering data Sedimentary facies Chronological data Volcanic ash layer Fossil Grain size Physical property data such as velocity logging etc.
Academic researchOrganization of reference data
Standard borehole data
Characteristic
Drilling depth
Item
Objective
Although there are not too many survey points, high precision information that serves as reference for strata comparisons
They are mainly of standard penetration test data and simple descriptions of strata, but there is accumulation of massive amount of data from the past

Research paper : Three-dimensional urban geological map (T. NAKAZAWA et al.)
−77−
Synthesiology - English edition Vol.9 No.2 (2016)
grain size variation that are recorded by geological experts are not included. While such borehole data may be fine for correlating strata within a small property that is the site of construction work, in many cases, the correlation of strata in a wide area that may stretch at prefectural levels are often difficult. However, this cannot be helped since wide range correlation of strata surpasses the original use of the borehole data format in the civil engineering and construction works.
Concerning such borehole data, if AIST can conduct drilling surveys in areas where the strata are thought to be schematically distributed, appropriately classify the strata based on these surveys, and accurately present the characteristics of each stratum, these will become the standard data, and the correlation of strata using the nearby borehole data from civil engineering and construction works can be done easily. We call such reference data the “standard borehole data” (Fig. 4).
Since standard penetration tests are conducted in regular
civil engineering and construction works, in most cases, core sampling may not be done or only partially done if at all, and it is difficult to grasp the continuous change of the strata in the vertical direction. In our drilling survey, all-core sampling where the strata of all depths to be drilled will be sampled as cylindrical sediment core samples of approximately 10 cm in diameter is conducted. The survey depth is in most cases several tens of meters for the borehole data of civil engineering and construction work as mentioned before, while our drilling survey will completely cover the range and extends to about 100 m depth that is slightly deeper than the construction survey.
The sampled sediment cores are split in half longitudinally, and sedimentary structures, fossil occurrences, volcanic ash layers, and others are descripted. Also, grain size analysis and radiometric dating are done, and depositional environments are interpreted from the contained fossils (Table 1). PS logging where the seismic wave velocities (P and S waves) of each stratum are measured, and also density logging using gamma rays are conducted (Table 1). Based on such surveys, the starata are appropriately classified in terms of stratigraphyTerm 2 and sedimentology,Term 3 and the characteristic and age of each stratum are presented as comparative standards. Cases where highly reliable standard data based on strata research have been prepared by institutions in charge of geoinformation of urban areas are extremely rare, and it is possible for the Geological Survey of Japan to do so precisely because it is a group of geologists.
3.3 Correlation of strataAfter organizing the standard borehole data, strata are compared with the existing borehole data based on the organized data. The spread of strata is grasped in this study. As mentioned earlier, a vast amount of existing borehole data has been accumulated. While it is a merit, the descriptions are simple compared to the standard borehole data, and personal differences in descriptions are large. In the
Fig. 3 Scenario for the creation of 3D geological maps for urban areas
Fig. 4 Drilling survey and standard borehole dataThe standard borehole data that will serve as the comparative index for existing borehole data is obtained through originally conducted drilling survey.
Landform classification
Correlation of
strata
Borehole data of public works
Cooperation of local government and AIST
Data m
anagement
and display
3D
modelingDating
Sedimentary facies analysisFossil analysisGrain size analysisDensity loggingVelocity logging etc.
Various analyses of standard boring survey
Borehole
databaseB
oreholedatabase
【Local government】
【AIST】
LinkTechnical supportUse
3D
geological m
ap
Example of standard borehole data(Kashiwa GS-KW-3 borehole)
(Foreshore)
(Shoreface)
(Inner bay)
(Tidal flat)
Upper
Lower
Kioroshi Formation
KIP tephra
GS-KW-3Asahi-cho, Kashiwa P wave
velocity(m/sec)
S wave velocity (m/sec)
Density(g/cm3)
N value
35
30
25
20
15
10
5
0
0 10 20 30 40 50
1.0
1.4
1.8
2.2
0
200
400
600
1000
1400
1800
2200
> p
b.gr
.c.
-v.c
.m
.f.vf
.m
ub

Research paper : Three-dimensional urban geological map (T. NAKAZAWA et al.)
−78−Synthesiology - English edition Vol.9 No.2 (2016)
correlation of the strata, sedimentary facies, fossils, standard penetration test data, and others described in the existing borehole data are compared with the standard borehole data. The characteristic of the strata is understood by checking each data, and the boundaries of strata are traced. The standard and existing borehole data are in the relation of hub and satellite, and it is possible to increase the reliability of geoinformation by using both data appropriately.
The correlation of the borehole data must be conducted by researchers or engineers in geology who are experienced in strata observation and are able to understand strata characteristics. The actual correlation is done manually by placing the borehole logs on the computer screen using a borehole data analysis tool[12] developed by AIST. This analysis tool allows listing the location information (latitude, longitude, and elevation) of the correlated stratum boundary at the individual drill sites. This location information is used as basic data for 3D modeling.
3.4 Landform classificationLandform ref lects the depositional process of the strata and their distribution. Therefore, for the surface (topmost) stratum, rather than determining the distribution only by borehole or outcrop data that is point data, a more accurate distribution can be learned by understanding the distribution of strata from the landform. The landform can be classified using topographical maps, a digital elevation model (DEM), aerial photographs, and others that are provided by the Geospatial Information Authority of Japan. Also, by comparing the old topographical maps or aerial photographs with the current ones, it is possible to know the distribution
of the land reclaimed areas and the cut and f ill of the developed plateaus and hills. For example, the old version of a topographical map, jinsoku sokuzu that was created in the Meiji Period[13] and the aerial photographs shot by the United States military immediately after WWII[14] are available. The results of the landform classification are shown in color on maps.
3.5 3D modeling technologyA 3D geological model is created by integrating the subsurface structure and landform information. For the subsurface structure, correlation of strata of multiple borehole data are conducted, and a 3D subsurface geological model is constructed by estimating the geological boundary surface from the elevation information of the boundary of each point. For the landform information, a landform classification map is created based on the topographical map, DEM, aerial photographs, and others. Finally, by integrating the classification categories of the 3D subsurface geological model and landform classification map, a 3D geological model is obtained (Fig. 5).
There are roughly two methods in the 3D geological modeling technology. One is a method in which a model is constructed manually based on the results of fieldwork by geologists. The other is a method in which a model is constructed by computer processing. In the manual method, the knowledge and experience of the geologists tend to be ref lected and complex geological structures can be easily described. However, there are disadvantages that the 3D models may be completely different depending on the creator even if the same survey results are used, and that the 3D
Fig. 5 Procedure of 3D modeling
Method used: “surface estimation method using optimization principles and spline”
Integration of surface and subsurface information
Boundary surface estimationLandform interpretation
3D geological model
Borehole log, outcrop log, etc.Topo map, DEM, aerial photo, etc.
Subsurface: stratum boundary surface
Surface: landform classification diagram

Research paper : Three-dimensional urban geological map (T. NAKAZAWA et al.)
−79−
Synthesiology - English edition Vol.9 No.2 (2016)
model is necessarily reconstructed from step one when the model is revised. On the other hand, in the computer processing method, although only the geological structures supported by processing algorithms can be described, the same 3D model can be obtained by any person from the same survey results, and the 3D model can be revised and reconstructed immediately after adding data. The awareness among the geologists can be shared if one modeling method is used as a common base and the 3D model is revised and reconstructed every time. Considering the diffusion and secondary use of geoinformation by 3D models, it is desirable to maintain the reproducibility and upgradability of the model, rather than simply displaying the geological structures in an easy to understand manner. Therefore, in this research, 3D modeling is conducted mainly by computer processing.
When conducting 3D modeling by computer processing, a 3D model is constructed virtually using the logical model of geological structure[15] and the forms of the geological boundary surfaces. The forms of the boundary surfaces are expressed by DEM that is a dataset where the elevation value is arranged in a grid of equal intervals. In the 3D modeling of resource development fields where the main target is deep underground, the quantity of basic data is scarce compared to the scale of targeted geological structures due to the issue of survey costs. Therefore, it is important to determine the place with the highest possibility of the presence of the desired stratum, and in most cases, the DEM of the geological boundary surfaces is created using a stochastic method. On the other hand, for the shallow subsurface 3D modeling of urban areas, abundant elevation data for the geological boundary can be obtained by carefully analyzing the existing borehole data. Therefore, it is important to precisely calculate the surface form that satisfies the data. For this reason, we
use a surface estimation method based on optimization pr inciples and splineTer m 4 to create the DEM for the geological boundary surfaces.[16] This is a method that finds the smoothest surface among the feasible surfaces. Available data are the elevation data of the geological boundary and the strike-dip data unique to geology. The elevation data is obtained from the analysis of borehole data and the strike-dip data is obtained from field surveys. For the elevation data, not only the elevation value at the point where the geological boundary is observed, but also the one that indicates the uppermost or lowermost limit such as “the boundary runs above/below this point” can be used. Such characteristics are useful in the cases where the depth of the borehole data does not reach the targeted geological boundary or in the cases where the position of the boundary cannot be clearly indicated due to the absence of some parts of the borehole core. In this method, the DEM is constructed while adjusting the smoothness of surfaces and the goodness of fit to each data. By storing the DEM in machine readable ASCII format, it can be secondarily used in various analyses that utilize the geological boundary surfaces.
3.6 Data management and display technologyTo have a 3D geological model used widely by the public, it is desirable to organize an environment where anyone can browse the 3D geological model easily. Therefore, we develop a web system in which the 3D geological model can be browsed by simple mouse operation (Fig. 6). From the perspective of maintaining the reliability of the 3D geological model, we make it possible to browse and search the borehole data used for the construction of the 3D geological model. Since the system is composed of free and open source software, it can be revised f lexibly in the future. The 3D geological model is provided in three formats of 2D map, cross-section diagrams, and 3D diagrams to ensure usability
Provide borehole data in easy to use format
JACIC spec XML
Ability to display 3D geological models
Ability to browse geological cross-section diagrams of arbitrary survey lines
Fig. 6 Web system for browsing the 3D geological model and borehole data

Research paper : Three-dimensional urban geological map (T. NAKAZAWA et al.)
−80−Synthesiology - English edition Vol.9 No.2 (2016)
by general users as well as researchers and engineers who are familiar with printed map sheets. For the display of the 2D map, high-speed map display technology using tiled images is used to provide better operability for users. This technology allows zoom in/out and moving by mouse operation. For the display of cross-section diagrams, a vertical geological cross-section between two points identified by clicking on a 2D map can be displayed. For the display of 3D diagrams, since web delivery of a whole area model is difficult due to the file size of 3D geological model data, the whole area is divided into lattices and a model for each smaller region is displayed. For the borehole data, by clicking on the data point, the metadata can be browsed. The metadata includes the link to JACIC XML and PDF. By constructing a database of metadata and by adding the function of setting the search range to the browser system, the metadata of borehole data can be searched from the browser system.
The borehole data for public works possessed by the local governments and the standard borehole data organized by AIST are important basic data that form the core of 3D modeling, and are essential information to maintain reliability of the 3D model. Therefore, we develop a system that allows the local governments to manage the borehole database in JACIC XML format (Fig. 7).[17] For the database, PostgreSQL,Term 6 that is an RDBMSTerm 5 with high versatility, is used, and this system will be released free of charge. Through the use of such a system, it is expected that the borehole data that is the basic geoinformation of urban areas will be appropriately managed in many local governments.
4 Assumed utilization of a 3D geological map
Currently, in our group, the six elemental technologies discussed in the previous chapter are being integrated, and we are attempting to create a 3D geological map. Assumed utilization of such a 3D geological map is in making hazard maps for earthquakes, planning for urban infrastructures and
industrial constructions, and in real estate transactions.
For the creation of an earthquake hazard map, the subsurface elastic wave velocity data (particularly S wave velocity data) and a shallow subsurface geological model are necessary.[18] However, existing borehole data that include S wave velocity data is rare. Since our drilling survey measures the S wave velocity, it can be used as the standard data for seismic motion simulation. Also, our 3D geological model created based on the standard borehole data is also expected to be used as geological model data when creating earthquake hazard maps (Fig. 8). Moreover, by understanding vibration characteristics such as specific dominant frequencies of the ground by microtremor measurement,[19] it is possible to create earthquake hazard maps that accurately take the geology into consideration. Therefore, our group conducts microtremor measurement along with the construction of the geological model, and we are considering classification of ground vibration characteristics according to geological conditions.
In planning urban infrastructures and industrial construction, it is extremely important to collect information beforehand on the presence of weak ground and at what depth the stratum that would be the support base of the structure is distributed. If this information can be known beforehand, the planning and estimates of the geological survey can be done easily. In the geological survey industry, efforts are spent on reducing the risks of delay of survey periods, design change, or increased project costs that may occur if the geological condition is different from the one assumed.[20] As a measure, the existing geoinformation should be actively used.[21] The existing borehole data of the urban areas and a 3D geological model appropriately interpreted from such data are thought to contribute to risk management through disclosure in an easy to use format (Fig. 8).
Since the 2011 Off the Pacific Coast of Tohoku Earthquake,
Format conversion program
Convert from local government’s file format
to standard format
Borehole data management system
Data search
Display metadata
Display and edit borehole log
Check entered data on background of various maps
Data management by database
Fig. 7 Conversion program for the borehole data and its management system

Research paper : Three-dimensional urban geological map (T. NAKAZAWA et al.)
−81−
Synthesiology - English edition Vol.9 No.2 (2016)
interest in the geology and ground of the urban areas increased significantly among the general public. In real estate transactions, the provision of geoinformation is not an obligation, but with the serious liquefaction damage in the Tokyo Bay coastal area, it has been proposed that the geoinformation should be actively used in real estate transactions.[22] While there are concerns that the real estate appraisal value may change, we think it is necessary to nurture common awareness in society that the geoinformation is important public property, in order to raise the people’s consciousness for disaster risks and to promote construction of cities resilient against disaster. The Science Council of Japan, in its proposal for sharing geoinformation,[23] states that it is indispensable that the information on subsurface geology is recognized as common property of the people, and that it is used effectively as basic information of our land. On the other hand, while the general public may be interested in the geology for building residences, it may be difficult to decipher the borehole data or geological maps for many people who do not have the geological expertise. This is the same for people in the real estate industry. To meet such needs, there are emerging consulting businesses that utilize the existing geoinformation. In such businesses, there are requests for geoinformation to be organized in a format that can be easily used. The 3D geological map on which we are working may satisfy such requests (Fig. 8).
5 Trial in the model region
In the scenario explained in Chapter 3, it is deemed possible to organize geoinformation of the urban areas. We have
set the northern part of Chiba Prefecture as a testing area and are presently making a 3D geological map. The major reason that this region was selected is because the typical strata of the Kanto Plain is distributed, and because Chiba Prefecture is actively spending effort on the organization of geoinformation.
5.1 Geological topic of the model regionIn the testing area, there are Pleistocene and Holocene strata that are representative deposits in the Kanto Plain, as well as landfill strata in the coastal lowlands.
The Pleistocene strata are exposed in uplands and commonly exhibit a large subsurface basin structure. The basin structure elucidates the history of the sedimentary basin, and also contributes to high-precision analysis of the subsurface water flow. Although the basin structure was estimated from the analysis of existing borehole data, there was hardly any stratigraphic research in the northern part of the Chiba area, and the accurate basic structure was unknown. Recently, stratigraphic research by our group is revealing the details of the basin structure centering around the Tokyo Bay coastal area.[24] It is important to accumulate the know-how for 3D analysis of the basin structure underneath the plain in the model region.
Beneath the present-day lowlands, there is a stratum formed 20,000 years ago or later called Chuseki-so. It is commonly known as soft muddy sediments filling old valleys. Recently, similar soft muddy sediments have been also found beneath uplands in the Kanto Plain.[25] Such muddy sediments are not
!
Fault
Fault
Hill HillLowlandUpland Upland
Mountain
What is the subsurface structure model?
Geological map
(Personal, company)Real estate transaction
What is the depth of the solid layer that
supports the foundation of the structure?
Is it reclaimed ground? Is it natural ground?Is there any soft layer?What is the thickness of the soft layer?
(Disaster prevention personnel of local governments)
For example, an accurate earthquake hazard map for
community disaster prevention
Geological disaster risk evaluation
(Government, local government, company)
Industrial construction
(Government, local government, company)
Urban infrastructure
Fig. 8 Assumed ways of utilizing the 3D geological map
Research paper : Three-dimensional urban geological map (T. NAKAZAWA et al.)
−82−Synthesiology - English edition Vol.9 No.2 (2016)
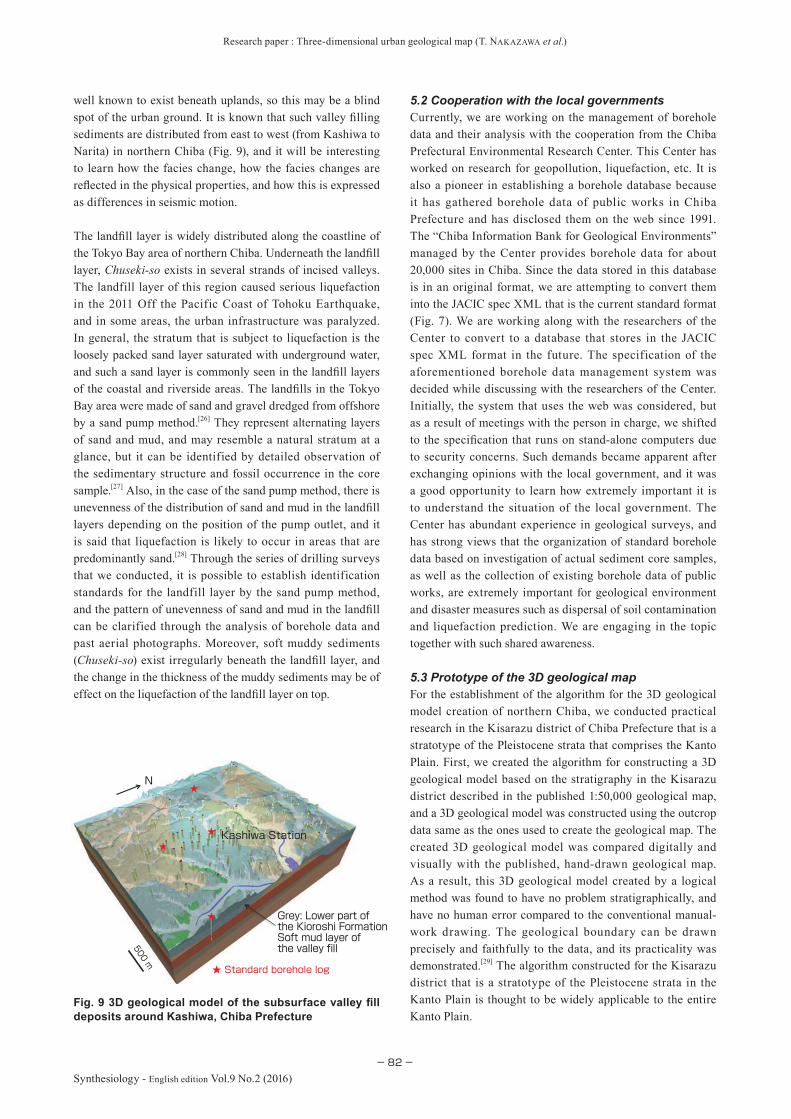
Fig. 9 3D geological model of the subsurface valley fill deposits around Kashiwa, Chiba Prefecture
well known to exist beneath uplands, so this may be a blind spot of the urban ground. It is known that such valley filling sediments are distributed from east to west (from Kashiwa to Narita) in northern Chiba (Fig. 9), and it will be interesting to learn how the facies change, how the facies changes are reflected in the physical properties, and how this is expressed as differences in seismic motion.
The landfill layer is widely distributed along the coastline of the Tokyo Bay area of northern Chiba. Underneath the landfill layer, Chuseki-so exists in several strands of incised valleys. The landfill layer of this region caused serious liquefaction in the 2011 Off the Pacific Coast of Tohoku Earthquake, and in some areas, the urban infrastructure was paralyzed. In general, the stratum that is subject to liquefaction is the loosely packed sand layer saturated with underground water, and such a sand layer is commonly seen in the landfill layers of the coastal and riverside areas. The landfills in the Tokyo Bay area were made of sand and gravel dredged from offshore by a sand pump method.[26] They represent alternating layers of sand and mud, and may resemble a natural stratum at a glance, but it can be identified by detailed observation of the sedimentary structure and fossil occurrence in the core sample.[27] Also, in the case of the sand pump method, there is unevenness of the distribution of sand and mud in the landfill layers depending on the position of the pump outlet, and it is said that liquefaction is likely to occur in areas that are predominantly sand.[28] Through the series of drilling surveys that we conducted, it is possible to establish identification standards for the landfill layer by the sand pump method, and the pattern of unevenness of sand and mud in the landfill can be clarified through the analysis of borehole data and past aerial photographs. Moreover, soft muddy sediments (Chuseki-so) exist irregularly beneath the landfill layer, and the change in the thickness of the muddy sediments may be of effect on the liquefaction of the landfill layer on top.
5.2 Cooperation with the local governmentsCurrently, we are working on the management of borehole data and their analysis with the cooperation from the Chiba Prefectural Environmental Research Center. This Center has worked on research for geopollution, liquefaction, etc. It is also a pioneer in establishing a borehole database because it has gathered borehole data of public works in Chiba Prefecture and has disclosed them on the web since 1991. The “Chiba Information Bank for Geological Environments” managed by the Center provides borehole data for about 20,000 sites in Chiba. Since the data stored in this database is in an original format, we are attempting to convert them into the JACIC spec XML that is the current standard format (Fig. 7). We are working along with the researchers of the Center to convert to a database that stores in the JACIC spec XML format in the future. The specification of the aforementioned borehole data management system was decided while discussing with the researchers of the Center. Initially, the system that uses the web was considered, but as a result of meetings with the person in charge, we shifted to the specification that runs on stand-alone computers due to security concerns. Such demands became apparent after exchanging opinions with the local government, and it was a good opportunity to learn how extremely important it is to understand the situation of the local government. The Center has abundant experience in geological surveys, and has strong views that the organization of standard borehole data based on investigation of actual sediment core samples, as well as the collection of existing borehole data of public works, are extremely important for geological environment and disaster measures such as dispersal of soil contamination and liquefaction prediction. We are engaging in the topic together with such shared awareness.
5.3 Prototype of the 3D geological mapFor the establishment of the algorithm for the 3D geological model creation of northern Chiba, we conducted practical research in the Kisarazu district of Chiba Prefecture that is a stratotype of the Pleistocene strata that comprises the Kanto Plain. First, we created the algorithm for constructing a 3D geological model based on the stratigraphy in the Kisarazu district described in the published 1:50,000 geological map, and a 3D geological model was constructed using the outcrop data same as the ones used to create the geological map. The created 3D geological model was compared digitally and visually with the published, hand-drawn geological map. As a result, this 3D geological model created by a logical method was found to have no problem stratigraphically, and have no human error compared to the conventional manual-work drawing. The geological boundary can be drawn precisely and faithfully to the data, and its practicality was demonstrated.[29] The algorithm constructed for the Kisarazu district that is a stratotype of the Pleistocene strata in the Kanto Plain is thought to be widely applicable to the entire Kanto Plain.
★ Standard borehole log
★
★
★
★
Grey: Lower part of the Kioroshi FormationSoft mud layer of the valley fill
Kashiwa Station
N
500 m

Research paper : Three-dimensional urban geological map (T. NAKAZAWA et al.)
−83−
Synthesiology - English edition Vol.9 No.2 (2016)
Using this algorithm, a temporary 3D geological model was created based on the standard borehole data of 14 points, outcrop logs at 355 points, and landform classification maps. We created the prototype of the 3D geological map that allows browsing of maps, arbitrary cross-section diagrams, 3D models, and borehole data using the aforementioned browsing system (Fig. 6).[30] We are aiming ultimately for geological maps that can be used at 1:25,000 scale that surpasses the basic scale (1:50,000) of the geological maps, by raising the precision of the geological model by increasing the standard borehole data to 20 points or more and using about 20,000 existing borehole data. Through such organization of the geological maps, it is expected that geological disaster risk evaluation will become possible at higher precision.
6 Conclusion
For the 3D geological map that is being attempted presently in the testing area, standard borehole data will be added in the future, and correlation of strata for the existing borehole data will be furthered to enhance the precision of the 3D geological model. The cross-section diagrams and 3D models will be revised for better operation and usability, and it is scheduled for disclosure in FY 2017. This result will be proposed as a new style of geoinformation for urban areas, and we hope this will initiate the expansion to other cities through the cooperation of the local governments. A guideline is considered that allows the local governments to create their own geological maps, and technical support will be provided where needed. By promoting the organization of geoinformation that is easy to understand, easy to use, and highly reliable for the urban areas, we hope the utilization of the geoinformation by the administration, companies, and general public will be further promoted.
Acknowledgements
In pursuing this research topic, we held various discussions to determine the direction of research with the following people from the start of the project: Measurement and Intellectual Infrastructure Division, METI; Research Planning Office for Geological Survey and Applied Geoscience (currently, Research Planning Office for Geological Survey of Japan), AIST; Geoinformation Center (currently, Geoinformation Ser v ice Center), AIST; execut ive personnel of the Research Institute of Geology and Geoinformation; Junko Komatsubara, Tomonori Naya, Ikuo Cho, and Kentaro Sakata of the Research Institute of Geology and Geoinformation who participated in this research topic; and the people of the Geological Environment Laboratory, Chiba Prefectural Environmental Research Center. We are grateful to all those involved.
Terminologies
Term 1. Secondary use: According to the “Guide for the promotion of disclosure and secondary use of ground information” (June 2013) of the Ministry of Internal Affairs and Communications, secondary use of ground information is defined as “the use or provision of ground information (such as borehole data) supplied by administrative organizations and others, by forming them into information that can be easi ly used or by adding other information.” Primary use is defined as “the use by the administrative institutions and others that possess the ground information mainly for their internal use.” In the open government data strategy, it is written that “the public data possessed by the Government, independent administrative bodies, local governments, or others should be disclosed in the machine readable data format, and should be subject to rules that allow secondary use including for commercial purposes.”
Term 2. Stratigraphy: A discipline that clarifies the layering order of the strata from fossils, measured age, and strata characteristics.
Term 3. Sedimentology: A discipline that clarif ies the process and mechanism by which the sedimentary layers are formed from the proper ties of the deposits.
Term 4. Spline: A piecewise polynomial function in which the target region is broken down into multiple segments and the polynomial equation is set for each segment. It is excellent for fitting curves and curved surfaces with complex shapes.
Term 5. RDBMS (relational database management system): A general term for the software for managing relational databases. In RDBMS, comparison, joining, extraction, and others of the data are done while the data are managed in a table format.
Term 6. PostgreSQL: Open source RBDMS that can be used for various purposes, free of fee, license, secondary distribution, and others. SQL is used for database operation.
References
[1] K. Wakamatsu and S. Senna: Tohoku Chiho Taiheiyo-oki Jishin (Higashi Nihon Dai Shinsai) ni yoru ekijoka to kako no ekijoka rireki [Liquefaction in the 2011 Off the Pacific Coast of Tohoku Earthquake (Great East Japan Earthquake) and past history of liquefaction], Chishitsu To Chosa, 2013

Research paper : Three-dimensional urban geological map (T. NAKAZAWA et al.)
−84−Synthesiology - English edition Vol.9 No.2 (2016)
(4), 138, 6–11 (2013) (in Japanese).[2] S. Okada, T. Komatsubara, T. Nakazawa, Y. Nakamura,
K. Sakata and T. Naya: Distribution of tiled-roof damage around Tsukuba and Tsuchiura Cities using Google Earth images by the 2011 Off the Pacif ic Coast of Tohoku Earthquake, J. Seismological Soc. Japan, Second Series, 64 (4), 257–264 (2012) (in Japanese).
[3] Civil Engineering Support and Training Center, Tokyo Metropolitan Government: Tokyo no jiban GIS-ban (GIS version of the ground in Tokyo), http://doboku.metro.tokyo.jp/start/03-jyouhou/geo-web/00-index.html, accessed 2015-08-27 (in Japanese).
[4] Chiba Information Bank for Geological Environments: Chiba Information Map (Geological Columns), https://www.pref.chiba.lg.jp/suiho/chishitsu.html, accessed 2015-08-26 (in Japanese).
[5] Ministry of Land, Infrastructure, Transport and Tourism: Kokudo jiban joho kensaku site KuniJiban (National ground information search site “KuniJiban”), http://www.kunijiban.pwri.go.jp/jp/index.html, accessed 2015-08-27 (in Japanese).
[6] National Research Institute for Earth Science and Disaster Prevention: Geo-Station, http://www.geo-stn.bosai.go.jp/jps/index.html, accessed 2015-08-27 (in Japanese).
[7] T. Nakazawa and H. Endo: Geology of the Omiya District, 1:50,000 Geological Map of Japan, Geological Survey of Japan (2002) (in Japanese).
[8] T. Nakazawa and S. Tanabe: Geology of the Noda District, 1:50,000 Geological Map of Japan, Geological Survey of Japan (2011) (in Japanese).
[9] T. Naya and M. Yasuhara: Geology of the Konosu District, 1:50,000 Geological Map of Japan, Geological Survey of Japan (2014) (in Japanese).
[10] Japan Construction Information Center Foundation: Boring chujozu sakusei yoryo (an) kaisetsusho [Manual (draft) of creating the borehole logs] (1999) (in Japanese).
[11] Ministry of Land, Infrastructure, Transport and Tourism: Chishitsu doshitsu chosa seika denshi nohin yoryo (an) fuzoku shiryo [Appendix of the electronic delivery method of geological and soil survey results (draft)] (2008), http://www.cals-ed.go.jp/mg/wp-content/uploads/boring62.pdf, accessed 2015-10-02 (in Japanese).
[12] K. Kimura: Boring data shori system no kokai—Kokudo kiban joho toshite no boring data no rikatsuyo o mezashite (Disclosure of the borehole data processing system—For the utilization of borehole data as basic national land information), AIST Today, 11 (1), 19 (2011) (in Japanese).
[13] National Institute for Agro-Environmental Sciences: Rekishiteki nogyo kankyo etsuran system (Browsing system for historical agricultural environment), http://habs.dc.affrc.go.jp, accessed 2015-10-02 (in Japanese).
[14] Geospatial Information Authority of Japan: Chizu kuchu shashin etsuran service (Browsing service for maps and aerial photographs), http://mapps.gsi.go.jp/maplibSearch.do#1, accessed 2015-10-02 (in Japanese).
[15] K. Shiono, S. Masumoto and M. Sakamoto: Characterization of 3D distribution of sedimentary layers and geomapping a lgor i t h m — Logica l model of geolog ic s t r uc t u re , Geoinformatics, 9 (3), 121–134 (1998) (in Japanese).
[16] S. Nonogaki, S. Masumoto and K. Shiono: Gridding of geological surfaces based on equality-inequality constraints from elevation data and trend data, International Journal of Geoinformatics, 8 (4), 49–60 (2012).
[17] S. Nonogaki and T. Nakazawa: Development of management system for borehole logs in JACIC format, Research Institute of Geology and Geoinformation Sokuho, 68, 53–59 (2015) (in
Japanese).[18] Director General for Disaster Management, Cabinet Office:
Jishin bosai map sakusei gijutsu shiryo (Technical resource materials for compilation of earthquake disaster prevention maps), ht tp://www.bousai.go.jp/kohou/oshirase/h17/pdf/050513siryou.pdf (2005) (in Japanese).
[19] I. Cho and S. Senna: Constructing a system to explore shallow velocity structures using a miniature microtremor array—Accumulating and utilizing large microtremor datasets, Synthesiology, 9 (2), 86–96 (2016) (in Japanese).
[20] Chishitsu Risk Gakkai and Japan Geotechnical Consultants Association (eds.): Chishitsu Risk Management Nyumon (Introduction to Geological Risk Management), Ohmsha (2010) (in Japanese).
[21] A. Iwamatsu: Applying geo-information to geological risk mitigation, Proceedings of 4th Symposium on Sediment Disasters, 09, http://committees.jsce.or.jp/seibu_s01/system/files/04vip-iwamatu.pdf (2008) (in Japanese).
[22] M. Honma: Utilization plan for geological data in real estate transactions and recovery status from liquefaction damage in Urayasu City, GSJ Chishitsu News, 2 (12), 357–360 (2013) (in Japanese).
[23] Science Council of Japan: Teigen chishitsu jiban joho no kyoyuka ni mukete—Anzen anshin na shakai kochiku no tameno chishitsu jiban joho ni kansuru hoseibi (Proposal for sharing of geological ground information—Legal consideration for geological ground information to construct a safe and secure society) (2013), http://www.scj.go.jp/ja/info/kohyo/pdf/kohyo-22-t168-1.pdf, accessed 2015-10-02 (in Japanese).
[24] T. Naya, K. Sakata, H. Nakazato, J. Komatsubara and T. Nakazawa: Stratigraphy of Shimosa Group at the coastal area of Tokyo Bay in the northwestern region of Chiba Prefecture, central Japan, Abstracts, 121st Annual Meeting of the Geological Society of Japan, 52 (2014) (in Japanese).
[25] T. Nakazawa, R. Nakashima, T. Ueki, S. Tanabe, H. Oshima and S. Horiuchi: Sequence stratigraphy of the Pleistocene Kioroshi Formation, Shimosa Group beneath the Omiya Upland, central Kanto Plain, central Japan, Journal of the Geological Society of Japan, 112, 349–368 (2006) (in Japanese).
[26] O. Kazaoka: Tonegawa karyu teichi and Tokyo Wan umetatechi (Lowlands of Tonegawa downstream and landfill area of Tokyo Bay), Urban Kubota, 40, 5–13 (2003) (in Japanese).
[27] J. Komatsubara, R. Nakashima and T. Naya: Sedimentary facies and depositional environments of the Pleistocene to Holocene incised valley fills in Funabashi city, Chiba prefecture, Abstracts, 121st Annual Meet ing of the Geological Society of Japan, 53 (2014) (in Japanese).
[28] O. Kazaoka, M. Sato, T. Kusuda, K. Kamura, T. Kazato, A. Kagawa, M. Morisaki, K. Satoh, K. Furuno, Y. Sakai, A. Kato and H. Nirei: Liquefaction fluidization on the boundary between artificial loose sand and soft mud reclaimed land around Tokyo Bay, Proceedings of the 10th Symposium on Geo-Environments and Geo-Technics, 33–38 (2000) (in Japanese).
[29] S. Nonogaki and T. Nakazawa: Three-dimensional geological modeling of the Kisarazu District based on logical procedures, Geoinformatics, 26, 3–13 (2015) (in Japanese).
[30] S. Nonogaki, T. Nakazawa and H. Nakazato: Development of browsing system for two- and three-dimensional geological data, Proc. GIS-IDEAS 2014, 236–241 (2015).

Research paper : Three-dimensional urban geological map (T. NAKAZAWA et al.)
−85−
Synthesiology - English edition Vol.9 No.2 (2016)
Authors
Tsutomu NAKAZAWACompleted the master’s program at the Graduate School of Science, Chiba University in 1993. After working at a limestone mine, joined the Geological Survey of Japan, Agency of Industrial Science and Technology, Ministry of International Trade and Industry in 1996. Group Leader, Geoinformatics Research Group, Research Institute of Geology and Geoinformation, AIST from 2012. Doctor (Science). Specialties are stratigraphy, sedimentology, and paleontology. Research subjects include the wide-ranging strata of Carboniferous to Quaternary age. Participated in the geoinformatics study of the urban areas in the compilation of 1:50,000 geological maps, and engaged in research for the strata of the Kanto Plain. Currently, engages in research as the leader of 3D geological map project. In this paper, was in charge of overall supervision and the writing of geological surveys.
Susumu NONOGAKICompleted the doctor’s program at the Graduate School of Science, Osaka City University in 2009. Doctor (Science). After post-doctoral fellowship at AIST, became Researcher, Geoinformatics Research Group, Research Institute of Geology and Geoinformation, AIST from 2012. Specialty is geoinformatics. Main research subject is the development of method for calculating the shape of stratum boundary from the geoinformation obtained in fieldwork. Also engages in the development of methods for constructing and visualizing the 3D model of geological structures. In this paper, was mainly in charge of the creation of 3D model and the writing on data management and display technologies.
Yoshinori MIYACHICompleted the master’s program at the Graduate School of Science, Niigata University in 1991. Joined the Geological Survey of Japan, Agency of Industrial Science and Technology, Ministry of International Trade and Industry in 1992. Group Leader, Quaternary Basin Research Group, Research Institute of Geology and Geoinformation, AIST from 2014. Senior Planning Manager, General Planning Office, Planning Headquarters, AIST from 2016. Specialties are stratigraphy and sedimentology. Research subjects are stratigraphy and geological structures of the Cenozoic period, in the Osaka, Niigata and Kanto Plains engaged in the study of “Active faults and geology of the coastal region” and “1:50,000 geological maps (quadrangle series).” Acted as the subleader in the 3D geological map project, and was in charge of the survey and analysis of the alluvium and artificial ground. In this paper, was in charge of the writing on survey of the alluvium and artificial ground and cooperation with local governments (section 5.2).
Discussions with Reviewers
1 OverallComment (Akira Kageyama, Research Support Advisor, AIST)
This paper is a summary of the results of the trial that was conducted for the purpose of supplying geoinformation not only for two-dimensional but also for three-dimensional geological maps, to use in earthquake hazard assessment and urban planning. It discusses the process by which several elemental technologies were integrated, including the data possessed by the local governments. Since the research was started with consideration of ease of use, the social usefulness is high. In terms of technology, the paper can be highly evaluated since it carefully considers the modeling technology for estimating the three dimensional geological conditions that are difficult to study directly. From these points, we conclude that this paper is appropriate for publication in Synthesiology.Comment (Chikao Kurimoto, AIST)
This paper proposes 3D geological maps of urban areas where the population is concentrated, and introduces the research results useful for the creation of hazard maps while collaborating with local governments. Such perspective is meaningful for urban areas where disaster prevention and mitigation are grave concerns, and this result is expected to have major impact on society. Also, the attitude of constructing a highly precise yet easy-to-use system through the development of modeling technology matches the social demand. This paper is based on geological surveys, but also goes on to the organization of geoinformation, handling and advancing the digital information, and implementation in society through collaboration with local governments. I think it sufficiently matches the objective of Synthesiology.
2 Primary and secondary usesComment (Chikao Kurimoto)
The primary use and secondary use mentioned in Chapter 1 “Introduction” are very important. I think the readers will better understand if you have a section on terminology.Answer (Tsutomu Nakazawa)
I added a footnote for secondary use (and primary use).
3 Composition of the explanations for the scenario and elemental technologiesComment (Akira Kageyama, Chikao Kurimoto)
You discuss the scenario for achieving the goal in the beginning of Chapter 3 and Fig. 3, but I think it will be easier to understand if you unify Figs. 2 and 3 (this doesn’t mean you should join the two figures into one). For example, suggestion 1: if the “landform and land use information” and “geoinformation on the surface” shown in Fig. 2 are used in 3D modeling, you should mention them also in Fig. 3. Suggestion 2: you can explain that Fig. 3 is a diagram that shows the details of how to conduct the integration of data and information for the borehole data and outcrop log of Fig. 2.
Also, what about explaining that you have worked on the integration of six elemental technologies while considering the usability and reliability in the appropriate part of Chapter 3, and then explain the individual elemental technologies?Answer (Tsutomu Nakazawa)
Since the information about the surface layer in Fig. 2, or the landform classification, is one of the important elemental technologies, we added the landform classif ication in the elemental technologies of Fig. 3, and added a section in the text for its explanation.
We also added the point that we are working on the

Research paper : Three-dimensional urban geological map (T. NAKAZAWA et al.)
−86−Synthesiology - English edition Vol.9 No.2 (2016)
integration of six elemental technologies in the preface of Chapter 3, and we also added that we are working on the trial creation of a 3D geological map by integrating the six elemental technologies at the beginning of Chapter 4.
4 Standard borehole data and borehole data of public worksComment (Akira Kageyama)
You explain the differences between the two in Subchapter 3.2 and I think this is important. Therefore, how about showing the differences between the two data in a table? By directly comparing the objective and measurement data, I think it will make the scenario for the whole research easier to understand, that is, although borehole data for public works and others are useful, they are not sufficient as they are.
It is the understanding of the Reviewer that the process of comparing, contrasting, and refining the borehole data possessed by the local governments against the results of the standard boring survey is the comparison of the strata in Subchapter 3.3. If so, I think the standard boring survey has the “hub function” while the local governments’ borehole data have the “satellite function.” Do you agree?Answer (Tsutomu Nakazawa)
We newly created Table 1 that compares the characteristics of the standard borehole data and the borehole data of public works. The two data are in the relation of hub to satellite, as you indicated, and we added the explanation that the reliability of geoinformation can be increased by using the two data.
5 3D modeling technologyQuestion & Comment (Akira Kageyama, Chikao Kurimoto)
I think the terminology should be unified for the discussion in Subchapter 3.3 and Fig. 5. For example, the terms, “3D geological model,” “3D geological ground model,” “landform classification diagram,” and “landform categorization diagram” are mentioned.
In Paragraph 2, Subchapter 3.5, it is described that there is a possibility that a completely different 3D model may be produced depending on the person in charge of manual work. Isn’t there need for making some sort of guideline that can produce a uniform model or interpretation? For example, the computer modeling method that you developed can be set as a common base, and then a gradual shift can be made to the system of adding on knowledge and experience of the experts as metadata.Answer (Tsutomu Nakazawa, Susumu Nonogaki)
For terminology, we reviewed the descriptions, and call the 3D model for subsurface geology only as the “3D subsurface geological model,” and the model integrated with surface information as the “3D geological model.” The “landform classification” and “landform categorization” were unified into “landform classification map.”
As you indicated, at this point, we are not working on obtaining a uniform model and interpretation, but we think it is important. The fact that the 3D model by computer processing is useful in sharing common awareness among experts was added to the paper.
6 Discussion in Chapter 4Question (Akira Kageyama)
(1) How many d r i l l i ng su r veys d id you do for t he establishment of reference data (standard borehole data) at Noda and Kashiwa? To obtain a certain level of reliability, how many
drilling surveys are necessary? Also, while this may depend on the content of the local governments’ borehole data, how much supplementary effect can be expected in constructing the total system? If you would provide some information on these, I think it will be a rough guide (including costs) when expanding the project to various regions of Japan in the future.
(2) For the utilization in real estate transactions, it is expected that there will be requests for not disclosing 3D geological maps because it may reduce the appraisal value of real estate. In the case of landslide damage that occurred in Asa-minami, Hiroshima Prefecture, it has been reported that the disaster increased because the disclosure of the hazard map was withheld. In such situations, from the viewpoint of increasing the risk response capability of society (community) by raising the understanding among interested parties, what are the authors’ thoughts on this (of course, the authors or AIST cannot undertake responsibility)?Answer (Tsutomu Nakazawa)
(1) In the northern Chiba area that is the testing area, we ultimately plan to conduct about 20 sites of drilling surveys for establishing reference borehole data and use about 20,000 existing borehole data from public works. By doing so, we aim for geological maps of 1:25,000 that surpasses the 1:50,000 which is the basic scale of the conventional geological maps. We believe the goal can be achieved. We added this point to Subchapter 5.3. About half of the standard drilling survey sites in this research mainly target the irregularly distributed valley fill deposits. While it is desirable to have as many standard borehole data as possible, the geological structure can be estimated with surveys at lesser density in areas where the strata are distributed flatly and evenly. In contrast, in areas with complex strata, more surveys will be necessary. This means that the density of the drilling survey differs greatly according to the geological characteristics of that region.
(2) As you indicate, I think there are concerns for the shift in appraisal value of a real estate if the geoinformation is added to real estate transactions. There may be both increase and decrease of the appraisal value. In either case, it is important for society to work on constructing a safe city by understanding the real geological and ground characteristics, and I think it is important to have people share the awareness that geoinformation is an important public asset for taking measures against disaster risks. We added this point to the paper, along with the citation of the proposal by the Science Council of Japan.
7 Creation of the 3D geological map, future prospect, and ripple effectComment (Chikao Kurimoto)
You cite Fig. 6 and explain the results of the prototype of the 3D geological map. I understand that this will lead to a “new style of geoinformation for urban areas” in future research. I think the readers will gain better understanding if you summarize the prospect of future research and its ripple effect.Answer (Tsutomu Nakazawa)
The prototype of the 3D geological map is expected to increase the precision of geological disaster risk evaluation, and we believe the ripple effect on society is great. This point was added. Also, to clarify the future research prospect and the expected ripple effect, we summarized in Chapter 6 that we shall aim for the establishment of a new style of geoinformation for urban areas and the construction of 3D geological maps in the model region.
Related Documents