Three-dimensional in vivo fluorescence diffuse optical tomography of breast cancer in humans Alper Corlu 1 , Regine Choe 1 , Turgut Durduran 1,2 , Mark A. Rosen 2 , Martin Schweiger 3 , Simon R. Arridge 3 , Mitchell D. Schnall 2 , Arjun G. Yodh 1 3 Department of Computer Science, University College London, Gower Street, London WC1E 6BT, UK 1 Department of Physics and Astronomy, 2 Department of Radiology, University of Pennsylvania, Philadelphia, Pennsylvania 19104 Phone: 1-215-573-3463, Fax: 1-215-573-6391, [email protected] http://www.lrsm.upenn.edu/pmi, http://www.physics.upenn.edu/yodhlab/ Abstract: We present three-dimensional (3D) in vivo images of human breast cancer based on fluorescence diffuse optical tomography (FDOT). To our knowledge, this work represents the first reported 3D fluorescence tomography of human breast cancer in vivo. In our protocol, the fluorophore Indocyanine Green (ICG) is injected intravenously. Fluorescence excitation and detection are accomplished in the soft-compression, parallel-plane, transmission geometry using laser sources at 786 nm and spectrally filtered CCD detection. Phantom and in vivo studies confirm the signals are due to ICG fluorescence, rather than tissue autofluorescence and excitation light leakage. Fluorescence images of breast tumors were in good agreement with those of MRI, and with DOT based on endogenous contrast. Tumor- to-normal tissue contrast based on ICG fluorescence was two-to-four-fold higher than contrast based on hemoglobin and scattering parameters. In total the measurements demonstrate that FDOT of breast cancer is feasible and promising. © 2007 Optical Society of America OCIS codes: (170.6280) Spectroscopy, fluorescence and luminescence; (170.3010) Image re- construction techniques; (170.3830) Mammography References and links 1. A. G. Yodh and B. Chance, Spectroscopy and imaging with diffusing light, Physics Today 48, 34–40 (1995). 2. A. G. Yodh and D. A. Boas, Biomedical Photonics, chapter Functional Imaging with Diffusing Light, (CRC Press, 2003) pp. 21/1–45. 3. J. P. Culver, R. Choe, M. J. Holboke, L. Zubkov, T. Durduran, A. Slemp, V. Ntziachristos, D. N. Pattanayak, B. Chance, and A. G. Yodh, 3D diffuse optical tomography in the plane parallel transmission geometry: Evalua- tion of a hybrid frequency domain/continuous wave clinical system for breast imaging, Med. Phys. 30, 235–247 (2003). 4. R. Choe, A. Corlu, K. Lee, T. Durduran, S. D. Konecky, M. Grosicka-Koptyra, S. R. Arridge, B. J. Czerniecki, D. L. Fraker, A. DeMichele, B. Chance, M. A. Rosen, and A. G. Yodh, Diffuse optical tomography of breast cancer during neoadjuvant chemotherapy: a case study with comparison to MRI, Med. Phys. 32, 1128–1139 (2005). #80644 - $15.00 USD Received 5 Mar 2007; revised 9 May 2007; accepted 10 May 2007; published 16 May 2007 (C) 2007 OSA 28 May 2007 / Vol. 15, No. 11 / OPTICS EXPRESS 6696

Welcome message from author
This document is posted to help you gain knowledge. Please leave a comment to let me know what you think about it! Share it to your friends and learn new things together.
Transcript
Three-dimensionalin vivo fluorescencediffuse optical tomography of breast
cancer in humans
Alper Corlu 1, Regine Choe1, Turgut Durduran 1,2, Mark A. Rosen2,Martin Schweiger3, Simon R. Arridge3, Mitchell D. Schnall2,
Arjun G. Yodh 1
3Department of Computer Science, University College London, Gower Street, London WC1E6BT, UK
1Department of Physics and Astronomy,2Department of Radiology, University ofPennsylvania, Philadelphia, Pennsylvania 19104
Phone: 1-215-573-3463, Fax: 1-215-573-6391, [email protected]
http://www.lrsm.upenn.edu/pmi, http://www.physics.upenn.edu/yodhlab/
Abstract: We present three-dimensional (3D)in vivo images of humanbreast cancer based on fluorescence diffuse optical tomography (FDOT).To our knowledge, this work represents the first reported 3D fluorescencetomography of human breast cancerin vivo. In our protocol, the fluorophoreIndocyanine Green (ICG) is injected intravenously. Fluorescence excitationand detection are accomplished in the soft-compression, parallel-plane,transmission geometry using laser sources at 786 nm and spectrally filteredCCD detection. Phantom andin vivo studies confirm the signals are due toICG fluorescence, rather than tissue autofluorescence and excitation lightleakage. Fluorescence images of breast tumors were in good agreementwith those of MRI, and with DOT based on endogenous contrast.Tumor-to-normal tissue contrast based on ICG fluorescence was two-to-four-foldhigher than contrast based on hemoglobin and scattering parameters. Intotal the measurements demonstrate that FDOT of breast cancer is feasibleand promising.
© 2007 Optical Society of America
OCIS codes:(170.6280) Spectroscopy, fluorescence and luminescence; (170.3010) Image re-construction techniques; (170.3830) Mammography
References and links1. A. G. Yodh and B. Chance, Spectroscopy and imaging with diffusing light, Physics Today 48, 34–40 (1995).2. A. G. Yodh and D. A. Boas, Biomedical Photonics, chapter Functional Imaging with Diffusing Light, (CRC
Press, 2003) pp. 21/1–45.3. J. P. Culver, R. Choe, M. J. Holboke, L. Zubkov, T. Durduran, A. Slemp, V. Ntziachristos, D. N. Pattanayak,
B. Chance, and A. G. Yodh, 3D diffuse optical tomography in theplane parallel transmission geometry: Evalua-tion of a hybrid frequency domain/continuous wave clinical system for breast imaging, Med. Phys. 30, 235–247(2003).
4. R. Choe, A. Corlu, K. Lee, T. Durduran, S. D. Konecky, M. Grosicka-Koptyra, S. R. Arridge, B. J. Czerniecki,D. L. Fraker, A. DeMichele, B. Chance, M. A. Rosen, and A. G. Yodh, Diffuse optical tomography of breastcancer during neoadjuvant chemotherapy: a case study with comparison to MRI, Med. Phys. 32, 1128–1139(2005).
#80644 - $15.00 USD Received 5 Mar 2007; revised 9 May 2007; accepted 10 May 2007; published 16 May 2007
(C) 2007 OSA 28 May 2007 / Vol. 15, No. 11 / OPTICS EXPRESS 6696
5. T. Durduran, R. Choe, J. P. Culver, L. Zubkov, M. J. Holboke, J. Giammarco, B. Chance, and A. G. Yodh, Bulkoptical properties of healthy female breast tissue, Phys. Med. Biol. 47, 2847–2861 (2002).
6. A. E. Cerussi, A. J. Berger, F. Bevilacqua, N. Shah, D. Jakubowski, J. Butler, R. F. Holcombe, and B. J. Tromberg,Sources of absorption and scattering contrast for near-infrared optical mammography, Acad. Radiol. 8, 211–218(2001).
7. T. O. McBride B. W. Pogue, S. D. Jiang, and U. L. Osterberg, Aparallel-detection frequency-domain near-infrared tomography system for hemoglobin imaging of the breast in vivo, Rev. Sci. Instrum. 72, 1817–1824(2001).
8. V. Ntziachristos and B. Chance, Probing physiology and molecular function using optical imaging: applicationsto breast cancer, Breast Cancer Res. 3, 41–46 (2001).
9. B. W. Pogue, S. P. Poplack, T. O. McBride, W. A. Wells, K. S. Osterman, U. L. Osterberg, and K. D. Paulsen,Quantitative hemoglobin tomography with diffuse near-infrared spectroscopy: Pilot results in the breast, Radiol-ogy 218, 261–266 (2001).
10. N. Shah, A. Cerussi, C. Eker, J. Espinoza, J. Butler, J. Fishkin, R. Hornung, and B. Tromberg, Noninvasivefunctional optical spectroscopy of human breast tissue, Proc. Natl. Acad. Sci. 98, 4420–4425 (2001).
11. A. Garofalakis, G. Zacharakis, G. Filippidis, E. Sanidas, D. D. Tsiftsis, E. Stathopoulos, M. Kafousi, J. Ripoll,and TG Papazoglou, Optical characterization of thin female breast biopsies based on the reduced scatteringcoefficient, Phys. Med. Biol 50, 2583–2596 (2005).
12. F. Martelli and G. Zaccanti, Calibration of scattering and absorption properties of a liquid diffusive medium atNIR wavelengths. CW method, Opt. Express 15, 486–500 (2007).
13. V. Ntziachristos, A. G. Yodh, M. Schnall, and B. Chance, Concurrent mri and diffuse optical tomography ofbreast after indocyanine green enhancement, Proc. Natl. Acad. Sci. 97, 2767–2772 (2000).
14. X. Intes, J. Ripoll, Y. Chen, S. Nioka, A. G. Yodh, and B. Chance, In vivo continuous-wave optical breast imagingenhanced with indocyanine green, Med. Phys. 30, 1039–1047 (2003).
15. R. Weissleder, C. H. Tung, U. Mahmood, and A. Bogdanov, In vivo imaging of tumors with protease-activatednear-infrared fluorescent probes, Nat. Biotechnol. 17, 375–378 (1999).
16. D. J. Hawrysz and E. M. Sevick-Muraca, Developments Toward Diagnostic Breast Cancer Imaging Using Near-Infrared Optical Measurements and Fluorescent Contrast Agents, Neoplasia 2, 388–417 (2000).
17. V. Ntziachristos, C. Tung, C. Bremer, and R. Weissleder, Fluorescence molecular tomography resolves proteaseactivity in vivo, Nat. Med. 8, 757–760 (2002).
18. R. Cheung, M. Solonenko, T. M. Busch, F. Del Piero, M. E. Putt, S. M. Hahn, and A. G. Yodh, Correlationof in vivo photosensitizer fluorescence and photodynamic-therapy-induced depth of necrosis in a murine tumormodel, J. Of Biomed. Opt. 8, 248–252 (2003).
19. S. Ke, X. Wen, M. Gurfinkel, C. Charnsangavej, S. Wallace,E. M. Sevick-Muraca, and C. Li, Near-infraredoptical imaging of epidermal growth factor receptor in breastcancer xenografts, Cancer Res. 63, 7870–7875(2003).
20. A. Bogaards, A. Varma, K. Zhang, D. Zach, S. K. Bisland, E. H. Moriyama, L. Lilge, P. J. Muller, and B. C.Wilson, Fluorescence image-guided brain tumour resection with adjuvant metronomic photodynamic therapy:pre-clinical model and technology development, Photochem. Photobiol. Sci. 4, 438–442 (2005).
21. T. H. Foster, B. D. Pearson, S. Mitra, and C. E. Bigelow, Fluorescence anisotropy imaging reveals localizationof meso-tetrahydroxyphenyl chlorin in the nuclear envelope, Photochem. Photobiol. 81, 1544–1547 (2005).
22. P. I. Bastiaens and A. Squire, Fluorescence lifetime imaging microscopy: spatial resolution of biochemicalprocesses in the cell, Trends Cell Biol. 9, 48–52 (1999).
23. E. Kuwana and E. M. Sevick-Muraca, Fluorescence lifetimespectroscopy for pH sensing in scattering media,Anal. Chem. 75, 4325–4329 (2003).
24. E. Bombardieri and F. Crippa. PET imaging in breast cancer,Q. J. of Nucl. Med. 45, 245–55 (2001).25. A. R. Padhani, Dynamic contrast-enhanced mri in clinical oncology: current status and future directions, J.
Magn. Reson. Imaging 16, 407–422 (2002).26. B. Ballou, G. W. Fisher, A. S. Waggoner, D. L. Farkas, J. M.Reiland, R. Jaffe, R. B. Mujumdar, S. R. Mujumdar,
and T. R. Hakala, Tumor labeling in vivo using cyanine-conjugated monoclonal antibodies, Cancer Immunol.Immunother 41, 257–263 (1995).
27. S. Achilefu, R. B. Dorshow, J. E. Bugaj, and R. Rajagopalan, Novel receptor-targeted fluorescent contrast agentsfor in vivo tumor imaging, Invest. Radiol. 35, 479–485 (2000).
28. U. Mahmood, C.H. Tung, Y. Tang, and R. Weissleder, Feasibility of in Vivo Multichannel Optical Imaging ofGene Expression: Experimental Study in Mice1 (2002).
29. S. Kwon, S. Ke, J. P. Houston, W. Wang, Q. Wu, C. Li, and E. M.Sevick-Muraca, Imaging dose-dependentpharmacokinetics of an RGD-fluorescent dye conjugate targeted to alpha v beta 3 receptor expressed in Kaposi’ssarcoma, Mol. Imaging 4, 75–87 (2005).
30. A. Tsourkas and G. Bao, Shedding light on health and disease using molecular beacons. Brief Funct. Genomic.Proteomic. 1, 372–384 (2003).
31. M. A. O’Leary, D. A. Boas, B. Chance, and A. G. Yodh, Reradiation and imaging of diffuse photon densitywaves using fluorescent inhomogeneities. J. Lumin. 60-1, 281–286 (1994).
#80644 - $15.00 USD Received 5 Mar 2007; revised 9 May 2007; accepted 10 May 2007; published 16 May 2007
(C) 2007 OSA 28 May 2007 / Vol. 15, No. 11 / OPTICS EXPRESS 6697
32. M. A. O’Leary, D. A. Boas, X. D. Li, B. Chance, and A. G. Yodh, Fluorescent lifetime imaging in turbid media.Opt. Lett. 21, 158–160 (1996).
33. J. Wu, L. Perelman, R. R. Dasari, and M. S. Feld, Fluorescence tomographic imaging in turbid media usingearly-arriving photons and Laplacetransforms. Proc. Natl.Acad. Sci. 94, 8783–8788 (1997).
34. B. B. Das, F. Liu, and R. R. Alfano, Time-resolved fluorescence and photon migration studies in biomedical andmodel random media. Rep. Prog. Phys. 60, 227–292 (1997).
35. X. D. Li, B. Chance, and A. G. Yodh, Fluorescent heterogeneities in turbid media: limits for detection, charac-terization, and comparison with absorption, Applied Optics37, 6833–6844 (1998).
36. E. L. Hull, M. G. Nichols, and T. H. Foster, Localization of luminescent inhomogeneities in turbid media withspatially resolved measurements of cw diffuse luminescence emittance, Appl. Opt. 37, 2755–2765 (1998).
37. M. J. Eppstein, D. J. Hawrysz, A. Godavarty, and E. M. Sevick-Muraca, Three-dimensional, Bayesian imagereconstruction from sparse and noisy data sets: Near-infrared fluorescence tomography, Proc. Natl. Acad. Sci.99, 9619–9624 (2002).
38. A. D. Klose and A. H. Hielscher, Fluorescence tomography with simulated data based on the equation of radiativetransfer, Opt. Lett. 28, 1019–1021 (2003).
39. V. Ntziachristos and R. Weissleder, CCD-based scanner for three-dimensional fluorescence-mediated diffuseoptical tomography of small animals, Med. Phys. 29, 803–809 (2002).
40. E. Shives, Y. Xu, and H. Jiang, Fluorescence lifetime tomography of turbid media based on an oxygen-sensitivedye, Opt. Express 10, 1557–1562 (2002).
41. Y. Chen, C. Mu, X. Intes, D. Blessington, and B. Chance, Near-infrared phase cancellation instrument for fastand accurate localization of fluorescent heterogeneity, Rev. Sci. Instrum. 74, 3466–3473 (2003).
42. K. R. Diamond, T. J. Farrell, and M. S. Patterson, Measurement of fluorophore concentrations and fluorescencequantum yield in tissue-simulating phantoms using three diffusion models of steady-state spatially resolved flu-orescence, Phys. Med. Biol. 48, 4135–4149 (2003).
43. S. C. Davis, B. W. Pogue, H. Dehghani, and K. D. Paulsen, Contrast-detail analysis characterizing diffuse opticalfluorescence tomography image reconstruction, J. Biomed. Opt.10, 050501–050501 (2005).
44. A. T. N. Kumar, S. B. Raymond, G. Boverman, D. A. Boas, and B. J.Bacskai, Time resolved fluorescencetomography of turbid media based on lifetime contrast, Opt. Express 14, 12255–12270 (2006).
45. A. Joshi, W. Bangerth, K. Hwang, J. C. Rasmussen, and E. M. Sevick-Muraca, Fully adaptive FEM basedfluorescence optical tomography from time-dependent measurements with area illumination and detection, Med.Phys. 33, 1299–1310 (2006).
46. A. Godavarty, A. B. Thompson, R. Roy, M. Gurfinkel, M. J. Eppstein, C. Zhang, and E. M. Sevick-Muraca, Di-agnostic imaging of breast cancer using fluorescence-enhanced optical tomography: phantom studies, J. Biomed.Opt. 9, 488–496 (2004).
47. D. E. Hyde, T. J. Farrell, M. S. Patterson, and B. C. Wilson, A diffusion theory model of spatially resolvedfluorescence from depth-dependent fluorophore concentrations, Phys. Med. Biol. 46, 369–383 (2001).
48. S. V. Apreleva, D. F. Wilson, and S. A. Vinogradov, Tomographic imaging of oxygen by phosphorescencelifetime, Appl. Opt. 45, 8547–8559 (2006).
49. S. Li, Q. Zhang, and H. Jiang, Two-dimensional bioluminescence tomography: numerical simulations and phan-tom experiments, Appl. Opt. 45, 3390–3394 (2006).
50. H. Dehghani, S. C. Davis, S. Jiang, B. W. Pogue, K. D. Paulsen, and M. S. Patterson, Spectrally resolvedbioluminescence optical tomography, Opt. Lett. 31, 365–367 (2006).
51. E. E. Graves, J. Ripoll, R. Weissleder, and V. Ntziachristos, A submillimeter resolution fluorescence molecularimaging system for small animal imaging, Med. Phys. 30, 901 (2003).
52. B. W. Pogue, S. L. Gibbs, B. Chen, and M. Savellano, Fluorescence imaging in vivo: raster scanned point-source imaging provides more accurate quantification than broad beam geometries, Technol. Cancer Res. Treat.3, 15–21 (2004).
53. S. V. Patwardhan, S. R. Bloch, S. Achilefu, and J. P. Culver, Time-dependent whole-body fluorescence tomogra-phy of probe bio-distributions in mice, Opt. Express 13, 2564–2577 (2005).
54. K. Hwang, J. P. Houston, J. C. Rasmussen, A. Joshi, S. Ke, C.Li, and E. M. Sevick-Muraca, Improved excitationlight rejection enhances small-animal fluorescent optical imaging, Mol. Imaging 4, 194–204 (2005).
55. S. Bloch, F. Lesage, L. McIntosh, A. Gandjbakhche, K. Liang, and S. Achilefu, Whole-body fluorescence lifetimeimaging of a tumor-targeted near-infrared molecular probe in mice. J. of Biomed. Opt. 10, 54003–54003 (2005).
56. A. Liebert, H. Wabnitz, J. Steinbrink, M. Moller, R. Macdonald, H. Rinneberg, A. Villringer, and H. Obrig,Bed-side assessment of cerebral perfusion in stroke patients based on optical monitoring of a dye bolus by time-resolved diffuse reflectance, Neuroimage 24, 426–35 (2005).
57. J. S. Reynolds, T. L. Troy, R. H. Mayer, A. B. Thompson, D. J.Waters, K. K. Cornell, P. W. Snyder, and E. M.Sevick-Muraca, Imaging of spontaneous canine mammary tumors using fluorescent contrast agents, Photochem.Photobiol. 70, 87–94 (1999).
58. Akorn Inc. IC-GREENTM. http://www.akorn.com/documents/catalog/packageinserts/17478-701-02.pdf, 2005.Accessed 2/13/07.
59. S. R. Arridge, Optical tomography in medical imaging, Inverse Problems 15, R41–R93 (1999).
#80644 - $15.00 USD Received 5 Mar 2007; revised 9 May 2007; accepted 10 May 2007; published 16 May 2007
(C) 2007 OSA 28 May 2007 / Vol. 15, No. 11 / OPTICS EXPRESS 6698
60. M. A. O’Leary, Imaging with diffuse photon density waves, Ph.D. Dissertation Unversity of Pennsylvania, 1996.61. S. R. Arridge and M. Schweiger, A gradient-based optimisation scheme for optical tomography, Opt. Express 2,
213–226 (1998).62. A. Corlu, R. Choe, T. Durduran, K. Lee, M. Schweiger, E. M.C. Hillman, S. R. Arridge, and A. G. Yodh, Diffuse
optical tomography with spectral constraints and wavelength optimization, Appl. Opt. 44, 2082–2093 (2005).63. A. Corlu, T. Durduran, R. Choe, M. Schweiger, E. M. C. Hillman, S. R. Arridge, and A. G. Yodh, Uniqueness and
wavelength optimization in continous-wave multispectral diffuse optical tomography, Opt. Lett. 28, 2339–2341(2003).
64. D. A. Boas,Diffuse Photon Probes of Structural and Dynamical Properties of Turbid Media: Theory and Biomed-ical Applications, Ph.d. dissertation, University of Pennsylvania, 1996.
65. T. Durduran, A. G. Yodh, B. Chance, and D. A. Boas, Does thephoton diffusion coefficient depend on absorp-tion? J. Opt. Soc. Am. 14, 3358–3365 (1997).
66. D. J. Durian, The diffusion coefficient depends on absorption, Opt. Lett. 23, 1502–1504 (1998).67. M. Schweiger, S. R. Arridge, M. Hiraoka, and D. T. Delpy, The finite element model for the propagation of light
in scattering media: Boundary and source conditions, Med. Phys. 22, 1779–1792 (1995).68. V. Ntziachristos and R. Weissleder, Experimental three-dimensional fluorescence reconstruction of diffuse media
by use of a normalized born approximation, Opt. Lett. 26, 893–895 (2001).69. M. Schweiger, S. R. Arridge, and I. Nissila, Gauss-Newton method for image reconstruction in diffuse optical
tomography, Phys. Med. Biol. 50, 2365–2386 (2005).70. H. W. Engl, M. Hanke, and A. Neubauer,Regularization of Inverse Problems(Kluwer Academic Publishers,
1996).71. S. R. Arridge, M. Schweiger, M. Hiraoka, and D. T. Delpy, Afinite element approach for modeling photon
transport in tissue, Med. Phys. 20, 299–309 (1993).72. S. Prahl, Optical properties spectra, http://omlc.ogi.edu/spectra/index.html, 2001. Accessed 2/14/07.73. E. M. Sevick-Muraca, G. Lopez, J. S. Reynolds, T. L. Troy,and C. L. Hutchinson, Fluorescence and absorption
contrast mechanisms for biomedical optical imaging using frequency-domain techniques, Photochem. Photobiol.66, 55–64 (1997).
74. H. Dehghani, B. W. Pogue, S. P. Poplack, and K. D. Paulsen,Multiwavelength three-dimensional near-infraredtomography of the breast: initial simulation, phantom, and clinical results, Appl. Opt 42, 135–145 (2003).
75. D. Grosenick, H. Wabnitz, K. T. Moesta, J. Mucke, P. M. Schlag, and H. Rinneberg, Time-domain scanningoptical mammography: II. Optical properties and tissue parameters of 87 carcinomas, Phys. Med. Biol 50, 2451–2468 (2005).
76. R. Choe,Diffuse Optical Tomography and Spectroscopy of Breast Cancer and Fetal Brain. PhD thesis, Universityof Pennsylvania, 2005.
77. A. Godavarty, M.J. Eppstein, C. Zhang, S. Theru, A. B. Thompson, M. Gurfinkel, and E. M. Sevick-Muraca,Fluorescence-enhanced optical imaging in large tissue volumes using a gain-modulated ICCD camera. Phys.Med. Biol. 48, 1701–1720 (2003).
1. Introduction
Diffuse optical tomography (DOT) is a promising new medicaldiagnostic [1, 2] that hasbeen recently applied for breast cancer imaging based on endogenous tissue contrast such ashemoglobin, water and lipid [3–12]. In addition, a few breast cancer studies have used theab-sorptionof exogenous molecular agents such as Indocyanine Green (ICG) to enhance tumorcontrast. Evidently, leaky tumor vasculature delays ICG washout and thereby elevates its con-centration in tumors relative to normal tissue [13,14].
Fluorescent contrast agents have also been considered as a means to enhance tumor detectionand characterization [15–21]. In principle, fluorescence signals can provide greater detectionsensitivity and specificity compared to absorption signals, as well as access to new informationabout tissue micro-environment, including tissue pO2, pH, and intracellular calcium concen-tration [22, 23]. Indeed, the potential uses of optical fluorophores bear close resemblance tothe use of contrast agents in PET and MRI [24, 25]. Successfulfluorescence diffuse opticaltomography (FDOT) is therefore critical for application ofmolecular imaging probes such asdyes [15, 17, 26–29] and molecular beacons [30] that bind to tumor-specific receptors in deeptissue.
Fluorescence tomography methods have been developed and explored in tissue phantoms[31–50], in small animals [17, 39, 51–55] and in deep tissuessuch as human brain [56] and
#80644 - $15.00 USD Received 5 Mar 2007; revised 9 May 2007; accepted 10 May 2007; published 16 May 2007
(C) 2007 OSA 28 May 2007 / Vol. 15, No. 11 / OPTICS EXPRESS 6699
canine mammary tumors [57]. To our knowledge, however, detection and 3Din vivo quan-tification of diffuse fluorescence signals has not as yet beenreported from the cancer bearinghuman breast.
In this paper we demonstratein vivo fluorescence diffuse optical tomography (FDOT) in thehuman breast, reconstructing 3D tomographic maps of the tissue fluorophore distributioninvivo. Three cancer cases are analyzed wherein tumors exhibit fluorescence contrast up to four-fold higher than corresponding endogenous optical contrast derived using the same apparatus.
The remainder of this paper is structured as follows. The Methods section introduces the DOTinstrument, describes tissue phantom andin vivo breast measurement protocols, and it outlines3D fluorescence image reconstruction procedures. The Results section first establishes that themeasured signal is due to ICG fluorescence rather than tissueautofluorescence and excitationlight leakage. Then phantom and breast tumor observations are presented, and we demonstratethat reconstructed fluorescence from the tumor bearing breast are in good agreement with opti-cal absorption and scattering images and with magnetic resonance imaging (MRI). In the Dis-cussion section we summarize and compare our methods and results to related FDOT studies.We also make suggestions for improvement.
2. Methods
2.1. DOT instrument
Figure 1(a) illustrates the clinical instrument. We use it to obtain both intrinsic and fluorescentdiffuse optical images of tissue phantoms and human breast.The instrument’s imaging capa-bilities, based on endogenous contrast, have been demonstrated previously with phantoms andin human subjects [3,4]. Furthermore, agreement with MRI ina case study of locally advancedbreast cancer during neoadjuvant chemotherapy treatment has validated the potential of thisDOT instrument for breast cancer imaging [4].
In practice the female subject lies in prone position with her breasts suspended in a boxfilled with a fluid mixture of 30% Lyposin III (Abbott Laboratories, Chicago,IL), and Indiaink (Black India 4415, Sanford, Bellwood, IL) whose opticalproperties are similar to those ofhuman tissue. Hereafter we will refer to this mixture as “matching fluid”. The cancerous breastis centered between the soft compression plate and the viewing window. The compression plate(Fig. 1(a)) contains 45 source fibers of 200µm in diameter (FIS) arranged in a 9 x 5 gridnumbered from left to right starting with the upper left source. An optical switch (Dicon FiberOptics, Richmond, CA) is utilized to deliver light from foursinusoidally intensity modulated(70 MHz) laser diodes operating at 650, 690, 786 and 830 nm to each grid position. The laserpower level varies depending on the wavelength and the source position, with an average of 10mW.
Light detection is accomplished in reemission through ninefibers located on the compres-sion plate (Fig. 1(a)) and in transmission through a lens coupled 16-bit CCD (Roper Scientific,Trenton, NJ, VersArray:1300F, 1340 x 1300 pixel). The remission fibers are connected to a fre-quency domain detection module which provides phase- and amplitude-data for determinationof the bulk optical properties of the matching fluid and tissue. The bulk properties determinedtherein are used as an initial estimate in the DOT reconstruction.
For the ICG [58] fluorescence measurements (Fig. 1(b)), two spectral filters are placed infront of the CCD camera in the following order. An 830 nm bandpass filter with 10 nm FWHM(OD = 4, CVI Laser Inc.) is placed first, and a 785 nm notch filter(OD = 6, Semrock Inc) isplaced second. In this way the incoming excitation light first passes through the notch filterand the possibility for detection of excitation-light-induced bandpass filter autofluorescence iseliminated.
#80644 - $15.00 USD Received 5 Mar 2007; revised 9 May 2007; accepted 10 May 2007; published 16 May 2007
(C) 2007 OSA 28 May 2007 / Vol. 15, No. 11 / OPTICS EXPRESS 6700
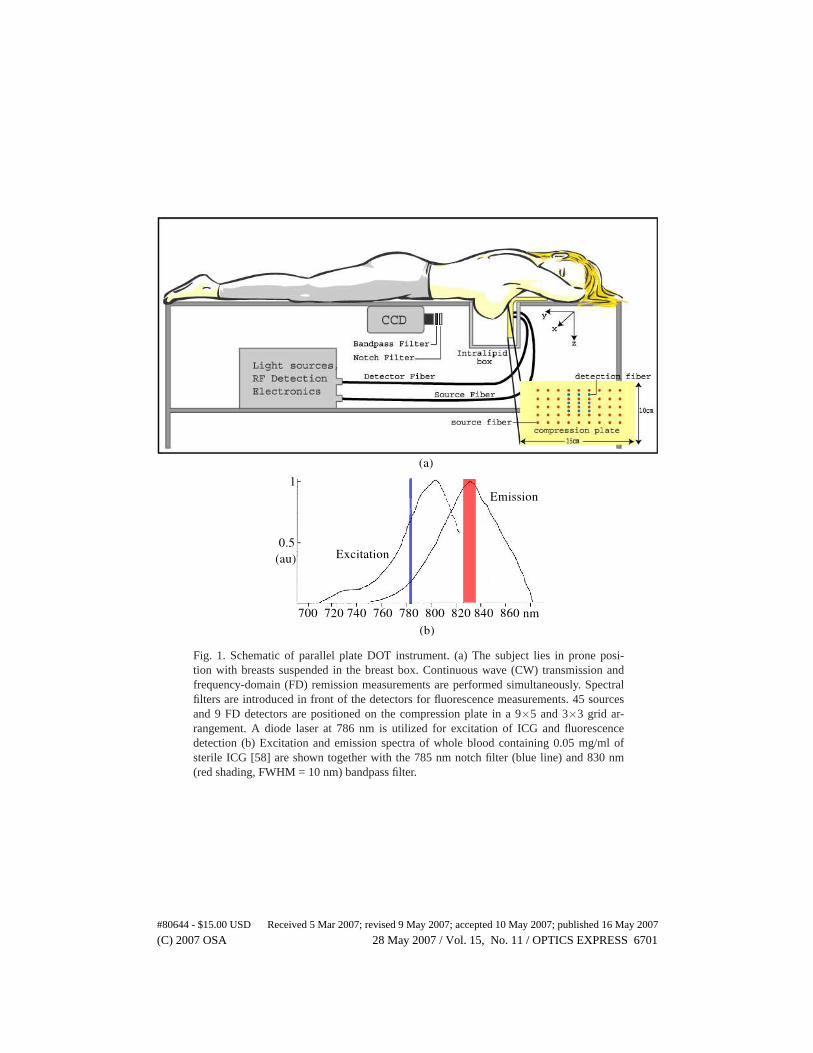
Fig. 1. Schematic of parallel plate DOT instrument. (a) The subject lies in prone posi-tion with breasts suspended in the breast box. Continuous wave (CW) transmission andfrequency-domain (FD) remission measurements are performed simultaneously. Spectralfilters are introduced in front of the detectors for fluorescence measurements. 45 sourcesand 9 FD detectors are positioned on the compression plate in a 9×5 and 3×3 grid ar-rangement. A diode laser at 786 nm is utilized for excitation of ICG and fluorescencedetection (b) Excitation and emission spectra of whole blood containing 0.05mg/ml ofsterile ICG [58] are shown together with the 785 nm notch filter (blue line) and830 nm(red shading, FWHM = 10 nm) bandpass filter.
#80644 - $15.00 USD Received 5 Mar 2007; revised 9 May 2007; accepted 10 May 2007; published 16 May 2007
(C) 2007 OSA 28 May 2007 / Vol. 15, No. 11 / OPTICS EXPRESS 6701
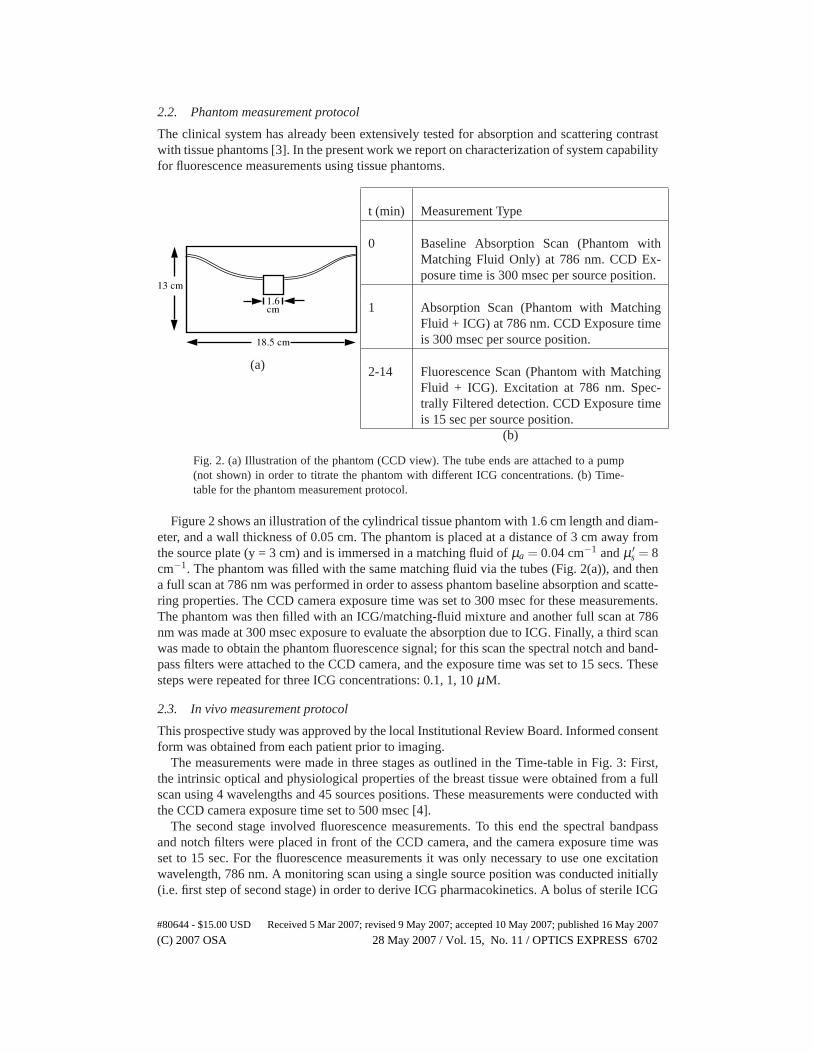
2.2. Phantom measurement protocol
The clinical system has already been extensively tested forabsorption and scattering contrastwith tissue phantoms [3]. In the present work we report on characterization of system capabilityfor fluorescence measurements using tissue phantoms.
(a)
t (min) Measurement Type
0 Baseline Absorption Scan (Phantom withMatching Fluid Only) at 786 nm. CCD Ex-posure time is 300 msec per source position.
1 Absorption Scan (Phantom with MatchingFluid + ICG) at 786 nm. CCD Exposure timeis 300 msec per source position.
2-14 Fluorescence Scan (Phantom with MatchingFluid + ICG). Excitation at 786 nm. Spec-trally Filtered detection. CCD Exposure timeis 15 sec per source position.
(b)
Fig. 2. (a) Illustration of the phantom (CCD view). The tube ends are attached to a pump(not shown) in order to titrate the phantom with different ICG concentrations. (b) Time-table for the phantom measurement protocol.
Figure 2 shows an illustration of the cylindrical tissue phantom with 1.6 cm length and diam-eter, and a wall thickness of 0.05 cm. The phantom is placed ata distance of 3 cm away fromthe source plate (y = 3 cm) and is immersed in a matching fluid ofµa = 0.04 cm−1 andµ ′
s = 8cm−1. The phantom was filled with the same matching fluid via the tubes (Fig. 2(a)), and thena full scan at 786 nm was performed in order to assess phantom baseline absorption and scatte-ring properties. The CCD camera exposure time was set to 300 msec for these measurements.The phantom was then filled with an ICG/matching-fluid mixture and another full scan at 786nm was made at 300 msec exposure to evaluate the absorption due to ICG. Finally, a third scanwas made to obtain the phantom fluorescence signal; for this scan the spectral notch and band-pass filters were attached to the CCD camera, and the exposuretime was set to 15 secs. Thesesteps were repeated for three ICG concentrations: 0.1, 1, 10µM.
2.3. In vivo measurement protocol
This prospective study was approved by the local Institutional Review Board. Informed consentform was obtained from each patient prior to imaging.
The measurements were made in three stages as outlined in theTime-table in Fig. 3: First,the intrinsic optical and physiological properties of the breast tissue were obtained from a fullscan using 4 wavelengths and 45 sources positions. These measurements were conducted withthe CCD camera exposure time set to 500 msec [4].
The second stage involved fluorescence measurements. To this end the spectral bandpassand notch filters were placed in front of the CCD camera, and the camera exposure time wasset to 15 sec. For the fluorescence measurements it was only necessary to use one excitationwavelength, 786 nm. A monitoring scan using a single source position was conducted initially(i.e. first step of second stage) in order to derive ICG pharmacokinetics. A bolus of sterile ICG
#80644 - $15.00 USD Received 5 Mar 2007; revised 9 May 2007; accepted 10 May 2007; published 16 May 2007
(C) 2007 OSA 28 May 2007 / Vol. 15, No. 11 / OPTICS EXPRESS 6702
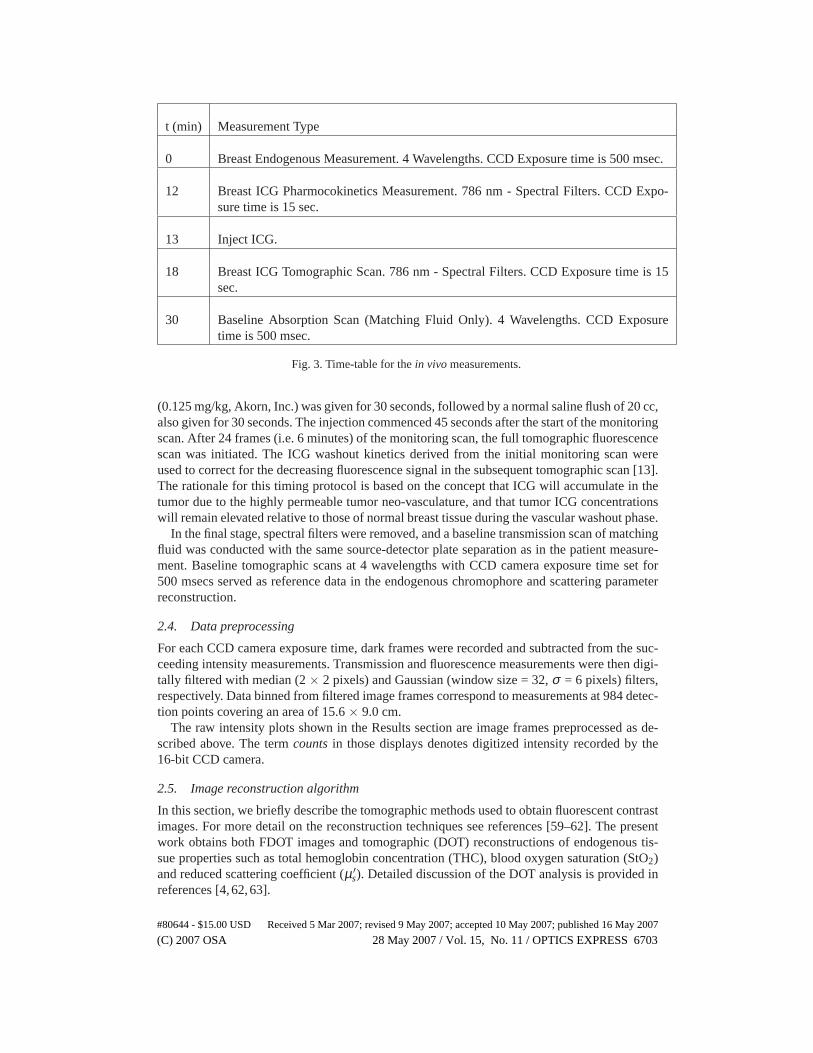
t (min) Measurement Type
0 Breast Endogenous Measurement. 4 Wavelengths. CCD Exposure time is 500 msec.
12 Breast ICG Pharmocokinetics Measurement. 786 nm - SpectralFilters. CCD Expo-sure time is 15 sec.
13 Inject ICG.
18 Breast ICG Tomographic Scan. 786 nm - Spectral Filters. CCD Exposure time is 15sec.
30 Baseline Absorption Scan (Matching Fluid Only). 4 Wavelengths. CCD Exposuretime is 500 msec.
Fig. 3. Time-table for thein vivomeasurements.
(0.125 mg/kg, Akorn, Inc.) was given for 30 seconds, followed by a normal saline flush of 20 cc,also given for 30 seconds. The injection commenced 45 seconds after the start of the monitoringscan. After 24 frames (i.e. 6 minutes) of the monitoring scan, the full tomographic fluorescencescan was initiated. The ICG washout kinetics derived from the initial monitoring scan wereused to correct for the decreasing fluorescence signal in thesubsequent tomographic scan [13].The rationale for this timing protocol is based on the concept that ICG will accumulate in thetumor due to the highly permeable tumor neo-vasculature, and that tumor ICG concentrationswill remain elevated relative to those of normal breast tissue during the vascular washout phase.
In the final stage, spectral filters were removed, and a baseline transmission scan of matchingfluid was conducted with the same source-detector plate separation as in the patient measure-ment. Baseline tomographic scans at 4 wavelengths with CCD camera exposure time set for500 msecs served as reference data in the endogenous chromophore and scattering parameterreconstruction.
2.4. Data preprocessing
For each CCD camera exposure time, dark frames were recordedand subtracted from the suc-ceeding intensity measurements. Transmission and fluorescence measurements were then digi-tally filtered with median (2× 2 pixels) and Gaussian (window size = 32,σ = 6 pixels) filters,respectively. Data binned from filtered image frames correspond to measurements at 984 detec-tion points covering an area of 15.6× 9.0 cm.
The raw intensity plots shown in the Results section are image frames preprocessed as de-scribed above. The termcountsin those displays denotes digitized intensity recorded by the16-bit CCD camera.
2.5. Image reconstruction algorithm
In this section, we briefly describe the tomographic methodsused to obtain fluorescent contrastimages. For more detail on the reconstruction techniques see references [59–62]. The presentwork obtains both FDOT images and tomographic (DOT) reconstructions of endogenous tis-sue properties such as total hemoglobin concentration (THC), blood oxygen saturation (StO2)and reduced scattering coefficient (µ ′
s). Detailed discussion of the DOT analysis is provided inreferences [4,62,63].
#80644 - $15.00 USD Received 5 Mar 2007; revised 9 May 2007; accepted 10 May 2007; published 16 May 2007
(C) 2007 OSA 28 May 2007 / Vol. 15, No. 11 / OPTICS EXPRESS 6703
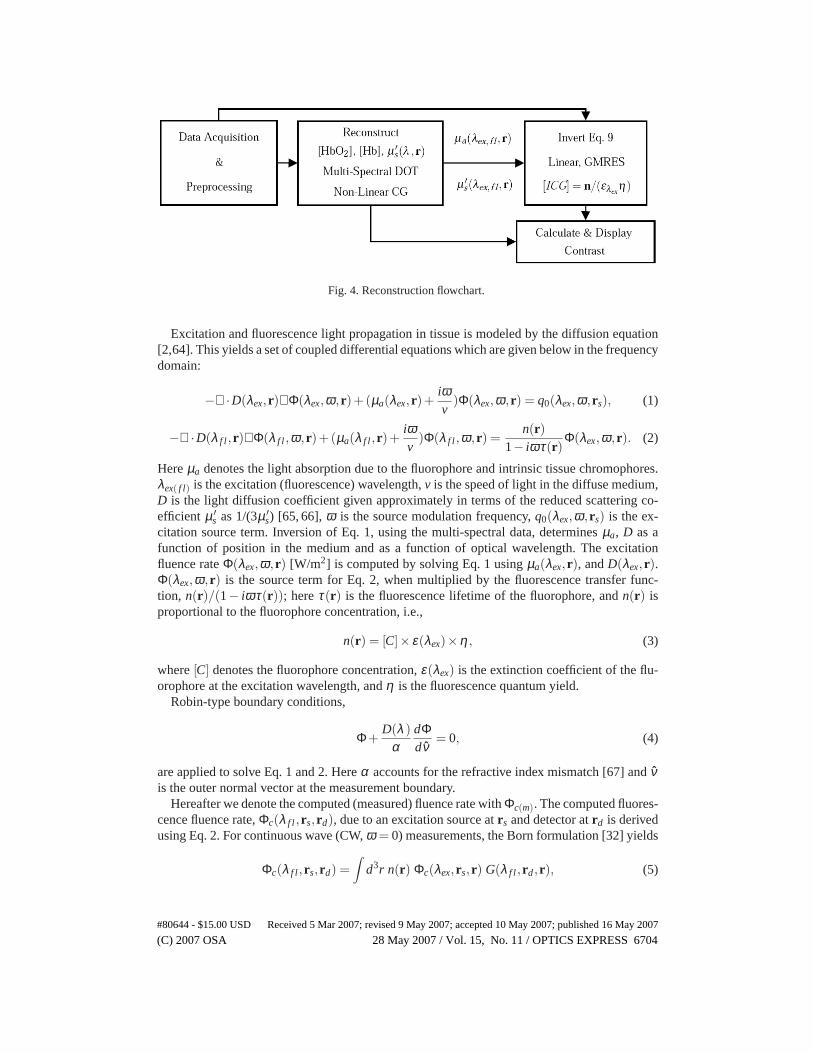
Fig. 4. Reconstruction flowchart.
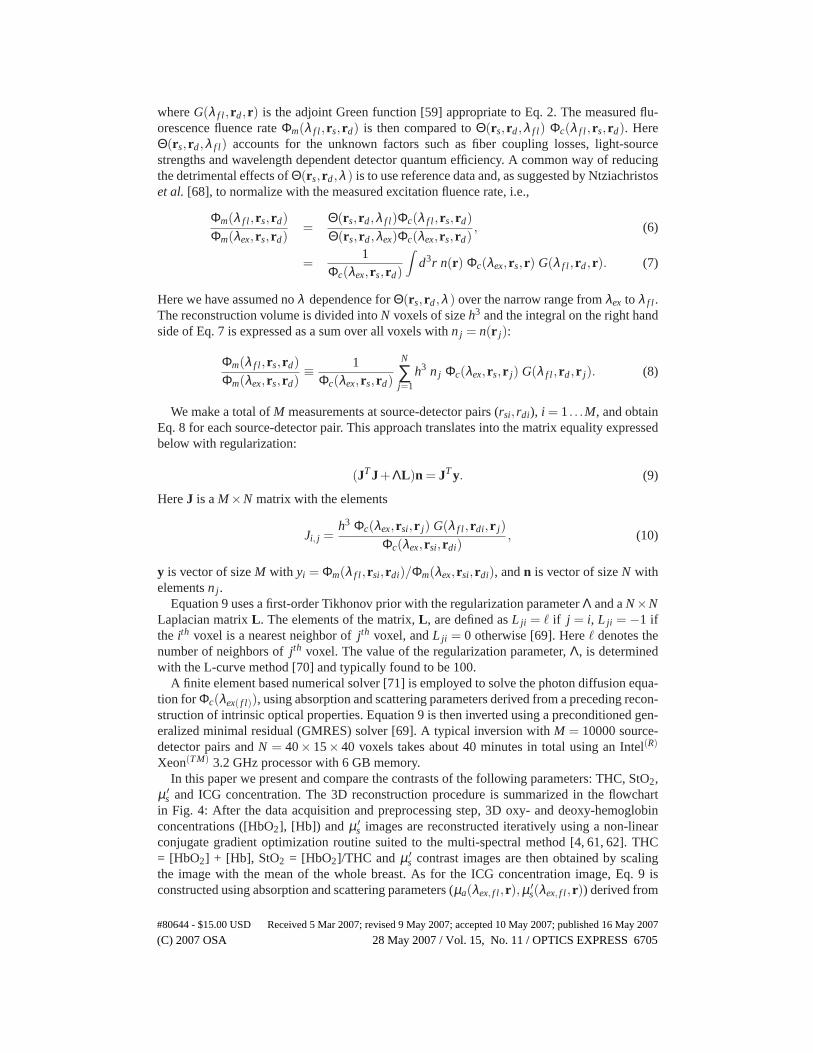
Excitation and fluorescence light propagation in tissue is modeled by the diffusion equation[2,64]. This yields a set of coupled differential equationswhich are given below in the frequencydomain:
−∇ ·D(λex, r)∇Φ(λex,ω, r)+(µa(λex, r)+iωv
)Φ(λex,ω, r) = q0(λex,ω, rs), (1)
−∇ ·D(λ f l , r)∇Φ(λ f l ,ω, r)+(µa(λ f l , r)+iωv
)Φ(λ f l ,ω, r) =n(r)
1− iωτ(r)Φ(λex,ω, r). (2)
Hereµa denotes the light absorption due to the fluorophore and intrinsic tissue chromophores.λex( f l) is the excitation (fluorescence) wavelength,v is the speed of light in the diffuse medium,D is the light diffusion coefficient given approximately in terms of the reduced scattering co-efficient µ ′
s as 1/(3µ ′s) [65, 66],ω is the source modulation frequency,q0(λex,ω, rs) is the ex-
citation source term. Inversion of Eq. 1, using the multi-spectral data, determinesµa, D as afunction of position in the medium and as a function of optical wavelength. The excitationfluence rateΦ(λex,ω, r) [W/m2] is computed by solving Eq. 1 usingµa(λex, r), andD(λex, r).Φ(λex,ω, r) is the source term for Eq. 2, when multiplied by the fluorescence transfer func-tion, n(r)/(1− iωτ(r)); hereτ(r) is the fluorescence lifetime of the fluorophore, andn(r) isproportional to the fluorophore concentration, i.e.,
n(r) = [C]× ε(λex)×η , (3)
where[C] denotes the fluorophore concentration,ε(λex) is the extinction coefficient of the flu-orophore at the excitation wavelength, andη is the fluorescence quantum yield.
Robin-type boundary conditions,
Φ+D(λ )
αdΦdν
= 0, (4)
are applied to solve Eq. 1 and 2. Hereα accounts for the refractive index mismatch [67] andνis the outer normal vector at the measurement boundary.
Hereafter we denote the computed (measured) fluence rate with Φc(m). The computed fluores-cence fluence rate,Φc(λ f l , rs, rd), due to an excitation source atrs and detector atrd is derivedusing Eq. 2. For continuous wave (CW,ω = 0) measurements, the Born formulation [32] yields
Φc(λ f l , rs, rd) =∫
d3r n(r) Φc(λex, rs, r) G(λ f l , rd, r), (5)
#80644 - $15.00 USD Received 5 Mar 2007; revised 9 May 2007; accepted 10 May 2007; published 16 May 2007
(C) 2007 OSA 28 May 2007 / Vol. 15, No. 11 / OPTICS EXPRESS 6704
whereG(λ f l , rd, r) is the adjoint Green function [59] appropriate to Eq. 2. The measured flu-orescence fluence rateΦm(λ f l , rs, rd) is then compared toΘ(rs, rd,λ f l ) Φc(λ f l , rs, rd). HereΘ(rs, rd,λ f l ) accounts for the unknown factors such as fiber coupling losses, light-sourcestrengths and wavelength dependent detector quantum efficiency. A common way of reducingthe detrimental effects ofΘ(rs, rd,λ ) is to use reference data and, as suggested by Ntziachristoset al. [68], to normalize with the measured excitation fluence rate, i.e.,
Φm(λ f l , rs, rd)
Φm(λex, rs, rd)=
Θ(rs, rd,λ f l )Φc(λ f l , rs, rd)
Θ(rs, rd,λex)Φc(λex, rs, rd), (6)
=1
Φc(λex, rs, rd)
∫
d3r n(r) Φc(λex, rs, r) G(λ f l , rd, r). (7)
Here we have assumed noλ dependence forΘ(rs, rd,λ ) over the narrow range fromλex to λ f l .The reconstruction volume is divided intoN voxels of sizeh3 and the integral on the right handside of Eq. 7 is expressed as a sum over all voxels withn j = n(r j):
Φm(λ f l , rs, rd)
Φm(λex, rs, rd)≡
1Φc(λex, rs, rd)
N
∑j=1
h3 n j Φc(λex, rs, r j) G(λ f l , rd, r j). (8)
We make a total ofM measurements at source-detector pairs (rsi, rdi), i = 1. . .M, and obtainEq. 8 for each source-detector pair. This approach translates into the matrix equality expressedbelow with regularization:
(JTJ+ΛL)n = JTy. (9)
HereJ is aM×N matrix with the elements
Ji, j =h3 Φc(λex, rsi, r j) G(λ f l , rdi, r j)
Φc(λex, rsi, rdi), (10)
y is vector of sizeM with yi = Φm(λ f l , rsi, rdi)/Φm(λex, rsi, rdi), andn is vector of sizeN withelementsn j .
Equation 9 uses a first-order Tikhonov prior with the regularization parameterΛ and aN×NLaplacian matrixL . The elements of the matrix,L , are defined asL ji = ℓ if j = i, L ji = −1 ifthe ith voxel is a nearest neighbor ofj th voxel, andL ji = 0 otherwise [69]. Hereℓ denotes thenumber of neighbors ofj th voxel. The value of the regularization parameter,Λ, is determinedwith the L-curve method [70] and typically found to be 100.
A finite element based numerical solver [71] is employed to solve the photon diffusion equa-tion for Φc(λex( f l)), using absorption and scattering parameters derived from apreceding recon-struction of intrinsic optical properties. Equation 9 is then inverted using a preconditioned gen-eralized minimal residual (GMRES) solver [69]. A typical inversion withM = 10000 source-detector pairs andN = 40× 15× 40 voxels takes about 40 minutes in total using an Intel(R)
Xeon(TM) 3.2 GHz processor with 6 GB memory.In this paper we present and compare the contrasts of the following parameters: THC, StO2,
µ ′s and ICG concentration. The 3D reconstruction procedure is summarized in the flowchart
in Fig. 4: After the data acquisition and preprocessing step, 3D oxy- and deoxy-hemoglobinconcentrations ([HbO2], [Hb]) and µ ′
s images are reconstructed iteratively using a non-linearconjugate gradient optimization routine suited to the multi-spectral method [4, 61, 62]. THC= [HbO2] + [Hb], StO2 = [HbO2]/THC and µ ′
s contrast images are then obtained by scalingthe image with the mean of the whole breast. As for the ICG concentration image, Eq. 9 isconstructed using absorption and scattering parameters (µa(λex, f l , r),µ ′
s(λex, f l , r)) derived from
#80644 - $15.00 USD Received 5 Mar 2007; revised 9 May 2007; accepted 10 May 2007; published 16 May 2007
(C) 2007 OSA 28 May 2007 / Vol. 15, No. 11 / OPTICS EXPRESS 6705
the endogenous chromophores obtained in the previous step,and inverted with a GMRES solverroutine. ICG concentration is obtained from reconstructedn using Eq. 3:[ICG] = n/(ε(λex)η),and scaled to yield ICG contrast forin vivo reconstructions in a manner similar to that ofendogenous contrast case. Note thatλex, f l corresponds to measurement wavelengths 786 and830 nm, respectively, andε(λex) = 254000 cm−1/M [72], η = 0.016 for ICG in water [73].
The contrast image slices for all of the four parameters are displayed along with the profilesdepicting the contrast along the pink lines crossing peak contrast regions. Profiles are plottedwith standard deviations calculated from upper and lower pixels adjacent to the pink traces.
2.6. Fluorescence transillumination
In order to generate a quick but incomplete representation of fluorescence data, we also con-struct two-dimensional fluorescencetransilluminationimages [4]. The fluorescence transillu-mination image is defined in terms of fluorescence and excitation fluence rate data as follows:
T(rd) = −log
(
∑Nss Φ f l
m(rs, rd)
∑Nss Φex
m(rs, rd)
)
. (11)
HereNs refers to the number of sources used in the scan. Note thatΦexm(rs, rd) andΦ f l
m(rs, rd)are obtained in the first and second (full FDOT scan) stages ofthein vivomeasurement, respec-tively. High contrast regions in a fluorescence transillumination image indicate enhanced ICGuptake and fluorescence. Transillumination images are particularly useful for identification ofsurface features that have the potential to generate DOT image artifacts.
3. Results
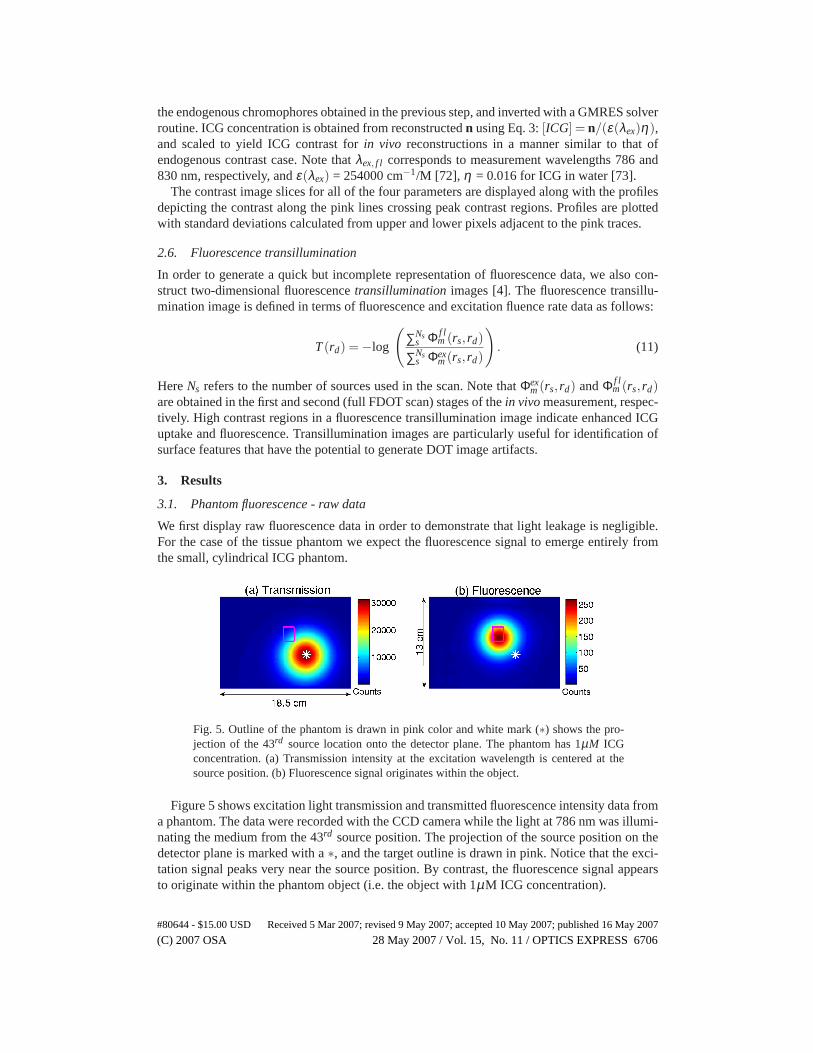
3.1. Phantom fluorescence - raw data
We first display raw fluorescence data in order to demonstratethat light leakage is negligible.For the case of the tissue phantom we expect the fluorescence signal to emerge entirely fromthe small, cylindrical ICG phantom.
Fig. 5. Outline of the phantom is drawn in pink color and white mark (∗) shows the pro-jection of the 43rd source location onto the detector plane. The phantom has 1µM ICGconcentration. (a) Transmission intensity at the excitation wavelength is centered at thesource position. (b) Fluorescence signal originates within the object.
Figure 5 shows excitation light transmission and transmitted fluorescence intensity data froma phantom. The data were recorded with the CCD camera while the light at 786 nm was illumi-nating the medium from the 43rd source position. The projection of the source position on thedetector plane is marked with a∗, and the target outline is drawn in pink. Notice that the exci-tation signal peaks very near the source position. By contrast, the fluorescence signal appearsto originate within the phantom object (i.e. the object with1µM ICG concentration).
#80644 - $15.00 USD Received 5 Mar 2007; revised 9 May 2007; accepted 10 May 2007; published 16 May 2007
(C) 2007 OSA 28 May 2007 / Vol. 15, No. 11 / OPTICS EXPRESS 6706
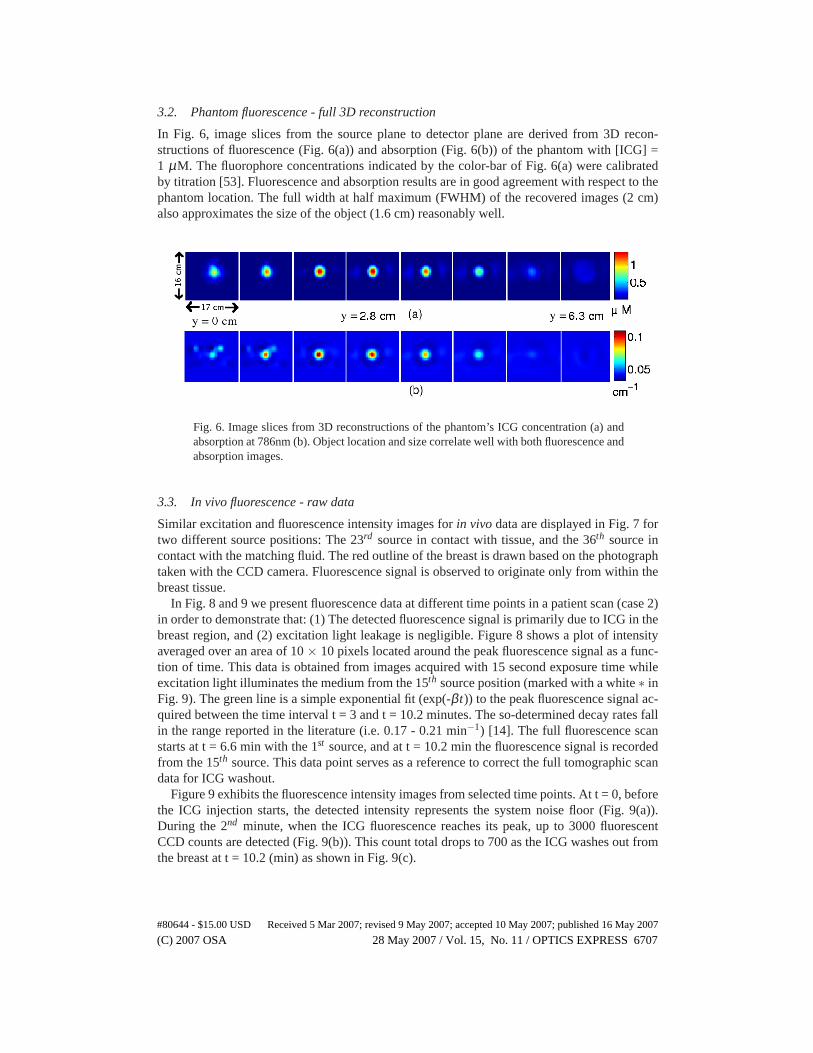
3.2. Phantom fluorescence - full 3D reconstruction
In Fig. 6, image slices from the source plane to detector plane are derived from 3D recon-structions of fluorescence (Fig. 6(a)) and absorption (Fig.6(b)) of the phantom with [ICG] =1 µM. The fluorophore concentrations indicated by the color-bar of Fig. 6(a) were calibratedby titration [53]. Fluorescence and absorption results arein good agreement with respect to thephantom location. The full width at half maximum (FWHM) of therecovered images (2 cm)also approximates the size of the object (1.6 cm) reasonablywell.
Fig. 6. Image slices from 3D reconstructions of the phantom’s ICG concentration (a) andabsorption at 786nm (b). Object location and size correlate well with both fluorescence andabsorption images.
3.3. In vivo fluorescence - raw data
Similar excitation and fluorescence intensity images forin vivo data are displayed in Fig. 7 fortwo different source positions: The 23rd source in contact with tissue, and the 36th source incontact with the matching fluid. The red outline of the breastis drawn based on the photographtaken with the CCD camera. Fluorescence signal is observed to originate only from within thebreast tissue.
In Fig. 8 and 9 we present fluorescence data at different time points in a patient scan (case 2)in order to demonstrate that: (1) The detected fluorescence signal is primarily due to ICG in thebreast region, and (2) excitation light leakage is negligible. Figure 8 shows a plot of intensityaveraged over an area of 10× 10 pixels located around the peak fluorescence signal as a func-tion of time. This data is obtained from images acquired with15 second exposure time whileexcitation light illuminates the medium from the 15th source position (marked with a white∗ inFig. 9). The green line is a simple exponential fit (exp(-β t)) to the peak fluorescence signal ac-quired between the time interval t = 3 and t = 10.2 minutes. Theso-determined decay rates fallin the range reported in the literature (i.e. 0.17 - 0.21 min−1) [14]. The full fluorescence scanstarts at t = 6.6 min with the 1st source, and at t = 10.2 min the fluorescence signal is recordedfrom the 15th source. This data point serves as a reference to correct the full tomographic scandata for ICG washout.
Figure 9 exhibits the fluorescence intensity images from selected time points. At t = 0, beforethe ICG injection starts, the detected intensity represents the system noise floor (Fig. 9(a)).During the 2nd minute, when the ICG fluorescence reaches its peak, up to 3000fluorescentCCD counts are detected (Fig. 9(b)). This count total drops to 700 as the ICG washes out fromthe breast at t = 10.2 (min) as shown in Fig. 9(c).
#80644 - $15.00 USD Received 5 Mar 2007; revised 9 May 2007; accepted 10 May 2007; published 16 May 2007
(C) 2007 OSA 28 May 2007 / Vol. 15, No. 11 / OPTICS EXPRESS 6707
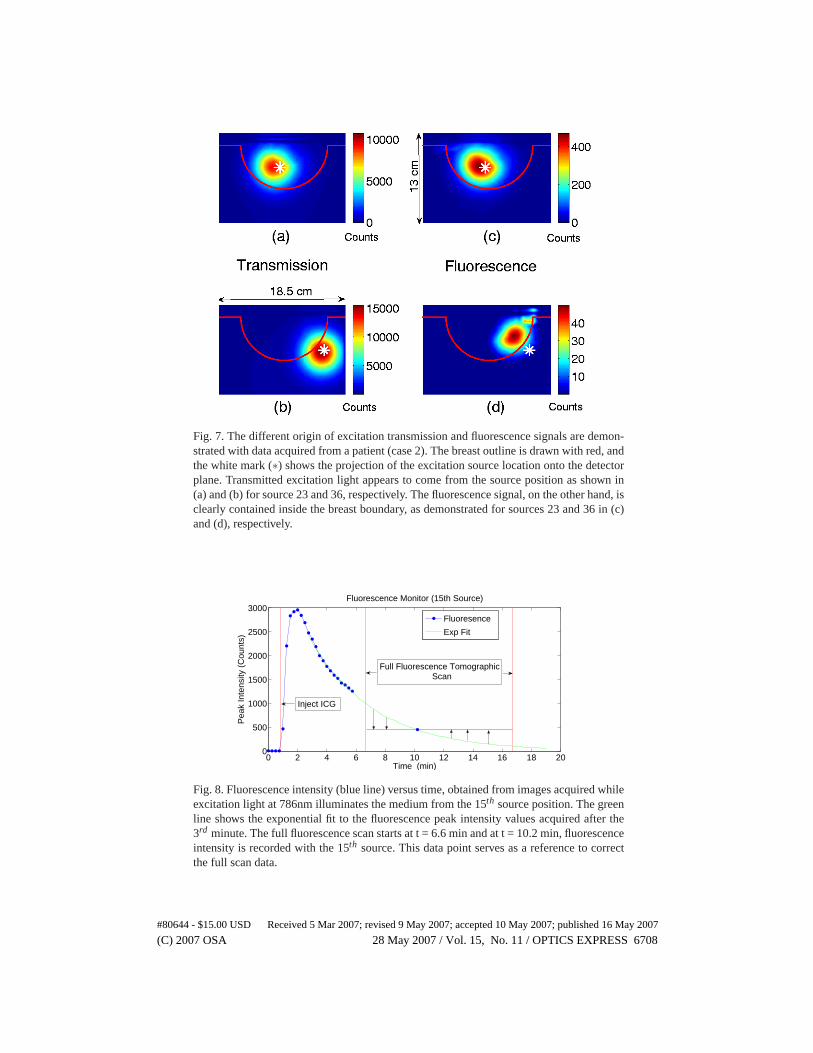
Fig. 7. The different origin of excitation transmission and fluorescencesignals are demon-strated with data acquired from a patient (case 2). The breast outline is drawn with red, andthe white mark (∗) shows the projection of the excitation source location onto the detectorplane. Transmitted excitation light appears to come from the source positionas shown in(a) and (b) for source 23 and 36, respectively. The fluorescencesignal, on the other hand, isclearly contained inside the breast boundary, as demonstrated for sources 23 and 36 in (c)and (d), respectively.
0 2 4 6 8 10 12 14 16 18 200
500
1000
1500
2000
2500
3000
Time (min)
Pea
k In
tens
ity (
Cou
nts)
Fluorescence Monitor (15th Source)
Fluoresence
Exp Fit
Full Fluorescence Tomographic Scan
Inject ICG
Fig. 8. Fluorescence intensity (blue line) versus time, obtained from images acquired whileexcitation light at 786nm illuminates the medium from the 15th source position. The greenline shows the exponential fit to the fluorescence peak intensity values acquired after the3rd minute. The full fluorescence scan starts at t = 6.6 min and at t = 10.2 min, fluorescenceintensity is recorded with the 15th source. This data point serves as a reference to correctthe full scan data.
#80644 - $15.00 USD Received 5 Mar 2007; revised 9 May 2007; accepted 10 May 2007; published 16 May 2007
(C) 2007 OSA 28 May 2007 / Vol. 15, No. 11 / OPTICS EXPRESS 6708
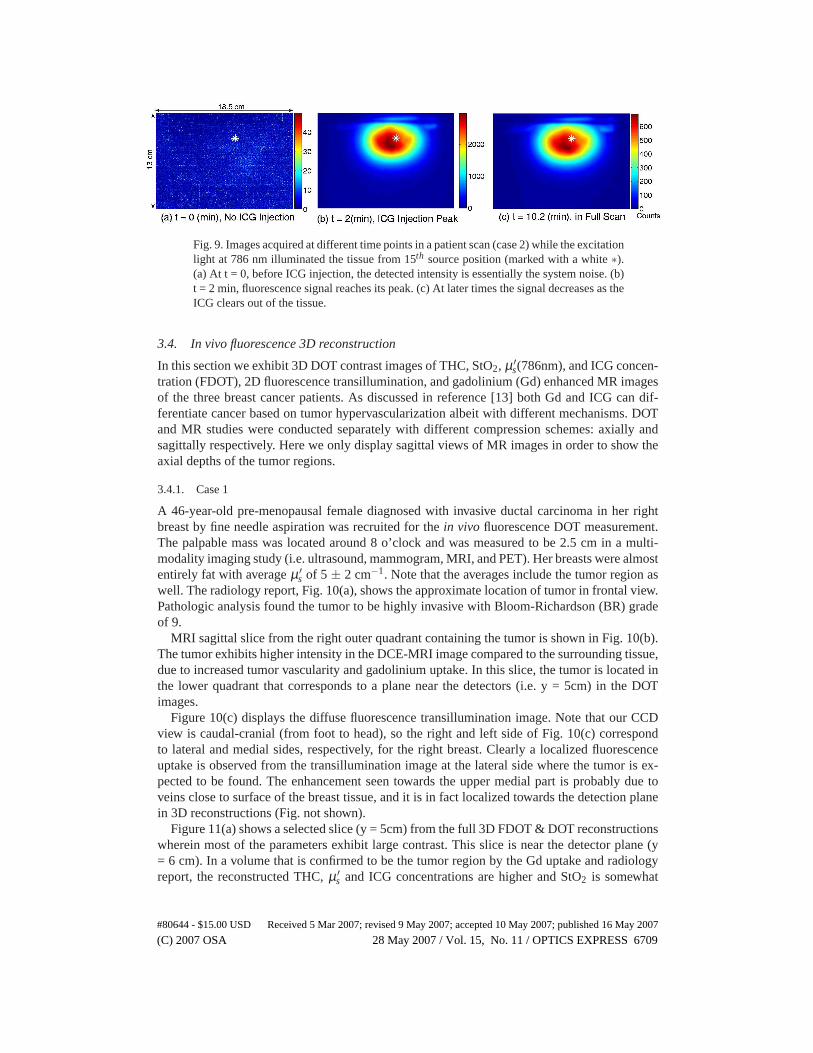
Fig. 9. Images acquired at different time points in a patient scan (case 2) while the excitationlight at 786 nm illuminated the tissue from 15th source position (marked with a white∗).(a) At t = 0, before ICG injection, the detected intensity is essentially the system noise. (b)t = 2 min, fluorescence signal reaches its peak. (c) At later times the signal decreases as theICG clears out of the tissue.
3.4. In vivo fluorescence 3D reconstruction
In this section we exhibit 3D DOT contrast images of THC, StO2, µ ′s(786nm), and ICG concen-
tration (FDOT), 2D fluorescence transillumination, and gadolinium (Gd) enhanced MR imagesof the three breast cancer patients. As discussed in reference [13] both Gd and ICG can dif-ferentiate cancer based on tumor hypervascularization albeit with different mechanisms. DOTand MR studies were conducted separately with different compression schemes: axially andsagittally respectively. Here we only display sagittal views of MR images in order to show theaxial depths of the tumor regions.
3.4.1. Case 1
A 46-year-old pre-menopausal female diagnosed with invasive ductal carcinoma in her rightbreast by fine needle aspiration was recruited for thein vivo fluorescence DOT measurement.The palpable mass was located around 8 o’clock and was measured to be 2.5 cm in a multi-modality imaging study (i.e. ultrasound, mammogram, MRI, and PET). Her breasts were almostentirely fat with averageµ ′
s of 5 ± 2 cm−1. Note that the averages include the tumor region aswell. The radiology report, Fig. 10(a), shows the approximate location of tumor in frontal view.Pathologic analysis found the tumor to be highly invasive with Bloom-Richardson (BR) gradeof 9.
MRI sagittal slice from the right outer quadrant containingthe tumor is shown in Fig. 10(b).The tumor exhibits higher intensity in the DCE-MRI image compared to the surrounding tissue,due to increased tumor vascularity and gadolinium uptake. In this slice, the tumor is located inthe lower quadrant that corresponds to a plane near the detectors (i.e. y = 5cm) in the DOTimages.
Figure 10(c) displays the diffuse fluorescence transillumination image. Note that our CCDview is caudal-cranial (from foot to head), so the right and left side of Fig. 10(c) correspondto lateral and medial sides, respectively, for the right breast. Clearly a localized fluorescenceuptake is observed from the transillumination image at the lateral side where the tumor is ex-pected to be found. The enhancement seen towards the upper medial part is probably due toveins close to surface of the breast tissue, and it is in fact localized towards the detection planein 3D reconstructions (Fig. not shown).
Figure 11(a) shows a selected slice (y = 5cm) from the full 3D FDOT & DOT reconstructionswherein most of the parameters exhibit large contrast. Thisslice is near the detector plane (y= 6 cm). In a volume that is confirmed to be the tumor region by the Gd uptake and radiologyreport, the reconstructed THC,µ ′
s and ICG concentrations are higher and StO2 is somewhat
#80644 - $15.00 USD Received 5 Mar 2007; revised 9 May 2007; accepted 10 May 2007; published 16 May 2007
(C) 2007 OSA 28 May 2007 / Vol. 15, No. 11 / OPTICS EXPRESS 6709
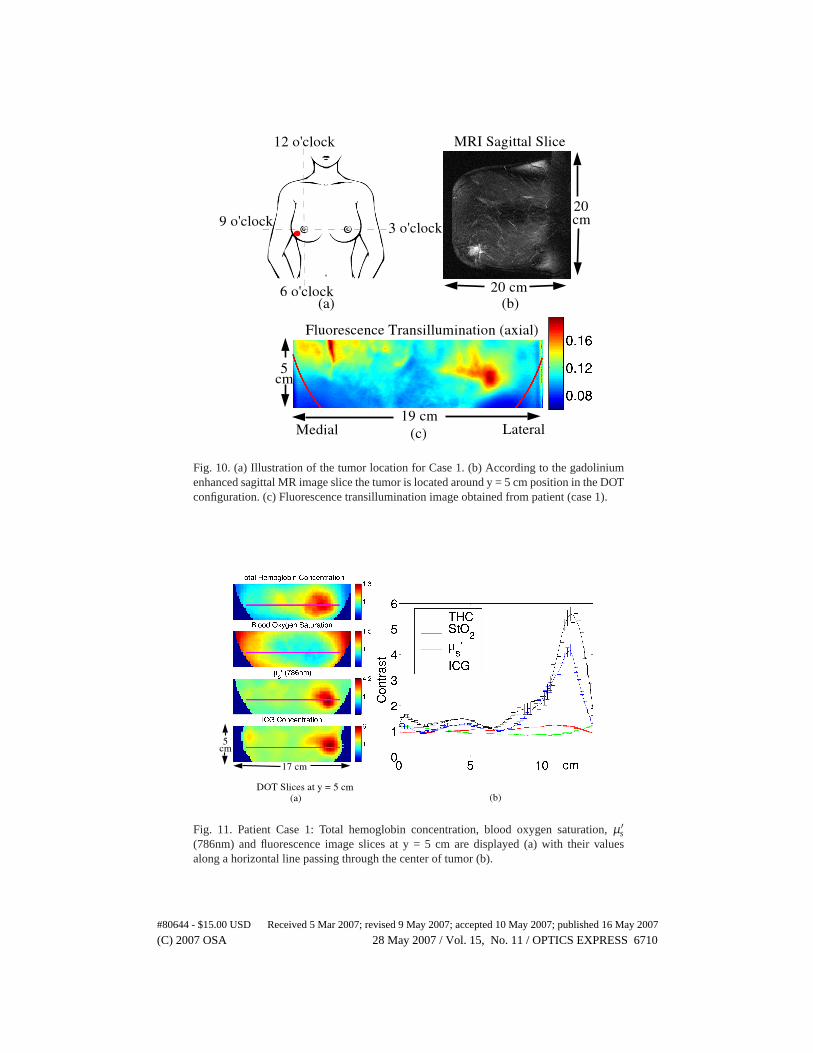
Fig. 10. (a) Illustration of the tumor location for Case 1. (b) According to the gadoliniumenhanced sagittal MR image slice the tumor is located around y = 5 cm position inthe DOTconfiguration. (c) Fluorescence transillumination image obtained from patient (case 1).
Fig. 11. Patient Case 1: Total hemoglobin concentration, blood oxygen saturation,µ ′s
(786nm) and fluorescence image slices at y = 5 cm are displayed (a) withtheir valuesalong a horizontal line passing through the center of tumor (b).
#80644 - $15.00 USD Received 5 Mar 2007; revised 9 May 2007; accepted 10 May 2007; published 16 May 2007
(C) 2007 OSA 28 May 2007 / Vol. 15, No. 11 / OPTICS EXPRESS 6710
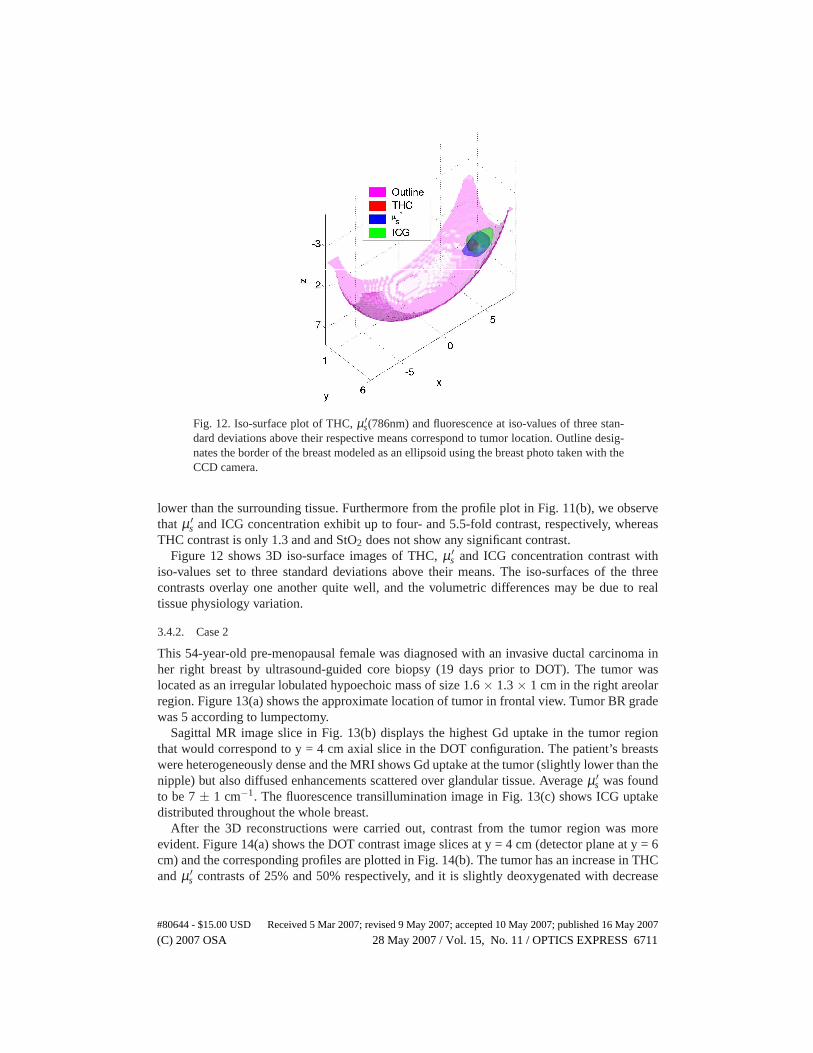
Fig. 12. Iso-surface plot of THC,µ ′s(786nm) and fluorescence at iso-values of three stan-
dard deviations above their respective means correspond to tumor location. Outline desig-nates the border of the breast modeled as an ellipsoid using the breast photo taken with theCCD camera.
lower than the surrounding tissue. Furthermore from the profile plot in Fig. 11(b), we observethat µ ′
s and ICG concentration exhibit up to four- and 5.5-fold contrast, respectively, whereasTHC contrast is only 1.3 and and StO2 does not show any significant contrast.
Figure 12 shows 3D iso-surface images of THC,µ ′s and ICG concentration contrast with
iso-values set to three standard deviations above their means. The iso-surfaces of the threecontrasts overlay one another quite well, and the volumetric differences may be due to realtissue physiology variation.
3.4.2. Case 2
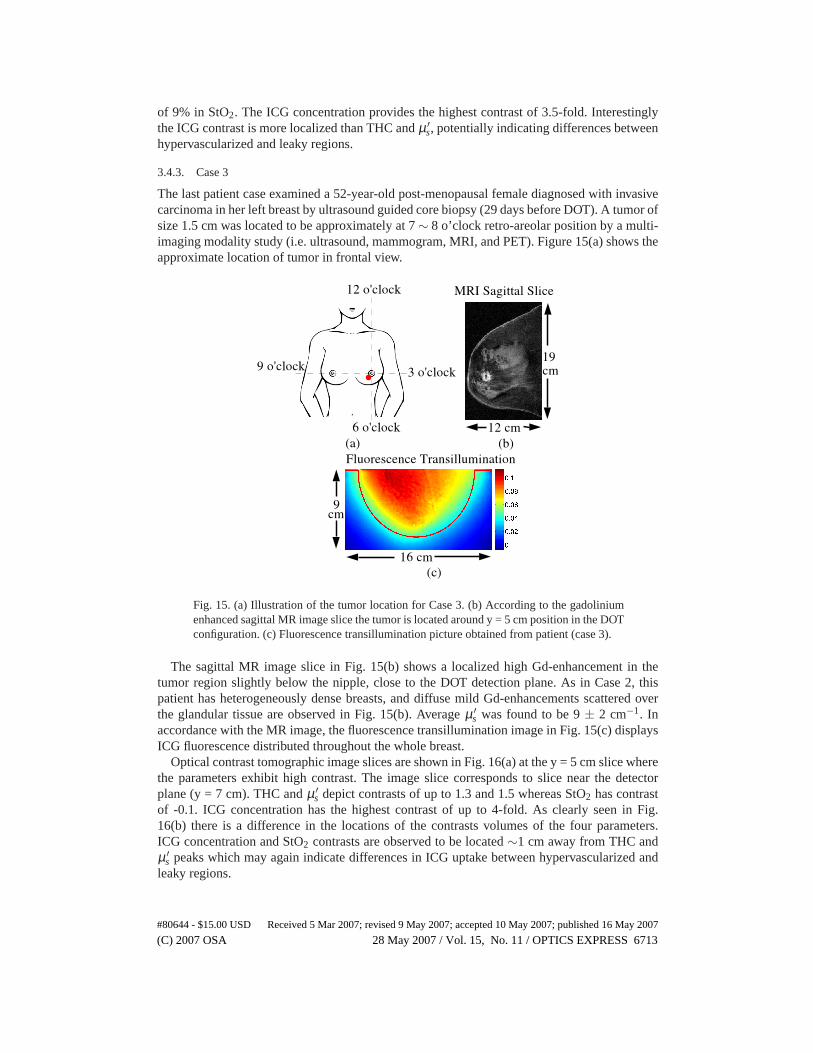
This 54-year-old pre-menopausal female was diagnosed withan invasive ductal carcinoma inher right breast by ultrasound-guided core biopsy (19 days prior to DOT). The tumor waslocated as an irregular lobulated hypoechoic mass of size 1.6 × 1.3× 1 cm in the right areolarregion. Figure 13(a) shows the approximate location of tumor in frontal view. Tumor BR gradewas 5 according to lumpectomy.
Sagittal MR image slice in Fig. 13(b) displays the highest Gduptake in the tumor regionthat would correspond to y = 4 cm axial slice in the DOT configuration. The patient’s breastswere heterogeneously dense and the MRI shows Gd uptake at thetumor (slightly lower than thenipple) but also diffused enhancements scattered over glandular tissue. Averageµ ′
s was foundto be 7± 1 cm−1. The fluorescence transillumination image in Fig. 13(c) shows ICG uptakedistributed throughout the whole breast.
After the 3D reconstructions were carried out, contrast from the tumor region was moreevident. Figure 14(a) shows the DOT contrast image slices aty = 4 cm (detector plane at y = 6cm) and the corresponding profiles are plotted in Fig. 14(b).The tumor has an increase in THCandµ ′
s contrasts of 25% and 50% respectively, and it is slightly deoxygenated with decrease
#80644 - $15.00 USD Received 5 Mar 2007; revised 9 May 2007; accepted 10 May 2007; published 16 May 2007
(C) 2007 OSA 28 May 2007 / Vol. 15, No. 11 / OPTICS EXPRESS 6711
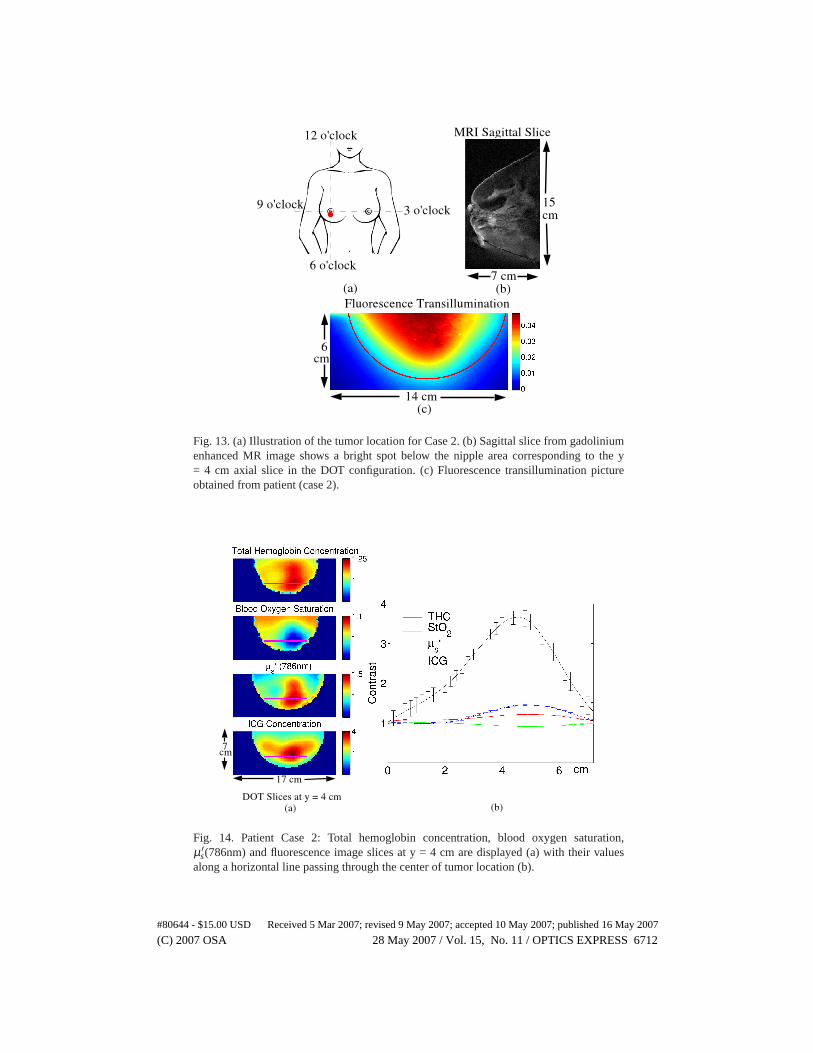
Fig. 13. (a) Illustration of the tumor location for Case 2. (b) Sagittal slice from gadoliniumenhanced MR image shows a bright spot below the nipple area corresponding to the y= 4 cm axial slice in the DOT configuration. (c) Fluorescence transillumination pictureobtained from patient (case 2).
Fig. 14. Patient Case 2: Total hemoglobin concentration, blood oxygen saturation,µ ′
s(786nm) and fluorescence image slices at y = 4 cm are displayed (a) withtheir valuesalong a horizontal line passing through the center of tumor location (b).
#80644 - $15.00 USD Received 5 Mar 2007; revised 9 May 2007; accepted 10 May 2007; published 16 May 2007
(C) 2007 OSA 28 May 2007 / Vol. 15, No. 11 / OPTICS EXPRESS 6712
of 9% in StO2. The ICG concentration provides the highest contrast of 3.5-fold. Interestinglythe ICG contrast is more localized than THC andµ ′
s, potentially indicating differences betweenhypervascularized and leaky regions.
3.4.3. Case 3
The last patient case examined a 52-year-old post-menopausal female diagnosed with invasivecarcinoma in her left breast by ultrasound guided core biopsy (29 days before DOT). A tumor ofsize 1.5 cm was located to be approximately at 7∼ 8 o’clock retro-areolar position by a multi-imaging modality study (i.e. ultrasound, mammogram, MRI, and PET). Figure 15(a) shows theapproximate location of tumor in frontal view.
Fig. 15. (a) Illustration of the tumor location for Case 3. (b) According to the gadoliniumenhanced sagittal MR image slice the tumor is located around y = 5 cm position inthe DOTconfiguration. (c) Fluorescence transillumination picture obtained from patient (case 3).
The sagittal MR image slice in Fig. 15(b) shows a localized high Gd-enhancement in thetumor region slightly below the nipple, close to the DOT detection plane. As in Case 2, thispatient has heterogeneously dense breasts, and diffuse mild Gd-enhancements scattered overthe glandular tissue are observed in Fig. 15(b). Averageµ ′
s was found to be 9± 2 cm−1. Inaccordance with the MR image, the fluorescence transillumination image in Fig. 15(c) displaysICG fluorescence distributed throughout the whole breast.
Optical contrast tomographic image slices are shown in Fig.16(a) at the y = 5 cm slice wherethe parameters exhibit high contrast. The image slice corresponds to slice near the detectorplane (y = 7 cm). THC andµ ′
s depict contrasts of up to 1.3 and 1.5 whereas StO2 has contrastof -0.1. ICG concentration has the highest contrast of up to 4-fold. As clearly seen in Fig.16(b) there is a difference in the locations of the contrastsvolumes of the four parameters.ICG concentration and StO2 contrasts are observed to be located∼1 cm away from THC andµ ′
s peaks which may again indicate differences in ICG uptake between hypervascularized andleaky regions.
#80644 - $15.00 USD Received 5 Mar 2007; revised 9 May 2007; accepted 10 May 2007; published 16 May 2007
(C) 2007 OSA 28 May 2007 / Vol. 15, No. 11 / OPTICS EXPRESS 6713
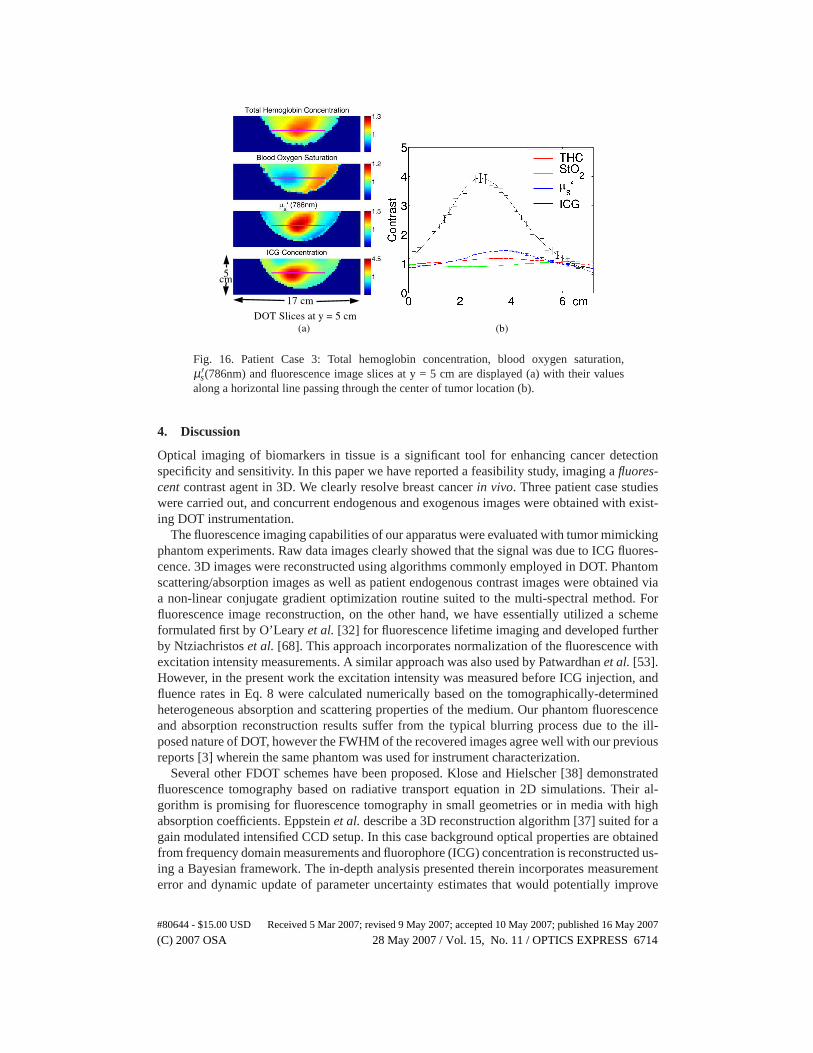
Fig. 16. Patient Case 3: Total hemoglobin concentration, blood oxygen saturation,µ ′
s(786nm) and fluorescence image slices at y = 5 cm are displayed (a) withtheir valuesalong a horizontal line passing through the center of tumor location (b).
4. Discussion
Optical imaging of biomarkers in tissue is a significant toolfor enhancing cancer detectionspecificity and sensitivity. In this paper we have reported afeasibility study, imaging afluores-centcontrast agent in 3D. We clearly resolve breast cancerin vivo. Three patient case studieswere carried out, and concurrent endogenous and exogenous images were obtained with exist-ing DOT instrumentation.
The fluorescence imaging capabilities of our apparatus wereevaluated with tumor mimickingphantom experiments. Raw data images clearly showed that the signal was due to ICG fluores-cence. 3D images were reconstructed using algorithms commonly employed in DOT. Phantomscattering/absorption images as well as patient endogenous contrast images were obtained viaa non-linear conjugate gradient optimization routine suited to the multi-spectral method. Forfluorescence image reconstruction, on the other hand, we have essentially utilized a schemeformulated first by O’Learyet al. [32] for fluorescence lifetime imaging and developed furtherby Ntziachristoset al. [68]. This approach incorporates normalization of the fluorescence withexcitation intensity measurements. A similar approach wasalso used by Patwardhanet al. [53].However, in the present work the excitation intensity was measured before ICG injection, andfluence rates in Eq. 8 were calculated numerically based on the tomographically-determinedheterogeneous absorption and scattering properties of themedium. Our phantom fluorescenceand absorption reconstruction results suffer from the typical blurring process due to the ill-posed nature of DOT, however the FWHM of the recovered images agree well with our previousreports [3] wherein the same phantom was used for instrumentcharacterization.
Several other FDOT schemes have been proposed. Klose and Hielscher [38] demonstratedfluorescence tomography based on radiative transport equation in 2D simulations. Their al-gorithm is promising for fluorescence tomography in small geometries or in media with highabsorption coefficients. Eppsteinet al.describe a 3D reconstruction algorithm [37] suited for again modulated intensified CCD setup. In this case background optical properties are obtainedfrom frequency domain measurements and fluorophore (ICG) concentration is reconstructed us-ing a Bayesian framework. The in-depth analysis presented therein incorporates measurementerror and dynamic update of parameter uncertainty estimates that would potentially improve
#80644 - $15.00 USD Received 5 Mar 2007; revised 9 May 2007; accepted 10 May 2007; published 16 May 2007
(C) 2007 OSA 28 May 2007 / Vol. 15, No. 11 / OPTICS EXPRESS 6714
our results.The present paper reported endogenous contrasts along withthe fluorophore concentration
contrast for three patients. In all three cases the tumor region exhibited increases in THC, ICGand µ ′
s and a slight decrease in StO2. THC, StO2 and µ ′s contrasts of the tumor were in the
1.25 - 1.3, 0 - 0.1, and 1.5 - 4 ranges, respectively. The rise in THC is consistent with angio-genesis accompanying the tumor growth. The high oxygen demand of cancer cells might beexpected to cause lower StO2. The increase in scattering contrast can be attributed to anin-crease in concentration of organelles such as mitochondriadue to the high metabolism in tumorcells, but might also arise (at least partially) from absorption/scattering image cross-talk. Pre-viously we have found that spectral constraints reduce the cross-talk associated with CW datawhen optimum source wavelengths are used [62, 63]. The measurement wavelengths utilizedin this study, however, are not quite optimum for separatingabsorption and scattering. Never-theless our simulation work (results not published) has found the cross-talk to be around 30%.Therefore we believe the scattering contrast is mostly physiological, in agreement with severalother researchers who have found 20% to 30% tumor scatteringcontrast using time-domaindata [74, 75]. Overall the intrinsic contrast results presented herein agree with our previousfindings [4,76].
ICG contrast at the tumor location was visible in the fluorescence transillumination imagefor Case 1, but similar transillumination images for Cases 2and 3 did not exhibit discerniblecontrast. In general transillumination is an insufficient radiological tool; it cannot separate theeffects of light absorption and scattering within the tissue [76]. However, 3D FDOT image re-constructions based on the photon diffusion Equation provided ICG contrast images consistentwith the radiology reports for all three cases. ICG concentration contrast ranged between 3.5-and 5.5-fold, possibly due to the leaky tumor vasculature.
ICG contrast in the tumor region was 3 to 4 fold higher than theTHC contrast and 2 to 3fold higher than the scattering contrast. ICG binds to bloodproteins, and in the case of leakytumor vasculature, ICG can aggregate in the tumor region while the ICG in normal tissue iswashed out. Therefore, timing in the ICG fluorescence measurement plays an important rolein affecting contrast, and full tomographic scans carried out during the tail of ICG temporaldecay curve facilitate enhanced detection of a fluorescencesignal that originates mostly fromthe tumor region. Thus the fluorescence contrast of the tumors is boosted.
FDOT studies for small animal imaging were applied by Graveset al. [51], and by Patward-hanet al. [53] in a similar parallel-plane source and lens coupled CCDcamera system. Graveset al. were able to reconstruct 3D image of a fluorescent probe within a mouse tumor withsubmillimeter resolution. Patwardhanet al. studied the spatio-temporal evolution of the fluo-rophore distributionin vivo. Both studies are consistent with our work, showing preferentialuptake of the target fluorescent probe in the tumor relative to normal tissue.
The purpose of this study was to investigate the feasibilityof in vivo diffuse optical fluo-rescence tomography for human breast cancer. The apparatusutilized an existing breast DOTinstrument with slight modifications (e.g. by coupling spectral filters). Several technical im-provements can be introduced to further validate the fluorescence contrast clinically and toachieve dynamic imaging. A system that records the fluorescence and excitation signals si-multaneously will provide better quantification and speed.This system can be achieved witha two-camera system or with a spectral filter wheel system coupled to the CCD camera. In adifferent vein, FDOT reconstruction algorithms can be improved to incorporate absorption dueto ICG in the matrix inversion (see Eq. 9). One way of achieving this is to invert Eq. 9, itera-tively updating ICG absorption at each step; another way would be to obtain ICG absorptiondirectly from excitation signals in a system capable of recording fluorescence signals simulta-neously. In order to accomplish dynamic imaging we need faster acquisition. To this end, we
#80644 - $15.00 USD Received 5 Mar 2007; revised 9 May 2007; accepted 10 May 2007; published 16 May 2007
(C) 2007 OSA 28 May 2007 / Vol. 15, No. 11 / OPTICS EXPRESS 6715
have started to incorporate fast optical switches and gain modulated CCD intensifier units intothe current system. The upgrade will provide frequency domain measurement of both the ex-citation and fluorescence signals thereby will allow quantification of fluorophore lifetime andsuperior reconstruction of absorption and scattering coefficients [77].
5. Conclusion
We have demonstrated three-dimensionalin vivoDOT images of fluorescence, total hemoglobinconcentration, blood oxygen saturation and scattering contrasts in three patients with tumorbearing breasts. The results were validated with phantom experiments using the same continu-ous wave imaging instrument.
To our knowledge, this proof of concept study is the first published report showing it ispossible to detect and reconstruct breast tumor fluorescence in vivo in 3D with diffuse opti-cal tomography. The large tumor contrast obtained with a non-targeted exogenous fluorophore(ICG) portends a promising future as molecularly targeted dyes and beacons become availablefor clinical use.
Acknowledgments
The authors thank J. P. Culver for his initial work on this instrumentation, K. Lee, S. Ko-necky, D. Busch, H. Wabnitz and A. Liebert for helpful discussions, M. Grosicka-Koptyra forpatient scheduling, and Y. K. Choe for illustrations. This research was supported by NIH R01-CA75124-04 and P01-CA85424. A. G. Y. acknowledges partial support from U54-CA105480(Network for Translational Research in Optical Imaging: NTROI).
#80644 - $15.00 USD Received 5 Mar 2007; revised 9 May 2007; accepted 10 May 2007; published 16 May 2007
(C) 2007 OSA 28 May 2007 / Vol. 15, No. 11 / OPTICS EXPRESS 6716
Related Documents