Original Research Three-Dimensional Hemodynamics in Intracranial Aneurysms: Influence of Size and Morphology Susanne Schnell, PhD, 1 * Sameer A. Ansari, MD, PhD, 1,2 Parmede Vakil, MS, 1,3 Marie Wasielewski, RT, 1 Maria L. Carr, RT, 1 Michael C. Hurley, MD, 1,2 Bernard R. Bendok, MD, 2 Hunt Batjer, MD, 2,4 Timothy J. Carroll, PhD, 1,3 James Carr, MD, 1 and Michael Markl, PhD 1,3 Purpose: To use four-dimensional (4D)-flow MRI for the comprehensive in vivo analysis of hemodynamics and its relationship to size and morphology of different intracra- nial aneurysms (IA). We hypothesize that different IA groups, defined by size and morphology, exhibit different velocity fields, wall shear stress, and vorticity. Materials and Methods: The 4D-flow MRI (spatial resolu- tion ¼ 0.99–1.8 0.78–1.46 1.2–1.4 mm 3 , temporal re- solution ¼ 44–48 ms) was performed in 19 IAs (18 patients, age ¼ 55.4 6 13.8 years) with saccular (n ¼ 16) and fusiform (n ¼ 3) morphology and different sizes rang- ing from small (n ¼ 8; largest dimension ¼ 6.2 6 0.4 mm) to large and giant (n ¼ 11; 25 6 7 mm). Analysis included quantification of volumetric spatial–temporal velocity dis- tribution, vorticity, and wall shear stress (WSS) along the aneurysm’s 3D surface. Results: The 4D-flow MRI revealed distinct hemodynamic patterns for large/giant saccular aneurysms (Group 1), small saccular aneurysms (Group 2), and large/giant fusiform aneurysms (Group 3). Saccular IA (Groups 1, 2) demonstrated significantly higher peak velocities (P < 0.002) and WSS (P < 0.001) compared with fusiform aneurysms. Although intra-aneurysmal 3D velocity distri- butions were similar for Group 1 and 2, vorticity and WSS was significantly (P < 0.001) different (increased in Group 1 by 54%) indicating a relationship between IA size and hemodynamics. Group 3 showed reduced velocities (P < 0.001) and WSS (P < 0.001). Conclusion: The 4D-flow MRI demonstrated the influence of lesion size and morphology on aneurysm hemodynam- ics suggesting the potential of 4D-flow MRI to assist in the classification of individual aneurysms. Key Words: intracranial aneurysms; 4D-flow MRI; hemo- dynamics; WSS; vorticity; velocity J. Magn. Reson. Imaging 2014;39:120–131. V C 2013 Wiley Periodicals, Inc. INTRACRANIAL ANEURYSMS (IA) are diverse and life- threatening conditions, occurring in 3–6% of the pop- ulation (1,2). Although the annual rupture rate is fairly low, approximately 2% (3) presenting with sub- arachnoid hemorrhage, there is significant associated morbidity and mortality. Current standard diagnostic methods for risk stratification and therapy planning (surgical intervention versus medical treatment) are based purely on empirical parameters (e.g. patient age, aneurysm anatomy, size, morphology, and loca- tion), ruptured or unruptured status, or systemic risk factors for rupture (hypertension, smoking/alcohol abuse or family history) (4,5). These measures provide an incomplete assessment of a complex disease, because aneurysm geometries, flow characteristics, and vessel wall properties can be substantially differ- ent for individual aneurysms of similar size and/or risk factors. In addition, intracranial aneurysms typi- cally develop at major bifurcation sites of intracranial vessels, suggesting that hemodynamic stress and, hence, flow patterns in these regions may have influ- ence on pathogenesis. Identification of new predictive biomarkers regard- ing risk of aneurysm rupture or disease progression is of interest for risk stratification, improved patient selection, and treatment planning. Irregular flow pat- terns (vortical and helical flow) have been shown to be associated with vascular alterations and may 1 Department of Radiology, Northwestern University, Chicago, Illinois, USA. 2 Department of Neurological Surgery, Northwestern University, Chicago, Illinois, USA. 3 Biomedical Engineering, Northwestern University, Chicago, Illinois, USA. 4 Neurological Surgery, University of Texas, Southwestern Medical Center, Dallas, Texas, USA. Additional Supporting information may be found in the online version of this article. Contract grant sponsor: the Deutsche Forschungsgemeinschaft (DFG); Contract grant number: SCHN 1170/1-1; Contract grant sponsor: SIR Foundation; Contract grant number: Pilot Research Grant; Contract grant sponsor: RSNA Research Seed Grant; Contract grant number: RSD1207; Contract grant sponsor: NIH; Contract grant number: T32 EB005170; Contract grant number; R01 HL088437. *Address reprint requests to: S.S., Department of Radiology, North- western University, 737 N. Michigan Avenue Suite 1600, Chicago, IL 60611. E-mail: [email protected] Received October 12, 2012; Accepted February 12, 2013. DOI 10.1002/jmri.24110 View this article online at wileyonlinelibrary.com. JOURNAL OF MAGNETIC RESONANCE IMAGING 39:120–131 (2014) V C 2013 Wiley Periodicals, Inc. 120

Welcome message from author
This document is posted to help you gain knowledge. Please leave a comment to let me know what you think about it! Share it to your friends and learn new things together.
Transcript
Original Research
Three-Dimensional Hemodynamics in IntracranialAneurysms: Influence of Size and Morphology
Susanne Schnell, PhD,1* Sameer A. Ansari, MD, PhD,1,2 Parmede Vakil, MS,1,3
Marie Wasielewski, RT,1 Maria L. Carr, RT,1 Michael C. Hurley, MD,1,2
Bernard R. Bendok, MD,2 Hunt Batjer, MD,2,4 Timothy J. Carroll, PhD,1,3
James Carr, MD,1 and Michael Markl, PhD1,3
Purpose: To use four-dimensional (4D)-flow MRI for thecomprehensive in vivo analysis of hemodynamics and itsrelationship to size and morphology of different intracra-nial aneurysms (IA). We hypothesize that different IAgroups, defined by size and morphology, exhibit differentvelocity fields, wall shear stress, and vorticity.
Materials and Methods: The 4D-flow MRI (spatial resolu-tion ¼ 0.99–1.8 � 0.78–1.46 � 1.2–1.4 mm3, temporal re-solution ¼ 44–48 ms) was performed in 19 IAs (18patients, age ¼ 55.4 6 13.8 years) with saccular (n ¼ 16)and fusiform (n ¼ 3) morphology and different sizes rang-ing from small (n ¼ 8; largest dimension ¼ 6.2 6 0.4 mm)to large and giant (n ¼ 11; 25 6 7 mm). Analysis includedquantification of volumetric spatial–temporal velocity dis-tribution, vorticity, and wall shear stress (WSS) along theaneurysm’s 3D surface.
Results: The 4D-flow MRI revealed distinct hemodynamicpatterns for large/giant saccular aneurysms (Group 1),small saccular aneurysms (Group 2), and large/giantfusiform aneurysms (Group 3). Saccular IA (Groups 1, 2)demonstrated significantly higher peak velocities (P <
0.002) and WSS (P < 0.001) compared with fusiformaneurysms. Although intra-aneurysmal 3D velocity distri-
butions were similar for Group 1 and 2, vorticity andWSS was significantly (P < 0.001) different (increased inGroup 1 by 54%) indicating a relationship between IA sizeand hemodynamics. Group 3 showed reduced velocities(P < 0.001) and WSS (P < 0.001).
Conclusion: The 4D-flow MRI demonstrated the influenceof lesion size and morphology on aneurysm hemodynam-ics suggesting the potential of 4D-flow MRI to assist inthe classification of individual aneurysms.
Key Words: intracranial aneurysms; 4D-flow MRI; hemo-dynamics; WSS; vorticity; velocityJ. Magn. Reson. Imaging 2014;39:120–131.VC 2013 Wiley Periodicals, Inc.
INTRACRANIAL ANEURYSMS (IA) are diverse and life-threatening conditions, occurring in 3–6% of the pop-ulation (1,2). Although the annual rupture rate isfairly low, approximately 2% (3) presenting with sub-arachnoid hemorrhage, there is significant associatedmorbidity and mortality. Current standard diagnosticmethods for risk stratification and therapy planning(surgical intervention versus medical treatment) arebased purely on empirical parameters (e.g. patientage, aneurysm anatomy, size, morphology, and loca-tion), ruptured or unruptured status, or systemic riskfactors for rupture (hypertension, smoking/alcoholabuse or family history) (4,5). These measures providean incomplete assessment of a complex disease,because aneurysm geometries, flow characteristics,and vessel wall properties can be substantially differ-ent for individual aneurysms of similar size and/orrisk factors. In addition, intracranial aneurysms typi-cally develop at major bifurcation sites of intracranialvessels, suggesting that hemodynamic stress and,hence, flow patterns in these regions may have influ-ence on pathogenesis.
Identification of new predictive biomarkers regard-ing risk of aneurysm rupture or disease progression isof interest for risk stratification, improved patientselection, and treatment planning. Irregular flow pat-terns (vortical and helical flow) have been shown tobe associated with vascular alterations and may
1Department of Radiology, Northwestern University, Chicago, Illinois,USA.2Department of Neurological Surgery, Northwestern University,Chicago, Illinois, USA.3Biomedical Engineering, Northwestern University, Chicago, Illinois,USA.4Neurological Surgery, University of Texas, Southwestern MedicalCenter, Dallas, Texas, USA.
Additional Supporting information may be found in the online versionof this article.
Contract grant sponsor: the Deutsche Forschungsgemeinschaft(DFG); Contract grant number: SCHN 1170/1-1; Contract grantsponsor: SIR Foundation; Contract grant number: Pilot ResearchGrant; Contract grant sponsor: RSNA Research Seed Grant; Contractgrant number: RSD1207; Contract grant sponsor: NIH; Contractgrant number: T32 EB005170; Contract grant number; R01HL088437.
*Address reprint requests to: S.S., Department of Radiology, North-western University, 737 N. Michigan Avenue Suite 1600, Chicago, IL60611. E-mail: [email protected]
Received October 12, 2012; Accepted February 12, 2013.
DOI 10.1002/jmri.24110View this article online at wileyonlinelibrary.com.
JOURNAL OF MAGNETIC RESONANCE IMAGING 39:120–131 (2014)
VC 2013 Wiley Periodicals, Inc. 120
potentially constitute new risk factors (6). Such flowdisturbances can induce shear force alterations at thevessel wall, endothelial dysfunction, and thus pro-mote disease progression by creating areas atincreased risk for vascular remodeling (6). Therefore,developing new methods to identify these hemody-namic factors may assist in improving the individualcharacterization of IAs beyond traditional risk factors.
Most studies investigating flow patterns in intracra-nial aneurysms used computational fluid dynamics(CFD) (6–16) techniques in conjunction with subject-specific geometries extracted from medical images(8,13,17,18). Previous studies on hemodynamics in IAbased on CFD simulations have demonstrated thepotentials of the methods for the detailed investigationof patient-specific flow patterns. All CFD investiga-tions of intracranial aneurysms revealed a wide vari-ety of complex intra-aneurysmal flow patterns thatare strongly dependent on patient-specific vasculargeometry and thus are not easily predictable by a sim-ple inspection or by extrapolation from idealized mod-els. For example, Cebral et al (19) investigated 210aneurysms by using patient-specific CFD simulationsunder pulsatile flow conditions and found that rup-tured aneurysms were more likely to have complexand stable flow patterns, concentrated inflow, andsmall impingement regions compared with unrup-tured aneurysms. Intra-aneurysmal flow patternsranged from those that are simple and stable to thosethat are complex and turbulent.
However, CFD has limitations such as simplificationof assumptions concerning blood properties, bound-ary conditions and vessel properties resulting in anincomplete description of hemodynamics and makingCFD a very user dependent method (20) (8,21). Inaddition, CFD-based wall shear stress (WSS) estima-tions remain difficult and may require extremely smallmesh sizes at the boundary layer of the CFD geome-tries (22). Nevertheless, CFD has proved to be a usefultool in several previous studies (6–16).
The 4D-flow MR imaging has recently been intro-duced and combines ECG-synchronized 3D phase-contrast MRI with advanced postprocessing strategiesfor the in vivo assessment of 3D blood flow with fullvolumetric coverage of the vascular region of interest.The 4D-flow MRI has been extensively validated in theaorta (23–25) and carotid arteries (26–28). Severalgroups reported on the successful measurement andanalysis of 3D-flow patterns in IA phantoms com-pared with reference methods such as particle imagevelocimetry measurements and CFD (29–32).Recently, we and others (12,14, 33–38) have presentedthe application of 4D-flow MRI for the in vivo evalua-tion of intra-aneurysmal flow and WSS in patientfeasibility studies. To date, however, no study hasprovided a quantitative evaluation of intra-aneurys-mal 3D velocity distribution and WSS in a cohort of IApatients to correlate hemodynamics factors withaneurysm size, shape, and type.
In this study, we evaluated in vivo intra-aneurysmalhemodynamics in a cohort of 18 patients with 19small versus large/giant IAs and saccular versus fusi-form morphologies using 4D-flow MRI to investigate
how differences in hemodynamics depend on shape orsize of the aneurysms. We hypothesized that differentIA groups, as defined by size (small, large giant) andmorphology (saccular, fusiform) inherently exhibit dif-ferent intra-aneurysmal hemodynamics as quantifiedby intra-aneurysmal 3D velocity distribution, vortic-ity, and wall shear stress.
MATERIALS AND METHODS
Study Cohort
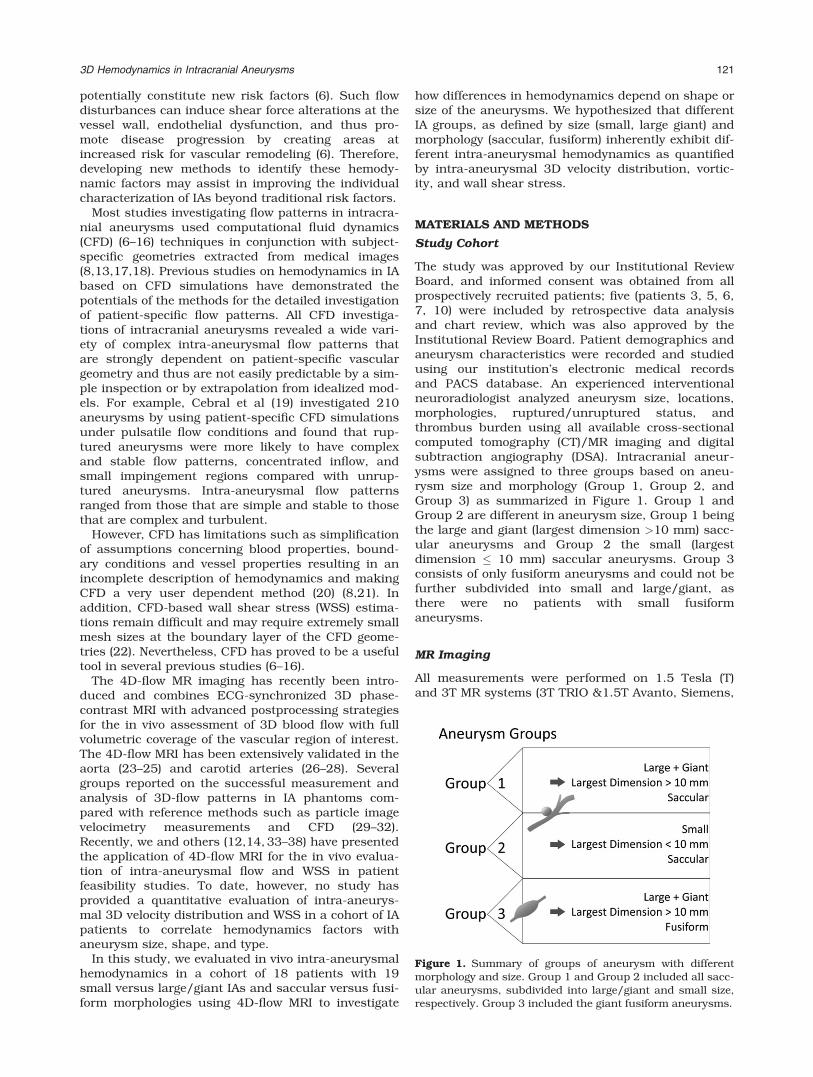
The study was approved by our Institutional ReviewBoard, and informed consent was obtained from allprospectively recruited patients; five (patients 3, 5, 6,7, 10) were included by retrospective data analysisand chart review, which was also approved by theInstitutional Review Board. Patient demographics andaneurysm characteristics were recorded and studiedusing our institution’s electronic medical recordsand PACS database. An experienced interventionalneuroradiologist analyzed aneurysm size, locations,morphologies, ruptured/unruptured status, andthrombus burden using all available cross-sectionalcomputed tomography (CT)/MR imaging and digitalsubtraction angiography (DSA). Intracranial aneur-ysms were assigned to three groups based on aneu-rysm size and morphology (Group 1, Group 2, andGroup 3) as summarized in Figure 1. Group 1 andGroup 2 are different in aneurysm size, Group 1 beingthe large and giant (largest dimension >10 mm) sacc-ular aneurysms and Group 2 the small (largestdimension � 10 mm) saccular aneurysms. Group 3consists of only fusiform aneurysms and could not befurther subdivided into small and large/giant, asthere were no patients with small fusiformaneurysms.
MR Imaging
All measurements were performed on 1.5 Tesla (T)and 3T MR systems (3T TRIO &1.5T Avanto, Siemens,
Figure 1. Summary of groups of aneurysm with differentmorphology and size. Group 1 and Group 2 included all sacc-ular aneurysms, subdivided into large/giant and small size,respectively. Group 3 included the giant fusiform aneurysms.
3D Hemodynamics in Intracranial Aneurysms 121
Germany) using time-resolved (CINE) 3D PC-MRI withthree-directional velocity encoding (4D-flow MRI)with the following pulse sequence parameters: spatialresolution ¼ 0.99–1.8 mm � 0.78–1.46 mm � 1.2–1.4mm, echo time (TE) ¼ 2.9–3.3 ms, flip angle ¼ 15�,repetition time (TR) ¼ 5.5–6 ms, temporal resolution ¼44–48 ms, three-directional velocity encoding withvenc ¼ 70–80 cm/s. The acquisition time variedbetween 12 and 15 min.
Data acquisition was synchronized with the cardiaccycle by prospective ECG gating. The total scan timefor the 4D-flow MRI was 15–20 min. The 4D-flow datawere acquired in an axial oblique 3D volume, whichincluded the IA in the center of the 3D volume. Before4D-flow MRI, 3D multi-slab TOF imaging (TR ¼21 ms, TE ¼ 3.8 ms, flip angle ¼ 25�, spatial resolu-tion ¼ 0.6 � 0.6 � 0.6 mm3) and T1-weighted sagittalMPrage (TR ¼ 1900 ms, TE ¼ 2.52 ms, TI ¼ 900 ms,flip angle ¼ 9�, spatial resolution 1 � 1 � 1 mm3) wasperformed to localize the IA for the 4D-flow scan.
Data Analysis
All data analysis was performed with self-written Mat-lab (The Mathworks, USA) code based on methods byBock et al (39) for data preprocessing or Stalder et al(23) for the calculation of WSS. For the visualizationof the 3D blood flow, commercial software (EnSight,CEI, USA) was used as illustrated in the workflowgraph in Figure 2. Statistical analysis was performedin Matlab and MS Excel (Microsoft Office ProfessionalPlus 2010, Microsoft Corporation, Redmond, WA).
Preprocessing and 3D Blood Flow Visualization
The 4D-flow MRI data were preprocessed to correctfor aliasing, eddy currents, and background noise asdescribed previously (39). Next, an MR angiogram wascalculated by taking the piecewise pseudo complexdifferences of the individual 3D PC-MR images usingthe following Equation (40).
IPCMR ¼ M sin pVthreshvelo
� �; < threshvelo
M ; otherwise
(½1�
with
V ¼ffiffiffiffiffiffiffiffiffiffiffiffiffiffiffiffiffiffiffiffiffiffiffiffiffiffiffiffiffiffiffiV 2
x þ V 2y þ V 2
z
q½2�
IPCMRA represents the resulting MR angiogram, Mthe anatomical image, and V the absolute velocity.The variable threshvelo is a user defined threshold
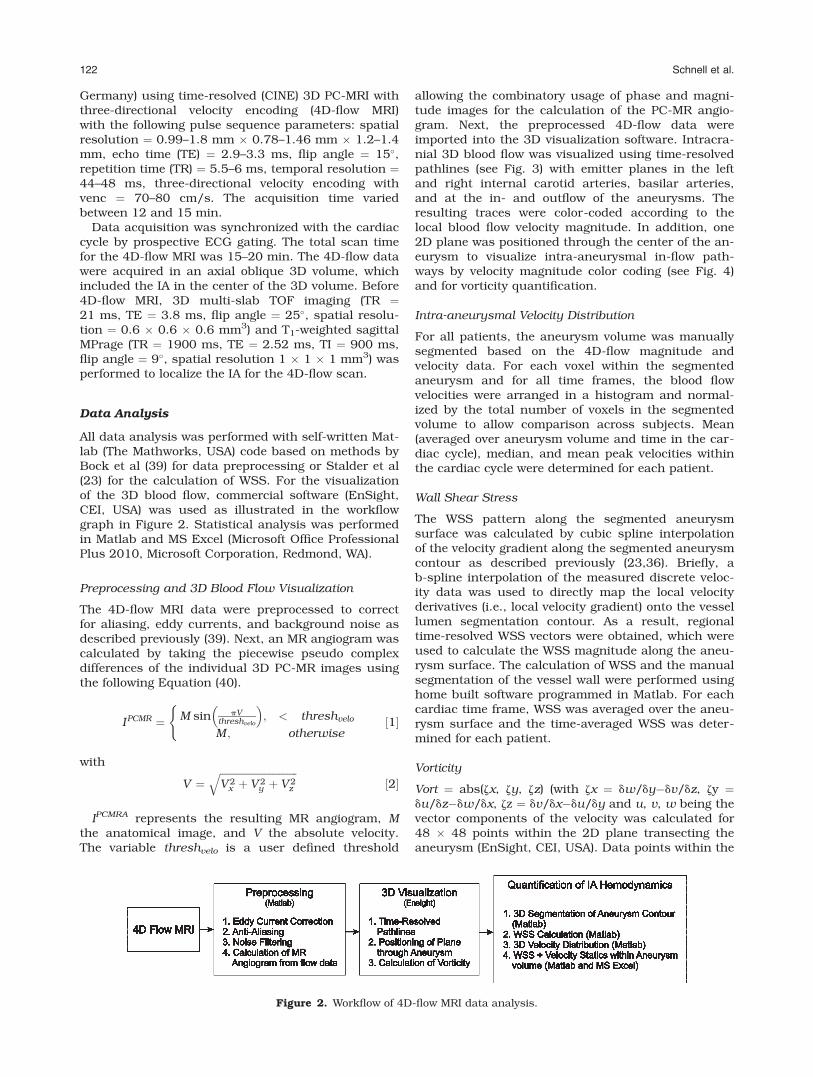
allowing the combinatory usage of phase and magni-tude images for the calculation of the PC-MR angio-gram. Next, the preprocessed 4D-flow data wereimported into the 3D visualization software. Intracra-nial 3D blood flow was visualized using time-resolvedpathlines (see Fig. 3) with emitter planes in the leftand right internal carotid arteries, basilar arteries,and at the in- and outflow of the aneurysms. Theresulting traces were color-coded according to thelocal blood flow velocity magnitude. In addition, one2D plane was positioned through the center of the an-eurysm to visualize intra-aneurysmal in-flow path-ways by velocity magnitude color coding (see Fig. 4)and for vorticity quantification.
Intra-aneurysmal Velocity Distribution
For all patients, the aneurysm volume was manuallysegmented based on the 4D-flow magnitude andvelocity data. For each voxel within the segmentedaneurysm and for all time frames, the blood flowvelocities were arranged in a histogram and normal-ized by the total number of voxels in the segmentedvolume to allow comparison across subjects. Mean(averaged over aneurysm volume and time in the car-diac cycle), median, and mean peak velocities withinthe cardiac cycle were determined for each patient.
Wall Shear Stress
The WSS pattern along the segmented aneurysmsurface was calculated by cubic spline interpolationof the velocity gradient along the segmented aneurysmcontour as described previously (23,36). Briefly, ab-spline interpolation of the measured discrete veloc-ity data was used to directly map the local velocityderivatives (i.e., local velocity gradient) onto the vessellumen segmentation contour. As a result, regionaltime-resolved WSS vectors were obtained, which wereused to calculate the WSS magnitude along the aneu-rysm surface. The calculation of WSS and the manualsegmentation of the vessel wall were performed usinghome built software programmed in Matlab. For eachcardiac time frame, WSS was averaged over the aneu-rysm surface and the time-averaged WSS was deter-mined for each patient.
Vorticity
Vort ¼ abs(zx, zy, zz) (with zx ¼ dw/dy�dv/dz, zy ¼du/dz�dw/dx, zz ¼ dv/dx�du/dy and u, v, w being thevector components of the velocity was calculated for48 � 48 points within the 2D plane transecting theaneurysm (EnSight, CEI, USA). Data points within the
Figure 2. Workflow of 4D-flow MRI data analysis.
122 Schnell et al.

aneurysms were median-filtered to reduce noise, butmaintain edge information. Outlier points weredefined to differ from the maximum vorticity by morethan 25% and then rejected.
Error Propagation Analysis
To estimate the accuracy of the velocity measure-ments as well as the dependent parameter WSS forour specific setup, we performed error propagationanalysis. The analysis is based on SNR and assump-tions of segmentation errors, not the spatial resolu-tion. All following calculations and equations arebased on Stalder et al (23). The SNR in the velocityimages was estimated according to:
sv ¼ffiffiffi2p
p
venc
SNRmag; ½3�
with the SNRmag measured in the magnitude imagesusing the signal within the aneurysms and the stand-
ard deviation in the background noise (venc velocitysensitivity).
The spatial and temporal averaging due to MRacquisition and vessel lumen size affects the errorpropagation of the WSS calculations. When simplify-ing the B-spline interpolation to one dimension, theerror propagation for the WSS averaged over lumencontour and cardiac cycle is given by:
sWSS ¼ h � sV � aB�spline � acontour � atime ; ½4�
with an assumed viscosity of blood h ¼ 4.5 cP andinaccuracies associated with spatial averaging with
acontour ¼ffiffiffiffiffiffiffiffiffiffiffiffiffiffiffiffiffiffiffiffiffiffiffi
Dlcircumference
q(Dl ¼ temporal sampling period,
circumference ¼ median circumference of segmentedaneurysm volume) and temporal averaging with
atime ¼ffiffiffiffiffiffiffiffiffiffiffiffiffiffiffiffiffiffiffiffiffiffiffiffiffiffiffiffiffiffiffiffiffiffiffiffiffiffiffi
1number of titme frames
qover the cardiac cycle. We
assumed that the 1D cubic B-spline derivative kernelproduced a similar error propagation as evaluated in
Figure 3. Examples of time resolved 3D pathlines for all three groups. Group 1: A giant saccular aneurysm located at theleft paraclinoid ICA (internal carotid artery). Group 2: Small saccular left cavernous ICA aneurysm, and Group 3: large basi-lar artery fusiform aneurysm (see also Supp. Video).
Figure 4. Intra-aneurysmal flow visualization in 2D analysis planes through the center of the IAs for all n ¼ 19 aneurysmsinclude in the study. Group 1 IAs mostly demonstrated a narrow high-flow channel along the aneurysm wall in combinationwith large central slow flow regions. Aneurysms in Group 2 showed more prominent high-flow channels peripherally with smallercentral slow flow regions. In contrast, slow flow with less defined flow channels were noted in the fusiform IAs (Group 3).
3D Hemodynamics in Intracranial Aneurysms 123
Stalder et al and chose the upper limit to accommo-date for worst conditions by choosing aB-spline ¼ 1.8/Dl. Further details about the underlying mathematicsand the evaluation of the B-spline propagation errorcan be found in the results and the appendix ofStalder et al (23).
Statistical Analysis
All continuous variables are reported as mean 6
standard deviation. We performed a Lillifors test onthe vorticity data, mean and peak velocity data, andWSS data to test for normal distribution. WSS num-bers were normal distributed and one-way analysis ofvariance (ANOVA) was performed for group compari-sons followed by multiple comparisons betweenindividual groups using an unpaired t-test. The distri-butions of vorticity and mean and peak velocitiesvalues were not normal and a nonparametric one-wayANOVA using chi-square statistics (Kruskal-Wallistest) and a Mann-Whitney U-test were used to com-pare medians. For both tests, a P value <0.05 wasconsidered statistically significant.
All hemodynamic parameters were arranged in his-tograms to determine their mode (most frequentlyoccurring value) and kurtosis (measure of the com-bined weight of the tails in relation to the rest of thedistribution), skewness (measure of asymmetry), andrange (minimum value subtracted from the maxi-mum). In addition, a descriptive graphical approachwas chosen to compare the histogram distributionsfor each parameter (mean vorticity, mean WSS, peakvelocity, and mean velocity). For this, the mode, kur-tosis, skewness, and range were determined for eachhistogram and then plotted for all three groups inspider web plots. The shapes of these plots provide avisual impression of differences in intra-aneurysmalhemodynamics between the groups.
Correlation Analysis
To identify relationships between aneurysm geometry(largest aneurysm dimension) and hemodynamics(mean WSS, mean velocity), linear regression wasperformed and Pearson’s correlation coefficient r wascalculated; a correlation was considered significantfor P < 0.05.
RESULTS
The 4D-flow MRI was successfully acquired to assessneurovascular blood flow velocities in 18 patients (12females, 6 males, mean age 56 6 12) with n ¼ 19small, large or giant cerebral aneurysms (mean largestdimension ¼ 16.2 6 11 mm, range ¼ 6–42 mm).Patient demographics and aneurysm characteristicsare summarized in Tables 1 and 2, respectively. Tenpatients (6 females, 4 males, mean age 57 6 14) hadlarge or giant aneurysms (mean largest dimension ¼23.1 6 7.8 mm, range ¼ 14–42 mm); the remaining 8patients (6 females, 2 male, mean age 54 6 12 aneu-rysm #9–16, Table 1) had aneurysms < 10 mm in alldimensions (mean largest dimension 7 6 1 mm, range
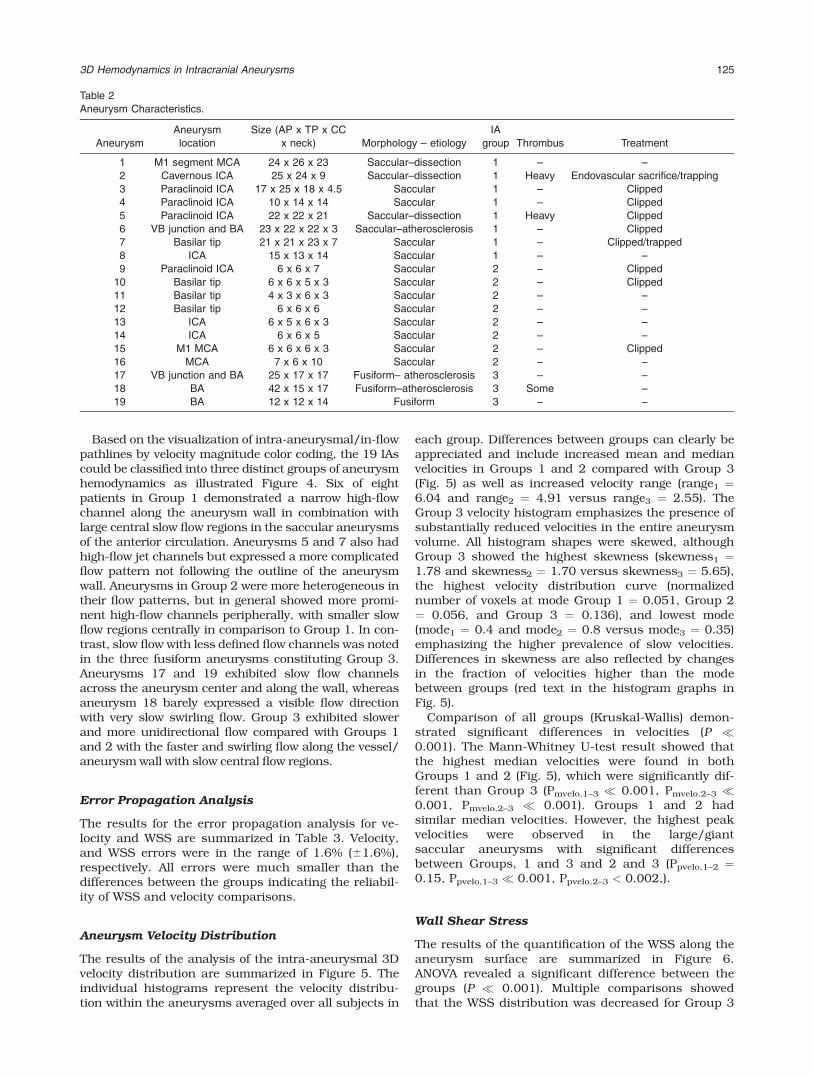
¼ 6 – 9 mm). Most aneurysms (n ¼ 16) were saccularin geometry and were proximally arising from theanterior circulation internal carotid artery (ICA) bifur-cation or posterior circulation basilar artery (BA)(Group 1: n ¼ 8 large/giant aneurysms; Group 2: n ¼8 small aneurysms). One of the small saccular aneur-ysms (aneurysm #15) was multi-lobed with possibleblebs, but below spatial resolution of the 4D-flow MRIacquisition. The remaining three fusiform aneurysms(Group 3: n ¼ 2 giant, n ¼ 1 large) involved the verte-bral arteries (VA) and BA (aneurysm #17–19). Onepatient harbored two large aneurysms (aneurysm #8and #19, Table 2), a saccular left ICA, and a fusiformVA-BA aneurysm. Two of the large/giant saccularaneurysms (aneurysms 2 and 5) were heavilythrombosed changing the original rather saccularmorphology to a rather fusiform flow channel. For thesegmentation of the vessel wall in these two aneur-ysms, extra care was taken to segment along the inneraneurysm flow volume and not along the vessel wall.
3D Blood Flow Visualization
The combination of 3D spatial encoding and 3-direc-tional velocity encoding allowed for the 3D visualiza-tion of complex intracranial flow patterns in allpatients as exemplary illustrated in Figure 3 for onepatient of each aneurysm group (see also Supp. Video,which is available online).
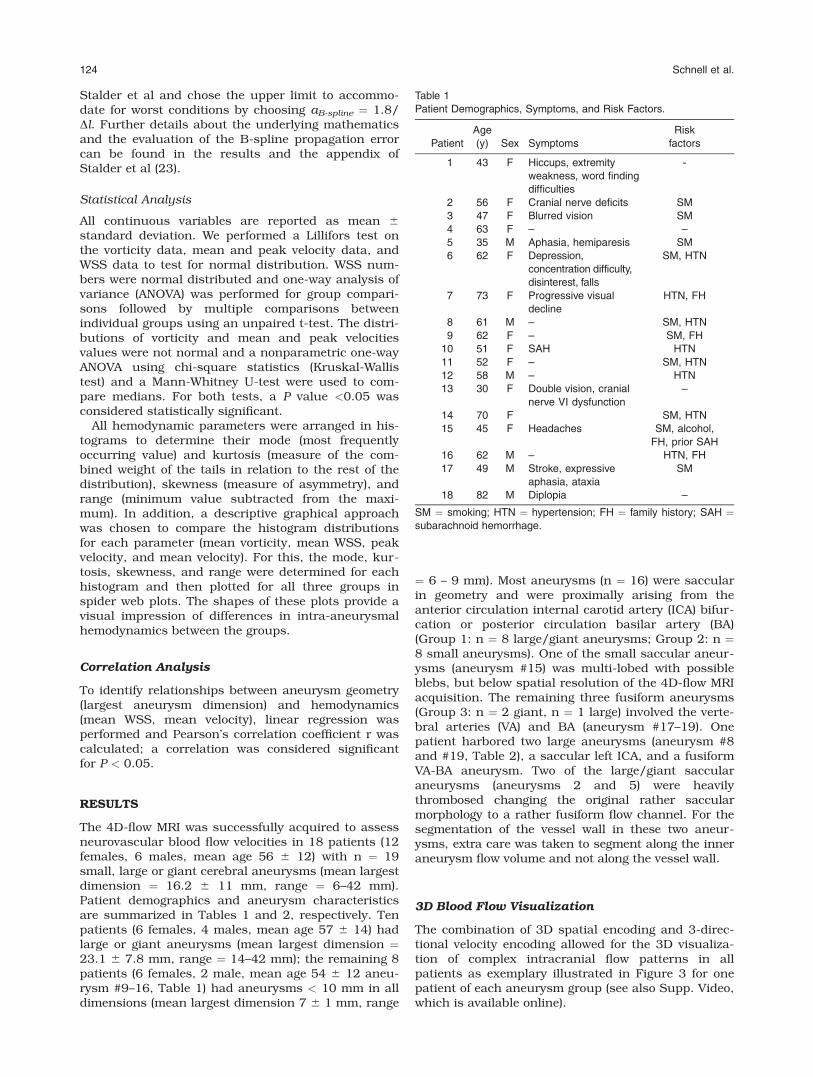
Table 1
Patient Demographics, Symptoms, and Risk Factors.
Patient
Age
(y) Sex Symptoms
Risk
factors
1 43 F Hiccups, extremity
weakness, word finding
difficulties
-
2 56 F Cranial nerve deficits SM
3 47 F Blurred vision SM
4 63 F – –
5 35 M Aphasia, hemiparesis SM
6 62 F Depression,
concentration difficulty,
disinterest, falls
SM, HTN
7 73 F Progressive visual
decline
HTN, FH
8 61 M – SM, HTN
9 62 F – SM, FH
10 51 F SAH HTN
11 52 F – SM, HTN
12 58 M – HTN
13 30 F Double vision, cranial
nerve VI dysfunction
–
14 70 F SM, HTN
15 45 F Headaches SM, alcohol,
FH, prior SAH
16 62 M – HTN, FH
17 49 M Stroke, expressive
aphasia, ataxia
SM
18 82 M Diplopia –
SM ¼ smoking; HTN ¼ hypertension; FH ¼ family history; SAH ¼subarachnoid hemorrhage.
124 Schnell et al.
Based on the visualization of intra-aneurysmal/in-flowpathlines by velocity magnitude color coding, the 19 IAscould be classified into three distinct groups of aneurysmhemodynamics as illustrated Figure 4. Six of eightpatients in Group 1 demonstrated a narrow high-flowchannel along the aneurysm wall in combination withlarge central slow flow regions in the saccular aneurysmsof the anterior circulation. Aneurysms 5 and 7 also hadhigh-flow jet channels but expressed a more complicatedflow pattern not following the outline of the aneurysmwall. Aneurysms in Group 2 were more heterogeneous intheir flow patterns, but in general showed more promi-nent high-flow channels peripherally, with smaller slowflow regions centrally in comparison to Group 1. In con-trast, slow flow with less defined flow channels was notedin the three fusiform aneurysms constituting Group 3.Aneurysms 17 and 19 exhibited slow flow channelsacross the aneurysm center and along the wall, whereasaneurysm 18 barely expressed a visible flow directionwith very slow swirling flow. Group 3 exhibited slowerand more unidirectional flow compared with Groups 1and 2 with the faster and swirling flow along the vessel/aneurysm wall with slow central flow regions.
Error Propagation Analysis
The results for the error propagation analysis for ve-locity and WSS are summarized in Table 3. Velocity,and WSS errors were in the range of 1.6% (61.6%),respectively. All errors were much smaller than thedifferences between the groups indicating the reliabil-ity of WSS and velocity comparisons.
Aneurysm Velocity Distribution
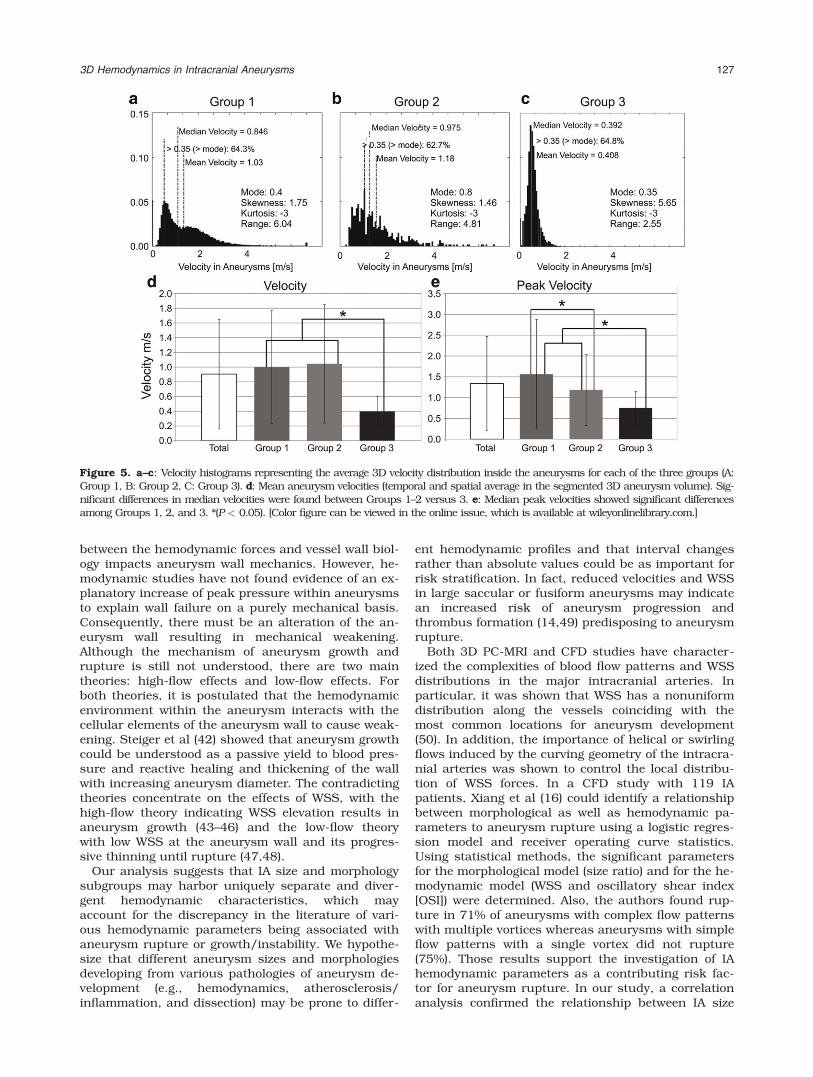
The results of the analysis of the intra-aneurysmal 3Dvelocity distribution are summarized in Figure 5. Theindividual histograms represent the velocity distribu-tion within the aneurysms averaged over all subjects in
each group. Differences between groups can clearly beappreciated and include increased mean and medianvelocities in Groups 1 and 2 compared with Group 3(Fig. 5) as well as increased velocity range (range1 ¼6.04 and range2 ¼ 4.91 versus range3 ¼ 2.55). TheGroup 3 velocity histogram emphasizes the presence ofsubstantially reduced velocities in the entire aneurysmvolume. All histogram shapes were skewed, althoughGroup 3 showed the highest skewness (skewness1 ¼1.78 and skewness2 ¼ 1.70 versus skewness3 ¼ 5.65),the highest velocity distribution curve (normalizednumber of voxels at mode Group 1 ¼ 0.051, Group 2¼ 0.056, and Group 3 ¼ 0.136), and lowest mode(mode1 ¼ 0.4 and mode2 ¼ 0.8 versus mode3 ¼ 0.35)emphasizing the higher prevalence of slow velocities.Differences in skewness are also reflected by changesin the fraction of velocities higher than the modebetween groups (red text in the histogram graphs inFig. 5).
Comparison of all groups (Kruskal-Wallis) demon-strated significant differences in velocities (P �0.001). The Mann-Whitney U-test result showed thatthe highest median velocities were found in bothGroups 1 and 2 (Fig. 5), which were significantly dif-ferent than Group 3 (Pmvelo,1–3 � 0.001, Pmvelo,2–3 �0.001, Pmvelo,2–3 � 0.001). Groups 1 and 2 hadsimilar median velocities. However, the highest peakvelocities were observed in the large/giantsaccular aneurysms with significant differencesbetween Groups, 1 and 3 and 2 and 3 (Ppvelo,1–2 ¼0.15, Ppvelo,1–3 � 0.001, Ppvelo,2–3 < 0.002,).
Wall Shear Stress
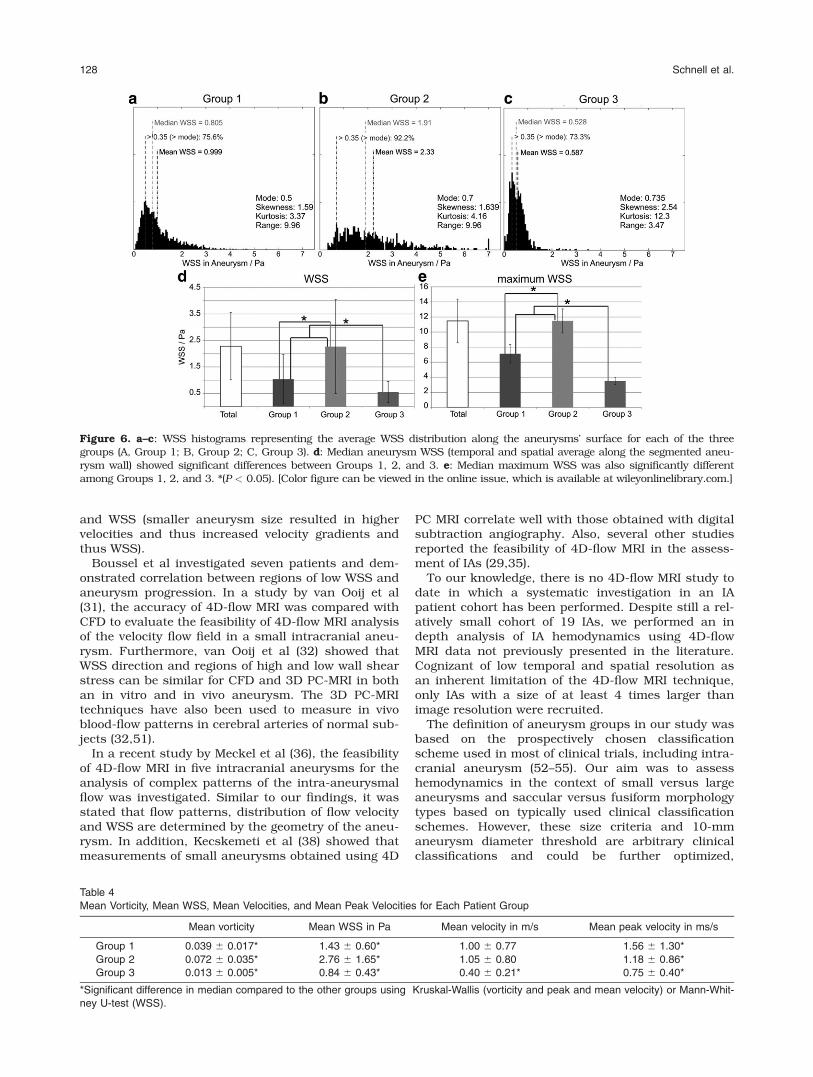
The results of the quantification of the WSS along theaneurysm surface are summarized in Figure 6.ANOVA revealed a significant difference between thegroups (P � 0.001). Multiple comparisons showedthat the WSS distribution was decreased for Group 3
Table 2
Aneurysm Characteristics.
Aneurysm
Aneurysm
location
Size (AP x TP x CC
x neck) Morphology – etiology
IA
group Thrombus Treatment
1 M1 segment MCA 24 x 26 x 23 Saccular–dissection 1 – –
2 Cavernous ICA 25 x 24 x 9 Saccular–dissection 1 Heavy Endovascular sacrifice/trapping
3 Paraclinoid ICA 17 x 25 x 18 x 4.5 Saccular 1 – Clipped
4 Paraclinoid ICA 10 x 14 x 14 Saccular 1 – Clipped
5 Paraclinoid ICA 22 x 22 x 21 Saccular–dissection 1 Heavy Clipped
6 VB junction and BA 23 x 22 x 22 x 3 Saccular–atherosclerosis 1 – Clipped
7 Basilar tip 21 x 21 x 23 x 7 Saccular 1 – Clipped/trapped
8 ICA 15 x 13 x 14 Saccular 1 – –
9 Paraclinoid ICA 6 x 6 x 7 Saccular 2 – Clipped
10 Basilar tip 6 x 6 x 5 x 3 Saccular 2 – Clipped
11 Basilar tip 4 x 3 x 6 x 3 Saccular 2 – –
12 Basilar tip 6 x 6 x 6 Saccular 2 – –
13 ICA 6 x 5 x 6 x 3 Saccular 2 – –
14 ICA 6 x 6 x 5 Saccular 2 – –
15 M1 MCA 6 x 6 x 6 x 3 Saccular 2 – Clipped
16 MCA 7 x 6 x 10 Saccular 2 – –
17 VB junction and BA 25 x 17 x 17 Fusiform– atherosclerosis 3 – –
18 BA 42 x 15 x 17 Fusiform–atherosclerosis 3 Some –
19 BA 12 x 12 x 14 Fusiform 3 – –
3D Hemodynamics in Intracranial Aneurysms 125

versus Groups 1 and 2 (PWSS,1–2 � 0.001, PWSS,1–3 �0.001, PWSS,2–3 � 0.001), as well as Group 1 versusGroup 2.
Vorticity
Vorticity was significantly different between groups(Kruskal-Wallis, P � 0.001). Aneurysms vorticity wassignificantly higher for Group 2 compared with Group1 as well as Group 1 versus Group 3 (Table 4, PVort,1–2
� 0.001, PVort,1–3 � 0.001, PVort,2–3 � 0.001).
Regression Analysis
Correlation analysis revealed a significant inverserelationship (P ¼ 0.02; r ¼ �0.55) between aneurysmsize and WSS for all saccular aneurysms (16 observa-tions) as well as for all aneurysms in general (19observations, P ¼ 0.014; r ¼ �0.55).
Multi-parametric Characterization of AneurysmHemodynamics
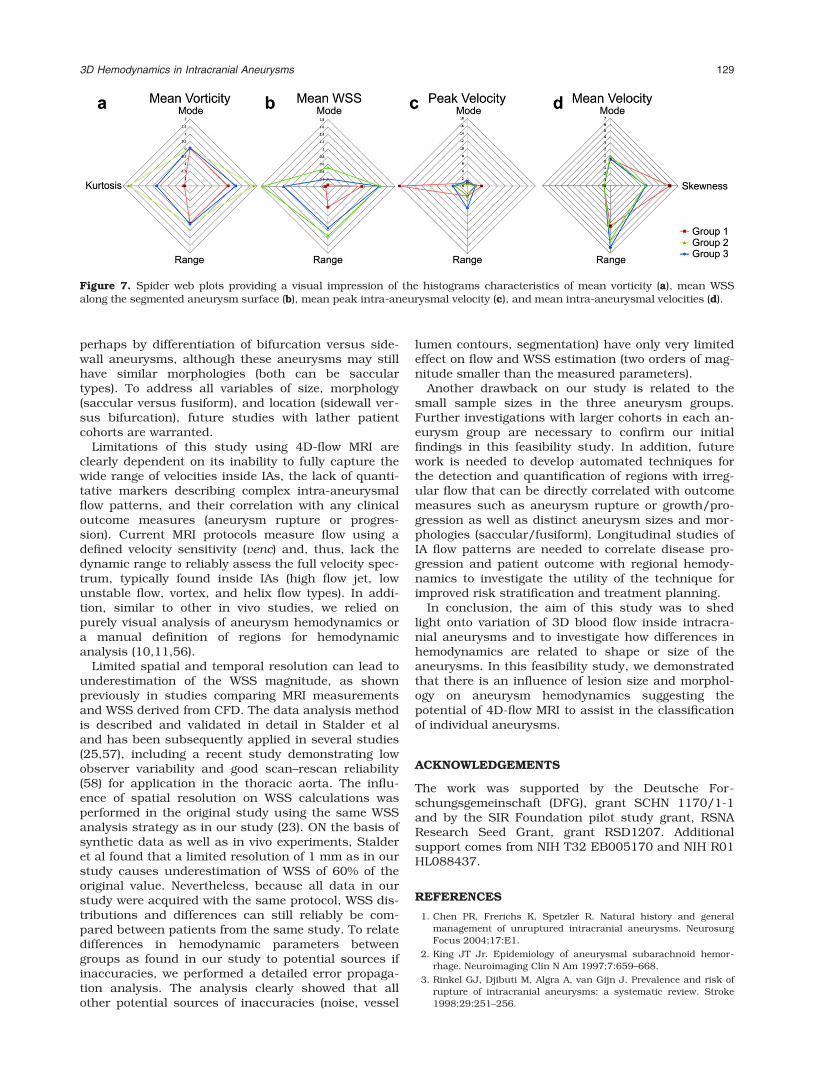
Figure 7 shows spider web plots for IA hemodynamicsas quantified by mean vorticity, time-averaged meanWSS, peak velocity, and mean velocity. As evidentfrom Figure 7a, c, and d velocity and vorticity distri-butions were similar for Groups 1 and 2 with onlymoderate differences in mode, kurtosis, range, orskewness. In contrast, the distribution of WSS alongthe aneurysm surface demonstrated clear differencesbetween all three groups. Noticeably, the spider webplots for Group 3 showed a strongly divergent shapefor all four parameters with most pronounced differ-ences for mean WSS and peak velocity.
DISCUSSION
Our findings in this feasibility study demonstrate thepotential of 4D-flow MRI to identify differences in IAhemodynamics as shown by visualization of intra-aneurysmal flow patterns and quantification of the 3Dvelocity distribution, vorticity, and WSS patterns.Both qualitative and quantitative hemodynamicparameters were clearly different between three aneu-rysm size and morphology groups. Small saccularaneurysms showed fast velocities, highest vorticity,and highest WSS compared with large and giantaneurysms. Moreover, large and giant saccular aneur-ysms showed high vorticity, high WSS, and high peakvelocities within the aneurysm and were easy differen-tiated from fusiform aneurysms with respect to thesederived hemodynamic parameters. Within Group 1,thrombus was present in two aneurysms (aneurysm 2and 5), altering the original saccular aneurysm mor-phology to a rather fusiform shape of the patentlumen. Further subdivision of morphology groups infuture studies might include single lobed versusmulti-lobed aneurysms, which may have altered flowdynamics. In the present patient cohort, only aneu-rysm #15 had a multi-lobulated shape and demon-strated similar flow characteristics in concordancewith Group 2 (saccular small aneurysms). Also, iden-tifying blebs (usually < 1–2 mm in size) and theirinfluence on IA hemodynamics parameters was out-side the resolution capability of our in vivo MR 4D-flow technique.
Various investigators have previously sought tocharacterize specific hemodynamic parameters associ-ated with IA rupture for improved risk stratification(8,13,18,41). In general, the understanding of the an-eurysm growth and rupture is that the interaction
Table 3
SNR in Magnitude Images and Error Propagation for Velocity and WSS for Each Aneurysm in Absolute Numbers as Well as in
Percentage of Corresponding Median Value
Aneurysm SNRmag rvelo/m/s rflow/ml/s rWSS/Pa
rvelo/ % of median
velocity
rWSS/ % of
median WSS
1 26.96 0.0134 0.2090 0.0018 0.92 0.12
2 13.33 0.0270 0.2790 0.0045 6.82 0.28
3 56.94 0.0055 0.0429 0.0011 1.27 0.08
4 55.49 0.0065 0.1233 0.0011 1.12 0.05
5 28.23 0.0128 0.1386 0.0020 3.08 0.28
6 97.98 0.0037 0.0339 0.0008 0.59 0.05
7 36.77 0.0098 0.0728 0.0015 2.68 0.17
8 31.14 0.0116 0.1239 0.0018 2.55 0.13
9 67.44 0.0053 0.0197 0.0016 0.66 0.04
10 95.83 0.0038 0.0579 0.0006 0.67 0.03
11 25.66 0.0140 0.0437 0.0043 1.79 0.19
12 95.80 0.0038 0.0126 0.0013 0.34 0.03
13 115.39 0.0031 0.0146 0.0008 0.22 0.02
14 71.34 0.0050 0.0271 0.0014 0.34 0.03
15 80.32 0.0045 0.0113 0.0012 0.63 0.06
16 73.97 0.0049 0.0128 0.0016 0.76 0.10
17 86.40 0.0042 0.0198 0.0012 1.86 0.19
18 69.65 0.0052 0.0420 0.0010 1.77 0.19
19 69.65 0.0052 0.0325 0.0011 2.90 0.27
Mean 63.07 0.0079 0.0693 0.0016 1.63 0.122
Standard deviation 29.28 0.0059 0.0740 0.0011 1.56 0.089
126 Schnell et al.
between the hemodynamic forces and vessel wall biol-ogy impacts aneurysm wall mechanics. However, he-modynamic studies have not found evidence of an ex-planatory increase of peak pressure within aneurysmsto explain wall failure on a purely mechanical basis.Consequently, there must be an alteration of the an-eurysm wall resulting in mechanical weakening.Although the mechanism of aneurysm growth andrupture is still not understood, there are two maintheories: high-flow effects and low-flow effects. Forboth theories, it is postulated that the hemodynamicenvironment within the aneurysm interacts with thecellular elements of the aneurysm wall to cause weak-ening. Steiger et al (42) showed that aneurysm growthcould be understood as a passive yield to blood pres-sure and reactive healing and thickening of the wallwith increasing aneurysm diameter. The contradictingtheories concentrate on the effects of WSS, with thehigh-flow theory indicating WSS elevation results inaneurysm growth (43–46) and the low-flow theorywith low WSS at the aneurysm wall and its progres-sive thinning until rupture (47,48).
Our analysis suggests that IA size and morphologysubgroups may harbor uniquely separate and diver-gent hemodynamic characteristics, which mayaccount for the discrepancy in the literature of vari-ous hemodynamic parameters being associated withaneurysm rupture or growth/instability. We hypothe-size that different aneurysm sizes and morphologiesdeveloping from various pathologies of aneurysm de-velopment (e.g., hemodynamics, atherosclerosis/inflammation, and dissection) may be prone to differ-
ent hemodynamic profiles and that interval changesrather than absolute values could be as important forrisk stratification. In fact, reduced velocities and WSSin large saccular or fusiform aneurysms may indicatean increased risk of aneurysm progression andthrombus formation (14,49) predisposing to aneurysmrupture.
Both 3D PC-MRI and CFD studies have character-ized the complexities of blood flow patterns and WSSdistributions in the major intracranial arteries. Inparticular, it was shown that WSS has a nonuniformdistribution along the vessels coinciding with themost common locations for aneurysm development(50). In addition, the importance of helical or swirlingflows induced by the curving geometry of the intracra-nial arteries was shown to control the local distribu-tion of WSS forces. In a CFD study with 119 IApatients, Xiang et al (16) could identify a relationshipbetween morphological as well as hemodynamic pa-rameters to aneurysm rupture using a logistic regres-sion model and receiver operating curve statistics.Using statistical methods, the significant parametersfor the morphological model (size ratio) and for the he-modynamic model (WSS and oscillatory shear index[OSI]) were determined. Also, the authors found rup-ture in 71% of aneurysms with complex flow patternswith multiple vortices whereas aneurysms with simpleflow patterns with a single vortex did not rupture(75%). Those results support the investigation of IAhemodynamic parameters as a contributing risk fac-tor for aneurysm rupture. In our study, a correlationanalysis confirmed the relationship between IA size
Figure 5. a–c: Velocity histograms representing the average 3D velocity distribution inside the aneurysms for each of the three groups (A:Group 1, B: Group 2, C: Group 3). d: Mean aneurysm velocities (temporal and spatial average in the segmented 3D aneurysm volume). Sig-nificant differences in median velocities were found between Groups 1–2 versus 3. e: Median peak velocities showed significant differencesamong Groups 1, 2, and 3. *(P < 0.05). [Color figure can be viewed in the online issue, which is available at wileyonlinelibrary.com.]
3D Hemodynamics in Intracranial Aneurysms 127
and WSS (smaller aneurysm size resulted in highervelocities and thus increased velocity gradients andthus WSS).
Boussel et al investigated seven patients and dem-onstrated correlation between regions of low WSS andaneurysm progression. In a study by van Ooij et al(31), the accuracy of 4D-flow MRI was compared withCFD to evaluate the feasibility of 4D-flow MRI analysisof the velocity flow field in a small intracranial aneu-rysm. Furthermore, van Ooij et al (32) showed thatWSS direction and regions of high and low wall shearstress can be similar for CFD and 3D PC-MRI in bothan in vitro and in vivo aneurysm. The 3D PC-MRItechniques have also been used to measure in vivoblood-flow patterns in cerebral arteries of normal sub-jects (32,51).
In a recent study by Meckel et al (36), the feasibilityof 4D-flow MRI in five intracranial aneurysms for theanalysis of complex patterns of the intra-aneurysmalflow was investigated. Similar to our findings, it wasstated that flow patterns, distribution of flow velocityand WSS are determined by the geometry of the aneu-rysm. In addition, Kecskemeti et al (38) showed thatmeasurements of small aneurysms obtained using 4D
PC MRI correlate well with those obtained with digitalsubtraction angiography. Also, several other studiesreported the feasibility of 4D-flow MRI in the assess-ment of IAs (29,35).
To our knowledge, there is no 4D-flow MRI study todate in which a systematic investigation in an IApatient cohort has been performed. Despite still a rel-atively small cohort of 19 IAs, we performed an indepth analysis of IA hemodynamics using 4D-flowMRI data not previously presented in the literature.Cognizant of low temporal and spatial resolution asan inherent limitation of the 4D-flow MRI technique,only IAs with a size of at least 4 times larger thanimage resolution were recruited.
The definition of aneurysm groups in our study wasbased on the prospectively chosen classificationscheme used in most of clinical trials, including intra-cranial aneurysm (52–55). Our aim was to assesshemodynamics in the context of small versus largeaneurysms and saccular versus fusiform morphologytypes based on typically used clinical classificationschemes. However, these size criteria and 10-mmaneurysm diameter threshold are arbitrary clinicalclassifications and could be further optimized,
Figure 6. a–c: WSS histograms representing the average WSS distribution along the aneurysms’ surface for each of the threegroups (A, Group 1; B, Group 2; C, Group 3). d: Median aneurysm WSS (temporal and spatial average along the segmented aneu-rysm wall) showed significant differences between Groups 1, 2, and 3. e: Median maximum WSS was also significantly differentamong Groups 1, 2, and 3. *(P < 0.05). [Color figure can be viewed in the online issue, which is available at wileyonlinelibrary.com.]
Table 4
Mean Vorticity, Mean WSS, Mean Velocities, and Mean Peak Velocities for Each Patient Group
Mean vorticity Mean WSS in Pa Mean velocity in m/s Mean peak velocity in ms/s
Group 1 0.039 6 0.017* 1.43 6 0.60* 1.00 6 0.77 1.56 6 1.30*
Group 2 0.072 6 0.035* 2.76 6 1.65* 1.05 6 0.80 1.18 6 0.86*
Group 3 0.013 6 0.005* 0.84 6 0.43* 0.40 6 0.21* 0.75 6 0.40*
*Significant difference in median compared to the other groups using Kruskal-Wallis (vorticity and peak and mean velocity) or Mann-Whit-
ney U-test (WSS).
128 Schnell et al.
perhaps by differentiation of bifurcation versus side-wall aneurysms, although these aneurysms may stillhave similar morphologies (both can be sacculartypes). To address all variables of size, morphology(saccular versus fusiform), and location (sidewall ver-sus bifurcation), future studies with lather patientcohorts are warranted.
Limitations of this study using 4D-flow MRI areclearly dependent on its inability to fully capture thewide range of velocities inside IAs, the lack of quanti-tative markers describing complex intra-aneurysmalflow patterns, and their correlation with any clinicaloutcome measures (aneurysm rupture or progres-sion). Current MRI protocols measure flow using adefined velocity sensitivity (venc) and, thus, lack thedynamic range to reliably assess the full velocity spec-trum, typically found inside IAs (high flow jet, lowunstable flow, vortex, and helix flow types). In addi-tion, similar to other in vivo studies, we relied onpurely visual analysis of aneurysm hemodynamics ora manual definition of regions for hemodynamicanalysis (10,11,56).
Limited spatial and temporal resolution can lead tounderestimation of the WSS magnitude, as shownpreviously in studies comparing MRI measurementsand WSS derived from CFD. The data analysis methodis described and validated in detail in Stalder et aland has been subsequently applied in several studies(25,57), including a recent study demonstrating lowobserver variability and good scan–rescan reliability(58) for application in the thoracic aorta. The influ-ence of spatial resolution on WSS calculations wasperformed in the original study using the same WSSanalysis strategy as in our study (23). ON the basis ofsynthetic data as well as in vivo experiments, Stalderet al found that a limited resolution of 1 mm as in ourstudy causes underestimation of WSS of 60% of theoriginal value. Nevertheless, because all data in ourstudy were acquired with the same protocol, WSS dis-tributions and differences can still reliably be com-pared between patients from the same study. To relatedifferences in hemodynamic parameters betweengroups as found in our study to potential sources ifinaccuracies, we performed a detailed error propaga-tion analysis. The analysis clearly showed that allother potential sources of inaccuracies (noise, vessel
lumen contours, segmentation) have only very limitedeffect on flow and WSS estimation (two orders of mag-nitude smaller than the measured parameters).
Another drawback on our study is related to thesmall sample sizes in the three aneurysm groups.Further investigations with larger cohorts in each an-eurysm group are necessary to confirm our initialfindings in this feasibility study. In addition, futurework is needed to develop automated techniques forthe detection and quantification of regions with irreg-ular flow that can be directly correlated with outcomemeasures such as aneurysm rupture or growth/pro-gression as well as distinct aneurysm sizes and mor-phologies (saccular/fusiform). Longitudinal studies ofIA flow patterns are needed to correlate disease pro-gression and patient outcome with regional hemody-namics to investigate the utility of the technique forimproved risk stratification and treatment planning.
In conclusion, the aim of this study was to shedlight onto variation of 3D blood flow inside intracra-nial aneurysms and to investigate how differences inhemodynamics are related to shape or size of theaneurysms. In this feasibility study, we demonstratedthat there is an influence of lesion size and morphol-ogy on aneurysm hemodynamics suggesting thepotential of 4D-flow MRI to assist in the classificationof individual aneurysms.
ACKNOWLEDGEMENTS
The work was supported by the Deutsche For-schungsgemeinschaft (DFG), grant SCHN 1170/1-1and by the SIR Foundation pilot study grant, RSNAResearch Seed Grant, grant RSD1207. Additionalsupport comes from NIH T32 EB005170 and NIH R01HL088437.
REFERENCES
1. Chen PR, Frerichs K, Spetzler R. Natural history and generalmanagement of unruptured intracranial aneurysms. NeurosurgFocus 2004;17:E1.
2. King JT Jr. Epidemiology of aneurysmal subarachnoid hemor-rhage. Neuroimaging Clin N Am 1997;7:659–668.
3. Rinkel GJ, Djibuti M, Algra A, van Gijn J. Prevalence and risk ofrupture of intracranial aneurysms: a systematic review. Stroke1998;29:251–256.
Figure 7. Spider web plots providing a visual impression of the histograms characteristics of mean vorticity (a), mean WSSalong the segmented aneurysm surface (b), mean peak intra-aneurysmal velocity (c), and mean intra-aneurysmal velocities (d).
3D Hemodynamics in Intracranial Aneurysms 129
4. Rahman M, Smietana J, Hauck E, et al. Size ratio correlates withintracranial aneurysm rupture status: a prospective study.Stroke 2010;41:916–920.
5. Wardlaw JM, White PM. The detection and management ofunruptured intracranial aneurysms. Brain 2000;123(Pt 2):205–221.
6. Sforza DM, Putman CM, Cebral JR. Hemodynamics of cerebralaneurysms. Ann Rev Fluid Mech 2009;41:91–107.
7. Gonzalez CF, Cho YI, Ortega HV, Moret J. Intracranial aneur-ysms: flow analysis of their origin and progression. AJNR AmJournal of Neuroradiol 1992;13:181–188.
8. Steinman DA, Milner JS, Norley CJ, Lownie SP, Holdsworth DW.Image-based computational simulation of flow dynamics in agiant intracranial aneurysm. AJNR Am J Neuroradiol 2003;24:559–566.
9. Ohta M, Wetzel SG, Dantan P, et al. Rheological changes afterstenting of a cerebral aneurysm: a finite element modelingapproach. Cardiovasc Intervent Radiol 2005;28:768–772.
10. Cebral JR, Castro MA, Appanaboyina S, Putman CM, Millan D,Frangi AF. Efficient pipeline for image-based patient-specificanalysis of cerebral aneurysm hemodynamics: technique andsensitivity. IEEE T Med Imaging 2005;24:457–467.
11. Cebral JR, Mut F, Weir J, Putman CM. Association of hemody-namic characteristics and cerebral aneurysm rupture. AJNR AmJ Neuroradiol 2011;32:264–270.
12. Boussel L, Rayz V, Martin A, et al. Phase-contrast magnetic reso-nance imaging measurements in intracranial aneurysms in vivoof flow patterns, velocity fields, and wall shear stress: comparisonwith computational fluid dynamics. Magn Reson Med 2009;61:409–417.
13. Jou LD, Quick CM, Young WL, et al. Computational approach toquantifying hemodynamic forces in giant cerebral aneurysms.AJNR Am J Neuroradiol 2003;24:1804–1810.
14. Rayz VL, Boussel L, Ge L, et al. Flow residence time and regionsof intraluminal thrombus deposition in intracranial aneurysms.Ann Biomed Eng 2010;38:3058–3069.
15. Jou LD, Wong G, Dispensa B, et al. Correlation between lumenalgeometry changes and hemodynamics in fusiform intracranialaneurysms. AJNR Am J Neuroradiol 2005;26:2357–2363.
16. Xiang J, Natarajan SK, Tremmel M, et al. Hemodynamic-morpho-logic discriminants for intracranial aneurysm rupture. Stroke2011;42:144–152.
17. Cebral JR, Castro MA, Burgess JE, Pergolizzi RS, Sheridan MJ,Putman CM. Characterization of cerebral aneurysms for assess-ing risk of rupture by using patient-specific computational hemo-dynamics models. AJNR Am J Neuroradiol 2005;26:2550–2559.
18. Hassan T, Ezura M, Timofeev EV, et al. Computational simulationof therapeutic parent artery occlusion to treat giant vertebrobasi-lar aneurysm. AJNR Am J Neuroradiol 2004;25:63–68.
19. Cebral JR, Mut F, Weir J, Putman C. Quantitative characterizationof the hemodynamic environment in ruptured and unrupturedbrain aneurysms. AJNR Am J Neuroradiol 2011;32:145–151.
20. Tateshima S, Murayama Y, Villablanca JP, et al. In vitro mea-surement of fluid-induced wall shear stress in unruptured cere-bral aneurysms harboring blebs. Stroke 2003;34:187–192.
21. Castro MA, Putman CM, Cebral JR. Computational fluid dynam-ics modeling of intracranial aneurysms: effects of parent arterysegmentation on intra-aneurysmal hemodynamics. AJNR Am JNeuroradiol 2006;27:1703–1709.
22. Prakash S, Ethier CR. Requirements for mesh resolution in 3Dcomputational hemodynamics. J Biomech Eng 2001;123:134–144.
23. Stalder AF, Russe MF, Frydrychowicz A, Bock J, Hennig J, MarklM. Quantitative 2D and 3D phase contrast MRI: optimized analy-sis of blood flow and vessel wall parameters. Magn Reson Med2008;60:1218–1231.
24. Canstein C, Cachot P, Faust A, et al. 3D MR flow analysis in real-istic rapid-prototyping model systems of the thoracic aorta: com-parison with in vivo data and computational fluid dynamics inidentical vessel geometries. Magn Reson Med 2008;59:535–546.
25. Frydrychowicz A, Stalder AF, Russe MF, et al. Three-dimensionalanalysis of segmental wall shear stress in the aorta by flow-sensi-tive four-dimensional-MRI. J Magn Reson Imaging 2009;30:77–84.
26. Harloff A, Albrecht F, Spreer J, et al. 3D blood flow characteris-tics in the carotid artery bifurcation assessed by flow-sensitive4D MRI at 3T. Magn Reson Med 2009;61:65–74.
27. Kohler U, Marshall I, Robertson MB, Long Q, Xu XY, Hoskins PR.MRI measurement of wall shear stress vectors in bifurcationmodels and comparison with CFD predictions. J Magn ResonImaging 2001;14:563–573.
28. Papathanasopoulou P, Zhao S, Kohler U, et al. MRI measurementof time-resolved wall shear stress vectors in a carotid bifurcationmodel, and comparison with CFD predictions. J Magn ResonImaging 2003;17:153–162.
29. Hollnagel DI, Summers PE, Poulikakos D, Kollias SS. Compara-tive velocity investigations in cerebral arteries and aneurysms:3D phase-contrast MR angiography, laser Doppler velocimetryand computational fluid dynamics. NMR Biomed 2009;22:795–808.
30. Marquering H, van Ooij P, Streekstra G, et al. Multi-scale flowpatterns within an intracranial aneurysm phantom. IEEE TransBiomed Eng 2011; 10.1109/TBME.2011.2163070.
31. van Ooij P, Guedon A, Poelma C, et al. Complex flow patterns ina real-size intracranial aneurysm phantom: phase contrast MRIcompared with particle image velocimetry and computationalfluid dynamics. NMR Biomed 2012;25:14–26.
32. van Ooij P, Potters WV, Gu�edon A, Schneiders JJ, MarqueringHA, Majoie CB, vanBavel E, Nederveen AJ. Wall shear stress esti-mated with phase contrast MRI in an in vitro and in vivo intra-cranial aneurysm. J Magn Reson Imaging. 2013 Feb 15. doi:10.1002/jmri.24051. [Epub ahead of print].
33. Wetzel S, Meckel S, Frydrychowicz A, et al. In vivo assessmentand visualization of intracranial arterial hemodynamics withflow-sensitized 4D MR imaging at 3T. AJNR Am J Neuroradiol2007;28:433–438.
34. Isoda H, Ohkura Y, Kosugi T, et al. In vivo hemodynamicanalysis of intracranial aneurysms obtained by magnetic reso-nance fluid dynamics (MRFD) based on time-resolved three-dimensional phase-contrast MRI. Neuroradiology 2010;52:921–928.
35. Hope TA, Hope MD, Purcell DD, et al. Evaluation of intracranialstenoses and aneurysms with accelerated 4D flow. Magn ResonImaging 2010;28:41–46.
36. Meckel S, Stalder AF, Santini F, et al. In vivo visualization andanalysis of 3-D hemodynamics in cerebral aneurysms with flow-sensitized 4-D MR imaging at 3 T. Neuroradiology 2008;50:473–484.
37. Schnell S, Ansari SA, Vakil P, et al. Characterization of cerebralaneurysms using 4D FLOW MRI. 2011 1st of Febuary 2012;Orlando, USA. SCMR/ISMRM Jointly Sponsored Workshop‘‘Exploring New Dimensions of Cardiovascular Flow and Motion’’;(#1255313).
38. Kecskemeti S, Johnson K, Wu Y, Mistretta C, Turski P, Wieben O.High resolution three-dimensional cine phase contrast MRI ofsmall intracranial aneurysms using a stack of stars k-space tra-jectory. J Magn Reson Imaging 2012;35:518–527.
39. Bock J, Kreher BW, Hennig J, Markl M. Optimized pre-processingof time-resolved 2D and 3D Phase Contrast MRI data. In: Pro-ceedings of the 15th Annual Meeting of ISMRM, Berlin, Germany,2007. (abstract 3138).
40. Bock J, Wieben O, Johnson K, Hennig J, Markl M. Optimal proc-essing to derive static PC-MRA from time-resolved 3D PC-MRIdata. Proc Intl Soc Mag Reson Med 2008;16:3053.
41. Cebral JR, Castro MA, Appanaboyina S, Putman CM, Millan D,Frangi AF. Efficient pipeline for image-based patient-specificanalysis of cerebral aneurysm hemodynamics: technique andsensitivity. IEEE Trans Med Imaging 2005;24:457–467.
42. Steiger HJ, Aaslid R, Keller S, Reulen HJ. Strength, elasticity andviscoelastic properties of cerebral aneurysms. Heart Vessels1989;5:41–46.
43. Nakatani H, Hashimoto N, Kang Y, et al. Cerebral blood flow pat-terns at major vessel bifurcations and aneurysms in rats. J Neu-rosurg 1991;74:258–262.
44. Fukuda S, Hashimoto N, Naritomi H, et al. Prevention of rat cere-bral aneurysm formation by inhibition of nitric oxide synthase.Circulation 2000;101:2532–2538.
45. Hara A, Yoshimi N, Mori H. Evidence for apoptosis in humanintracranial aneurysms. Neurol Res 1998;20:127–130.
46. Sho E, Sho M, Singh TM, Xu C, Zarins CK, Masuda H. Blood flowdecrease induces apoptosis of endothelial cells in previouslydilated arteries resulting from chronic high blood flow. Arterios-cler Thromb Vasc Biol 2001;21:1139–1145.
130 Schnell et al.

47. Griffith TM. Modulation of blood flow and tissue perfusion byendothelium-derived relaxing factor. Exp Physiol 1994;79:873–913.
48. Liepsch DW. Flow in tubes and arteries–a comparison. Biorheol-ogy 1986;23:395–433.
49. Boussel L, Rayz V, McCulloch C, et al. Aneurysm growth occursat region of low wall shear stress: patient-specific correlation ofhemodynamics and growth in a longitudinal study. Stroke 2008;39:2997–3002.
50. Brisman JL, Song JK, Newell DW. Cerebral aneurysms. N Engl JMed 2006;355:928–939.
51. Bammer R, Hope TA, Aksoy M, Alley MT. Time-resolved 3Dquantitative flow MRI of the major intracranial vessels: initialexperience and comparative evaluation at 1.5T and 3.0T in com-bination with parallel imaging. Magn Reson Med 2007;57:127–140.
52. Kataoka K, Taneda M, Asai T, Yamada Y. Difference in nature ofruptured and unruptured cerebral aneurysms. Lancet 2000;355:203.
53. Juvela S, Porras M, Poussa K. Natural history of unrupturedintracranial aneurysms: probability of and risk factors for aneu-rysm rupture. J Neurosurg 2000;93:379–387.
54. Investigators TISoUIA. Unruptured intracranial aneurysms–riskof rupture and risks of surgical intervention. International Studyof Unruptured Intracranial Aneurysms Investigators. N Engl JMed 1998;339:1725–1733.
55. Wiebers DO, Whisnant JP, Huston J III, et al. Unruptured intra-cranial aneurysms: natural history, clinical outcome, and risks ofsurgical and endovascular treatment. Lancet 2003;362:103–110.
56. Mulder G, Bogaerds ACB, Rongen P, van de Vosse FN. On auto-mated analysis of flow patterns in cerebral aneurysms based onvortex identification. J Eng Math 2009;64:391–401.
57. Harloff A, Nussbaumer A, Bauer S, et al. In vivo assessment ofwall shear stress in the atherosclerotic aorta using flow-sensitive4D MRI. Magn Reson Med 2010;63:1529–1536.
58. Markl M, Wallis W, Harloff A. Reproducibility of flow and wallshear stress analysis using flow-sensitive four-dimensional MRI.J Magn Reson Imaging 2011;33:988–994.
3D Hemodynamics in Intracranial Aneurysms 131
Related Documents