The showrooming phenomenon – Threat, opportunity or challenge in multi-channel retailing? Inaugural dissertation to obtain the Academic Degree of a Doctor of Economics (Dr. rer. oec.) at the Faculty of Economic Sciences – Schumpeter School of Business and Economics – of the University of Wuppertal Submitted by Patricia Jennifer Schneider, M. A. Wuppertal, June 2020 First Supervisor: Prof. Dr. Stephan Zielke Second Supervisor: Prof. Dr. Ina Garnefeld

Welcome message from author
This document is posted to help you gain knowledge. Please leave a comment to let me know what you think about it! Share it to your friends and learn new things together.
Transcript

The showrooming phenomenon –
Threat, opportunity or challenge in multi-channel retailing?
Inaugural dissertation
to obtain the Academic Degree of a Doctor of Economics
(Dr. rer. oec.)
at the Faculty of Economic Sciences
– Schumpeter School of Business and Economics –
of the University of Wuppertal
Submitted by
Patricia Jennifer Schneider, M. A.
Wuppertal, June 2020
First Supervisor: Prof. Dr. Stephan Zielke
Second Supervisor: Prof. Dr. Ina Garnefeld

The PhD thesis can be quoted as follows:
urn:nbn:de:hbz:468-20210325-101502-2[http://nbn-resolving.de/urn/resolver.pl?urn=urn%3Anbn%3Ade%3Ahbz%3A468-20210325-101502-2]
DOI: 10.25926/3b8y-rr98[https://doi.org/10.25926/3b8y-rr98]
Acknowledgements
Acknowledgements
I am sincerely grateful to my supervisor Stephan Zielke for his continuous guidance and advice
throughout the years. I also wish to thank my doctoral and chair colleagues for their support and
helpful comments. In particular, I would like to thank my office partner Laura Bertrandie and my
colleagues Alena Ortlinghaus, Kathrin Sinemus and Vanessa Schmieja who always listen to me and
gave me useful comments whenever I wanted to discuss my work. I also want to thank Florian
Kluge for his technical assistance, Svenja Wege and Melina Otte for their help in data collection
processes and Ute Brüne for her mental support during the whole time.
Finally, I can never thank my parents – Bettina und Hartmut Schneider – my sister – Sabrina
Schneider – and especially my boyfriend – Dominik Jung – enough for their patience and support.
That is why this dissertation is dedicated to you. Your love and support sustains me every day.
Wuppertal, June 2020
Patricia J. Schneider
Table of contents
I
Table of contents
Table of contents ................................................................................................................................... I
List of figures ..................................................................................................................................... IV
List of tables ........................................................................................................................................ V
1 Introduction ..................................................................................................................................... 1
1.1 Relevance of showrooming for retail research and practice ...................................................... 1
1.2 Research objectives and framework ........................................................................................... 3
1.3 Structure of dissertation .............................................................................................................. 9
2 Showrooming forms and segments .............................................................................................. 11
2.1 Introduction .............................................................................................................................. 12
2.2 Theoretical framework ............................................................................................................. 13
2.2.1 From channel choice to showrooming ............................................................................... 13
2.2.2 Multi-channel segments ..................................................................................................... 15
2.2.3 Psychographic dimensions in showrooming contexts – a conceptual framework ............ 16
2.3 Research design and sample description .................................................................................. 19
2.3.1 Qualitative pre-study ......................................................................................................... 19
2.3.2 Main study ......................................................................................................................... 21
2.4 Analysis and results .................................................................................................................. 24
2.4.1 Potential showroomers and characterizing factors ............................................................ 24
2.4.2 Cluster analyses ................................................................................................................. 24
2.4.3 Description of showrooming clusters ................................................................................ 27
2.4.4 Comparison of showrooming segments concerning psychographic dimensions .............. 29
2.4.5 Additional analyses............................................................................................................ 29
2.5 General discussion .................................................................................................................... 30
2.6 Management implications ........................................................................................................ 32
2.7 Limitations and future research ................................................................................................ 33
3 Showrooming potentials and showrooming behavior................................................................ 35
3.1 Introduction .............................................................................................................................. 36
3.2 Theoretical framework ............................................................................................................. 39
3.2.1 Background: buying process models and adaptive behavior ............................................. 39
3.2.2 Defining showrooming potentials and behavior ................................................................ 40
3.2.3 Relationships between showrooming potentials and showrooming behavior ................... 44
3.3 Qualitative pre-study: online search behavior in potential showrooming situations ............... 50
Table of contents
II
3.3.1 Research design and sample description ........................................................................... 50
3.3.2 Analysis and results ........................................................................................................... 50
3.4 Survey study: relationships between showrooming potentials and behavior ........................... 51
3.4.1 Development of measurements ......................................................................................... 51
3.4.2 Research design and sample description ........................................................................... 52
3.4.3 Analysis and results ........................................................................................................... 53
3.5 Complementary study: the role of choice confusion and search convenience ......................... 56
3.6 Experimental study: effective usage of customers’ need for product information .................. 58
3.6.1 Research design and sample description ........................................................................... 59
3.6.2 Analysis and results ........................................................................................................... 60
3.7 General discussion .................................................................................................................... 61
3.8 Management implications ........................................................................................................ 62
3.9 Limitations and future research ................................................................................................ 63
4 Managerial antecedents of showrooming ................................................................................... 65
4.1 Introduction .............................................................................................................................. 66
4.2 Theoretical framework ............................................................................................................. 67
4.2.1 Showrooming..................................................................................................................... 67
4.2.2 Conceptual model and development of hypotheses .......................................................... 69
4.3 Study A: price differences and service usage ........................................................................... 73
4.3.1 Research design and sample description ........................................................................... 73
4.3.2 Analysis and results ........................................................................................................... 75
4.4 Study B: service availability and service quality ..................................................................... 78
4.4.1 Research design and sample description ........................................................................... 78
4.4.2 Analysis and results ........................................................................................................... 79
4.5 Study C: price differences with fast service availability and high service quality ................... 81
4.5.1 Research design and sample description ........................................................................... 81
4.5.2 Analysis and results ........................................................................................................... 82
4.6 General discussion .................................................................................................................... 84
4.7 Management implications ........................................................................................................ 85
4.8 Limitations and future research ................................................................................................ 86
5 General conclusions ...................................................................................................................... 87
5.1 Summary of results ................................................................................................................... 87
5.2 Implications for research .......................................................................................................... 92
5.3 Implications for business practice ............................................................................................ 93
Table of contents
III
5.4 Limitations and future research ................................................................................................ 95
5.5 Personal conclusion .................................................................................................................. 95
References .......................................................................................................................................... VI
Appendix ........................................................................................................................................ XVII

List of figures
IV
List of figures
Figure 1 Research framework ..................................................................................................... 4
Figure 2 Schematic overview of research projects ..................................................................... 8
Figure 3 Structure of dissertation .............................................................................................. 10
Research project 1:
Figure 4 Conceptual framework ............................................................................................... 19
Figure 5 SEM model ................................................................................................................. 30
Figure 6 Preferred retailer for purchase across showrooming segments (same vs. other
retailer) ...................................................................................................................... 31
Figure 7 Preferred place for purchase across showrooming segments (mobile vs. home
purchase) ..................................................................................................................... 32
Research project 2:
Figure 8 Model of showrooming potentials and showrooming behavior ................................. 48
Figure 9 Overview of empirical studies .................................................................................... 49
Figure 10 Standardized factor loadings for basic model (survey study) .................................... 54
Figure 11 Standardized factor loadings for basic model (complementary study) ...................... 57
Figure 12 Results of sequential mediation analyses (complementary study) ............................. 58
Research project 3:
Figure 13 Conceptual framework ............................................................................................... 73
Figure 14 Interaction plots of price differences and service usage on showrooming and offline
purchase behavior (study A) ....................................................................................... 77
Figure 15 Mean values of showrooming behavior according to price differences and different
service levels (study A and C) .................................................................................... 83

List of tables
V
List of tables
Research project 1:
Table 1 Category system of explorative pre-study .................................................................. 20
Table 2 Characterizing forms, showrooming behavior questions and characterizing
factors due to multiple factor analyses (n = 332) ....................................................... 23
Table 3 Characterization of showrooming segments – characterizing factors ........................ 25
Table 4 Characterization of showrooming segments – profiling factors................................. 26
Table 5 Demographic factors of showrooming segments ....................................................... 26
Research project 2:
Table 6 Research on antecedents and consequences in showrooming contexts...................... 41
Table 7 Means, standard deviations, square root of AVE and correlations between
constructs (survey study) ............................................................................................ 53
Table 8 Results of hypotheses tests ......................................................................................... 55
Table 9 Means, standard deviations, square root of AVE and correlations between
constructs (complementary study) .............................................................................. 57
Research project 3:
Table 10 Summary of previous research on the antecedents of showrooming ......................... 68
Table 11 Results of MANOVA with price differences and service usage as independent
variables (study A) ..................................................................................................... 75
Table 12 Mean values and standard deviation of showrooming and offline purchase
behavior according to price difference levels and service usage (study A) ............... 76
Table 13 Results of MANOVA with service availability and service quality as independent
variables (study B) ...................................................................................................... 79
Table 14 Mean values and standard deviation of price difference levels and service usage
and non-usage (study B) ............................................................................................. 79
Table 15 Results of hypotheses tests ......................................................................................... 81
Table 16 Results of ANOVA with price differences as independent variable and show-
rooming behavior as dependent variable (study C) .................................................... 82
Table 17 Differences of mean values of price difference levels and different service levels of
study A and study C ................................................................................................... 83

Introduction
1
1 Introduction
1.1 Relevance of showrooming for retail research and practice
Over the past twenty years retail has changed fundamentally. In addition to the classic distribution
channels – stationary and the catalogue channel – the internet conquered the retail landscape.
Online shares of retail in the U.S. rose from 9.7% in 2012 to 16.6% in 2018. In Germany, online
retailing recorded even stronger growth of 9.2 percentage points (2012: 5.9%; 2018: 15.1%) (Center
for Retail Research, 2020). With the success of the internet, other sales channels such as mobile and
social commerce emerged (Levy, Weitz, & Grewal, 2019). In particular, mobile commerce is cur-
rently experiencing growth. An annual worldwide survey conducted by the consulting firm PWC
shows that the mobile channel for shopping is steadily increasing (PWC, 2017). The number of e-
shoppers that shop online at least once in twelve months as a percentage of the population in Ger-
many in 2018 was 64%. In the UK the figure was as high as 73%. The trend is still rising (Center
for Retail Research, 2020). In general, mobile shoppers globally use their smartphones mainly to
search for products, to compare prices with competitors and to pay (PWC, 2017). Customers do this
with an increasing frequency in traditional offline stores. This smartphone usage in-store changes
the role of physical stores in general (Fuentes, Baeckstroem, & Svingstedt, 2017). Progressive digi-
talization has not only created new distribution channels but also additional distribution-
independent touchpoints of consumers with retailers. All these touchpoints together influence the
entire customer journey of today’s multi-channel customers starting with past experiences and in-
cluding all stages of the purchasing process as well as future purchasing intentions (Lemon &
Verhoef, 2016).
Consequently, retailers today face customers who probably already have or will have contact with
them or their products in various ways. This new shopping environment has changed customer be-
havior enormously in recent years and will continue to do so in the future. Apart from retailers
selling exclusive products (Kuksov & Liao, 2018), customers are no longer dependent on one retail-
er or channel. On the contrary, they have a wide range of choices at their disposal, so that multi-
channel retailers, for example, face the challenge of successfully integrating their marketing instru-
ments between channels (Bertrandie & Zielke, 2017, 2019). The customer journey is becoming in-
creasingly complex because customers switch channels between the various stages of the shopping
process. The literature calls this research shopping (Verhoef, Neslin, & Vroomen, 2007), and this
channel switching behavior has witnessed a definite upsurge in interest. The most common forms of
research shopping are webrooming, i.e. searching online and buying offline and its opposite show-
Introduction
2
rooming, i.e. searching offline and buying online (Kang, 2018). According to an annual consumer
research report of an online booking platform for optimizing the customer journey, on average 74%
of consumers webroom (searching online and purchasing in-store) especially for electronics, cloth-
ing and household items and 57% stated to showroom (searching in-store and purchasing online)
predominantly for clothing, gifts and electronics among US and UK shoppers in 2019 (JRNI, 2019).
Retailers assess showrooming in particular as a threat to stationary retail (Fulgoni, 2014; Teixeira &
Gupta, 2015). With the implementation of multi-channel technologies such as check and reserve,
click and collect or mere availability checks, multi-channel retailers try to keep customers in their
own channels (Ortlinghaus, Zielke, & Dobbelstein, 2019). However, recent figures for city centers
in Germany show that compared to 2014, in 2018 about every fourth person visits city centers less
frequently for shopping (Ministry of economic affairs, innovation, digitalization and energy of
North Rhine-Westphalia, 2019). This decline in frequency can have devastating consequences for
city centers especially when those customers visiting brick-and-mortar retailers do not finalize their
purchase in-store (Spiegel.de, 2020; Zuppinger, 2013).
Much effort in showrooming research has been expended on the identification and investigation of
possible causes of this consumer behavior (Arora & Sahney, 2018; Arora, Singha, & Sahney, 2017;
Balakrishnan, Sundaresan, & Zhang, 2014; Burns, Gupta, & Hutchins, 2019; Dahana, Shin, &
Katsumata, 2018; Daunt & Harris, 2017; Gensler, Neslin, & Verhoef, 2017; Kang, 2018). Although,
previous research identified numerous influencing factors, there is a lack of studies that relate these
factors to each other. Especially price and service seem to be the most important drivers for show-
rooming processes. But so far, only a study by Fassnacht, Beatty, and Szajna (2019) brings them
together examining the interaction effect of price matching and interaction quality on customers’ in-
store buying intentions. Hence, there is a lack of research examining the combined impact of vari-
ous price differences and different levels of service (e.g. quality and availability) in one study.
Instead, the development of suitable counter-strategies and measures has aroused substantial re-
search interest (Bell, Gallino, & Moreno, 2015; Fassnacht et al., 2019; Jing, 2018; Kuksov & Liao,
2018; Mehra, Kumar, & Raju, 2013, 2018; Rapp, Baker, Bachrach, Ogilvie, & Beitelspacher, 2015;
Willmott, 2014; Wu, Wang, & Zhu, 2015). Most of these studies define showrooming as in-store
search and online purchase (Balakrishnan et al., 2014). There is no study considering online infor-
mation search behavior as an integral part of the showrooming definition. Beyond, there is only one
study defining showrooming behavior as pure online search behavior (Rapp et al., 2015). However,
considering the entire showrooming literature, showrooming includes online search behavior pre-
ceding the actual online purchase behavior and following the offline search behavior.

Introduction
3
Concentrating on the act of purchasing, some studies focus on the final retailer for online purchase,
e.g. Gensler et al. (2017) who concentrate on the so-called competitive showrooming, in which cus-
tomers switch not only the channel but also the retailer or Gu and Tayi (2017) who examine pseu-
do-showrooming, in which customers search for a product in-store and purchase not the same but a
similar product in the online store of the same retailer. So far, there is no study examining different
facets of showrooming going beyond these definitions. Hence, there is no differentiation of positive
and negative showrooming from a retailer's point of view or an investigation of other facets that
could differentiate showrooming behavior, such as the time of online purchase, the device used for
online purchase or the use of various information options in-store. Furthermore, research has not yet
dealt with showrooming customers in particular. Instead, research focused on customer segmenta-
tions concentrating on online or offline shoppers (Brown, Pope, & Voges, 2003; Ganesh, Reynolds,
Luckett, & Pomirleanu, 2010; Rohm & Swaminathan, 2004) or concentrating on mobile customers
(Quint, Rogers, & Ferguson, 2013). Recently, some studies also offer customer segmentations con-
sidering channel interactions and thus, multi-channel-customers in general (Frasquet, Mollà, &
Ruiz, 2015). Overall, little systematic research on the showrooming phenomenon exists so far.
1.2 Research objectives and framework
The aim of the present work is to close the aforementioned research gaps. The following research
question guides this purpose: How can stationary retailers successfully encounter the showrooming
phenomenon or possibly even benefit from showrooming customers? On the basis of this research
question, the work discusses whether showrooming represents a threat, an opportunity or rather a
challenge for stationary retail.
To answer this superordinate question, the basic idea of this work is to present a differentiated view
of the showrooming phenomenon and thereby make an essential contribution to showrooming re-
search. This differentiated approach includes the exploration of different forms of showrooming
behavior, the presentation of a first typology of showrooming customers, the proposal of a new
conceptualization of the showrooming phenomenon including a differentiation of various online
search behaviors (showrooming potentials) that precede the online purchase (showrooming
behavior). Further, a central concern of this work is to develop and empirically test a model of rela-
tionships between diverse online search forms and their impacts on showrooming behavior and fi-
nally determine the impacts of the most important showrooming antecedents, namely price and ser-
vice, and their compensating effects. Examining the phenomenon as differentiated as possible, of-

Introduction
4
fers opportunities to derive suitable and promising implications for retailers. This dissertation com-
prises three independent projects that differ in their research focus:
Research project 1: Focus on forms of showrooming behavior and showrooming customers
Research project 2: Focus on online search behavior (showrooming potentials) that precedes
showrooming behavior
Research project 3: Focus on managerial antecedents (price vs. service) of showrooming
Figure 1 illustrates the relationships. Each project deals with separate research questions and makes
its own research contributions in order to answer the overall research question of this dissertation.
The first research project “Showrooming forms and segments” mainly focusses on online purchase
behavior (showrooming behavior) after visiting a physical store with special consideration of loyal
and disloyal behavioral tendencies. Moreover, it tries to identify various showrooming segments
based on preferred showrooming forms.
The project particularly addresses two of the already mentioned research gaps: First, until now, re-
search mainly focuses on competitive showrooming (Burns, Gupta, Bihn, & Hutchins, 2018; Daunt
& Harris, 2017; Gensler et al., 2017; Kang, 2018; Mehra et al., 2018; Sit, Hoang, & Inversini, 2018;
Teixeira & Gupta, 2015) and does not consider different forms of showrooming behavior. Although
previous research suggests that showrooming does not always appear in the same characteristic
form, no study investigates different facets of showrooming so far (Daunt & Harris, 2017). Second-
ly, to the current research state, there is no study providing a segmentation of showrooming cus-
tomers. Hence, the first project answers the following research questions:
(1) Which factors characterize different forms of showrooming behavior?
(2) How can we use these factors to identify different showrooming segments?
(3) How can we characterize these segments based on psychographic variables?
Showrooming
behavior
Showrooming
potentials
Managerial
antecedents
Showrooming phenomenon
Figure 1. Research framework.

Introduction
5
A qualitative pre-study identifies different forms of showrooming behavior. A subsequent online
study considers its results and measures the probabilities of different values of these so called
characterizing forms of showrooming behavior. These forms comprise for example time, place or
device used for online purchasing after visiting an offline store. In the online survey, values of the
characterizing form “device used for online purchase” were for example smartphone, tablet, laptop
or computer. Factor analyses of collected data compress these values into factors that we call
characterizing factors of showrooming behavior. In case of device used for purchase, a factor analy-
sis identified two factors, namely mobile and stationary devices used for purchase. Consequently,
various characterizing forms (e.g. device used for online purchase) aggregate different characteriz-
ing factors of showrooming behavior (e.g. mobile and stationary device). Based on these character-
izing factors, cluster analyses offer a first typology of showrooming customers that are further
characterized by different demographic and psychographic variables. Beyond, we analyzed the im-
pact of various psychographics on the general probability of showrooming.
Results offer five different forms of showrooming behavior with various characterizing factors indi-
cating that showrooming is a multifaceted phenomenon. This is confirmed by four identified show-
rooming segments differing in demographics and psychographics, for example in loyalty tendencies
or in their desire for social contact.
The second research project “Showrooming potentials and showrooming behavior” mainly inves-
tigates online search behaviors that follow an offline search and possibly lead to an online purchase.
These online search behaviors differ in terms of mobile or later search and in terms of product in-
formation or price information search. They are called potentials because they are an integral part of
the whole showrooming process. Showrooming potentials can but need not inevitable lead to online
purchase behavior. Hence, they differ from typical showrooming antecedents that initiate the show-
rooming process as a whole but that are not an integral part of it, such as situational or personal fac-
tors. In summary, research project two proposes a new conceptualization of the showrooming phe-
nomenon comprising offline search behavior, different forms of online search behavior (showroom-
ing potentials) and the act of purchasing online (showrooming behavior).
The second research project is based on another already mentioned research gap, namely the non-
consideration of online search behavior in previous showrooming definitions. Most existing studies
understand showrooming as an offline search followed by an online purchase (Balakrishnan et al.,
2014; Gensler et al., 2017). If existing studies consider online search behavior at all, then not as a
major component of the showrooming process but for instance as showrooming behavior per se (see
Rapp et al., 2015). Thus, there is no common understanding of the showrooming process in re-

Introduction
6
search, hindering a systematic analysis of the phenomenon. Additionally, until now, research does
not differentiate various online search behaviors, and consequently does not examine their relation-
ships nor develops counter-strategies based on them. Psychological variables, such as perceived
search convenience which is an important driver for showrooming (Sit et al., 2018) or choice confu-
sion while facing a large amount of information on- and offline (Malhotra, 1984) might explain
these relationships (here the relationship between in-store and later search). One strategy to reduce
showrooming based on customers’ online search behavior might be the use of QR codes in-store
that direct customers to the multi-channel retailer’s own online channel.
Therefore, research project 2 answers the following research questions:
(4) Which forms of online search behavior (showrooming potentials) exist in showrooming
contexts?
(5) How are different forms of online search behavior related and how do they influence
showrooming behavior?
(6) How do choice confusion and search convenience affect the relationships between show-
rooming potentials?
(7) Can multi-channel technologies such as QR codes keep customers in retailers’ own chan-
nels?
The methodological approach comprises: (1) a qualitative pre-study exploring various online search
behaviors in potential showrooming situations (showrooming potentials); (2) a multi-step develop-
ment of scales to get valid individual measures of four identified showrooming potentials and the
actual online purchase (showrooming behavior); (3) an online survey study that examines relation-
ships between these showrooming potentials and their impacts on showrooming behavior; (4) a
complementary study concentrating on the mediating effects of perceived choice confusion and
perceived search convenience on the relationships between showrooming potentials and finally, (5)
a subsequent laboratory experiment analyzing how multi-channel retailers can use customers’
search behavior for a selected counter-strategy, namely the use of QR codes. QR codes are a cheap
in-store technology that can easily combine offline information search with online information
search behavior. When customers start online search behavior in-store (so if they are already in the
middle of the showrooming process), QR codes enable retailers to direct customers’ information
search process to retailers’ own online channels. Therefore, the aim of the experiment is to investi-
gate whether the use of QR codes can reduce the probability of changing the retailer during channel
switching behavior (and thus prevent competitive showrooming).
Introduction
7
Results determine four different showrooming potentials comprising mobile vs. later online search
as well as product vs. price information search online. Whereas product information search enhanc-
es price search, mobile search enhances later online search. Additionally, the latter effect is mediat-
ed by perceived choice confusion and desire for search convenience. Customers using QR codes
that link to retailers’ website search for longer, but less in other retailers’ channels and less on addi-
tional websites.
The third research project “Managerial antecedents of showrooming” focuses on two main ante-
cedents of the showrooming phenomenon, namely price and service. For this reason, the research
project integrates the showrooming phenomenon more strongly into the customer journey (Lemon
& Verhoef, 2016). Numerous multi-channel customers search and compare product and price in-
formation on the internet even before they enter a store (Rippé, Weisfeld-Spolter, Yurova, &
Sussan, 2015). Verhoef et al. (2007) attribute this primarily to the advantages of the online channel
in the search phase of the purchasing process. Hence, in addition to the previous understanding of
showrooming this project includes an online search prior to the store visit. This project examines
price differences between the online and offline channel as well as in-store service as two relevant
situational influencing variables on showrooming behavior.
The third project focusses on the research gap identified in the context of showrooming drivers. So
far, research identified numerous important antecedents of showrooming (Daunt & Harris, 2017;
Fassnacht et al., 2019). Thereby, studies already prove the relevance of prices (Mehra et al., 2013;
Sit et al., 2018) and sales personnel in the context of showrooming (Rapp et al., 2015; Verhoef et
al., 2007). Fassnacht et al. (2019) combined facets of both variables in their study by investigating
the impact of a price guarantee with interaction quality on customers’ offline buying intention. Ex-
isting research confirms that service quality is one of the most important factors in customers’
channel switching behavior (Chiu, Hsieh, Roan, Tseng, & Hsieh, 2011; Verhoef et al., 2007). Ser-
vice availability seems to influence showrooming according to Gensler et al. (2017). Consequently,
previous research lacks in examining various price differences combined with different service lev-
els in-store. Therefore, the third project contributes to research by answering the following research
questions:
(8) Can service compensate for the disadvantage of price differences in the offline channel in
terms of showrooming behavior?
(9) What should this service look like?
(10) Do availability and quality of service personnel have a different impact on showrooming?
(11) What effect does the level of price difference have on showrooming?
Introduction
8
Research
project 3
Research
project 2
Research
project 1
Showrooming
behavior
Showrooming
potentials
Managerial
antecedents
Showrooming phenomenon
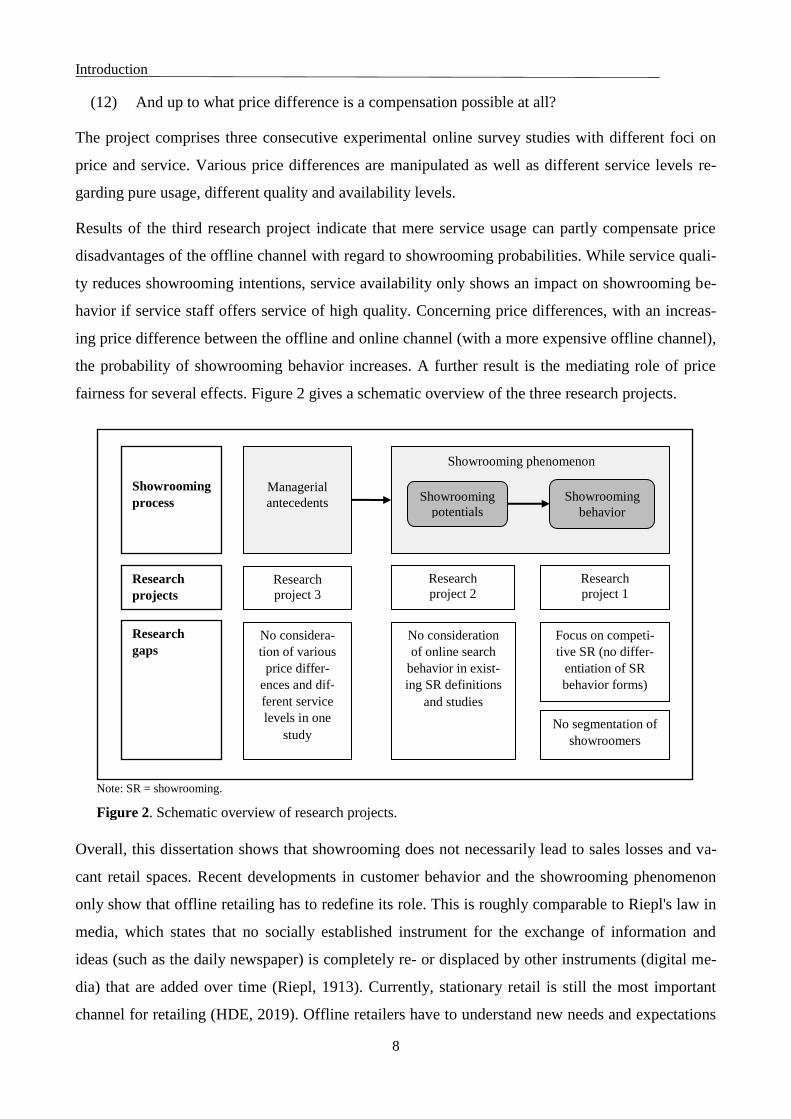
Note: SR = showrooming.
Figure 2. Schematic overview of research projects.
Showrooming
process
Research
projects
Research
gaps
No considera-
tion of various
price differ-
ences and dif-
ferent service
levels in one
study
No consideration
of online search
behavior in exist-
ing SR definitions
and studies
Focus on competi-
tive SR (no differ-
entiation of SR
behavior forms)
No segmentation of
showroomers
(12) And up to what price difference is a compensation possible at all?
The project comprises three consecutive experimental online survey studies with different foci on
price and service. Various price differences are manipulated as well as different service levels re-
garding pure usage, different quality and availability levels.
Results of the third research project indicate that mere service usage can partly compensate price
disadvantages of the offline channel with regard to showrooming probabilities. While service quali-
ty reduces showrooming intentions, service availability only shows an impact on showrooming be-
havior if service staff offers service of high quality. Concerning price differences, with an increas-
ing price difference between the offline and online channel (with a more expensive offline channel),
the probability of showrooming behavior increases. A further result is the mediating role of price
fairness for several effects. Figure 2 gives a schematic overview of the three research projects.
Overall, this dissertation shows that showrooming does not necessarily lead to sales losses and va-
cant retail spaces. Recent developments in customer behavior and the showrooming phenomenon
only show that offline retailing has to redefine its role. This is roughly comparable to Riepl's law in
media, which states that no socially established instrument for the exchange of information and
ideas (such as the daily newspaper) is completely re- or displaced by other instruments (digital me-
dia) that are added over time (Riepl, 1913). Currently, stationary retail is still the most important
channel for retailing (HDE, 2019). Offline retailers have to understand new needs and expectations

Introduction
9
of multi-channel customers for the offline channel. They need to focus on their store’s strengths
and, if necessary, adapt or optimize their offer in order to secure their place in the retail landscape.
1.3 Structure of dissertation
This dissertation comprises five chapters starting with the introduction (1). The introduction begins
by outlining the relevance of the showrooming topic both for research and for stationary retail, as
retailers see showrooming as a major threat to stationary retailing. Afterwards, it presents three arti-
cles with different research objectives and contributions. It closes with the dissertation’s structure.
The three subsequent chapters of this work, i.e. chapters 2, 3 and 4, represent three separate re-
search articles. All three articles are broadly similar in structure but differ in the number of research
studies included. Chapter 2 comprises the first research project “Showrooming forms and seg-
ments”, chapter 3 the second research project “Showrooming potentials and showrooming beha-
vior” and chapter 4 the last project “Managerial antecedents of showrooming”. The dissertation
finishes with a general conclusion (5) including a summary of core results, an elaboration of im-
portant research and managerial implications as well as the presentation of relevant limitations and
resulting future research approaches. Finally, the author draws a personal conclusion. Figure 3 pro-
vides an overview of the dissertation’s structure.

Introduction
10
Ma
na
ger
ial
an
tece
den
ts
Sh
ow
roo
min
g p
hen
om
en
on
Figure 3. Structure of dissertation.
(5) General conclusion
(4) Research project 3:
Managerial antecedents
of showrooming
(3) Research project 2:
Showrooming potentials and
showrooming behavior
(2) Research project 1:
Showrooming forms and segments
(1) Introduction
Showrooming forms and segments
11
2 Showrooming forms and segments1
Abstract
Showrooming is a behavior in which customers search for information in brick-and-mortar
stores and then purchase products online. While the literature conceptualizes showrooming as
a one-dimensional variable, we argue that different forms of showrooming exist. We identify
four showrooming segments that differ in retailer loyalty, usage of instore information,
devices, place and time of the online purchase. We further show that loyal vs. competitive
showroomers differ in psychographic variables, such as price consciousness, desire for social
contact and bad conscience during showrooming. The results have important implications for
retailers aiming to keep customers in their own channels.
Co-author: Stephan Zielke (University of Wuppertal)
1 Chapter 2 is based on the article “Searching offline and buying online – An analysis of showrooming forms and seg-
ments”, published in the Journal of Retailing and Consumer Services (2020, Vol. 52).

Showrooming forms and segments
12
2.1 Introduction
Imagine you are a retailer: “A young man – let’s call him Andy – walks into your store and starts
looking at your merchandise. Suddenly he pulls out a smartphone and snaps a picture. Then he
starts tapping away at the keys on his device. What’s going on? It seems Andy is looking up your
merchandise on the Internet, seeking a better price. When he finds one, he’ll order the item online.
With that done, he’ll walk out of your store. Revenues to you: Zero.” (Perry, 2013, p. 36). This is a
typical example of showrooming – a behavior in which customers search for products in retail
stores and then purchase them online (Teixeira & Gupta, 2015). It is a phenomenon which primarily
concerns multi-brand-stores and where the comparison of prices to other retailers is possible and
easy due to the internet.
In the context of rapid technology development, increasing smartphone coverage and therefore
ubiquitous access to the mobile internet (Kau, Tang, & Ghose, 2003), customers’ multi-channel
behavior is becoming more complex. Therefore, showrooming as one particular form of customer
behavior seems to be a topic of current relevance and interest. Surprisingly, not many research arti-
cles have examined the showrooming phenomenon thus far. The existing literature mainly focuses
on root cause analysis (Balakrishnan et al., 2014) or identifying counter-strategies (Mehra et al.,
2013; Rapp et al., 2015). Most studies focus on competitive showrooming in which customers
switch the channel and the retailer, i.e. they buy the product online at a competing retailer (Gensler
et al., 2017). However, customers can also show loyal showrooming behavior, in which they order a
product online after visiting the physical store of the same retailer. Furthermore, most studies ne-
glect the fact that showrooming behavior appears in different forms depending on situational fac-
tors, such as available instore information, usage of devices, time and place of the online purchase.
These characteristic forms of showrooming behavior might differ between customers. Many re-
search projects focus on customer segmentations concerning online and offline shoppers or recently
on channel interactions, but so far, segmentation studies of showroomers do not exist. In this con-
text, a segmentation based on loyalty and the aforementioned situational factors can contribute to a
better understanding of the showrooming phenomenon. Furthermore, as loyalty factors are particu-
larly relevant from a managerial perspective, it is important to understand which personal customer
characteristics stimulate or attenuate loyal vs. competitive showrooming.
Therefore, the aim of this study is to explore different characteristic forms of showrooming
behavior and develop a first typology of showrooming customers based on potential showrooming
factors (loyalty and situational factors). Additionally, the study aims to discover psychographic dif-
ferences between showrooming segments with a particular focus on loyal vs. disloyal customer

Showrooming forms and segments
13
groups. Hence, the study provides an important contribution to showrooming research by identify-
ing and characterizing different patterns of showrooming behavior with a special focus on loyalty
issues. The results should be useful for retailers to address potential showroomers more effectively
via specific marketing actions and communication strategies to retain them in their own channels. In
particular, the following research questions should be answered:
o Which factors characterize different forms of showrooming behavior?
o How can we use these factors to identify different showrooming segments?
o How can we characterize these segments based on psychographic variables?
The next section provides an overview of the theoretical background and develops a conceptual
framework for showroomer segmentation. We then present a qualitative pre-study, followed by a
quantitative survey study. The paper reports four different showrooming segments and provides
implications for retailers how to handle these segments in-store. This paper contributes to the
literature by (1) identifying different forms of showrooming behavior, (2) providing a first typology
of showrooming segments and (3) linking psychographic variables with loyal vs. disloyal segments.
2.2 Theoretical framework
2.2.1 From channel choice to showrooming
As the literature on showrooming is scarce, studies examining channel choice in general can be seen
as a starting point (Balasubramanian, Raghunathan, & Mahajan, 2005; Frambach, Roest, & Krish-
nan, 2007). Concerning channel-switching behavior, some articles analyze the so-called research
shopping or free-riding phenomenon (Kalyanam & Tsay, 2013; Van Baal & Dach, 2005; Verhoef et
al., 2007). Whereas research shopping is “the propensity of consumers to research the product in
one channel (e.g. the internet), and purchase it through another channel (e.g. the store)” (Verhoef et
al., 2007, p. 129), free-riding has a negative connotation because customers use resources of the
searching channel without any benefit to retailers in this channel (Van Baal & Dach, 2005). The
literature analyzed different types of influencing factors of research shopping. These are psycho-
graphic and sociodemographic characteristics of customers (Chiu et al., 2011; Heitz-Spahn, 2013;
Pookulangara, Hawley, & Xiao, 2011), product characteristics (Heitz-Spahn, 2013; Van Baal &
Dach, 2005) and channel attributes (Chiu et al., 2011; Kucuk & Maddux, 2010; Verhoef et al.,
2007). Kalyanam and Tsay (2013) examine the impact of research shopping and use the term “hy-
brid shopping” (pp. 20-21), in which they integrate retailer (dis)loyalty as a characterizing element.
Further research analyzed strategies to counter free-riding (Shin, 2007).

Showrooming forms and segments
14
In our study we focus not only on research shoppers in general but more specifically on the so-
called showroomer. Showrooming can be considered as a specific form of research shopping or
free-riding combined with online shopping behavior. Balakrishnan et al. (2014) define showroom-
ing as “the practice among some consumers of first browsing at a physical store and then ordering
from an online seller (…)” (p. 1144). Showrooming is a kind of natural customer behavior in a mul-
ti-channel environment (Bachrach, Ogilvie, Rapp, & Calamusa, 2016; Neslin et al., 2014;
Vanheems, Kelly, & Stevenson, 2013). However, studies focusing on showrooming are rare. Some
discuss and analyze the antecedents of showrooming behavior or potential influencing factors
(Bachrach et al., 2016; Balakrishnan et al., 2014; Daunt & Harris, 2017; Gensler et al., 2017). Other
studies focus on consequences of showrooming behavior from different perspectives. Chiou, Wu,
and Chou (2012) analyze how customers use “techniques of neutralization to rationalize” (p. 883)
their own showrooming behavior. Rapp et al. (2015) focus on the negative impact of showrooming
on salespersons’ behavior and performance. Simultaneously, they analyze counter-strategies, which
is also a popular topic (Ankosko, 2012; Bachrach et al., 2016; Bell et al., 2015; Kalyanam & Tsay,
2013; Mehra et al., 2013; Wu et al., 2015).
Hence, it seems that existing studies view showrooming as something negative because they assume
that customers always change the retailer (Kalyanam & Tsay, 2013; Mehra et al., 2013; Texeira &
Gupta, 2015). Therefore, Gensler et al. (2017) use the term “competitive showrooming” (p. 29).
Nevertheless, showrooming can even be positive to the retailer when customers switch only the
channel, but not the retailer (Van Baal & Dach, 2005). Rejón-Guardia and Luna-Nevarez (2017)
characterize this behavior as “loyal showrooming” (p. 177). Using multiple channels of the same
retailer can result in a positive customer experience (Lemon & Verhoef, 2016). Furthermore, some
authors refer to specific devices and places in their definitions, such as usage of mobile phones in
stores (Rapp et al., 2015). Obviously, showrooming does not always appear in the same characteris-
tic form. Conversely, showrooming behavior has different facets. As Daunt and Harris (2017) al-
ready requested, it is important to look at showrooming devices, timings, product categories and
further aspects that could differentiate various forms of showrooming behavior. Therefore, this pa-
per aims to identify multiple showrooming factors leading to different forms of showrooming be-
havior. The aforementioned research on channel choice and showrooming suggests that retailer loy-
alty and situational factors are important impact variables for characterizing showrooming behavior.
Consequently, showrooming segments might differ in these variables.
Showrooming forms and segments
15
2.2.2 Multi-channel segments
As showrooming is a complex phenomenon, it might also be helpful for retailers to identify differ-
ent segments of showroomers, which they can address more effectively. Several recent segmenta-
tion studies focus on the development of internet shopper typologies (Bhatnagar & Ghose, 2004;
Brown et al., 2003; Kau et al., 2003). However, most studies either examine only internet shoppers
or just compare them with offline shopping segments (Ganesh et al., 2010; Rohm & Swaminathan,
2004). Studies considering channel interactions are rare. Konuş, Verhoef, and Neslin (2008) devel-
op a segmentation related to channels for search and purchase, but they identify only multi-channel
shoppers as one general segment. Sands, Ferraro, Campbell, and Pallant (2016) add the after sales
stage and Frasquet et al. (2015) go even further by classifying multi-channel customers based on
their real channel usage across all three stages of the shopping process. Another qualitative study
maps customer journeys and uses the results to segment multi-channel shoppers (Wolny &
Charoensuksai, 2014). All studies reveal customer segments, using both online and offline channels
during their path-to-purchase, but did not focus on showrooming behavior in particular.
Studying customer behavior in general, Naik and Reddy (1999) mention, “we have to consider not
only what people buy, but where, how often, and under what conditions they make their purchase”
(p. 2). We can conclude that showrooming definitely is a form of customer behavior. Since segmen-
tation studies of showroomers do not exist, while the segmentation of customers is a fundamental
requirement for any marketing action (East, Wright, & Vanhuele, 2013), a segmentation of show-
rooming customers is necessary.
Many segmentation studies of online shoppers or multi-channel shoppers identify one store-focused
segment that favors the offline channel (De Keyser, Scherpers, & Konuş, 2015; Frasquet et al.,
2015; Kau et al., 2003; Konuş et al., 2008; Quint et al., 2013; Rohm & Swaminathan, 2004). Other
segmentation studies of multi-channel shoppers determine the existence of online-focused segments
(De Keyser et al., 2015; Frasquet et al., 2015; Sands et al., 2016) or especially of mobile-assisted
shoppers that are predominantly driven by digital attributes (Quint et al., 2013). Especially for
showroomers the visit of a physical store in the search stage as well as the usage of the internet
channel for purchase are essential by definition. Therefore, a high affinity to offline-searching and
online-purchasing behavior might characterize the classical showroomer. Nevertheless, showroom-
ing segments can differ in their offline- or online focus. As mentioned in section 2.2.1, we also ex-
pect that customer segments differ with regard to showrooming factors, such as devices used for
purchasing, time of purchase, retailer loyalty vs. switching, etc. Furthermore, showrooming seg-
ments as a special form of multi-channel segments might also show differences in psychographic
Showrooming forms and segments
16
and demographic variables (Frasquet et al., 2015; Konuş et al., 2008). Therefore, this paper aims to
identify different customer segments based on the aforementioned aspects of showrooming
behavior. According to existing segmentation studies, we expect more store-focused showrooming
segments which might rather stay with the retailer and more online-focused segments that will ra-
ther change retailers. Besides, there might also be at least one mobile-focused segment that uses
mobile devices in the search and purchase stage of showrooming. Hence, recent multi-channel seg-
mentation studies corroborate the assumption that retailer loyalty and multiple situational factors
characterize showrooming segments. Furthermore, demographic and psychographic variables differ
between these segments.
2.2.3 Psychographic dimensions in showrooming contexts – a conceptual framework
Following the arguments presented in section 2.2.2, we assume that showrooming segments differ
in several psychographic variables, especially as customer characteristics have an essential impact
on channel switching behavior (see Konuş et al., 2008; Verhoef, Kannan, & Inman, 2015). Based
on multidimensional value conceptualizations (Sweeney & Soutar, 2001), we selected psychograph-
ic variables related to economic, social and emotional benefits. These variables can potentially ex-
plain the value of loyal vs. disloyal showrooming behavior. We develop hypotheses with a focus on
retailer loyalty, because this showrooming factor is highly important for retailer performance.
The probably most important context-relevant customer characteristic is price consciousness, which
is “the degree to which the consumer focuses exclusively on paying low prices” (Lichtenstein,
Ridgway, & Netemeyer, 1993, p. 235). Price consciousness is an important differentiating factor in
customer segmentation studies and related to economic benefits of shopping. Morschett, Swoboda,
and Foscht (2005) identify customer segments based on shopping motives, including price orienta-
tion. They found that price-focused segments prefer cheaper discounters. Compared to the offline
channel, the online channel is often cheaper, so we could imagine a similar pattern for showroom-
ers. Gensler et al. (2017) found out that customers’ perception of higher price dispersion and lower
average prices online increases competitive showrooming. Accordingly, price-conscious segments
should show increased competitive vs. loyal showrooming behavior. Moreover, existing studies
examining online shoppers (Brown et al., 2003; Ganesh et al., 2010) and multi-channel shoppers
(Konuş et al., 2008) also find that price consciousness differs significantly across customer seg-
ments. Furthermore, the price itself is a relevant channel attribute explaining channel choice
(Balasubramanian et al., 2005) and channel-switching behavior, namely research shopping and free-
riding (Kucuk & Maddux, 2010; Verhoef et al., 2007). Although high price consciousness can
Showrooming forms and segments
17
stimulate showrooming, customers can also showroom for other reasons than price (e.g. rethink the
decision before purchasing, further information search, convenient delivery, etc.). We therefore
assume that price consciousness differs between showrooming segments. In particular, we expect
less loyal showrooming segments to be more price conscious than loyal showrooming segments.
H12: Showrooming segments with lower retailer loyalty have a higher level of price consciousness
than showrooming segments with higher retailer loyalty.
Another customer characteristic that could differ across showrooming segments is desire for social
contact. This characteristic is related to social benefits of shopping. Recent literature suggests that a
personalized service experience still has an important role in the shopping process (Balasubramani-
an et al., 2005; Brown et al., 2003). Rohm and Swaminathan (2004) argue that especially store-
oriented shoppers have a distinct desire for social contact. Hence, customers who value the social
benefit of physical stores should have a stronger tendency for loyal vs. competitive showrooming
behavior. However, Koenigstorfer and Groeppel-Klein (2012) also found that the lower the desire
for social contact, the more likely people use a mobile device in-store, which is an important indica-
tor of competitive showrooming behavior (Rapp et al., 2015). Taken together, the results of previ-
ous studies lead to the conclusion that at least some showrooming segments have a limited need for
social interaction and likely switch retailers. However, a desire for social contact could also explain
showrooming behavior, as customers can socially interact while searching for information and
benefit from advantages of purchasing online. Therefore, we also expect segments with a higher
desire for social interaction and retailer loyalty. We hypothesize:
H2: Showrooming segments with lower retailer loyalty have a lower level of a desire for social
contact than showrooming segments with higher retailer loyalty.
In the context of normative social influence, motivation to conform means public compliance,
which is a superficial change in behavior, not in one’s opinion (Stangor, Jhangiani, & Tarry, 2011).
It also relates to social aspects of shopping value. It further affects channel choice (Verhoef et al.,
2007) and the channel-switching intention (Pookulangara et al., 2011). Hence, “individuals attempt
to fit in with perceived opinions of relevant others due to the use of shopping via channel migra-
tion” (Pookulangara et al., 2011, p. 196). When analyzing motivation to conform in the context of
showrooming, it is necessary to define those “relevant others”. Depending on the individual shop-
per, other customers in the store, shopping companions or the sales personnel itself can be relevant.
Conformity with sales personnel could, for example reduce showrooming, while a motivation to
2 Due to the study’s highly explorative character and a lack of prior research on showrooming segments, we formulate
hypotheses on a rather general level to compare different expected showrooming segments.

Showrooming forms and segments
18
conform to thrifty family members or deal searching friends might stimulate showrooming. There-
fore, we assume different levels of this influencing factor between showrooming segments.
Regarding loyalty, in particular a low motivation to conform with the sales personnel might reduce
psychological restraints of competitive showrooming and thus stimulate disloyal behavior. We hy-
pothesize:
H3: Showrooming segments with lower retailer loyalty have a lower level of motivation to con-
form than showrooming segments with higher retailer loyalty.
Finally, a feeling of guilt or a bad conscience is an important emotion in the context of customers’
choices. It relates to the emotional dimension of shopping value. Anchored in exchange theory, us-
ing services and sales staff in the offline channel but buying somewhere else contradicts the ex-
pected balance in exchanges (Homans, 1958). Furthermore, different studies reflect the importance
of guilt in consumption situations (Antonetti & Maklan, 2014; Steenhaut & Van Kenhove, 2006;
Zielke, 2011). Especially in a multi-channel environment, customers try to justify their channel-
switching behavior (Chiou et al., 2012) that results from bad conscience. A strong tendency of
having a bad conscience might in particular attenuate showrooming behavior in which customers
switch the channel and the retailer, but not behavior in which customers only switch channels of the
same retailer. Therefore, we suppose:
H4: Showrooming segments with lower retailer loyalty have a lower level of bad conscience
during showrooming than showrooming segments with higher retailer loyalty.
The psychographic variables discussed before can either motivate or attenuate showrooming
behavior. However, their relevance and impact might differ between customer segments. Therefore,
this paper aims to show how different showrooming segments differ in terms of price conscious-
ness, desire for social contact, motivation to conform and bad conscience related to showrooming.
Our literature analysis shows that psychographic variables can act as antecedents of showrooming
factors and especially explain loyal vs. competitive showrooming behavior. Figure 4 summarizes
the suggested conceptual framework.
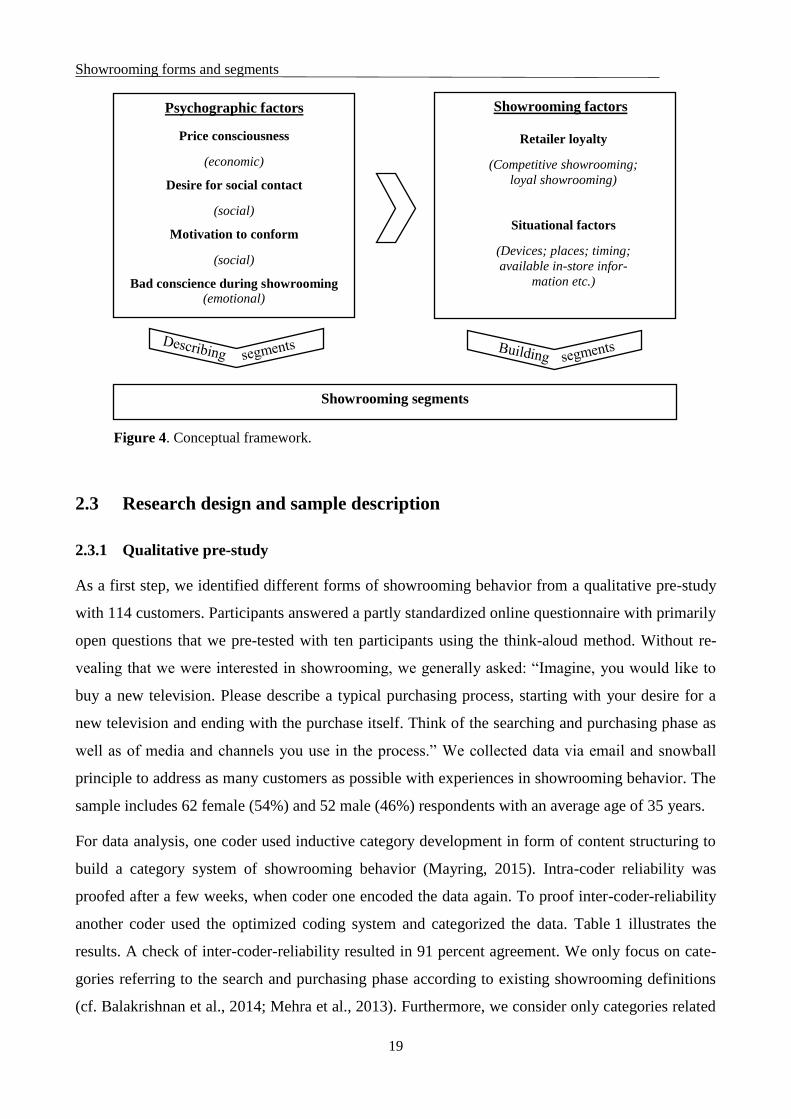
Showrooming forms and segments
19
2.3 Research design and sample description
2.3.1 Qualitative pre-study
As a first step, we identified different forms of showrooming behavior from a qualitative pre-study
with 114 customers. Participants answered a partly standardized online questionnaire with primarily
open questions that we pre-tested with ten participants using the think-aloud method. Without re-
vealing that we were interested in showrooming, we generally asked: “Imagine, you would like to
buy a new television. Please describe a typical purchasing process, starting with your desire for a
new television and ending with the purchase itself. Think of the searching and purchasing phase as
well as of media and channels you use in the process.” We collected data via email and snowball
principle to address as many customers as possible with experiences in showrooming behavior. The
sample includes 62 female (54%) and 52 male (46%) respondents with an average age of 35 years.
For data analysis, one coder used inductive category development in form of content structuring to
build a category system of showrooming behavior (Mayring, 2015). Intra-coder reliability was
proofed after a few weeks, when coder one encoded the data again. To proof inter-coder-reliability
another coder used the optimized coding system and categorized the data. Table 1 illustrates the
results. A check of inter-coder-reliability resulted in 91 percent agreement. We only focus on cate-
gories referring to the search and purchasing phase according to existing showrooming definitions
(cf. Balakrishnan et al., 2014; Mehra et al., 2013). Furthermore, we consider only categories related
Psychographic factors
Price consciousness
(economic)
Desire for social contact
(social)
Motivation to conform
(social)
Bad conscience during showrooming
(emotional)
Retailer loyalty
(Competitive showrooming;
loyal showrooming)
Situational factors
(Devices; places; timing;
available in-store infor-
mation etc.)
Showrooming factors
Showrooming segments
Figure 4. Conceptual framework.

Showrooming forms and segments
20
to observable showrooming behavior, not psychographic variables, such as buying motivations or
shopping motives. Table 1 shows the final coding system and how frequently both coders assigned
the codes to the particular categories. Respondents most frequently mentioned options for infor-
mation searching in-store before purchase and the selection of purchase channel and retailer. How-
ever, they also mentioned devices and aspects related to the place and time of purchase (category
“after visiting the offline channel”).
Table 1. Category system of explorative pre-study.
Main category Subcategories Coder
1
Coder
2
Device Searching / buying via smartphone 19 16
Searching / buying via laptop 6 6
Searching / buying via computer 5 5
Searching / buying via tablet 2 3
Selection of
purchase channel
and retailer
(Probably) buying offline 45 45
Buying from retailer with best
price (online / offline)
28 24
Buying offline, if excellent price-
performance-ratio
17 23
(Probably) buying online 14 16
Buying online up to an individual
price level
14 16
Buying the best offer (online /
offline)
13 14
Options for
information
in-store before
purchase
Advice given by sales staff 104 105
Looking at product in-store 85 94
Advice given by friends / family /
partner / colleague
27 27
Testing the product 7 9
Touching the product 2 2
Taking photos 1 2
Additional in-
formation
channels
Different store/s 26 26
Print media 20 18
After visiting the
offline channel
Searching online from home 23 17
Immediate / fast purchase online 15 16
Purchase after some days 4 4
Note: absolute figures; n = 114.
Based on the results presented in Table 1, a group discussion with 14 participants confirmed the
completeness of the general framework and evaluated the category system considering practical
application. As a result we derived five factor groups of showrooming behavior: device used for
purchase, options for information in-store before purchase, place of purchase, time of purchase and
retailer for purchase.
Showrooming forms and segments
21
2.3.2 Main study
Based on the results of the pre-study, we developed an online questionnaire. Its objectives were the
measurement of different characterizing forms of showrooming behavior and the identification of
showrooming clusters. Two questions measuring channel usage were used to identify potential
showroomers in general: Imagine the purchase of (specific product). (1) What is the probability for
purchasing the product via the online channel? (2) What is the probability for informing yourself
about (the specific product) in the offline channel before the purchase? We identified potential
showroomers as respondents using the store for information search about a product and the online
channel for buying the product. Customers rating both questions with four or more on a seven-point
Likert-Scale were defined as potential showroomers. We used this indirect approach to include as
many customers as possible who could at least imagine showrooming behavior; in other words,
customers who potentially use these channels. Concerning our identified forms of showrooming, the
questions in the main section addressed sources of information search in-store, devices used for
purchasing, the place and time of purchasing and retailer loyalty or switching, measured on seven-
point Likert-scales. To gather information on the device used for purchase the question was e.g.,
“You have indicated that you potentially buy the respective product on the internet. What is the
probability of using one of the following devices for the purchase?” Table 2 (left part) provides a
complete list of items.
Respondents answered the questions on showrooming behavior and channel usage with regard to
one of four randomly assigned product groups: game console, MP3 player, electronic toothbrush or
washing machine. The product groups represent different price levels and functional-hedonic orien-
tation (Shen, Cai, & Guo, 2016) to vary in showrooming situations and strengthen extern validity,
as showrooming is a category-specific phenomenon. We chose electronic products because elec-
tronics was by far the most frequently mentioned showrooming category in our qualitative pre-
study.
For further characterizing the segments, we also measured the previously mentioned psychographic
variables (e.g. price consciousness – later called profiling factors), a variable measuring general
showrooming propensity and demographics. We used proven scales from the literature. Using
AMOS 25, a confirmatory factor analysis with all construct measures yielded a good model fit con-
cerning standard cut-off values according to Hu and Bentler (1999): χ2 = 413.65 (df = 142,
p < .001), SRMR =.05, RMSEA = .06, NFI = .93, TLI = .94 and CFI = .95 (although the RMSEA
value was slightly over the respective threshold of .05). Results corroborated the one-dimensionality
of all constructs. Factor reliability scores of all constructs were above .6 (Bagozzi & Yi, 1988).
Showrooming forms and segments
22
Values for average variance extracted (AVE) ranged from .53 to .72 and were above squared corre-
lations of all constructs (.00 to .35), indicating discriminant validity (Fornell & Larcker, 1981). Fur-
thermore, constructs show good levels of reliability (α = .80 to .91; Nunnally, 1978). Appendix A
provides all item scales used for measuring psychographic variables along with information about
sources, the results of reliability measures, lambda loadings and values for AVE of the confirmatory
factor analysis.
The online survey was posted for a four-week period in spring 2016. We pretested the questionnaire
using thinking-aloud method with 20 participants of a master’s degree course from a large European
university. We distributed a link to the online survey via snowball principle, starting with personal
contacts of the aforementioned master students. We distributed the link and an associated password
to the online survey using social media and email. We used quotas for age and gender to guarantee
the representativeness of the sample. In total, 564 people participated in the online study. The aver-
age age was 34 years and 51% were female.

Showrooming forms and segments
23
Ta
ble
2.
Ch
arac
teri
zin
g f
orm
s, s
ho
wro
om
ing
beh
avio
r q
ues
tio
ns
and
ch
arac
teri
zin
g f
acto
rs d
ue
to m
ult
iple
fac
tor
anal
yse
s (n
= 3
32
).
Ch
ara
ct.
fact
ors
F1
: M
edia
ted
in
form
atio
n s
earc
hin
g i
n-s
tore
bef
ore
pu
rch
ase
F2
: P
erso
nal
in
form
atio
n s
earc
hin
g i
n-s
tore
bef
ore
pu
rch
ase
F3
: M
obil
e in
form
atio
n s
earc
hin
g i
n-s
tore
bef
ore
pu
rch
ase
F4
: S
tati
on
ary
dev
ices
fo
r p
urc
has
e
F5
: M
obil
e d
evic
es f
or
pu
rch
ase
F6
: M
obil
e p
lace
of
pu
rch
ase
F7
:H
om
e p
urc
has
e
F8
: P
rom
pt
pu
rch
ase
F9
: M
ean t
ime
pu
rch
ase
F1
0:
Lat
e ti
me
pu
rch
ase
F1
1:
Oth
er r
etai
ler
for
pu
rch
ase
F1
2:
Sam
e re
tail
er f
or
pu
rch
ase
*E
xam
ple
fo
r co
mp
lete
qu
esti
on
: “
Wha
t is
th
e p
roba
bil
ity
of
usi
ng t
he
foll
ow
ing
opti
on
s fo
r in
form
ati
on
in
-sto
re?
" /
**
Con
ten
t-b
ased
cla
ssif
icat
ion
in
to t
wo
fac
tors
.
F3
.893
F1
0
.904
.863
F2
.645
.673
.753
.461
F5
.795
.794
F7
‒.7
61
F9
.899
.641
F1
.857
.638
.823
F4
.759
‒.7
52
F6
.860
.592
.855
F8
.882
.677
F1
1
.832
‒.8
32*
*
Sh
ow
roo
min
g b
ehav
ior
qu
esti
on
s*
Dis
pla
yed
bro
chu
res/
cata
log
ues
in
-sto
re
Ele
ctro
nic
al t
erm
inal
Ban
ner
/ad
s et
c. i
n-s
tore
Peo
ple
who
acc
om
pan
y y
ou o
n y
ou
r sh
op
pin
g t
rip
Pri
ce l
abel
ling
and
pro
du
ct i
nfo
rmat
ion
on
th
e p
rodu
ct
Wat
chin
g,
tou
chin
g a
nd t
ryin
g p
rod
uct
s
Sal
es s
taff
Sea
rch
ing
via
ow
n s
mar
tpho
ne
(QR
co
des
, in
tern
et e
tc.)
Lap
top
Des
kto
p c
om
pu
ter
Sm
artp
hon
e
Tab
let
In-s
tore
via
sm
artp
hon
e
In a
n i
nte
rnet
caf
é
On
th
e w
ay o
uts
ide
the
sto
re
Fro
m h
om
e
Imm
edia
te p
urc
has
e in
-sto
re
Les
s th
an 2
ho
urs
aft
er l
eav
ing t
he
sto
re
Les
s th
an 1
2 h
ou
rs a
fter
lea
vin
g t
he
sto
re
Les
s th
an 2
4 h
ou
rs a
fter
lea
vin
g t
he
sto
re
Les
s th
an 4
8 h
ou
rs a
fter
lea
vin
g t
he
sto
re
48
or
mo
re h
ou
rs a
fter
lea
vin
g t
he
sto
re
Pu
rch
ase
fro
m a
dif
fere
nt
reta
iler
Pu
rch
ase
fro
m t
he
sam
e re
tail
er
Ch
ara
ct.
form
s
Op
tion
s fo
r
info
rmat
ion
in-s
tore
bef
ore
pu
rch
ase
Dev
ice
use
d
for
pu
rch
ase
Pla
ce o
f
pu
rch
ase
Tim
e o
f
pu
rch
ase
Ret
aile
r fo
r
pu
rch
ase

Showrooming forms and segments
24
2.4 Analysis and results
2.4.1 Potential showroomers and characterizing factors
In accordance with other segmentation studies, we conducted factor analysis and a subsequent clus-
tering (Frasquet et al., 2015; Ganesh et al., 2010; Rohm & Swaminathan, 2004). In a first step, the
sample was filtered to identify only potential showroomers according to our previous definition and
operationalization. In total, 332 participants could be characterized as potential showroomers. This
pre-definition tallies with the results of a specially developed multi-item question measuring show-
rooming propensity more directly (see Appendix A).
The detailed questions about showrooming behavior were analyzed using exploratory factor
analyses with principal component analysis (PCA) and varimax rotation separately for each of the
five main characterizing forms of showrooming. We used these separate exploratory factor analyses
only to reduce and summarize data within the five main forms. Therefore, we maintained our con-
tent-based characterizing forms identified in the pre-study. Table 2 shows how the five main factor
groups are now subdivided into two to three characterizing factors. For example, options for infor-
mation instore before purchase are subdivided in mediated (F1), personal (F2) and mobile instore
information search (F3). Devices used for purchase can be stationary (F4) or mobile (F5). Regard-
ing the place of purchase, customers can order mobile out of home (F6) or from home (F7). The
time lag between visiting the store and purchasing can be small (F8), medium (F9) or large (F10).
Finally, customers can purchase from a different (F11) or from the same retailer (F12). In total, the
analysis yielded twelve characterizing factors. The Kaiser-Meyer-Olkin (KMO) measure of
sampling adequacy was between .50 and .68. Thus, the values are above the minimum score of .5,
which is considered necessary for using factor analysis.
2.4.2 Cluster analyses
In a subsequent step, a hierarchical cluster analysis identified customer segments based on the
twelve characterizing factors resulting from the factor analyses. We used single-linkage clustering
to identify possible outliers and for the main analysis Ward’s minimum variance model and squared
Euclidean distance as proximity measures (Punj & Stewart, 1983; Ward, 1963). Considering the
dendrogram, the line plot of the coefficients of the cluster agglomeration steps and the feasibility of
the cluster number, a four-cluster solution seemed appropriate. Although the elbow-criteria of the
dendrogram also justified a three-cluster solution, we decided to use a four-cluster solution because
of content-related issues. Since statistical tests justified both solutions, the four-cluster solution en-
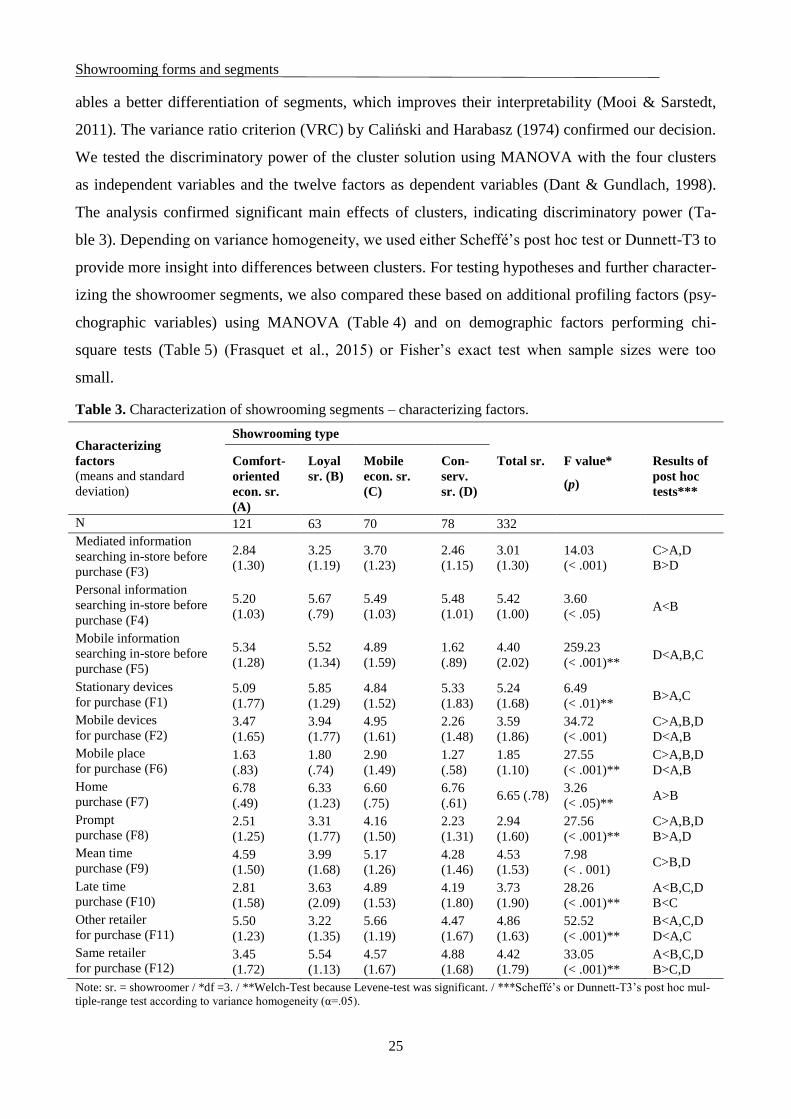
Showrooming forms and segments
25
ables a better differentiation of segments, which improves their interpretability (Mooi & Sarstedt,
2011). The variance ratio criterion (VRC) by Caliński and Harabasz (1974) confirmed our decision.
We tested the discriminatory power of the cluster solution using MANOVA with the four clusters
as independent variables and the twelve factors as dependent variables (Dant & Gundlach, 1998).
The analysis confirmed significant main effects of clusters, indicating discriminatory power (Ta-
ble 3). Depending on variance homogeneity, we used either Scheffé’s post hoc test or Dunnett-T3 to
provide more insight into differences between clusters. For testing hypotheses and further character-
izing the showroomer segments, we also compared these based on additional profiling factors (psy-
chographic variables) using MANOVA (Table 4) and on demographic factors performing chi-
square tests (Table 5) (Frasquet et al., 2015) or Fisher’s exact test when sample sizes were too
small.
Table 3. Characterization of showrooming segments – characterizing factors.
Characterizing
factors
(means and standard
deviation)
Showrooming type
Comfort-
oriented
econ. sr.
(A)
Loyal
sr. (B)
Mobile
econ. sr.
(C)
Con-
serv.
sr. (D)
Total sr. F value*
(p)
Results of
post hoc
tests***
N 121 63 70 78 332
Mediated information
searching in-store before
purchase (F3)
2.84
(1.30)
3.25
(1.19)
3.70
(1.23)
2.46
(1.15)
3.01
(1.30)
14.03
(< .001)
C>A,D
B>D
Personal information
searching in-store before
purchase (F4)
5.20
(1.03)
5.67
(.79)
5.49
(1.03)
5.48
(1.01)
5.42
(1.00)
3.60
(< .05) A<B
Mobile information
searching in-store before
purchase (F5)
5.34
(1.28)
5.52
(1.34)
4.89
(1.59)
1.62
(.89)
4.40
(2.02)
259.23
(< .001)** D<A,B,C
Stationary devices
for purchase (F1) 5.09
(1.77)
5.85
(1.29)
4.84
(1.52)
5.33
(1.83)
5.24
(1.68)
6.49
(< .01)** B>A,C
Mobile devices
for purchase (F2) 3.47
(1.65)
3.94
(1.77)
4.95
(1.61)
2.26
(1.48)
3.59
(1.86)
34.72
(< .001)
C>A,B,D
D<A,B
Mobile place
for purchase (F6) 1.63
(.83)
1.80
(.74)
2.90
(1.49)
1.27
(.58)
1.85
(1.10)
27.55
(< .001)**
C>A,B,D
D<A,B
Home
purchase (F7) 6.78
(.49)
6.33
(1.23)
6.60
(.75)
6.76
(.61) 6.65 (.78)
3.26
(< .05)** A>B
Prompt
purchase (F8) 2.51
(1.25)
3.31
(1.77)
4.16
(1.50)
2.23
(1.31)
2.94
(1.60)
27.56
(< .001)**
C>A,B,D
B>A,D
Mean time
purchase (F9) 4.59
(1.50)
3.99
(1.68)
5.17
(1.26)
4.28
(1.46)
4.53
(1.53)
7.98
(< . 001) C>B,D
Late time
purchase (F10) 2.81
(1.58)
3.63
(2.09)
4.89
(1.53)
4.19
(1.80)
3.73
(1.90)
28.26
(< .001)**
A<B,C,D
B<C
Other retailer
for purchase (F11) 5.50
(1.23)
3.22
(1.35)
5.66
(1.19)
4.47
(1.67)
4.86
(1.63)
52.52
(< .001)**
B<A,C,D
D<A,C
Same retailer
for purchase (F12) 3.45
(1.72)
5.54
(1.13)
4.57
(1.67)
4.88
(1.68)
4.42
(1.79)
33.05
(< .001)**
A<B,C,D
B>C,D
Note: sr. = showroomer / *df =3. / **Welch-Test because Levene-test was significant. / ***Scheffé’s or Dunnett-T3’s post hoc mul-
tiple-range test according to variance homogeneity (α=.05).

Showrooming forms and segments
26
Table 4. Characterization of showrooming segments – profiling factors.
Profiling factors
(means and standard
deviation)
Showrooming type
Comfort-
oriented
econ. sr.
(A)
Loyal
sr.
(B)
Mobile
econ.
sr.
(C)
Con-
serv.
sr.
(D)
Total
sr.
F value*
(p)
Results
of post
hoc
tests***
Non sr.
n 121 63 70 78 332 232
Price consciousness 5.42
(1.16)
4.85
(1.40)
5.51
(1.12)
4.91
(1.30)
5.21
(1.26)
5.95
(< .01)
A>B,D
C>B,D
4.80
(1.45)
Desire for social con-
tact
4.13
(1.48)
4.59
(1.48)
4.01
(1.56)
4.87
(1.57)
4.36
(1.55)
5.52
(< .01) D>A,C
4.68
(1.77)
Motivation to conform 3.13
(1.46)
3.02
(1.24)
3.61
(1.40)
2.96
(1.25)
3.17
(1.37)
3.31
(< .05) C>D
2.88
(1.28)
Bad conscience during
showrooming 3.08
(1.65)
3.79
(1.69)
2.83
(1.44)
3.71
(1.94)
3.31
(1.73)
5.95
(< .01)**
B>A,C
C<D
3.66
(1.92)
Channel usefulness:
Store 5.78
(1.29)
5.92
(.97)
5.91
(1.24)
6.24
(.97)
5.94
(1.16)
3.04
(< .05)**
A<D
4.08
(1.71)
Channel usefulness:
(mobile) internet
6.60
(.64)
6.30
(.94) 6.63
(.73)
6.10
(1.16)
6.43
(.89)
5.66
(< .01)** D<A,C
5.18
(1.76)
Note: sr. = showroomer / *df =3. / **Welch-Test because Levene-test was significant. / ***Scheffé’s or Dunnett-T3’s post hoc
multiple-range test according to variance homogeneity (α=.05).
Table 5. Demographic factors of showrooming segments.
Showrooming type
Demographic factors
(absolute figures)
Comfort-
oriented
econ. sr.
(A)
Loyal
sr.
(B)
Mobile
econ. sr.
(C)
Conserv.
sr.
(D)
Chi²
(p)
Total
sr.
Non
sr.
Chi²
(p)
N 121 63 70 78 332 232
Gender
Female 60 40 35 48 5.32
(.150)
183 107 4.43
(.035) Male 61 23 35 30 149 125
Age
Ø 32 32 27 35
160.70
(.260) 32 37
78.12
(.022)
Level of education
High school 111 53 64 73 Too many
cells less
than or
equal 5 >
value not
calculated
301 200 6.04
(.196) /
Fisher’s
exact test
5.56
(.223)
Low level education 4 3 0 4 11 16
Fulltime student 1 1 1 0 3 0
Other 5 3 4 1 13 8
No answer 0 3 1 0 4 2
Marital status
Married 36 16 7 21 11.71
(.069) /
Fisher’s
exact test
12.49
(.037)
80 79 8.67
(.013) Single/
divorced/widowed 82 46 59 55 242 145
No answer 3 1 4 2 10 3
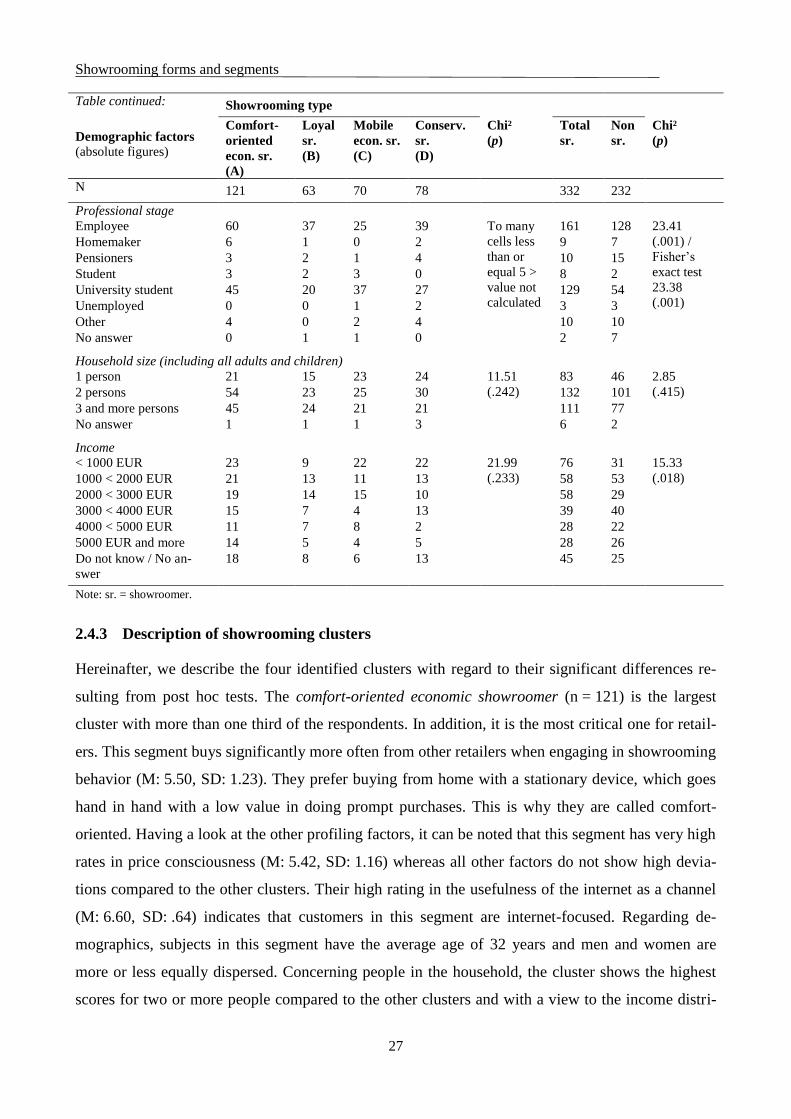
Showrooming forms and segments
27
Table continued: Showrooming type
Demographic factors
(absolute figures)
Comfort-
oriented
econ. sr.
(A)
Loyal
sr.
(B)
Mobile
econ. sr.
(C)
Conserv.
sr.
(D)
Chi²
(p)
Total
sr.
Non
sr.
Chi²
(p)
N 121 63 70 78 332 232
Professional stage
Employee 60 37 25 39 To many
cells less
than or
equal 5 >
value not
calculated
161 128 23.41
(.001) /
Fisher’s
exact test
23.38
(.001)
Homemaker 6 1 0 2 9 7
Pensioners 3 2 1 4 10 15
Student 3 2 3 0 8 2
University student 45 20 37 27 129 54
Unemployed 0 0 1 2 3 3
Other 4 0 2 4 10 10
No answer 0 1 1 0 2 7
Household size (including all adults and children)
1 person 21 15 23 24 11.51
(.242)
83 46 2.85
(.415) 2 persons 54 23 25 30 132 101
3 and more persons 45 24 21 21 111 77
No answer 1 1 1 3 6 2
Income
< 1000 EUR 23 9 22 22 21.99
(.233)
76 31 15.33
(.018) 1000 < 2000 EUR 21 13 11 13 58 53
2000 < 3000 EUR 19 14 15 10 58 29
3000 < 4000 EUR 15 7 4 13 39 40
4000 < 5000 EUR 11 7 8 2 28 22
5000 EUR and more 14 5 4 5 28 26
Do not know / No an-
swer
18 8 6 13 45 25
Note: sr. = showroomer.
2.4.3 Description of showrooming clusters
Hereinafter, we describe the four identified clusters with regard to their significant differences re-
sulting from post hoc tests. The comfort-oriented economic showroomer (n = 121) is the largest
cluster with more than one third of the respondents. In addition, it is the most critical one for retail-
ers. This segment buys significantly more often from other retailers when engaging in showrooming
behavior (M: 5.50, SD: 1.23). They prefer buying from home with a stationary device, which goes
hand in hand with a low value in doing prompt purchases. This is why they are called comfort-
oriented. Having a look at the other profiling factors, it can be noted that this segment has very high
rates in price consciousness (M: 5.42, SD: 1.16) whereas all other factors do not show high devia-
tions compared to the other clusters. Their high rating in the usefulness of the internet as a channel
(M: 6.60, SD: .64) indicates that customers in this segment are internet-focused. Regarding de-
mographics, subjects in this segment have the average age of 32 years and men and women are
more or less equally dispersed. Concerning people in the household, the cluster shows the highest
scores for two or more people compared to the other clusters and with a view to the income distri-

Showrooming forms and segments
28
bution of the clusters the comfort-oriented economic showroomers are better represented in the up-
per half. All in all, not having unique characteristics makes it a critical segment for retailers.
For the loyal showroomer cluster (n = 63), subjects show significant values in terms of changing
and sticking with one retailer when switching from an offline to an online channel. They reveal the
highest degree of sticking with one retailer (M: 5.54, SD: 1.13) and the lowest changing compared
to the other segments (M: 3.22, SD: 1.35). Hence, sticking with one retailer or not seems to be a
very important characteristic in the context of showrooming. Loyal showroomers use stationary
devices to purchase but mobile devices to get information in the store more often than other seg-
ments. They also show the highest score for personal information searching in the store (M: 5.67,
SD: .79). Consistent with a high desire for social contact, their higher level in bad conscience
during showrooming shows the normative influence. All other profiling variables are not remarka-
ble. The only notable demographic attribute is that female customers are represented more often in
this cluster.
The mobile economic showroomer (n = 70) is predominantly driven by mobile devices. Compared
to the other segments, these customers show the highest values in purchasing via mobile devices
(M: 4.95, SD: 1.61 vs. M: 3.59, SD: 1.86) and using a mobile place for purchase (M: 2.90, SD: 1.49
vs. M: 1.85, SD: 1.10). In general, scores of most variables are in the upper range. This also in-
cludes the highest score in changing the retailer in the stage of purchase (M: 5.66, SD: 1.19). Con-
cerning demographics, the mobile economic showroomer is younger than other showroomers with
an average age of 27 years. Subjects are above average university students, single, living in single-
person households and cover all income groups.
Finally, conservative showroomers (n = 78) show low scores in all showrooming factors which are
related to mobile devices. Therefore, it is not surprising that they also use a smartphone in-store to a
far lower extent than other clusters. These customers primarily use stationary devices (M: 5.33,
SD: 1.83) at home (M: 6.76, SD: .61) to purchase products on the internet. Furthermore, in contrast
to the comfort-oriented economic showroomer, they have a stronger tendency to stick with the re-
tailer (M: 4.88, SD: 1.68 vs. M: 3.45, SD: 1.72) and a lower tendency of switching the retailer
(M: 4.47, SD: 1.67 vs. M: 5.50, SD: 1.23). Looking at the profiling variables, conservative show-
roomers have significantly higher scores in the desire for social contact (M: 4.87, SD: 1.57). The
score for bad conscience during showrooming is above average as well as the evaluation of the use-
fulness of the stationary channel in general. However, price consciousness is below average and the
motivation to conform shows even the lowest score. The conservative showroomer is older than the
average (35 years), mostly female and shows an income in the lower half of the distribution.

Showrooming forms and segments
29
A further analysis of product groups (game consoles, MP3 players, electric toothbrushes and wash-
ing machines) revealed no significant effect on the cluster distribution. Therefore, our results sug-
gest that all showrooming types exist in all considered product groups.
2.4.4 Comparison of showrooming segments concerning psychographic dimensions
Before testing the hypotheses, we have to define loyal vs. competitive showrooming segments. Two
factors relate to retailer loyalty, namely factor 11 “other retailer for purchase” and factor 12 “same
retailer for purchase” (cf. Table 2). Comparing mean values of both factors between segments,
“other retailer for purchase” shows the highest scores for the mobile economic and comfort-oriented
economic segment, whereas the loyal and the conservative segments score highest for “same retailer
for purchase”. Loyal showroomers are the most retailer loyal segment, followed by conservative
showroomers, mobile economic showroomers and finally comfort-oriented economic showroomers.
H1 suggests that segments with a low retailer loyalty show a higher level of price consciousness
compared to segments with a high retailer loyalty score. Accordingly, results show that comfort-
oriented economic showroomers (M: 5.42, SD: 1.16) and mobile economic showroomers (M: 5.51,
SD: 1.12) have a significantly higher price consciousness than conservative (M: 4.91, SD: 1.30) and
loyal showroomers (M: 4.85, SD: 1.40), supporting H1 (cf. Table 4). Regarding desire for social
contact, conservative showroomers have a significant higher mean value (M: 4.87, SD: 1.57) than
mobile economic (M: 4.01, SD: 1.56) and comfort-oriented economic showroomers (M: 4.13,
SD: 1.48). For the loyal segment, desire for social contact is close to the conservative segment
(M: 4.59, SD: 1.48) and larger compared to the other two segments, but these differences are not
significant. Nevertheless, the results can at least partly support H2. For motivation to conform, only
mobile economic showroomers (M: 3.61, SD: 1.40) show a significant higher mean value than con-
servative showroomers (M: 2.96, SD: 1.25). Hence, H3 finds no support. Finally, results indicate
that retailer loyal clusters show higher values in bad conscience during showrooming. Loyal show-
roomers (M: 3.79, SD: 1.69) show significant higher mean values than comfort-oriented economic
(M: 3.08, SD: 1.65) and mobile economic (M: 2.83, SD: 1.44) showroomers. Furthermore, the val-
ue for conservative showroomers (M: 3.71, SD: 1.94) is significantly higher compared to mobile
economic showroomers. These results support H4.
2.4.5 Additional analyses
Although we were mostly interested in differences in psychographic variables between showroom-
ing factors, we additionally analyzed the impact of psychographics on the general showrooming
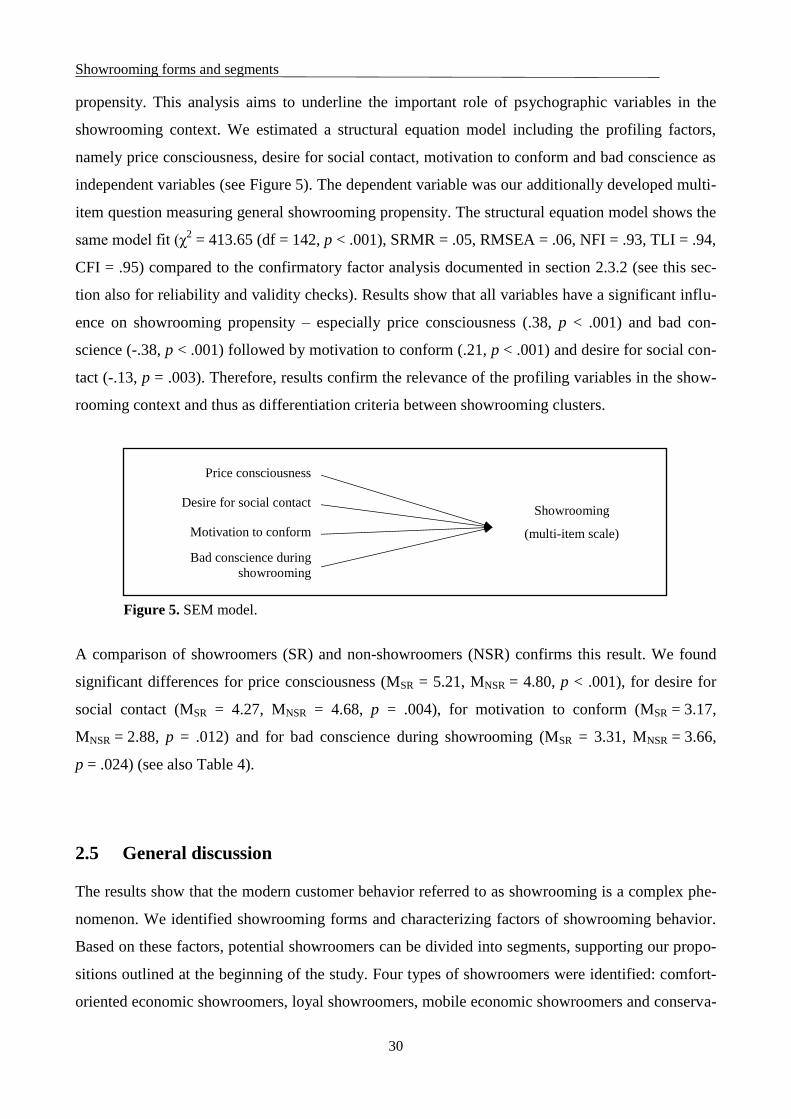
Showrooming forms and segments
30
propensity. This analysis aims to underline the important role of psychographic variables in the
showrooming context. We estimated a structural equation model including the profiling factors,
namely price consciousness, desire for social contact, motivation to conform and bad conscience as
independent variables (see Figure 5). The dependent variable was our additionally developed multi-
item question measuring general showrooming propensity. The structural equation model shows the
same model fit (χ2 = 413.65 (df = 142, p < .001), SRMR = .05, RMSEA = .06, NFI = .93, TLI = .94,
CFI = .95) compared to the confirmatory factor analysis documented in section 2.3.2 (see this sec-
tion also for reliability and validity checks). Results show that all variables have a significant influ-
ence on showrooming propensity – especially price consciousness (.38, p < .001) and bad con-
science (-.38, p < .001) followed by motivation to conform (.21, p < .001) and desire for social con-
tact (-.13, p = .003). Therefore, results confirm the relevance of the profiling variables in the show-
rooming context and thus as differentiation criteria between showrooming clusters.
A comparison of showroomers (SR) and non-showroomers (NSR) confirms this result. We found
significant differences for price consciousness (MSR = 5.21, MNSR = 4.80, p < .001), for desire for
social contact (MSR = 4.27, MNSR = 4.68, p = .004), for motivation to conform (MSR = 3.17,
MNSR = 2.88, p = .012) and for bad conscience during showrooming (MSR = 3.31, MNSR = 3.66,
p = .024) (see also Table 4).
2.5 General discussion
The results show that the modern customer behavior referred to as showrooming is a complex phe-
nomenon. We identified showrooming forms and characterizing factors of showrooming behavior.
Based on these factors, potential showroomers can be divided into segments, supporting our propo-
sitions outlined at the beginning of the study. Four types of showroomers were identified: comfort-
oriented economic showroomers, loyal showroomers, mobile economic showroomers and conserva-
Price consciousness
Desire for social contact
Motivation to conform
Showrooming
(multi-item scale)
Bad conscience during
showrooming
Figure 5. SEM model.

Showrooming forms and segments
31
tive showroomers. These segments differ not only in their type of showrooming but also in further
psychographic and demographic variables.
Some of the results are particularly relevant or surprising. Figures 6 and 7 illustrate the differences
in loyalty (same vs. other retailer) and place of purchase (mobile vs. home purchase) for the identi-
fied segments (mean values on a seven-point scale). The segment of loyal showroomers underlines,
for example, that a substantial proportion of showroomers switch channels, but not retailers. The
conservative showroomer shows also a slightly higher value for sticking with the retailer while
switching channels. Although the mobile showroomer shows some tendency to stick with the retail-
er, it has the highest score for purchasing at a competitor. Furthermore, the largest segment of com-
fort-oriented economic showroomers has a high score for changing retailers and channels and the
lowest loyalty score. This most problematic segment, however, prefers purchasing at home using
stationary devices. Hence, retailers cannot identify problematic showroomers for certain by
observing in-store mobile phone usage.
Comfort-oriented
economic
showroomer
Loyal
showroomer
Mobile economic
showroomer
Conservative
showroomer
Total
showroomer
2
3
4
5
6
7
2 3 3 4 4 5 5 6 6 7 7Sa
me
reta
iler
fo
r p
urc
ha
se
Other retailer for purchase
Note: All items were measured on a seven-point scale (1 = “I do not agree at all” and 7 = “I totally agree”).
Figure 6. Preferred retailer for purchase across showrooming segments (same vs. other
retailer).

Showrooming forms and segments
32
tally agree’).
This paper contributes to the literature in different ways. Firstly, it extends our understanding of
showrooming by suggesting factor groups and factors characterizing different forms of showroom-
ing. So far, the literature has discussed showrooming as a one-dimensional behavior only. Secondly,
it draws attention to the fact that showrooming is not always negative, in particular when customers
remain loyal to the retailer while switching channels. Thirdly, the paper provides a first typology of
showrooming clusters that has not existed in the literature so far. Fourthly, we are able to describe
these clusters with psychographic and demographic variables. Fifthly, we show that psychographics
related to economic, social and emotional shopping value differ between loyal vs. competitive
showrooming segments.
2.6 Management implications
Regarding management implications, managers need to train their sales staff to identify different
showrooming customers. This can happen based on obvious demographical issues as well as in con-
sideration of attitudinal preferences, which have to be figured out in a personal conversation or by
means of customer observations at the point-of-sale. Having noticed potential showroomers, the
sales staff needs to behave in a certain way to prevent competitive showrooming. Since loyal show-
roomers are the most desirable segment, retailers can benefit from this showrooming group by help-
ing them in-store and providing incentives for buying online in their own shop. Especially new
technologies such as beacons or apps can help them to find their way in-store or find product
Comfort-oriented
economic
showroomer
Loyal
showroomer
Mobile economic
showroomer
Conservative
showroomer
Total
showroomer
0
1
2
3
4
5 6 7
Mo
bil
e p
lace
fo
r p
urc
ha
se
Home purchase
Note: All items were measured on a seven-point scale (1 = “I do not agree at all” and 7 = “I totally agree”).
Figure 7. Preferred place for purchase across showrooming segments (mobile vs. home
purchase).
Showrooming forms and segments
33
specific information (availability, colors, etc.) more easily. Furthermore, retailers can use reminder
e-mails or mobile push messages when customers were identified by using customer cards or bea-
con apps when searching for information in-store.
For the conservative segment, retailers seem to have a good chance of keeping customers in their
own channels by means of marketing communication. In contrast to the loyal showroomer, tech-
nical opportunities in the store do not reach this group, while personal contact with the sales staff
might be more effective. It is therefore important to train the sales staff, so they can inform this cus-
tomer group optimally about advantages of staying with the retailer. Furthermore, addressing their
bad conscience while showrooming, might prevent this segment from purchasing at other retailers.
Even the mobile economic showroomer indicated a tendency of being loyal to the retailer. As the
name suggests, mobile economic showroomers tend to use a broad range of different tools and op-
tions. The challenge for retailers lies in providing this segment with many different information
search opportunities (apps, homepage, TV spot, information in-store etc.), paying options (e.g. mo-
bile phone payment systems), etc. Retailers may in particular use mobile apps to support in-store
mobile search in their own channels. Taking the young age of this group into account, technical
innovation is an important feature for targeting. However, as price is also important, cross-channel
price promotion may work.
The most problematic segment, the comfort-oriented economic showroomer, does not purchase
immediately and with stationary devices. Here, retailers have a small time buffer before the
customer purchases at another retailer in the online channel. Price consciousness seems to be a pos-
sible starting point. Retailers can offer this segment price promotions or additional services to ac-
celerate the purchase decision. Bundle offers may make it more difficult to compare competitor
prices online (Rapp et al., 2015). Retailers may also consider offering price matching guarantees as
a signal that accelerates the purchase decision. Consequently, sales staff should motivate this cluster
to complete the purchase directly at the store because they are likely to switch retailers at home.
Hence, the segmentation approach shows potential starting points for retail managers to better ad-
dress different showrooming groups and keep them in their own channels.
2.7 Limitations and future research
A limitation of the study might be the focus on consumer electronics. Future research should ana-
lyze the importance of the identified segments for further product categories. Additionally, further
studies may also find other profiling factors and examine differences between showroomers and

Showrooming forms and segments
34
non-showroomers in more detail. Future studies may also consider the impact of further market
characteristics (e.g. variety of products available or level of retailer competition) on showrooming
forms. Another limitation might be the identification of potential showroomers, although a compari-
son of a general showrooming tendency between identified showroomers and non-showroomers
supports our approach. Furthermore, the definition of showrooming as a situational behavior im-
plies that showrooming segments are not stable. They might differ depending on situational factors,
e.g. the product category or shopping intentions. Further research needs to identify further
situational factors that require changes in showrooming segment categorization. Additionally, re-
search should also determine if and how different marketing actions affect showrooming segments
and their behavior. Thereby, studies can stress and manifest the managerial relevance of the differ-
entiation of showrooming clusters.

Showrooming potentials and showrooming behavior
35
3 Showrooming potentials and showrooming behavior
Abstract
Literature often defines showrooming as a behavior, in which customers search for infor-
mation at physical stores and then buy the product online (often at a competing retailer at a
lower price). However, research does usually not consider price and product information
search in online channels during and after store visits (showrooming potentials) that lead to
the online purchase. The authors therefore analyze relationships between four types of show-
rooming potentials and their impact on showrooming behavior. Based on qualitative data and
structural equation modeling, we find support that product information search stimulates price
search and in-store search stimulates later search. More precisely, the showrooming process
can start with mobile product information search stimulating mobile price search (i.e. price
search is not necessarily the starting point of showrooming). Mobile search in turn increases
later search, which has a considerably stronger impact on showrooming behavior, i.e. show-
rooming customers tend to postpone their purchase. A supplementary study underlines the
role of choice confusion and search convenience. Further, a scenario experiment shows how
QR codes provide an opportunity to influence information search and keep customers in re-
tailers’ own channels.
Co-author: Stephan Zielke (University of Wuppertal)
Showrooming potentials and showrooming behavior
36
3.1 Introduction
Emma is looking for a new winter jacket. She walks into a small and cozy store in the city center
that offers clothes of different brands. When she enters the store she touches and tries different
products. After a while she finds a jacket from the current collection that she really likes. Since
there is no sales staff to ask, she pulls out her smartphone to get to know what other customers think
about the jacket. In doing so, she comes across an online shop that offers the jacket for about 20%
less. She hangs the jacket away and leaves the store. Later in the day after checking the price again
she purchases it online. Noah needs a new TV. He drives to an electronics store and finds a TV that
fits his needs. As no sales personnel is available, Noah scans the QR code shown at the TV’s price
tag for obtaining further information. The code guides him to the store’s online shop where he reads
several positive reviews about the TV. Because of the positive reviews, Noah walks to the checkout
and buys it.
Both are typical examples of customer behavior nowadays. The first example illustrates the so-
called showrooming phenomenon in which customers search for information in-store and finish
their purchase online (Balakrishnan et al., 2014). In particular for traditional brick-and-mortar re-
tailers, showrooming is a serious issue. As a reaction, some even introduced service fees that they
refund when customers buy in their stores (Mehra et al., 2013). The examples also illustrate that the
online search for product and price information during and after store visits plays an important role
in the showrooming process. Quint et al. (2013) report that around half of their respondents use the
mobile internet in-store regularly to make price comparisons or to look for product information and
product evaluations. However, the second example also shows that a deeper understanding of the
online search that potentially precedes showrooming may help retailers to develop counter-
strategies.
After examining various channel combinations in customers’ shopping processes Flavián, Gurrea,
and Orús (2020) conclude that “however, real-world experiences may involve several interactions
across virtual and physical channels during the information search stage of the process. Future
studies might, thus, investigate the online-offline channel combination not only as a unidirectional
sequence (from online to offline, or from offline to online) but examine also the effects of varied
channel combinations“ (p. 8). Hence, customers’ purchase processes or journeys are complex. Pre-
vious research has not sufficiently considered this complexity, as it does not consider online search
behavior as a separate and inevitable stage of the showrooming process. Instead, typical showroom-
ing concepts focus on offline search behavior which in a next step leads to online purchases (Gens-
ler et al., 2017; Gu & Tayi, 2017). However, as the examples illustrate, after searching in-store at
Showrooming potentials and showrooming behavior
37
least two separate behaviors emerge in the online channel: First, search for information online and
secondly, the act of purchasing. Thus, research needs a new and more complex conceptualization of
the showrooming phenomenon. Therefore, the first objective of this study is to propose a new con-
ceptualization of showrooming, in which we add a differentiated understanding of online search
behavior. We define different forms of online search behavior as showrooming potentials and the
act of purchasing as showrooming behavior. This differentiation provides a better understanding of
the phenomenon and enables retailers to retain customers in their own channels.
The second objective addresses relationships between showrooming potentials. In the initial exam-
ple, Emma searches for information in different ways. She touches and feels the product, searches
product information online via her mobile device and thereby comes across a better price. The actu-
al purchasing behavior emerges later after leaving the store. This example illustrates that searching
for product information can lead customers to price information and thus results in showrooming
behavior, even in situations in which customers do not deliberately search for price information
online. It further shows that one part of the showrooming process happens in-store, while another
part can happen later after leaving. Based on research on goal hierarchies (Bettman, 1979) and
adaptive behavior (McDowell, 2013), this research therefore considers two main relationships be-
tween online search behaviors: (1) product information search online enhances price information
search online and (2) mobile online search in-store enhances later online search.
Regarding the first relationship between product and price information, Chernev (2006) shows that
price often plays a role in customer decision processes after consumers feel informed about the
products and have formed attitudes towards them. This is particularly problematic for retailers.
When customers search for additional product information online in-store with their mobile device,
they can easily come across cheaper prices of competitive online retailers. Hence, if such a relation-
ship exists, retailers have to develop counter-strategies. QR codes that guide customers to pre-
programmed online pages (Narang, Jain, & Roy, 2012), here the retailers’ own online shop, where
they find additional product information without coming across websites of competitors might be a
promising strategy. Customers would then not encounter lower competitor prices and therefore be
less likely to engage in competitive showrooming behavior.
The second relationship between mobile in-store and later online search reflects a temporal se-
quence that results from a postponement of the purchase decision. Facing a numerous amount of
information while searching in-store with a mobile, cognitive overload and confusion can occur
(Malhotra, 1984), such that customers feel no longer able to make a purchase decision (Blackwell,
Miniard, & Engel, 2006). This psychological process is highly relevant for brick-and-mortar

Showrooming potentials and showrooming behavior
38
retailers, as postponements of the purchase decision decrease the probability of an offline purchase.
Additionally, Sit et al. (2018) found that customers’ convenience of cross-checking information
between the offline and online channel is an important driver of showrooming behavior and studies
examining online shoppers often identify convenience-oriented segments (Rohm & Swaminathan,
2004). We therefore expect that search convenience also enhances later online search behavior be-
cause it is easier and more comfortable to search for and compare information on the internet later
after leaving the store (e.g. from home) with a stationary device (e.g. laptop).
Analyzing the different forms of online search (showrooming potentials) arises the question of how
they influence actual purchase behavior. Buying process models suggest that information search
behavior precedes purchase behavior (Kotler, Keller, Brady, Goodman, & Hansen, 2019). Conse-
quently, these various online search behaviors (showrooming potentials) can lead to both online
(showrooming behavior) and offline purchases (webrooming behavior). Hence, showrooming and
webrooming are closely linked, because they are alternative outcomes of combined in-store offline
and online search. Previous research has often examined both phenomena together as both were
previously regarded as two-stage processes (e.g. Flavián, Gurrea, & Orús, 2019). However, as in
particular showrooming is a serious issue for brick-and-mortar retailers, we concentrate on the for-
mer keeping in mind that the decision not to showroom and purchase offline could be considered as
webrooming. To sum up, the second objective of the paper is to generate insights into the relation-
ships between diverse showrooming potentials and their impact on showrooming behavior. The
following research questions address the two strongly related purposes of our study:
o Which forms of online search behavior (showrooming potentials) exist in showrooming
contexts?
o How are different forms of online search behavior related and how do they influence
showrooming behavior?
o How do choice confusion and search convenience affect the relationships between show-
rooming potentials?
o Can multi-channel technologies such as QR codes keep customers in retailers’ own chan-
nels?
Each research question is assigned to one respective study presented in this paper. Answering the
research questions is theoretically and practical important to understand the showrooming
phenomenon and to develop counter-strategies. If, for example, the mere search for product infor-
mation stimulates price search and thus showrooming behavior, retailers must try to stimulate
product information search in their own channels, for example by using QR codes. Retailers may
Showrooming potentials and showrooming behavior
39
further address choice confusion or search convenience to influence online information search.
We will start with a theoretical framework providing the research basis and defining and differenti-
ating showrooming potentials and showrooming behavior. Then, we derive hypotheses and the con-
ceptual model of the study. A qualitative pre-study emphasizes the focus on different online search
behaviors in showrooming contexts (showrooming potentials). Next, a survey study examines the
hypothesized relationships based on structural equation modeling. Moreover, a complementary sur-
vey study sheds light on the role of choice confusion and search convenience. Finally, an experi-
ment illustrates how retailers can translate the findings in a selected counter-strategy (support of in-
store information search by QR codes). We end up with a general discussion that highlights the im-
portance of separating showrooming potentials and behavior, especially in terms of influencing cus-
tomers’ mobile product information search in-store to retain them in retailers’ own channels.
3.2 Theoretical framework
3.2.1 Background: buying process models and adaptive behavior
The framework of this study is anchored in process models of consumer purchase decisions and
theories of adaptive human behavior, which are both closely linked. As consumers’ shopping be-
havior becomes more and more complex due to digitalization, Lemon and Verhoef (2016) mention
the customer journey in which multi-channel customers “interact with multiple touch points,
moving from consideration, search, and purchase to post-purchase, consumption, and future en-
gagement or repurchase” (p. 79). Hence, the customer journey is divided into different stages of a
shopping process following typical buying process models (Kotler et al., 2019). The five-stage
model of the consumer buying process comprises the stages problem recognition, information
search, evaluation of alternatives, purchase decision and post-purchase behavior (Kotler et al.,
2019). Its origins go back to the EKB model and its further development to the EBM model of con-
sumer decision-making (Blackwell et al., 2006). According to Kotler et al. (2019) firstly, consumers
recognize their problem caused by internal or external stimuli. Then, the information search stage
begins in which consumers become more receptive to product information and actively start to
search for information. Starting with a total set including all products available, consumers build an
awareness set with brands that they know and later on a consideration set with product options that
meet their buying criteria. In a further step consumers search for more information on a few
selected products that make up their choice set from which they select the final product to buy.
Hence, consumers stepwise filter product alternatives before making a purchase decision, which is

Showrooming potentials and showrooming behavior
40
finally followed by the post-purchase stage. Whether consumers pass through all five stages of this
process depends on the product and customers’ experiences with it (Kotler et al., 2019). For the
purpose of this study, we will focus on the “information search” and the “evaluation of alternatives”
as both stages are relevant in showrooming contexts and potentially precede showrooming beha-
vior.
As Flavián et al. (2020) state, the customers’ purchase-decision making process is a complex se-
quence of different channels or in the words of Lemon and Verhoef (2016) various “touch points”
(p. 69). Based on an extensive literature analysis Lemon and Verhoef (2016) determined that these
multiple touchpoints influence each other and customers’ purchase behavior. This causal relation-
ship is evolutionary-biologically determined and manifests itself in research on adaptive behavior.
Humans adapt their behavior to natural and social environmental conditions (Borthwick-Duffy,
2007; Tassé, 2013). This adaption in turn leads to new patterns of behavior resulting from previous
ones (McDowell, 2013). Bettman (1979) refers to this adaptive process by a goal hierarchy, in
which new goals emerge from the previous ones. To sum up, the customer journey reflects a se-
quence of adaptive human or rather customer behavior. Observable customer behavior results from
previous behavior and thus, contacts with previous touchpoints.
In channel switching contexts this means that customers adapt their behavior by using different
channels at different stages of the purchase process (Verhoef et al., 2007). Decisions to switch a
channel or touchpoint depend on information customers collected or received at preceding channels
or touchpoints. Speaking of the showrooming phenomenon, customers can, for example, start with
an offline search. Depending on the availability and quality of information they find in the store,
they may adapt their search behavior and switch to the online channel, where they ultimately pur-
chase the product. Hence, adaptive search behavior can potentially result in showrooming.
3.2.2 Defining showrooming potentials and behavior
Literature on channel switching often examines showrooming and webrooming behavior
simultaneously (Flavián et al., 2019; Jing, 2018; Kang, 2018; Reid, Ross, & Vignali, 2016; Fernán-
dez, Pérez, & Vázquez-Casielles, 2018). This is because research has so far treated both behaviors
as two-stage processes: showrooming as searching offline and buying online and webrooming as
searching online and buying offline. Studies focusing on webrooming only are rare. They mainly
examine drivers (Arora & Sahney, 2017; Santos & Gonçalves, 2019) and/or consequences (Flavián,
Gurrea, & Orús, 2016). In contrast, showrooming research has increased significantly in recent
years, also focusing primarily on antecedents and consequences (see Table 6). These papers usually

Showrooming potentials and showrooming behavior
41
do not consider the online search in between, which necessarily precedes the online purchase. Typi-
cal examples of showrooming definitions used in these papers are “(…) the practice among some
consumers of first browsing at a physical store and then ordering from an online seller (…)” (Bala-
krishnan et al., 2014, p. 1144) or “(…) consumers gathering information about a product from the
offline retailer and then purchasing the product online” (Basak, Basu, Avittathur, & Sikdar, 2017,
p. 34). Only single definitions consider online search to some extent, e.g. in form of mobile search
at physical stores, but do not include the final act of purchasing online. For example, Rapp et al.
(2015) define showrooming as “a practice whereby consumers visit a brick-and-mortar retail store
to (1) evaluate products/services first-hand and (2) use mobile technology while in-store to compare
products for potential purchase via any number of channels” (p. 360). So far, there is no conceptual-
ization of showrooming that includes all three stages of the showrooming process, namely offline
search, online search and online purchase (see Table 6). Furthermore, up to now, there are no re-
search studies examining various types of online search and relationships between these (for exam-
ple product vs. price information search or mobile in-store vs. later search outside the store).
Table 6. Research on antecedents and consequences in showrooming contexts.
Author(s)
and year
Considered
parts of SR con-
ceptualization
Method Product
group
Identified
antecedents
Identified
consequences
Arora and
Sahney (2018)
In-store search /
online purchase
Survey Electronics Perceived relative search
benefits offline; relative
purchase benefits online;
perceived ease of pur-
chasing online; overall
usefulness of SR
SR behavior
Arora et al.
(2017)
In-store search /
online purchase
Survey Not specified
Importance of touching
and feeling the product;
importance of sales staff
assistance
Visit store before
online purchase
Online service quality;
lower online prices
Price consciousness;
ability to use multiple
channels
SR behavior
Balakrishnan
et al. (2014)*
In-store search /
online purchase
Game theory Diverse
Option for consumers to
browse-and-switch (SR
behavior)
Competition be-
tween retailer and
e-tailer; profits of
firms
Basak et al.
(2017)*
In-store search /
online purchase
Game theory Not specified
SR behavior Profit of tradi-
tional and online
retailer; overall
retail prices
Dahana et al.
(2018)
In-store search /
online purchase
Survey Apparel
Involvement; price con-
sciousness
Potential show-
roomers
Prior knowledge; per-
ceived risk; price con-
sciousness; internet us-
age; device usage; age
SR behavior fre-
quency

Showrooming potentials and showrooming behavior
42
Author(s)
and year
Considered
parts of SR con-
ceptualization
Method Product
group
Identified
antecedents
Identified
consequences
Daunt and
Harris (2017)
In-store search /
online purchase
Survey Diverse
Technological speed of
change; product acquisi-
tion value; product price;
product availability;
product involvement; in-
store shopping savvi-
ness; internet savviness;
trust in in-store sales
employees; trust in
online stores; value of
in-store shopping; value
of online-shopping
In-store value
taking; online
value co-
destruction/co-
creation
Fassnacht et
al. (2019)
In-store search /
online purchase
Survey Electronics Interaction quality with
service staff; price
matching strategy; offer-
ing alternative products;
explaining
store’s return policy
Showroomers’
and non-
showroomers’ in-
store buying in-
tention
Flavián et al.
(2019)
In-store search /
online purchase
Qualitative
interviews;
survey; la-
boratory
experiment
Diverse
Webrooming; SR
behavior
Search process
satisfaction; con-
fidence in making
the right pur-
chase; smart
shopping feelings
Flavián et al.
(2020)
In-store search /
online purchase
Survey Apparel Webrooming; SR
behavior
Customer experi-
ence (smart shop-
ping perceptions
and feelings)
Gensler et al.
(2017)
In-store search /
online purchase
Survey Clothing,
shoes, sport-
ing equip-
ment, furni-
ture,
toys/games,
electronics
Price savings; perceived
dispersion of online
prices; fit with consum-
er’s needs; waiting time
for service staff; time
pressure
SR behavior
Gu and Tayi
(2017)*
In-store search /
online purchase
Game theory Diverse Pseudo-showrooming via
offering higher-quality
product/ higher demand
product online exclusive-
ly
Profit of firms
Jing (2018)* In-store search /
online purchase
Game theory Not specified
SR behavior Price competition;
retailers’ profits
Consumer search costs;
return policy of retailer
SR behavior
Webrooming SR behavior;
competition;
online retailers’
profit

Showrooming potentials and showrooming behavior
43
Author(s)
and year
Considered
parts of SR con-
ceptualization
Method Product
Group
Identified
antecedents
Identified
consequences
Kang (2018) In-store search /
online purchase
Survey Apparel and
beauty
Showroomers User-generated
content creation
intention on social
media, infor-
mation attain-
ment; price com-
parison
Social interaction SR behavior
Rapp et al.
(2015)
In-store search
(incl. mobile search
in-store) / no pur-
chase behavior
Survey Running
shoes and
clothing
Perceived showrooming
(moderating variables:
salesperson’s coping
strategies; cross-selling
strategies)
Salesperson’s
self-efficacy;
salesperson’s
performance
Reid et al.
(2016)
In-store search /
online purchase
Survey Not specified
Missing possibility of
efficient price and
product comparisons in
physical channels
SR behavior
Schneider and
Zielke (2020)
Mobile search as
one characterizing
factor of in-store
search / online pur-
chase
Survey Electronics
Price consciousness;
desire for social contact;
motivation to conform;
bad conscience during
SR behavior
SR behavior
Note: SR = Showrooming / *identified antecedents and consequences are modeled due to game-theoretic modeling approach.
Addressing these issues, we propose a new showrooming definition that includes not only offline
search and online purchase behavior, but also online search behavior in between. Furthermore, we
distinguish different types of online information search that precede the online purchase. We call
these types of online search behavior showrooming potentials. With the term “potential” we distin-
guish online search as a necessary and integral part of the showrooming process from other influ-
encing factors of showrooming, such as situational aspects (i.e. time pressure) or customer charac-
teristics (i.e. price consciousness). Hence, by using the term showrooming potentials, we differenti-
ate online search from other antecedents or drivers of showrooming. The term “potential” further
underlines that online search is a precondition that can but does not need to ultimately result in an
online purchase. As mentioned before, the pattern of search and purchase behavior is driven by
adaptive behavior (McDowell, 2013). Depending on the information customers find online, online
search behavior can also result in a decision to buy at the store, i.e. webrooming, in which online
search precedes offline purchases (Arora & Sahney, 2017).
For understanding the showrooming process, it is further important to distinguish different types of
online search. Customers and in particular showroomers search for product and price information
that influence their buying decisions (Sit et al., 2018). Product information search comprises search
for product descriptions or reviews of other customers (Park & Kim, 2003). Customers can further
search for additional product and price information with their mobile in-store (Quint et al., 2013) or
Showrooming potentials and showrooming behavior
44
with any device afterwards (Fuentes & Svingstedt, 2017). The use of the smartphone in-store in the
search phase of the shopping process has become a natural part of today’s shopping behavior
(Fuentes et al., 2017; Fuentes & Svingstedt, 2017; Grewal, Ahlbom, Beitelspacher, Noble, & Nord-
faelt, 2018). However, searching for online information can also take place after leaving the store,
for example on the way home, at work or from home (Fuentes & Svingstedt, 2017; Schneider &
Zielke, 2020). Hence, we distinguish four showrooming potentials:
(1) Price information search online via mobile devices in-store,
(2) Price information search online after leaving the store,
(3) Product information search online via mobile devices in-store and
(4) Product information search online after leaving the store.
We define and conceptualize showrooming as a process, in which customers visit a physical store to
select a product, then search for product and/or price information online in-store or later (show-
rooming potentials) before they purchase the product online.
3.2.3 Relationships between showrooming potentials and showrooming behavior
We further propose relationships between showrooming potentials. Since human behavior is adap-
tive (Borthwick-Duffy, 2007; Tassé, 2013) and decision making processes are hierarchical
(Bettman, 1979), customers’ search for information is based on their goal hierarchy and previous
experiences. Therefore, we assume relationships between the different types of online search
behavior (showrooming potentials) as a consequence of adaption. We will now discuss these rela-
tionships.
Chen (2009) offers a modified model of the consumer decision process in which he considers a first
search and evaluation stage followed by a second information search and evaluation stage. He states
that in the first search and evaluation phase customers focus on “product-related information, such
as brand, specification, function and appraisal. Consumers rigorously search for and evaluate
products, while only generally referring to price to ensure the products are within their budgets.”
(p. 311). Chernev (2006) follows a similar direction in his argumentation, stating that due to cus-
tomers’ degree of uncertainty of their consumption preferences concerning a specific product, price
information often plays a subordinate role.
At the end of this first phase customers have only a few products or at least one product left (Chen,
2009). These few products match the product choice set that Kotler et al. (2019) place at the end of
the search and evaluation stage. Based on customers’ information at this point, they adapt their be-

Showrooming potentials and showrooming behavior
45
havior and according to Chen (2009) follow a second search and evaluation phase focusing on price
information. “They tend to undertake price comparison across a variety of retailers and then make
their final decision which product and on where to purchase the product (both online and offline)”
(Chen, 2009, p. 312). Hence, price plays a primary role in the final decision between products of an
already selected choice set. Further, product and price search characteristics also support the as-
sumption that information search starts with product search and ends up with price search. Search-
ing for product information encompasses more than one search category, such as product descrip-
tion, product quality or product specifications whereas searching for price information is one single
search category (Detlor, Sproule, & Gupta, 2003). Hence, product information search is often ex-
ploratory and wide, whereas price search is more targeted.
In showrooming contexts, we assume that potential showroomers often switch from offline to
online search during the first search and evaluation stage in order to find additional product infor-
mation or search for further product alternatives. After a stepwise filtering process, customers select
their final choice set. This channel switching behavior in the first search and evaluation stage occurs
more frequently when no sales staff is available (Gensler et al., 2017).
Hence, we can assume that especially in the showrooming context, customers see a specific product
in-store for which they want to search for more information or find alternatives to form a final
choice set. When they feel that in-store information is not sufficient, they adapt their search strategy
and start searching online for product information. In particular, when customers observe cheaper
online prices while searching for product information, they may adapt their search strategy by
searching for cheaper offers online. According to the phases suggested by Chen (2009) and the ar-
guments presented before, customers will then in a second phase search for price information
online. Hence, the decision process is adaptive (Borthwick-Duffy, 2007; Tassé, 2013) and hierar-
chical (Bettman, 1979) and searching for product information stimulates customers subsequent
search for price information online. We assume this effect for both mobile in-store as well as for
later online search.
H1a. Mobile product information search in-store is positively related to mobile price information
search in-store.
H1b. Later product information search is positively related to later price information search.
In addition, we know that customers increasingly use their mobile devices in-store to search for
more information (e.g. further product information and positive reviews or price checking for a con-
sidered product) (Quint et al., 2013). Some studies even consider mobile search as an indicator of
showrooming (Rapp et al., 2015). At the same time, results from Schneider and Zielke (2020) show
Showrooming potentials and showrooming behavior
46
that most showroomers complete their purchases primarily from home. In a qualitative pre-study
conducted by the authors, some customers stated that when they search for additional information
on their smartphone in-store, they feel uncomfortable because of the small display. Therefore, they
prefer to continue their search later at home using a stationary device (e.g. laptop).
For the relationship between mobile in-store and later online information search in showrooming
contexts this means that customers often search with their mobile devices in-store, but continue
their search at home. Again, this is also a reflection of adaptive behavior in the purchasing process.
As we will discuss later, customers may not be ready for making a decision and find the device
(mobile) or place (store) inconvenient for searching additional information and completing the pur-
chase. As a consequence, they adapt their behavior and continue their search later online. We fur-
ther expect that customers continue their search behavior at the point at which they stopped in-store,
i.e. mobile product search stimulates later product search and mobile price search stimulates later
price search. We therefore hypothesize:
H2a. Mobile product information search in-store is positively related to later product information
search.
H2b. Mobile price information search in-store is positively related to later price information
search.
We already mentioned that customers often adapt their search behavior by continuing mobile search
in-store later at home or at another place outside the store. We now discuss reasons for adaptive
behavior more deeply. Once customers start mobile information search in-store, they find nearly
endless information online and can easily get confused since human processing capacity is limited.
Too many information will lead to cognitive overload (Malhotra, 1984), i.e. a state in which cus-
tomers are no longer able to compare or comprehend given alternatives (Mitchell, Walsh, & Yamin,
2005; Walsh, Hennig-Thurau, & Mitchell, 2007). This cognitive stage results in an increased per-
ceived risk of purchase (Blackwell et al., 2006) and in the context of showrooming, customers being
in-store may hope to reduce this negative state by further expanding their search behavior and effort
(Blackwell et al., 2006).
Moreover, another important aspect is search convenience. Customers searching for information in-
store may perceive the small smartphone display as inconvenient to obtain all information they need
(PWC, 2017), especially when they are already confused by too much information. Singh and Swait
(2017) confirm that customers rate perceived search and purchase convenience of mobiles much
lower compared to desktops. Furthermore, Holmes, Byrne, and Rowley (2014) show that consum-
ers perceive computers (vs. mobiles) to be better in terms of convenience, helpfulness and clear-

Showrooming potentials and showrooming behavior
47
ness. With regard to showrooming, Sit et al. (2018) found out that customers’ convenience of cross-
checking information between the offline and online channel is an important driver of showrooming
behavior.
Thus, customers being in-store could postpone their purchase decision to a later time. To sum up,
we argue that mobile search in-store stimulates later search, because while searching for infor-
mation online, customers get confused by the amount of information they find and thus continue
their search in a more convenient environment.
H2c. The impact of mobile search behavior in-store on later search behavior is sequentially medi-
ated by choice confusion and perceived search convenience.
According to Chen (2009) and the arguments presented before, price information search in the
second search and evaluation phase determines the final purchase decision. At this point, customers
can adapt their behavior by continuing their search later, purchase the product in the store
(webrooming) or purchase the product online (showrooming). As the online channel offers diverse
opportunities to find products at competitive prices (e.g. price search engines) and as online prices
are often considered to be lower than offline prices, the probability that online price search results
in showrooming behavior is large. We therefore assume that price information search is directly
linked to showrooming.
H3a/b. Mobile price information search in-store (a) and later price information search (b) are posi-
tively related to showrooming behavior.
Recent literature shows that mobile search behavior in-store via mobile devices increases (Gross,
2015), but until now the proportion of customers purchasing online via mobile devices in-store is
low (Holmes et al., 2014). As mentioned before, most showroomers continue their online price
search later and prefer to purchase from home (Schneider & Zielke, 2020). Therefore, later price
search should have a stronger impact on showrooming behavior than mobile price search in-store.
H3c. Later price information search has a stronger impact on showrooming behavior than mobile
price information search in-store.

Showrooming potentials and showrooming behavior
48
Figure 8 summarizes our framework. Since we argue that the showrooming process starts with mo-
bile product information search in-store, the other showrooming potentials mediate the effects on
the final showrooming behavior.
We analyze the theoretical framework in different studies. Firstly, a qualitative study provides some
general insights in the relevance of showrooming potentials. Then, a first survey study analyzes
relationships between showrooming potentials and behavior using structural equation modeling. A
complementary survey study replicates results from the first study and analyzes the role of choice
confusion and search convenience. A final laboratory experiment tests a counter-strategy for retail-
ers that appears promising based on the results of the survey studies. Figure 9 provides an overview
of the four studies.
Notes: bolt: main model / dashed: psychological explanations.
Figure 8. Model of showrooming potentials and showrooming behavior.
Choice
confusion
Perceived later
online search
convenience
Mobile
product search
Mobile
price search Later
price search
Later
product search
Showrooming behavior

Showrooming potentials and showrooming behavior
49
Pre-
study
Pre-study: Online search behavior in potential showrooming situations
In-depth interviews
Convenience Sample: 15 customers of different age, gender, educational attainment
and working situation
Product: washing machine
Development of scales for showrooming potentials and behavior
Generation of items (4 experts)
Classification of items (7 experts)
Selection of items (expert group and group discussion of 19 graduate students)
Pre-test of scales (initial sample of 182 customers)
Final item selection (4 experts)
Testing relationships between showrooming potentials and behavior
Sample: 703 customers
Scenario approach
Products: sports shoes, TV sets
Variables: showrooming potentials, showrooming behavior
The role of choice confusion and search convenience
Sample: 127 customers
Products: sports shoes, TV sets
Variables: showrooming potentials, showrooming behavior, choice confusion, per-
ceived later online search convenience
Survey
study
Complementary
study
Effective usage of customers’ need for product information
Sample: 101 customers
Product: washing machine
Variables: mobile information search behavior in-store, showrooming behavior and
general purchase behavior
Experimental
study
Figure 9. Overview of empirical studies.

Showrooming potentials and showrooming behavior
50
3.3 Qualitative pre-study: online search behavior in potential showrooming
situations
The aim of the qualitative pre-study is to support the conceptual model and simultaneously shed
more light on relationships between showrooming potentials.
3.3.1 Research design and sample description
We conducted 15 in-depth interviews. Participants were between 18 and 64 years and 53% were
male. We interviewed participants of different age, gender, educational attainment and working
situation. The questionnaire started with some closed questions about general shopping behavior
and the ownership of mobile devices. We asked participants to imagine and describe a typical shop-
ping process for a washing machine ˗ a typical (complex) showrooming product for which custom-
ers usually invest time in information search before they make a purchase (Shen et al., 2016). Af-
terwards, participants were instructed to imagine being in an electronics store to buy a washing ma-
chine. We showed them photos of six real washing machines with real product information charts
and asked them to explain, what they would probably do next after finding these machines in the
store. Then, we told them that no sales staff is available and that they should use their smartphone if
they need more information for making a purchasing decision. We gave them the time they needed
to search for information with their own smartphone. Afterwards, we asked them which websites
and keywords they have used, which information they have found and if and where they would buy
a machine. Participants evaluated the given situation as realistic with a mean value of 6.13 (on a
seven-point scale with 1 = “not realistic” and 7 = “totally realistic”).
3.3.2 Analysis and results
We used deductive category assignment (structuring method) for analyzing the data (Mayring,
2015). Categories were based on our conceptual framework. In the free imagination question of a
shopping process, all participants stated to search for information before purchasing a washing ma-
chine. Eight mentioned product information search before price information search. Three started
with price search in terms of setting a price range, then searched for product information in this
price frame and finally ended up again with searching for the best offer. Another three participants
mentioned to search for price and product information simultaneously and one apparently started
with price before product information search. When imagining being in the store that offers the six
washing machines, six participants stated that it is highly likely that they would use their
smartphone in-store, five said it is possible, for example when no sales staff is available, two men-
Showrooming potentials and showrooming behavior
51
tioned a low probability, one said that he would do it outside the store and one could not imagine it
at all. Therefore, one person was not asked to perform the task of searching additional information
with a smartphone. When participants reported their mobile search behavior in-store, almost all (13)
started searching via google. Most participants searched for the name of the washing machine in
combination with the brand. Additionally, their search often included words like “washing ma-
chine” or “test”. Nobody used the word “price”, but twelve customers stated that they have found
price information as well and even five reported that the price was the most obvious information,
they have found. Furthermore, we could recognize choice confusion (2 participants) and a desire for
more convenient devices (9 participants) after using the smartphone for additional information in
the in-store situation. One participant stated for example:
“I think I'm a little overwhelmed with the information (…). That's why I wouldn’t buy anything
now anyway, I think. No, that would be too much for me right now. I think I would normally
need more time and would like to do it on the computer. I could imagine that maybe I will try to
google something. But anyway, I can’t get all the information I need to choose a machine on the
smartphone, because the display is too small.”
(Interview 3)
To sum up, searching for product information online most commonly precedes searching for price
information. Choice confusion and a more convenient perception of later search at a desktop com-
puter could be drivers for a postponement of online search. Hence, this qualitative pre-study sup-
ports the assumed relationships to be tested in the main study.
3.4 Survey study: relationships between showrooming potentials and behavior
In a first survey study we analyze the fundamental relationships between showrooming potentials
and behavior according to H1a/b, H2a/b and H3a/b/c. As part of this study, we also developed
measures for showrooming potentials and behavior.
3.4.1 Development of measurements
We developed multi-item scales for showrooming potentials and behavior in a multi-step process
(Walsh et al., 2007). As we later worked with scenarios, we intended to measure intentions as latent
constructs and not actual behavior. We started with a small panel of four experts (incl. authors),
who created 109 different items for measuring these constructs. Then, seven other experts assigned
every single item to the respective construct to proof face validity. Based on this work and a group
discussion with 19 graduate students, the initial expert panel explored the differentiability and prac-
tical usability of the remaining items. This purification reduced the number of items to 39. We then
pre-tested the scale based on a sample of 182 respondents. A first confirmatory factor analysis

Showrooming potentials and showrooming behavior
52
yielded good model fit. Nevertheless, the expert panel from the beginning reduced the large scale
for practical reasons to four items for each concept based on face validity. To validate this content-
related selection we used confirmatory factor analysis that yielded a good model fit. We used the
final multi-item scale for the main study (see Appendix B for the item list).
3.4.2 Research design and sample description
We conducted a scenario-based online survey with two product categories (sports shoes / TV sets)
and two shopping scenarios (buying / browsing) to strengthen external validity. The scenario ap-
proach is often used in consumer behavior research (e.g. Turley & Milliman, 2000). We chose
sports shoes and TV sets as they belong to typical showrooming product categories examined in
research so far (see Table 6). However, both product categories differ in customers’ need for touch
and feel, the degree of perceived risk and involvement. Considering both product categories allows
us to check generalizability of our results across products.
The questionnaire started with the presentation of one of the four scenarios. Participants should im-
agine visiting a brick-and-mortar store that they usually consider, when they are looking for the
respective product. In the store, they find a product that they really like, test/try it and ask the sales
staff for further information. Finally, they would like to buy the product (see Appendix C). After-
wards participants should report the probability for showrooming potentials and behavior (inten-
tional constructs) in the given situation. We used manipulation checks to be certain that participants
have read and understood the scenario instructions. Later on, we asked for some psychographics,
aspects of their general shopping behavior and finally demographical information. Respondents
answered most questions on seven-point scales.
We decided to start the process with a brick-and-mortar store visit, as we considered buying and
browsing situations. The latter often starts with information search in physical stores. Even though
this is usually not the case for customers with a clear buying intention (as they have often already
obtained information online before visiting a store), we decided to start all scenarios consistently in-
store for comparability reasons.
After pre-testing, we distributed a link to the questionnaire and an associated password online via
snowball sampling. We considered quotas for age and gender to enable comparability between the
four scenarios. We collected 703 questionnaires with 53% female and 47% male respondents at an
average age of 33 years. 343 participants answered the sports shoes scenario (buying: 179 / brows-
ing: 164) and 360 the TV sets scenario (buying: 177 / browsing: 183). Almost 98 % of respondents

Showrooming potentials and showrooming behavior
53
own a smartphone, 85% go to the city center at least once a month and 75% order a product online
at least once a month. Additionally, participants considered the scenario as realistic (M: 5.59,
SD: 1.21) and their general shopping behavior indicates that they could easily imagine the given
situation.
Cronbach’s Alpha for all showrooming constructs exceeded .7 (Nunnally, 1978). Confirmatory fac-
tor analysis of the measurement models shows a good model fit according to criteria suggested by
Hu and Bentler (1999): χ2 = 357.904 (df = 160, p < .001), SRMR = .017, RMSEA = .042,
NFI = .984, TLI = .989 and CFI = .991. Indicator reliability (squared multiple correlation), compo-
site reliability (CR) and average variance extracted (AVE) were above the minimum accepted val-
ues in the literature (Fornell & Larcker, 1981). Besides, the Fornell and Larcker (1981) criterion
proves discriminant validity, as AVEs for each construct (.829 to .935) were greater than squared
factor correlations (.109 to .503) (see Table 7).
Table 7. Means, standard deviations, square root of AVE and correlations
between constructs (survey study).
Correlations
Construct Mean SD P1 P2 P3 P4 SB
Mobile product search (P1) 2.771 1.930 .963 .483 .709 .409 .451
Later product search (P2) 4.163 2.033
.946 .330 .686 .520
Mobile price search (P3) 3.596 2.275
.966 .532 .499
Later price search (P4) 4.717 2.019
.930 .683
Showrooming behavior (SB) 3.284 1.684 .910
Note: Diagonal values in italics are square roots of AVE and others (off-diagonal) are cor-
relations between variables.
3.4.3 Analysis and results
We used structural equation modelling (SEM) to analyze relationships between showrooming po-
tentials and their impact on showrooming behavior (H1 to H3). The model has a good fit
(χ2 = 413.034 (df = 164, p < .001), SRMR = .034, RMSEA = .047, NFI = .981, TLI = .987 and
CFI = .988) and all coefficients indicate significant relationships (see Figure 10). Moreover, except
for the path of mobile price search in-store on showrooming behavior, all path coefficients have
meaningful values (> .2) according to Chin (1998).

Showrooming potentials and showrooming behavior
54
Hence, the results confirm the positive relationship between showrooming potentials and show-
rooming behavior. Moreover, the results show that online search for product information precedes
online search for price information. Mobile product information search strongly stimulates mobile
price search at the physical store (.708, p < .001) and later product information search also has a
positive effect on later price search (.573, p < .001). Hence, results support H1a and H1b.
Results also indicate that mobile information search in-store precedes later information search. Mo-
bile product information search in-store shows a significant positive effect on later product infor-
mation search (.479, p < .001) as well as mobile price search in-store on later price search (.339,
p < .001). This supports H2a and H2b. Regarding the impact of mobile in-store versus later price
search on actual showrooming behavior, both path coefficients show significant effects (p < .001),
supporting H3a and b. Whereas the model reveals a high impact of later price information search
(.587, p < .001), it indicates a smaller positive effect of mobile price search in-store (.189, p < .001)
on showrooming behavior. This supports H3c. Table 8 summarizes the results of all hypotheses
tests. Additional analyses indicate similar effects for offline shopping behavior as the dependent
variable (webrooming), but expectedly with a negative sign. Alternative model specifications and
additional mediation analyses prove the robustness of all results. For example, we analyzed an al-
ternative model with switched positions of product and price search (in which price search precedes
product information search behavior). This model resulted in a worse fit compared to our proposed
model.
We also applied multi-group structural equation modeling to test the robustness of our findings and
to explore possible moderating effects of the product category (sports shoes vs. TV sets) and the
Note: * p < .05 / **p < .01 / ***p < .001.
Figure 10. Standardized factor loadings for basic model (survey study).
Mobile product
search
Later product
search
Later price
search
Showrooming
behavior
Mobile price
search
.708***
.587***
.573***
.189***
.339***
.479***

Showrooming potentials and showrooming behavior
55
shopping scenario (buying vs. browsing). Results present significant relationships for each path in
the conceptual model irrespective of the product category and shopping situation. However, after
successfully testing for measurement equivalence between both product categories, a comparison of
model fit values between the unconstrained model and the measurement residual model indicates a
moderating effect (Cheung & Rensvold, 2002). Critical ratios for differences in parameters show
that the impact of mobile in-store on later product information search is significantly larger for
sports shoes (.526, p < .001) compared to TV sets (.391, p < .001). The impact of mobile in-store on
later price search is also significantly larger for sports shoes (.373, p < .001) compared to TV sets
(.307, p < .001).
Table 8. Results of hypotheses tests.
Hypotheses
Results
survey
study
Results
complem.
study
H1a Mobile product information search in-store is positively related to mobile
price information search in-store.
Supported Supported
H1b Later product information search is positively related to later price infor-
mation search.
Supported Supported
H2a Mobile product information search in-store is positively related to later
product information search.
Supported Supported
H2b Mobile price information search in-store is positively related to later price
information search.
Supported Supported
H2c The impact of mobile search behavior in-store on later search behavior is
mediated by choice confusion and perceived search convenience.
Not tested Supported
H3a/b Mobile price information search in-store (a) and later price information
search (b) are positively related to showrooming behavior.
Supported Supported
H3c Later price information search has a stronger impact on showrooming be-
havior than mobile price information search in-store.
Supported Supported
The study suggests dividing the showrooming phenomenon in showrooming potentials and show-
rooming behavior. Moreover, different showrooming potentials exist, depending on the type of in-
formation search (product vs. price) and the place and time of search (mobile in-store vs. later out-
side the store). The results show relationships between the showrooming potentials and they suggest
that the showrooming process can start with mobile product search in-store that (automatically)
stimulates price search and then might lead to showrooming behavior.
The findings also indicate that a differentiation between mobile in-store and later online search is
essential, because mobile search increases later search. This indicates that showrooming customers
tend to postpone further information search and the final online buying decision. We explained this
effect by the large amount of available information in the online channel that evokes confusion in
an in-store purchase setting. Accordingly, our model reveals that later price search influences show-
rooming behavior more strongly than mobile price search in-store. This is an important contribution

Showrooming potentials and showrooming behavior
56
because it underlines that studies with a focus on mobile search in-store are too narrow (Rapp et al.,
2015).
Finally, we identified product category as a moderator. Although, all paths show the same relation-
ships for both product categories, we found some differences in the strength of some effects. The
impact of mobile in-store on later search is significantly stronger for sports shoes (look and feel
product) compared to TV sets (complex electronic product). This holds for product and price infor-
mation search as well. Recent research argues that customers need to evaluate products in terms of
haptic and quality in personal before they make a purchase (Rejón-Guardia & Luna-Nevarez, 2017),
as this reduces uncertainties about product features (Kuksov & Liao, 2018). Sports shoes as a look
and feel product belong to experience goods, which require personal experience before purchase,
whereas a TV set is a typical search good that “can be evaluated by external information” (Chiang
& Dholakia, 2003, p. 179). Hence, for sports shoes customers rather tend to postpone their search
and purchase behavior to a later time because it is more difficult to make a decision based on avail-
able information than for TV sets.
3.5 Complementary study: the role of choice confusion and search
convenience
A second survey study aims to replicate the findings from the first study and to analyze the role of
choice confusion and search convenience according to H3c (see Appendix B for additional item
scales). Since we observed no differences between the buying and browsing condition in the first
study, we only used the buying scenario in this study. A snowball sampling procedure resulted in
127 usable questionnaires (sports shoes: 65 / TV set: 62). Participants’ average age was 34 years
with 55% female respondents. All respondents own a smartphone, 85% go to the city center at least
once a month and 75% order a product online at least once a month. Additionally, 71% stated that
they have already searched offline and purchased online before. Participants also considered the
scenario as realistic (M: 5.54, SD: 1.41). Factor analyses and Cronbach’s alpha values above .7 for
all constructs indicate reliability of multi-item scales. Again confirmatory factor analysis of the
measurement models shows a good model fit (χ2 = 290.009 (df = 160, p < .001), SRMR = .035,
RMSEA = .080, NFI = .936, TLI = .964 and CFI = .970) and squared multiple correlation, CR and
AVE were above the thresholds set by Fornell and Larcker (1981) (see Table 9).

Showrooming potentials and showrooming behavior
57
Table 9. Means, standard deviations, square root of AVE and correlations
between constructs (complementary study).
Correlations
Construct Mean SD P1 P2 P3 P4 SB
Mobile product search (P1) 3.134 1.994 .957 .218 .697 .228 .280
Later product search (P2) 4.026 1.954
.960 .201 .733 .497
Mobile price search (P3) 4.053 2.228
.954 .373 .360
Later price search (P4) 4.543 2.050
.968 .617
Showrooming behavior (SB) 3.000 1.653 .938
Note: Diagonal values in italics are square roots of AVE and others (off-diagonal)
are correlations between variables.
In a first step, we replicated the structural equation model from the first survey study. Results reveal
similar coefficients and thus confirm the robustness of findings. Model fit measures show a good
model fit (χ2 = 296.408 (df = 164, p < .001), SRMR = .051, RMSEA = .080, NFI = .935,
TLI = .965 and CFI = .969) (see Figure 11).
Additionally, we conducted mediation analyses using the process macro for SPSS (Hayes, 2018).
We found a significant sequential mediation effect of mobile product information search in-store
via search confusion that increases search convenience and ultimately later product information
search (indirect effect: .029; CI = .007 to .080). We observe the same result for the relationship be-
tween mobile price search in-store, the two mediators and later price search (indirect effect: .025;
CI = .003 to .065). This confirms H3c, as mobile information search in-store increases choice con-
fusion (product search: .177, p = .005 |price search: .109, p = .055), which increases customers’
perceived convenience of later search (.401, p = .000 | .392, p = .000) that finally results in stronger
Note: * p < .05 / **p < .01 / ***p < .001 / n. s. (not significant).
Figure 11. Standardized factor loadings for basic model
(complementary study).
Mobile product
search
Later product
search
Later price
search
Showrooming
behavior
Mobile price
search
.832***
.489***
.679***
.116*
.206***
.232*

Showrooming potentials and showrooming behavior
58
later online search behavior (.406, p = .000 | .577, p = .000). Hence, results show that mobile
product information search in-store has a stronger impact on choice confusion than mobile price
search in-store and that the effect of the latter is only marginally significant. Figure 12 presents the
results of both mediation analyses. The complementary study again underlines the important role of
mobile product search behavior in the showrooming context. Therefore, we conducted an expe-
rimental study to analyze how retailers can control product search behavior.
3.6 Experimental study: effective usage of customers’ need for product infor-
mation
According to customers’ desire for mobile product information search in-store, we examine whether
QR codes could be an opportunity to satisfy this need by providing additional information online
(e.g. product information on technical data, product availability, videos, reviews, etc.) and to reduce
customers additional search on websites of competing retailers, where they may also find price in-
formation that can result in showrooming.
Note: * p < .05 / **p < .01 / ***p < .001 / † (p < .10) / n. s. (not significant).
Figure 12. Results of sequential mediation analyses (complementary study).
Mobile product
search
Choice
confusion
Perceived later online
search convenience
Later product
search
.177**
.340**
.406***
-.121 n. s.
.165*
.401***
Mobile price
search
Choice
confusion
Perceived later online
search convenience
Later price
search
.109 †
.265*
.577***
-.124*
.339***
.392***

Showrooming potentials and showrooming behavior
59
3.6.1 Research design and sample description
We tested whether quick response (QR) codes are an appropriate strategy to keep customers in re-
tailers’ own channels. A smartphone camera (combined with a smartphone application) can read the
QR code and redirect to a variety of online contents (Narang et al., 2012), for example the website
of the retailer. We used a laboratory experiment to explore effects of QR codes on mobile search
behavior in-store (similar to other studies investigating information search behavior or shopping
situations in general) (cf. Hoelscher & Strube, 2000). We simulate a shopping situation for washing
machines in an electronics store using a computer lab. Each participant stood in-front of four pic-
tures representing different washing machines with separate fact sheets that present some decision
relevant information, such as washing capacity or maximum spin speed. The experiment used three
treatment groups: A) participants face fact sheets for the washing machines without QR codes, B)
participants face fact sheets for exactly the same machines with QR codes and C) participants also
face fact sheets with QR codes, and were encouraged to install and use a QR code scanner on their
smartphone. The QR codes in the treatments linked to the respective websites of an existing multi-
channel electronics retailer, where more details of the machines were shown.
After pre-testing, we used direct recruitment of potential study participants by asking students at a
European university to participate in the experiment. To encourage participation, we held a draw for
three vouchers of an electronics store. During recruitment, we pointed out that participants will need
their smartphone, a stable internet connection and an adequate battery load. We decided to use a
student sample because this age group has a high online shopping affinity and frequently uses
smartphones for shopping (Quint et al., 2013). Additionally, students face a similar life situation.
The experimental task required to imagine that participants have just finished their studies, signed
an employment contract and need to move into a new home and purchase a new washing machine.
Participants should imagine being in an electronics store, facing four washing machines with the
fact sheets in front of them. They were told that no sales staff is available at the moment. Therefore,
they have to search for more information online using their smartphone. After finding enough in-
formation and being ready to make a purchase decision for a machine, they moved on to an online
questionnaire that was already open at a computer screen. The online questionnaire comprised ques-
tions about participants’ search and intended purchase behavior, control questions related to partici-
pants’ smartphones, familiarity with and sympathy for the electronics retailer and finally de-
mographics.
While in the survey studies scenarios mentioned that sales personnel was available, the OR code
experiment focused on a situation without available sales personnel. This allowed us to focus spe-

Showrooming potentials and showrooming behavior
60
cifically on the online search processes in-store. Existing research shows that especially in situa-
tions without available sales staff, the probability of showrooming behavior increases (Gensler et
al., 2017). Furthermore, Rapp et al. (2015) state that sales staff consciously withdraws when they
perceive mobile searching customers in the store. Our own qualitative pre-study also confirms that
customers especially use their smartphone to find more information on washing machines when no
sales staff is available.
Overall, 101 students successfully participated in the experiment (group A: n = 32; group B: n = 30;
group C: n = 39). 52% were female and the average age was 23 years. About 88% visit the city cen-
ter at least once a month and 73% order a product online at least once a month. Moreover, 78% re-
port personal showrooming experience. All participants stated to use their smartphone to search for
more information, when they are in an offline store (>1 on a seven-point Likert scale with
1 = “never”). Concerning QR codes, 21 of 30 participants in group B used the QR code on the fact
sheet without having the task to use it. However, 10 of these 21 participants state that they never use
a QR code when usually being in an offline store. In the whole sample, 63 participants (62%) state
that they never scan a QR code in-store. Nevertheless, participants considered the experiment as
realistic (M: 5.97, SD: 1.05, seven-point scale).
3.6.2 Analysis and results
Results show that participants’ frequency to search for product information via their smartphone
differs significantly between treatments (Chi²: p = .002; Cramér’s V: p = .002). 88% of group A
searched for product information on the internet, whereas only 57% of group B and 49% of group C
searched for more product information on the internet (excluding usage of the QR code). For price
information search, group differences are marginally significant (Chi²: p = .060; Cramér’s V:
p = .060) with 53% searching for price information without facing a QR code (group A), whereas
40% of group B and 26% of group C searched for price information online (excluding usage of the
QR code). Considering the number of websites used to search for further information, an ANOVA
with Scheffé’s post-hoc comparisons shows that participants in group A visited significantly more
websites than participants who faced a QR code in group B (p = .003) and C (p = .000). On average,
participants visited 2.50 websites in group A, 1.20 additional websites in group B and 1.08 in group
C. Results also indicate a significant impact of treatments on the time used for information search.
Without QR codes participants searched for a shorter time than with a QR code (M group A: 10:09
mm:ss, SD: 3:49; M group B: 10:33 mm:ss, SD: 3:25; M group C: 12:38 mm:ss; SD: 3:38). The
difference between group A and C (p = .024) is significant and between group B and C marginally

Showrooming potentials and showrooming behavior
61
significant (p = .068). Contrary to our assumptions, we observed no significant differences in
participants’ intended purchase behavior (e.g. the probability to purchase online at a competing re-
tailer or to purchase offline at the electronics store) between the experimental groups.
Results reveal some interesting effects of the experimental groups regarding 1) the usage frequency
of further online product and price information search, 2) the number of websites used for searching
further information and 3) the time spent on information search. We observe that customers facing a
QR code (groups B and C) search with lower probability for information outside the retailer’s chan-
nels and visit less additional websites, but search for a longer time. Therefore, we can argue that QR
codes can help multi-channel retailers keeping customers in their own channels for longer periods
of time. Furthermore, QR codes could reduce information search behavior on other websites,
reducing the probability that customers come across cheaper prices elsewhere. The experimental
study could not figure out significant differences in customers’ purchase behavior between experi-
mental groups facing a QR code or not. This could be caused by the hypothetical buying situation in
the experiment. Furthermore, several respondents in our (European) sample were unfamiliar with
the use of QR codes due to a low usage by retailers. In contrast, other cultures and countries – espe-
cially China – show a high use and acceptance of QR codes (Wang, 2017).
3.7 General discussion
Customers nowadays use different channels in their path to purchase, resulting in more and more
complex customer journeys. New behavioral patterns such as showrooming threaten brick-and-
mortar stores and online market shares have constantly increased in recent years. This paper pro-
poses a new conceptualization of showrooming that contributes to a better understanding of the
phenomenon. These insights enable retailers to develop counter-strategies and thus retain customers
in their own channels.
We addressed our research questions by (1) identifying forms of online search behavior (show-
rooming potentials), which are relevant in showrooming contexts, (2a) examining how online
product information search goes along with price information search and (2b) how mobile in-store
search goes along with later online information search after leaving the store, (2c) developing a
model of relationships between showrooming potentials and subsequent behavior, (3) analyzing the
role of choice confusion and perceived online search convenience in the online search process and
finally (4) showing how QR codes reduce information search outside the retailer’s channels and
Showrooming potentials and showrooming behavior
62
thus showrooming. We conducted multiple consecutive qualitative and quantitative studies,
including surveys and a laboratory experiment.
Extending existing research, our results provide clear evidence for the complexity of the showroom-
ing phenomenon, i.e. its composition of two separate behaviors after visiting an offline store –
online search behavior (showrooming potentials) and online purchase behavior (showrooming be-
havior). We identified four different showrooming potentials according to the type of information
searched (product vs. price information) and the time and place of search (mobile in-store using a
mobile device or later outside the store). Our results show that the showrooming process can start
with the more exploratory product information search that leads to price information search. More-
over, we figured out that mobile search in-store enhances later search after leaving the store
considering two mediators. Too much online information leads to choice confusion. We also see
that the amount of product information online increases customers’ choice confusion more strongly
than the amount of online prices. In a next step, choice confusion increases customers’ perceived
online search convenience that a mobile device cannot satisfy. As a result, later online information
search increases. This is an important insight for understanding the showrooming process. We fur-
ther confirmed the robustness of our findings across product categories and shopping situations
(although the strength of some relationships differed between product groups). Finally, we tested
whether QR codes are an appropriate strategy to keep customers in retailers’ own channels. We
could not identify direct effects on intended shopping behavior, but we found effects of retailers’
usage of QR codes on type and duration of mobile in-store search. This paper provides an important
contribution to the showrooming literature by differentiating showrooming potentials and show-
rooming behavior. It offers a new conceptualization for research and retail management. More gen-
erally, this paper contributes to research on channel switching behavior (in particular showrooming
and webrooming) by considering that goal hierarchies and adaptive behavior require more complex
analyses of customers’ information search.
3.8 Management implications
Based on the results of our main study, we recommend that retailers should focus especially on cus-
tomers’ mobile search behavior in-store – but not because it immediately causes online shopping at
a competing retailer. The main problem is that it stimulates the postponement of the purchase deci-
sion for additional later online search, which in turn increases showrooming behavior significantly.
Additionally, the showrooming process often starts with mobile search for product information in-
store. Then, customers might automatically come across cheaper prices elsewhere which increases

Showrooming potentials and showrooming behavior
63
online shopping behavior at competing retailers. Hence, retailers must either limit mobile search in-
store or control it in a way that it does not result in a postponement of the purchase decision or in a
purchase transaction with a competing online retailer. However, limiting mobile search in-store is
problematic. Grewal et al. (2018) found that customers using their smartphones in-store spend more
and are therefore an attractive customer group. Consequently, controlling the mobile search process
in-store, as well as simplifying and utilizing it for retailers’ own purposes might be the better strate-
gy. The mediation effects of choice confusion and perceived online search convenience from mo-
bile in-store to later search have also practical implications. Retailers should try to reduce choice
confusion, for example by offering clear and coordinated product ranges. They should further pro-
vide consistent and not confusing information in their offline and online channels.
Perceived search convenience in-store should be maximized as much as possible. This is highly
important as, nowadays, mobile online search behavior in-store is part of the daily buying process
(Fuentes et al., 2017; Fuentes & Svingstedt, 2017; Grewal et al., 2018). Hence, brick-and-mortar
stores should offer free Wi-Fi, in-store technologies like information terminals or freely available
tablets as well as QR codes that directly transfer the mobile product searching customer in-store to
retailers’ own information channels (cf. Jacob, 2018). Especially, the display of online information
provided via QR codes should be optimized for mobile devices in order to enable a convenient in-
formation search.
Alongside these strategies, sales staff should be available and trained to pro-actively contact cus-
tomers showing mobile showrooming potentials. As a postponement of the purchase decision is that
critical, sales staff should try to accelerate purchase decisions of mobile searchers in-store, for ex-
ample through time-limited promotions. The prerequisite for this, however, is that retailers increase
both the quantity and the quality of their service personnel on the sales floor. Furthermore, it is im-
portant to communicate to the sales personnel that mobile searching customers in-store are not lost
and just search for support in their buying decisions. Hence, avoidance strategies as sales person-
nel’s reaction towards mobile searching customers in-store (reported by Rapp et al., 2015) are high-
ly problematic.
3.9 Limitations and future research
A limitation of the survey and complementary studies is the usage of scenarios. However, alterna-
tive retrospective studies of customer journeys face their own difficulties, such as correct remem-
bering of past shopping processes. Consistently, the store was examined as the first touchpoint in

Showrooming potentials and showrooming behavior
64
the studies to ensure comparability of the results since we considered buying and browsing situa-
tions. Nevertheless, we assume that in contrast to browsing customers, customers with a clear pur-
chase intention often search for information online before entering a store. For this reason, future
research should shed more light on diverse sequences of offline and online search behavior. Fur-
thermore, although our samples are not representative, we recruited participants with high online
affinity and experience in showrooming situations. Even though we have selected products that
most participants have already purchased once, respondents may differ in perceived difficulty of the
purchase decision process and the perceived risk of making a purchase. As both aspects may have
an impact on information search, future studies should shed more light on their role in the show-
rooming process. Since we used structural equation modeling, we must interpret causal relation-
ships with caution. However, our theoretical framework and underlying theories support the pro-
posed causal effects and testing models with alternative causal relationships yielded worse model
fit. Future studies should focus on further moderating variables influencing the relationship between
showrooming potentials and showrooming behavior. They should also shed additional light on situ-
ational variables (e.g. availability of sales personnel) and psychological processes (e.g. the impact
of anticipated regret) that stimulate mobile product information search in-store. Finally, additional
experiments, preferably in real shopping environments, should investigate further possibilities to
keep mobile searching customers in retailers’ own channels.
Managerial antecedents of showrooming
65
4 Managerial antecedents of showrooming
Abstract
This study examines how price differences between the online and offline channel and in-
store service influence showrooming behavior. Three consecutive online experiments show
that (1) showrooming increases with larger price disadvantages in the offline channel, (2) that
mere service usage by customers compensates these effects at least partly, while it has no ef-
fect without a price disadvantage (e.g. showrooming probability is lower with a 20% offline
price disadvantage and service usage compared to a 10% price difference without service
usage). (3) Service quality also reduces showrooming, while (4) service availability is only
relevant at high service levels. Furthermore, (5) no service usage results in lower showroom-
ing tendencies than low quality service (i.e. no service is better than low quality service) and
(6) high quality and quickly available service can better compensate effects of price disad-
vantages than mere service usage. Finally, (7) price fairness mediates several of the aforemen-
tioned effects.
Co-author: Stephan Zielke (University of Wuppertal)
Managerial antecedents of showrooming
66
4.1 Introduction
Digitalization has caused dramatic changes in the retail sector. New distribution channels (e.g. mo-
bile shopping) and touchpoints (e.g. apps, social media) have emerged (Gross, 2015; Lemon &
Verhoef, 2016) and offer consumers a multitude of options during their customer journey (Lemon
& Verhoef, 2016). Customers have adapted their behavior to these changes. Research identified
multi-channel customers (Konuş et al., 2008) who use and switch between different channels during
their path to purchase (Frasquet et al., 2015). One of these channel switching behaviors is show-
rooming, in which customers search for information offline before they buy online (Balakrishnan et
al., 2014). This behavior causes serious issues for offline retailers facing losses in sales (Kalyanam
& Tsay, 2013). Moreover, customers use smartphones in-store for tasks that were previously taken
over by sales staff (Fuentes et al., 2017). Against this background, traditional offline retailers have
to realign their raison d’être in the customer journey. They have to find new ways to keep customers
in their own channels. The traditional brick-and-mortar store still plays an important role in the pur-
chasing process, as customers want to touch and feel products (Levin, Levin, & Heath, 2003), they
want to ask questions, seek advice and overall, they seek a unique shopping experience (Rohm &
Swaminathan, 2004). Hence, traditional competences of offline stores have to be optimized.
In recent years, considerable efforts have been made to study the showrooming phenomenon. Pre-
vious studies especially focus on antecedents of showrooming (Arora & Sahney, 2018; Arora et al.,
2017; Balakrishnan et al., 2014; Burns et al., 2019; Dahana et al., 2018; Daunt & Harris, 2017;
Gensler et al., 2017; Kang, 2018) as well as on counter-strategies (Bell et al., 2015; Fassnacht et al.,
2019; Jing, 2018; Kuksov & Liao, 2018; Mehra et al., 2018; Willmott, 2014; Wu et al., 2015).
However, whilst research has identified price as one of the most important antecedents of show-
rooming (Arora et al., 2017; Burns et al., 2019; Gensler et al., 2017), offline retailers can match
prices of online competitors only to a limited extent. Pure online retailers can offer cheaper prices
because of lower cost structures (Brynjolfsson & Smith, 2000). Beyond price, another important
antecedent of showrooming is the lack of service and/or service personnel (or service availability
and quality as factors limiting showrooming). Research often mentions the role of service (Arora &
Sahney, 2018; Arora et al., 2017; Daunt & Harris, 2017; Gensler et al., 2017; Reid et al., 2016; Sit
et al., 2018), but rarely focuses on it explicitly (Fassnacht et al., 2019; Rapp et al., 2015). However,
there is still a lack of research examining how service usage and/or quality compensate for different
levels of price differences between pure online and offline retailers. Hence, the primary research
question is:

Managerial antecedents of showrooming
67
o To what extent can offline retailers compensate a disadvantage in price by service to pre-
vent showrooming behavior? Further questions follow:
o How should this service look like?
o Do availability and quality of service personnel have a different impact on showrooming?
o How does the level of price difference impact showrooming?
o Do customers tolerate small price disadvantages in the offline channel and up to what
price difference is a compensation through service possible at all? And finally:
o What role does perceived price fairness play in this context?
Answering these questions allows retailers to better understand customers’ channel switching be-
havior and moreover enables them to develop strategies to keep customers in their own channels.
The paper contributes to the literature by examining effects of and interactions between offline price
disadvantage levels and service strategies on showrooming behavior. For this purpose, we conduct-
ed three experimental studies. Study A investigates the effects of price differences and service us-
age on showrooming and, besides, the extent to which these effects are mediated by customers’
perception of price fairness. The study also discusses possible interaction effects between price dif-
ferences and service usage. Study B focuses on effects of service availability vs. service quality,
which are relevant for retailers’ allocation of service personnel.
4.2 Theoretical framework
4.2.1 Showrooming
The literature offers diverse definitions that reflect different forms of showrooming (Gensler et al.
2017; Gu & Tayi, 2017; Rapp et al., 2015). We use the definition of “competitive showrooming” by
Gensler et al. (2017, p. 29), in which customers search for information offline at a physical store but
make their purchase online at a competing retailer. The definition explicitly considers the purchase
channel and retailer. This is important, as customers purchasing from a competing online retailer
after visiting a brick-and-mortar store have cause costs, but no turnover in the offline channel
(Gensler et al., 2017). Such competitive showrooming behavior therefore calls for counter-
strategies.
In recent years, diverse studies on the showrooming phenomenon have been published. In addition
to studies that constitute different forms of showrooming (Gu & Tayi, 2017; Gensler et al., 2017;
Jing, 2018) or examine characteristics of showrooming customers (Fernández et al., 2018; Schnei-
der & Zielke, 2020), research mainly focusses on antecedents and effects of showrooming or coun-
ter-strategies against it. Important antecedents of showrooming are in particular price and price con-
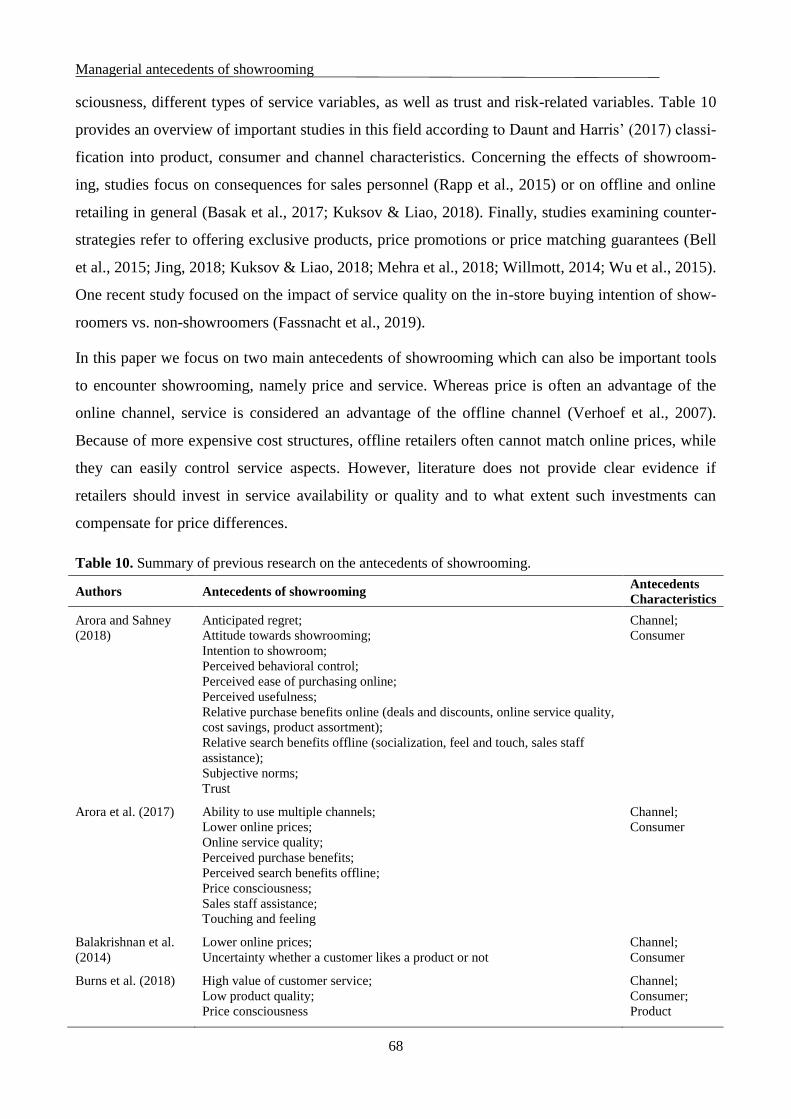
Managerial antecedents of showrooming
68
sciousness, different types of service variables, as well as trust and risk-related variables. Table 10
provides an overview of important studies in this field according to Daunt and Harris’ (2017) classi-
fication into product, consumer and channel characteristics. Concerning the effects of showroom-
ing, studies focus on consequences for sales personnel (Rapp et al., 2015) or on offline and online
retailing in general (Basak et al., 2017; Kuksov & Liao, 2018). Finally, studies examining counter-
strategies refer to offering exclusive products, price promotions or price matching guarantees (Bell
et al., 2015; Jing, 2018; Kuksov & Liao, 2018; Mehra et al., 2018; Willmott, 2014; Wu et al., 2015).
One recent study focused on the impact of service quality on the in-store buying intention of show-
roomers vs. non-showroomers (Fassnacht et al., 2019).
In this paper we focus on two main antecedents of showrooming which can also be important tools
to encounter showrooming, namely price and service. Whereas price is often an advantage of the
online channel, service is considered an advantage of the offline channel (Verhoef et al., 2007).
Because of more expensive cost structures, offline retailers often cannot match online prices, while
they can easily control service aspects. However, literature does not provide clear evidence if
retailers should invest in service availability or quality and to what extent such investments can
compensate for price differences.
Table 10. Summary of previous research on the antecedents of showrooming.
Authors Antecedents of showrooming Antecedents
Characteristics
Arora and Sahney
(2018)
Anticipated regret;
Attitude towards showrooming;
Intention to showroom;
Perceived behavioral control;
Perceived ease of purchasing online;
Perceived usefulness;
Relative purchase benefits online (deals and discounts, online service quality,
cost savings, product assortment);
Relative search benefits offline (socialization, feel and touch, sales staff
assistance);
Subjective norms;
Trust
Channel;
Consumer
Arora et al. (2017) Ability to use multiple channels;
Lower online prices;
Online service quality;
Perceived purchase benefits;
Perceived search benefits offline;
Price consciousness;
Sales staff assistance;
Touching and feeling
Channel;
Consumer
Balakrishnan et al.
(2014)
Lower online prices;
Uncertainty whether a customer likes a product or not
Channel;
Consumer
Burns et al. (2018) High value of customer service;
Low product quality;
Price consciousness
Channel;
Consumer;
Product

Managerial antecedents of showrooming
69
Authors Antecedents of showrooming Antecedents
characteristics
Dahana et al. (2018) High involvement;
Internet experience;
Perceived risks in online shopping;
Price consciousness;
Prior knowledge;
Usage of focal internet device;
Younger age
Consumer;
Product
Daunt and Harris
(2017)
In-store shopping savviness;
Internet savviness;
Product acquisition value;
Product availability;
Product involvement;
Product price;
Technological speed of change;
Trust in in-store sales employees;
Trust in online stores;
Value of in-store shopping;
Value of online shopping
Channel;
Consumer;
Product
Gensler et al. (2017) Computer category;
Higher online search costs;
Higher quality;
Lower online price;
Perceived time pressure;
Price dispersion;
Unavailability of in-store personnel
Channel;
Product
Kang (2018) Information attainment;
Price comparison;
Social interaction
Channel
Reid et al. (2016) Access convenience;
Discounting;
Greater product availability;
Greater product selection;
Price reduction;
Security;
Time savings;
Website functions
Channel;
Product
Sit et al. (2018) Non-price attributes (brand reputation and customer service);
Price matching;
Value trade-off
Channel;
Product
4.2.2 Conceptual model and development of hypotheses
Our research model is grounded in equity theory (Adams, 1965). It reflects the idea of social ex-
change in conjunction with the concept of perceived fairness. Perceived fairness is the result of a
relationship of contribution (input) and reward (output) of a person. If the ratio of input and output
is equal, this results in perceived fairness. If it is unequal and disadvantageous, it results in per-
ceived unfairness. Inequity results in negative emotions and hence, motivates people to change their
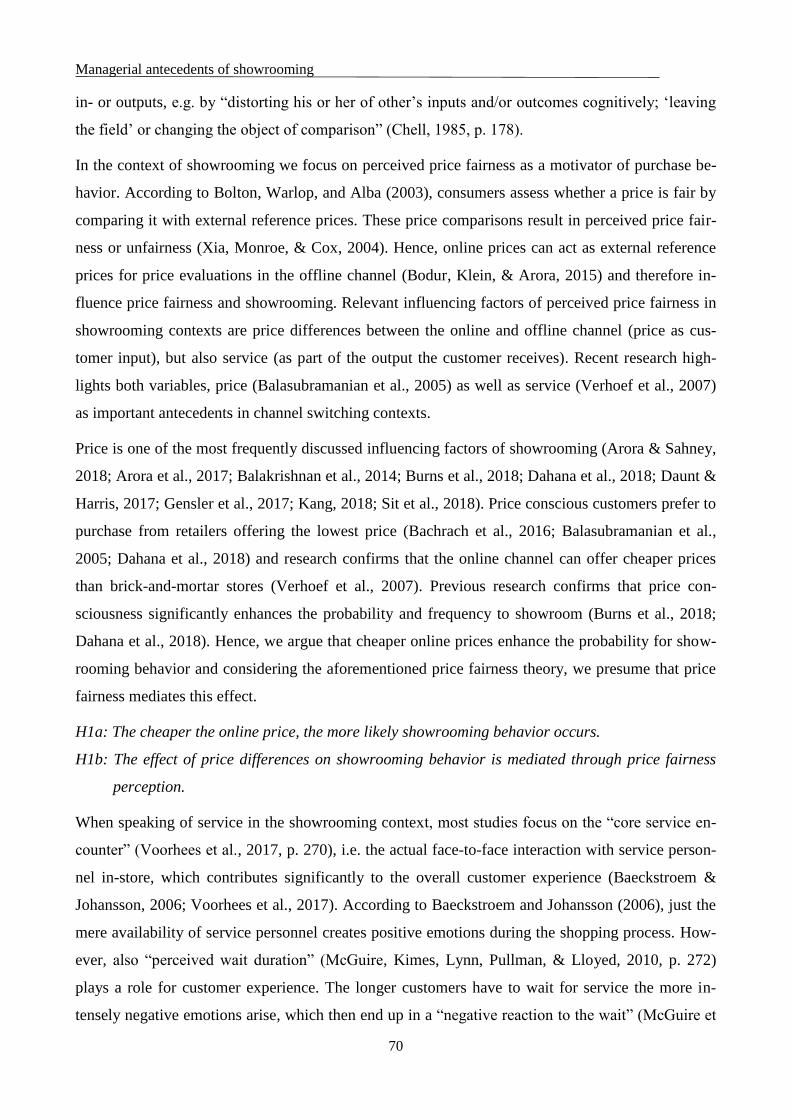
Managerial antecedents of showrooming
70
in- or outputs, e.g. by “distorting his or her of other’s inputs and/or outcomes cognitively; ‘leaving
the field’ or changing the object of comparison” (Chell, 1985, p. 178).
In the context of showrooming we focus on perceived price fairness as a motivator of purchase be-
havior. According to Bolton, Warlop, and Alba (2003), consumers assess whether a price is fair by
comparing it with external reference prices. These price comparisons result in perceived price fair-
ness or unfairness (Xia, Monroe, & Cox, 2004). Hence, online prices can act as external reference
prices for price evaluations in the offline channel (Bodur, Klein, & Arora, 2015) and therefore in-
fluence price fairness and showrooming. Relevant influencing factors of perceived price fairness in
showrooming contexts are price differences between the online and offline channel (price as cus-
tomer input), but also service (as part of the output the customer receives). Recent research high-
lights both variables, price (Balasubramanian et al., 2005) as well as service (Verhoef et al., 2007)
as important antecedents in channel switching contexts.
Price is one of the most frequently discussed influencing factors of showrooming (Arora & Sahney,
2018; Arora et al., 2017; Balakrishnan et al., 2014; Burns et al., 2018; Dahana et al., 2018; Daunt &
Harris, 2017; Gensler et al., 2017; Kang, 2018; Sit et al., 2018). Price conscious customers prefer to
purchase from retailers offering the lowest price (Bachrach et al., 2016; Balasubramanian et al.,
2005; Dahana et al., 2018) and research confirms that the online channel can offer cheaper prices
than brick-and-mortar stores (Verhoef et al., 2007). Previous research confirms that price con-
sciousness significantly enhances the probability and frequency to showroom (Burns et al., 2018;
Dahana et al., 2018). Hence, we argue that cheaper online prices enhance the probability for show-
rooming behavior and considering the aforementioned price fairness theory, we presume that price
fairness mediates this effect.
H1a: The cheaper the online price, the more likely showrooming behavior occurs.
H1b: The effect of price differences on showrooming behavior is mediated through price fairness
perception.
When speaking of service in the showrooming context, most studies focus on the “core service en-
counter” (Voorhees et al., 2017, p. 270), i.e. the actual face-to-face interaction with service person-
nel in-store, which contributes significantly to the overall customer experience (Baeckstroem &
Johansson, 2006; Voorhees et al., 2017). According to Baeckstroem and Johansson (2006), just the
mere availability of service personnel creates positive emotions during the shopping process. How-
ever, also “perceived wait duration” (McGuire, Kimes, Lynn, Pullman, & Lloyed, 2010, p. 272)
plays a role for customer experience. The longer customers have to wait for service the more in-
tensely negative emotions arise, which then end up in a “negative reaction to the wait” (McGuire et
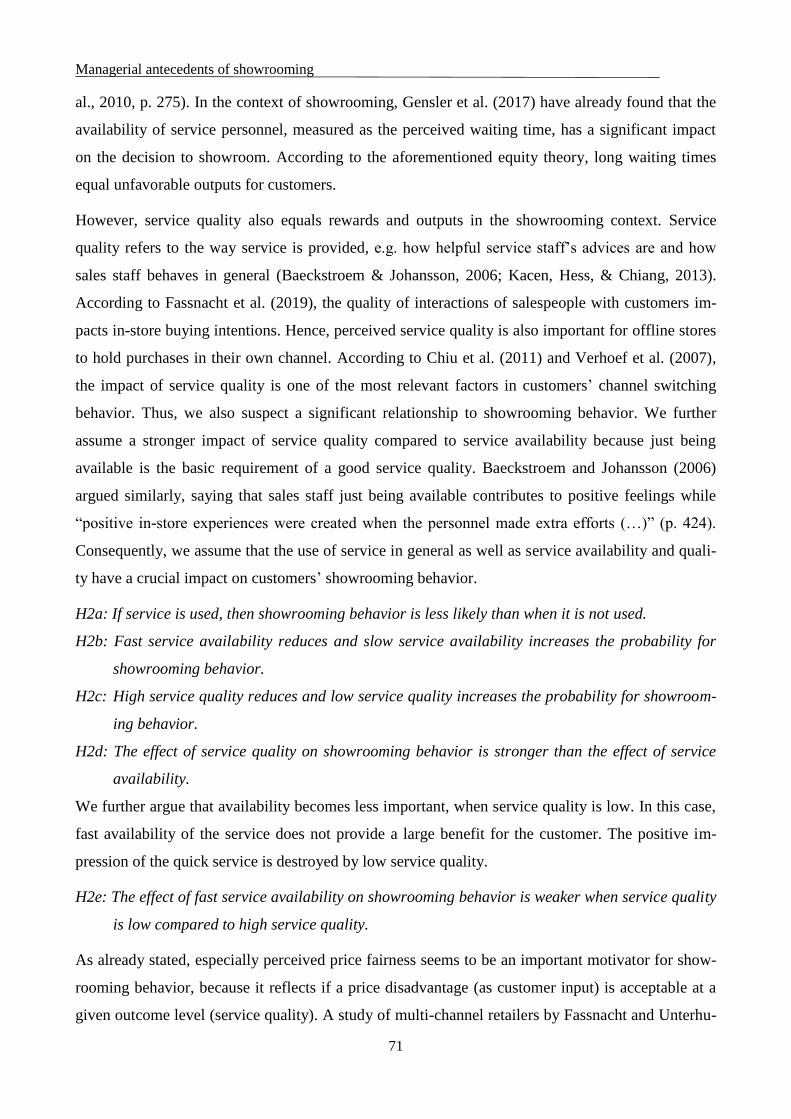
Managerial antecedents of showrooming
71
al., 2010, p. 275). In the context of showrooming, Gensler et al. (2017) have already found that the
availability of service personnel, measured as the perceived waiting time, has a significant impact
on the decision to showroom. According to the aforementioned equity theory, long waiting times
equal unfavorable outputs for customers.
However, service quality also equals rewards and outputs in the showrooming context. Service
quality refers to the way service is provided, e.g. how helpful service staff’s advices are and how
sales staff behaves in general (Baeckstroem & Johansson, 2006; Kacen, Hess, & Chiang, 2013).
According to Fassnacht et al. (2019), the quality of interactions of salespeople with customers im-
pacts in-store buying intentions. Hence, perceived service quality is also important for offline stores
to hold purchases in their own channel. According to Chiu et al. (2011) and Verhoef et al. (2007),
the impact of service quality is one of the most relevant factors in customers’ channel switching
behavior. Thus, we also suspect a significant relationship to showrooming behavior. We further
assume a stronger impact of service quality compared to service availability because just being
available is the basic requirement of a good service quality. Baeckstroem and Johansson (2006)
argued similarly, saying that sales staff just being available contributes to positive feelings while
“positive in-store experiences were created when the personnel made extra efforts (…)” (p. 424).
Consequently, we assume that the use of service in general as well as service availability and quali-
ty have a crucial impact on customers’ showrooming behavior.
H2a: If service is used, then showrooming behavior is less likely than when it is not used.
H2b: Fast service availability reduces and slow service availability increases the probability for
showrooming behavior.
H2c: High service quality reduces and low service quality increases the probability for showroom-
ing behavior.
H2d: The effect of service quality on showrooming behavior is stronger than the effect of service
availability.
We further argue that availability becomes less important, when service quality is low. In this case,
fast availability of the service does not provide a large benefit for the customer. The positive im-
pression of the quick service is destroyed by low service quality.
H2e: The effect of fast service availability on showrooming behavior is weaker when service quality
is low compared to high service quality.
As already stated, especially perceived price fairness seems to be an important motivator for show-
rooming behavior, because it reflects if a price disadvantage (as customer input) is acceptable at a
given outcome level (service quality). A study of multi-channel retailers by Fassnacht and Unterhu-

Managerial antecedents of showrooming
72
ber (2016) shows that lower prices are not necessarily considered to be fairer. They reveal that con-
sumers’ implicit assumptions and information about costs to the retailer as well as the way price
differences are communicated play a crucial role as determinants of consumers’ reaction when fac-
ing channel-based price differences. Concerning implicit assumptions about costs, offered and uti-
lized services might play a role. Moreover, with regard to equity theory we assume that service
usage as well as availability and quality are rewards for customers whereas the price to pay is the
contribution to make. Hence, service usage, its availability and quality contribute to customers’ per-
ceived price fairness which in a next step reduces showrooming behavior.
H2f-h: The effect of (f) service usage, (g) availability and (h) quality on showrooming behavior is
mediated through price fairness perception.
As discussed before, consumers assess whether a price is fair by using external reference prices.
While showrooming, customers compare the offered offline price with prices of online retailers. In
a next step, customers set this input, speaking in terms of equity theory, in relation to received re-
wards, i.e. the quality of the product itself and additionally perceived service quality in-store (For-
nell, Johnson, Anderson, Cha, & Bryant, 1996). In their qualitative study on showrooming, Sit et al.
(2018) conclude that customers finalize their purchase decision based on the trade-off between eco-
nomic (e.g. price, price differences) and service-excellence (e.g. offered service) factors. We argue
that a price disadvantage is the trigger of showrooming intentions and that service can cushion its
effect. Hence, service should only have an impact on showrooming, when the trigger of a price dis-
advantage is present. Formally, the online-offline price difference and service should interact. So,
we propose:
H3: In the absence of a price difference, service usage compared to non-usage has no effect on
showrooming behavior, whereas in the presence of a price difference service usage compared
to non-usage has a mitigating effect on showrooming behavior.
Figure 13 shows the conceptual model. Study A examines the direct effects of price differences
(H1a) and service-usage (H2a) on showrooming behavior and their interaction effects (H3). Fur-
thermore, it analyses if perceived price fairness acts as a mediator (H1b; H2f). Study B focuses on
service by examining the effects of service quality and availability on showrooming behavior sepa-
rately (H2b, H2c), in comparison (H2d) and interactively (H2e). This study also considers the me-
diation effect of price fairness (H2g/h). In addition to the hypotheses, study C looks at the impact of
price differences on showrooming behavior in case of high service quality and fast availability.

Managerial antecedents of showrooming
73
4.3 Study A: price differences and service usage
Study A analyzes the impact of price difference levels and service usage on showrooming behavior
and offline purchases (H1a, H2a and H3). It further considers the mediating role of price fairness
perception (H1b, H2f).
4.3.1 Research design and sample description
We conducted a scenario experiment and collected data using an online survey. The scenarios de-
scribe a situation in which respondents have found a pair of sports shoes at a pure online retailer
Figure 13. Conceptual framework.
Price fairness
perception
Showrooming
behavior
Offline
purchase
Study A:
Price difference
(0% / 5% / 10% / 20%)
Service usage
(yes / no)
Study B:
Service availability
(fast: after 5 min available /
slow: after 15 min available)
Service quality
(high: friendly and knowledgeable /
low: unfriendly and uninformed)
Study C:
Price difference
(0% / 5% / 10% / 20%)
Fast service availability
(after 5 min available) and
high service quality
(friendly and knowledgeable)
Purchase intentions:

Managerial antecedents of showrooming
74
that they want to try on at an offline store. We decided to focus on sports shoes, because firstly, we
assumed that most respondents have shopping experience with sports shoes. Secondly, sports shoes
(as clothing and footwear in general) are a product that customers want to touch and feel before
making a purchase (Frasquet et al., 2015; Levin et al., 2003) and thirdly, sports shoes are a product
with a need of explanation regarding fit, purpose of use, materials and technologies. Therefore, they
are a typical showrooming product (Van Baal & Dach, 2005). For simplicity reasons, we focus on a
pure offline vs. online retailer. Respondents were asked to imagine a situation in which they had a
clear intention to buy a pair of sports shoes (planned purchase).
We used a between-subject scenario design with four price difference levels and two levels of ser-
vice usage (4x2-design). We selected the four price difference levels (0%, 5%, 10% and 20%) based
on already existing studies comparing prices between the offline and online channel (Homburg,
Lauer, & Vomberg, 2019; Keen, Wetzels, de Ruyter, & Feinberg, 2004). The offline price is always
130 EUR. The online price was calculated based on the respective percentage levels, but communi-
cated in a EUR amount. For service, scenarios included either service usage or no usage (Homburg
et al., 2019). In the service usage condition, the scenario explains: “At Run4Fun you can examine
the sports shoes in detail, try them on and get advice from the sales staff. The salesperson measures
your feet and makes a fit analysis to determine the right size of your favorite sports shoes”, whereas
in the non-usage condition the scenario text describes that customers dispense on additional services
by the sales staff. Appendix D includes the complete scenario description.
The scale for price fairness is based on previous studies (Fassnacht & Unterhuber, 2016; Malc,
Mumel, & Pisnik, 2016) and includes four items (“I consider the offline retailer’s price for sports
shoes to be acceptable/justifiable/fair/reasonable”) measured on seven-point Likert-scales (1 = “I do
not agree at all” and 7 = “I totally agree”; α = .939). The probability of showrooming and offline
purchase intention were measured with single items on a seven-point Likert-scale (“I order the
sports shoes online at sportdreamz.de.” and “I purchase the sports shoes in the retail store of
Run4Fun.”). As these two variables reflect concrete behaviors, single item-scales are suitable ac-
cording to Rossiter (2002).
Although, we did not include offline purchasing explicitly in the hypotheses, we included it as a
supplementary dependent variable, as it is the counterpart of showrooming. Results for showroom-
ing behavior describe respondents’ tendency to showroom whereas the results for offline purchase
intention might reflect customer loyalty towards the offline channel. Hence, we consider that actual
purchase behavior results from a combination of both behavioral tendencies. Due to space re-
strictions, we only report results for offline purchase intention in the text when they offer additional

Managerial antecedents of showrooming
75
insights (however, they are included in all results tables).
For data collection, university students distributed a link to the questionnaire together with a pass-
word via their social networks (friends, acquaintances, relatives, etc.). This approach guaranteed at
least some online affinity of the sample. The online questionnaire further guaranteed anonymity to
prevent socially desirable responses, which we expect in showrooming contexts. The final sample
consists of 699 participants. About 54% are female. The average age is 32 and ranges between 15
and 86 years (see Appendix E for more details).
4.3.2 Analysis and results
We conducted a MANOVA with showrooming and offline shopping intention as dependent and
price differences and service usage as independent variables. Although, Levene’s test indicated
variance heterogeneity (p < .001), we report F-Test results, as group sizes were approximately equal
and sufficiently large (see Table 11 for MANOVA results and Table 12 for mean values of
dependent variables in the eight scenarios).
Table 11. Results of MANOVA with price differences and service usage as independent variables (study A).
Price differences
Dependent varia-
bles
Wilks’s lamb-
da
F-
value
df Effect size
(η²)
p < Post hoc comparison by Games-
Howell
multivariate .795 27.906 6 .108 .000 -
Univariate
Showrooming
Offline purchase
-
-
55.076
40.016
3
3
.193
.148
.000
.000
0 < 5 < 10 < 20
0 > † 5 > 10 > 20
Service usage
Dependent varia-
bles
Wilks’s lamb-
da
F-
value
df Effect size
(η²)
p < Comparison of mean values
multivariate .948 18.816 2 .052 .000 -
Univariate
Showrooming
Offline purchase
-
-
28.217
34.234
1
1
.039
.047
.000
.000
u < n
u > n
Price difference x service usage
Dependent varia-
bles
Wilks’s lamb-
da
F-
value
df Effect size
(η²)
p <
multivariate .983 1.986 6 .009 .065
Univariate
Showrooming
Offline purchase
-
-
2.589
2.925
3
3
.011
.013
.052
.033
Note: 0 = 0% price differences; 5 = 5% price differences; 10 = 10% price differences; 20 = 20% price differences / u = service usage;
n = service non-usage; </> reflects significant differences at p < .05; † marginal significant differences p < .10.

Managerial antecedents of showrooming
76
Price and service explain 22% of the variance of showrooming intention. Results show significant
main effects of price differences on showrooming [F(3,690) = 55.076, p < .001, η²=.193]. The main
effect of service usage on showrooming behavior [F(1,690) = 28.217, p < .001, η²=.039] is also
significant. Post hoc comparisons of price differences show that no price difference between the
online and offline channel leads to the lowest probability to showroom. With increasing price dif-
ferences, the probability of showrooming increases significantly. Hence, results support H1a. Fur-
thermore, service usage leads to a significantly lower probability of showrooming than service non-
usage. This supports H2a.
Results also reveal a marginally significant multivariate interaction effect between price differences
and service usage (Wilk’s lambda: [F(6,1378) = 1.986, p = .065, η²=.009]). Univariate effects are
marginally significant for showrooming (p = .052) and significant for offline purchase intention
(p = .033). Interactions plots presented in Figure 14 and results presented in Table 12 illustrate that
without a price disadvantage, service usage has no relevance for showrooming and offline purchas-
es, while service usage significantly reduces showrooming at all price difference levels (p < .001).
Hence, results support H3.
Table 12. Mean values and standard deviation of showrooming and offline purchase behavior
according to price difference levels and service usage (study A).
Showrooming behavior
Service usage Service
non-usage
Differences
(non-usage – usage)
T-test
(p-values) Total
n = 386 n = 313
0% price differences 2.21
(1.58)
2.29
(1.82)
.08 .534 2.25
(1.69)
5% price differences 2.63
(1.63)
3.64
(2.17)
1.01 .000 3.06
(1.94)
10% price differences 3.41
(2.03)
4.31
(1.97)
.90 .000 3.79
(2.04)
20 % price differences 4.20
(2.06)
5.26
(1.79)
1.06 .000 4.72
(2.00)
Total 3.09
(1.97)
3.88
(2.22)
.79 .000 3.44
(2.12)
Offline purchase behavior
Service usage Service non-usage
Differences
(non-usage – usage)
T-test
(p-values) Total
n = 386 n = 313
0% price differences 5.89
(1.42)
5.70
(1.79)
-.19 .118 5.80
(1.60)
5% price differences 5.67
(1.57)
4.92
(1.96)
-.75 .000 5.35
(1.78)
10% price differences 5.07
(1.91)
4.12
(1.99)
-.95 .000 4.67
(1.99)
20 % price differences 4.47
(1.82)
3.18
(1.84)
-1.29 .000 3.84
(1.94)
Total 5.29
(1.77)
4.47
(2.11)
-.82 .000 4.93
(1.97)
Note: Standard deviation in parentheses.

Managerial antecedents of showrooming
77
A comparison of plots for showrooming vs. offline purchase intention also reveals interesting in-
sights. While the effect of service usage on showrooming behavior is similar at all price disad-
vantage levels (parallel lines in Figure 14), the effect of service usage on offline purchase intention
increases with the price disadvantage (dispersing lines in Figure 14). Furthermore, the plots show
that a 10% price difference with service usage is more likely to result in an offline purchase than a
5% price difference without service usage. This effect becomes even larger for comparing a 20%
price difference plus service usage with a 10% difference without service usage.
Figure 14. Interaction plots of price differences and service usage on showrooming and offline pur-
chase behavior (study A).
We further analyzed how price fairness mediates the effects of price differences (H1b) and service
usage (H2f) on showrooming. Since price difference is a categorial variable with four categories,
we used a sequential coding system to conduct the mediation analysis with Hayes’ (2018) process
macro (model 4). Using 5,000 bootstrap samples, two of three 95% bootstrap confidence intervals
for the relative indirect effects of price difference on the probability of showrooming show values
entirely above zero (10% compared to 5%: β = .146, CI = .064 to .259 and 20% compared to 10%:
β = 140, CI = .050 to .264). Moreover, all relative direct effects are significant (10% compared to
5%: β = .586, CI = .186 to .985; 20% compared to 10%: β = .769, CI = .368 to 1.170). Hence, price
fairness partially mediates the effects of price differences on showrooming, which supports H1b.
Price fairness also mediates the effect of service usage on showrooming behavior (indirect effect:
β = .166, CI = .077 to .271). Again, also the direct effect is significant (β = .604, CI = .298 to .909),
which underlines partial mediation effect, supporting H2f.
Results of study A show the impacts of price differences and customers’ service usage in the show-
rooming context. Whereas price differences increase the probability to showroom, the usage of ser-
2,21 2,63
3,41
4,20 2,29
3,64 4,31
5,26
1
2
3
4
5
6
7
Showrooming behavior
Service usage Service non-uasge
5,89 5,67 5,07
4,47 5,70
4,92
4,12
3,18
1
2
3
4
5
6
7
Offline purchase behavior
Service usage Service non-usage

Managerial antecedents of showrooming
78
vice compared to non-usage significantly reduces it. Moreover, service usage is only relevant when
a price disadvantage exists and for offline purchases it becomes more relevant with increasing price
differences. These results raise the question of how exactly service must be designed in order to
increase the probability of in-store purchases.
4.4 Study B: service availability and service quality
Study B examines the impact of service availability and service quality on showrooming behavior
and offline purchase intention (H2b-e). It further considers the mediating role of price fairness
(H2g/h).
4.4.1 Research design and sample description
As in the previous study, we conducted an experimental online survey with different scenarios. We
used a 2x2-design (plus control group), in which we manipulated service quality (high vs. low) and
service availability (fast vs. slow). For manipulating service quality and availability we consulted
recent studies. Based on Gensler et al. (2017), we manipulated fast availability by five minutes
waiting time and slow availability by fifteen minutes. In terms of service quality, we manipulated
high service quality by writing “Sales staff makes a friendly and professional impression on you.
The salesperson is motivated and asks you questions to understand what is important to you. All in
all, you perceive the service quality as high”. For low service quality, we included “Sales staff
makes an unfriendly and unprofessional impression on you. The salesperson does not ask you any
questions to find out your needs and seems unmotivated. Overall, you perceive the service quality
as low”. Overall, we had five scenarios, considering service availability (fast vs. slow), service
quality (high vs. low) and no service offering at all in the control group (see Appendix D).
As in the first study, the scenarios presented a sports shoes shopping situation, in which participants
have found a pair of shoes at a pure online retailer that they try on at an offline store. We set the
online price at 117 EUR and the offline price at 130 EUR (i.e. the online price is 10% cheaper) in
all scenarios. We used the same data collection procedure and item scales as in study A (price fair-
ness: α = .929). The final sample consists of 324 participants with 58% females and a mean age of
31, which is comparable to sample characteristics of study A (see Appendix E for more details).
The number of participants ranged between 61 and 74 for the different scenarios (see Appendix D).
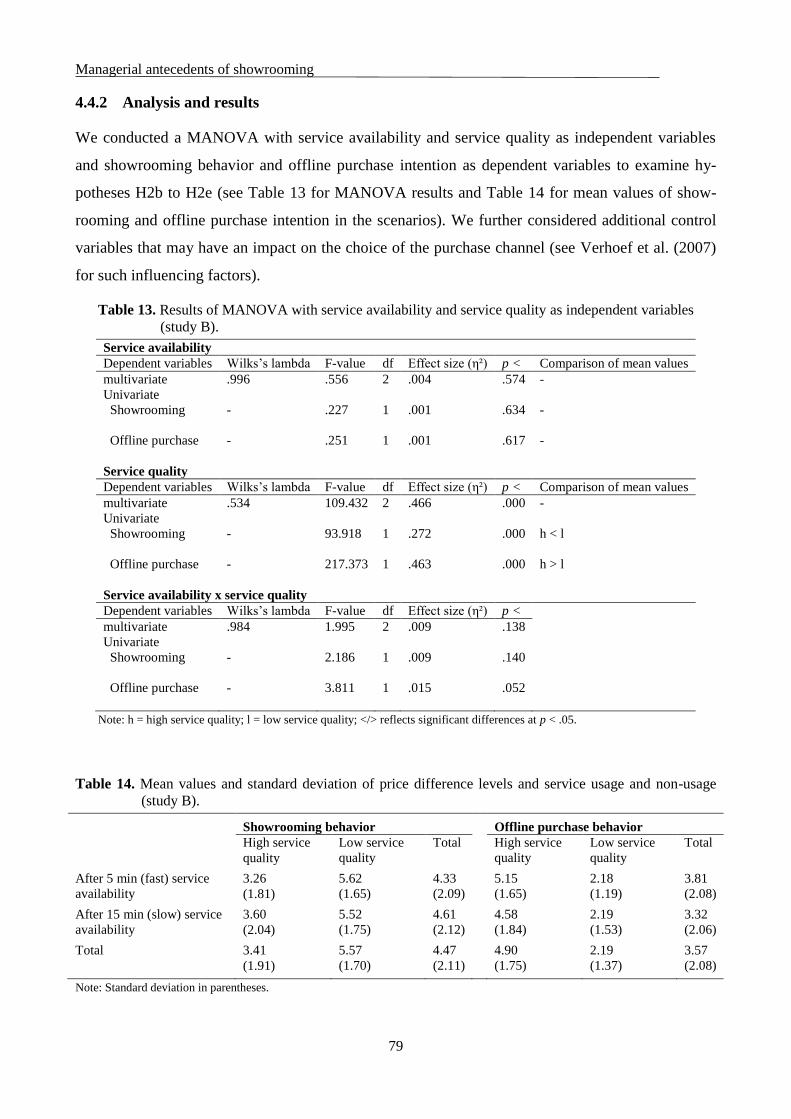
Managerial antecedents of showrooming
79
4.4.2 Analysis and results
We conducted a MANOVA with service availability and service quality as independent variables
and showrooming behavior and offline purchase intention as dependent variables to examine hy-
potheses H2b to H2e (see Table 13 for MANOVA results and Table 14 for mean values of show-
rooming and offline purchase intention in the scenarios). We further considered additional control
variables that may have an impact on the choice of the purchase channel (see Verhoef et al. (2007)
for such influencing factors).
Table 13. Results of MANOVA with service availability and service quality as independent variables
(study B).
Service availability
Dependent variables Wilks’s lambda F-value df Effect size (η²) p < Comparison of mean values
multivariate .996 .556 2 .004 .574 -
Univariate
Showrooming
Offline purchase
-
-
.227
.251
1
1
.001
.001
.634
.617
-
-
Service quality
Dependent variables Wilks’s lambda F-value df Effect size (η²) p < Comparison of mean values
multivariate .534 109.432 2 .466 .000 -
Univariate
Showrooming
Offline purchase
-
-
93.918
217.373
1
1
.272
.463
.000
.000
h < l
h > l
Service availability x service quality
Dependent variables Wilks’s lambda F-value df Effect size (η²) p <
multivariate .984 1.995 2 .009 .138
Univariate
Showrooming
Offline purchase
-
-
2.186
3.811
1
1
.009
.015
.140
.052
Note: h = high service quality; l = low service quality; </> reflects significant differences at p < .05.
Table 14. Mean values and standard deviation of price difference levels and service usage and non-usage
(study B).
Showrooming behavior Offline purchase behavior
High service
quality
Low service
quality
Total High service
quality
Low service
quality
Total
After 5 min (fast) service
availability
3.26
(1.81)
5.62
(1.65)
4.33
(2.09)
5.15
(1.65)
2.18
(1.19)
3.81
(2.08)
After 15 min (slow) service
availability
3.60
(2.04)
5.52
(1.75)
4.61
(2.12)
4.58
(1.84)
2.19
(1.53)
3.32
(2.06)
Total 3.41
(1.91)
5.57
(1.70)
4.47
(2.11)
4.90
(1.75)
2.19
(1.37)
3.57
(2.08)
Note: Standard deviation in parentheses.

Managerial antecedents of showrooming
80
The model explains 35.5% of showrooming behavior. Results show a significant effect of service
quality on showrooming behavior [F(1,252) = 93.918, p < .001, η²=.272], but no effect of service
availability [F(1,252) = .227, p = .634, η²=.001]. More precisely, high service quality reduces the
probability to showroom whereas low service quality increases it significantly. These results sup-
port H2c but not H2b. Simultaneously, in the absence of a significant main effect of service availa-
bility we can conclude that service quality has a stronger effect on showrooming behavior than ser-
vice availability. Hence, H2d is supported. Furthermore, a marginally significant interaction effect
exists between service availability and quality [F(2,251) = 3.811, p = .052, η²=.015] on offline pur-
chase intention (but not on showrooming behavior). Mean values presented in Table 14 indicate that
with high service quality, a short waiting time increases offline purchase intention, while this effect
does not exist in low service quality conditions. Moreover, for the high service quality condition
mean values for showrooming behavior show a non-significant but nevertheless similar trend in the
opposite direction (fast service availability reduces showrooming probability at high service levels).
So, although results cannot confirm H2e, they indicate a trend in the assumed direction.
In a next step, we tested whether price fairness mediates the effect of service quality on purchase
intention using Hayes’ (2018) process macro (model 4). We did not test the mediation for service
availability, as the main effect was not significant. Results indicate that price fairness partially me-
diates the indirect effect of service quality on showrooming (β = -.223, CI = -.448 to -.008). The
direct effect is also significant, indicating partial mediation (β = -1.854, CI = -2.346 to -1.362).
Consequently, H2h is confirmed whereas H2g is not. Table 15 summarizes the results of the hy-
potheses tests from both studies.
We further conducted an additional MANOVA analysis to compare the four service scenarios with
no service availability. Results show a main effect of scenarios on the probability for showrooming
[F(4,319) = 22.712, p < .001, η²=.222]. Games Howell post hoc comparisons show that offering no
service at all results in significantly lower showrooming behavior (M: 4.68, SD: 2.01) than offering
service of low quality after 5 min (M: 5.62, SD: 1.65; p = .040) and marginal significantly lower
showrooming behavior than offering service of low quality after 15 min (M: 5.52, SD: 1.75;
p = .090). In contrast, offering high service quality reduces showrooming behavior compared to a
situation with no service (5 min: M: 3.26, SD: 1.81; p < .001; 15 min: M: 3.60, SD: 2.04; p = .032).

Managerial antecedents of showrooming
81
Table 15. Results of hypotheses tests.
Antecedents Hypotheses Studies Results
Price H1a The cheaper the online price, the more likely showrooming behavior
occurs.
A
H1b The effect of price differences on showrooming behavior is mediated
through price fairness perception.
A
Service H2a If Service is used, then showrooming behavior is less likely than
when it is not used.
A
H2b Fast service availability reduces and slow service availability increas-
es the probability for showrooming behavior.
B
H2c High service quality reduces and low service quality increases the
probability for showrooming behavior.
H2d The effect of service quality on showrooming behavior is stronger
than the effect of service availability.
B
H2e The effect of fast service availability on showrooming behavior is
weaker when service quality is low compared to high service quality.
B
H2f/g/h The effect of (f) service usage, (g) availability and (h) quality on
showrooming behavior is mediated through price fairness perception.
A and
B
//
Price
x
Service
H3 In the absence of a price difference, service usage compared to non-
usage had no effect on showrooming behavior, whereas in the pres-
ence of a price difference service usage compared to non-usage has a
mitigating effect on showrooming behavior.
A
Results of study B indicate that high service quality reduces the probability for showrooming and
the effect is mediated through price fairness perception. Besides, service availability does not show
significant effects. However, there is a marginally significant interaction effect between service
quality and availability on offline purchase intention. This interaction indicates that service availa-
bility is at least relevant when service quality is high. An analysis of the interaction effect on the
probability to showroom shows similar tendencies (in reversed direction). Further, no sales staff
increases the probability of showrooming less than low quality service.
4.5 Study C: price differences with fast service availability and high service
quality
While study B indicated that offline retailers can reduce showrooming by offering service of high
quality and fast availability, study C analyzes how such service can compensate effects of different
offline price disadvantages.
4.5.1 Research design and sample description
Besides examining the hypotheses, we additionally conducted study C to test whether high service
quality and fast availability reduce the increasing effect of price differences on showrooming be-
havior stronger than service usage online (study A). Therefore, study C replicates study A in terms

Managerial antecedents of showrooming
82
of study design, data collection, questionnaire design and measures (see Appendix F). However,
instead of manipulating service usage, all scenarios describe service usage of high quality
(knowledge and friendliness) and fast availability (after 5 min). Price differences between the online
and offline retailer were manipulated as in study A (0%, 5%, 10% and 20%; see Appendix D). In
this study, we only included showrooming intention as a dependent variable. The final sample con-
tains 113 participants, including 62% women. The average age is 38 years (see Appendix E for
more details).
4.5.2 Analysis and results
We firstly conducted an ANOVA analyzing the impact of price differences under high service
quality and fast service availability on showrooming behavior. As Levene’s indicates variance
heterogeneity (p =.001) and group sizes are smaller than in studies A and B, we rely on the more
robust Brown-Forsythe and Welch test (see Table 16 for ANOVA results and Table 17 for mean
values of dependent variables in the four scenarios). As in study A, results show a significant main
effect of price differences (Brown-Forsythe: F(3,109) = 4.350, p = .006; Welch test:
F(3,109) = 3.760, p = .016). Price differences explain 8.4% of the variance in the model. Games-
Howell post hoc comparisons show that no price difference (0%) and 5% significantly result in a
lower showrooming probability than 20% price differences (p = .015 and p = .030). Compared to
study A, all tendencies are the same but fewer group differences are significant.
Table 16. Results of ANOVA with price differences as independent variable and showrooming behavior as
dependent variable (study C).
Price differences
Dependent
variables
F-value df Effect size (η²) p < Post hoc
comparison by
Games-Howell
Showrooming 4.403 3 .108 .006 0 < 20
5 < 20 Note: 0 = 0% price differences; 5 = 5% price differences; 10 = 10% price differences; 20 = 20% price differences; < reflects signifi-
cant differences at p < .05.
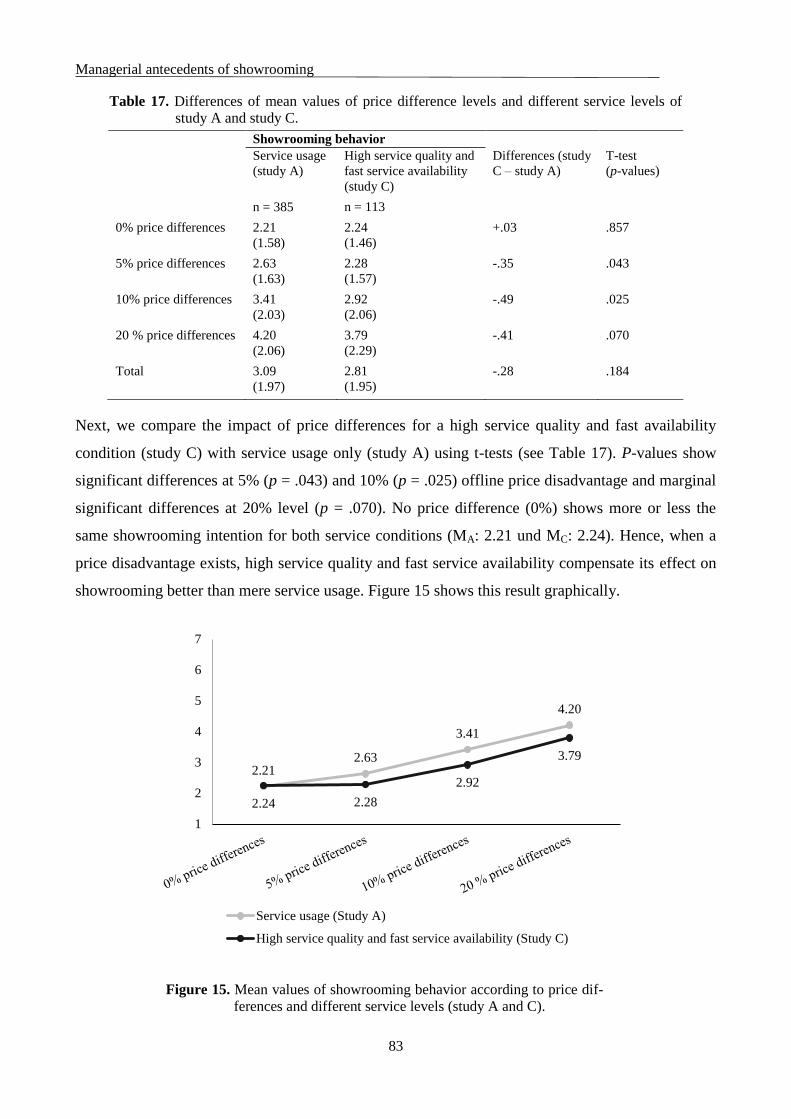
Managerial antecedents of showrooming
83
Table 17. Differences of mean values of price difference levels and different service levels of
study A and study C.
Showrooming behavior
Service usage
(study A)
High service quality and
fast service availability
(study C)
Differences (study
C – study A)
T-test
(p-values)
n = 385 n = 113
0% price differences 2.21
(1.58)
2.24
(1.46)
+.03 .857
5% price differences 2.63
(1.63)
2.28
(1.57)
-.35 .043
10% price differences 3.41
(2.03)
2.92
(2.06)
-.49 .025
20 % price differences 4.20
(2.06)
3.79
(2.29)
-.41 .070
Total 3.09
(1.97)
2.81
(1.95)
-.28 .184
Next, we compare the impact of price differences for a high service quality and fast availability
condition (study C) with service usage only (study A) using t-tests (see Table 17). P-values show
significant differences at 5% (p = .043) and 10% (p = .025) offline price disadvantage and marginal
significant differences at 20% level (p = .070). No price difference (0%) shows more or less the
same showrooming intention for both service conditions (MA: 2.21 und MC: 2.24). Hence, when a
price disadvantage exists, high service quality and fast service availability compensate its effect on
showrooming better than mere service usage. Figure 15 shows this result graphically.
Figure 15. Mean values of showrooming behavior according to price dif-
ferences and different service levels (study A and C).
2.21 2.63
3.41
4.20
2.24 2.28
2.92
3.79
1
2
3
4
5
6
7
Service usage (Study A)
High service quality and fast service availability (Study C)
Managerial antecedents of showrooming
84
To sum up, study C confirms the results of study A regarding an increasing showrooming
probability with increasing price disadvantage of the offline channel. Further, a comparison of study
C with results of study A reveals that at all price disadvantage levels (price difference of 5%, 10%
and 20%), the probability of showrooming is lower under high service quality and fast service
availability compared to service usage only. Thus, offering service of high quality and fast availa-
bility is a promising strategy for reducing showrooming behavior.
4.6 General discussion
This study contributes to the literature by analyzing the effect of different price and service levels
on showrooming behavior. In two studies, we found that the probability of showrooming increases
with the price disadvantage in the offline channel. Vice versa the probability of offline purchases
decreases. Considering service, we can state that service usage is better than non-usage to counter-
act showrooming behavior. Without a price disadvantage, service usage has no effect. However, in
situations with price disadvantage, service usage can compensate its negative effects of price disad-
vantage to a large extent. For example, the probability of an offline purchase is higher at a price
difference level of 10% when service is used compared to a price disadvantage of 5% when service
is not used (also applies for 20% when service is used vs. 10% when service is not used). Similarly,
the probability of an offline purchase is higher at a price difference level of 20% when service is
used compared to a disadvantage of 10% when service is not used. Results also show that not only
service usage, but also the service level plays a crucial role in showrooming contexts. High service
quality is important to reduce showrooming and vice versa to increase offline purchase behavior.
Additional analyses find that offering untrained and unfriendly sales staff enhances the probability
of showrooming more than offering no sales staff at all. Another interesting result is that service
availability (5 min vs. 15 min) has no general (main) effect on purchase intention. This result con-
trasts with previous findings that the availability but not the quality of service personnel on the sales
floor reduces showrooming (Gensler et al., 2017). However, a more detailed examination of the
data with regard to interacting effects indicates that service availability is definitely relevant for
purchase behavior when good quality service is offered. In this case, the probability of offline pur-
chases increases for shorter compared to longer waiting times (marginally significant) and the
probability of showrooming decreases (only tendency). Comparing mere service usage with service
usage of high quality and fast availability, analyses show that the latter reduces the probability of
showrooming at all levels of offline price disadvantage, but not at matching price levels.
Price fairness partially mediates effects of price (input) and service (output) on showrooming be-

Managerial antecedents of showrooming
85
havior (supporting our arguments based on equity theory). The partial mediation shows that price
fairness plays a role in understanding showrooming, but it does not explain it completely. Apparent-
ly, service can compensate effects of a price disadvantage of showrooming though higher fairness
perception (mediation) while direct effects indicate also some opportunistic behavior beyond price
fairness. This partial mediation result may also indicate the existence of different showrooming
segments (Schneider & Zielke, 2020): showroomers who are mainly characterized by opportunistic
thinking and behavior and showroomers for whom the consideration of inputs (contribution) and
outputs (rewards) is relevant for their purchasing decision. In particular, customers who evaluate
price and service to decide whether a price is fair base their purchase decision on this perception
and are an important segment. Here, brick-and-mortar retailers with a high service level (concerning
quality and availability) have a good and realistic chance to sell products at a higher price compared
to the online channel.
All in all, the three studies reveal that price and service are important aspects in the showrooming
context and price fairness perception mediates these effects. Although, service cannot fully com-
pensate all offline price disadvantages, we observe significant reductions of the probability to show-
room. Additionally, we see that service increases the probability of offline purchases which indi-
cates loyalty tendencies to the offline retailer.
4.7 Management implications
Based on the findings of this study, retailers have to encourage customers to use the services of-
fered. This requires sufficient sales staff on the sales floor, so that customers do not have to wait
long or alternatively, as McGuire et al. (2010) suggest, the creation of a special customer experi-
ence, so that customers are not bored while waiting. Moreover, it is even more important to offer
knowledgeable and friendly service personnel. Hence, retailers should firstly invest in service quali-
ty and then, secondly in service availability (as availability has only an effect when quality is high).
Although investments in service quality might be expensive, they can keep customers in the offline
channel. Furthermore, results are highly interesting for offline retailers since they suggest to either
offer well trained and sufficiently available personnel or if this is not feasible, better offering no
sales staff at all than low quality service. Regarding price differences, our findings provide clear
evidence of keeping the price difference to the internet as small as possible. Retailers should also
address customers’ price fairness perceptions. The best way for retailers to do this is to increase in-
store rewards for customers. The more valuable these rewards are, the fairer the offline price is per-
ceived. In addition to sales personnel in-store, after sales services could be offered as well as dis-

Managerial antecedents of showrooming
86
counts and coupons for future purchases or for complementary products (e.g. for special sports
shoes care or cleaning products or – more innovative – a free month for a paid fitness app). Further,
customer experience should increase perceived rewards (for sports shoes, stores could offer oppor-
tunities to test shoes on different floors or at various temperatures; they could offer individual run-
ning coaching by experts in-store or other creative marketing activities). In this way, more valuable
outputs increase customers’ perceived price fairness and finally, the probability for offline purchas-
es. To sum up, brick-and-mortar retailers can compensate price disadvantages by a focus on service
and further in-store rewards for customers to increase perceived price fairness. Hence, especially
service can act as a competitive advantage of offline retailers.
4.8 Limitations and future research
We conducted scenario experiments because of their easy feasibility and to ensure comparability.
However, results should be confirmed by further experiments in real retail settings. These could
also include further price differences. Additional work is also required to explore the role of service
availability in the showrooming context, for example by adding scenarios with a larger variation in
waiting time (with immediate availability as fastest option). Furthermore, while we described
waiting time only in the scenarios, future studies may manipulate actual waiting times.

General conclusions
87
5 General conclusions
5.1 Summary of results
This dissertation focuses on the highly relevant showrooming phenomenon. Showrooming is a new
type of consumer behavior based on the use of different channels within the so called customer
journey (Lemon & Verhoef, 2016). Generally speaking, it comprises a search for information in the
offline channel and a subsequent online purchase (Balakrishnan et al., 2014). In recent years, this
behavior has developed through the emergence and usage of a multitude of distribution channels.
Customers in today’s world switch channels in order to be able to obtain an optimum benefit for
themselves at every stage of the purchasing process (Verhoef et al., 2007).
Most existing studies describe showrooming as a threat to stationary retail. Although, brick-and-
mortar stores invest in service and offer in-store service personnel, they lose sales because custom-
ers finalize their purchase cheaper at competing online sellers (Kalyanam & Tsay, 2013; Teixeira &
Gupta, 2015). At the same time, current developments show increasing vacancies of retail proper-
ties that reduce the attractiveness of city centers (Spiegel.de, 2020). Showrooming behavior can
either cause or strengthen this development. This raises the question of how stationary retail can
survive or even be profitable under these changed and further changing environmental conditions.
Hence, the showrooming topic has a high degree of relevance for retailing and research. Therefore,
the aim of this work was to make a major contribution to a differentiated understanding of the
showrooming phenomenon in order to derive appropriate and helpful management implications.
Accordingly, the following central research question was raised in the introduction and served as a
common thread:
How can stationary retailers successfully encounter the showrooming phenomenon or possibly even
benefit from showrooming customers?
We conducted three independent research projects, each with a different focus on the showrooming
phenomenon: Research project 1 concentrates on different forms of showrooming behavior and on
showrooming customers; research project 2 focusses on online search behavior (showrooming po-
tentials) that precedes showrooming (purchase) behavior and research project 3 investigates mana-
gerial antecedents of showrooming (price vs. service). However, all three research areas are
considered to a certain extent in each project. This is due to the complexity of showrooming and
simultaneously, it enables a broader understanding of the phenomenon.
General conclusions
88
The first research project addresses two research gaps. Firstly, until now, research concentrates on
competitive showrooming and does usually not consider loyal showrooming tendencies or any fur-
ther facets of the phenomenon. Secondly, existing studies do not examine types of showrooming
customers in particular. Hence, there is no segmentation of showrooming customers so far. This
generates the following research questions:
(1) Which factors characterize different forms of showrooming behavior?
(2) How can we use these factors to identify different showrooming segments?
(3) How can we characterize these segments based on psychographic variables?
The first research project extended our knowledge by exploring five different characterizing forms
of showrooming behavior. As already explained in the introductory chapter, a multi-stage process
derived factors that result from these forms. These five forms and their corresponding factors are:
(1) “options for information in-store before purchase”. This form comprises mediated, personal and
mobile information search in-store (three factors), (2) “device used for purchase” – divided into
stationary or mobile device used for purchase (two factors), (3) “place of purchase” – broken down
into mobile place or home purchase (two factors), (4) “time of purchase” – divided into prompt,
mean or late time of purchase (three factors) and finally, (5) “retailer for purchase” which distin-
guishes between purchasing online from the same or from a competing online retailer (two factors)
(question 1).
Using cluster analyses based on the twelve characterizing factors, the study answers the second re-
search question and suggests four different showrooming segments: (1) comfort-oriented economic
showroomers, (2) loyal showroomers, (3) mobile economic showroomers and (4) conservative
showroomers (question 2). Besides demographical differences, the segments also show differences
in psychographic variables. The comfort-oriented and mobile economic segments show a signifi-
cantly higher price consciousness than the two remaining segments. Further, on a loyalty scale
(probability to purchase from the same retailer online), the loyal showroomers lead the ranking be-
fore the conservative showroomers, followed by the mobile economic segment and finally, the com-
fort-oriented economic showroomers. Moreover, retailer loyal clusters show higher values in bad
conscience during showrooming and the desire for social contact is stronger for the loyal and con-
servative segment than for the remaining ones (question 3).
The project’s most important contribution for retailers is that not all showrooming customers pose a
threat to stationary retail. In contrast, there are four different showrooming segments characterized
by different patterns of showrooming, differing in psychographics and showing either rather loyal
General conclusions
89
or disloyal behavioral tendencies. These insights enable retailers to develop segment specific mar-
keting actions and strategies to retain potential showroomers in their own channels.
An important contribution for showrooming research is that showrooming behavior differs not only
in terms of loyalty but also in terms of various situational factors, such as device, time and place of
the online purchase as well as the usage of available in-store information. Hence, showrooming
behavior is multifaceted. Furthermore, results proof the existence of different showrooming seg-
ments.
To successfully face showrooming it is important for retailers to know who showroomers are and if
and how they differ in terms of demographical, psychological and behavioral aspects. Hence, the
first project contributes to the overall research question of this dissertation by identifying four dif-
ferent showrooming segments. Some of them show valuable potential for the stationary channel of
multi-channel retailers because they show an increased sense of loyalty, a high desire of social con-
tact and a slightly lower degree of price consciousness. Results state that searching with a mobile
device in-store does not necessarily lead to a purchase at a competing retailer (see mobile economic
/ loyal showroomers). Referring to the overall research question, the retailers’ goal must be to pre-
vent competitive showrooming and to strengthen loyal showrooming behavior. With this
knowledge, retail managers need to train their sales staff to identify different showrooming seg-
ments either through a personal conversation or through detailed observations in-store (e.g. de-
mographics, behavior). Then, sales personnel can address each showrooming segment individually
with segment specific strategies and marketing activities to keep them in their own channels.
The second research project responds to a lack in research considering a systematic analysis of the
showrooming phenomenon. This is due to the fact that previous research does not consider online
search behavior as an important sub-process between offline search and online purchase within
showrooming. More precisely, there are different online search behaviors, such as mobile (in-store
via mobile device) vs. later online search (after leaving a store via any device) or product vs. price
information search. So, until now, no common showrooming conceptualization includes offline
search behavior, various online search behaviors (showrooming potentials) and online purchase
behavior (showrooming behavior) as three steps of the showrooming phenomenon. For this reason,
project 2 focuses on the following research questions:
(4) Which forms of online search behavior (showrooming potentials) exist in showrooming
contexts?
(5) How are different forms of online search behavior related and how do they influence
showrooming behavior?

General conclusions
90
(6) How do choice confusion and search convenience affect the relationships between show-
rooming potentials?
(7) Can multi-channel technologies such as QR codes keep customers in retailers’ own chan-
nels?
The project identified four different showrooming potentials that complement or follow customers’
search behavior in-store and which necessarily precede, but not necessarily lead to showrooming
behavior. These showrooming potentials comprise mobile vs. later online search as well as product
vs. price search (question 4). An empirically tested model of relationships confirmed that online
product search enhances online price search and that mobile online search precedes later online
search outside the store. Besides, results show that online price search is the last step before pur-
chasing online and that later price search has a significantly higher impact on online purchase be-
havior than mobile price search (question 5). As theoretically assumed, starting with mobile online-
search, choice confusion arises and increases due to new and further options and information. This,
in turn, leads to an increasing desire for search convenience (e.g. a quiet place or more time for
search). Hence, this perceived later search convenience increases later online search (question 6).
Results of a laboratory experiment show that customers using a QR code with a link to the retailers’
website are less likely to search in other retailers’ channels, visit less additional websites, but search
longer overall (question 7).
The second research project enables retailers to gain a deeper understanding of each behavioral step
in the showrooming process and its associated psychographic constructs. Results provide clear
strategies for action, such as simplifying the search for product information online in retailers’ own
channels. In this way, it is possible to prevent customers from accidentally coming across cheaper
offers from online competitors and then switching both, the channel and the retailer.
An essential contribution for research is that previous showrooming definitions might be insuffi-
cient to explain and predict consumer behavior because they neglect online search behavior within
the showrooming process. Showrooming research should consider offline search, various online
search behaviors and online purchase behavior when examining the showrooming phenomenon.
The second project contributes to the overall research question of this dissertation by providing a
new showrooming conceptualization considering various online search behaviors (product vs. price
and mobile vs. later online search) that precede online purchase behavior. The knowledge of these
consecutive behaviors in the showrooming context provides valuable insights for retailers. Research
project 2 can built upon prior findings of project 1, since a customer who searches for information
in-store via a mobile device is not yet lost, on the contrary, he or she just needs to be addressed in a
General conclusions
91
different way than a customer who proactively contacts sales personnel. Moreover, results confirm
that in a showrooming process offline information search and online information search in-store
precede the actual online purchase. This, in turn, shows two options, in which retailers can inter-
vene and possibly convince customers to purchase in retailers’ own channels. The knowledge of
psychological variables influencing this relationship enables the deduction of concrete strategies:
Retailers need to simplify product information search in-store and/or guide customers to their own
channels and touchpoints. This can prevent customers from accidentally coming across cheaper
prices in the online channel.
To briefly summarize the research gap underlying the third research project, literature examining
the impact of the most important showrooming antecedents, namely price and service, is scarce.
More precisely, until now, there is no study examining the impact of various price differences and
various service levels (i.e. usage, quality and availability) together. To close this research gap, the
project answers the following research questions:
(8) Can service compensate for the disadvantage of price differences in the offline channel in
terms of showrooming behavior?
(9) What should this service look like?
(10) Do availability and quality of service personnel have a different impact on showrooming?
(11) What effect does the level of price difference have on showrooming?
(12) And up to what price difference is a compensation possible at all?
Results show that mere service usage by customers can partly compensate price differences in the
offline channel in terms of showrooming behavior. This means for example that customers’ show-
rooming tendency is lower with a price difference of 20% and service usage compared to a 10%
price disadvantage in the offline channel without service usage (question 8). With regard to the or-
ganization of service, a differentiated examination of service quality and service availability is
necessary. Although, Gensler et al. (2017) state that only service availability influences showroom-
ing, this project shows that whereas service quality reduces the probability to showroom, service
availability is only relevant when service quality is high. Results further show that low quality ser-
vice on the sales floor results in higher showrooming tendencies than no service usage at all and
when retailers combine high quality with fast availability of service personnel this can compensate
price difference levels better than mere service usage. Hence, for retailers it is important to first
invest in sales personnel’s quality and in a next step in its availability (question 9 and 10). Further-
more, the price difference level is extremely important. The higher the price difference level, the
higher the probability to showroom (question 11). Price fairness mediates several effects. Thus,

General conclusions
92
retailers need to increase and multiply customers’ rewards in-store to increase perceived price fair-
ness and finally, to prevent or at least to reduce the probability to showroom (question 12).
A central practical contribution for retailers of this research project is that brick-and-mortar retailers
must keep the price difference to the online channel as small as possible even though service usage
by customers can compensate the negative effects of price disadvantages to a large extent. Addi-
tionally, offered sales staff should act at a high quality level. When service quality is high, retailers
should also keep waiting times for service staff as short as possible. However, if retailers’ resources
are limited, retailers should not provide service personnel at all, rather than low quality service. Re-
sults further show that retailers need to address customers’ price fairness perceptions. The fairer
customers perceive the price, the lower the probability to showroom. Retailers have to increase in-
store rewards to increase price fairness perception and thus reduce showrooming probability.
The project also offers two essential contributions for research. Firstly, it is important for research
to differentiate between various service strategies (i.e. mere service usage, service quality and ser-
vice availability) as well as between various price differences between the online and offline chan-
nel as antecedents of showrooming behavior. Secondly, research should consider both factors
simultaneously. Whereas offline retailers can influence service strategies to a large extent, they can
adjust price differences only hardly. However, different combinations of price differences and ser-
vice strategies show varying compensating effects of both variables.
Research project 3 answers the overall research question by examining price and service as two
main managerial antecedents of the showrooming phenomenon. Brick-and-mortar retailers can in-
fluence price or price structures to a small extent but more importantly, they can fully influence
service and service offerings in their stores. The personal service variable distinguishes offline
stores from mere online retailers (Verhoef et al., 2007). Hence, getting information on how both
variables compensate each other offers important insights for retailers. They need to change their
focus on customer interaction. This can be done primarily via service, which is expected and valued
by customers. If a high service level is offered, then price differences are accepted to a certain ex-
tent.
5.2 Implications for research
The present work expands showrooming research demonstrably. Numerous results show this: (1) In
contrast to recent research (Arora & Sahney, 2018; Basak et al., 2017; Flavián et al., 2019; Wu et
al., 2015), this work shows that showrooming is a behavioral phenomenon which, on closer exami-
General conclusions
93
nation, is again composed of several behaviors. It consists of information search behavior and
online purchasing behavior, of which the former has to be divided into in-store search behavior and
online search behavior. To make this distinction clear, we refer to different forms of online search
behavior as showrooming potentials, because these are a precondition for the actual online pur-
chase, which we call showrooming behavior. In this way, the present work offers the first coherent
conceptualization of a differentiated view of the phenomenon and empirically confirms its exist-
ence. Future research should build on this new conceptualization. (2) A closer examination of show-
rooming behavior shows that it can occur with retailer disloyalty as well as loyalty tendencies. Fur-
ther, showrooming behavior can vary in terms of various situational factors, e.g. device, time and
place of the online purchase. (3) Whereas most existing customer segmentation studies focus on
offline or online shoppers (Ganesh et al., 2010; Rohm & Swaminathan, 2004), few recent papers
also bring multi-channel customers to the fore (Frasquet et al., 2015; Konuş et al., 2008; Sands et
al., 2016). However, the latter do this at a very general level, while this dissertation focusses on
different showrooming segments in particular. (4) This work reveals that service is a highly interest-
ing variable in showrooming research and that it is not sufficient to analyze service in general. This
dissertation shows that it matters to differentiate between mere service usage, service quality level
and service availability (in the case of waiting times). These are probably not the only facets of the
service variable, so that future research should address this issue. (5) This work considers compen-
sation effects of the most important managerial antecedents – price and service – in competitive
showrooming contexts.
Another general implication for research results from the methodological diversity in the investiga-
tion of the showrooming phenomenon within the present dissertation. In addition to several qualita-
tive studies, this work includes numerous online survey studies and a laboratory experiment. The
variety of methods and/or studies within each research project allows the compilation of a more
comprehensive picture of the showrooming phenomenon and encourages future studies to continue
this approach.
5.3 Implications for business practice
Each of the three research projects offers specific management implications derived from the re-
spective study results. Beyond that, there are some general implications for business practice con-
sidering the dissertation as a whole. These are closely linked to the aspects already mentioned to
answer the overall research question (5.1). Nevertheless, due to their outstanding relevance, this
chapter will bring them together and discuss them in a more general way.

General conclusions
94
Recent literature states that showroomers come to the offline store to touch and feel products and in
this way to get product specific information they cannot get online (Levin et al., 2003). To become
a showroomer, this work proves that at first, these customers have to search for further information
online either in-store or later after leaving the store and afterwards, they will have to purchase
online. Consequently, watching customers using their smartphones in-store is not a proof that cus-
tomers want to or will finalize their purchase online. Instead, mobile online search in-store has be-
come daily business and smartphones have become everyday shopping assistants (Fuentes et al.,
2017; Fuentes & Svingstedt, 2017; Grewal et al., 2018).
Watching potential showroomers using their smartphone in-store enables sales personnel to inter-
vene in a possible showrooming process. Sales personnel has the unique opportunity to use strate-
gies to either encourage customers to purchase offline or – particularly for multi-channel retailers –
to purchase online in the retailers’ own online shops. To do this successfully, it is important for re-
tailers to identify different segments with the help of qualified sales personnel and in a next step, to
address these customer groups individually. A specific approach considering personal needs when
shopping, as well as individual service and price offers can retain potential showroomers in retail-
ers’ own channels. Considering price offers, it is important for offline retailers to keep the price
difference to the online channel as small as possible. However, this is not easy due to fixed costs,
e.g. for shop rent or sales personnel. Considering service, retailers must be aware of the following:
On the one hand showrooming is highly contextual and showroomers differ and on the other hand
brick-and-mortar stores can easily influence service aspects, but prices only to a limited extent. Of-
fline retailers therefore have to focus on service encounters in-store. This contributes to a specific
and unique shopping experience for customers (McGuire et al., 2010) and enables offline stores to
sharpen their profile and to justify and to secure their existence.
Taken together, the three research projects included in this dissertation confirm that the key to eco-
nomic viability of brick-and-mortar stores is service. It distinguishes offline from online retailing
(Verhoef et al., 2007). It is a multifaceted variable (mere usage, quality, availability etc.) resulting
in numerous possibilities for action and moreover, offline retailers can fully influence it. Good ser-
vice has a positive impact on perceived price fairness and can compensate the negative impact of
price differences to a certain extent. In the end, the fairer customers perceive the price, the lower the
probability to showroom. But care must be taken. If shops are unable to offer high quality service,
results show that no service at all is better than service of low quality.

General conclusions
95
5.4 Limitations and future research
Beyond the respective limitations of each research project, there are three general limitations of this
work that call for further research. Firstly, for feasibility reasons and due to the limited research in
showrooming, each study was limited to certain products or to one certain product. Although, simi-
lar results can be assumed for products in the same category or with similar characteristics, this is a
restriction of results. Especially showrooming situations and hence, showrooming segments are not
stable. The showrooming phenomenon is extremely contextual and therefore, dependent on various
situational variables, not only product categories, but also service encounters, weather, time re-
strictions, level of retailer competition or shopping intentions etc. Further research should include
the impact of situational variables, because each shopping situation is unique. The second limitation
of this work is its usage of scenario-based survey studies. However, this work also considered other
research methods to work on the topic from different perspectives. Nevertheless, studies in real en-
vironment are missing. Therefore, future studies should be conducted in real shopping environments
comprising, inter alia, field experiments. Field experiments could test the impact of specific
marketing strategies that were explored and identified in this dissertation. The third general limita-
tion is the low consideration of non-showroomers or comparisons between showroomers and non-
showroomers. Only research project 1 allows this to a limited extent. Due to study designs, scenario
based survey studies only asked for showrooming probabilities. For this reason, online purchase and
offline purchase were not mutually exclusive so that non-showroomers could hardly be identified.
Studies in real shopping contexts could compare showroomers and non-showroomers in specific
situations. Such comparisons might relate to demographics, psychological variables and processes
affecting relationships between showrooming potentials.
5.5 Personal conclusion
Retailing is developing rapidly. Digitalization and automation processes have already changed cus-
tomer behavior and will continue to. Customers’ expectations and needs are becoming increasingly
individualized. So, customer segments become more and more diverse. While pure online shopping
segments will increase, the segment of pure offline shoppers will continue to decline. However,
there are more and more customers who use different channels (multi-channel customers). Since
purchase behavior does not have to follow immediately after search, most customers are hardly
aware of switching channels in purchase processes. Especially with showrooming, there can be a
certain amount of time between the offline search and the online purchase. Hence, showrooming

General conclusions
96
behavior often occurs unconsciously and already has become part of everyday purchase behavior of
most multi-channel customers.
Hence, showrooming is a main challenge for retailers and will continue to be. In the future, other
diversified forms of this behavior may occur. Nevertheless, present research and current develop-
ments clearly prove that stationary retail continues to have a raison d’être. One current development
is the corona pandemic that has shown that online retailing is losing sales when offline retailing is
not available (Bevh, 2020). So, perhaps the focus of offline shops will have to change in the future
– the focus needs to be less on the lowest price or less on the competition with big online shops.
What drives customers to offline shops and city centers seem to be primarily social needs in con-
nection with a touch and feel experience and an immediate product receipt, or simply the freedom
to walk into a store, interact with others, experience a unique shopping experience and simply to
have a good time outside.
For pure brick-and-mortar stores that do not offer exclusive products, that are not willing to explore
new ways and that do not have the personal and/or financial options to develop further, the show-
rooming phenomenon is a serious threat. These retailers will probably have to close their stores in
foreseeable future.
However, showrooming can also be an opportunity for retailers. To be successful under these
changing circumstances, retail should clearly focus on service. Customers have to feel comfortable
in-store and especially in service encounters. Retailers have to select and train their sales staff spe-
cifically. In addition, sales personnel must be given the freedom to act in order to be able to respond
individually to customers’ needs. This can include price offers or even price guarantees as well as
additional service offers or simply coupons for future purchases – in such a way that it offers the
greatest added value for the individual customer. This approach is not easy and certainly not cheap.
Instead, it is an opportunity for all retailers who are willing to develop themselves and for all that
want to adapt to new customer behavior to work on their competences and unique selling points.
Nevertheless, the showrooming phenomenon is and remains a challenge for every retailer. Retailers
need creativity, staying power, flexibility, the ability to develop new sales concepts (thinking of
customer experience) and above all, the courage to try something new. They must sell their
products and have to find out what customers are willing to pay for in-store. Therefore, the show-
rooming phenomenon can be anything: a threat, an opportunity and a challenge. It depends on what
each retailer makes out of it.
References
VI
References
Adams, J. S. (1965). Inequity in social exchange. In L. Berkowitz (Ed.), Advances in experimental
social psychology (pp. 267-299). Amsterdam: Academic Press.
Ankosko, B. (2012). Retailers fight showrooming. Dealerscope: The Business of CE Retailing,
54(5), 60-62.
Antonetti, P., & Maklan, S. (2014). Feelings that make a difference: How guilt and pride convince
consumers of the effectiveness of sustainable consumption choices. Journal of Business Ethics,
124(1), 117-134.
Arora, S., & Sahney, S. (2017). Webrooming behaviour: A conceptual framework. Journal of Retail
and Distribution Management, 45(7/8), 762-781.
Arora, S., & Sahney, S. (2018). Antecedents to consumers’ showrooming behaviour: an integrated
TAM-TPB framework. Journal of Consumers Marketing, 35(4), 438-450.
Arora, S., Singha, K., & Sahney, S. (2017). Understanding consumer’s showrooming behaviour:
extending the theory of planned behaviour. Asia Pacific Journal of Marketing and Logistics,
29(2), 409-431.
Bachrach, D. G., Ogilvie, J., Rapp, A., & Calamusa, J. (2016). More than a showroom: strategies
for winning back online shoppers. New York: Palgrave Macmillan US.
Baeckstroem, K., & Johansson, U. (2006). Creating and consuming experiences in retail store envi-
ronments: Comparing retailer and consumer perspectives. Journal of Retailing and Consumer
Services, 13(6), 417-430.
Bagozzi, R. P., & Yi, Y. (1988). On the evaluation of structural equation models. Journal of the
Academy of Marketing Science, 16(1), 74-94.
Balakrishnan, A., Sundaresan, S., & Zhang, B. (2014). Browse-and-switch: Retail-online competi-
tion under value uncertainty. Production and Operations Management, 23(7), 1129-1145.
Balasubramanian, S., Raghunathan, R., & Mahajan, V. (2005). Consumers in a multichannel envi-
ronment: Product utility, process utility, and channel choice. Journal of Interactive Marketing,
19(2), 12-30.
Basak, S., Basu, P., Avittathur, B., & Sikdar, S. (2017). A game theoretic analysis of multichannel
retail in the context of ‘showrooming’. Decision Support Systems, 103, 34-45.
Bell, D., Gallino, S., & Moreno, A. (2015). Showrooms and information provision in omni-channel
retail. Production and Operations Management, 24(3), 360-362.

References
VII
Bertrandie, L., & Zielke, S. (2017). The effects of multi-channel assortment integration on customer
confusion. The International Review of Retail, Distribution and Consumer Research, 27(5),
437-449.
Bertrandie, L., & Zielke, S. (2019). The influence of multi-channel pricing strategy on price fairness
and customer confusion. The International Review of Retail, Distribution and Consumer Re-
search, 29(5), 504-517.
Bettman, J. R. (1979). An information processing theory of consumer choice. Reading: Addison-
Wesley.
Bevh (2020). Corona-Pandemie führt zu deutlichem Umsatzverlust im Onlinehandel. Retrieved
April, 6, 2020, from https://www.bevh.org/presse/pressemitteilungen/details/corona-pandemie-
fuehrt-zu-deutlichem-umsatzverlust-im-onlinehandel.html
Bhatnagar, A., & Ghose, S. (2004). A latent class segmentation analysis of e-shoppers. Journal of
Business Research, 57(7), 758-767.
Blackwell, R. D., Miniard, P. W., & Engel, J. F. (2006). Consumer behavior. Vol. 10. Mason:
Thomson South-Western.
Bodur, H. O., Klein, N. M., & Arora, N. (2015). Online price search: Impact of price comparison
sites on offline price evaluations. Journal of Retailing, 91(1), 125-139.
Bolton, L. E., Warlop, L., & Alba, J. W. (2003). Consumer perceptions of price (un)fairness. Jour-
nal of Consumer Research, 29(4), 474-491.
Borthwick-Duffy, S. A. (2007). Adaptive behavior. In J. W. Jacobson, J. A. Mulick, & J. Rojahn
(Eds.), Handbook of Intellectual and Development Disabilities. Issues on Clinical Child Psy-
chology (pp. 279-293). Boston, MA: Springer.
Brown, M., Pope, N., & Voges, K. (2003). Buying or browsing? European Journal of Marketing,
37(11/12), 1666-1684.
Brynjolfsson, E., & Smith, M. D. (2000). Frictionless commerce? A comparison of internet and
conventional retailers. Management Science, 46(4), 563-585.
Burns, D. J., Gupta, P. B., & Hutchins, J. (2019). Showrooming: the effect of gender. Journal of
Global Scholars of Marketing Science, 29(1), 99-113.
Burns, D. J., Gupta, P. B., Bihn, H. C., & Hutchins, J. (2018). Showrooming: an exploratory
empirical investigation of students’ attitudes and behavior. Information Systems Management,
35(4), 294-307.
Caliński, T., & Harabasz, J. (1974). A dendrite method for cluster analysis. Communications in Sta-
tistics - Theory and Methods, 3(1), 1-27.

References
VIII
Center for Retail Research (2020). Online: UK, Europe & N. America. European online growth.
Retrieved February, 5, 2020, from https://www.retailresearch.org/online-retail.html
Chell, E. (1985). Participation and organization: A social psychological approach. London: The
Macmillan Press Ltd.
Chen, C.-A. (2009). Information-oriented online shopping behavior in electronic commerce envi-
ronment. Journal of Software, 4(4), 307-314.
Chernev, A. (2006). Differentiation and parity in assortment pricing. Journal of Consumer Re-
search, 33(2), 199-210.
Cheung, G. W., & Rensvold, R. B. (2002). Evaluating goodness-of-fit indexes for testing measure-
ment invariance. Structural Equation Modeling, 9(2), 233-255.
Chiang, K. P., & Dholakia, R. R. (2003). Factors driving consumer intention to shop online: an em-
pirical investigation. Journal of Consumer Psychology, 13(1), 177-183.
Chin, W. W. (1998). Issues and opinion on structural equation modeling. Management Information
Systems Quarterly, 22(1), 7-16.
Chiou, J.-S., Wu, L.-Y., & Chou, S.-Y. (2012). You do the service but they take the order. Journal
of Business Research, 65(7), 883-889.
Chiu, H.-C., Hsieh, Y.-C., Roan, J., Tseng, K.-J., & Hsieh, J.-K. (2011). The challenge for multi-
channel services: Cross-channel free-riding behavior. Electronic Commerce Research and Ap-
plications, 10(2), 268-277.
Dabholkar, P. A. (1996). Consumer evaluations of new technology-based self-service options: an
investigation of alternative models of service quality. International Journal of Research in Mar-
keting, 13(1), 29-51.
Dahana, W. D., Shin, H., & Katsumata, S. (2018). Influence of individual characteristics on whether
and how much consumers engage in showrooming behavior. Electronic Commerce Research,
18(4), 665-692.
Dant, R. P., & Gundlach, G. T. (1998). The challenge of autonomy and dependence in franchised
channels of distribution. Journal of Business Venturing, 14(1), 35-67.
Daunt, K. L., & Harris, L. C. (2017). Consumer showrooming: value co-destruction. Journal of
Retailing and Consumer Services, 38, 166-176.
De Keyser, A., Scherpers, J., & Konuş, U. (2015). Multichannel customer segmentation: Does the
after-sales channel matter? A replication and extension. International Journal of Research in
Marketing, 32(4), 453-456.
Detlor, B., Sproule, S., & Gupta, C. (2003). Pre-purchase online information seeking: search versus
browse. Journal of Electronic Commerce Research, 4(2), 72-84.
References
IX
Diehl, K., & Poynor, C. (2010). Great expectations?! Assortment size, expectations, and satisfac-
tion. Journal of Marketing Research, 47(2), 312-322.
East, R., Wright, M., & Vanhuele, M. (2013). Consumer behavior: Applications in marketing (2nd
ed.). Los Angeles: Sage.
Fassnacht, M., & Unterhuber, S. (2016). Consumer response to online/offline price differentiation.
Journal of Retailing and Consumer Services, 28, 137-148.
Fassnacht, M., Beatty, S. E., & Szajna, M. (2019). Combating the negative effects of showrooming:
Successful salesperson tactics for converting showroomers into buyers. Journal of Business Re-
search, 102, 131-139.
Fernández, N. V., Pérez, M. J. S., & Vázquez-Casielles, R. (2018). Webroomers versus showroom-
ers: are they the same? Journal of Business Research, 92, 300-320.
Flavián, C., Gurrea, R., & Orús, C. (2016). Choice confidence in the webrooming purchase process:
The impact of online positive reviews and the motivation to touch. Journal of Consumer
Behaviour, 15, 459-476.
Flavián, C., Gurrea, R., & Orús, C. (2019). Feeling confident and smart with webrooming: under-
standing the consumer’s path to satisfaction. Journal of Interactive Marketing, 47, 1-15.
Flavián, C., Gurrea, R., & Orús, C. (2020). Combining channels to make smart purchases: The role
of webrooming and showrooming. Journal of Retailing and Consumer Services, 52, 1-11.
Fornell, C., & Larcker, D. F. (1981). Evaluating structural equation models with unobservable vari-
ables and measurement error. Journal of Marketing Research, 18(1), 39-50.
Fornell, C., Johnson, M. D., Anderson, E. W., Cha, J., & Bryant, B. E. (1996). The American cus-
tomer satisfaction index: nature, purpose, and findings. Journal of Marketing, 60(4), 7-18.
Forsythe, S., Liu, C., Shannon, D., & Gardner, L. C. (2006). Development of a scale to measure the
perceived benefits and risks of online shopping. Journal of Interactive Marketing, 20(2), 55-75.
Frambach, R. T., Roest, H. C., & Krishnan, T. V. (2007). The impact of consumer internet experi-
ence on channel preference and usage intentions across the different stages of the buying pro-
cess. Journal of Interactive Marketing, 21(2), 26-41.
Frasquet, M., Mollá, A., & Ruiz, E. (2015). Identifying patterns in channel usage across the search,
purchase and post-sales stages of shopping. Electronic Commerce Research and Applications,
14(6), 654-665.
Fuentes, C., & Svingstedt, A. (2017). Mobile phones and the practice of shopping: A study of how
young adults use smartphones to shop. Journal of Retailing and Consumer Services, 38, 137-
146.
References
X
Fuentes, C., Baeckstroem, K., & Svingstedt, A. (2017). Smartphones and the reconfiguration of
retailscapes: stores, shopping, and digitalization. Journal of Retailing and Consumer Services,
39, 270-278.
Fulgoni, G. M. (2014). “Omni-channel” retail insights and the consumer's path-to-purchase: How
digital has transformed the way people make purchasing decisions. Journal of Advertising Re-
search, 54(4), 377-380.
Ganesh, J., Reynolds, K. E., Luckett, M., & Pomirleanu, N. (2010). Online shopper motivations,
and e-store attributes: an examination of online patronage behavior and shopper typologies.
Journal of Retailing, 86(1), 106-115.
Gensler, S., Neslin, S. A., & Verhoef, P. C. (2017). The showrooming phenomenon: it's more than
just about price. Journal of Interactive Marketing, 38, 29-43.
Grewal, D., Ahlbom, C.-P., Beitelspacher, L., Noble, S. M., & Nordfaelt, J. (2018). In-store mobile
phone use and customer shopping behavior: evidence from the field. Journal of Marketing,
82(4), 102-126.
Gross, M. (2015). Mobile shopping: a classification framework and literature review. International
Journal of Retail & Distribution Management, 43(3), 221-241.
Gu, J. Z., & Tayi, G. K. (2017). Consumer pseudo-showrooming and omni-channel product place-
ment strategies. Management Information Systems Quarterly, 4(2), 583-606.
Hayes, A. F. (2018). Partial, conditional, and moderated moderated mediation: quantification, infer-
ence, and interpretation. Communication Monographs, 85(1), 4-40.
HDE (2019). Wachstumsdifferenz im Handel. Retrieved February, 5, 2020, from
https://einzelhandel.de/presse/zahlenfaktengrafiken/861-online-handel/11865-
wachstumsdifferenz-im-handel
Heitmann, M., Lehmann, D. R., & Herrmann, A. (2007). Choice goal attainment and decision and
consumption satisfaction. Journal of Marketing Research, 44(2), 234-250.
Heitz-Spahn, S. (2013). Cross-channel free-riding consumer behavior in a multichannel environ-
ment: An investigation of shopping motives, sociodemographics and product categories. Journal
of Retailing and Consumer Services, 20(6), 570-578.
Hoelscher, C., & Strube, G. (2000). Web search behavior of internet experts and newbies.
Computer Networks, 33(1-6), 337-346.
Holmes, A., Byrne, A., & Rowley, J. (2014). Mobile shopping behaviour: insights into attitudes,
shopping process involvement and location. International Journal of Retail & Distribution
Management, 42(1), 25-39.

References
XI
Homans, G. C. (1958). Social behavior as exchange. American Journal of Sociology, 63(6), 597-
606.
Homburg, C., Lauer, K., & Vomberg, A. (2019). The multichannel pricing dilemma: Do consumers
accept higher offline than online prices? International Journal of Research in Marketing, 36(4),
597-612.
Hu, L., & Bentler, P. M. (1999). Cutoff criteria for fit indexes in covariance structure analysis: con-
ventional criteria versus new alternatives. Structural Equation Modeling: A Multidisciplinary
Journal, 6(1), 1-55.
Jacob, A. (2018). An inside look at amazon books’ new store in DC. NBC Washington. Retrieved
November, 28, 2018, from https://www.nbcwashington.com/entertainment/the-scene/An-Inside-
Look-into-Amazons-Modern-Bookstore-476698643.html
Jing, B. (2018). Showrooming and webrooming: information externalities between online and of-
fline sellers. Marketing Science, 37(3), 469-483.
JRNI (2019). New JRNI research highlights continued demand for omnichannel shopping experi-
ences. Retrieved February, 5, 2020, from https://www.jrni.com/newsroom/modern-consumer-
research-2019
Kacen, J. J., Hess, J. D., & Chiang, W-Y. K. (2013). Bricks or clicks? Consumer attitudes toward
traditional stores and online stores. Global Economics and Management Review, 18(1), 12-21.
Kalyanam, K., & Tsay, A. A. (2013). Free riding and conflict in hybrid shopping environments:
implications for retailers, manufacturers, and regulators. The Antitrust Bulletin, 58(1), 19-68.
Kang, J.-Y. M. (2018). Showrooming, webrooming, and user-generated content creation in the om-
nichannel era. Journal of Internet Commerce, 17(2), 145-169.
Kau, A. K., Tang, Y. E., & Ghose, S. (2003). Typology of online shoppers. Journal of Consumer
Marketing, 20(2), 139-156.
Keen, C., Wetzels, M., de Ruyter, K., & Feinberg, R. (2004). E-tailers versus retailers: Which fac-
tors determine consumer preferences? Journal of Business Research, 57(7), 685-695.
Koenigstorfer, J., & Groeppel-Klein, A. (2012). Consumer acceptance of the mobile internet. Mar-
keting Letters, 23(4), 917-928.
Konuş, U., Verhoef, P. C., & Neslin, S. A. (2008). Multichannel shopper segments and their covari-
ates. Journal of Retailing, 84(4), 398-413.
Kotler, P., Keller, K. L., Brady, M., Goodman, M., & Hansen, T. (2019). Marketing Management
(4th ed.). Edinburgh: Pearson Education limited.
Kucuk, S. U., & Maddux, R. C. (2010). The role of the internet on free-riding: an exploratory study
of the wallpaper industry. Journal of Retailing and Consumer Services, 17(4), 313-320.

References
XII
Kuksov, D., & Liao, C. (2018). When showrooming increases retailer profit. Journal of Marketing
Research, 55(4), 459-473.
Lemon, K. N., & Verhoef, P. C. (2016). Understanding customer experience throughout the cus-
tomer journey. Journal of Marketing, 80(6), 69-96.
Levin, A. M., Levin, I. R., & Heath, C. E. (2003). Product category dependent consumer prefer-
ences for online and offline shopping features and their influence on multi-channel retail alli-
ances. Journal of Electronic Commerce Research, 4(3), 85-93.
Levy, M., Weitz, B. A., & Grewal, D. (2019). Retailing management (10th
ed.). New York:
McGraw-Hill Irwin.
Lichtenstein, D. R., Ridgway, N. M., & Netemeyer, R. G. (1993). Price perceptions and consumer
shopping behavior: a field study. Journal of Marketing Research, 30(2), 234-245.
Malc, D., Mumel, D., & Pisnik, A. (2016). Exploring price fairness perceptions and their influence
on consumer behavior. Journal of Business Research, 69(9), 3693-3697.
Malhotra, N. K. (1984). Reflections on the information overload paradigm in consumer decision
making. Journal of Consumer Research, 10(4), 436-440.
Mayring, P. (2015). Qualitative content analysis: theoretical background and procedures. In A.
Bikner-Ahsbahs, C. Knipping, & N. Presmeg (Eds.), Advances in Mathematics Education. Ap-
proaches to Qualitative Research in Mathematics Education (pp. 365-380). Dordrecht: Springer
Netherlands, 365-380.
McDowell, J. J. (2013). A quantitative evolutionary theory of adaptive behavior dynamics. Psycho-
logical Review, 120(4), 731-750.
McGuire, K. A., Kimes, S. E., Lynn, M., Pullman, M. E., & Lloyed, R. C. (2010). A framework for
evaluating the customer wait experience. Journal of Service Management, 21(3), 269-290.
Mehra, A., Kumar, S., & Raju, J. S. (2013). ‘Showrooming’ and the competition between store and
online retailers. SSRN Electronic Journal, 2200420.
Mehra, A., Kumar, S., & Raju, J. S. (2018). Competitive strategies for brick-and-mortar stores to
counter ‘showrooming’. Management Science, 64(7), 3076-3090.
Ministry of Economic Affairs, Innovation, Digitisation and Energy of North Rhine-Westphalia
(2019). Handelsszenarien Nordrhein-Westfalen 2030. Einzelhandel in Nordrhein-Westfalen im
digitalen Zeitalter. Herausforderungen und Empfehlungen. Retrieved February, 5, 2020 from
https://www.wirtschaft.nrw/sites/default/files/asset/document/mwide_handelsszenarien_nrw_20
30_web.pdf
Mitchell, V.-W., Walsh, G., & Yamin, M. (2005). Towards a conceptual model of consumer confu-
sion. Advances in Consumer Research, 32, 143-150.
References
XIII
Mooi, E. A., & Sarstedt, M. (2011). A concise guide to market research. The process, data, and
methods using IBM SPSS statistics. Heidelberg: Springer.
Morschett, D., Swoboda, B., & Foscht, T. (2005). Perception of store attributes and overall attitude
towards grocery retailers: The role of shopping motives. The International Review of Retail,
Distribution and Consumer Research, 15(4), 423-447.
Naik, C. N. K., & Reddy, L. V. (1999). Consumer Behaviour. New Delhi: Discovery Publ. House.
Narang, S., Jain, V., & Roy, S. (2012). Effect of QR codes on consumer attitudes. International
Journal of Mobile Marketing, 7(2), 52-64.
Neslin, S. A., Jerath, K., Bodapati, A., Bradlow, E. T., Deighton, J., Gensler, S., Lee, L., Montaguti,
E., Telang, R., Venkatesan, R., Verhoef P. C., & Zhang, J. (2014). The interrelationships be-
tween brand and channel choice. Marketing Letters, 25(3), 319-330.
Nunnally, J. C. (1978). Psychometric Theory. New York: McGraw-Hill.
Ortlinghaus, A., Zielke, S., & Dobbelstein, T. (2019). The impact of risk perceptions on the attitude
toward multi-channel technologies. The International Review of Retail, Distribution and Con-
sumer Research, 29(3), 262-284.
Park, C.-H., & Kim, Y.-G. (2003). Identifying key factors affecting consumer purchase behavior in
an online shopping context. International Journal of Retail & Distribution Management, 31(1),
16-29.
Perry, P. M. (2013). Showrooming: How to turn enemies into advocates. Rural Telecom, 32(5), 36-
37.
Pookulangara, S., Hawley, J., & Xiao, G. (2011). Explaining multi-channel consumer's channel‐
migration intention using theory of reasoned action. International Journal of Retail and Distri-
bution Management, 39(3), 183-202.
Punj, G., & Stewart, D. W. (1983). Cluster analysis in marketing research: review and suggestions
for application. Journal of Marketing Research, 20(2), 134-148.
PWC (2017). Total retail 2017. Retrieved November 28, 2018, from
https://www.pwc.com/vn/en/industries/assets/total-retail-2017.pdf
Quint, M., Rogers, D., & Ferguson, R. (2013). Showrooming and the rise of the mobile-assisted
shopper. Columbia Business School. Center on Global Brand Leadership, 1-34. Retrieved July
23, 2018, from
https://www8.gsb.columbia.edu/globalbrands/sites/globalbrands/files/images/Showrooming_Ris
e_Mobile_Assisted_Shopper_Columbia-Aimia_Sept2013.pdf

References
XIV
Rapp, A., Baker, T. L., Bachrach, D. G., Ogilvie, J., & Beitelspacher, L. S. (2015). Perceived cus-
tomer showrooming behavior and the effect on retail salesperson self-efficacy and performance.
Journal of Retailing, 91(2), 358-369.
Reid, L. F., Ross, H. F., & Vignali, G. (2016). An exploration of the relationship between product
selection criteria and engagement with ‘show-rooming’ and ‘web-rooming’ in the consumer’s
decision-making process. International Journal of Business and Globalisation, 17(3), 364-383.
Rejón-Guardia, F., & Luna-Nevarez, C. (2017). ‘Showrooming’ in consumer electronics retailing:
an empirical study. Journal of Internet Commerce, 16(2), 174-201.
Riepl, W. (1913). Das Nachrichtenwesen des Altertums: mit besonderer Rücksicht auf die Römer.
Leipzig: BG Teubner.
Rippé, C. B., Weisfeld-Spolter, S., Yurova, Y., & Sussan, F. (2015). Is there a global multichannel
consumer? International Marketing Review, 32(3/4), 329-349.
Rohm, A. J., & Swaminathan, V. (2004). A typology of online shoppers based on shopping motiva-
tions. Journal of Business Research, 57(7), 748-757.
Rossiter, J. R. (2002). The C-OAR-SE procedure for scale development in marketing. International
Journal of Research in Marketing, 19(4), 305-335.
Sands, S., Ferraro, C., Campbell, C., & Pallant, J. (2016). Segmenting multichannel consumers
across search, purchase and after-sales. Journal of Retailing and Consumer Services, 33, 62-71.
Santos, S., & Gonşalves, H. M. (2019). Multichannel consumer behaviors in the mobile environ-
ment: Using fsQCA and discriminant analysis to understand webrooming motivations. Journal
of Business Research, 101, 757-766.
Schneider, P. J., & Zielke, S. (2020). Searching offline and buying online – an analysis of show-
rooming forms and segments. Journal of Retailing and Consumer Services, 52 (published elec-
tronically September 6, 2018). doi: 10.1016/jretconser.2019.101919
Shen, K. N., Cai, Y., & Guo, Z. (2016). When do online consumers shop in an offline store: the
moderating effects of product characteristics. Journal of Marketing Channels, 23(3), 129-145.
Shin, J. (2007). How does free riding on customer service affect competition? Marketing Science,
26(4), 488-503.
Singh, S., & Swait, J. (2017). Channels for search and purchase: Does mobile internet matter?
Journal of Retailing and Consumer Services, 39, 123-134.
Sit, J. K., Hoang, A., & Inversini, A. (2018). Showrooming and retail opportunities: A qualitative
investigation via a consumer-experience lens. Journal of Retailing and Consumer Services, 40,
163-174.

References
XV
Spiegel.de (2020). Veränderte Lebensgewohnheiten. Handelsexperten sagen großes Ladensterben
voraus. Retrieved March, 20, 2020, from https://www.spiegel.de/wirtschaft/institut-sagt-grosses-
ladensterben-voraus-a-a0f90f84-8602-4dfe-9bd6-247f9211e02a
Stangor, C., Jhangiani, R., & Tarry, H. (2011). Principles of Social Psychology - 1st International
Edition. Retrieved March, 18, 2020, from
http://pzacad.pitzer.edu/~hfairchi/courses/Spring2015/Psych%20103/Principles-of-Social-
Psychology-1st-International-Edition-1415042666.pdf
Steenhaut, S., & Van Kenhove, P. (2006). The mediating role of anticipated guilt in consumers’
ethical decision-making. Journal of Business Ethics, 69(3), 269-288.
Sweeney, J. C., & Soutar, G. N. (2001). Consumer perceived value: The development of a multiple
item scale. Journal of Retailing, 77(2), 203-220.
Tassé, M. J. (2013). Adaptive behavior. In M. L. Wehmeyer (ed.), The Oxford handbook of positive
psychology and disability (p. 105-115). New York: Oxford University Press.
Teixeira, T. S., & Gupta, S. (2015). Case study can you win back online shoppers? Harvard Busi-
ness Review, 93, 117-121.
Turley, L. W., & Milliman, R. E. (2000). Atmospheric effects on shopping behavior: A review of
the experimental evidence. Journal of Business Research, 49(2), 193-211.
Van Baal, S., & Dach, C. (2005). Free riding and customer retention across retailers’ channels.
Journal of Interactive Marketing, 19(2), 75-85.
Vanheems, R., Kelly, J. S., & Stevenson, K. (2013). The internet, the modern death of a salesman:
multichannel retailing’s impact on the salesperson’s role. International Journal of Integrated
Marketing Communications, 5(2), 91-100.
Verhoef, P. C., Kannan, P. K., & Inman, J. J. (2015). From multi-channel retailing to omni-channel
retailing. Journal of Retailing, 91(2), 174-181.
Verhoef, P. C., Neslin, S. A., & Vroomen, B. (2007). Multichannel customer management: under-
standing the research-shopper phenomenon. International Journal of Research in Marketing,
24(2), 129-148.
Voelckner, F. (2008). The dual role of price: decomposing consumers’ reactions to price. Journal of
the Academy of Marketing Science, 36(3), 359-377.
Voorhees, C. M., Fombelle, P. W., Gregoire, Y., Bone, S., Gustafsson, A., Sousa, R., & Walkowi-
ak, T. (2017). Service encounters, experiences and customer journey: Defining the field and a
call to expand our lens. Journal of Business Research, 79, 269-280.
Walsh, G., Hennig-Thurau, T., & Mitchell, V.-W. (2007). Consumer confusion proneness: scale
development, validation, and application. Journal of Marketing Management, 23(7-8), 697-721.

References
XVI
Wang, S. (2017). Why China can’t get enough of QR codes. CNN Business. Retrieved November,
5, 2019, from https://money.cnn.com/2017/09/08/technology/china-qr-codes/index.html
Ward, Jr. J. H. (1963). Hierarchical grouping to optimize an objective function. Journal of the
American Statistical Association, 58(301), 236-244.
Willmott, B. (2014). Retail showrooms, mobile sales. Journal of Direct, Data and Digital
Marketing Practice, 15(3), 229-232.
Wolny, J., & Charoensuksai, N. (2014). Mapping customer journeys in multichannel decision-
making. Journal of Direct, Data and Digital Marketing Practice, 15(4), 317-326.
Wu, C., Wang, K., & Zhu, T. (2015). Can price matching defeat showrooming? University of Cali-
fornia, Haas School of Business, Berkeley. Retrieved November, 4, 2016, from
https://pdfs.semanticscholar.org/7f9e/993e8d1266ed60591df0e3cf78aa7a350294.pdf
Xia, L., Monroe, K. B., & Cox, J. L. (2004). The price is unfair! A conceptual framework of price
fairness perceptions. Journal of Marketing, 68(4), 1-15.
Zielke, S. (2011). Integrating emotions in the analysis of retail price images. Psychology and Mar-
keting, 28(4), 330-359.
Zuppinger, J. (2013). Showrooming – the new buzz word for retailers. Retail Week. Retrieved Feb-
ruary, 4, 2016, from
https://www.nexis.com/results/enhdocview.do?docLinkInd=true&ersKey=23_T24987562222

Appendix
XVII
Appendix
Research project 1:
Appendix A. Survey items, reliability measures, results of factor analysis and confirmatory factor
analysis of multi-item constructs (n = 564) .......................................................... XVIII
Research project 2:
Appendix B. Item scales ............................................................................................................... XIX
Appendix C. Scenario of survey and complementary study .......................................................... XX
Research project 3:
Appendix D. Scenarios of each research study ............................................................................. XXI
Appendix E. Sample characteristics of each study ...................................................................... XXII
Appendix F. Survey items for price fairness, reliability measures and results of factor analysis
.............................................................................................................................. XXIII

Appendix
XVIII
Appendix A. Survey items, reliability measures, results of factor analysis and confirmatory factor analysis of
multi-item constructs (n = 564).
Construct Cronbach’s
alpha
Lambda
loadings
(CFA)
AVE
(CFA) Literature for
scale items
Price consciousness
It is important for me to get the best price for the products I buy.
.82
.78
.53
Konuş et al.
(2008), Lich-
tenstein et al.
(1993),
Voelckner
(2008)
I am very concerned about low prices when I buy products. .74
I will shop at more than one store to take advantage of low pric-
es. .70
The time it takes to find low prices is usually worth the effort. .69
Desire for social contact
It bothers me if I have to use a piece of technology when I could
interact with a person instead.
.86
.74
.62
Dabholkar
(1996),
Koenigstorfer
and Groeppel-
Klein (2012)
I prefer personal contact to communicating with technological
devices. .88
If I have to choose, I prefer a personal conversation to an elec-
tronic alternative. .70
In a personal conversation I feel more comfortable than in using
technologies. .81
Motivation to conform
It bothers me if other people disapprove of my choices.
.83
.64
.56 Voelckner
(2008)
My behavior often depends on how I feel others wish me to
behave. .71
A sense of belonging is important for me. .76
It is important to me to fit in. .87
Bad conscience during showrooming
I have a bad conscience when I buy the product on the internet.
.91
.92
.72 Zielke (2011)
I feel irresponsible when I buy the product on the internet. .83
It is not correct to buy the product on the internet. .79
I have a clear conscience buying the product on the internet.
(recoded) -.84
General showrooming tendency
Often I purchase products on the internet which I have seen in a
store.
.80
.82
.59 ― Seeing products in-store, I often compare the prices on the in-
ternet. .62
I often search for information in stores to buy on the internet
afterwards. .85
Note: All items were measured on a seven-point scale (1 = “I do not agree at all” and 7 = “I totally agree”).

Appendix
XIX
Appendix B. Item scales.
Construct Item
Price information
search online via
mobile devices in-
store
In-store I use my smartphone to make sure that the product is not cheaper online.
In-store I take a look at the product and use my smartphone to search for better deals
online.
In-store I use my mobile device to compare prices online for the product.
While I am in the store I consult a mobile device to look for prices for the product online.
Price information
search online after
leaving the store
I have a look at the product in-store and later search for better deals on the internet.
After visiting the store I search for better prices online.
After having informed myself about the product in-store I check online whether the prod-
uct is cheaper there.
After having a look at the product in-store I compare its price calmly later on the internet.
Product infor-
mation search
online via mobile
devices in-store
I use a mobile device in-store, to find out more about the product.
In-store I search for more product information with my smartphone.
While I am in the store, I use my smartphone to get more information about the product.
In-store I led myself be inspired and use my mobile device to get better information about
the product in that moment.
Product infor-
mation search
online after leaving
the store
I check the product in-store and later, search for more information about the product
online.
After I become familiar with the product in-store, I later, take the opportunity to find out
more about the product.
In-store I led myself be inspired and later, use the internet to get better information about
the product.
I have a look at the product in-store and later search for more information online calmly.
Search in-store and
purchase online
(showrooming
behavior)**
I take a look at the product in-store and next order it online.
I become familiar with the product in-store and purchase it on the internet later.
I use the advisory service of the brick-and-mortar store and then, buy the product online.
I gather information about the product in-store and purchase it on the internet.
Choice confusion* (following Diehl &
Poynor, 2010; Heit-
mann, Lehmann, &
Herrmann, 2007)
In-store I feel overwhelmed at the time of decision making for [a product].
In-store I feel confused at the time of decision making for [a product].
In-store the decision for [a product] is difficult to make.
It takes me time and effort to choose the right [product].
In-store I cannot afford the time to choose the right [product].
It is difficult to compare the different offerings in-store.
Perceived later
online search con-
venience (following Forsythe,
Liu, Shannon, &
Gardner, 2006)
I can search for later information online in privacy of home.
When searching for information online later I have no hassles.
Searching via a smartphone in-store is a big effort.
Note: All items measured on a seven-point scale (1 = “I do not agree at all” and 7 = “I totally agree”). / *Insert respective product (sports shoes vs. TV sets) / **Offline purchase behavior was measured with adjusted items.
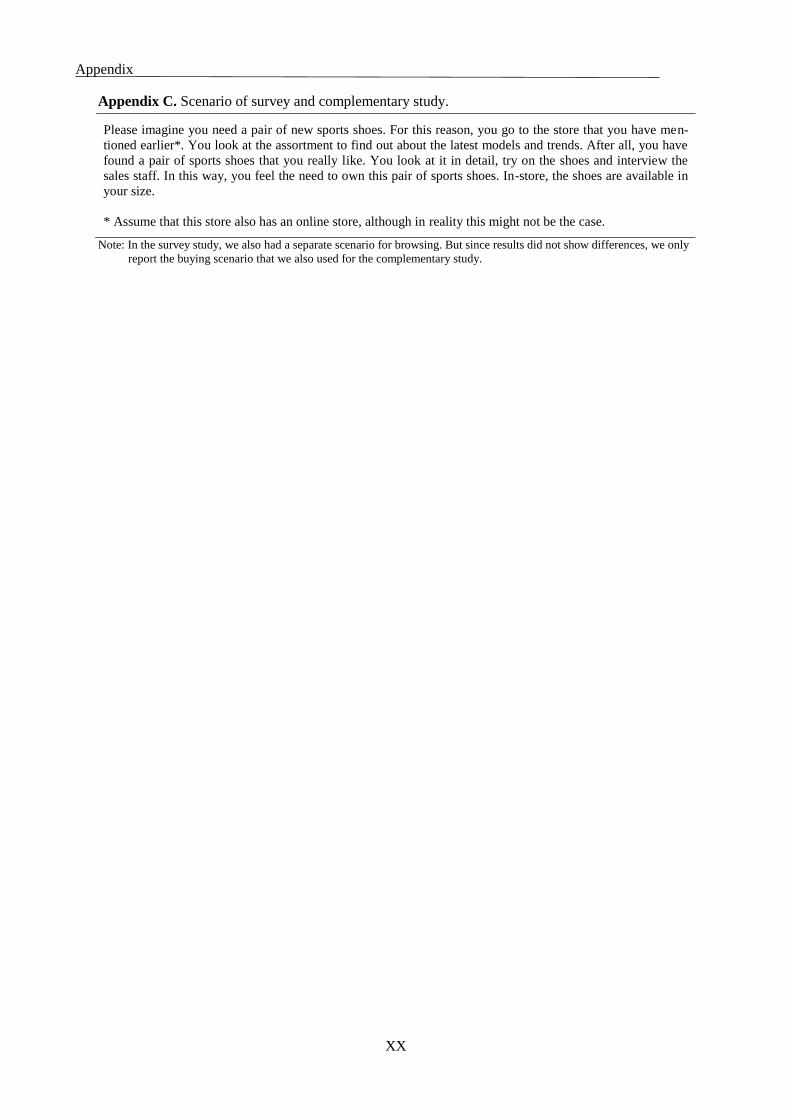
Appendix
XX
Appendix C. Scenario of survey and complementary study.
Please imagine you need a pair of new sports shoes. For this reason, you go to the store that you have men-
tioned earlier*. You look at the assortment to find out about the latest models and trends. After all, you have
found a pair of sports shoes that you really like. You look at it in detail, try on the shoes and interview the
sales staff. In this way, you feel the need to own this pair of sports shoes. In-store, the shoes are available in
your size.
* Assume that this store also has an online store, although in reality this might not be the case.
Note: In the survey study, we also had a separate scenario for browsing. But since results did not show differences, we only
report the buying scenario that we also used for the complementary study.

Appendix
XXI
Appendix D. Scenarios of each research study.
Study A: With service usage in-store: Without service usage in-store:
I: 0% price difference (130 EUR), n = 96 V: 0% price difference (130 EUR), n = 82
II: 5% price difference (123.50 EUR), n = 101 VI: 5% price difference (123.50 EUR), n = 75
III: 10% price difference (117 EUR), n = 99 VII: 10% price difference (117 EUR), n = 72
IV: 20% price difference (104 EUR), n = 90 VIII: 20% price difference (104 EUR), n = 84
Please imagine that you need some new sports shoes. This includes running and functional shoes as well as
fashionable sports shoes. You have already informed yourself about sports shoes on the website of various re-
tailers and found a favorite. You have found the best offer for your favorite sports shoes on the sportdreamz.de
website.
There you saw the sports shoes for I+V: 130 EUR (II+VI: 123.50 EUR; III+VII: 117 EUR; IV+VII: 104 EUR).
Delivery is free of charge. To have a look at these sports shoes, you decide to visit the Run4Fun store near you.
I-IV: At Run4Fun you can examine the sports shoes in detail, try them on and get advice from the sales staff.
The salesperson measures your feet and makes a fit analysis to determine the right size of your favorite sports
shoes. The right size is available in the store and costs 130 EUR.
V-VIII: At Run4Fun you examine the sports shoes in detail and try them on. You dispense on a measuring of
your feet and on a fit analysis by the sales staff, because you are already sure in your decision. The right size is
available in the store and costs 130 EUR.
Study B: I: No sales staff available, n = 62
II: Sales staff available after 5 min with high quality service, n = 74
III: Sales staff available after 5 min with low service quality, n = 61
IV: Sales staff available after 15 min with high quality service, n = 60
V: Sales staff available after 15 min with low service quality, n = 67
Please imagine that you need some new sports shoes. This includes running and functional shoes as well as
fashionable sports shoes. You have already informed yourself about sports shoes on the website of various re-
tailers and found a favorite. You have found the best offer for your favorite sports shoes on the sportdreamz.de
website.
There you saw the sports shoes for 117 EUR. Delivery is free of charge. To have a look at these sports shoes,
you decide to visit the Run4Fun store near you. At Run4Fun you can examine the sports shoes in detail and try
them on. You would like to take advantage of a consultation.
I: There is no sales staff on the sales floor. II-V: There are several sales assistants on the sales floor. After II+III:
five (IV + V: 15) minutes someone is there for you.
II + IV: Sales staff makes a friendly and professional impression on you. The salesperson is motivated and asks
you questions to understand what is important to you. All in all, you perceive the service quality as high.
III+V: Sales staff makes an unfriendly and unprofessional impression on you. The salesperson does not ask you
any questions to find out your needs and seems unmotivated. Overall, you perceive the service quality as low.
Your favorite sports shoes are available in-store in the right size and cost 130 EUR.
Study C: Service staff available after 5 min with high service quality and fast service availability:
I: 0% price difference (130 EUR), n = 33
II: 5% price difference (123.50 EUR), n = 25
III: 10% price difference (117 EUR), n = 26
IV: 20% price difference (104 EUR), n = 29
Please imagine that you need some new sports shoes. This includes running and functional shoes as well as
fashionable sports shoes. You have already informed yourself about sports shoes on the website of various re-
tailers and found a favorite. You have found the best offer for your favorite sports shoes on the sportdreamz.de
website.
There you saw the sports shoes for I: 130 EUR (II: 123.50 EUR; III: 117 EUR; IV: 104 EUR). Delivery is free
of charge. To have a look at these sports shoes, you decide to visit the Run4Fun store near you. At Run4Fun you
can examine the sports shoes in detail and try them on. You would like to take advantage of a consultation.
There are several sales assistants on the sales floor. After five minutes someone is there for you.
Sales staff makes a friendly and professional impression on you. The salesperson is motivated and asks you
questions to understand what is important to you. All in all, you perceive the service quality as high. Your favor-
ite sports shoes are available in-store in the right size and cost 130 EUR.
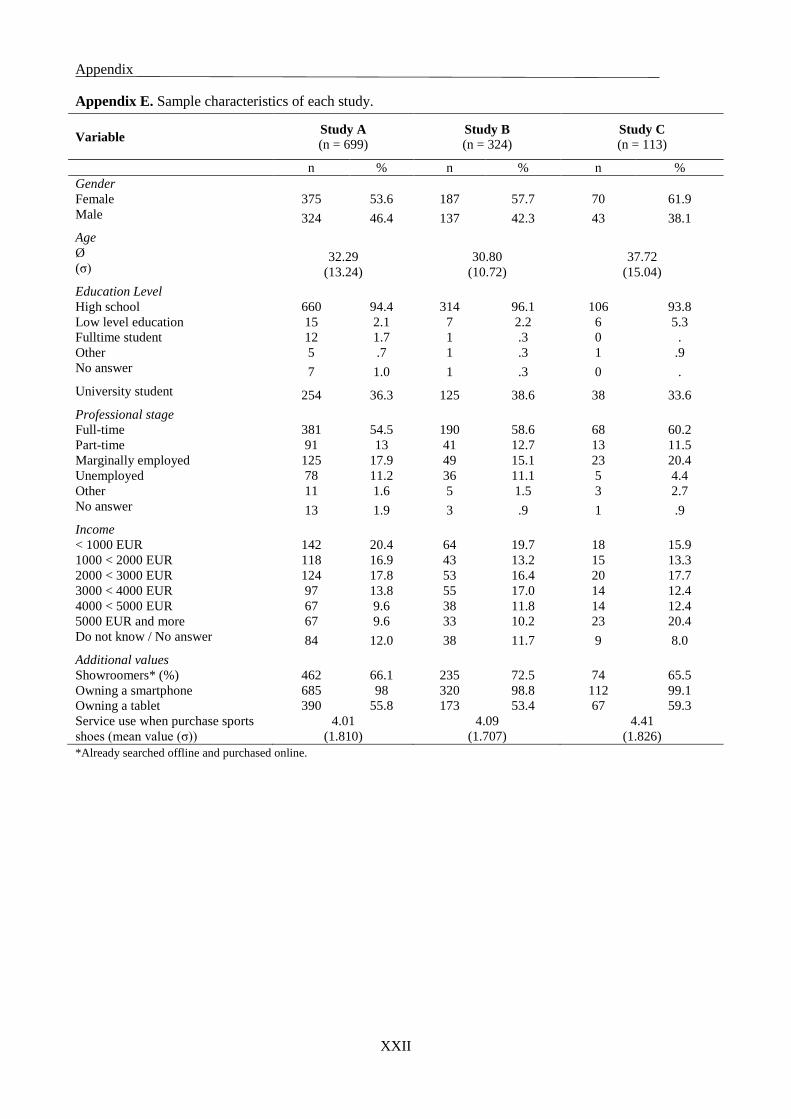
Appendix
XXII
Appendix E. Sample characteristics of each study.
Variable Study A
(n = 699) Study B
(n = 324) Study C
(n = 113)
n % n % n %
Gender
Female 375 53.6 187 57.7 70 61.9
Male 324 46.4 137 42.3 43 38.1
Age
Ø
(σ) 32.29
(13.24)
30.80
(10.72)
37.72
(15.04)
Education Level
High school 660 94.4 314 96.1 106 93.8
Low level education 15 2.1 7 2.2 6 5.3
Fulltime student 12 1.7 1 .3 0 .
Other 5 .7 1 .3 1 .9
No answer 7 1.0 1 .3 0 .
University student 254 36.3 125 38.6 38 33.6
Professional stage
Full-time 381 54.5 190 58.6 68 60.2
Part-time 91 13 41 12.7 13 11.5
Marginally employed 125 17.9 49 15.1 23 20.4
Unemployed 78 11.2 36 11.1 5 4.4
Other 11 1.6 5 1.5 3 2.7
No answer 13 1.9 3 .9 1 .9
Income
< 1000 EUR 142 20.4 64 19.7 18 15.9
1000 < 2000 EUR 118 16.9 43 13.2 15 13.3
2000 < 3000 EUR 124 17.8 53 16.4 20 17.7
3000 < 4000 EUR 97 13.8 55 17.0 14 12.4
4000 < 5000 EUR 67 9.6 38 11.8 14 12.4
5000 EUR and more 67 9.6 33 10.2 23 20.4
Do not know / No answer 84 12.0 38 11.7 9 8.0
Additional values
Showroomers* (%) 462 66.1 235 72.5 74 65.5
Owning a smartphone 685 98 320 98.8 112 99.1
Owning a tablet 390 55.8 173 53.4 67 59.3
Service use when purchase sports
shoes (mean value (σ))
4.01
(1.810)
4.09
(1.707)
4.41
(1.826)
*Already searched offline and purchased online.
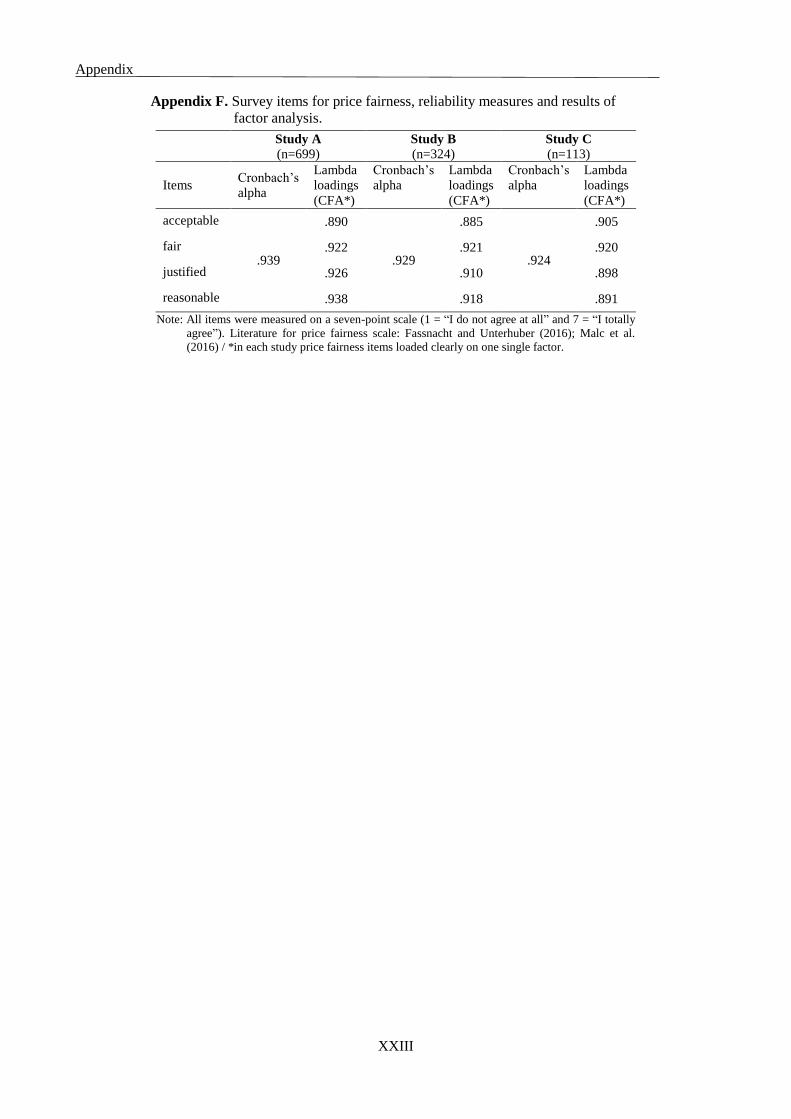
Appendix
XXIII
Appendix F. Survey items for price fairness, reliability measures and results of
factor analysis.
Study A
(n=699) Study B
(n=324) Study C
(n=113)
Items Cronbach’s
alpha
Lambda
loadings
(CFA*)
Cronbach’s
alpha
Lambda
loadings
(CFA*)
Cronbach’s
alpha
Lambda
loadings
(CFA*)
acceptable
.939
.890
.929
.885
.924
.905
fair .922 .921 .920
justified .926 .910 .898
reasonable .938 .918 .891
Note: All items were measured on a seven-point scale (1 = “I do not agree at all” and 7 = “I totally
agree”). Literature for price fairness scale: Fassnacht and Unterhuber (2016); Malc et al.
(2016) / *in each study price fairness items loaded clearly on one single factor.
Related Documents