Thomas A. Danjczek President Steel Manufacturers Association May 10, 2010 Milwaukee, WI LONG PRODUCTS SUPPLY CHAIN SYMPOSIUM ACTIONS FOR ECONOMIC RECOVERY From the Steelmaker’s Perspective

Thomas A. Danjczek President Steel Manufacturers Association May 10, 2010 Milwaukee, WI LONG PRODUCTS SUPPLY CHAIN SYMPOSIUM ACTIONS FOR ECONOMIC RECOVERY.
Dec 24, 2015
Welcome message from author
This document is posted to help you gain knowledge. Please leave a comment to let me know what you think about it! Share it to your friends and learn new things together.
Transcript
Thomas A. DanjczekPresidentSteel Manufacturers AssociationMay 10, 2010Milwaukee, WI
LONG PRODUCTS SUPPLY CHAIN SYMPOSIUM ACTIONS FOR ECONOMIC RECOVERY
From the Steelmaker’s Perspective

Outline
•SMA
•Set the Stage
-U.S. Steel Production
-SMA Long Product Data
-Global Steel Outlook
• Trade Issues
-China
-Scrap
-Raw Materials
• Environmental / Safety Washington, DC Issues
•Is Enough Being Done?
•What does the U.S. need to do?
•Conclusion
Long Products Supply Chain Symposium

• The Steel Manufacturers Association (SMA)– 34 North American companies:
29 U.S., 3 Canadian, and 2 Mexican
– Operate 125 steel recycling plants in North America
– Electric Arc Furnace (EAF) steelmakers using recycled steel
– EAF steel producers accounted for nearly 2/3 of U.S. production in 2009
– SMA represents approximately 90 million of U.S. 120 million ton capacity (75%)
– 128 Associate members - Suppliers of goods and services to the steel industry
SMALong Products Supply Chain Symposium
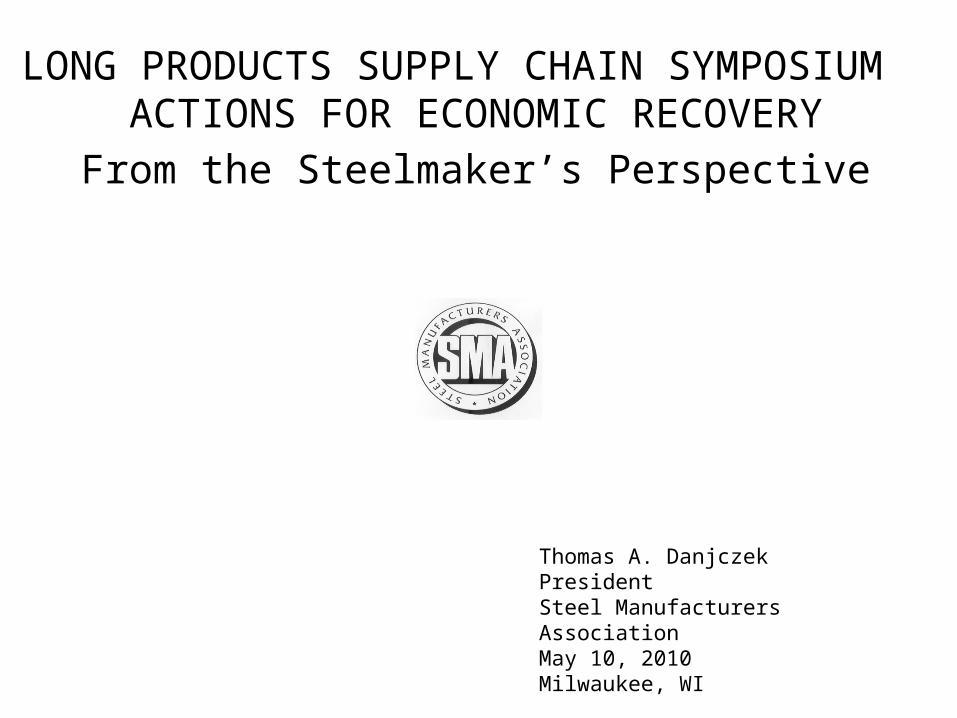
US Steel Production (All in Million Net Tons)
(Numbers are Approximate)
PAST – From 1986 through 2008, U.S. steel production has been around 100 m tons – up & down 10%
2009
1st Half 25m (45% utilization)
2nd Half 36m (62% utilization) Now 1.5m/week vs. 2.1m/week
Year 63m (Minimills at 63% of production)
2010 (from November 2009)
World Steel 78m (up 19% over 2009), optimistic
Peter Marcus 68m (Back to 75m in 2012)
US Poll 69m (up 10% over 2009)
2010 – Today (Through March 30) Capacity Utilization (67.7%); or approximately 80 million tons annual rate
42.9% in 2009
Set the StageLong Products Supply Chain Symposium

United States
Million MT2009 (e) 2010(f)
Change (%)
Crude Steel Use
65.1 81.8 25.5%
Finished Steel Use
57.4 72.7 26.5%
Exports 8.5 11.3 32.9%
Imports 12.9 13.7 6.2%
Canada
Million MT2009 (e) 2010(f)
Change (%)
Crude Steel Use 10.6 13.1 23.9%
Finished Steel Use 9.5 11.8 23.9%
Exports 4.9 6.4 29.6%
Imports 6.0 7.7 28.3%
Mexico
Million MT2009 (e) 2010 (f)
Change (%)
Crude Steel Use 17.7 22.1 24.5%
Finished Steel Use
13.9 15.5 10.9%
Exports 2.0 2.4 20.0%
Imports 3.2 3.6 12.5%
Source: Worldsteel Economic Studies Committee, April 2010
The Worldsteel Short Range Outlook
Long Products Supply Chain Symposium

Source: Worldsteel
World Crude Steel Capacity 2000-2012
1,062 1,062 1,0951,170
1,2451,356
1,453
1,583
1,8161,917
1,9972,055
1,654
100
350
600
850
1,100
1,350
1,600
1,850
2,100
2000 2001 2002 2003 2004 2005 2006 2007 2008 2009 2010(e) 2011(e)
Ste
el
Cap
ac
ity
(m
illio
n m
etr
ic t
on
ne
s)
0
5
10
15
20
Cu
rre
nt
Av
era
ge
Gro
wth
Ra
te (
CA
GR
)
World Crude Steel Capacity CAGR
2012(e)
Global Steel Capacity Continues to Increase
Long Products Supply Chain Symposium

SMA Long Product Summary Data – (4/16/10)
Long Products Supply Chain Symposium
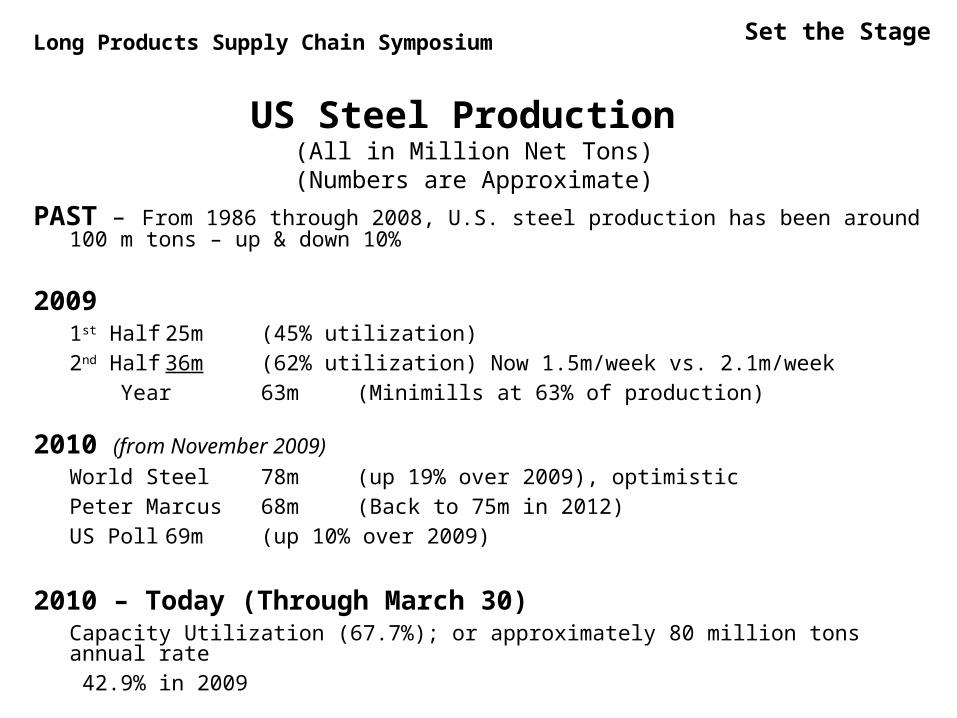
SIMA Import License Data Detail for March as published April 13, 2010:
PRODUCT TONS
Rebar40,147
Wire Rod130,187
Merchant Bar16,374
Light Shapes6,129
Parallel Flange Sections23,056
Structural Angles & Channels5,092
All Other Structural Sections14,751
Total Licenses 235,737
Long Products Supply Chain Symposium
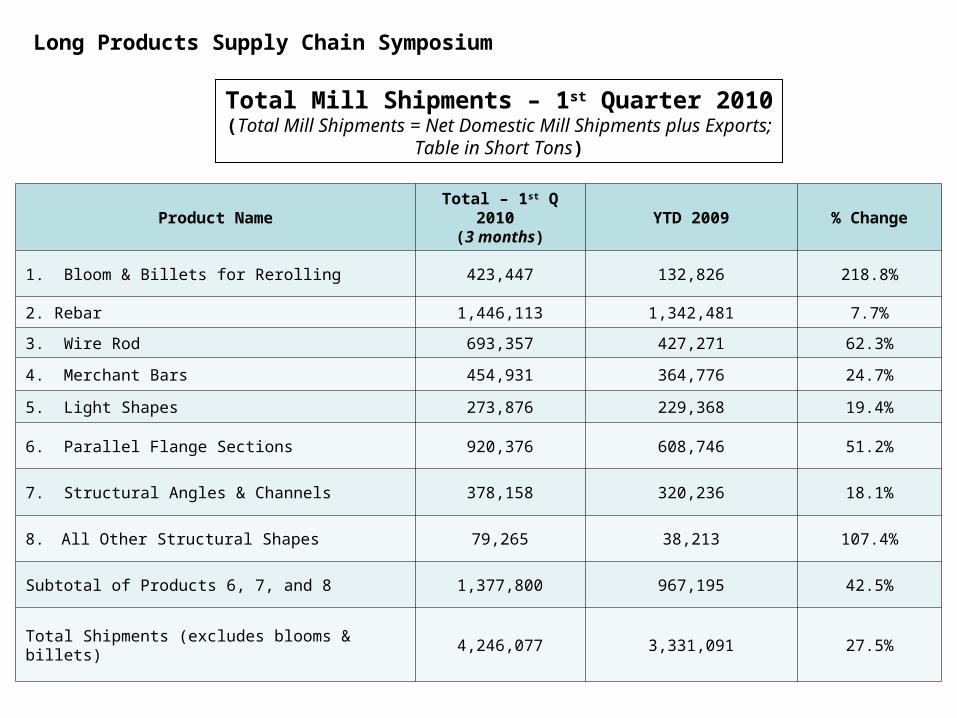
Product NameTotal – 1st Q 2010
(3 months)YTD 2009 % Change
1. Bloom & Billets for Rerolling 423,447 132,826 218.8%
2. Rebar 1,446,113 1,342,481 7.7%
3. Wire Rod 693,357 427,271 62.3%
4. Merchant Bars 454,931 364,776 24.7%
5. Light Shapes 273,876 229,368 19.4%
6. Parallel Flange Sections 920,376 608,746 51.2%
7. Structural Angles & Channels 378,158 320,236 18.1%
8. All Other Structural Shapes 79,265 38,213 107.4%
Subtotal of Products 6, 7, and 8 1,377,800 967,195 42.5%
Total Shipments (excludes blooms & billets) 4,246,077 3,331,091 27.5%
Total Mill Shipments – 1st Quarter 2010(Total Mill Shipments = Net Domestic Mill Shipments plus Exports;
Table in Short Tons)
Long Products Supply Chain Symposium
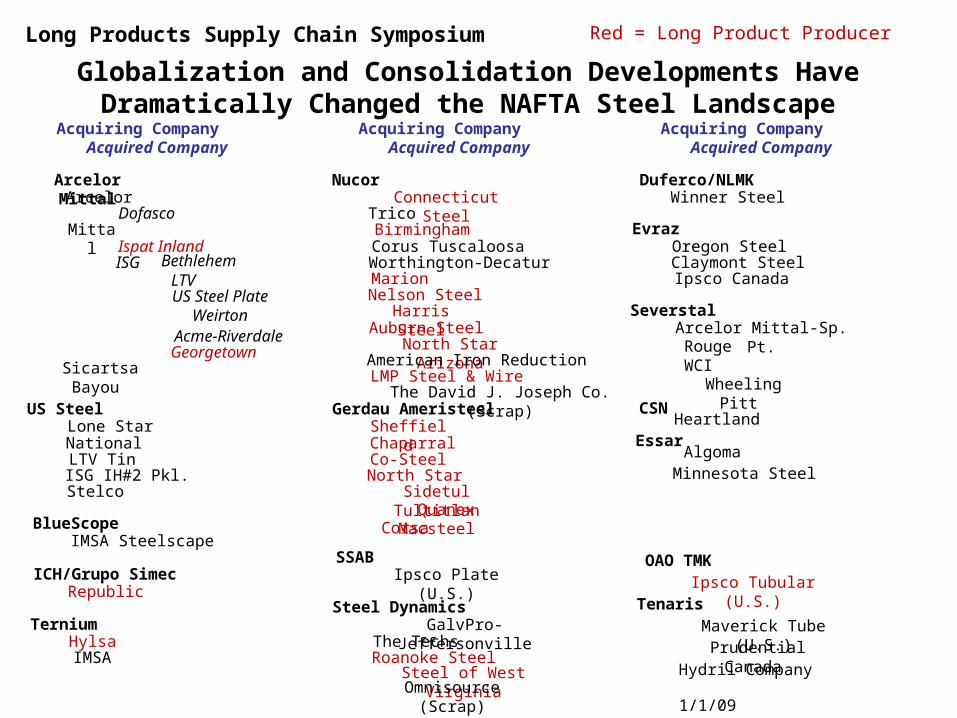
Globalization and Consolidation Developments Have Dramatically Changed the NAFTA Steel Landscape
Acquiring Company Acquiring Company Acquiring CompanyAcquired Company Acquired Company Acquired Company
Arcelor Mittal Nucor Duferco/NLMKArcelor Connecticut Steel Winner Steel
Dofasco TricoMittal Birmingham Evraz
Ispat Inland Corus Tuscaloosa Oregon SteelISG Worthington-Decatur Claymont Steel
LTV Marion Ipsco CanadaUS Steel Plate
WeirtonNelson SteelHarris Steel Severstal
Acme-Riverdale Auburn Steel Arcelor Mittal-Sp. Pt.North Star Arizona Rouge
WCI
Georgetown American Iron ReductionSicartsaBayou
LMP Steel & Wire
CSNHeartland
US Steel Gerdau AmeristeelLone Star Sheffield
EssarNational Chaparral AlgomaLTV Tin Co-SteelMinnesota SteelISG IH#2 Pkl. North Star
Stelco Sidetul Tultitlan Quanex Macsteel
BlueScope CorsaIMSA Steelscape
OAO TMKSSAB
Ipsco Tubular (U.S.)ICH/Grupo Simec Ipsco Plate (U.S.)Republic
Steel DynamicsTernium GalvPro-Jeffersonville
Hylsa The TechsIMSA Roanoke Steel
Steel of West Virginia
TenarisMaverick Tube (U.S.) Prudential Canada Hydril Company
Wheeling Pitt
1/1/09
Bethlehem
The David J. Joseph Co. (Scrap)
Omnisource (Scrap)
Red = Long Product ProducerLong Products Supply Chain Symposium

China’s Trade Surplus with the U.S.
Year China’s Trade Surplus
2001 $22 billion(year China joined WTO)
2006 $177 billion
2007 $262 billion (up 47.7%)
2008 $290 billon
2009 $196 billion The U.S. has lost 3.3 million manufacturing jobs since The U.S. has lost 3.3 million manufacturing jobs since 2000… imbalances cannot go on forever.2000… imbalances cannot go on forever.
Long Products Supply Chain Symposium

0
10
20
30
40
50
60
70
80
90
2000 2001 2002 2003 2004 2005 2006 2007 2008 2009
Mill
ion
To
ns
Exports
U.S. Consumption
U.S. Scrap Consumption and Exports
Long Products Supply Chain Symposium
2009 – Exports 22.3mtImports (e) 3.0mtU.S. Consumption 48.0mt
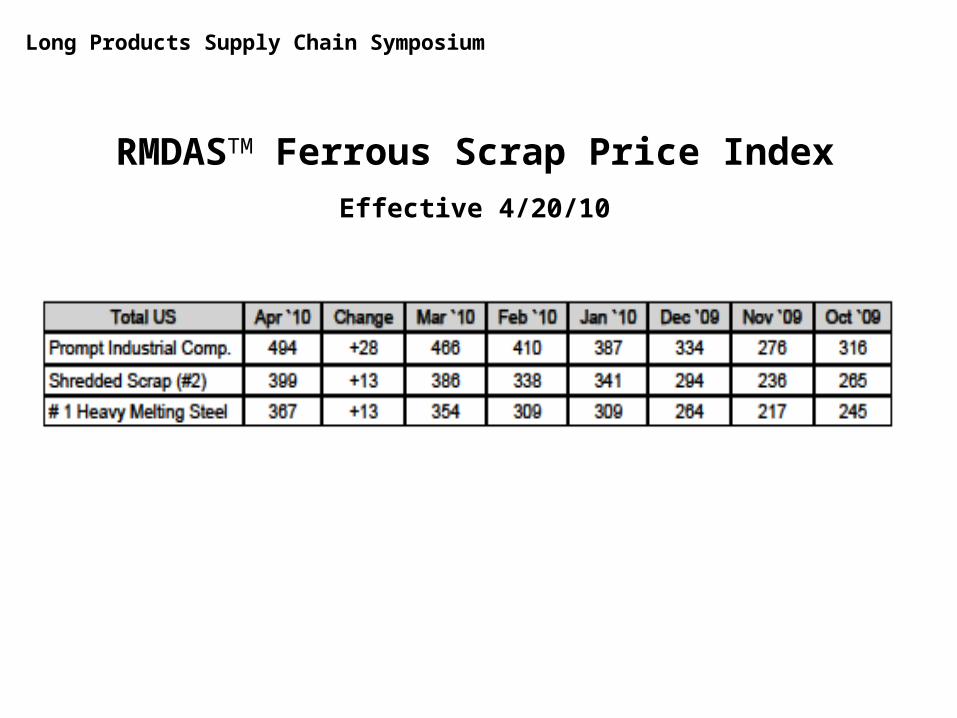
RMDASTM Ferrous Scrap Price Index
Effective 4/20/10
Long Products Supply Chain Symposium

Raw Material Export Restrictions are Continuing to Disadvantage U.S. Steel Producers
• Many countries continue to impose a variety of restrictions on exports of vital raw materials– Export prohibitions– Export duties– Export quotas– Other measures
• Trade-distorting restrictions on exports of raw materials– Give domestic producers in the exporting country an unfair
advantage– Increase worldwide costs of production– Do not accord with the justifications given– Place a heavy burden on steel industries in developing countries
that do not have substantial iron ore reserves or steel supplies scrap
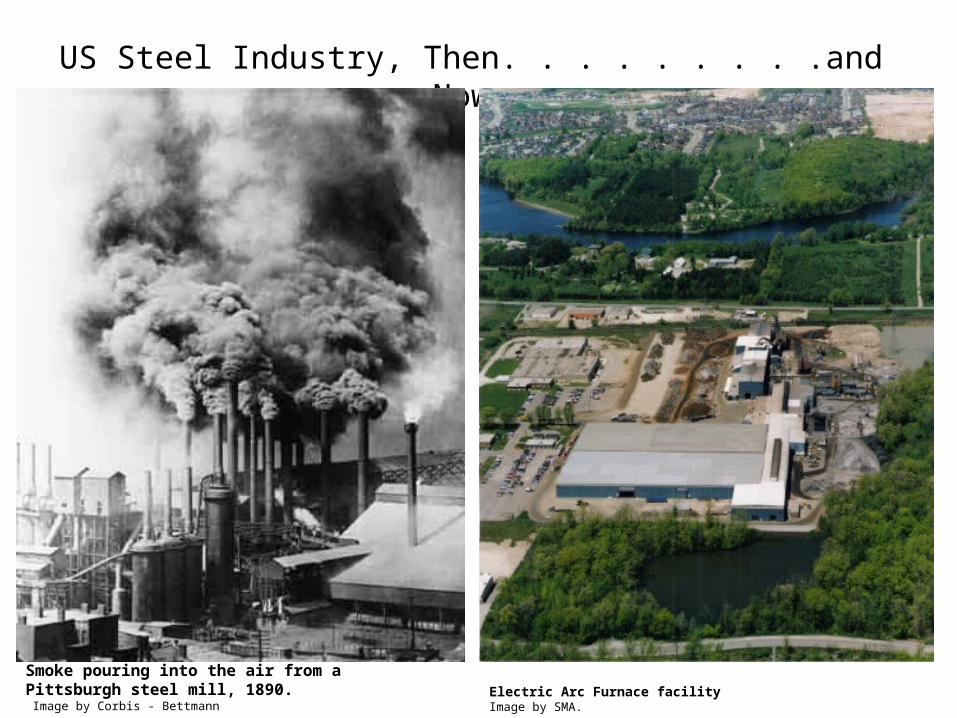
US Steel Industry, Then. . . . . . . . .and Now
Smoke pouring into the air from a Pittsburgh steel mill, 1890. Image by Corbis - Bettmann
Electric Arc Furnace facilityImage by SMA.
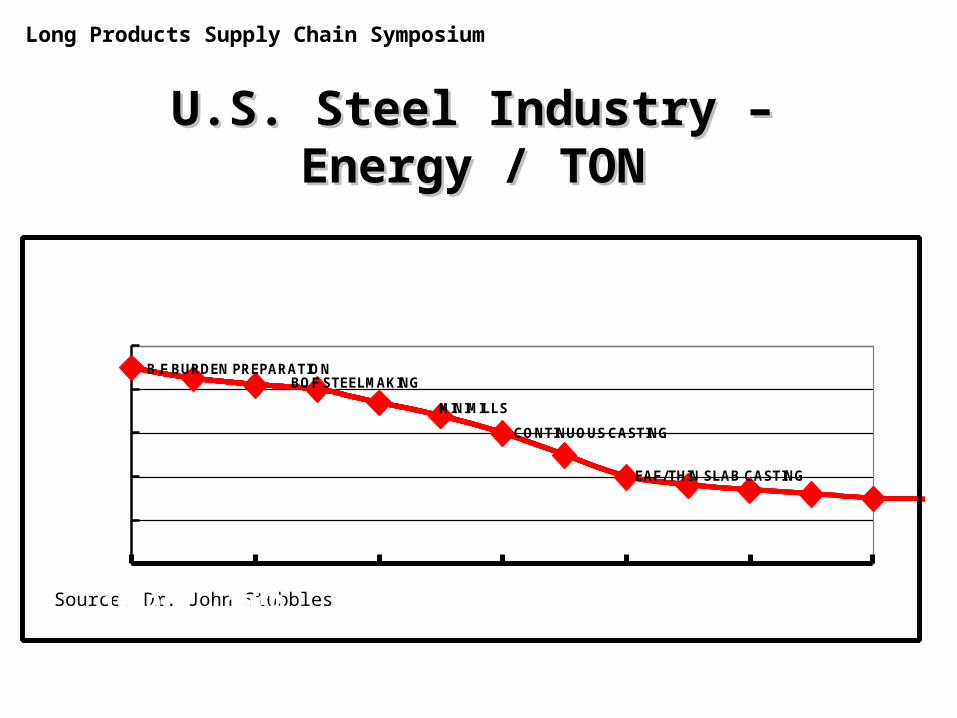
U.S. Steel Industry – Energy / TONU.S. Steel Industry – Energy / TON
Source: Dr. John Stubbles
0
10
20
30
40
50
1950 1960 1970 1980 1990 2000 2010
MIL
LIO
NS
BT
U/T
ON
B.F BURDEN PREPARATIONBOF STEELMAKING
MINIMILLS
CONTINUOUS CASTING
EAF/ THIN SLAB CASTING
Long Products Supply Chain Symposium
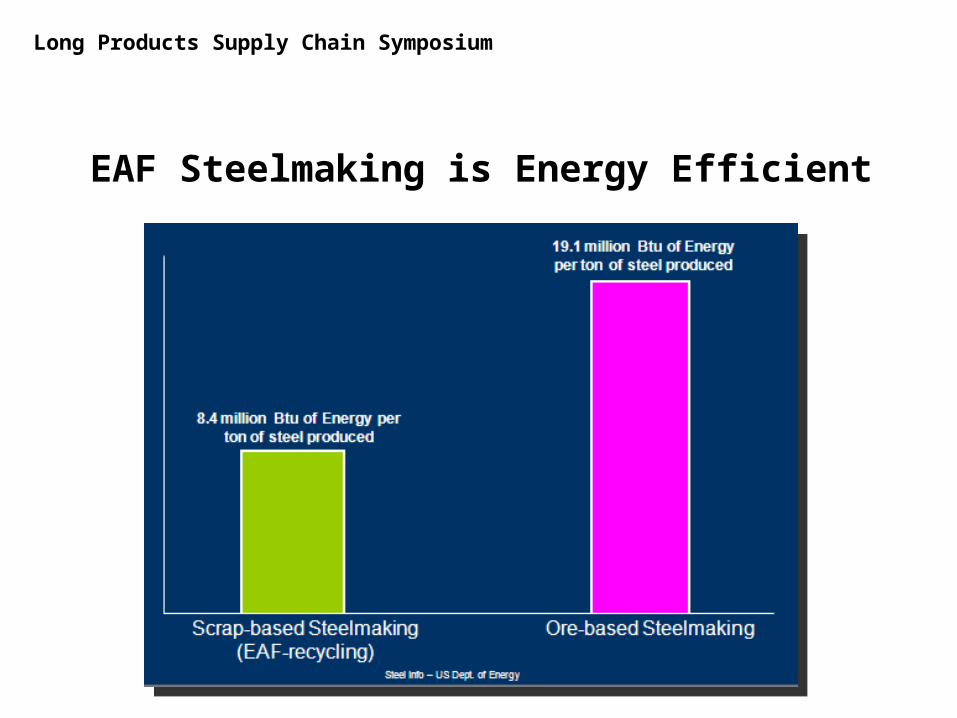
EAF Steelmaking is Energy Efficient
Long Products Supply Chain Symposium

0
50
100
150
200
250
CHINA E.U. JAPAN U.S.
MIL
LIO
NS T
ONS
C (A
S CO
2)
BOF EAF
GLOBAL C ( FOSSIL FUELS ) ~ 8 BILLION TONSU.S. C ( FOSSIL FUELS ) ~ 2 BILLION TONSU.S. STEEL INDUSTRY ~ .034 BILLION TONSU.S.EAF'S ~ .011 BILLION TONS
Long Products Supply Chain Symposium
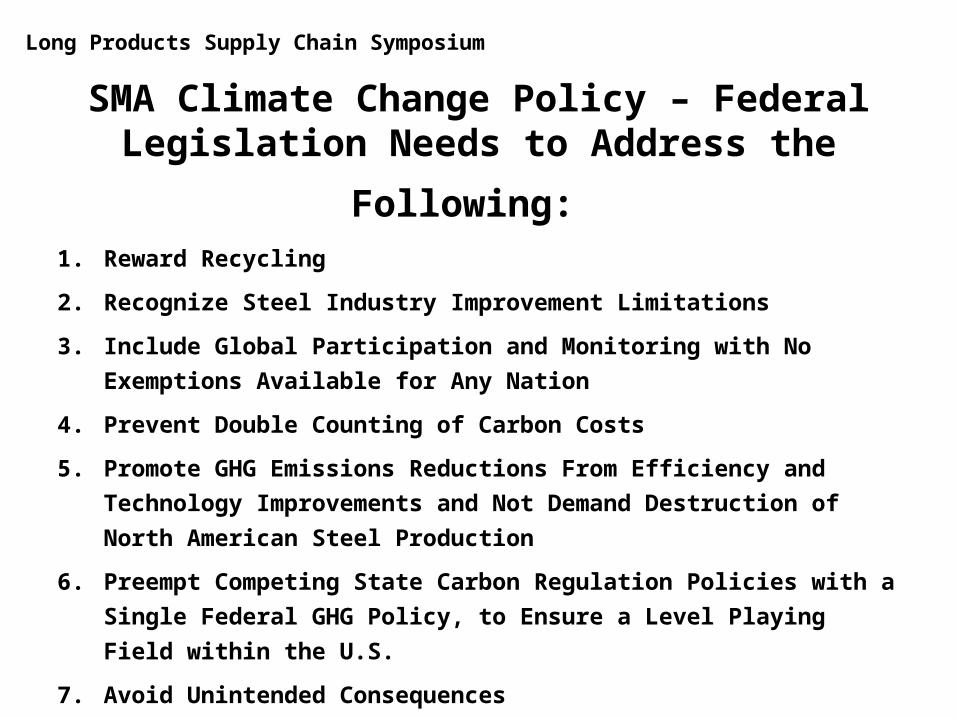
SMA Climate Change Policy – Federal
Legislation Needs to Address the Following: 1. Reward Recycling
2. Recognize Steel Industry Improvement Limitations
3. Include Global Participation and Monitoring with No Exemptions
Available for Any Nation
4. Prevent Double Counting of Carbon Costs
5. Promote GHG Emissions Reductions From Efficiency and
Technology Improvements and Not Demand Destruction of North
American Steel Production
6. Preempt Competing State Carbon Regulation Policies with a Single
Federal GHG Policy, to Ensure a Level Playing Field within the U.S.
7. Avoid Unintended Consequences
Long Products Supply Chain Symposium
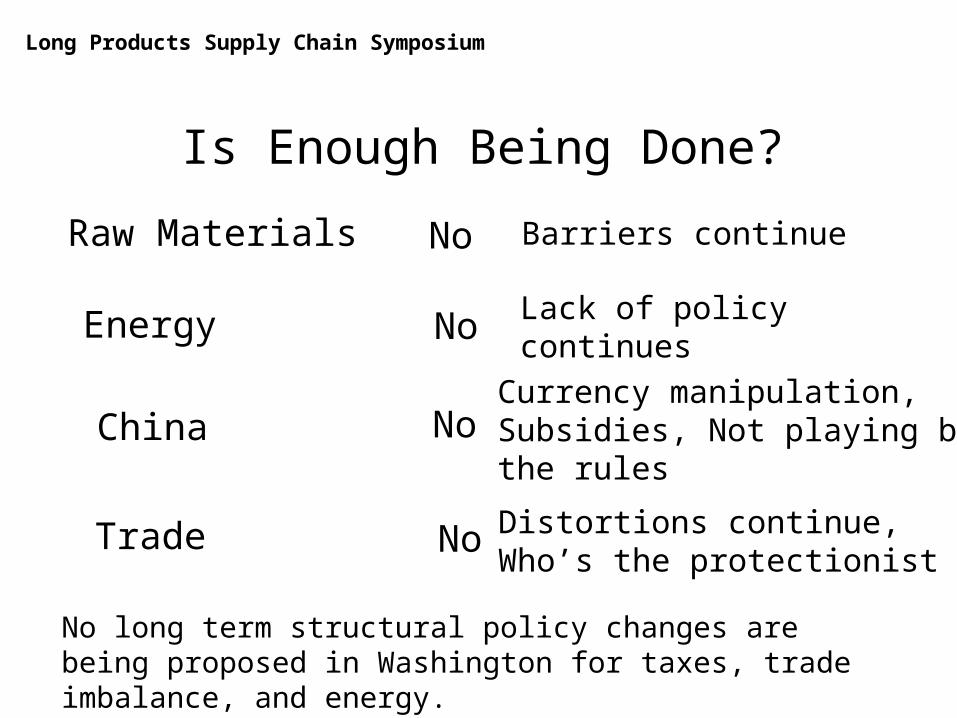
Is Enough Being Done?
Raw Materials
Energy
China
Trade
No
No
No
No
Barriers continue
Lack of policy continues
Currency manipulation, Subsidies, Not playing by the rules
Distortions continue, Who’s the protectionist
No long term structural policy changes are being proposed in Washington for taxes, trade imbalance, and energy.
Long Products Supply Chain Symposium
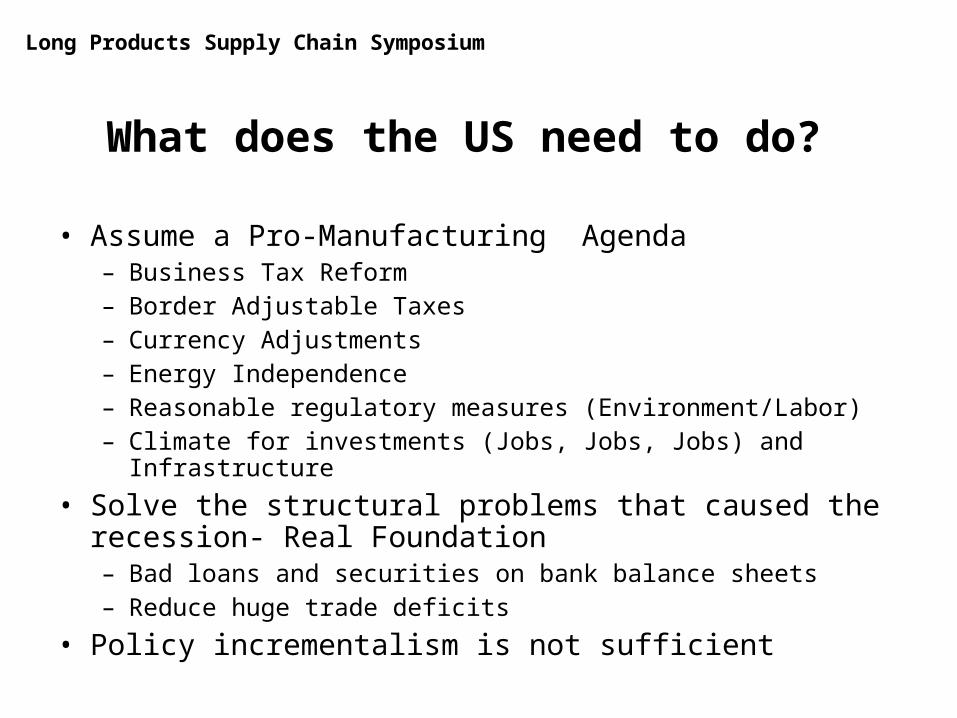
What does the US need to do?
• Assume a Pro-Manufacturing Agenda– Business Tax Reform– Border Adjustable Taxes– Currency Adjustments– Energy Independence– Reasonable regulatory measures (Environment/Labor)– Climate for investments (Jobs, Jobs, Jobs) and Infrastructure
• Solve the structural problems that caused the recession- Real Foundation– Bad loans and securities on bank balance sheets– Reduce huge trade deficits
• Policy incrementalism is not sufficient
Long Products Supply Chain Symposium
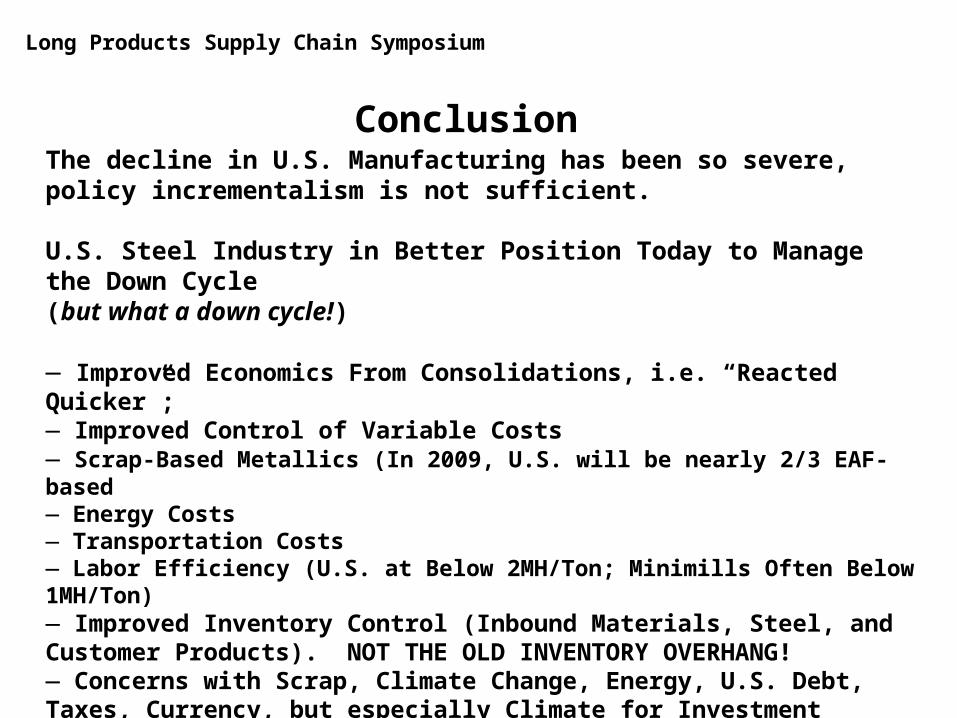
ConclusionThe decline in U.S. Manufacturing has been so severe, policy incrementalism is not sufficient.
U.S. Steel Industry in Better Position Today to Manage the Down Cycle (but what a down cycle!)
― Improved Economics From Consolidations, i.e. “Reacted Quicker”;― Improved Control of Variable Costs― Scrap-Based Metallics (In 2009, U.S. will be nearly 2/3 EAF-based― Energy Costs― Transportation Costs― Labor Efficiency (U.S. at Below 2MH/Ton; Minimills Often Below 1MH/Ton)― Improved Inventory Control (Inbound Materials, Steel, and Customer Products). NOT THE OLD INVENTORY OVERHANG!― Concerns with Scrap, Climate Change, Energy, U.S. Debt, Taxes, Currency, but especially Climate for Investment
― Still Challenging – But Reasons for Meaningful Long-Term Optimism!
Long Products Supply Chain Symposium
Related Documents