THIS REPORT CONTAINS ASSESSMENTS OF COMMODITY AND TRADE ISSUES MADE BY USDA STAFF AND NOT NECESSARILY STATEMENTS OF OFFICIAL U.S. GOVERNMENT POLICY - Date: GAIN Report Number: Post: Report Categories: Approved By: Prepared By: Report Highlights: The German food service sector is large, fragmented, and highly competitive. Foodservice sales continue to be led primarily by independent full service restaurants. International chains have a very strong position in the fast food segment. Total turnover for the German food service sector increased by 3.8% to €65.3 billion in 2011. This is the strongest growth this sector has seen in recent years. Leif Erik Rehder Paul Spencer Food Service - Hotel Restaurant Institutional Strong Food Service Growth Berlin Germany GM13002 1/9/2013 Public Voluntary

Welcome message from author
This document is posted to help you gain knowledge. Please leave a comment to let me know what you think about it! Share it to your friends and learn new things together.
Transcript

THIS REPORT CONTAINS ASSESSMENTS OF COMMODITY AND TRADE ISSUES MADE BY
USDA STAFF AND NOT NECESSARILY STATEMENTS OF OFFICIAL U.S. GOVERNMENT
POLICY
-
Date:
GAIN Report Number:
Post:
Report Categories:
Approved By:
Prepared By:
Report Highlights:
The German food service sector is large, fragmented, and highly competitive. Foodservice sales continue to be led primarily by independent full service restaurants. International chains have a very strong position in the fast food segment. Total turnover for the German food service sector increased by 3.8% to €65.3 billion in 2011. This is the strongest growth this sector has seen in recent years.
Leif Erik Rehder
Paul Spencer
Food Service - Hotel Restaurant Institutional
Strong Food Service Growth
Berlin
Germany
GM13002
1/9/2013
Public Voluntary

General Information:
Germany
HRI Food Service Sector 2012
Section I. Market Summary
Germany's 82 million inhabitants make the food and beverage market the largest in Europe. Overall, Germany
is a net importer in most major classes of food products but local production and firms are in many instances
established and globally competitive. German consumers have high quality expectation for their food and
beverage products but they are also very price sensitive.
Key Factor for Consumer Demand in Germany
Declining population with a birth rate of 1.39 babies born per woman of childbearing age
Ageing population
Number of households is growing
Households are becoming smaller
There is a rise in number of working women
Internationalization of consumer tastes e.g. Chinese, Indian, Italian, Thai, Mexican, American
Reduction in formal mealtimes, leading to an increase in snacking
Healthier eating habits
Sustainability is the trend meeting consumer concerns about environment, obesity, safety of the food
supply
The German food service sector is large and highly fragmented, but can be divided into the commercial and
institutional food service markets. The German commercial food service market includes hotels, restaurants,
fast food and take-away outlets, bars, cafeterias, coffee shops, and similar channels. The institutional food
service market is comprised of hospitals, universities, nursing homes, and cafeterias.
Total turnover for the German food service sector increased by 3.8% to €65.3 billion in 2011. This is the
strongest growth this sector has seen in recent years. Growth came from higher expenditures whereas the
frequency of out of home eating was stable. People were willing to pay more but the so-called ‘price-to-
performance’ ratio is still seen as was one of the most important factors to success. Some key trends include
the use of ‘sustainability’ as a marketing tool, regional produce, convenience, health and wellness, Asian cuisine
and retail catering.

Annual Turnover in the German Hotel/Restaurant/Institutional Sector
Turnover in Billion Euro 2007 2008 2009 2010 2011
Hotels 5.7 5.9 5.6 5.8 5.9
Restaurants and Fast Food Outlets 38.8 38.2 36.1 35.5 36.9
Canteens and caterer 21.6 21.7 20.3 21.6 22.5
Total 66.1 65.8 62.0 62.9 65.3
Source: DEHOGA (Deutscher Hotel- und Gaststättenverband)
Sales of consumer foodservice continued to be led by full service restaurants, which are mainly independent.
Compared with other countries, chains still have a low presence in Germany but they are becoming more
popular. International chains have a very strong position in fast food. The biggest players in the German food
service market are McDonalds, Burger King, LSG, Tank & Rast, and Nordsee.
Top 10 German Food Service Companies
Rank Company Type No. of outlets
Turnover
Growth rate vs. 2010 Million EUR Million USD
1 McDonalds FF 1301 3195 4444.2 5.9
2 Burger King FF 696 790 1098.9 5.3
3 LSG VG 19 714 993.2 0.0
4 Tank & Rast VG 393 597 830.4 0.8 5 Nordsee FF 345 301 418.7 1.3
6 SSP VG 284 185 257.3 0.5
7 Yum! FF 139 177.6 247.0 13.2
8 Aral VG 1076 175.1 243.6 0.7
9 Ikea HG 46 175 243.4 0.0
10 Subway FF 612 175 243.4 -12.5
Source: FoodService Europe, FF; Fast Food, Snacks, Home Delivery; VG: Transportation & trade show
gastronomy; HG: Retail gastronomy
Top 5 Fast Food Restaurant Companies
Company No. of outlets
Turnover
Growth rate vs. 2010 Million EUR Million USD
McDonalds 1301 3195 4444.2 5.9
Burger King 696 790 1098.9 5.3
Nordsee 345 301 418.7 1.3 Yum! 139 177.6 247.0 13.2
Subway 612 175 243.4 -12.5
Source: FoodService Europe
Top 5 Travel Restaurant Companies
Company No. of outlets
Turnover
Growth rate vs. 2010 Million EUR Million USD

LSG 19 714 993.2 4.2 Tank & Rast 393 597 830.4 0.3
SSP 284 185 257.3 0.5
Aral 1076 175.1 243.6 1.1
DB Fernverkehr 542 113.4 157.7 0.9
Source: FoodService Europe
Top 4 Full Service Restaurant Companies
Company No. of outlets
Turnover
Growth rate vs. 2010 Million EUR Million USD
Block Group 45 125 173.9 9.6
Kuffler 36 102.5 142.6 4.5
Maredo 58 101.2 140.8 3.4 Gastro & Soul 31 60.4 84.0 13.7
Source: FoodService Europe
Top 4 Retail Restaurant Companies
Company No. of outlets
Turnover
Growth rate vs. 2010 Million EUR Million USD
Ikea 46 175 243.4 0.0 Karstadt 87 135 187.8 2.9
Metro 113 115 160.0 -11.5
Globus 40 57.5 80.0 8.5
Source: FoodService Europe
Top 5 Leisure Restaurant Companies
Company No. of outlets
Turnover
Growth rate vs. 2010 Million EUR Million USD
Enchilada 76 72 100.2 23.3
Europa-Park 49 68.5 95.3 5.4
Mitchells&Butlers 38 62.5 86.9 9.8
CMS 72 52.4 72.9 2.7
Extrablatt 52 50 69.6 4.2
Source: FoodService Europe
Institutional Foodservice
The largest German food service/catering companies are Compass, Aramark, Sodexo, Dussmann, and Klüh.
Nearly half of total sale volume in this sector came from company restaurants. The strongest growth in 2011
was registered in new markets, such as event catering.
Developments in the individual sectors were as follows:
Company Restaurants
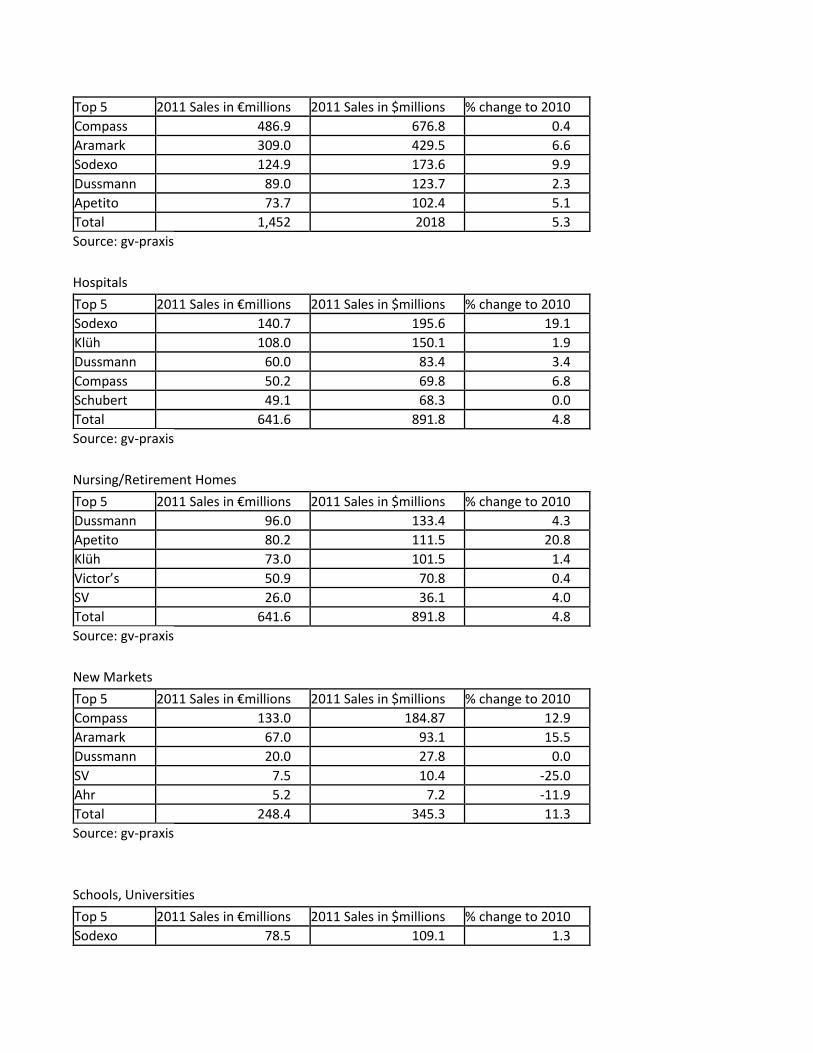
Top 5 2011 Sales in €millions 2011 Sales in $millions % change to 2010
Compass 486.9 676.8 0.4
Aramark 309.0 429.5 6.6
Sodexo 124.9 173.6 9.9
Dussmann 89.0 123.7 2.3
Apetito 73.7 102.4 5.1
Total 1,452 2018 5.3
Source: gv-praxis
Hospitals
Top 5 2011 Sales in €millions 2011 Sales in $millions % change to 2010
Sodexo 140.7 195.6 19.1
Klüh 108.0 150.1 1.9
Dussmann 60.0 83.4 3.4
Compass 50.2 69.8 6.8
Schubert 49.1 68.3 0.0
Total 641.6 891.8 4.8
Source: gv-praxis
Nursing/Retirement Homes
Top 5 2011 Sales in €millions 2011 Sales in $millions % change to 2010
Dussmann 96.0 133.4 4.3
Apetito 80.2 111.5 20.8
Klüh 73.0 101.5 1.4
Victor’s 50.9 70.8 0.4
SV 26.0 36.1 4.0
Total 641.6 891.8 4.8
Source: gv-praxis
New Markets
Top 5 2011 Sales in €millions 2011 Sales in $millions % change to 2010
Compass 133.0 184.87 12.9
Aramark 67.0 93.1 15.5
Dussmann 20.0 27.8 0.0
SV 7.5 10.4 -25.0
Ahr 5.2 7.2 -11.9
Total 248.4 345.3 11.3
Source: gv-praxis
Schools, Universities
Top 5 2011 Sales in €millions 2011 Sales in $millions % change to 2010
Sodexo 78.5 109.1 1.3

Dussmann 25.0 34.75 4.2
Apetito 16.3 22.7 -2.4
Sander 5.8 8.1 16.0
SRH 5.6 7.8 21.7
Total 151.1 210.0 4.8
Source: gv-praxis
The foodservice sector in Germany is set for further growth. This is driven by the trend towards single
households and an aging population. However, there may be long-term financial pressures on Germany’s
middle age and older populations that, coupled with a culture of price sensitivity, will favor low cost lower-cost
foodservice models.
Advantages and Challenges of the German Food Retail Market
Sector Strength & Market Opportunities Sector Weaknesses & Competitive Threats
Germany is the biggest market in Europe with one of the highest income levels in the world
German consumers demand quality and low prices
Many German consumers are uninformed about the details of sustainability and there is yet room to define a U.S. sustainability message
No unified U.S. sustainability message in the German market.
Germany is among the largest food importing nations in the world
EU import regulation and tariffs. EU gives preferential access to products from EU countries
Opportunities for healthy food products not sufficiently available on the local European market
Very competitive market with low growth in retail sales
Germany has many, well established importers. Distribution system is well developed
Margins on food at HRI level are very thin
U.S. style is popular, especially among the younger generation
HRI companies rarely import products into Germany on their own
The size of the EU import quota for beef is rising to 48,200 tons and Germany is the largest EU market.
The quota only applies to beef from animals treated with growth-promoting hormones
Good reputation for U.S. food like dried fruits, seafood, wine.
Large non-German population and German’s inclination to travel abroad help fuel demand for foreign products
Section II. Road Map for Market Entry
The German market offers good opportunities for U.S. food exporters. U.S. suppliers should analyze
German/EU food law, packaging and labeling requirements, business practices and trade-related laws and
tariffs, potential importers and the distribution system. The Office of Agricultural Affairs (OAA) in Berlin offers
guidelines on business practices and import regulations and can assist with contact information on German
buyers.
Purchasing by Hotels, Restaurants, and Institutions is fragmented and competitive. Few of them import

products directly and prefer to buy from distributors. In general, these are wholesalers have specialized in
products or product groups and some are even experts in food products from a specific country of origin. These
specialized importers have an in-depth knowledge of importing requirements, such as product certification,
labeling and packaging. They also typically handle shipping, customs clearance, warehousing and distribution of
products within the country.
The two major distribution channels for the German food service trade are Cash & Carry Wholesalers and
Specialized Distributor/Wholesalers. Cash & Carry wholesalers operate large stores wwith food and non-food
products. They sell to retailers, restaurants, and other food service operators. C&C stores offer a variety of
products to competitive prices. They are not open to average consumers.
Specialized Distributors to the food service sector have dry and cold storage facilities with refrigerated/frozen
trucks for deliveries. They buy from processing companies, importers and occasionally, foreign exporters. To
cover the entire German food service market, regional distributors have organized in groups, such as Intergast
and Service Bund. Some distributors organize in-house food shows once or twice a year where suppliers can
connect with potential customers.
Participating in German food trade shows is a proven way to find the right distributor and facilitates the direct
contact with German food brokers, importers, and wholesalers. Trade shows like ANUGA, Internorga or the
BioFach show in Germany enjoy an exceptional reputation within the global food industry and these shows
outreach is, in many cases, global. For a current listing of German food trade shows, please see: www.usda-
mideurope.com
Section III. Competition
Competition for U.S. exports

Product category Total Import in million US$, 2011
Main suppliers in percentage, 2011
Strengths of Key supply countries
Advantages and Disadvantages of Local Suppliers
PG 30 Breakfast Cereals
256
1. France 16.3
2. Netherlands 14.9 3. United Kingdom 12.5
16. U.S. 0.2
Distance, availability and regional products
Developed processed food industry
PG 31 Snack Foods
3,258
1. Netherlands 23.3
2. Belgium 22.3
3. Poland 8.3
4. U.S. 0.2
Distance, availability and regional products
Developed confectionary industry
HS 02: Meat 8,094
1. Netherlands 22.5
2. Belgium 13.7
3. Denmark 11.1
18. U.S. 0.8
Distance and availability
Focus on dairy production instead of beef production. Genetics need improvement
HS 03: Fish and Crustaceans
4,294
1. Poland 14.3
2. Denmark 12.5
3. China 12.2
6. U.S. 5.5
1,2: Distance and availaibility 3: Price/quality ratio
Tradition in seafood trading and processing, fish is popular
HS 04: Dairy Produce; Birds Eggs and Natural Honey
8,625
1. Netherlands 31.3
2. France 14.5
3. Austria 7.7
33. U.S. 0.1
Proximity Great tradition of milk and milk based products
HS 07: Edible vegetables
6,444
1. Netherlands 38.1
2. Spain 20.3
3. Italy 9.0
19. U.S.
1: Proximity 2,3: Tradition, different climate/ supply/ taste/ varieties
Products not sufficiently available on local market
0.3
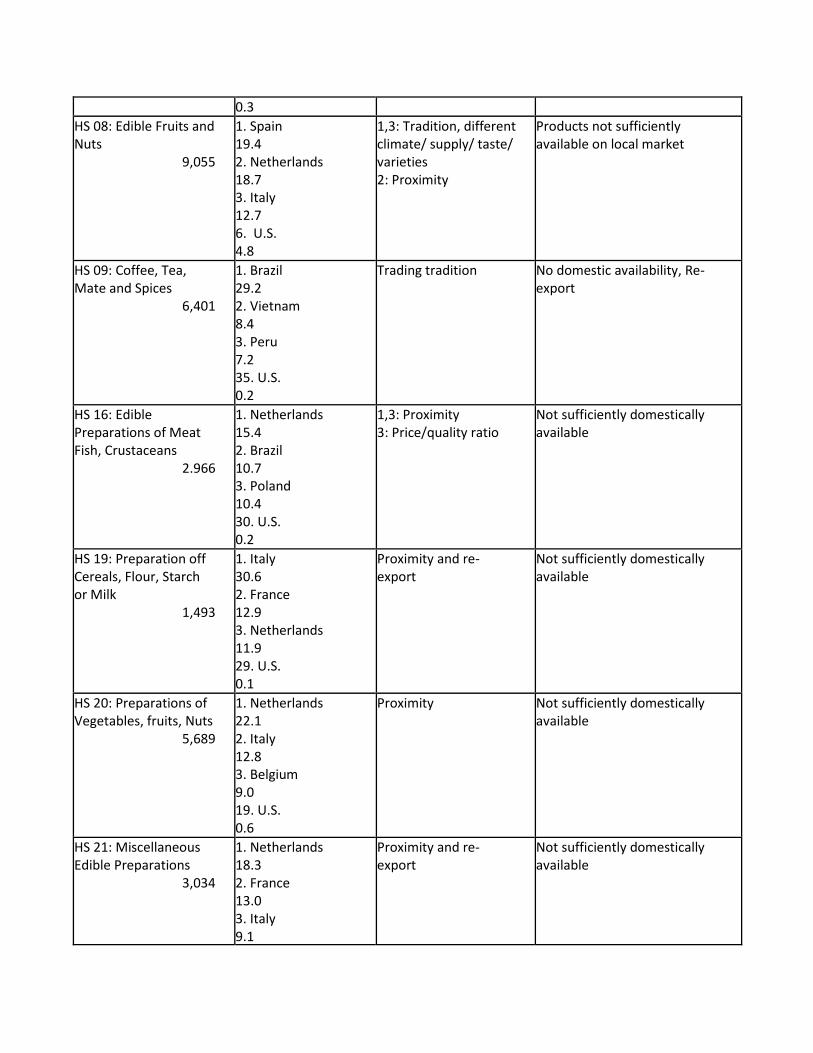
HS 08: Edible Fruits and Nuts
9,055
1. Spain 19.4
2. Netherlands 18.7 3. Italy 12.7
6. U.S. 4.8
1,3: Tradition, different climate/ supply/ taste/ varieties 2: Proximity
Products not sufficiently available on local market
HS 09: Coffee, Tea, Mate and Spices
6,401
1. Brazil 29.2
2. Vietnam 8.4
3. Peru 7.2
35. U.S. 0.2
Trading tradition No domestic availability, Re-export
HS 16: Edible Preparations of Meat Fish, Crustaceans
2.966
1. Netherlands 15.4
2. Brazil 10.7 3. Poland 10.4
30. U.S. 0.2
1,3: Proximity 3: Price/quality ratio
Not sufficiently domestically available
HS 19: Preparation off Cereals, Flour, Starch or Milk
1,493
1. Italy 30.6
2. France 12.9
3. Netherlands 11.9
29. U.S. 0.1
Proximity and re-export
Not sufficiently domestically available
HS 20: Preparations of Vegetables, fruits, Nuts
5,689
1. Netherlands 22.1
2. Italy 12.8 3. Belgium 9.0
19. U.S. 0.6
Proximity Not sufficiently domestically available
HS 21: Miscellaneous Edible Preparations
3,034
1. Netherlands 18.3
2. France 13.0
3. Italy 9.1
Proximity and re-export
Not sufficiently domestically available

11. U.S. 1.6
HS 22: Beverages, Spirits, Wine and Vinegar
8,679
1. Italy 20.7
2. France 20.5
3. Netherlands 11.3
8. U.S. 4.7
Excellent regional products
Not sufficiently domestically available
Source: www.gtis.com
Section IV Best Product Prospects
U.S. products with the best export opportunities in German market meet one or more of the following criteria:
The basic product is not produced in Europe in sufficient quantities or the American quality is superior
The product (usually fresh) is available on a counter seasonal basis
The product is unique to the United States
Best Product Prospects
Product Category Total German Imports 2011 in millions of U.S. $
German Imports from the U.S. in millions of U.S. $
U.S. Import Growth in 5 years (2007-2011)*
Market attractiveness for USA
Fish and Seafood Products
5,146 257 -1% The German market offers lucrative opportunities for fish and seafood products. Fish consumption is growing as consumers associate fishery products with a healthy diet. Best prospects for U.S. and seafood exports are salmon, (lobster), shrimps, crabs, caviar substitutes, catfish and scallops
Tree Nuts 1,539 298 14% The United States is the biggest supplier of tree nuts to Germany. Most tree nuts are used as ingredients by the food processing sector. Almonds are the most important commodity within this category. Further products with good sales potential include hazelnuts, pistachios, pecans and walnuts.
Wine and Beer 3,902 98 42% Germany has a high share of domestic wine production. However, good prospects exists for “new world wines” including those from the U.S.

Pet Foods (Dog and Cat)
861 1.6 -22% Sales of cat food have the biggest market share. U.S. exports are declining but potential exists for premium pet food.
Processed Fruits and Vegetables
3,295 33 11% German imports are slowly increasing. Those products are mostly used as ingredients by the food processing sector for the production of pastries and cereals. Dried fruits and prepared nuts are also popular as a snack.
Snack Foods (Excl. Nuts)
3,257 6.5 12% German demand for healthy, organic, innovative, and exotic snacks continues to grow.
Red Meats Fresh/Chilled/Frozen
5,541 68 2439% Good opportunities for U.S. high quality beef produced without growth promotants. The EU quota size and administration system have recently see changes.
www.gtis.com; * Due to the global financial crisis most import volumes peaked in 2008. U.S. imports have
recovered slowly. Some products like pet foods and fish still haven’t reached pre-crisis levels.
Category A: Products Present in the Market That Have Good Sales Potential
Tree nuts
Wine
Processed fruits and vegetables
Fruit juices
Snack foods
Health food, organic food, sustainable food products
Dried fruits
Category B: Products Not Present In Significant Quantities but Which Have Good Sales Potential
High quality beef (produced without promotants)
Cranberries and cranberry products
Seafood and seafood products
Game and exotic meat
Innovative sauces, condiments and confectionary products
Products featuring ‘sustainable’ or other social issue-based marketing theme
Category C: Products Not Present Because They Face Significant Barriers
Poultry (non-tariff barrier)
Processed food with GMO ingredients, bleached flour
Section V. Post contact and further information

Participating or simply attending a trade show can be very cost-effective way to test the German market, to
introduce a product, or to expand sales. Germany offers a wide variety of trade show venues for food and
beverage products. U.S. Exporters who are looking to sell to the German Market should consider participating
or visiting the following trade shows. The trade shows Internorga and ANUGA are of special interest as these are
leading fairs for food service companies.
ANUGA (every two years) www.anuga.com
One of the leading global food fairs for the retail trade and the food service and catering market
ISM (International Sweets and Biscuit Show) www.ism-cologne.com
World’s largest show for snacks and confectionery products
Fruit Logistica
www.fruitlogistica.com The World's Leading Trade Fair for the Fresh Fruit and Vegetable Business
Bio Fach
www.biofach.com Leading European tradeshow for organic food and non-food products
VeggieWorld
www.veggieworld.de Germany’s leading tradeshow for vegetarian products
ProWein
www.prowein.com International trade show for wine and spirits
Internorga
www.internorga.com International tradeshow for the hotel, restaurant, catering, baking, and confectionery trades
More information about these and other German exhibitions and trade shows can be found under the following
Internet address: www.auma-messen.de.
Homepages of potential interest to the U.S. food and beverage exporters are listed below:
Foreign Agricultural Service Berlin www.usda-mideurope.com
Foreign Agricultural Service Washington http://www.fas.usda.gov
European Importer Directory http://www.american-foods.org/
One tip of use to U.S. exporters is a German business ‘portal’, which is maintained by the Ministry of Economics
and Technology. Provided in English, it serves as a central contact platform that can steer inquiries into the
right channel. More information about the food and beverage sector can be found under:
http://www.ixpos.de/IXPOS/Navigation/EN/your-business-in-germany.html
If you have questions or comments regarding this report, or need assistance exporting to Germany, please

contact the U.S. Foreign Agricultural Service Office in Berlin at:
Foreign Agricultural Service
U.S. Department of Agriculture
Embassy of United States of America
Clayallee 170
14191 Berlin
Tel: (49) (30) 8305 – 1150
Fax: (49) (30) 8305 – 1935
E-Mail: [email protected]
Related Documents


