Welcome message from author
This document is posted to help you gain knowledge. Please leave a comment to let me know what you think about it! Share it to your friends and learn new things together.
Transcript


This project was funded by an Australian Government
Department of Health and Ageing:
Quality Use of Pathology Program grant
Suggested citation:
Georgiou A, Vecellio E, Toouli G, Eigenstetter A, Li L, Wilson R, Westbrook JI. The impact of the
implementation of electronic ordering on hospital pathology services. Report to Commonwealth of
Australia, Department of Health and Ageing, Quality Use of Pathology Committee. Australian
Institute of Health Innovation, University of New South Wales, Sydney. October 2012.
© Centre for Health Systems and Safety Research
Published 2012
Centre for Health Systems and Safety Research
Australian Institute of Health Innovation
University of New South Wales
ISBN: 978-0-7334-3194-4

Quality Use of Pathology Program Report
i
Table of Contents
SECTION I: EXECUTIVE SUMMARY ............................................................................ 1
SECTION II: GLOSSARY .................................................................................................. 6
SECTION III: INTRODUCTION ........................................................................................ 7
The Electronic Medical Record ........................................................................................ 7
Project aim ........................................................................................................................ 8
Project setting ................................................................................................................... 8
SECTION IV: QUALITY AND SAFETY OF THE TEST ORDERING PROCESS ....... 12
Introduction .................................................................................................................... 12
Study design ................................................................................................................... 13
Pre-analytic stage of the laboratory process ................................................................... 13
CSR error categories ....................................................................................................... 16
Data collection and analysis ........................................................................................... 17
Frequency of test order errors ......................................................................................... 19
SECTION V: EFFECTIVENESS OF THE TEST ORDERING PROCESS ..................... 24
Methods .......................................................................................................................... 24
Test volume .................................................................................................................... 27
Diagnosis-related Groups (DRG) ................................................................................... 28
Add-on testing ................................................................................................................ 32
Repeat testing ................................................................................................................. 33
SECTION VI: TURNAROUND TIMES ........................................................................... 37
Introduction .................................................................................................................... 37
Methods .......................................................................................................................... 37
Results ............................................................................................................................ 37
SECTION VII: PATIENT OUTCOME – EMERGENCY DEPARTMENT (ED)
LENGTH OF STAY .......................................................................................................... 41
Aims................................................................................................................................ 41
Data background ............................................................................................................. 41
Data inclusion criteria ..................................................................................................... 41
Comparison of ED LOS between this study dataset and Bureau of Health Information
ED Quarterly report (July-Sep 2011) ............................................................................. 42

Quality Use of Pathology Program Report
ii
Methods .......................................................................................................................... 43
Results ............................................................................................................................ 43
The relationship between ED LOS and the pathology service ....................................... 48
SECTION VIII: BENEFITS REALISATION FRAMEWORK ........................................ 50
Laboratory test order errors ............................................................................................ 50
Effectiveness of the test order process ........................................................................... 51
Timeliness of the test ordering process .......................................................................... 52
Patient outcomes – ED length of stay ............................................................................. 53
Performance indicators of the impact of EMR on the quality of pathology services ..... 53
Appendix I – CSR error log sheet used for the paper-based documentation of errors (in
use until 21 September 2009) ............................................................................................. 62
Appendix II – Daily summary log sheet for paper-based documentation of errors (in use
until 21 September 2009) ................................................................................................... 63
Appendix III – Screenshot of the revised computerised error log interface showing the list
of possible error categories (in use from 1 March 2010) ................................................... 64
Appendix IV– A sample EMR test order form print-out which was manually altered
(requesting an additional Full Blood Count test), resulting in an “EMR test order
problem” error .................................................................................................................... 65
Appendix V – Screenshot of a duplicate order alert in the EMR ....................................... 66
Appendix VI – Flow diagram for handling of “handwritten request on an EMR order”
errors in the CSR ................................................................................................................ 67
REFERENCES ................................................................................................................... 68

Quality Use of Pathology Program Report
1
SECTION I: EXECUTIVE SUMMARY
Project aim
This project aimed to assess the impact of electronic ordering systems, on the quality use of
pathology services across six hospital sites and different pathology departments, for the
following areas:
the legibility and completeness of laboratory test orders and the impact on Central
Specimen Reception work processes (Quality of test orders).
the volume and mix of tests ordered examined by such factors as Diagnosis-related
Groups (DRGs), adjusted for clinical activity where appropriate, and the prevalence
of add-on and repeat testing (Effectiveness).
the timeliness of the pathology laboratory process (Turnaround time).
the impact of pathology performance (e.g., laboratory test turnaround times) on the
duration of patient stay in the emergency department (Patient outcome).
The project also produced a benefits realisation framework, made up of performance
indicators, that can be used to guide the assessment of electronic ordering in a pathology
service and to monitor what works (or doesn’t work), where, and in what circumstances.
The project was funded by an Australian Government Department of Health and Ageing,
Quality Use of Pathology Program grant.
Project setting
An electronic medical record (EMR) system utilising Cerner PowerChart became available
at Hospitals A, B, and C, on 26 October 2009; Hospital D on 29 June 2009, Hospital E on 1
October 2008, and Hospital F on 9 March 2009. The EMR allowed the clinicians to create
electronic orders. In 2011, electronic ordering was used for approximately 66% of pathology
test orders across the six hospitals.
Laboratory test order errors
Electronic ordering systems (referred to as EMR in the settings involved in this study) are
expected to eliminate legibility problems in handwritten orders and to reduce errors,
particularly during the pre-analytic phase involving patient identification and specimen
collection and labelling. They are also able to contribute to improvements in the quality of

Quality Use of Pathology Program Report
2
the information provided to the laboratory, thus increasing efficiency and effectiveness in
the laboratory.
A longitudinal analysis of laboratory errors including a period after the implementation of
the EMR showed an increase in the number of errors, both as raw frequency and as a rate
per 1000 test order episodes. This increase was accounted for by the introduction of a new
class of errors associated with the EMR and the processes surrounding its use. A cross-
sectional analysis, comparing the error rate for EMR orders with that for paper orders (for
the same period of time), indicated that the overall error rate for many categories of error
was lower for EMR orders than for paper orders. Critically, this pattern was consistent for
all three Incident Information Management System (IIMS) categories of errors that relate
particularly to patient safety issues.
Test volume
A series of analyses across the six hospital sites was undertaken to compare test volumes
and aspects of the effectiveness of the test order process. A comparison of the rates before
(2008) and after (2011) the implementation of the EMR, indicated that the mean number of
tests ordered in each test order episode decreased significantly at each of the hospitals.
Taken for all hospitals, the mean number of tests for each episode fell from 4.63 in 2008 to
4.36 in 2011.
Diagnosis-related Group casemix
Our comparison of the number of tests undertaken per admission and grouped in DRG
categories provided examples such as A06B (Tracheostomy w/ventilation >95hrs) where the
mean number of tests per admission fell from 181.10 in 2008 to 156.77 in 2011, but where
the corresponding mean length of stay rose from 646 hours to 696 hours. Alternatively, for
E62A (Respiratory infections) the numbers were 40.60 to 42.81 for mean number of tests
and 305 to 289 hours for mean length of stay. The use of DRGs also provided a valuable
means to examine test ordering patterns across hospitals. Our analysis of the test ordering
profiles for F74Z (Chest pain) at four hospital emergency departments (EDs) highlighted
similar test ordering patterns (e.g., Troponin, EUC, and Automated Differential tests were
consistently the most frequently ordered tests). There were some differences in test ordering
profiles, especially for the lower volume tests, between hospitals compared across the pre-
and post-EMR periods. The mean number of C-Reactive protein tests per ED presentation

Quality Use of Pathology Program Report
3
varied both between hospitals and between years. At three of the EDs the mean number of
C-Reactive protein tests per ED presentation was higher in 2011 than in 2008.
Add-on testing
Add-on tests are test assays that are performed on an existing specimen within the pathology
service. The reasons for ordering an add-on test may include; requiring a base-line test result
in cases where treatment has already commenced, the ordering clinician neglecting to order
all relevant tests in the first instance, or simply to avoid subjecting certain vulnerable
patients to additional phlebotomies. Add-on tests are labour-intensive and disruptive and
place a disproportionate burden on laboratory resources. The add-on rates between hospitals
ranged from 0.61% (Hospital B; specialist hospital) to 2.24% (Hospital F; metropolitan
general hospital). The clinical chemistry and haematology departments, combined,
accounted for 70% of all add-on test volume. In the clinical chemistry and haematology
departments, add-on tests accounted for 2.56% and 0.69%, respectively, of all ordered tests.
Repeat tests
We compared the rate of paper and EMR-ordered EUC tests which were ordered within one
hour and 24-hours of the previous EUC test. In 2011, the overall proportion of repeat EUC
testing occurring within one hour of the previous EUC test was significantly greater for
paper tests than EMR tests (0.69% and 0.25%, respectively). While, for tests ordered within
24 hours, there was a significantly lower proportion of repeat tests with paper orders than
for EMR orders (11.68% and 34.04%, respectively).
Test turnaround time
Laboratory turnaround time (TAT) is the time taken by the laboratory to complete the entire
testing process (from when the specimen arrives in the CSR to when a result is available to
the clinician). TAT is often used as a key performance indicator of laboratory performance.
Our analyses showed that the median data entry time (the time from when the specimen
arrives in the CSR until the order is entered into the Laboratory Information System), for all
hospitals combined, was three minutes shorter for EMR than paper. This difference was
consistent and significant for both EUC and Automated Differential in 2010 and 2011.
These decreases contributed to significantly lower median Total Laboratory TATs for EMR
orders than for paper orders (for EUC tests, the difference in medians was 12 minutes in
2010 and six minutes in 2011; for Automated Differential tests, the difference in medians
was four minutes in 2010 and two minutes in 2011).

Quality Use of Pathology Program Report
4
Patient outcomes – Emergency Department length of stay
This project used multilevel linear regression modelling to examine the relationship between
length of stay (LOS) in the ED along with pathology testing characteristics such as TAT and
the volume of tests. The final model, accounting for 24% of the variation in ED LOS,
showed that after controlling for the effect of patient age, triage category, number of tests in
the test order episode, and ED mode of separation, the ED LOS on average, increased by
9.8% for every 60 minutes increase in the test turnaround time.
Benefits realisation framework
The evidence provided by this research (as summarised above) has highlighted the value of
a set of key performance indicators that can be used to measure major features of electronic
ordering and its effect on the laboratory processes (predominantly the pre-analytical
processes). These indicators can be used for comparisons between hospitals, wards etc., to
help monitor and improve the overall safety of patient care, efficiency in the wards, and to
help enhance the quality of pathology provided.
In this project, the utilisation of these indicators provided valuable empirical information
about the EMR and its impact on pathology services and clinical work processes. Within the
CSR they revealed the impact of errors associated with the introduction of the EMR but also
showed how the EMR-ordering was associated with significantly fewer IIMS-related errors
when compared with paper orders. The introduction of EMR was connected to a significant
decrease in the mean number of tests for each test order episode across each hospital when
compared before and after EMR implementation. This project used DRG categories to
compare the number of tests per admission and to examine test ordering patterns across
hospitals. Add-on test rates were investigated between hospital departments to provide
benchmarks for future analyses. The analysis of repeat tests for EMR-ordered EUC tests
showed that the overall proportion of repeat EUC tests which occurred within one hour of
the previous EUC test was significantly lower for EMR than for paper orders. The project
identified a significant decrease, for all hospitals, in the median time taken from specimen
arrival in the CSR to the time the order was entered in the Laboratory Information System.
This decrease contributed to the significantly lower median laboratory TAT measured from
the time a specimen arrived at CSR to the time a result was available to the clinician. The
project’s multi-level linear regression modelling examined the relationship between LOS in

Quality Use of Pathology Program Report
5
the ED along with pathology testing characteristics such as TAT and the volume of tests,
and produced a model that accounted for 24% of ED LOS variation.

Quality Use of Pathology Program Report
6
SECTION II: GLOSSARY
Glossary of general terms
BHI
Bureau of Health Information
CPOE Computerised Provider Order Entry
CSR Central Specimen Reception
DRG Diagnosis-related Group
ED Emergency Department
EDIS Emergency Department Information System
EMR Electronic Medical Record
ICT Information and Communication Technology
IIMS Incident Information Management System
IQR Inter-quartile range
ISO International Organization for Standardization
KIMMS Key Incident Monitoring and Management Systems
LIS Laboratory Information System
LOS Length of stay
NATA National Association of Testing Authorities
PAS Patient Administration System
RCPA Royal College of Pathologists of Australasia
TAT Turnaround time
Glossary of pathology tests
Automated Diff
Automated Differential (includes full blood count)
CA MG PHOS Calcium, magnesium, phosphate
CK Creatine kinase
CKMB Creatine kinase MB isoenzyme
C-Reactive protein C-Reactive protein
D-Dimer LIA D-Dimer Latex Immuno Assay
EUC Electrolytes, Urea, Creatinine
BLOOD GAS Blood gases
Glucose Glucose
LFT Liver function test
Lipase Lipase
PT Prothrombin time
INR International normalised ratio
APTT Activated partial thromboplastin time
Troponin Troponin I and Troponin T
TSH Thyroid Stimulating Hormone

Quality Use of Pathology Program Report
7
SECTION III: INTRODUCTION
Pathology services are widely seen as an area where information and communication
technologies (ICT) can have a major impact on the efficiency and effectiveness of service
delivery.1 They are information-intense bodies that provide services across primary,
secondary and tertiary care and are responsible for leveraging 60-70% of all critical
decision-making involving patient admission, discharge and medication choice.2
The Electronic Medical Record
Electronic ordering systems (also known as Computerised Provider Order Entry [CPOE])
enable the integration of clinical and patient data systems across the hospital. They provide
clinicians with the ability to order diagnostic tests directly via a computer terminal thus
eliminating the need for paper test orders which inherently have considerable potential for
error.3 Electronic ordering systems are also seen as the building block for the hospital-wide
electronic medical record.4 There has been considerable support for the introduction of
electronic ordering systems across healthcare settings internationally, not least because of
the significant advantages they provide pathology services and their contribution to the well-
being of patients.5 These systems can be used to reduce the duplication of test orders,
eliminate legibility problems and significantly decrease the possibility of misidentification
of patient specimens and order forms.6 In short they can contribute to greater efficiency,
effectiveness and safety in pathology services.7 8
Electronic ordering systems may also
incorporate decision support features which can help clinicians choose the correct test, and
make evidence-based decisions that improve the quality of care provided to patients.9
Despite the potential for electronic systems to improve effectiveness and efficiency across
hospital departments, there has been slower than expected diffusion of these systems across
healthcare settings over the last decade,10 11
and there is evidence that important features of
these systems remain underutilised or poorly implemented.10 12
There are many reasons for
this – implementation of health information and communication systems is difficult,
involving a number of complex organisational and professional challenges beyond the
ubiquitous technical issues.13-15
These challenges include problems associated with reaching
agreement about standards across departments (e.g., commonly agreed laboratory order sets
or diagnostic algorithms relevant for specified patient conditions).16
There is also the
possibility of clinical resistance to electronic ordering systems and decision support

Quality Use of Pathology Program Report
8
prompts17
that may be related to problems with usability, and incompatibility with existing
systems and processes for performing clinical and laboratory work.18
Project aim
This project aimed to deliver findings, compared between multiple hospital sites and
different pathology departments, about the impact of electronic ordering systems on the
quality use of pathology services. It aimed to achieve this through the development of a
benefits realisation framework that assesses: quality (ensuring that the right process is
performed well and meets identified needs and other relevant standards);19
effectiveness (the
best possible outcome) or success of the intervention;20
and timeliness (turnaround times).21
This involved an examination of the impact of the electronic ordering system on key
indicators of laboratory performance and the quality use of pathology across the following
areas:
the legibility and completeness of laboratory test orders and the impact on Central
Specimen Reception work processes.
the volume and mix of tests ordered examined by such factors as Diagnosis-related
Groups (DRG), controlling for clinical activity where appropriate, and the
prevalence of add-on and repeat testing.
the timeliness of the pathology laboratory process.
the impact of laboratory performance (e.g., laboratory test turnaround times) on the
duration of patient stay in the emergency department.
The project provided key comparative (between six hospitals) and longitudinal (over time)
evidence about the effects of electronic ordering systems; and produced a benefits
realisation framework that can be used to monitor what works (or doesn’t work), where and
in what circumstances. The outputs of this project can be used to enhance the application of
electronic ordering systems in hospital pathology settings. The project was funded by an
Australian Government Department of Health and Ageing, Quality Use of Pathology
Program grant.
Project setting
The project was undertaken across three Local Health Districts/Special Health Networks in
New South Wales covering a resident population of around 1.2 million people.22
The focus
was on a group of six hospitals serviced by a single fully accredited pathology laboratory

Quality Use of Pathology Program Report
9
service which provides comprehensive biomedical laboratory services including the
following laboratory specialties: Anatomical Pathology, Blood Bank, Clinical Chemistry,
Microbiology, Endocrinology, Haematology, Molecular Genetics and Immunology. The
entire pathology service (of which we investigated only a component) employs over 828
staff and deals with approximately 13 million tests annually.
During the initial implementation, the electronic medical record (EMR), which allowed
clinicians to create electronic orders, was based on the Cerner PowerChart system, Version
2007.16 and became available at Hospitals A, B, and C on 26 October 2009; Hospital D on
29 June 2009, Hospital E on 1 October 2008, and Hospital F on 9 March 2009. In May
2011, the EMR was upgraded to Cerner PowerChart system, Version 2010.02.16. The
Laboratory Information System (LIS) in Hospitals A, B, C, and E is Integrated Software
Solutions (ISS) Omnilab v9.4.2 SR10 while in Hospitals D and F the laboratory information
system is ISS Omnilab v9.5.2 SR26. Table 1 shows the number of available beds, the
number of pathology tests, and number of patients who had pathology tests, at each of the
six study hospitals for the month of September 2011. The three large metropolitan general
hospitals (A, E, and F) accounted for both the bulk of pathology tests and patients who had
pathology tests. The two specialist hospitals, (B and C) and the regional hospital (D),
accounted for the smallest proportion of pathology tests.
Hospital Available Beds Test numbers Patients who had tests
A 567 85208 5387
B 187 15316 2129
C 159 23600 1847
D 197 25234 1916
E 654 116045 6362
F 538 82942 5155
Total 2302 348345 22796
Table 1. Number of pathology tests compared by numbers of patients and
available beds
The number and proportion of tests that were ordered electronically (EMR) and using the
paper system, for each of the six hospitals during the period August-September of 2008 to
2011, are shown in Table 2. In 2009, 41% of all orders across all sites were electronic
orders, the remainder were paper orders. With the introduction of EMR at Hospitals A, B,
and C, in 2010 the proportion of tests ordered with EMR increased to 64%, and to 66% in
2011. The greatest rate of electronic ordering utilisation was at Hospital D (around three-

Quality Use of Pathology Program Report
10
quarters of tests ordered electronically); the smallest rate of electronic ordering was at
Hospital B (around one-third of tests ordered electronically).
Number of Tests
(Proportion of Tests Accounted for)
Hospital 2008 2009 2010 2011
EMR Paper EMR Paper EMR Paper EMR Paper
A . 181256
(100%) .
160690
(100%)
115825
(70%)
50480
(30%)
122024
(68%)
56795
(32%)
B . 33287
(100%) .
31887
(100%)
9998
(32%)
21205
(68%)
10124
(33%)
21006
(67%)
C . 57216
(100%) .
52502
(100%)
31544
(60%)
20729
(40%)
27755
(56%)
21413
(44%)
D . 47226
(100%)
31968
(79%)
8395
(21%)
33443
(79%)
8953
(21%)
36422
(73%)
13193
(27%)
E . 223041
(100%)
132601
(65%)
72095
(35%)
140108
(63%)
81378
(37%)
161935
(68%)
76229
(32%)
F . 178432
(100%)
100547
(62%)
61749
(38%)
102627
(62%)
62445
(38%)
112029
(66%)
57122
(34%)
Overall . 720458
(100%)
265116
(41%)
387318
(59%)
433545
(64%)
245190
(36%)
470289
(66%)
245758
(34%)
Table 2. The volume and proportion of paper- and electronically-ordered (EMR) tests at the six hospitals for
August-September 2008-2011.
Any errors identified in the patient demographics or any non-compliance in laboratory
requirements regarding test order forms and specimens were documented in the CSR
department’s error log. Prior to 21 September 2009 this was a paper-based system using
error-detail entry sheets (see Appendix I) that were manually collated into a daily log (see
Appendix II). The errors were categorised as per the information on the error-detail sheets.
On 21 September 2009, a computerised error log (devised in-house and using a Microsoft
Access database) was implemented and was available on all CSR computers thus
eliminating paper forms and making error logging accessible to staff at their workstations.
Initially, the data entry fields and error categories in the computerised error log were similar
(but not always identical) to the paper-based system. From 1 March 2010, a revised version
of the computerised error log was introduced with the inclusion of a new error category:
“EMR test order problem.” Appendix III shows a screen shot of the computerised error log
screen and the available error category options (including the new “EMR test order
problem” category).

Quality Use of Pathology Program Report
11
Ethics approval
Ethics approval was granted by the South Eastern Sydney Local Health District Human
Research Ethics Committee (HREC; Project No. 11/146), and ratified by the University of
New South Wales HREC (Project No. 11380).

Quality Use of Pathology Program Report
12
SECTION IV: QUALITY AND SAFETY OF THE TEST ORDERING PROCESS
Introduction
Errors in laboratory medicine can occur at any of the many steps that a specimen passes
through, in some cases even before it is processed.23 24
In the wards, errors can occur during
the creation of the test order by the clinician, collection of the specimen by medical, nursing
or laboratory staff and transportation of the specimen to the laboratory. In the laboratory,
errors can occur during sorting and specimen receipt, laboratory accessioning and data
entry. Many of these errors can have an undesirable outcome on patient safety. Electronic
ordering systems are expected to eliminate legibility problems in handwritten orders and to
reduce errors in both the wards and the laboratory and improve the quality of the
information provided to the laboratory, thus increasing efficiency and effectiveness in the
laboratory.25
The pre-analytical phase of the laboratory test process includes all the steps
that occur prior to the actual analysis of the specimen in the laboratory. This phase includes
patient- and processing-related variables, including patient identification, specimen
collection and specimen labelling. The analytical phase relates to the processing of
specimens leading to a validated result, and the post-analytical phase begins when the test
result is obtained and ends when it is received by the ordering clinician.26
Pre-analytical errors generally include problems associated with test orders. Sometimes
clinicians order incorrect tests, inaccurately specify some aspect of the test order, or even
forget to order a test altogether. In addition, test orders sometimes fail to reach the
laboratory, particularly in settings that use paper orders, which can be dropped, misplaced,
or otherwise lost.27
Blood specimens can be unsuitable for testing when, for example, they
are too old or of insufficient quantity for an accurate test result to be returned. Specimens
can also be taken from the wrong patient, or be collected in the wrong tube or container.
Research in this area shows that up to 65% of laboratory errors occur in the pre-analytical
phases of the testing cycle,24 28
often related to issues involving the identification of patients
and the labelling of specimens.29
In 2006, the Royal College of Pathologists of Australasia
Quality Assurance Program Pty. Ltd. (RCPA QAP) launched the Key Incident Monitoring
and Management Systems (KIMMS) to measure and monitor key incident indicators for
pre- and post-analytical areas of laboratory work to help determine the main reasons for
specimen misidentification and rejection.30

Quality Use of Pathology Program Report
13
Study design
This part of the project was conducted at the Central Specimen Reception (CSR) of the
pathology laboratory located at the campus housing Hospitals A, B, and C, where all
specimens and test order forms for those three hospitals are delivered for processing. We
undertook a retrospective audit of the pathology service paper-based error log from January
to June 2009 and of the revised computerised error log that was in operation from 1 March
2010. Data analysis incorporated all errors recorded up to 9 October 2011.
Pre-analytic stage of the laboratory process
At this pathology service, there are two methods by which a pathology test order can be
created. The first uses a handwritten paper test order form on which patient demographic
data (e.g., name and date of birth) the tests, and relevant clinical details are recorded by the
ordering clinician. This test order form must be signed by an authorised clinician before it is
sent to the pathology service with the specimen. The second method of ordering pathology
tests is electronic, via the EMR system. The clinician is required to complete the pathology
order at a computer terminal and then print a hard copy of the test order form which is sent
to the pathology service with the specimen. Specimens may be collected by clinicians
directly, or by laboratory phlebotomists during their regular twice-daily blood collection
rounds through the wards. Printed test order forms from the EMR use an electronic
signature for authorisation. Any subsequent alteration of this printed form, such as the
addition of handwritten information, is considered to be unauthorised. If further tests are
required after the form is printed a new order must be created.
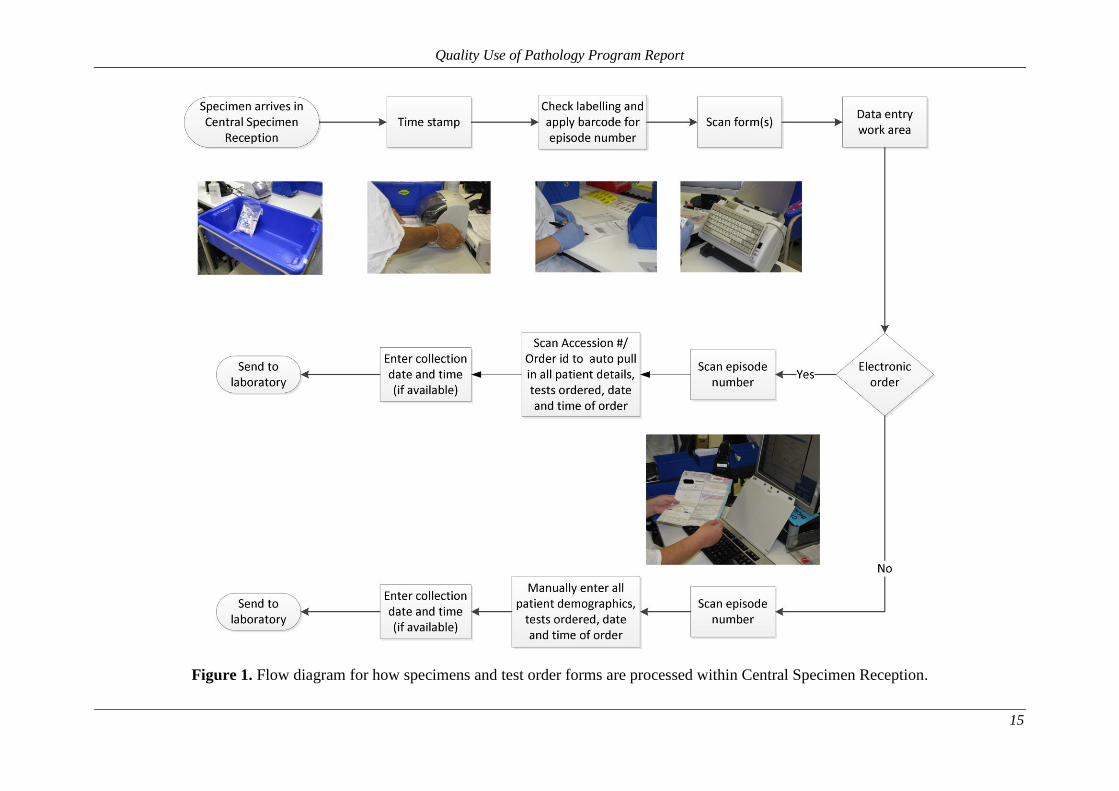
All test order forms and specimens are received in CSR where they are time-stamped by
CSR staff to register the time of receipt. Patient and specimen details are then cross-
checked. Figure 1 provides a schematic diagram of the entire CSR workflow process. A
LIS-linked barcode (associated with a new test order episode within the LIS) is added to the
form, which is then converted into a digital image and archived using an optical scanner.
Test order forms and specimens are then transferred to the CSR data entry work area.
Laboratory order forms for electronic orders contain at least three barcodes: i) a unique
barcode for patient details; ii) unique barcodes for each test (linked to the EMR) and iii) a
test order episode barcode (linked to the LIS). Laboratory order forms for paper orders
contain only the test order episode barcode (linked to the LIS). In the case of electronic
orders, the LIS-linked test order episode and EMR-linked patient detail barcodes are

Quality Use of Pathology Program Report
14
scanned to retrieve those data. A scan of any of the EMR-linked barcodes will provide a
complete list of all the tests ordered in that test order episode. For paper orders, the LIS-
linked test order episode barcode is scanned electronically but the remaining information
(patient details and the list of tests ordered) must be manually typed into the computerised
LIS data entry form. The time-stamp of specimen arrival in the CSR must still be entered
manually into the computerised LIS data entry form, for both electronic and paper test
orders. Once the data entry process is complete, test order forms are sent for archive and the
specimens are delivered to the relevant pathology department for processing and analysis.
Quality Use of Pathology Program Report
15
Figure 1. Flow diagram for how specimens and test order forms are processed within Central Specimen Reception.
Quality Use of Pathology Program Report
16
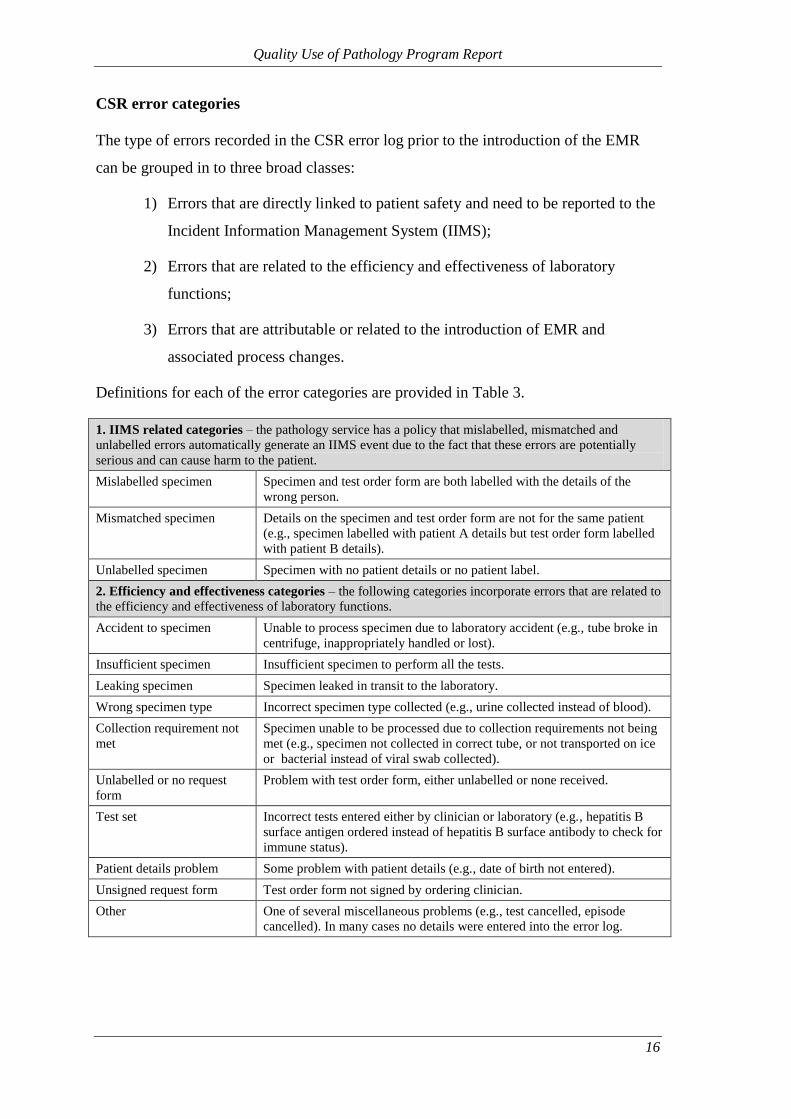
CSR error categories
The type of errors recorded in the CSR error log prior to the introduction of the EMR
can be grouped in to three broad classes:
1) Errors that are directly linked to patient safety and need to be reported to the
Incident Information Management System (IIMS);
2) Errors that are related to the efficiency and effectiveness of laboratory
functions;
3) Errors that are attributable or related to the introduction of EMR and
associated process changes.
Definitions for each of the error categories are provided in Table 3.
1. IIMS related categories – the pathology service has a policy that mislabelled, mismatched and
unlabelled errors automatically generate an IIMS event due to the fact that these errors are potentially
serious and can cause harm to the patient.
Mislabelled specimen Specimen and test order form are both labelled with the details of the
wrong person.
Mismatched specimen Details on the specimen and test order form are not for the same patient
(e.g., specimen labelled with patient A details but test order form labelled
with patient B details).
Unlabelled specimen Specimen with no patient details or no patient label.
2. Efficiency and effectiveness categories – the following categories incorporate errors that are related to
the efficiency and effectiveness of laboratory functions.
Accident to specimen Unable to process specimen due to laboratory accident (e.g., tube broke in
centrifuge, inappropriately handled or lost).
Insufficient specimen Insufficient specimen to perform all the tests.
Leaking specimen Specimen leaked in transit to the laboratory.
Wrong specimen type Incorrect specimen type collected (e.g., urine collected instead of blood).
Collection requirement not
met
Specimen unable to be processed due to collection requirements not being
met (e.g., specimen not collected in correct tube, or not transported on ice
or bacterial instead of viral swab collected).
Unlabelled or no request
form
Problem with test order form, either unlabelled or none received.
Test set Incorrect tests entered either by clinician or laboratory (e.g., hepatitis B
surface antigen ordered instead of hepatitis B surface antibody to check for
immune status).
Patient details problem Some problem with patient details (e.g., date of birth not entered).
Unsigned request form Test order form not signed by ordering clinician.
Other One of several miscellaneous problems (e.g., test cancelled, episode
cancelled). In many cases no details were entered into the error log.

Quality Use of Pathology Program Report
17
3. Errors that are attributable to changed work processes brought on by EMR
EMR test order problem Error that has been attributed to the electronic medical record (e.g.,
electronic test order form had a hand written test appended). Hand written
amendments to electronic orders can occur for a number of reasons:
Clinician forgot to order a test, and instead of entering a new electronic
order, the test order was handwritten on an EMR print-out.
A clinician requested that a test be added to an original order made by
a different clinician.
Patient was discharged making it difficult for the clinician to add a test
to an existing order.
EMR test order problems can also occur when a second or subsequent
electronic order is created for a patient and only one specimen is
collected. If all test order forms are not sent to the pathology service
with the specimen then the pathology service is required to locate the
remaining form(s) (since all test order forms must be accounted for).
EMR test order problems were sometimes logged for paper orders
when the EMR was down or not available.
No specimen received Test order form received with no specimen.
Table 3 Definitions of error categories in the CSR error log.
Data collection and analysis
Data from the paper-based CSR error log were collected for a six-month period prior to
the introduction of the computerised CSR error log (January to June 2009) and were
compared longitudinally with matching periods after the implementation of electronic
ordering (January to June 2010 and 2011; using data from the computerised error log).
The cross-sectional analysis of the computerised error log covered the period from 1
March 2010 (the date that “EMR test order problem” became available as an error
category) until 9 October 2011 (the last date before data extraction was performed).
Scanned images of test order forms were also available for confirmation of error details.
An experienced member of the research team (a laboratory manager/researcher) audited
and analysed the error log categories in consultation with senior staff in the pathology
service. Over an eight month period (August 2011 to March 2012), 20 meetings were
held with CSR staff (supervisor, assistant supervisor and data entry staff) to generate a
process map of the workflow process, and to investigate the differences between
processes used for paper and electronic test order forms in the processing of errors.
Regular iterative feedback sessions were held with senior staff to confirm the validity of
the findings.
Quality Use of Pathology Program Report
18
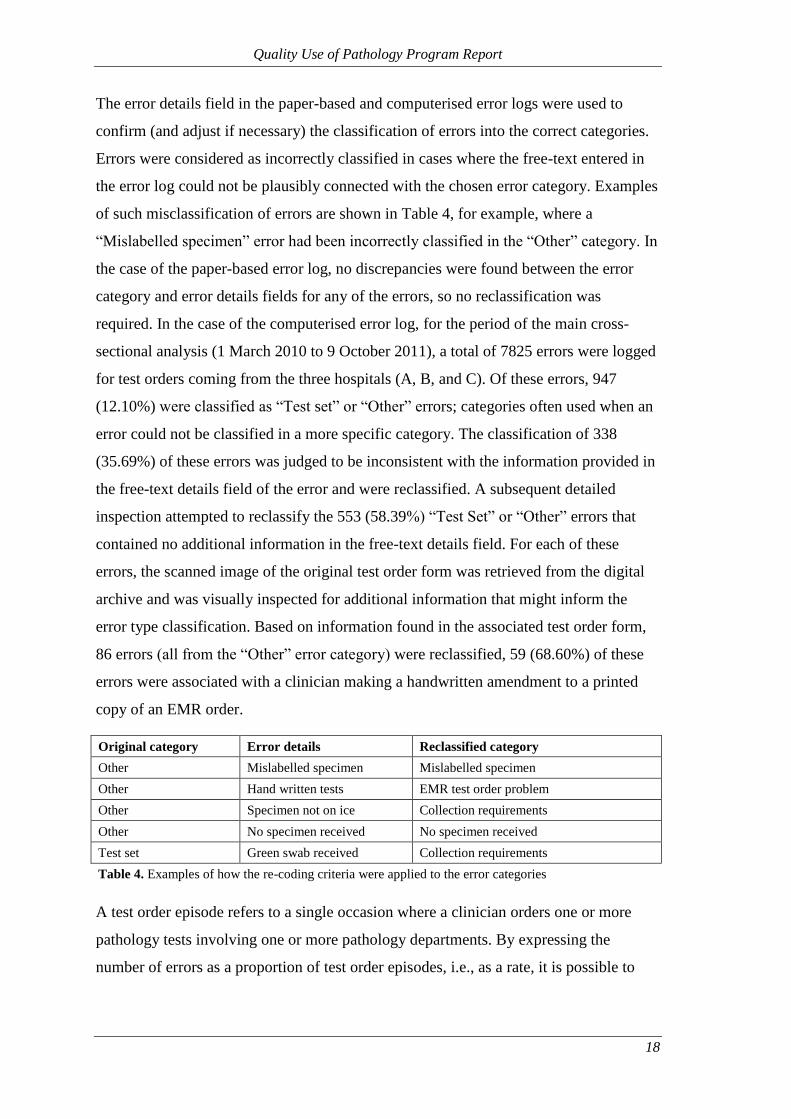
The error details field in the paper-based and computerised error logs were used to
confirm (and adjust if necessary) the classification of errors into the correct categories.
Errors were considered as incorrectly classified in cases where the free-text entered in
the error log could not be plausibly connected with the chosen error category. Examples
of such misclassification of errors are shown in Table 4, for example, where a
“Mislabelled specimen” error had been incorrectly classified in the “Other” category. In
the case of the paper-based error log, no discrepancies were found between the error
category and error details fields for any of the errors, so no reclassification was
required. In the case of the computerised error log, for the period of the main cross-
sectional analysis (1 March 2010 to 9 October 2011), a total of 7825 errors were logged
for test orders coming from the three hospitals (A, B, and C). Of these errors, 947
(12.10%) were classified as “Test set” or “Other” errors; categories often used when an
error could not be classified in a more specific category. The classification of 338
(35.69%) of these errors was judged to be inconsistent with the information provided in
the free-text details field of the error and were reclassified. A subsequent detailed
inspection attempted to reclassify the 553 (58.39%) “Test Set” or “Other” errors that
contained no additional information in the free-text details field. For each of these
errors, the scanned image of the original test order form was retrieved from the digital
archive and was visually inspected for additional information that might inform the
error type classification. Based on information found in the associated test order form,
86 errors (all from the “Other” error category) were reclassified, 59 (68.60%) of these
errors were associated with a clinician making a handwritten amendment to a printed
copy of an EMR order.
Original category Error details Reclassified category
Other Mislabelled specimen Mislabelled specimen
Other Hand written tests EMR test order problem
Other Specimen not on ice Collection requirements
Other No specimen received No specimen received
Test set Green swab received Collection requirements
Table 4. Examples of how the re-coding criteria were applied to the error categories
A test order episode refers to a single occasion where a clinician orders one or more
pathology tests involving one or more pathology departments. By expressing the
number of errors as a proportion of test order episodes, i.e., as a rate, it is possible to
Quality Use of Pathology Program Report
19
control for the volume of test orders being processed at any particular time or by a
particular system (i.e., paper vs. electronic orders).
Frequency of test order errors
The volume and rates of errors for each of the three periods January to June of 2009,
2010 and 2011 is presented in Table 5. The 2009 period covers the period prior to the
introduction of EMR. The total number of errors increased from 1772 in 2009 to 2282
and 2452 in 2010 and 2011 respectively. When measured as a rate per 1000 test order
episodes, this resulted in rates of 9.66, 12.67 and 13.48, for 2009 to 2011 respectively.
The error rate in 2010 was approximately 30% higher than it was in 2009. The vast
majority of this increase in errors reported was accounted for by errors classified as
“EMR test order problem” (n=280) and “No specimen received” (increase of 197). It is
also possible that some of the errors recorded as “Other” (increase of 55) and “Test set”
(increase of 15) contributed to this increase in error rate between 2009 and 2010. Thus
the increase in errors across time is largely due to a new category of errors associated
with the electronic ordering process.

Quality Use of Pathology Program Report
20
Error Rate per 1000 Test Order Episodes (Number of Errors)
Error Type 2009 2010 2011
IIM
S r
ela
ted
cate
go
ries
Mislabelled specimen 0.32 (58) 0.14 (25) 0.20 (37)
Mismatched specimen 0.36 (66) 0.64 (116) 0.78 (142)
Unlabelled specimen 1.75 (321) 1.35 (243) 1.64 (298)
Eff
icie
ncy
an
d e
ffec
tiv
enes
s
cate
go
ries
Accident to specimen 0.13 (24) 0.11 (20) 0.14 (26)
Insufficient specimen 0.23 (43) 0.19 (34) 0.24 (44)
Leaking specimen 0.20 (36) 0.17 (30) 0.23 (41)
Collection requirements not met 1.19 (219) 1.23 (221) 1.58 (287)
Unlabelled or no request form 0.03 (5) 0.36 (65) 0.27 (49)
Patient details problem 0.08 (14) 0.08 (15) 0.17 (31)
Unsigned request form 0.12 (22) 0.01 (2) 0 (0)
Test set 0.72 (133) 0.82 (148) 0.53 (97)
Other 0.09 (17) 0.4 (72) 0.67 (122)
Err
ors
th
at
are
att
rib
uta
ble
to
ch
an
ged
wo
rk p
roce
sses
bro
ug
ht
on
by
EM
R
EMR test order problem n/a 1.56 (280) 1.45 (263)
No specimen received 4.44 (814) 5.61 (1011) 5.58 (1015)
Total
Errors
9.66 (1772) 12.67 (2282) 13.48 (2452)
Total Test Order Episodes 183495 180059 181892
Table 5. Comparison of the rates and frequencies with which each type of error was recorded,
collapsed across Hospitals A, B, and C, before the implementation of EMR (Jan-Jun 2009) and
after the implementation of EMR (Jan-Jun 2010 and Jan-Jun 2011).
A detailed breakdown of the types of errors recorded as “EMR test order problem” is
shown in Table 6. It shows that, across all three hospitals, 66.72% of errors were related
to an order erroneously handwritten onto an EMR test order form print-out. This type of
error generally occurred when the ordering clinician sought to amend an existing
electronic order by altering the print-out of the order rather than creating a new order
within the EMR. That is, in these instances, the ordering clinician treated the print-out
of the order as though it was itself the order, rather than as a token representing the

Quality Use of Pathology Program Report
21
EMR order. (See Appendix IV for an example of a print-out of an electronic order that
was manually altered, classified as a “Handwritten request on an EMR order” error). A
further 26.48% had no information and could not be further categorised; and 6.80%
reported a variety of reasons related to EMR order number problems, duplicate forms
and wrong types of EMR order. Further analysis of the CSR error log revealed that 418
(61.83%) “EMR test order problem” errors required laboratory staff to contact the
clinician or ward to request corrective action for the problem (to get a new order form
from the clinician/ward, or to get a signed test order form from the clinician/ward).
Hospital
Error details A B C Total
Handwritten request on an EMR order 65.24%
(n=274)
64.47%
(n=49)
71.11%
(n=128)
66.72%
(n=451)
Order number problem (number filed, used, invalid or
discontinued)
3.10%
(n=13)
5.26%
(n=4)
2.22%
(n=4)
3.11%
(n=21)
Multiple forms (2 forms, 3 forms) / Duplicate Forms 1.90%
(n=8)
0%
(n=0)
0%
(n=0)
1.18%
(n=8)
EMR order incorrect (swab instead of fluid, urine
received for swab, etc)
2.86%
(n=12)
2.63%
(n=2)
0.56%
(n=1)
2.22%
(n=15)
Change of tests 0.23%
(n=1)
0%
(n=0)
0%
(n=0)
0.15%
(n=1)
Add-on test 0.23%
(n=1)
0%
(n=0)
0%
(n=0)
0.15%
(n=1)
No information provided 26.43%
(n=111)
27.63%
(n=21)
26.11%
(n=47)
26.48%
(n=179)
Total 420 76 180 676
Table 6. The types of errors described in the error details free text for errors classified as “EMR
test order problem” for electronic test orders only, and the frequency and rate at which they were
recorded (01/03/2010 – 09/10/2011).
Errors of the “EMR test order problem” category have repercussions for CSR
workflow. This begins with the need for CSR to complete an entry into the
computerised error log that is then followed up by a designated laboratory error
“trouble-shooter” who contacts the ordering clinician for corrective action (see
Appendix VI). This results in delays to the pathology testing process. Table 7 compares
the median data entry time between test order episodes that had an “EMR test order
problem” error and median data entry time for all test order episodes (test order
episodes with, and without, and errors logged). The median data entry time was three
minutes (60%) longer when an “EMR test order problem” error was logged compared
to the median data entry time of all test order episodes. A large part of this time delay

Quality Use of Pathology Program Report
22
was accounted for by additional time required for data entry staff in the CSR to make an
entry in the computerised error log. When taking into consideration the amount of time
required for the “trouble-shooter” to contact the clinician or ward and for the latter to
take corrective action, as shown in the Total Laboratory TAT section of Table 7, the
median TAT was three hours (181 minutes; 220%) longer when a “EMR test order
problem” occurred than for all test order episodes.
EMR test order
problem
All Test Order
Episodes
Median Data Entry time (mins) 8 5
Z=7.65, p<.001
Median Total Lab TAT (mins) 263 82.14
Z=8.91, p<.001
Total Episode Count (n=) 174 124119
Wilcoxon signed-rank tests of significance
Table 7. Comparison of median TATs for test order episodes that resulted in
an “EMR test order problem” tests and the median TAT for all test order
episodes.
Our cross-sectional analysis compared the volume and nature of errors for paper and
EMR orders. Table 8 details the volume and rates of errors for electronic orders and
paper orders across the hospitals for the period 1 March 2010 to 9 October 2011. The
table shows that EMR uptake, during the analysis period, for each of the hospitals was
68.92% at Hospital A, 32.28% at Hospital B, and 58.46% at Hospital C. When
considering the overall error rates across all hospitals, the rate of errors per 1000 test
order episodes for the three IIMS-related problems was consistently lower for EMR
orders than for paper orders: 0.10 vs. 0.31 for “Mislabelled specimen” errors, 0.49 vs.
1.42 for “Mismatched specimen” errors, and 1.37 vs. 1.65 for “Unlabelled specimen”
errors. Chi-square (χ2) tests of independence, shown in Table 8, revealed that these
differences in rates were all significant (p<.001, p<.001, p<.01, respectively).

Quality Use of Pathology Program Report
23
Error Rate per 1000 Test Order Episodes
(Number of Errors)
Hospital
A B C Overall
EMR Paper EMR Paper EMR Paper EMR Paper
EMR Uptake
Rate (01/03/2010
– 09/10/2011)
68.92% 32.28% 58.46% 62.34%
Error Category IIMS related categories
Mislabelled
specimen
0.08
(23)
0.52
(41)
0.07
(3)
0.13
(8)
0.16
(13)
0.17
(7)
0.10
(39)
0.31
(56)
χ2=36.51, p<.001
Mismatched
specimen
0.44
(126)
2.18
(172)
0.46
(19)
0.73
(44)
0.70
(55)
0.97
(39)
0.49
(200)
1.42
(255)
χ2=141.18, p<.001
Unlabelled
specimen
1.12
(324)
2.31
(182)
1.34
(55)
0.80
(48)
2.28
(180)
1.65
(66)
1.37
(559)
1.65
(296)
χ2=7.16, p<.01
Efficiency and effectiveness categories
Collection
requirements not
met
1.03
(298)
1.70
(134)
1.37
(56)
0.53
(32)
2.63
(208)
2.15
(86)
1.37
(562)
1.41
(252)
Unlabelled or no
request form
0.16
(47)
0.47
(37)
0.24
(10)
0.30
(18)
0.28
(22)
0.32
(13)
0.19
(79)
0.38
(68)
Patient details
problem
0.05
(15)
0.28
(22)
0.42
(17)
0.33
(20)
0.10
(8)
0.15
(6)
0.10
(40)
0.27
(48)
Test set 0.45
(129)
1.03
(81)
0.54
(22)
0.40
(24)
0.96
(76)
0.75
(30)
0.55
(227)
0.75
(135)
Unsigned
request form
0.00
(1)
0.01
(1)
0.00
(0)
0.03
(2)
0.00
(0)
0.07
(3)
0.07
(1)
0.07
(6)
Other 0.21
(60)
0.46
(36)
0.34
(14)
0.30
(18)
0.44
(35)
0.70
(28)
0.27
(109)
0.46
(82)
Accident to
specimen
0.09
(26)
0.10
(8)
0.29
(12)
0.12
(7)
0.30
(24)
0.15
(6)
0.15
(62)
0.12
(21)
Insufficient
specimen
0.08
(22)
0.05
(4)
0.15
(6)
0.05
(3)
0.66
(52)
0.45
(18)
0.20
(80)
0.14
(25)
Leaking
specimen
0.06
(18)
0.18
(14)
0.56
(23)
0.08
(5)
0.67
(53)
0.12
(5)
0.23
(94)
0.13
(24)
Errors attributable to EMR work processes
EMR test order
problem
1.45
(420)
1.44
(113)
1.86
(76)
0.35
(21)
2.28
(180)
0.90
(36)
1.65
(676)
0.95
(170)
No specimen
received
7.05
(2040)
3.78
(298)
3.76
(154)
1.48
(89)
10.01
(791)
2.92
(117)
7.29
(2985)
2.82
(504)
Total Errors 12.27
(3549)
14.52
(1143)
11.40
(467)
5.63
(339)
21.47
(1697)
11.48
(460)
13.96
(5713)
10.85
(1942)
Table 8. Comparison of the rates and frequencies with which each type of error was recorded at
Hospitals A, B, and C. (01/03/2010 – 09/10/2011.)

Quality Use of Pathology Program Report
24
SECTION V: EFFECTIVENESS OF THE TEST ORDERING PROCESS
The effectiveness of a pathology laboratory service refers to the quality of the service
provided to clinicians, hospitals and, ultimately, to patients.20 31
Whilst the effectiveness
of the pathology service is affected by the complex array of systems and processes
within the service, it is also influenced by external factors often outside the control of
the pathology service. For example, how information, such as orders, is communicated
between the computer system in the ward and the computer system in the pathology
service; and what clinical contextual information is provided to assist the pathology
service in processing the test order and providing an appropriate interpretation. The
effectiveness of the pathology service also depends on what they are required to do,
such as the volume of tests being ordered; the types of tests being ordered and whether
they are suitable for the patient condition,32
whether repeat tests are ordered at
appropriate times, whether they can inform diagnosis and treatment; and the proper
utilisation of add-on testing, which can have a disproportionate effect on pathology
service workload.33-35
New ICT systems have the potential to provide decision support
to assist clinicians in making appropriate decisions and thereby improve the
effectiveness of patient care.36 37
One example of this is the ability of the EMR to alert
the ordering clinician to a duplicate order (see Appendix V).
Methods
Data Extraction
The initial LIS data extraction generated a dataset containing information relating to all
pathology tests conducted on specimens received by the pathology service departments
in the period January 2008 and September 2011. Our analyses were conducted only on
pathology tests that were ordered by the six study hospitals. The analysis was focused
by further limiting the dataset to pathology tests conducted on specimens received
during August and September for each year: 2008, 2009, 2010, and 2011. This reduced
dataset contained information relating to 3,227,101 pathology tests. Within the dataset,
429,068 (13.3%) records were found to be duplicate entries (where the values in every
field were identical). Once duplicate records were removed, the dataset contained
information for 2,798,033 tests. A further 30,359 records were removed because they
related to laboratory workflow rather than identifying an actual test order. This left
2,767,674 pathology test records associated with 130,060 patient records (who may
have had multiple admissions in hospital). This dataset formed the basis for the

Quality Use of Pathology Program Report
25
subsequent analysis of test volume and turnaround times. Another adjustment was made
to these data to account for a small proportion of tests whose turnaround time was
recorded with a value less than zero minutes (for data entry time, 10,474 such records
were found; for Total Laboratory TAT, 890 such records were found). These records
were flagged and did not contribute to analyses of TATs, but were included in other
analyses.
In order to assess the volume of test ordering per patient encounter (from patient
admission to the hospital until their discharge) it was necessary to extract patient
encounter data from the Patient Administration System (PAS) and Emergency
Department Information System (EDIS) of the hospitals. These patient encounter data
covered the period between 1 August and 30 September of 2008, 2009, 2010, and 2011.
A number of steps were taken to ensure the integrity and consistency of these patient
encounter datasets before they were linked to the test order dataset. The final linkage
occurred between records for 147,280 patient admissions (extracted from the PAS), and
records for 176,015 ED presentations (extracted from the EDIS), with the records for
2,767,674 pathology test orders (extracted from the LIS).
Data Linkage
All data integrity and validity checks, and linkage were performed in IBM SPSS
Statistics 20.0.0. The datasets extracted from the PAS and EDIS were comma-separated
values (CSV) format; the in-built SPSS data opening functions were used to import the
data.
The patient admission dataset from the PAS and the ED presentation dataset from the
EDIS were merged with the Test Order dataset from the LIS and the entire merged
dataset was sorted by patient, patient admission dates and times, and specimen
collection dates and times. Test orders where the specimen was collected after the
patient admission and before the patient discharge, for matching patients, could be
confidently attributed to those patient encounters. Data linkage between the three
datasets allowed a single test order to be linked with either the PAS or EDIS dataset, or
both datasets simultaneously. The SPSS “LAG” function was used to compare the
patient, patient admission dates/times, and specimen collection dates/times of the sorted
merged datasets and to associate, where valid and appropriate data were found, patient
admission, discharge, and demographic information with the relevant test order data. In

Quality Use of Pathology Program Report
26
cases where specimen collection for a test order occurred either before patient
admission, after patient discharge, or where no patient encounter data could be found,
no linkage was performed. Therefore, these test orders were excluded from all analyses
where linked data were necessary (e.g., comparisons of test rates per patient admission
and DRG casemix). Once the linkable patient presentation and admission data from the
EDIS and PAS datasets were merged, the merged dataset was cleaned to remove orphan
patient admission information (presentations and admissions for which no associated
pathology tests were found).
Data Analysis
Data analyses were conducted using IBM SPSS Statistics 20.0.0 and Microsoft Excel
2007. A number of different statistical tests were used for tests of significance. These
depended on the nature of the data being analysed, and the research question being
addressed. At various points of this report, analyses used independent-sample t-tests,
chi-square (χ2) tests of independence, Mann-Whitney U tests, and Wilcoxon signed-
rank tests. In all cases, the alpha-value for significance was set at p < .05.

Quality Use of Pathology Program Report
27
Test volume
The volume of pathology tests ordered by clinicians varied greatly between hospitals.
These differences are not necessarily driven by factors associated with patient acuity or
by the type of medical service.32
Table 9 compares the mean number of tests ordered for
each test order episode for each year from 2008 to 2011 when EMR was introduced at
each of the hospitals. It shows that the overall mean rates of tests per test ordering
episode were uniformly and consistently lower across all six study hospitals in 2011
(after the introduction of EMR) than in 2008, independent sample t-tests found the
difference significant in all hospitals.
Year
Hospital 2008 2009 2010 2011 Mean Difference: 2008 - 2011
A 4.68 4.20 4.51 4.62 0.06
t(77447.1)=2.37, p<.05
B 3.16 3.03 3.07 3.09 0.07
t(20585.3)=2.08, p<.05
C 4.42 3.91 4.19 4.15 0.27
t(24647.7)=2.95, p<.001
D 4.70 4.14 3.98 4.35 0.36
t(20726.1)=7.62, p<.001
E 4.65 4.17 4.33 4.49 0.16
t(100742.4)=7.26, p<.001
F 5.04 4.32 4.38 4.32 0.72
t(70372.9)=26.39, p<.001
Overall 4.63 4.11 4.27 4.36 0.27
t(317634.6)=21.72, p<.001
Independent sample t-tests
Table 9. A comparison, between years, of the mean number of tests ordered in each test order episode at
the six study hospitals. Numbers in normal text are pre-EMR implementation; numbers in bold are post-
EMR implementation; numbers in italics are overall rates.
A comparison of the mean number of tests per admission and mean length of stay
between the six study hospitals and across the four years is shown in Table 10. A
comparison of the mean number of tests per admission, at each hospital, for the periods
before and after the availability of electronic ordering, reveals an inconsistent pattern of
results. Hospitals A and E showed an increase in the number of tests per patient
admission, whereas Hospitals C and D showed a reduction in the mean tests per patient
admission. Lastly, the rate at Hospitals B and F was similar in 2011 to what it was in
2008. The mean length of stay was, however, shorter at all hospitals in 2011 compared
to 2008.

Quality Use of Pathology Program Report
28
Mean Number of Tests Per Admission
(Number of Tests/Number of Admissions)
Mean Length of Stay (hours)
Hospital 2008 2009 2010 2011
A
19.91
(75172/3776)
181
19.51
(70036/3589)
191
19.57
(71714/3665)
189
20.15
(76795/3812)
163
B
7.22
(8560/1185)
128
7.98
(9068/1137)
131
7.37
(7938/1077)
118
7.35
(8053/1096)
115
C
16.26
(21851/1344)
110
18.29
(24121/1319)
117
15.80
(22568/1428)
98
14.97
(21511/1437)
95
D
13.53
(24172/1787)
101
13.19
(24037/1822)
88
13.17
(24160/1835)
90
12.61
(26262/2083)
86
E
19.17
(98553/5141)
146
20.76
(102565/4941)
141
20.77
(108502/5224)
138
22.41
(119276/5322)
143
F
17.35
(75958/4377)
134
18.34
(72151/3935)
156
15.81
(78686/4977)
122
17.28
(84370/4882)
130
Table 10. A comparison, between years, of the mean number of pathology tests ordered in each patient
admission, at each of the six study hospitals. Numbers in normal text are pre-EMR implementation;
numbers in bold are post-EMR implementation.
Diagnosis-related Groups (DRG)
Assessing test types and volume by matched diagnosis-related groups (DRGs) allows
analyses to control for the variability of test ordering between different categories as a
means of examining patterns and variations of pathology ordering.4 38
A comparison of
the mean number of tests per admission and mean length of stay, between the four
years, for the top-10 DRGs based on pathology utilisation, is shown in Table 11. When
comparing the period before electronic ordering was available (2008) with the period
after it was available and well-established (2011), the pattern of results was
inconsistent. Some DRGs showed an increase in the number of tests per patient
admission, for example G02A (Major bowel procedure) showed a considerable increase
from a mean of 76.11 to 91.88 tests per patient admission, whereas other DRGs (e.g.,
A06B [Tracheostomy]) showed a reduction in the mean tests per patient admission.
Similarly, mean length of stay was reduced over time for DRGs such as E65B (Chronic
Obstructive Airways Disease) but increased for F62B (Heart Failure & Shock).
Conversely, the consistency in test volumes and length of stay for L61Z
(Haemodialysis) is what would be expected for this category.

Quality Use of Pathology Program Report
29
Mean Number of Tests Per Admission
(Number of Tests/Number of Admissions)
Mean Length of Stay (hours)
DRG 2008 2009 2010 2011
A06B
Tracheostomy
w/ ventilation
>95hrs + and -
181.10
(10866/60)
646
179.31
(10400/58)
886
159.77
(11823/74)
636
156.77
(12071/77)
696
Z60A Rehabilitation
+
72.86
(7140/98)
1205
74.49
(8045/108)
1070
83.99
(7475/89)
1350
91.16
(10392/114)
1160
L61Z Haemodialysis
5.26
(8720/1657)
7
4.86
(5413/1113)
7
4.90
(6087/1242)
7
5.27
(5481/1041)
7
E62A Respiratory
infections +
40.60
(5359/132)
305
36.51
(3395/93)
225
37.94
(3870/102)
244
42.81
(5308/124)
289
F74Z Chest pain
8.67
(3973/458)
27
9.52
(3978/418)
33
9.08
(4810/530)
29
8.87
(4888/551)
25
A06A
Tracheostomy
w/ ventilation
>95hrs + only
301.05
(6021/20)
2026
296.82
(3265/11)
2437
224.68
(4269/19)
956
250.75
(3009/12)
1150
F62B Heart failure
& shock –
19.26
(4294/223)
123
21.08
(3141/149)
120
22.23
(4423/199)
134
21.75
(4612/212)
128
E65B
Chronic
Obstructive
Airways
Disease -
16.32
(4602/282)
135
17.88
(3630/203)
132
16.02
(3829/239)
128
17.63
(4319/245)
118
G02A Major bowel
procedure +
76.11
(2740/36)
471
84.69
(4319/51)
502
71.17
(3274/46)
483
91.88
(5513/60)
445
G67B
Oesophagitis &
Gastroenteritis
+
9.98
(3382/339)
47
10.11
(3436/340)
44
9.80
(3792/387)
43
9.87
(3059/310)
39
Overall (Top-10 DRGs)
17.28
(57097/3305)
109
19.27
(49022/2544)
126
18.33
(53652/2927)
113
21.36
(58652/2746)
128
DRG code with +: “with catastrophic complications”
DRG code with -: “without catastrophic complications”
Table 11. A comparison, between years, of the mean number of pathology tests ordered in each patient
admission, for each of the ten DRG admission codes associated with the highest pathology utilisation.
A more detailed analysis of pathology testing using DRGs comparing test volume,
proportions, and rank (in parentheses) of the highest-utilisation pathology tests (all tests
accounting for at least the 90th
percentile of test volume for each hospital for each year),
for patients within the ED who were admitted to a hospital ward with the DRG of F74Z
(Chest pain) is presented in Table 12. The highest ranked groups of tests (Troponin,
EUC [electrolytes, urea, and creatinine], Automated Differential and Liver Function

Quality Use of Pathology Program Report
30
Tests) were consistently selected and ranked as the four most frequently ordered tests at
all the hospitals, for both pre-EMR and post-EMR periods. The mean number of
C-Reactive protein tests per ED presentation varied both between hospitals and between
years. At three of the EDs the mean number of C-Reactive protein tests per ED
presentation was higher in 2011 than in 2008 (Hospital ED “A”: from a mean of 0.02
C-Reactive protein tests per ED presentation, in 2008, to a mean of 0.08 tests per
presentation; Hospital ED “D”: from a mean of 0.24 tests to 0.31 tests; and Hospital ED
“F”: from a mean of 0.13 tests to 0.21 tests), while the opposite was true for the ED at
Hospital ED “E” (from a mean of 0.11 tests to 0.06 tests).
Number of Tests
(Mean Number of Tests per ED Presentation)
% of tests
(rank)
Hospital ED A D E F
Test 2008 2011 2008 2011 2008 2011 2008 2011
N of Patients
(N of ED
presentations)
108
(111)
133
(134)
33
(34)
87
(91)
140
(143)
133
(134)
159
(158)
179
(183)
TROPONIN
133
(1.20)
21.25%
(1)
186
(1.39)
23.72%
(1)
52
(1.53)
22.22%
(1)
145
(1.59)
22.52%
(1)
174
(1.22)
19.62%
(1)
177
(1.32)
22.61%
(1)
219
(1.39)
20.20%
(1)
266
(1.45)
21.11%
(1)
EUC
117
(1.05)
18.69%
(2)
136
(1.01)
17.35%
(2)
33
(0.97)
14.10%
(2)
91
(1.00)
14.13%
(2)
150
(1.05)
16.91%
(2)
137
(1.02)
17.50%
(2)
165
(1.04)
15.22%
(2)
184
(1.01)
14.60%
(2)
AUTOMATED
DIFF
114
(1.03)
18.21%
(3)
134
(1.00)
17.09%
(3)
33
(0.97)
14.10%
(2)
90
(0.99)
13.98%
(3)
145
(1.01)
16.35%
(3)
133
(0.99)
16.99%
(3)
160
(1.01)
14.76%
(3)
180
(0.98)
14.29%
(3)
LFT
60
(0.54)
9.58%
(4)
71
(0.53)
9.06%
(4)
22
(0.65)
9.40%
(4)
62
(0.68)
9.63%
(4)
126
(0.88)
14.21%
(4)
89
(0.66)
11.37%
(4)
79
(0.50)
7.29%
(5)
117
(0.64)
9.29%
(4)
PT/INR/APTT
19
(0.17)
3.04%
(7)
35
(0.26)
4.46%
(6)
21
(0.62)
8.97%
(5)
50
(0.55)
7.76%
(6)
62
(0.43)
6.99%
(5)
65
(0.49)
8.30%
(5)
99
(0.63)
9.13%
(4)
101
(0.55)
8.02%
(5)
CA MG PHOS
8
(0.07)
1.28%
*(11)
44
(0.33)
5.61%
(5)
16
(0.47)
6.84%
(6)
59
(0.65)
9.16%
(5)
21
(0.15)
2.37%
(9)
50
(0.37)
6.39%
(6)
75
(0.47)
6.92%
(6)
91
(0.50)
7.22%
(7)
GLUCOSE
47
(0.42)
7.51%
(5)
33
(0.25)
4.21%
(7)
14
(0.41)
5.98%
(7)
44
(0.48)
6.83%
(7)
58
(0.41)
6.54%
(6)
12
(0.09)
1.53%
(10)
37
(0.23)
3.41%
(8)
96
(0.52)
7.62%
(6)

Quality Use of Pathology Program Report
31
Number of Tests
(Mean Number of Tests per ED Presentation)
% of tests
(rank)
Hospital ED A D E F
Test 2008 2011 2008 2011 2008 2011 2008 2011
D-DIMER LIA
16
(0.14)
2.56%
(9)
22
(0.16)
2.81%
(9)
6
(0.18)
2.56%
*(9)
14
(0.15)
2.17%
(10)
27
(0.19)
3.04%
(7)
14
(0.10)
1.79%
*(9)
38
(0.24)
3.51%
(7)
35
(0.19)
2.78%
*(10)
LIPASE
26
(0.23)
4.15%
(6)
13
(0.10)
1.66%
(11)
6
(0.18)
2.56%
(9)
20
(0.22)
3.11%
*(9)
8
(0.06)
0.90%
(14)
24
(0.18)
3.07%
(7)
34
(0.22)
3.14%
(9)
41
(0.22)
3.25%
(8)
C-REACTIVE
PROTEIN
2
(0.02)
0.32%
(19)
11
(0.08)
1.40%
(12)
8
(0.24)
3.42%
(8)
28
(0.31)
4.35%
(8)
16
(0.11)
1.80%
*(10)
8
(0.06)
1.02%
(11)
20
(0.13)
1.85%
(11)
39
(0.21)
3.10%
(9)
BLOOD GAS
19
(0.17)
3.04%
(7)
31
(0.23)
3.95%
(8)
1
(0.01)
0.16%
(17)
8
(0.06)
0.90%
(14)
20
(0.15)
2.55%
(8)
13
(0.08)
1.20%
(12)
15
(0.08)
1.19%
(12)
TSH
3
(0.03)
0.48%
(16)
3
(0.02)
0.38%
(17)
6
(0.18)
2.56%
(9)
12
(0.13)
1.86%
(11)
5
(0.03)
0.56%
(16)
8
(0.06)
1.02%
(11)
21
(0.13)
1.94%
(10)
17
(0.09)
1.35%
(11)
URINE MICRO
5
(0.05)
0.80%
(14)
17
(0.13)
2.17%
*(10)
3
(0.09)
1.28%
(14)
4
(0.04)
0.62%
(13)
10
(0.07)
1.13%
(13)
5
(0.04)
0.64%
(14)
6
(0.04)
0.55%
(17)
15
(0.08)
1.19%
(12)
AMYLASE
1
(0.01)
0.16%
(25)
2
(0.01)
0.26%
(21)
4
(0.12)
1.71%
(13)
7
(0.08)
1.09%
(12)
25
(0.17)
2.82%
(8)
8
(0.06)
1.02%
(11)
8
(0.05)
0.74%
(15)
4
(0.02)
0.32%
(15)
CK
8
(0.07)
1.28%
(11)
1
(0.01)
0.13%
(25)
5
(0.15)
2.14%
(12)
1
(0.01)
0.16%
(17)
3
(0.02)
0.34%
(17)
1
(0.01)
0.13%
(21)
13
(0.08)
1.20%
(12)
4
(0.02)
0.32%
(15)
PT/INR
11
(0.10)
1.76%
(10)
16
(0.11)
1.80%
(10)
1
(0.01)
0.13%
(21)
CKMB
10
(0.06)
0.92%
*(14)
1
(0.01)
0.08%
(26)
* indicates the lowest ranked test, for each hospital for each year, that must be included for a minimum
of the 90th
percentile of tests based on test utilisation.
Table 12. A comparison, between 2008 and 2011 at the ED of four hospitals, of the tests (number, rate
per presentation, proportion, and rank) ordered for patients within the ED who were eventually admitted
to a ward with a DRG of F74Z (Chest pain). (Note: Very low volume tests are not shown.)

Quality Use of Pathology Program Report
32
Add-on testing
Add-on tests are tests that are performed on an existing specimen previously submitted
to the pathology service with an earlier test order. The reasons for ordering an add-on
test are many including situations when a clinician requires a base-line result in cases
where treatment has already commenced, when the clinician neglected to order all
prescribed tests, or even situations when a clinician wants to avoid subjecting
vulnerable patients or children to additional phlebotomies. Add-on tests are labour-
intensive and disruptive for the laboratory and place a disproportionate burden on
laboratory resources.18 33-35 39
Interruptions to the routine work flow, interruption of
clinical staff and delayed testing of the specimen are part of the impact of add-on
testing. Measuring the number of add-on tests allows the laboratory to identify any
major problem areas.33-35
Procedures to reliably identify add-on tests were not implemented until 2011 and,
therefore, it was not possible to compare the add-on test rate for the period before
electronic ordering became available. The results reported in Table 13 contrast add-on
test rates for different hospitals and pathology departments. They show a variation
between hospitals of between a minimum of 0.61% (Hospital B; specialist hospital) and
maximum 2.24% (Hospital F; metropolitan general hospital). There were considerable
differences in the rate at which add-on tests were ordered in the different departments.
The departments with the highest proportion of add-ons were Serology, Immunology
and Endocrinology (7.78% 7.22% and 6.33% respectively). The add-on test rates in the
clinical chemistry and haematology departments, that combined accounted for 70% of
the add-on test volume, were 2.56% and 0.69%, respectively.

Quality Use of Pathology Program Report
33
Proportion of Tests Accounted for by Add-on Tests
(Number of Add-on Tests/Number of all Tests)
Hospital Department
Andrology/Seminology
0%
(0/797)
Bone Marrow
0%
(0/237)
Clinical chemistry
2.56%
(8300/324178)
Cytology
0%
(0/3095)
Endocrinology
6.33%
(1358/21455)
Genetics
0.29%
(7/2396)
Haematology
0.69%
(1527/222374)
A 2.04%
(3654/178819) Histopathology
0.05%
(1/1868)
B 0.61%
(189/31130) Immunology
7.22%
(1199/16613)
C 1.29%
(632/49168) Microbiology
0.10%
(98/97904)
D 2.22%
(1103/49615) Non-gynae cytology
0.65%
(9/1381)
E 1.92%
(4569/238164) Serology
7.78%
(1300/16700)
F 2.24%
(3796/169151) Virology
2.04%
(144/7049)
Overall 1.95%
(13943/716047)
Table 13. The proportion of pathology tests accounted for by add-on tests,
the add-on test volume, and the total test volume, at each of the six study
hospitals (left-side) and each of the ten departments within the pathology
service (right-side) for the two-month period of August-September 2011.
Repeat testing
Assessing the appropriateness of test ordering is a complex process, not least because
test ordering decisions are made according to nuances of each patient’s condition.38
Appropriateness of test ordering relates to both overuse and under-use, although most
commentary has focused on overuse, occurring when a test has been ordered without a
clinical indication or within a time frame that is unlikely to provide additional
diagnostic information.31 32

Quality Use of Pathology Program Report
34
The clinical decision support features that can be included in electronic ordering
systems have the potential to reduce the repeat test order rate by notifying clinicians
when there is an existing identical test order, for that patient, already recorded within
the EMR. Clinicians can then choose not to proceed with the order or, if clinically
appropriate, to override the alert and proceed with the order. On the other hand, it is
much more difficult for a paper order to be identified as a repeat test and, therefore,
clinicians have reduced access to information that could assist them make effective
decisions. Reductions in the rate of unnecessary repeat tests can result in reductions in
patient phlebotomies and workload in the laboratory.40 41
We compared the rates of repeat EUC testing within one-hour and within 24-hours of
the previous test, for electronic and paper test orders. The pattern of data shown in
Table 14 shows that the proportion of repeat EUC testing in 2011 that occurred within
one hour of the previous EUC test was greater for tests ordered using the paper system
than those ordered with the EMR (0.69% and 0.25%, respectively), a significant
difference (χ2=40.95, p< .001). While, for tests ordered within 24 hours, there was a
lower proportion of repeat tests with paper orders than for electronic orders (11.68%
and 34.04%, respectively), also a significant difference (χ2=8534.37, p< .001).
Repeat EUC orders created electronically within 24-hours of the previous EUC order
for the same patient triggered a Duplicate Order Alert that had to be acknowledged for
the order to be created. The finding that 33.79% (the difference between 34.04% of
orders within 24 hours and 0.25% of orders within 1 hour) of electronically-ordered
repeat EUC tests occurred between one and 24-hours suggests that ordering clinicians
were prepared, in many cases, to proceed with a repeat EUC order despite encountering
a Duplicate Order Alert. The relative infrequency of electronically-ordered EUC orders
within one hour of the previous order may be a consequence of ordering clinicians’
decisions being influenced by their ability to access data on their computers screens
about what EUC tests had been ordered in the very recent past. In addition, while the
proportion of repeat EUC tests occurring within one-hour of the previous test decreased
with time for electronically-ordered tests (overall: 0.40% in 2009, 0.31% in 2010, and
0.25% in 2011), the pattern was not consistent for EUC tests ordered with the paper
system (Overall: 0.63% in 2009, 0.56% in 2010, and 0.69% in 2011).
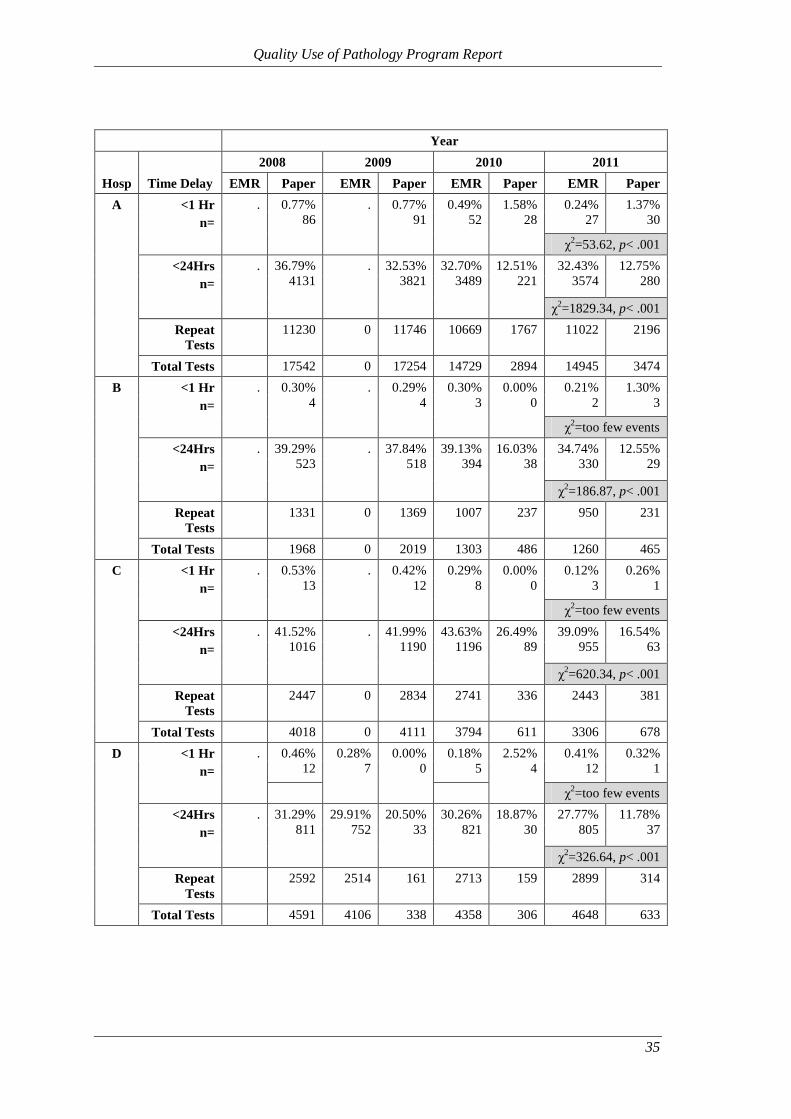
Quality Use of Pathology Program Report
35
Year
Hosp Time Delay
2008 2009 2010 2011
EMR Paper EMR Paper EMR Paper EMR Paper
A <1 Hr
n=
. 0.77%
86
. 0.77%
91
0.49%
52
1.58%
28
0.24%
27
1.37%
30
χ2=53.62, p< .001
<24Hrs
n=
. 36.79%
4131
. 32.53%
3821
32.70%
3489
12.51%
221
32.43%
3574
12.75%
280
χ2=1829.34, p< .001
Repeat
Tests
11230 0 11746 10669 1767 11022 2196
Total Tests 17542 0 17254 14729 2894 14945 3474
B <1 Hr
n=
. 0.30%
4
. 0.29%
4
0.30%
3
0.00%
0
0.21%
2
1.30%
3
χ2=too few events
<24Hrs
n=
. 39.29%
523
. 37.84%
518
39.13%
394
16.03%
38
34.74%
330
12.55%
29
χ2=186.87, p< .001
Repeat
Tests
1331 0 1369 1007 237 950 231
Total Tests 1968 0 2019 1303 486 1260 465
C <1 Hr
n=
. 0.53%
13
. 0.42%
12
0.29%
8
0.00%
0
0.12%
3
0.26%
1
χ2=too few events
<24Hrs
n=
. 41.52%
1016
. 41.99%
1190
43.63%
1196
26.49%
89
39.09%
955
16.54%
63
χ2=620.34, p< .001
Repeat
Tests
2447 0 2834 2741 336 2443 381
Total Tests 4018 0 4111 3794 611 3306 678
D <1 Hr
n=
. 0.46%
12
0.28%
7
0.00%
0
0.18%
5
2.52%
4
0.41%
12
0.32%
1
χ2=too few events
<24Hrs
n=
. 31.29%
811
29.91%
752
20.50%
33
30.26%
821
18.87%
30
27.77%
805
11.78%
37
χ2=326.64, p< .001
Repeat
Tests
2592 2514 161 2713 159 2899 314
Total Tests 4591 4106 338 4358 306 4648 633

Quality Use of Pathology Program Report
36
Year
Hosp
Time
Delay
2008 2009 2010 2011
EMR Paper EMR Paper EMR Paper EMR Paper
E <1 Hr
n=
. 0.53%
82
0.49%
68
0.75%
20
0.24%
37
0.29%
10
0.27%
48
0.56%
13
χ2=5.69, p< .05
<24Hrs
n=
. 37.17%
5802
38.92%
5367
11.94%
320
37.29%
5661
19.56%
680
37.40%
6573
9.82%
228
χ2=3987.71, p< .001
Repeat
Tests
15609 13790 2679 15181 3476 17577 2322
Total
Tests
22911 18256 4445 19640 4954 21984 3698
F <1 Hr
n=
. 0.50%
63
0.33%
37
0.31%
8
0.26%
28
0.25%
7
0.22%
25
0.25%
6
χ2=0.16, n.s.
<24Hrs
n=
. 35.99%
4530
36.13%
4102
8.50%
216
31.90%
3382
7.82%
220
30.91%
3568
11.64%
281
χ2=1734.58, p< .001
Repeat
Tests
12586 11353 2542 10601 2815 11543 2415
Total
Tests
18949 15207 3888 14474 3946 15322 3267
Overall <1 Hr
n=
. 0.57%
260
0.40%
112
0.63%
135
0.31%
133
0.56%
49
0.25%
117
0.69%
54
χ2=40.95, p< .001
<24Hrs
n=
. 36.71%
16813
36.96%
10221
28.59%
6098
34.82%
14943
14.54%
1278
34.04%
15805
11.68%
918
χ2=8534.37, p< .001
Repeat
Tests
45795 27657 21331 42912 8790 46434 7859
Total
Tests
69979 37569 32055 58298 13197 61465 12215
Chi-square (χ2) tests of independence; n.s.: Not Significant
Table 14. A comparison, between hospitals and between years, of the proportion and volume of paper-
and electronically-ordered (EMR) and repeat EUC tests (in the clinical chemistry department) whose
specimens arrived in the CSR within 1- and 24-hours of the previous EUC test, for the same patient.

Quality Use of Pathology Program Report
37
SECTION VI: TURNAROUND TIMES
Introduction
The measurement of test turnaround times (TATs) involves consideration of multiple
sequential steps that make up the pathology test process.42
The start time for TAT
calculation can be defined at a variety of time points including the time a pathology test
is ordered by the authorised clinician, the time a specimen is collected, received at the
CSR of the pathology service, when the laboratory test process was undertaken, right
through to the time a result was issued or a clinician accessed the result.8 TAT provides
one measure of the effectiveness of a laboratory, provided it is linked to clinical need,
and is often used as a key indicator of laboratory performance.43 44
TAT has the
potential to affect the length of stay in wards and the ED, where delays in obtaining
pathology test results may delay diagnosis, treatment and the transfer or discharge of
the patient from ED.45-47
Methods
TAT analysis for this section utilised the linked and verified dataset as described in
Section V. This enabled examination of the following two measures:
the data entry phase undertaken within CSR measured from the time a specimen
is received in the CSR to when the specimen leaves CSR (Data entry time).
Total Laboratory TAT measured from the time a specimen is received in the
CSR to the time a verified result is available (Total Laboratory TAT).
Data were extracted from the LIS for all six study hospitals for the months August and
September for each of the years from 2008 to 2011. The tests selected were limited to
high-volume tests (EUC [electrolytes, urea, creatinine] in the clinical chemistry
department and Automated Differential [including full blood count] in the haematology
department).
Results
Our analyses showed that the median data entry time for all hospitals combined was
three minutes faster for electronic than for paper orders for each year; a significant
difference. This significant difference was consistent for both tests (EUC and
Automated Differential) across 2010 and 2011 (see Tables 15a and 15b). This faster
data entry time translated into significantly lower median Total Laboratory TATs for

Quality Use of Pathology Program Report
38
electronic orders than for paper orders (for EUC tests the difference in medians was 12
minutes in 2010 and six minutes in 2011; for Automated Differential tests, the
difference in medians was four minutes in 2010 and two minutes in 2011). In January
2011, the chemistry analyser in the clinical chemistry department servicing Hospitals A,
B, and C, was replaced with an instrument with a longer analytical cycle time. This was
the reason for an increased Total Laboratory TAT in 2011.

Quality Use of Pathology Program Report
39
Clinical chemistry 2008 2009 2010 2011
Hosp EUC
EMR Paper EMR Paper EMR Paper EMR Paper
A
Median
TAT
(mins)
Data
Entry . 14 . 9
5 8 5 8
z=25.56, p<.001 z=17.77, p<.001
Total
Lab . 42 . 47
43 56 58 64
z=20.53, p<.001 z=15.72, p<.001
Test Count . 20325 . 19757 16926 3058 17252 3616
B
Median
TAT
(mins)
Data
Entry . 12 . 9
6 8 5 6
z=7.36, p<.001 z=2.88, p<.01
Total
Lab . 42 . 49
44 51 61 65
z=5.39, p<.001 z=3.38, p<.01
Test Count . 2152 . 2205 1486 504 1435 481
C
Median
TAT
(mins)
Data
Entry . 10 . 9
5 8 5 8
z=12.13, p<.001 z=12.76, p<.001
Total
Lab . 40 . 51
43 59 64 70
z=12.51, p<.001 z=6.02, p<.001
Test Count . 4953 . 5142 4475 663 3886 714
D
Median
TAT
(mins)
Data
Entry . 1
10 12 6 8 4 9
z=4.06, p<.001 z=4.03, p<.001 z=12.64, p<.001
Total
Lab . 52
66 74 68 74 59 70
z=5.10, p<.001 z=3.38, p<.01 z=10.13, p<.001
Test Count . 5160 4560 357 4880 321 5134 646
E
Median
TAT
(mins)
Data
Entry . 10
10 15 10 15 7 13
z=20.22, p<.001 z=25.70, p<.001 z=27.04, p<.001
Total
Lab . 50
52 58 79 89 67 81
z=16.38, p<.001 z=14.33, p<.001 z=22.60, p<.001
Test Count . 24266 19459 4482 20798 5071 23179 3747
F
Median
TAT
(mins)
Data
Entry . 12
14 12 9 9 6 7
z=0.48, n.s. z=0.56, n.s. z=7.47, p<.001
Total
Lab . 65
65 72 87 88 61 65
z=16.69, p<.001 z=3.95, p<.001 z=12.43, p<.001
Test Count . 19517 15776 3950 15503 4017 16418 3345
Overall
Median
TAT
(mins)
Data
Entry
7 10 6 9
z=35.16, p<.001 z=33.56, p<.001
Total
Lab
66 78 62 68
z=29.67, p<.001 z=30.45, p<.001
Test Count 64068 13634 67304 12549
Mann-Whitney U tests of significance; n.s.: Not Significant
Table 15a. A comparison, between electronic-orders (EMR) and paper-orders, for EUC in the clinical
chemistry department, of the median test TATs for the pre-analytic data entry phase and the laboratory
test process from the time a specimen was received in CSR until a result was available.

Quality Use of Pathology Program Report
40
Haematology
2008 2009 2010 2011
Hosp Automated Diff EMR Paper EMR Paper EMR Paper EMR Paper
A
Median
TAT
(mins)
Data
Entry . 14 . 9
5 9 5 8
z=28.69, p<.001 z=20.29, p<.001
Total
Lab . 45 . 33
28 32 29 30
z=11.34, p<.001 z=5.77, p<.001
Test Count . 19561 . 19121 15836 3160 16237 3771
B
Median
TAT
(mins)
Data
Entry . 16 . 9
6 7 6 8
z=7.28, p<.001 z=7.45, p<.001
Total
Lab . 51 . 35
32 32 30 31
z=0.04, n.s. z=2.57, p<.05
Test Count . 3087 . 2996 1642 1333 1647 1376
C
Median
TAT
(mins)
Data
Entry . 12 . 9
5 9 4 9
z=17.46, p<.001 z=15.81, p<.001
Total
Lab . 46 . 36
33 33 32 32
z=0.70, n.s. z=0.81, n.s.
Test Count . 3963 . 3809 3378 636 3056 751
D
Median
TAT
(mins)
Data
Entry . 1
10 12 6 7 4 9
z=3.80, p<.001 z=4.42, p<.001 z=12.35, p<.001
Total
Lab . 29
42 47 43 50 26 33
z=3.60, p<.001 z=3.01, p<.01 z=6.30, p<.001
Test Count . 4979 4419 346 4744 329 5231 688
E
Median
TAT
(mins)
Data
Entry . 10
10 15 10 15 7 13
z=21.06, p<.001 z=25.55, p<.001 z=26.59, p<.001
Total
Lab . 45
43 47 38 44 37 44
z=10.19, p<.001 z=18.54, p<.001 z=18.27, p<.001
Test Count . 22367 17305 4791 19490 5453 21473 4373
F
Median
TAT
(mins)
Data
Entry . 12
13 12 9 8 6 6
z=2.41, p<.05 z=0.21, n.s. z=5.56, p<.001
Total
Lab . 74
71 73 78 78 58 64
z=1.57, n.s. z=0.06, n.s. z=2.57, p<.05
Test Count . 20139 15838 4662 15811 4417 16717 3733
Overall
Median
TAT
(mins)
Data
Entry
7 10 6 9
z=34.41, p<.001 z=35.35, p<.001
Total
Lab
40 44 36 38
z=12.79, p<.001 z=11.70, p<.001
Test Count 60901 15328 64361 14692
Mann-Whitney U tests of significance; n.s.: Not Significant
Table 15b. A comparison, between electronic-orders (EMR) and paper-orders, for Automated
Differential in haematology, of the median test TATs for the pre-analytic data entry phase, and the
laboratory test process from the time a specimen was received in CSR until a result was available.

Quality Use of Pathology Program Report
41
SECTION VII: PATIENT OUTCOME – EMERGENCY DEPARTMENT (ED)
LENGTH OF STAY
Aims
This analysis examined the relationships between the performance of the pathology
service (e.g., number of pathology departments involved, number of tests, test
turnaround time and whether test orders were paper or electronic) and patient length of
stay in emergency departments (ED LOS).
Data background
As described earlier (see Section V), pathology test order data from the LIS were linked
with ED admission, discharge, and triage data (from the EDIS) for patients who
presented at an ED during the period August-September of 2008 to 2011. Four adult
hospitals with EDs were included. The linked ED pathology dataset, contained
information for 397,639 tests ordered for 55,933 patients (with 67,246 patient
presentations) who had at least one pathology test ordered during their stay in the ED.
Data inclusion criteria
In the linked dataset, 57% of ED presentations involved a single pathology test order
episode; 43% of ED presentations involved multiple test order episodes (up to 17 test
order episodes). There was a median of seven tests in each test order episode (inter-
quartile range: 5 to 10 tests). Sometimes, a subsequent test order episode occurred
before all the results of a preceding test order episode were available to clinicians. In
addition, tests from a single test order episode were often processed in different
departments of the pathology service and therefore test results become available at
different times. These issues had the potential to confound statistical analyses.
In order to simplify the data analysis, we included only presentations with a single
pathology test order episode (57% of ED presentations); and utilised the maximum test
TAT before patient discharge (i.e., the test TAT for the slowest test result that was
available before the patient was discharged from the ED).
There were 31,214 presentations, for 28,191 patients, which met the criteria stated
above (presentations that had only one test order episode, had a valid laboratory test
TAT, and presented at the ED of one of the hospital sites).
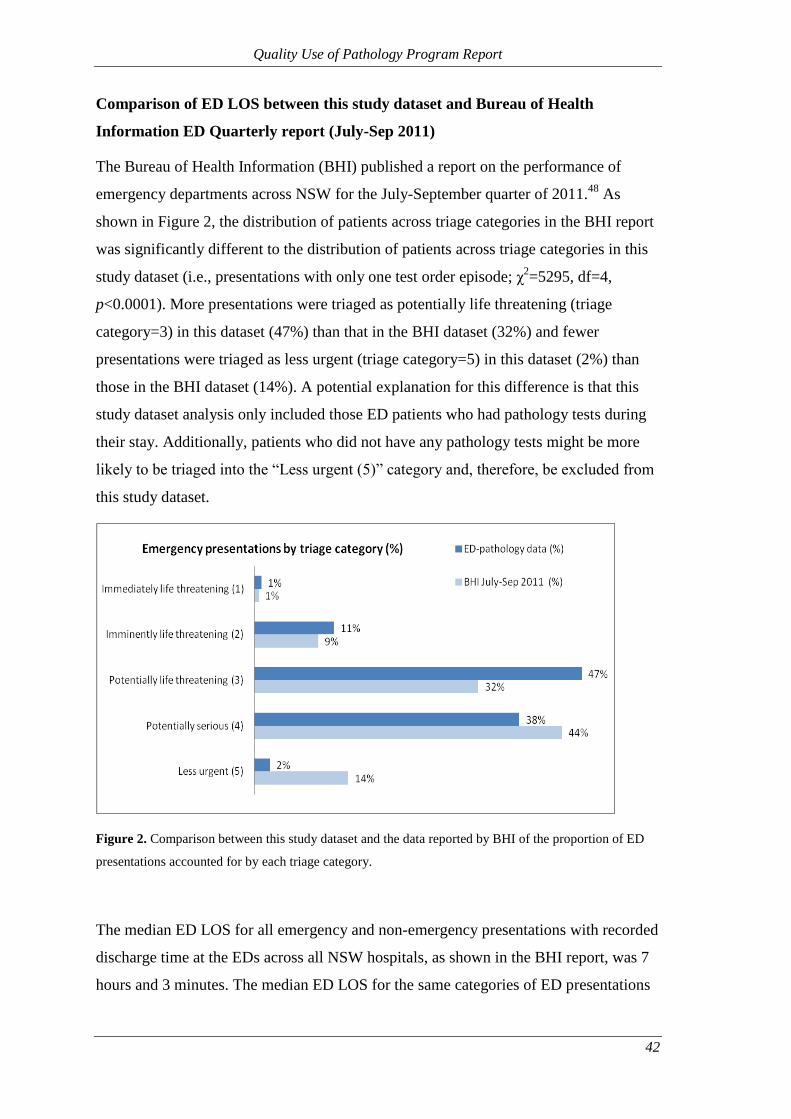
Quality Use of Pathology Program Report
42
Comparison of ED LOS between this study dataset and Bureau of Health
Information ED Quarterly report (July-Sep 2011)
The Bureau of Health Information (BHI) published a report on the performance of
emergency departments across NSW for the July-September quarter of 2011.48
As
shown in Figure 2, the distribution of patients across triage categories in the BHI report
was significantly different to the distribution of patients across triage categories in this
study dataset (i.e., presentations with only one test order episode; χ2=5295, df=4,
p<0.0001). More presentations were triaged as potentially life threatening (triage
category=3) in this dataset (47%) than that in the BHI dataset (32%) and fewer
presentations were triaged as less urgent (triage category=5) in this dataset (2%) than
those in the BHI dataset (14%). A potential explanation for this difference is that this
study dataset analysis only included those ED patients who had pathology tests during
their stay. Additionally, patients who did not have any pathology tests might be more
likely to be triaged into the “Less urgent (5)” category and, therefore, be excluded from
this study dataset.
Figure 2. Comparison between this study dataset and the data reported by BHI of the proportion of ED
presentations accounted for by each triage category.
The median ED LOS for all emergency and non-emergency presentations with recorded
discharge time at the EDs across all NSW hospitals, as shown in the BHI report, was 7
hours and 3 minutes. The median ED LOS for the same categories of ED presentations

Quality Use of Pathology Program Report
43
in this study dataset was 6 hours and 37 minutes. Potential reasons for this difference
include:
1) LOS in our analysis was calculated from the available triage time to discharge
time, not from the patients’ actual arrival time (a systematically longer time);
2) Our analysis excluded ED presentations with more than one test order episode,
which would seem more likely to have a longer LOS than presentations with
only one test order episode.
Methods
Multilevel linear regression modelling was applied to identify the factors affecting ED
LOS taking into account the correlation between patients’ presentations at the same
hospital in the same calendar year. Our analysis examined the available data on ED
patients’ demographics (i.e., age and gender) and information related to ED
presentation characteristics (i.e., triage category, and ED mode of separation). Data
extracted from the LIS provided pathology test information related to ED presentations,
such as number of tests, number of pathology departments involved, order type (paper,
EMR, or both), and laboratory TAT. The distribution of ED length of stay was found to
be skewed and, therefore, a logarithmic transformation was applied. Model building
was performed using StataCorp Stata version 12 software.49
The following data include
only ED presentations that met the inclusion criteria described above.
Results
There was a greater proportion of female patients in the dataset than males (47.1%
males, χ2=95, df=1, p<0.0001). This pattern was consistent across each of the four
hospitals (χ2=4.1, df=3, p=.25). The median age of patients at the first presentation (in
cases where multiple presentations occurred within the analysis period) was 51 years
(IQR: 31-72).
ED length of stay (ED LOS)
The median LOS was 5 hours and 35 minutes (IQR: 3 hours and 39 minutes to 7 hours
and 51 minutes). Overall, 74.53% of the presentations had a stay longer than 4-hours
(95% CI 74.05% to 75.02%). The duration of the 95th
percentile ED LOS was 878
minutes (14 hours and 38 minutes). Among the four hospitals, the median ED LOS was
consistently the shortest at Hospital A and, with the exception of 2008, consistently the
longest at Hospital F (Table 16).

Quality Use of Pathology Program Report
44
Year Hospital
Number of ED
presentations
meeting criteria
Median LOS
(minutes)
Median TAT
(minutes)
Median
number
of tests
2008
A 1932 308 49 4
D 1116 351 68 6
E 2612 326 51 5
F 2199 349 68 5
2009
A 2105 296 48 4
D 1095 367 72 6
E 2406 312 48 4
F 2040 385 69 5
2010
A 2208 323 46 4
D 1166 355 72 6
E 2472 349 63 4
F 1981 367 77 5
2011
A 2140 301 53 4
D 1255 332 53 5
E 2473 325 55 4
F 2014 382 66 5
Table 16. Median LOS, TAT, and number of tests by hospital and year.
Pathology testing characteristics
Maximum test TAT before discharge
The median maximum test TAT before discharge from ED was 58 minutes (IQR: 40-88
minutes). The duration of the 95th
percentile maximum test TAT was 3 hours and 40
minutes. There was a moderate positive correlation between maximum TAT and LOS
(ρ=0.42; 95% CI: 0.39-0.41). The median TAT at Hospital A was the shortest and at
Hospital F it was the longest among four hospitals (see Table 16). This was the same
pattern observed for LOS.
Number of tests
Half the presentations involved a minimum of four pathology tests (IQR: 3-6 tests). The
number of tests varied more between the calendar years for Hospitals D and E than
Hospitals A and F (Table 16). There was a weak positive correlation between the
number of tests in a test order episode and ED LOS (ρ=0.14; 95% CI: 0.12-0.15).

Quality Use of Pathology Program Report
45
Number of pathology departments involved
Of the presentations meeting the inclusion criteria, 77.52% included tests from two
pathology departments, most often clinical chemistry and haematology. The results in
Table 17 suggest that, as more pathology departments were involved in fulfilling the
test order, both the maximum test TAT and the ED LOS were longer.
Number of
labs Number of test order episodes
Median TAT
(minutes)
Median LOS
(minutes)
1 1857 43 280
2 24197 56 335
3 4760 77 360
4 381 84 379
5 17 91 409
6 2 104 548
Table 17. The number of test order episodes which involved one through six different pathology
departments, and the associated median TAT and LOS.
Test order type
EMR was implemented through 2008 and 2009, and became available at Hospital A in
2010, while at Hospitals D, E, and F it was also available for the 2009 period. Each test
order episode could be created exclusively using the paper system, exclusively using
the EMR system, or using a combination of the two systems. After the implementation
of EMR was complete at all hospital EDs, (i.e., 2010), around 74% (in 2010) to 76% (in
2011) of test order episodes were created using EMR; around 2% (in both 2010 and
2011) used only the paper system; and 22% (in 2011) to 24% (in 2010) used a
combination of both EMR and paper systems (Figure 3).

Quality Use of Pathology Program Report
46
Figure 3. Percentage of test order episodes of each order type across the study period.
Across all hospital EDs the median TAT and ED LOS were longest for presentations
where the test order episode was created using both the paper and EMR systems
compared to presentations where the test order episode was created using the paper or
EMR system exclusively (Table 18).
Hospital Order Type
Number of ED
presentations
meeting criteria
Median TAT
(minutes)
Median LOS
(minutes)
A
Paper 4080 48 302
Paper/EMR 960 83 354
EMR 3345 47 301
D
Paper 1159 68 353
Paper/EMR 798 101 384
EMR 2675 59 335
E
Paper 2818 50 323
Paper/EMR 1388 82 378
EMR 5757 52 319
F
Paper 2289 69 351
Paper/EMR 1400 105 429
EMR 4545 65 363
Table 18. Median LOS and TAT by hospital and order type.

Quality Use of Pathology Program Report
47
ED presentation characteristics
Triage category
More than 85% of presentations were triaged as potentially life threatening or
potentially serious (categories 3 and 4, respectively). Figure 4 shows that the
distribution of patient volume between triage categories was not uniform across the four
hospitals (χ2=815, df=12, p<0.0001).
Figure 4. Percentage of ED presentations by triage category in each hospital.
The median test TAT and ED LOS were shorter for presentations with the triage
category of immediately life threatening (category 1) than for presentations in the other
four triage categories (Table 19).
Triage
Number of ED
presentations
meeting criteria
Median TAT
(IQR)
(minutes)
Median LOS
(IQR)
(minutes)
Immediately life threatening (1) 309 54 (36, 77) 271 (175, 418)
Imminently life threatening (2) 3541 60 (43, 89) 293 (209, 410)
Potentially life threatening (3) 14682 58 (40, 89) 335 (240, 471)
Potentially serious (4) 11928 56 (39, 86) 353 (250, 490)
Less urgent (5) 754 53 (36, 82) 317 (220, 452)
Table 19. Median LOS and TAT by triage category.

Quality Use of Pathology Program Report
48
Mode of separation
Of the presentations meeting the inclusion criteria, 41.70% had their treatment
completed within the ED and were discharged to home, and 56.17% of patients were
eventually admitted or transferred to another ward or hospital (Table 20). The median
TATs of the different modes of separation varied from 49 to 65 minutes and the median
LOS ranged from 246 to 395 minutes (Table 20). Both median TAT and median LOS
were longer for patients who were admitted and discharged as an inpatient within ED
than for patients with another mode of separation.
ED mode of separation
Number of ED
presentations
meeting criteria
Median TAT
(minutes)
Median LOS
(minutes)
Admitted/transferred to
another ward/hospital 17534 62 395
Admitted: Died in ED 40 65 302
Departed: Treatment
Completed 13015 54 282
Left at own risk 625 49 246
Table 20. Median LOS and TAT by ED mode of separation.
The relationship between ED LOS and the pathology service
Table 21 shows the factors which make significant contributions to the changes of ED
LOS with consideration of the correlation between presentations at the same hospital in
the same calendar year. The model accounts for 24% of the variation in ED LOS. The
inclusion of TAT and the number of tests ordered in the model explains more than 10%
of the variation in ED LOS.
Table 21 shows that, everything else being equal, every 60 minute increase in
maximum test turnaround time was, on average, associated with a 9.84% increase in ED
LOS (95% CI: 9.49% to 10.19%; p<.0001). This constitutes strong evidence that the
pathology test turnaround time affects patients’ length of stay within the ED when
controlling for patient age, triage category, number of tests conducted during the ED
stay and ED mode of separation and taking into account the correlation between
presentations at the same hospital in the same calendar year. Another important factor
related to the pathology testing revealed by this analysis is the number of tests ordered
for each presentation. Each additional five tests ordered within a presentation was, on
average, associated with a 2.84% increase in ED LOS after adjustment for the other
factors in the model, a small but significant effect (95% CI: 1.68% to 4.29%; p<.0001).
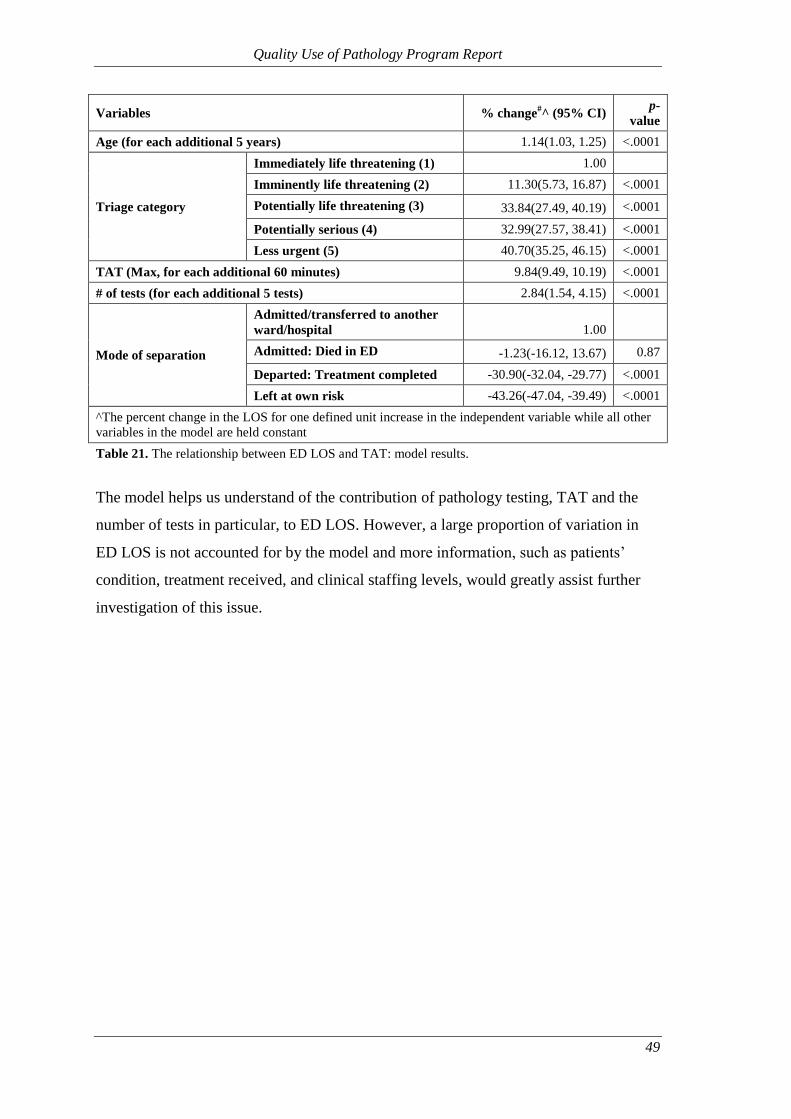
Quality Use of Pathology Program Report
49
Variables % change#^ (95% CI)
p-
value
Age (for each additional 5 years) 1.14(1.03, 1.25) <.0001
Triage category
Immediately life threatening (1) 1.00
Imminently life threatening (2) 11.30(5.73, 16.87) <.0001
Potentially life threatening (3) 33.84(27.49, 40.19) <.0001
Potentially serious (4) 32.99(27.57, 38.41) <.0001
Less urgent (5) 40.70(35.25, 46.15) <.0001
TAT (Max, for each additional 60 minutes) 9.84(9.49, 10.19) <.0001
# of tests (for each additional 5 tests) 2.84(1.54, 4.15) <.0001
Mode of separation
Admitted/transferred to another
ward/hospital 1.00
Admitted: Died in ED -1.23(-16.12, 13.67) 0.87
Departed: Treatment completed -30.90(-32.04, -29.77) <.0001
Left at own risk -43.26(-47.04, -39.49) <.0001
^The percent change in the LOS for one defined unit increase in the independent variable while all other
variables in the model are held constant
Table 21. The relationship between ED LOS and TAT: model results.
The model helps us understand of the contribution of pathology testing, TAT and the
number of tests in particular, to ED LOS. However, a large proportion of variation in
ED LOS is not accounted for by the model and more information, such as patients’
condition, treatment received, and clinical staffing levels, would greatly assist further
investigation of this issue.

Quality Use of Pathology Program Report
50
SECTION VIII: BENEFITS REALISATION FRAMEWORK
This project has delivered a large body of empirical findings assessing the impact of the
EMR on key performance dimensions of the pathology ordering process including: a)
the quality of the test ordering process e.g., labelling, patient and specimen
identification; b) the effectiveness of the orders (test volumes, DRG casemix, add-on
testing and repeat test rates; c) the impact on laboratory processes as measured by
turnaround times; and d) patient outcomes – the impact on length of stay within the ED.
Laboratory test order errors
Our retrospective audit of the error log compared the number and frequency of errors
logged during the first half of 2009 (when it was a paper based system), and the period
between 1 March 2010 and 9 October 2011 (when it was a computerised system). There
was a major increase in the number and frequency of errors logged in the system when
measured as a rate per 1000 test order episodes increasing from 9.66 in 2009 to 12.67 in
2010 and 13.48 in 2011. The great majority of errors responsible for this increase were
attributable to new or changed processes associated with the introduction of EMR,
which included errors categorised as “Other,” “No specimen received,” “Test set” and
“EMR test order problem.” Closer analysis of the “EMR test order problem” errors
revealed that 66.72% of cases were related to an alteration made on a print-out of an
electronic test order where a new test order should have been created. Other reasons
included the presence of duplicate forms, add-on tests, or an incorrect EMR order.
A cross-sectional analysis of the error log data comparing paper test orders with EMR
test orders across the three years found that the rate of errors recorded in the IIMS (for
the categories “Mislabelled specimen”, “Mismatched specimen” and “Unlabelled
specimen”) were significantly fewer for EMR orders than for paper orders. The findings
across categories related to efficiency and effectiveness (e.g., “Accident to specimen;
“Insufficient specimen” and “Patient detail problem”) were variable. Process maps were
utilised to identify the source of errors recorded as “EMR test order problem” and to
help quantify their impact on laboratory processes. Our analysis showed that the median
turnaround time (from receipt at the CSR to test result) of test orders with an “EMR test
order problem” was 181 minutes (3 hours) longer than the equivalent median for all test
order episodes.

Quality Use of Pathology Program Report
51
Effectiveness of the test order process
We undertook a series of analyses at each of the six hospital sites to compare test
volumes. Our findings showed that when comparing the periods before and after the
implementation of EMR, the mean number of tests ordered in each test order episode
decreased significantly at all hospitals. The overall rate across all hospitals fell from
4.63 in 2008 to 4.36 in 2011 (p<.001). When test numbers were analysed according to
the number of tests per patient admission they were found to be higher in 2011
compared to 2008 for some hospitals (e.g., A and E) but lower in other hospitals (e.g., C
and D). However, the mean length of stay for admitted patients was consistently shorter
in 2011 than 2008.
Our comparison of the number of tests undertaken per admission and grouped into
DRG categories provided examples such as A06B (Tracheostomy w/ventilation >95hrs)
where the mean number of tests per admission fell from 181.10 in 2008 to 156.77 in
2011, but where the corresponding mean length of stay rose from 646 hours to 696
hours. Alternatively, for E62A (Respiratory infections) the numbers increased from
40.60 to 42.81 for mean number of tests and decreased from 305 to 289 hours for mean
length of stay. Our analysis of the test ordering profiles for the DRG of F74Z (Chest
pain) at four hospital EDs highlighted some common test ordering patterns (e.g.,
Troponin, EUC, and Automated Differential tests were consistently the most frequently
ordered tests) but also revealed some major differences between hospitals and for the
period before and after the introduction of EMR. The mean number of C-Reactive
protein tests per ED presentation varied both between hospitals and between years. At
three of the EDs the mean number of C-Reactive protein tests per ED presentation was
higher in 2011 than in 2008 (Hospital ED “A”: from a mean of 0.02 C-Reactive protein
tests per ED presentation, in 2008, to a mean of 0.08 tests per presentation; Hospital ED
“D”: from a mean of 0.24 tests to 0.31 tests; and Hospital ED “F”: from a mean of 0.13
tests to 0.21 tests), while the opposite was true for the ED at Hospital ED “E” (from a
mean of 0.11 tests to 0.06 tests).
The introduction of EMR across all the hospitals made it possible to compare add-on
testing rates both between hospitals and between pathology departments. Our analysis
showed that there was variation between hospitals that ranged from 0.61% in Hospital
B (specialist hospital) to 2.24% in Hospital F (metropolitan hospital). Clinical
chemistry and haematology were the pathology departments that accounted for the

Quality Use of Pathology Program Report
52
highest volume of add-on tests; in those departments, add-on tests accounted for 2.56%,
and 0.69%, respectively, of all ordered tests.
Assessing the appropriateness of test ordering is a complex process. The National
Coalition of Public Pathology describes appropriateness as a multifaceted concept
which requires consideration of a number of factors usually unique to every individual
context.38
Generally, test inappropriateness is assumed to be synonymous with
“overuse” and occurs when a test has been ordered without a clinical indication or
within a time frame which provides no additional information and therefore provides no
value in the diagnosis or treatment of the patient.50 51
These situations are determined by
expert consensus based on evidence-based guidelines.38
In this project, we compared
the rate of paper and EMR-ordered EUC tests which were ordered within 1-hour and
24-hours of the previous EUC test. In 2011, the proportion of repeat EUC testing
occurring within one hour of the previous EUC test was significantly greater for tests
ordered with the paper system than electronically-ordered tests (0.69% and 0.25%,
respectively). Conversely, a significantly smaller proportion of paper-ordered tests was
ordered within 24 hours than for electronically-ordered tests (11.68% and 34.04%,
respectively).
Timeliness of the test ordering process
Turnaround times (TAT) are one of the most frequently used measures of laboratory
performance,43
and often a central criteria of how clinicians judge the quality of a
pathology service.44
TAT partly reflects the efficiency of the laboratory workflow in
regard to the use of time but it also includes processes outside the laboratory’s control
(e.g., analytical cycle time). TAT can be considered by type of test (e.g., EUC), its
priority (e.g., urgent or routine) or via different stages of the testing process (e.g.,
ordering, collection, identification, transportation, preparation, analysis, reporting,
interpretation, action).52
In this project, we incorporated an examination of the data
entry time; that is, the time from when a specimen arrives in the CSR to the time that it
leaves the CSR, often referred to as the laboratory pre-analytical stage. This provided a
means of comparing the impact of EMR (relative to the paper-based status quo) on data
entry processes within the CSR. The median data entry time for EMR orders was three
minutes shorter than it was for paper-orders. We also examined the Total Laboratory
TAT. This measure allowed us to test if any time savings from the data entry process

Quality Use of Pathology Program Report
53
impacted on a measure of the entire laboratory process; significant differences in the
median Total Laboratory TAT were demonstrated.
Patient outcomes – ED length of stay
The impact that improved TATs have on patient outcomes is difficult to establish
because of the unique work processes and contextual make up of each healthcare
setting.44
Critical care settings and EDs are areas where shorter TATs may be expected
to contribute to the improvement of patient flows and reduction of length of stay.53
There are studies that have investigated the effect that improved TATs and the volume
of tests have on reducing length of stay in the ED which can be expected to affect
overcrowding and the quality of patient care.45 47 54
This project used multilevel linear
regression modelling to examine the relationship between TAT and the number of tests
and the length of stay in the ED. Our analysis produced a model that accounted for 24%
of the variation in ED LOS and indicated that the ED LOS, on average, increased by
9.84% for every 60 minute increase in the test turnaround time (95% CI: 9.5% to
10.2%; p<0.0001). After adjusting for patient age, triage category, and number of tests
conducted during the ED stay and eventual ED mode of separation, the model provided
strong evidence that test turnaround time affects patients’ length of stay in the ED.
Performance indicators of the impact of EMR on the quality of pathology services
This research was underpinned by an imperative to carefully monitor the impact that
electronic ordering has on the functioning of pathology laboratory services and their
contribution to safe and quality patient care.55
It highlights the importance of using
quantitative analyses built upon robust evidence-based performance indicators as a
means of encouraging transparency and clarity about what is being achieved and the
desired outcome.56
The comparative empirical findings that emerge from the benefits
realisation framework can identify what works best, where, and in what circumstances,
as a means of enhancing the implementation and sustainability of electronic ordering
systems and maximising their contribution to safe and high quality patient care.
Contribution to evidence-based practice: Evidence-based medicine has meant a shift in
the culture of health provision away from decisions based on opinion, past practices and
precedent towards a system that better utilises science, research and evidence to guide
decision making.57
For pathology, this has inspired a new emphasis on its role in the
whole patient journey beginning with asking the right clinical questions about the

Quality Use of Pathology Program Report
54
selection of the most appropriate test or investigation to diagnose a problem, to the
interpretation and provision of clinical advice, and treatment across the whole spectrum
of clinical specialties involved in the patient pathway.58
Quality and safety of patient care: The World Health Organization’s World Alliance
for Patient Safety has highlighted the importance of pathology services to the global
patient safety agenda emphasising the role of the laboratory in: i) ensuring reliable and
accurate results delivered in a timely fashion; ii) informing clinical management
decisions; and iii) the safe administration of blood products and medications.59
The
main sources of laboratory errors arise within the pre-analytic (clinician’s test order and
CSR) and post-analytic (laboratory report to the clinician) phases of the process. It is in
these areas where electronic ordering can have a major positive impact. Electronic
decision support functions can assist clinicians to improve the quality of test ordering,
for example selecting appropriate tests, accurately specifying all aspects of the test
order including relevant clinical information, and indicating clinical urgency. It can also
help to promote appropriate test ordering and utilisation that facilitates quality decision
making and health benefit for the patient.9
Effectiveness of pathology services: There is some evidence, from general practice and
acute care settings over the last decade, of the potential for electronic ordering to
improve the effectiveness of health care,60-62
promote compliance with evidence-based
guidelines63
and accentuate the use of evidence to support clinical decision making.64
However, the utilisation of electronic ordering in Australia and overseas has yet to
extend beyond a small number of hospitals and the utilisation of decision support
functions has not been extensive.11
Moreover, the implementation of electronic ordering
represents a potential high risk for hospitals65
that can lead to unexpected outcomes66
and test ordering errors including the over-utilisation or inappropriate ordering of
tests.67
One of the main gaps within the existing literature is that it often neglects to
compare different applications over time in order to identify the features that contribute
to their success or otherwise.11
It also often fails to account for the crucial role that
factors like education, feedback and quality improvement can have on the success and
sustainability of decision support features.68 69
This means that there is an insufficient
understanding of why a system may be useful and effective in one setting but not
another.70

Quality Use of Pathology Program Report
55
The evidence provided by this research has led to a set of indicators that can be used to
monitor various aspects of electronic ordering and its effect on the laboratory processes
(predominantly the pre-analytical processes). These indicators can be used for
comparisons between hospitals, wards etc., to help improve the overall safety of the
patient, efficiency in the wards and help improve the quality and value of pathology
provided. Tables 22a-22f provide a summary of these indicators which make up the key
elements of the Benefits Realisation Framework.

Quality Use of Pathology Program Report
56
Quality of pathology test orders and specimens
Definition Quality pathology testing requires accurate patient and test order
information as well as safe collection and transport of all specimens
to the pathology service.
Aim To accurately document the type of pre-analytical errors (e.g.,
mislabelled specimens, patient detail problems or unmet collection
requirements) and to use this information to address the cause of the
errors and to improve the quality of pathology provided by the
pathology service.
Rationale Patient safety may be compromised by pre-analytical errors that can
occur at any of the many steps that a specimen and test order form
take before specimen processing and analysis actually begins.25 71
Electronic ordering has been introduced with the purpose of
improving the quality of information provided to the laboratory thus
enhancing the safety of the patient and improving efficiency and
effectiveness in the laboratory.
Potential uses The measurement of errors can be performed as part of an overall
assessment between hospitals, between wards or across time. A
comprehensive evaluation of errors allows for complex issues to be
assessed and provides a valuable quality improvement tool.
Potential
confounders
Documentation of errors needs to be part of the routine laboratory
procedure. Classification of the various errors is subject to a range of
interpretations so clear unambiguous definitions are required.
Data sources All pathology services are required to collect and report laboratory
errors as part of the NATA medical testing accreditation
requirements.72
Computerised error logs provide data in digital form
that is generally more amenable to validity and integrity checks and
statistical analyses. The manual intervention required to audit a paper
error log is associated with the need for a much greater investment of
time and resources.
Table 22a. Benefits realisation framework: Quality of pathology test orders and
specimens.

Quality Use of Pathology Program Report
57
Test volumes
Definition The total number of tests ordered for a given period measured
through a variety of methods e.g., per test order episode, per patient
admission, per Diagnosis-related Group (DRG), per patient
admission, and per specific test type (e.g., Troponin).
Aim To compare and monitor test volumes using the metrics described
above.
Rationale Clinical decision support components of electronic ordering have the
potential to improve the appropriateness of pathology test ordering.
Alternatively, the ease with which an order can be made may also
increase the risk of over-ordering pathology tests. The impact of
excessive ordering is not just financial; it may lead to an increase in
false positives resulting in unnecessary and expensive diagnostic
examinations and treatments.73
Potential uses Assessing test volume using a variety of metrics (described above)
allows for a comprehensive analysis of test utilisation in the
pathology service. For example, assessing test volume per test order
episode informs whether changes that make test ordering more
accessible (i.e., electronic ordering) are associated with over-
ordering; and assessing test volume per patient admission per DRG
allows test volume assessments to control for the type, severity, and
complexity of the patients’ condition.
Potential
confounders
Research in this field shows that the volume of test ordering may be
affected by a variety of factors including, the type of hospital (i.e.,
teaching or non-teaching), seniority and position of clinical staff and
even by the number of clinicians who see a patient.74
There is often a
direct relationship between patient length of stay and the number of
tests per patient admission. Test volume for electronic and paper
orders cannot be directly compared because, when both methods of
ordering are available, they may be used differently in different
clinical contexts (i.e., different wards, or patients of differing
diagnostic complexity).
Data sources Analyses of test volume per test order episode can be conducted
using data extracted from a LIS; however, analyses using other
metrics (patient admission and DRG categories) will require a LIS
dataset that has been linked with admission, discharge, and DRG
data extracted from the PAS and EDIS.75
Table 22b. Benefits realisation framework: Test volumes.

Quality Use of Pathology Program Report
58
Add-on test rates
Definition Add-on tests are tests performed on an existing specimen previously
submitted to the pathology service with an earlier test order.34 35
Aim To assess the volume and distribution of add-on tests.
Rationale Add-on tests are labour-intensive and interruptive of the workflow in
the laboratory. Add-on test utilisation places a disproportionate
burden on laboratory resources.33
Potential uses Understanding the utilisation of add-on testing can assist in decisions
regarding the allocation of resources and, potentially, changes in the
processes used for add-on testing.39
Potential
confounders
An add-on test rate can be defined in two ways: (1) the number of
add-on tests as a proportion of all tests, and (2) the number of add-on
test order episodes (that may contain requests for multiple add-on
tests) as a proportion of all test order episodes.
Data sources Data extracted from LIS are sufficient to conduct analyses of add-on
test volumes and rates. Analyses are rendered much easier if the LIS
supports a binary flag or checkbox to identify add-on tests (rather
than free-text).
Table 22c. Benefits realisation framework: Add-on test rates.

Quality Use of Pathology Program Report
59
Test appropriateness
Definition While there are many pathology tests that are conducted repeatedly
in order to monitor a condition or treatment, when a repeat test is
ordered within a brief time frame there is a high likelihood that it
will be redundant and will provide no additional information.60 76
Aim To identify the proportion of repeat tests ordered within different
time-frames and compare these proportions for paper- and
electronically-ordered repeat tests at each hospital.
Rationale Electronic ordering systems allow ordering clinicians to see what
tests have already been ordered. They can also provide on-screen
warnings suggesting that a repeat test order has been made within an
inappropriate time frame. Such information may lead clinicians to
decide not to order a repeat test that they otherwise would have
ordered.
Potential uses Reduce the rate of inappropriate test orders.
Potential
confounders
Inappropriate testing is generally used to refer to the ordering of tests
without a clear clinical indication or performed at the wrong time or
too frequently to be of value in diagnosis or clinical management in
line with evidence-based guidelines and expert consensus.38
Data sources One aspect of test appropriateness can be assessed by looking at the
temporal properties of repeat testing. For this type of analysis, data
extracted from LIS are sufficient, but the analysis should select
specific tests and clinical settings.
Table 22d. Benefits realisation framework: Test appropriateness.
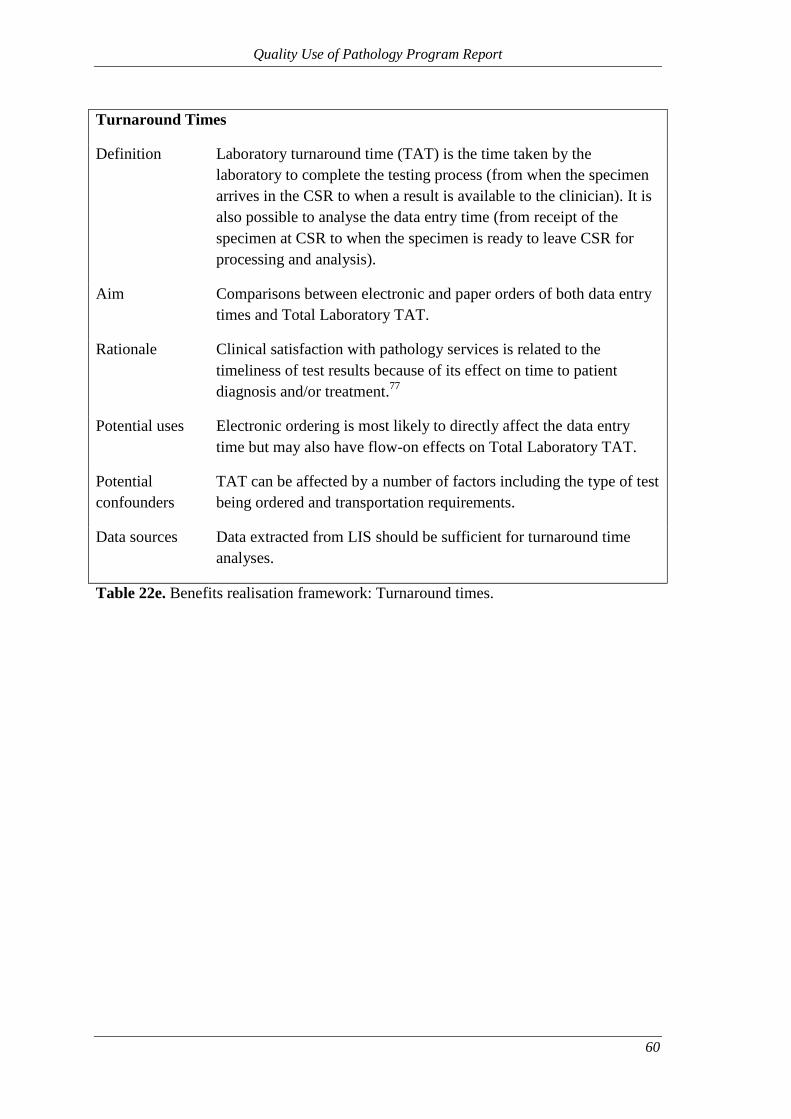
Quality Use of Pathology Program Report
60
Turnaround Times
Definition Laboratory turnaround time (TAT) is the time taken by the
laboratory to complete the testing process (from when the specimen
arrives in the CSR to when a result is available to the clinician). It is
also possible to analyse the data entry time (from receipt of the
specimen at CSR to when the specimen is ready to leave CSR for
processing and analysis).
Aim Comparisons between electronic and paper orders of both data entry
times and Total Laboratory TAT.
Rationale Clinical satisfaction with pathology services is related to the
timeliness of test results because of its effect on time to patient
diagnosis and/or treatment.77
Potential uses Electronic ordering is most likely to directly affect the data entry
time but may also have flow-on effects on Total Laboratory TAT.
Potential
confounders
TAT can be affected by a number of factors including the type of test
being ordered and transportation requirements.
Data sources Data extracted from LIS should be sufficient for turnaround time
analyses.
Table 22e. Benefits realisation framework: Turnaround times.

Quality Use of Pathology Program Report
61
Impact on patient outcomes (ED length of stay):
Definition Length of stay (LOS) represents the amount of time a patient remains
in ED from triage to discharge.
Aim To understand what factors associated with pathology testing play a
role in a patient’s LOS in the ED.
Rationale EDs are a high-activity and high-demand component of the
hospital.78
ED LOS is one of the major factors contributing to
hospital overcrowding53
and laboratory TAT is one of the many
contributing factors to ED LOS.79
Shorter stays in the EDs are also
indicative of efficient diagnosis and stabilisation of the patient
condition and, therefore, of the ED’s performance as a whole.47 80 81
Potential uses Quantifying benefits, in patient-experience terms, aids in the
resource-allocation strategies in the hospital.
Potential
confounders
Many ED visits will involve multiple pathology tests ordered across
multiple test order episodes. Each of those tests will influence more-
or-less strongly the clinicians’ diagnostic decision and treatment;
therefore, care should be taken to consider how analyses can utilise
the turnaround time of the decision-critical tests.
Data sources Analyses of the impact of various factors on length of stay in ED will
require a LIS dataset that has been linked with admission, discharge,
triage, and demographic data extracted from the EDIS.
Table 22f. Benefits realisation framework: Impact on patient outcomes (Length of stay
in ED).

Quality Use of Pathology Program Report
62
Appendix I – CSR error log sheet used for the paper-based documentation of
errors (in use until 21 September 2009)

Quality Use of Pathology Program Report
63
Appendix II – Daily summary log sheet for paper-based documentation of errors
(in use until 21 September 2009)

Quality Use of Pathology Program Report
64
Appendix III – Screenshot of the revised computerised error log interface showing
the list of possible error categories (in use from 1 March 2010)

Quality Use of Pathology Program Report
65
Appendix IV– A sample EMR test order form print-out which was manually
altered (requesting an additional Full Blood Count test), resulting in an “EMR test
order problem” error

Quality Use of Pathology Program Report
66
Appendix V – Screenshot of a duplicate order alert in the EMR

Quality Use of Pathology Program Report
67
Appendix VI – Flow diagram for handling of “handwritten request on an EMR order” errors in the CSR

Quality Use of Pathology Program Report
68
REFERENCES
1. Aller R, Georgiou A, Pantanowitz L. Electronic Health Records In: Pantanowitz L,
Tuthill JM, Balis UG, editors. Pathology Informatics Theory and Practice.
Canada: American Society for Clinical Pathology, 2012:217-30.
2. Forsman RW. Why is the laboratory an afterthought for managed care organizations?
Clinical Chemistry 1996;42(5):813-6.
3. Georgiou A, Westbrook JI. Computerised Physician Order Entry systems and their
effect on pathology laboratories. Hospital Information Technology Europe
2007;2007(Autumn):40-41.
4. Georgiou A, Williamson M, Westbrook J, Ray S. The impact of computerised
physician order entry systems on pathology services: a systematic review
International Journal of Medical Informatics 2007;76(7):514-29.
5. The Leapfrog Group for Patient Safety. Fact Sheet: Computerized Physician Order
Entry (CPOE) (2003) Available at:
www.leapfroggroup.org/media/file/Leapfrog-
Computer_Physician_Order_Entry_Fact_Sheet.pdf (Accessed 25 March 2010).
6. Mekhjian HS, Kumar RR, Kuehn L, Bentley TD, Teater P, Thomas A, et al.
Immediate benefits realized following implementation of physician order entry
at an academic medical center. Journal of the American Medical Informatics
Association 2002;9(5):529-39.
7. Becich MJ. Information management: moving from test results to clinical
information. Clinical Leadership & Management Review 2000;14(6):296-300.
8. Georgiou A, Westbrook J. Computerised order entry systems and pathology services
- a synthesis of the evidence. Clinical Biochemist Reviews 2006;27(2):79-87.
9. Price CP. Application of the principles of evidence-based medicine to laboratory
medicine. Clinica Chimica Acta 2003;333(2):147-54.
10. Black A, Car J, Pagliari C, Anandan C, Cresswell K, Bokun T, et al. The Impact of
eHealth on the Quality and Safety of Health Care: A Systematic Overview.
PLoS Medicine 2011;8(1).
11. Kaushal R, Shojania KG, Bates DW. Effects of Computerized Physician Order
Entry and Clinical Decision Support Systems on Medication Safety: A
Systematic Review Archives of Internal Medicine 2003;163(12):1409-16.
12. Kaplan B. Evaluating informatics applications - clinical decision support systems
literature review. International Journal of Medical Informatics 2001;64(1):15-
37.
13. Sim I, Gorman P, Greenes RA, Haynes RB, Kaplan B, Lehmann H, et al. Clinical
decision support systems for the practice of evidence-based medicine. Journal
of the American Medical Informatics Association 2001;8(6):527-34.
14. Georgiou A, Ampt A, Creswick N, Westbrook J, Braithwaite J. Computerized
provider order entry - what are health professionals concerned about? A
qualitative study in an Australian hospital International Journal of Medical
Informatics 2009;78(1):60-70.
15. Georgiou A, Westbrook J, Braithwaite J. Computerized provider order entry
systems–Research imperatives and organizational challenges facing pathology
services. Journal of Pathology Informatics 2010;1:11.
16. Bobb AM, Payne TH, Gross PA. Viewpoint: controversies surrounding use of order
sets for clinical decision support in Computerized Provider Order Entry. Journal
of the American Medical Informatics Association 2007;14(1):41-47.

Quality Use of Pathology Program Report
69
17. Garg AX, Adhikari NK, McDonald H, Rosas-Arellano MP, Devereaux PJ, Beyene
J, et al. Effects of computerized clinical decision support systems on practitioner
performance and patient outcomes: a systematic review. Journal of the
American Medical Association 2005;293(10):1223-38.
18. Georgiou A, Westbrook JI, Braithwaite J, Iedema R, Ray S, Forsyth R, et al. When
requests become orders - A formative investigation into the impact of a
Computerized Physician Order Entry system on a pathology laboratory service.
International Journal of Medical Informatics 2007;76(8):583-91.
19. Donabedian A. The quality of care. How can it be assessed? Journal of the
American Medical Association 1988;260(12):1743-8.
20. Scriven M. Evaluation Thesaurus (4th edition). Newbury CA: Sage, 1991.
21. Potter J. Standards of care for older people: an introduction to the issues. In: Potter
J, Georgiou A, Pearson M, editors. Measuring the quality of care for older
people. London: Royal College of Physicians, 2000:3-19.
22. South Eastern Sydney IIlawarra NSW Health. Our people and their health
(Available at:
http://www.sesiahs.health.nsw.gov.au/Publications/People_and_Health/Our_Peo
ple_and_Their_Health.pdf) Accessed: 5 April 2011, 2011.
23. Tetrault GA. Clinical laboratory quality assurance. In: Henry JBE, editor. Clinical
Diagnosis and Management by Laboratory Methods. Philadelphia: WB
Saunders Company, 2001:148-58.
24. Plebani M, Carraro P. Mistakes in a stat laboratory: types and frequency. Clinical
Chemistry 1997;43(8 Pt 1):1348-51.
25. Burnett L, Chesher D, Mudaliar Y. Improving the quality of information on
pathology request forms. Annals of Clinical Biochemistry 2004;41:53-56.
26. Kessimian N, DeLellis R. Contributions of pathology and laboratory medicine to
the patient saftey movement. Medicine and Health Rhode Island
2005;88(7):216-19.
27. Scarselletta M. The Infamous "Lab Error": Education, Skill, and Quality in Medical
Technicians' Work. In: Barley SR, Orr JE, editors. Between Craft and Science;
Technical Work in U.S. Settings. Ithaca: Cornell University Press, 1997:187-
209.
28. Bonini P, Plebani M, Ceriotti F, Rubboli F. Errors in laboratory medicine. Clinical
Chemistry 2002;48(5):691-8.
29. Hollensead SC, Lockwood WB, Elin RJ. Errors in pathology and laboratory
medicine: consequences and prevention. Journal of Surgical Oncology
2004;88(3):161-81.
30. Royal College of Pathologists of Australasia Quality Assurance Programs Pty
Limited. Key Incident Monitoring & Management Systems (KIMMS).
Available at: www.rcpaqap.com/kimms/history.cfm Accessed 7 February 2012.
31. Potter J, Georgiou A, Pearson M. Measuring the quality of care for older people.
London: Royal College of Physicians, 2000.
32. Crolla LJ, Stiffler PW, Vacca S, McNear S. The Laboratory Manager: Role in
Compliance, Organizational Structure, and Financial Management. In:
Lewandrowski K, editor. Clinical Chemistry - Laboratory Management and
Clinical Correlations. Philadelphia: Lippincott Williams & Wilkins, 2002:51-
63.
33. Vecellio E, Georgiou A, Toouli G, Westbrook JI. Volume, rates, source and types
of add-on pathology test requests across five hospitals. Clinical Chemistry and
Laboratory Medicine 2012;50(6):1041-8.

Quality Use of Pathology Program Report
70
34. Melanson SF, Hsieh B, Flood JG, Lewandrowski KB. Evaluation of add-on testing
in the clinical chemistry laboratory of a large academic medical center:
operational considerations. Archives of Pathology & Laboratory Medicine
2004;128(8):885-89.
35. Melanson S, Flood J, Lewandrowski K. Add-on testing in the clinical laboratory:
observations from two large academic medical centers. Laboratory Medicine
2006;37(11):675-78.
36. Osheroff JA, Teich JM, Middleton B, Steen EB, Wright A, Detmer DE. A Roadmap
for National Action on Clinical Decision Support, 2007:141-45.
37. Osheroff JA, Pifer EA, Teich JM, Sittig DF, Jenders RA. Improving Outcomes with
Clinical Decision Support: An Implementer's Guide. Chicago: Healthcare
Information and Management Systems Society, 2005.
38. National Coalition of Public Pathology. Encouraging Quality Pathology Ordering
in Australia's Public Hospitals: National Coalition of Public Pathology, 2012.
39. Kim JY, Kamis IK, Singh B, Batra S, Dixon RH, Dighe AS. Implementation of
computerized add-on testing for hospitalized patients in a large academic
medical center. Clinical Chemistry and Laboratory Medicine 2011;49(5):845-
50.
40. Queensland Health Pathology and Scientific Services. AUSLAB Retest Interval
Project - Project Report Final; Available at:
http://www.health.gov.au/internet/main/publishing.nsf/Content/9B6B7B4EAAC
0383DCA256F180048CCBD/$File/AUSLABExtensionV2Dec04.pdf Accessed:
22 February 2012, 2004.
41. Sharma A, Salzmann M. The effect of automated test rejection on repeat requesting.
Journal of Clinical Pathology 2007;60(8):954-55.
42. Hawkins H, Hankins R, Johnson E. A computerized physician order entry system
for the promotion of ordering compliance and appropriate test utilization.
Journal of Healthcare Information Management 1999;13(3):63-72.
43. Manor P. Turnaround times in the laboratory: a review of the literature. Clinical
Laboratory Science 1999;12(2):85-89.
44. Hawkins RC. Laboratory turnaround time. Clinical Biochemist Reviews
2007;28:179-94.
45. Steindel SJ, Howanitz PJ. Physician satisfaction and emergency department
laboratory test turnaround time. Archives of Pathology & Laboratory Medicine
2001;125(7):863-71.
46. Westbrook JI, Georgiou A, Lam M. Does computerised provider order entry reduce
test turnaround times? A before-and-after study at four hospitals. In: Adlassnig
K-P, Blobel B, Mantas J, Masic I, editors. Medical informatics in a united and
healthy Europe: proceedings of MIE 2009. Amsterdam: IOS Press, 2009:527-
31.
47. Francis A, Ray M, Marshall M. Pathology processes and the emergency department
length of stay: the impact of change. Medical Journal of Australia
2009;190(12):665-69.
48. Bureau of Health Information. Hospital Quarterly: Performance of NSW public
hospitals, July to September 2011. Emergency Departments 2(3). Sydney, NSW,
2011.
49. StataCorp. Stata Statistical Software: Release 12.: College Station, TX: StataCorp
LP, 2011.
50. Wilson ML. Appropriate use of clinical microbiology tests. Clinics in Laboratory
Medicine 2002;22(2):491-503.

Quality Use of Pathology Program Report
71
51. van Walraven C, Naylor CD. Do we know what inappropriate laboratory utilization
is? A systematic review of laboratory clinical audits. Journal of the American
Medical Association 1998;280(6):550-8.
52. Shahangian S, Snyder SR. Laboratory medicine quality indicators. American
Journal of Clinical Pathology 2009;131(3):418-31.
53. Sinnott MJ. Access block viewed as a medical model. Medical Journal of Australia.
2004;181(3):172-3.
54. Sprivulis PC, Da Silva J, Jacobs IG, Frazer ARL, Jelinek GA. The association
between hospital overcrowding and mortality among patients admitted via
Western Australian emergency departments. Medical Journal of Australia
2006;184(5):208-212.
55. Ammenwerth E, Brender J, Nykanen P, Prokosch HU, Rigby M, Talmon J, et al.
Visions and strategies to improve evaluation of health information systems.
Reflections and lessons based on the HIS-EVAL workshop in Innsbruck.
International Journal of Medical Informatics 2004;73(6):479-91.
56. NHS Institute for Innovation and Improvement. The Good Indicators Guide:
Understanding how to use and choose indicators. Available at
http://www.institute.nhs.uk/index.php?option=com_joomcart&main_page=docu
ment_product_info&products_id=372&cPath=65 (Accessed 13 June 2012),
2007.
57. Sackett DL, Rosenberg WM, Gray JA, Haynes RB, Richardson WS. Evidence
based medicine: what it is and what it isn't. British Medical Journal
1996;312(7023):71-2.
58. Review of NHS Pathology Services in England. Report of the Review of NHS
Pathology Services in England. 2006. Available at:
http://www.dh.gov.uk/en/Publicationsandstatistics/Publications/PublicationsPoli
cyAndGuidance/DH_4137606 (Accessed 13 June 2012).
59. McCay L, Lemer C, Wu AW. Laboratory safety and the WHO World Alliance for
Patient Safety. Clinica Chimica Acta 2009;404(1):6-11.
60. Bates D, Kuperman G, Rittenberg M, Teich J, Fiskio J, Ma'luf N, et al. A
randomized trial of a computer-based intervention to reduce utilization of
redundant laboratory tests. American Journal of Medicine 1999;106(2):144-50.
61. Bates DW, Boyle DL, Rittenberg E, Kuperman GJ, Ma'Luf N, Menkin V, et al.
What proportion of common diagnostic tests appear redundant? American
Journal of Medicine 1998;104(4):361-8.
62. Bates DW, Kuperman GJ, Jha A, Teich JM, Orav EJ, Ma'luf N, et al. Does the
computerized display of charges affect inpatient ancillary test utilization?
Archives of Internal Medicine 1997;157(21):2501-08.
63. Hunt DL, Haynes RB, Hanna SE, Smith K. Effects of Computer-Based Clinical
Decision Support Systems on Physician Performance and Patient Outcomes: A
Systematic Review 10.1001/jama.280.15.1339. Journal of the American
Medical Association 1998;280(15):1339-46.
64. Friedman CP, Elstein AS, Wolf FM, Murphy GC, Franz TM, Heckerling PS, et al.
Enhancement of Clinicians' Diagnostic Reasoning by Computer-Based
Consultation: A Multisite Study of 2 Systems 10.1001/jama.282.19.1851.
Journal of the American Medical Association 1999;282(19):1851-56.
65. Birkmeyer CM, Lee J, Bates DW, Birkmeyer JD. Will electronic order entry reduce
health care costs? Effective Clinical Practice 2002;5(2):67-74.

Quality Use of Pathology Program Report
72
66. Koppel R, Metlay JP, Cohen A, Abaluck B, Localio AR, Kimmel SE, et al. Role of
Computerized Physician Order Entry systems in facilitating medication errors.
Journal of the American Medical Association 2005;293(10):1197-203.
67. Peute LWP, Jaspers MWM. The significance of a usability evaluation of an
emerging laboratory order entry system. International Journal of Medical
Informatics 2007;76(2-3):157-68.
68. Hammett R, Harris R. Halting the growth in diagnostic testing. Medical Journal of
Australia 2002;177(3):124-24.
69. Bunting P, van Walraven C. Effect of a controlled feedback intervention on
laboratory test ordering by community physicians. Clinical Chemistry
2004;50(2):321-6.
70. Kaplan B. Evaluating informatics applications - some alternative approaches:
theory, social interactionism, and call for methodological pluralism.
International Journal of Medical Informatics 2001;64(1):39-56.
71. Khoury M, Burnett L, Mackay MA. Error rates in Australian chemical pathology
laboratories. Medical Journal of Australia 1996;165:128-30.
72. National Association of Testing Authorities Australia. RCPA/NATA Accredited
Medical Testing Facilities Available at: http://www.nata.asn.au/latest-news/322-
rcpanata-accredited-medical-testing-facilities Accessed: 29 May 2012.
73. Axt-Adam P, van der Wouden JC, van der Does E. Influencing behavior of
physicians ordering laboratory tests: a literature study. Medical Care
1993;31(9):784-94.
74. Valenstein P. Managing physician use of laboratory tests. Clinics in Laboratory
Medicine 1996;16(3):749-71.
75. Lam M, Georgiou A, Westbrook JI. Record linkage - a method to generate an
enriched dataset for the study of CPOE systems on test turnaround time. Health
Informatics Conference Melbourne, Australia: Health Informatics Society of
Australia., 2008.
76. van Walraven C, Raymond M. Population-based study of repeat laboratory testing.
Clinical Chemistry 2003;49(12):1997-2005.
77. Howanitz JH, Howanitz PJ. Laboratory results. Timeliness as a quality attribute and
strategy. American Journal of Clinical Pathology 2001;116(3):311-5.
78. Institute of Medicine. Hospital-Based Emergency Care - At the Breaking Point.
Washington D.C.: The National Academies Press, 2007.
79. Chan L, Reilly KM, Salluzzo RF. Variables that affect patient throughput times in
an academic emergency department. American Journal of Medical Quality
1997;12(4):183-6.
80. Steindel SJ, Howanitz PJ. Physician satisfaction and emergency department
laboratory test turnaround time. 2009.
81. Georgiou A, Westbrook JI. Pathology processes and emergency department length
of stay: the impact of change. Medical Journal of Australia 2009;191(6):359.


Centre for Health Systems and Safety Research
Faculty of Medicine
University of New South Wales
Level 1, AGSM Building
UNSW Sydney 2052, Australia
T +61 (2) 9385 3964
F +61 (2) 9385 8280
www.aihi.unsw.edu.au/chssr
Related Documents