Welcome message from author
This document is posted to help you gain knowledge. Please leave a comment to let me know what you think about it! Share it to your friends and learn new things together.
Transcript


This page intentionally left blank.

To the residents, elected officials, management, and stakeholders of the City of Gahanna,
At the request of the City Council, a performance audit of the City of Gahanna was initiated on July 25, 2016, with funding provided through the Leverage for Efficiency, Accountability and Performance (LEAP) Fund. The functional areas assessed in the performance audit were: Administration, Financial Management and Governance; Public Safety; and Public Services. These areas were selected because they are important components of City operations that support its mission. Improvements in these areas can assist in enhancing the efficiency and effectiveness of the City.
The City has been encouraged to use the management information and recommendations contained in the performance audit report. However, it is also encouraged to perform its own assessment of operations and develop alternative management strategies independent of the performance audit report.
Gahanna is already fiscally healthy, as evident in the Financial Health Indicators (FHI).
Specifically, the City’s FHI showed 16 of 17 indicators had a “positive” outlook. One indicator was “cautionary.” The indicators rely on five years of financial data, with the most recent being 2015.
City leaders may want to visit SkinnyOhio.org for ideas on becoming more efficient. The website, http://www.skinnyohio.org, is a resource providing links to previous performance audit reports, information on leading practice approaches, news on recent shared services examples, the Shared Services Idea Center, and other useful resources such as the Local Government Toolkit. The site is a great resource, including the Shared Services Idea Center – a searchable database allowing users to quickly sort through shared services examples across Ohio.
This performance audit report can be accessed online through the Auditor of State’s website at http://www.ohioauditor.gov and choosing the “Search” option. Sincerely, Dave Yost Auditor of State August 10, 2017
srbabbitt
Yost Signature

This page intentionally left blank.

City of Gahanna Performance Audit
Table of Contents Executive Summary ...................................................................................................................... 1
Purpose and Scope of the Audit .................................................................................................. 1
Performance Audit Overview ..................................................................................................... 1
Audit Methodology ..................................................................................................................... 1
Issues for Further Study .............................................................................................................. 3
Summary of Recommendations .................................................................................................. 4
1. City Overview ............................................................................................................................ 5
2. City Administration ................................................................................................................ 11
R2.1 Develop an indirect cost allocation plan for City support services .............................. 12
R2.2 Bring employer insurance costs in line with benchmarks ............................................ 16
3. Collective Bargaining.............................................................................................................. 22
R3.1 Reduce leave accrual .................................................................................................... 24
R3.2 Bring sick leave severance pay in line with peers ........................................................ 26
R3.3 Consider adjusting police overtime standards .............................................................. 27
R3.4 Consider adjusting police holiday overtime ................................................................. 29
4. Public Safety ............................................................................................................................ 31
R4.1 Develop a data-driven staffing plan for patrol officers ................................................ 34
R4.2 Develop a data-driven staffing plan for the Detective Bureau ..................................... 46
R4.3 Reduce police dispatch overtime.................................................................................. 51
5 Public Service ........................................................................................................................... 57
R5.1 Bring Service Garage staffing in line with benchmarks .............................................. 60
6. Parks and Recreation ............................................................................................................. 63
R6.1 Incorporate full cost/benefit evaluation into Parks subsidy policy .............................. 65
R6.2 Consider alternative service delivery options for the Senior Center ............................ 68
R6.3 Take action to improve financial performance of the pools......................................... 70
Appendix A: Scope and Objectives ........................................................................................... 76
Appendix B: Police Workload Comparisons ............................................................................ 77
Client Response ........................................................................................................................... 87
.
City of Gahanna Performance Audit
Page 1
Executive Summary Purpose and Scope of the Audit The City of Gahanna (Gahanna or the City) requested a performance audit from the Auditor of State (AOS) using the Leverage for Efficiency, Accountability, and Performance (LEAP) Program. On August 2, 2016, the City signed a letter of engagement (LOE) requesting the Ohio Performance Team (OPT) identify opportunities to improve the economy, efficiency, and effectiveness of the following initial scope areas: Administration, Financial Management, and Governance; Public Safety; and Public Services. Gahanna’s population growth and General Fund revenue were relatively flat between 2010 and 2015, leading to a concern that the City could have a difficult time weathering another recession. Due to this concern, the City requested a performance audit to identify methods of increasing efficiency and effectiveness in its services. During the initial planning process, initial scope areas were developed into final scope areas. See Appendix A: Scope and Objectives for detailed objectives developed to assess operations in each scope area. Audit work was conducted within each scope area to address the detailed objectives and, where warranted, to develop recommendations for improvement. Performance Audit Overview Performance audits provide objective analysis to assist management and those charged with governance and oversight to improve program performance and operations, reduce costs, facilitate decision making by parties with responsibility to oversee or initiate corrective action, and contribute to public accountability. The United States Government Accountability Office develops and promulgates Government Auditing Standards that establish a framework for performing high-quality audit work with competence, integrity, objectivity, and independence to provide accountability and to help improve government operations and services. These standards are commonly referred to as Generally Accepted Government Auditing Standards (GAGAS). OPT conducted this performance audit in accordance with GAGAS. These standards required that OPT plan and perform the audit to obtain sufficient, appropriate evidence to provide a reasonable basis for findings and conclusions based on the audit objectives. OPT believes that the evidence obtained provides a reasonable basis for our findings and conclusions based on the audit objectives. Audit Methodology To complete this performance audit, auditors gathered data, conducted interviews with numerous individuals associated with the areas of City operations included in the audit scope, and reviewed

City of Gahanna Performance Audit
Page 2
and assessed information. Assessments were performed using criteria from a number of sources, including:
• Peer cities; • Industry standards; • Leading practices; • Ordinances; and • Policies and procedures.
In consultation with the City, a set of peer cities were selected for comparisons contained in this report. This selection was based on the following factors:
• Geographic Proximity – macro factors including overall economic growth and crime trends tend to impact across regions, so comparisons were limited to cities in or adjacent to Franklin County, where Gahanna is located;
• Government Type – limited to charter cities.1 In addition, a mix of city manager and mayor-council governments was selected because Gahanna has a mixed system with both an elected mayor and appointed city administrator;
• Services – limited to cities with police and parks and recreation departments, because the City provides these services and expressed an interest in seeing comparisons to those operational areas; and
• Population – population is major variable in city operations, so comparisons were limited to cities with populations greater than 30,000 and less than 40,000. Gahanna’s population is 34,590 as of 2015.
Table 1 shows the peer set selected using the above parameters.
Table 1: Peer Cities City County Government Type Population
Delaware Delaware City Manager 37,995 Grove City Franklin Mayor-Council 39,388 Hilliard Franklin Mayor-Council 33,649 Reynoldsburg Franklin Mayor-Council 37,158 Upper Arlington Franklin City Manager 34,907 Westerville Franklin City Manager 38,384 Source: Ohio Municipal League and the U.S. Census Bureau Where reasonable and appropriate, this peer set was used as a basis of comparison. However, in some operational areas, industry standards or leading practices were used for primary comparison. Sources of industry standards or leading practices used include: the Central Ohio Young Men’s Christian Association (YMCA); Charlotte County, Florida; Cigna Health Insurance; the City of Whitehall, Ohio; the Commission on Accreditation for Law Enforcement
1 A charter allows an Ohio city to adopt its own form of government and practice home rule within the bounds of Article XVIII, § 7 of the Ohio Constitution and Ohio Revised Code § 701.5.

City of Gahanna Performance Audit
Page 3
Agencies (CALEA); the County of San Diego, California; the Federal Fair Labor Standards Act (FLSA); the International City/County Management Association (ICMA); MAXUS Consulting Services; Michigan State University; the National Incident-Based Reporting System (NIBRS); the Ohio Department of Public Safety Office of Criminal Justice Services (OCJS); the State Employment Relations Board (SERB); the United States Department of Justice (DOJ); and the United States Department of Labor (DOL). The performance audit involved information sharing with the City, including drafts of findings and recommendations related to the identified audit areas. Periodic status meetings throughout the engagement informed the City of key issues impacting selected areas, and shared proposed recommendations to improve operations. The City provided verbal and written comments in response to various recommendations, which were taken into consideration during the reporting process. AOS and OPT express their appreciation to the management and employees of City of Gahanna for their cooperation and assistance throughout this audit. Issues for Further Study Issues are sometimes identified by AOS that are not related to the objectives of the audit but could yield economic, efficiency, and/or operational improvements if examined in more detail. The following issue for further study was identified during the course of the audit. Dispatch Staffing: Before hiring additional dispatchers, Gahanna should consider working in conjunction with other cities to coordinate schedules in such a way as to avoid shift-coverage overtime. The City has the technological capability of sharing dispatch call volume with the cities of Bexley, New Albany, Reynoldsburg, and Whitehall. This technology has historically been used for coverage in emergencies or unusual situations, but has not yet been used to optimize staffing across the five cities. In addition to utilizing current technology, the City and potential partners should consider the following factors when evaluating potential areas of cooperation with the partner cities:
• Staffing; • Call load and call type; and • Dispatch scheduling.

City of Gahanna Performance Audit
Page 4
Summary of Recommendations The following table summarizes the performance audit recommendations.
Table 2: Summary of Recommendations Recommendations Savings
R2.1 Develop an indirect cost allocation plan for City support services N/A R2.2 Bring employer insurance costs in line with benchmarks $396,200 R3.1 Reduce leave accrual N/A R3.2 Reduce sick leave payout N/A R3.3 Consider adjusting police overtime standards N/A R3.4 Consider adjusting police holiday overtime N/A R4.1 Develop a data-driven staffing plan for patrol officers N/A R4.2 Develop a data-driven staffing plan for the detective bureau N/A R4.3 Reduce police dispatch overtime $11,400 R5.1 Bring Service Garage staffing in line with benchmarks $44,140 R6.1 Incorporate full cost/benefit evaluation in subsidy policy N/A R6.2 Consider alternative service delivery options for the Senior Center N/A R6.3 Take action to improve financial performance of the pools $199,600 Total Savings $651,340
City of Gahanna Performance Audit
Page 5
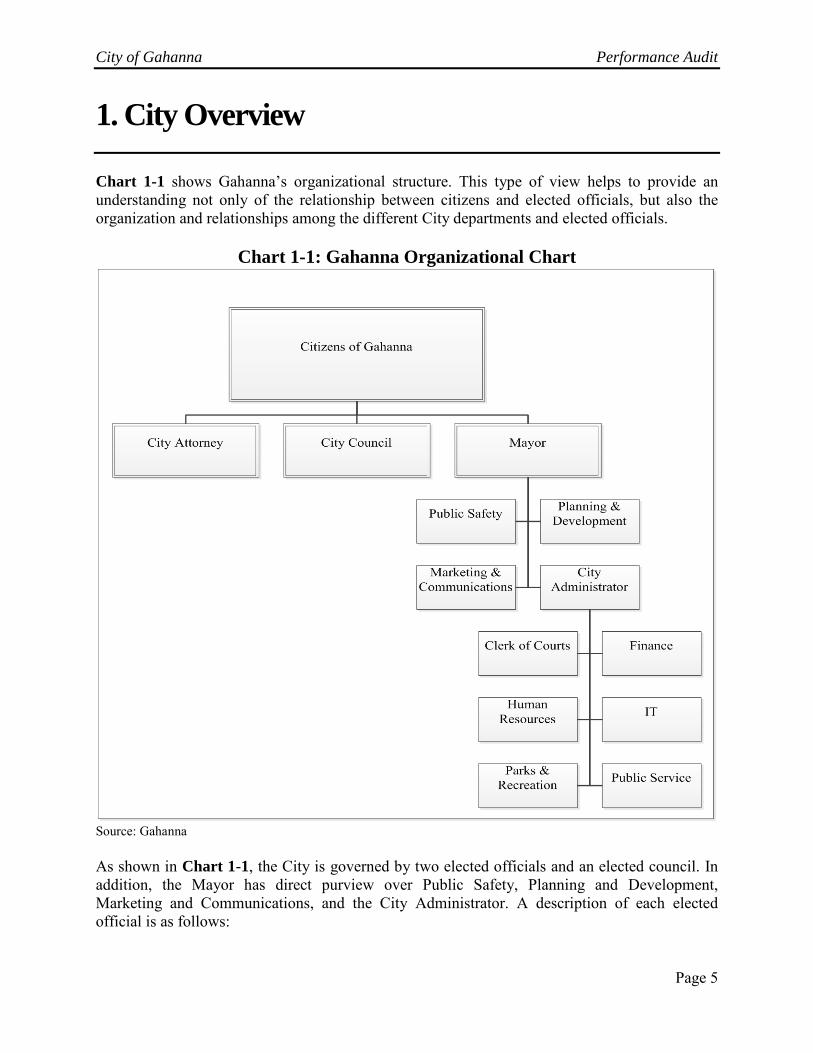
1. City Overview Chart 1-1 shows Gahanna’s organizational structure. This type of view helps to provide an understanding not only of the relationship between citizens and elected officials, but also the organization and relationships among the different City departments and elected officials.
Chart 1-1: Gahanna Organizational Chart
Source: Gahanna As shown in Chart 1-1, the City is governed by two elected officials and an elected council. In addition, the Mayor has direct purview over Public Safety, Planning and Development, Marketing and Communications, and the City Administrator. A description of each elected official is as follows:
City of Gahanna Performance Audit
Page 6
Elected Officials: • Mayor – elected to a four-year term and has the power to appoint all department heads,
members of boards and commissions, and any other position created by City Council. In addition, the Mayor has the power to veto Council resolutions. The Mayor’s Office includes the City Administrator and the Safety Director.
• City Council (Council) – composed of seven members, including four ward representatives and three at-large representatives. Members are elected to four-year terms, with elections held in alternating years.
• City Attorney – elected to a four-year term and handles all legal representation for the City as well as additional tasks assigned by Council.
Courts:
• Clerk of Courts – includes the Mayor’s Court which adjudicates cases involving misdemeanor offenses.
Administrative Departments:
• Finance Department (Finance) – responsible for completing the city budget, processing payroll, and overseeing all City purchases (see R2.1).
• Human Resources (HR) – oversees the hiring and separation of City employees as well as administering employee benefits and negotiating collective bargaining agreements (see R2.1).
• Marketing and Communications – leads planning, development, implementation and measurement of communications, and related activity for the City.
• Parks and Recreation (Parks) – responsible for the maintenance of all City-owned park land as well as the operation of the pools, Senior Center, Gahanna Municipal Golf Course (the golf course), Herb Center, and recreational programming (see R6.1, R6.2, and R6.3).
• Planning and Development Department (Planning) – assists with planning and economic growth.
• Public Safety (Police) – provides 24-hour law enforcement and dispatch service for the City (see R4.1, R4.2, and R4.3).
• Public Service and Engineering (Service) – provides maintenance for roads, water, sewer, and storm sewer lines. In addition, Service maintains City-owned vehicles (see R5.1) and bills for utility services.
• Technology (IT) – provides support for City-owned technology, including computer endpoints and enterprise systems.
City of Gahanna Performance Audit
Page 7
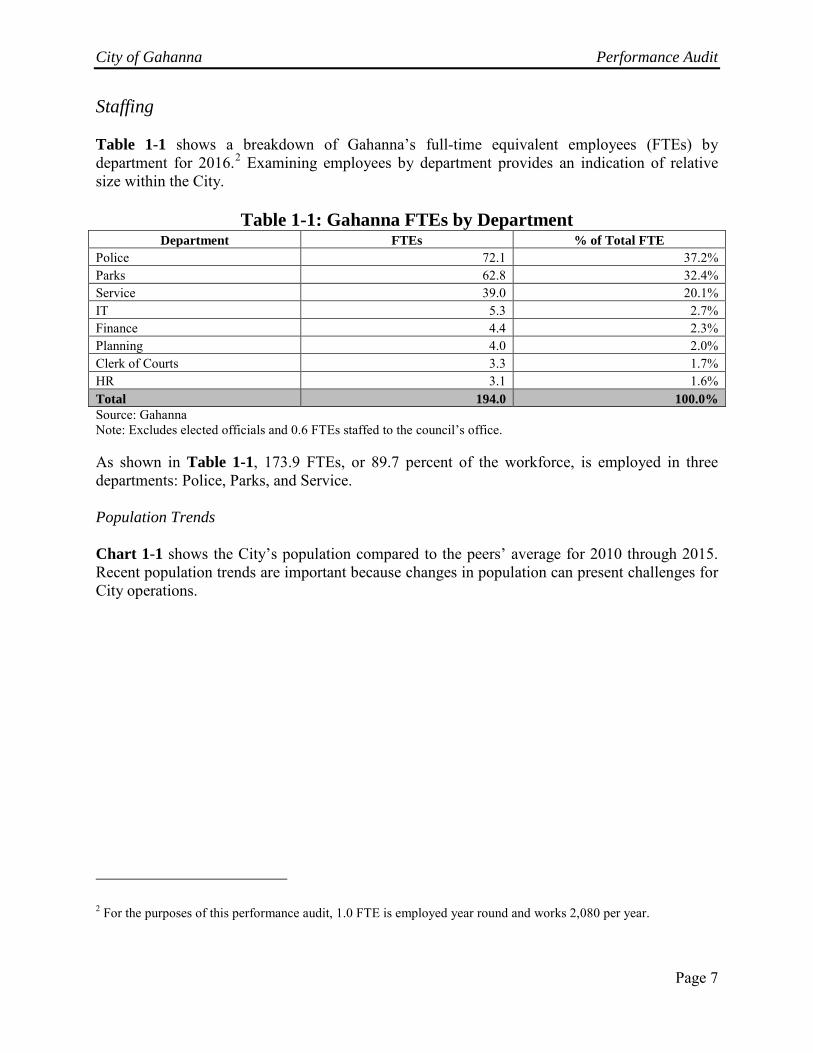
Staffing Table 1-1 shows a breakdown of Gahanna’s full-time equivalent employees (FTEs) by department for 2016.2 Examining employees by department provides an indication of relative size within the City.
Table 1-1: Gahanna FTEs by Department Department FTEs % of Total FTE
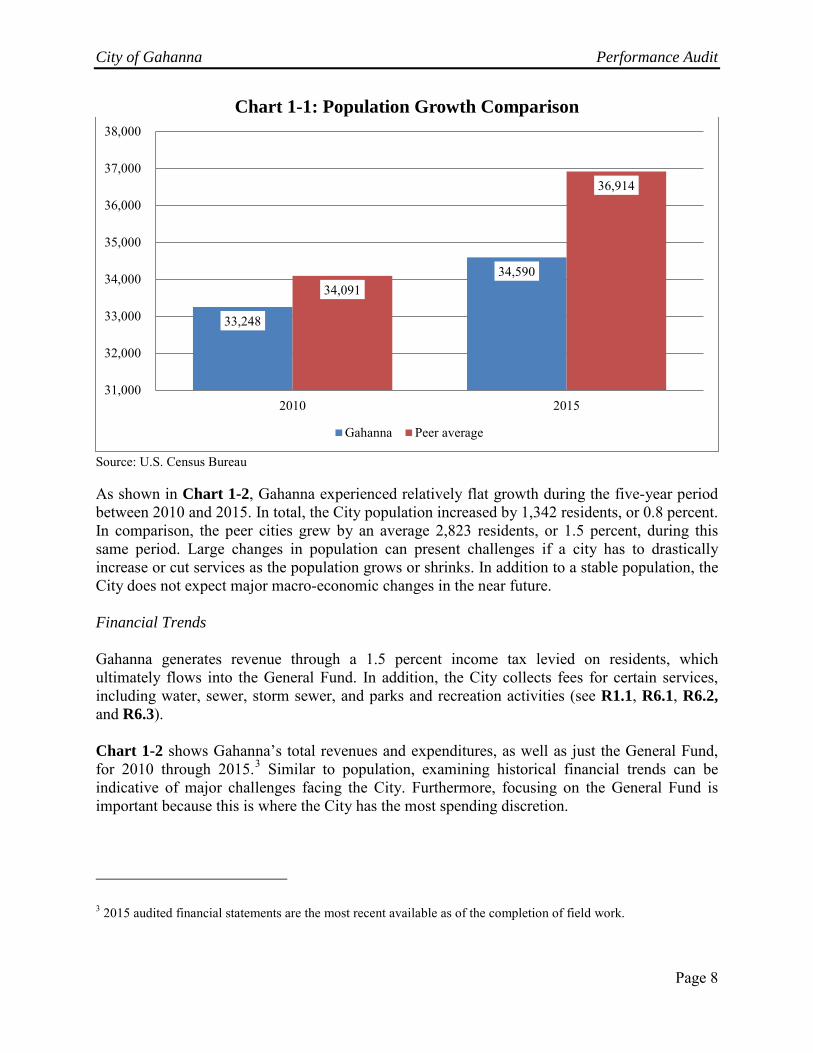
Police 72.1 37.2% Parks 62.8 32.4% Service 39.0 20.1% IT 5.3 2.7% Finance 4.4 2.3% Planning 4.0 2.0% Clerk of Courts 3.3 1.7% HR 3.1 1.6% Total 194.0 100.0% Source: Gahanna Note: Excludes elected officials and 0.6 FTEs staffed to the council’s office. As shown in Table 1-1, 173.9 FTEs, or 89.7 percent of the workforce, is employed in three departments: Police, Parks, and Service. Population Trends Chart 1-1 shows the City’s population compared to the peers’ average for 2010 through 2015. Recent population trends are important because changes in population can present challenges for City operations.
2 For the purposes of this performance audit, 1.0 FTE is employed year round and works 2,080 per year.
City of Gahanna Performance Audit
Page 8
Chart 1-1: Population Growth Comparison
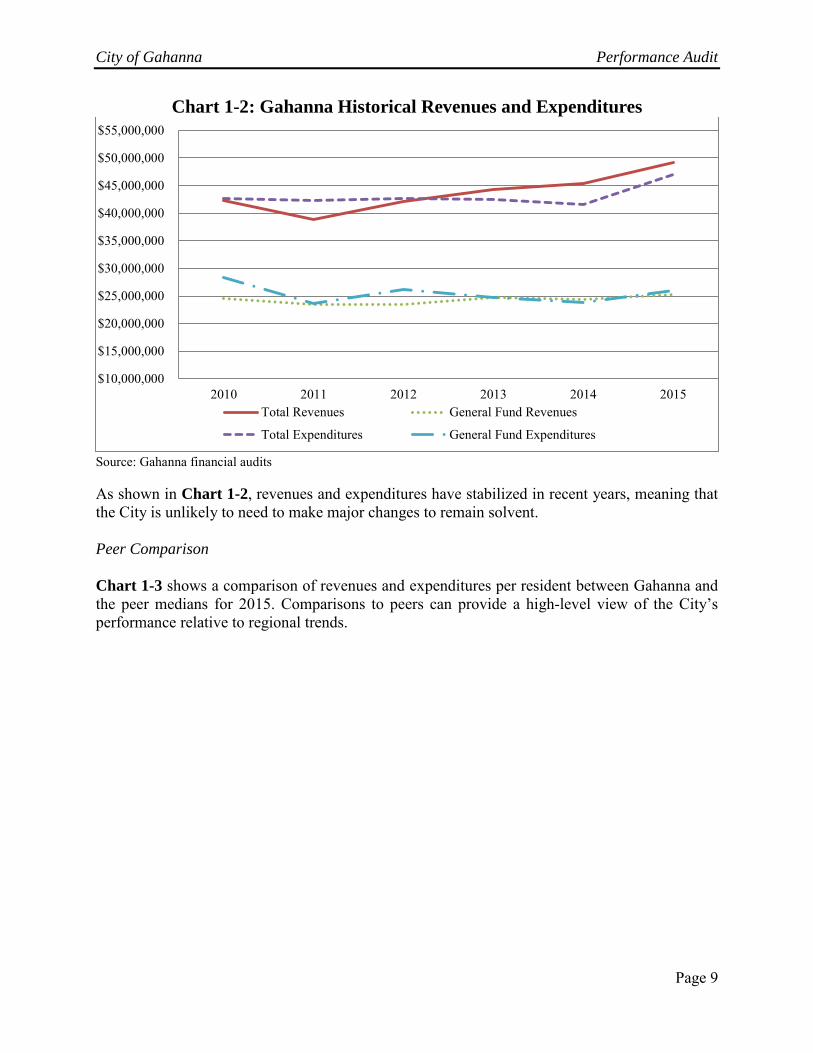
Source: U.S. Census Bureau As shown in Chart 1-2, Gahanna experienced relatively flat growth during the five-year period between 2010 and 2015. In total, the City population increased by 1,342 residents, or 0.8 percent. In comparison, the peer cities grew by an average 2,823 residents, or 1.5 percent, during this same period. Large changes in population can present challenges if a city has to drastically increase or cut services as the population grows or shrinks. In addition to a stable population, the City does not expect major macro-economic changes in the near future. Financial Trends Gahanna generates revenue through a 1.5 percent income tax levied on residents, which ultimately flows into the General Fund. In addition, the City collects fees for certain services, including water, sewer, storm sewer, and parks and recreation activities (see R1.1, R6.1, R6.2, and R6.3). Chart 1-2 shows Gahanna’s total revenues and expenditures, as well as just the General Fund, for 2010 through 2015.3 Similar to population, examining historical financial trends can be indicative of major challenges facing the City. Furthermore, focusing on the General Fund is important because this is where the City has the most spending discretion.
3 2015 audited financial statements are the most recent available as of the completion of field work.
33,248
34,590 34,091
36,914
31,000
32,000
33,000
34,000
35,000
36,000
37,000
38,000
2010 2015
Gahanna Peer average
City of Gahanna Performance Audit
Page 9
Chart 1-2: Gahanna Historical Revenues and Expenditures
Source: Gahanna financial audits As shown in Chart 1-2, revenues and expenditures have stabilized in recent years, meaning that the City is unlikely to need to make major changes to remain solvent. Peer Comparison Chart 1-3 shows a comparison of revenues and expenditures per resident between Gahanna and the peer medians for 2015. Comparisons to peers can provide a high-level view of the City’s performance relative to regional trends.
$10,000,000
$15,000,000
$20,000,000
$25,000,000
$30,000,000
$35,000,000
$40,000,000
$45,000,000
$50,000,000
$55,000,000
2010 2011 2012 2013 2014 2015Total Revenues General Fund Revenues
Total Expenditures General Fund Expenditures

City of Gahanna Performance Audit
Page 10
Chart 1-3: Revenues and Expenditures Comparison
Source:Gahanna and peer financial audits and the US Census Bureau As shown in Chart 1-3, Gahanna was more effective at maintaining fiscal stability per resident, with revenues per resident exceeding expenditures by $95.30, or 10.8 percent. This compares favorably to the peers, where this spread was $66.94, or 5.6 percent. The City’s 2017 Proposed Budget states that excess funds “…will be used strategically at the direction of the Mayor and Council to provide for current and future City needs”. Overall, Gahanna has been able to restore and effectively maintain fiscal stability relative to peers. The City may be benefiting from slow, but steady population growth. The City has the opportunity to review certain areas of operations that would offer significant coverage (e.g. employees and budget) to ensure operations are efficient and effective.
$973.87
$1,197.49
$878.57
$1,130.55
$0
$200
$400
$600
$800
$1,000
$1,200
$1,400
Gahanna Peer Median
Dol
lar
per
Res
iden
t
Revenues per Resident Expenditures per Resident

City of Gahanna Performance Audit
Page 11
2. City Administration Background Gahanna has three departments that provide support services to the public, elected officials, and other departments. These support service departments include:
• HR – HR’s mission statement notes that it “…serves as a Strategic Partner within the City of Gahanna by being an Employer of Choice to attract, sustain, and inspire passionate people committed to serving the public.” HR accomplishes this mission under the direction of 1.0 FTE Director of Human Resource and 2.0 FTE support personnel. HR supports other City departments by: recruiting, hiring, and separating employees; negotiating collective bargaining agreements (CBAs); and by handling employee benefits, including health insurance and workers’ compensation. City leadership estimates that HR resources are evenly split across hirings and separations, negotiations, and benefits administration.
• IT – IT is responsible for “…planning, developing, integrating, implementing, and
protecting all aspects of technology used by the City’s internal staff and departments as well as programs used by the public to access important information about the City and the services the City provides.” IT accomplishes its mission by staffing 1.0 FTE Director and 4.3 FTE support personnel. IT is responsible for maintaining 200 physical computer endpoints, dispersed across 10 fixed locations with an additional 22 mobile units in police cruisers, and 22 enterprise systems. City leadership estimates that IT resources are evenly split between computer endpoints and enterprise systems.
• Finance – Gahanna’s website states that it is “…committed to fiscal accountability
and transparency with its budget and financial information.” Finance supports this by overseeing cash management, debt administration, income tax administration, accounts payable, accounts receivable, and payroll processing. Finance is headed by 1.0 FTE Director of Finance and 3.4 FTE support personnel. Also, City departments present an annual budget to Finance, which is then incorporated into the City-wide budget and approved by a vote of Council. Department budgets include an estimate of expenditures, including staff and employee benefits for the coming year. City leadership estimates that Finance resources are evenly split across payroll, accounts payable, and budgeting.
In 2016, HR, IT, and Finance collectively expended a total of approximately $1.8 million for all operating costs including salaries, benefits, and supplies and materials.

City of Gahanna Performance Audit
Page 12
Recommendations R2.1 Develop an indirect cost allocation plan for City support services Broadly, costs for any service or activity can be broken down into three types:
• Direct – Code of Federal Regulation § 200.413 define these as costs “… that can be identified specifically with a particular final cost objective…” Examples include the salaries and benefits of an employee who works on a specific project, as well as materials used to complete a specific project.
• Indirect – A Guide for Indirect Cost Rate Determination (US Department of Labor (DOL), 2016) defines these as “…costs incurred for common or joint objectives”. Examples include administrative or clerical support tasks.
• Opportunity – Principles of Microeconomics states that, “An opportunity cost of an action is what you must give up when you make that choice” (Mankiw, 2000). For example, the amount of time an employee spends on a given task is time that cannot be spent on another task.
In order to cover the indirect cost of the support services provided by HR, Finance, and IT, the City charges the enterprise funds (i.e., Water, Sewer, and Storm Water) a flat 6.5 percent fee per quarter. In 2016, the City charged these enterprise funds with a total of $187,655 for the indirect cost of support services. However, while all other departments receive similar support services, the City does not have a policy or process in place to identify and recover these indirect costs. Table 2-1 shows 2016 expenditures for the HR, Finance, and IT departments, plus the costs that are recovered from the enterprise funds. This shows the net cost for support service departments that are currently unassigned to specific departments, programs, or activities.
Table 2-1: Support Service Department Indirect Cost Recovery Department Expenditure
HR $384,132 Finance $416,828 IT $970,340 Total Cost of Support Service Departments $1,771,300 Indirect Cost Recovered from Enterprise Funds ($187,655) Net Cost of Support Service Departments $1,583,645 Source: Gahanna As shown in Table 2-1, the City had approximately $1.6 million in unassigned support service cost for 2016.
City of Gahanna Performance Audit
Page 13
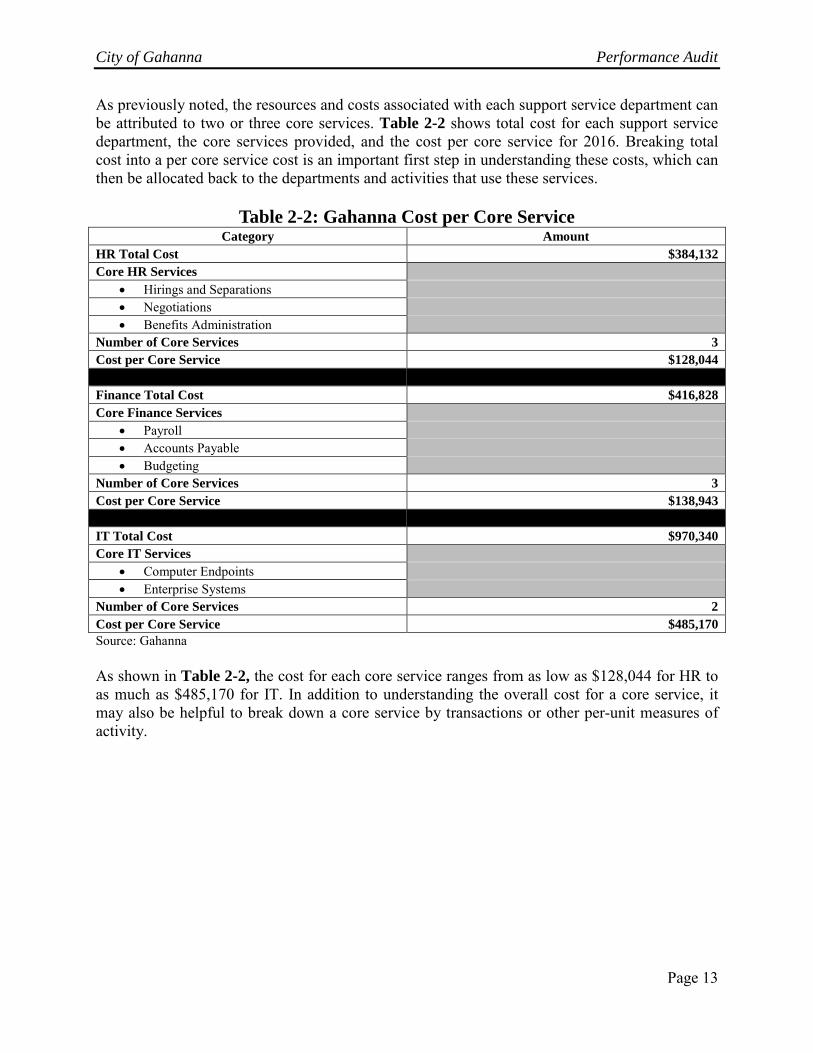
As previously noted, the resources and costs associated with each support service department can be attributed to two or three core services. Table 2-2 shows total cost for each support service department, the core services provided, and the cost per core service for 2016. Breaking total cost into a per core service cost is an important first step in understanding these costs, which can then be allocated back to the departments and activities that use these services.
Table 2-2: Gahanna Cost per Core Service Category Amount
HR Total Cost $384,132 Core HR Services
• Hirings and Separations • Negotiations • Benefits Administration
Number of Core Services 3 Cost per Core Service $128,044 Finance Total Cost $416,828 Core Finance Services
• Payroll • Accounts Payable • Budgeting
Number of Core Services 3 Cost per Core Service $138,943 IT Total Cost $970,340 Core IT Services
• Computer Endpoints • Enterprise Systems
Number of Core Services 2 Cost per Core Service $485,170 Source: Gahanna As shown in Table 2-2, the cost for each core service ranges from as low as $128,044 for HR to as much as $485,170 for IT. In addition to understanding the overall cost for a core service, it may also be helpful to break down a core service by transactions or other per-unit measures of activity.

City of Gahanna Performance Audit
Page 14
Table 2-3 shows how the cost of core services can be further divided on a per-unit basis for 2016. Dividing indirect costs in this manner is a useful way to calculate the per-unit cost of services which can then be applied to an indirect cost plan.
Table 2-3: Indirect Costs per Unit Category Amount
HR Indirect Cost Hiring and Separations Core Cost $128,044 Average Hirings and Separations per year 1 177 Cost per Hiring/Separation $723 Negotiations Core Cost $128,044 Number of Bargaining Unit Members 95 Cost per Bargaining Unit Member $1,348 Benefits Administration $128,044 Number of Employees Receiving Benefits 137 Cost per Employee Receiving Benefits $935
Finance Indirect Cost
Payroll $138,943 Total Employees 398 Cost per Employee $349 Accounts Payable Calculated Based on % of Total Purchases Budgeting Calculated Based on % of Total Budget
IT Indirect Cost
Computer Endpoints Core Cost $485,170 Number of Computer Endpoints 200 Cost per Computer Endpoint $2,426 Enterprise Systems Core Cost $485,170 Number of Enterprise Systems 22 Cost per Enterprise System $22,053 Source: Gahanna 1 Average hiring and separations per year is calculated based on all activity from 2007 through 2016. As shown in Table 2-3, per-unit costs in HR and IT can be calculated by dividing the cost of each department by the number of core services provided. Costs in Finance can be allocated based upon the percentage of accounts payable and the proportion of the City budget used by a given department. Example Indirect Cost Identification – Parks Pools One potentially significant indirect cost driver is Parks, specifically HR costs with the hiring and separating of seasonal employees. Seasonal employees staff the pools, camps, and recreation programs. In 2016, Gahanna hired 154 seasonal workers to staff Parks pools, camps, and recreation programs. A total of 72, or 46.8 percent, of these seasonal workers were assigned to the pools. Given the number of employees that must be recruited and hired, there is potentially a large, and currently uncaptured, indirect cost of operating the Parks pools.

City of Gahanna Performance Audit
Page 15
Table 2-4 shows an example indirect cost plan applied to the Parks pools using the indirect cost per unit established in Table 2-3. Applying indirect costs in this manner can help decision makers understand the full financial impact of budgeting and operational decisions.
Table 2-4: Example Indirect Cost Plan for Parks Pools Category Amount
HR Indirect Cost Core Service - Cost per Hiring/Separation $723 Number of Hirings and Separations for Pools 1 69 Total Indirect Cost of Hiring and Separations $49,887 Core Service - Cost per Bargaining Unit Member $1,348 Number of Bargaining Unit Members N/A Total Indirect Cost of Negotiations $0 Core Service - Cost per Employee Receiving Benefits $935 Number of Employees Receiving Benefits 1 Total Indirect Cost of Benefits Administration $935 Total HR Indirect Cost for Parks Pools $50,822
Finance Indirect Cost
Core Service - Payroll per Employee $349 Pool Employee Headcount 2016 72 Indirect Cost of Pool Payroll $25,128 Core Service - Accounts Payable $138,943 Citywide Supplies and Materials $1,093,164 Pool Supplies and Materials $124,355 Pool as % of Total 11.4% Indirect Accounts Payable for Pool $15,806 Core Service - City Budget $138,943 Total City Expenditure 2016 $57,754,064 Pool Expenditure 2016 $518,951 Pool as % of Total Expenditure 0.9% Indirect Budget Cost for Pool $1,248 Total Finance Indirect Cost for Parks Pools $42,182
IT Indirect Cost
Core Service - Cost per Endpoint $2,426 Total Endpoints for Pools 2 Indirect Cost of Endpoints $4,852 Core Service - Cost per Enterprise System $22,053 Enterprise Systems in Pool 0.5 Indirect Cost per Enterprise System $11,027 Total IT Indirect Cost for Parks Pools $15,879 Total Indirect Cost for Parks Pools $108,883 Source: Gahanna 1 Based on the 2007 through 2016 annual average.
City of Gahanna Performance Audit
Page 16
As shown in Table 2-4, the current uncaptured, indirect cost of operating the pools is estimated to be $108,883 per year. See R6.3 for a full analysis of the pool operating cost and City subsidy practices. In addition to the indirect costs shown in Table 2-4, the City should also consider the opportunity cost of hiring and separating a large number of seasonal workers each year. If the City did not need to hire so many seasonal workers, the time spent recruiting, hiring, and terminating those workers at the end of the season is time that could be spent on other tasks. The City should develop an indirect cost plan to capture the cost of providing support services by HR, IT, and Finance. Without an indirect cost plan, the City is at risk of making suboptimal decisions regarding resource allocation. R2.2 Bring employer insurance costs in line with benchmarks The City offers employees single and family health insurance plans.4 The exact type of plan depends on the employee classification:5
• Central Ohio Health Care Consortium (COHCC) – offers single and family health insurance plans to members of the Fraternal Order of Police (FOP), Fraternal Order of Police/Ohio Labor Council (FOP/OLC), and unclassified employees. The City has 30 and 81 employees electing to take the single and family COHCC plans, respectively. COHCC members contribute 15.0 percent of the premium cost for either a single or family plan.
• United Steel Workers Health and Wellness Fund (HWF) – offers single and family health, vision, and dental plans. The City has nine and 17 employees electing to take the single and family HWF plans, respectively. HWF members contribute 15.0 percent of the premium cost for either a single or family plan.
COHCC Plan Analysis Chart 2-1 and Chart 2-2 show COHCC monthly single and family insurance premium costs compared to the regional, county, and statewide averages for Preferred Provider Organization (PPO) plans as reported to the State Employment Relations Board (SERB) for 2016. The City’s 2017 insurance costs are also shown for the purpose of comparison. Insurance cost is recognized as sensitive to local conditions and, where possible, other local, regional, and statewide plan data provide the most realistic benchmarks for relative price competitiveness.
4 The baseline employee contribution to both plans is 15.0 percent; however, the City offers a wellness incentive that results in some employees paying as little as 6.0 percent. 5 See Section 3 Collective Bargaining for a full explanation of employee classifications.

City of Gahanna Performance Audit
Page 17
Chart 2-1: COHCC Monthly Single Premium Comparisons
Source: Gahanna and SERB
Chart 2-2: COHCC Monthly Family Premium Comparison
Source: Gahanna and SERB As shown in Chart 2-1 and Chart 2-2, single and family COHCC premiums are higher than each comparative point. In addition, 2017 costs increased by approximately $40 or 5.6 percent, for single plans, and approximately $193 or 9.2 percent, for family plans. Respective to the cost
$638 $604 $557 $570 $510
$113 $107
$92 $79 $74
$0
$100
$200
$300
$400
$500
$600
$700
$800
COHCC 2017 COHCC 2016 Regional Avg. County Avg. Statewide Avg.
Employer Single Employee Single
$1,941 $1,777 $1,432 $1,432 $1,308
$343 $314
$257 $227 $200
$0
$500
$1,000
$1,500
$2,000
$2,500
COHCC 2017 COHCC 2016 Regional Avg. County Avg. Statewide Avg.
Employer Family Employee Family
City of Gahanna Performance Audit
Page 18
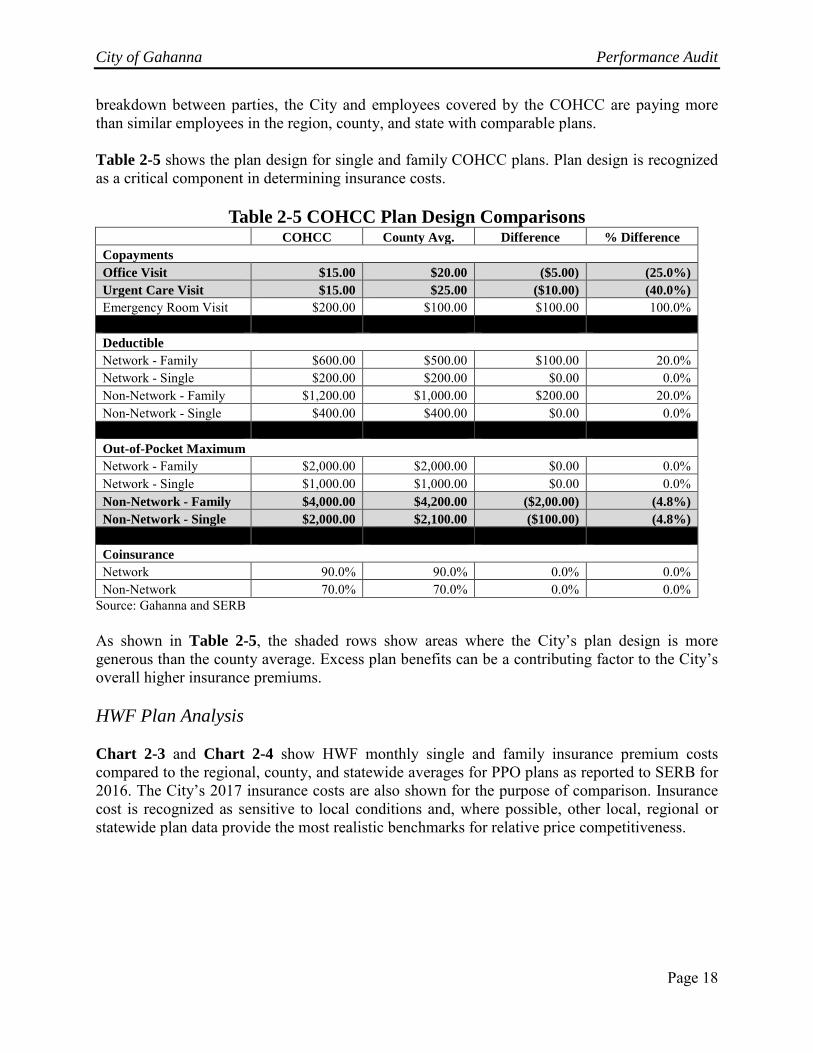
breakdown between parties, the City and employees covered by the COHCC are paying more than similar employees in the region, county, and state with comparable plans. Table 2-5 shows the plan design for single and family COHCC plans. Plan design is recognized as a critical component in determining insurance costs.
Table 2-5 COHCC Plan Design Comparisons COHCC County Avg. Difference % Difference Copayments Office Visit $15.00 $20.00 ($5.00) (25.0%) Urgent Care Visit $15.00 $25.00 ($10.00) (40.0%) Emergency Room Visit $200.00 $100.00 $100.00 100.0% Deductible Network - Family $600.00 $500.00 $100.00 20.0% Network - Single $200.00 $200.00 $0.00 0.0% Non-Network - Family $1,200.00 $1,000.00 $200.00 20.0% Non-Network - Single $400.00 $400.00 $0.00 0.0% Out-of-Pocket Maximum Network - Family $2,000.00 $2,000.00 $0.00 0.0% Network - Single $1,000.00 $1,000.00 $0.00 0.0% Non-Network - Family $4,000.00 $4,200.00 ($2,00.00) (4.8%) Non-Network - Single $2,000.00 $2,100.00 ($100.00) (4.8%) Coinsurance Network 90.0% 90.0% 0.0% 0.0% Non-Network 70.0% 70.0% 0.0% 0.0%
Source: Gahanna and SERB As shown in Table 2-5, the shaded rows show areas where the City’s plan design is more generous than the county average. Excess plan benefits can be a contributing factor to the City’s overall higher insurance premiums. HWF Plan Analysis Chart 2-3 and Chart 2-4 show HWF monthly single and family insurance premium costs compared to the regional, county, and statewide averages for PPO plans as reported to SERB for 2016. The City’s 2017 insurance costs are also shown for the purpose of comparison. Insurance cost is recognized as sensitive to local conditions and, where possible, other local, regional or statewide plan data provide the most realistic benchmarks for relative price competitiveness.

City of Gahanna Performance Audit
Page 19
Chart 2-3: HWF Monthly Single Premiums
Source: Gahanna and SERB
Chart 2-4: HWF Monthly Family Premiums
Source: Gahanna and SERB Chart 2-3 shows that in 2016 HWF single plans are cost competitive with the SERB regional and county averages but more expensive than the state average. However, as shown in Chart 2-4, HWF premiums are higher than the comparisons for family plans. In addition, 2017 family
$633 $546 $557 $570
$510
$112
$97 $92 $79 $74
$0
$100
$200
$300
$400
$500
$600
$700
$800
HWF 2017 HWF 2016 Regional Avg. County Avg. Statewide Avg.
Employer Single Employee Single
$1,679 $1,668 $1,432 $1,432 $1,308
$299 $296
$257 $227 $200
$0
$500
$1,000
$1,500
$2,000
$2,500
HWF 2017 HWF 2016 Regional Avg. County Avg. Statewide Avg.
Employer Family Employee Family

City of Gahanna Performance Audit
Page 20
plans increased in costs by $14, or less than 1.0 percent, and for single plans by $102, or 15.8 percent. Table 2-6 shows the plan design for single and family HWF plans. Plan design is recognized as a critical component in determining insurance costs.
Table 2-6 HWF Plan Design Comparisons HWF County Avg. Difference % Difference Copayments Office Visit $10.00 $20.00 ($10.00) (50.0%) Urgent Care Visit $10.00 $25.00 ($15.00) (60.0%) Emergency Room Visit $50.00 $100.00 ($50.00) (50.0%) Deductible Network - Family $300.00 $500.00 ($200.00) (40.0%) Network - Single $150.00 $200.00 ($50.00) (25.0%) Non-Network - Family $1,000.00 $1,000.00 $0.00 0.0% Non- Network -Single $500.00 $400.00 $100.00 25.0% Out-of-Pocket Maximum Network - Family $2,000.00 $2,000.00 $0.00 0.0% Network - Single $1,000.00 $1,000.00 $0.00 0.0% Non-Network - Family $4,000.00 $4,200.00 ($200.00) (4.8%) Non- Network -Single $2,000.00 $2,100.00 ($100.00) (4.8%) Coinsurance Network 90.0% 90.0% 0.0% 0.0% Non-Network 70.0% 70.0% 0.0% 0.0% Source: Gahanna and SERB As shown in Table 2-6, the shaded rows show areas where the City’s plan design is more generous than the county average. Providing excess plan benefits can be a contributing factor to the City’s overall higher insurance premiums. In addition to the plan design elements shown in Table 2-5 and Table 2-6, options for reducing costs include:
• Insurance plan design – overly generous plan design and benefits can contribute to the overall cost of an insurance plan.
• Consumer Directed Health Plan (CDHP) – a CDHP combines a high deductible insurance plan with a health savings account (HSA) to give consumers more control and choice over healthcare spending. The 8th annual Cigna Choice Fund Experience Study (Cigna Health Insurance, 2014), reported that customers who switched to a CDHP plan experienced an average annual savings of $1,580 per employee.
• On-site wellness clinic – Local Governments Cut Health-Care Costs with Free On-Site Health Clinic for City Workers (Govtech.com, 2010) states that “...local agencies have discovered on-site wellness facilities as a solution for skyrocketing health-care costs.”

City of Gahanna Performance Audit
Page 21
The City of Whitehall, Ohio opened an Urgent Care-style clinic for its employees with the goal of providing more convenient access to medical care at a lower cost.
Table 2-7 shows the financial impact of reducing insurance costs to the county average for single and family plans, based on 2016 base insurance costs.
Table 2-7: Financial Impact of Reduced Insurance Costs COHCC Plan Participation Overview Single Plan Family Plan Gahanna Plan Counts 30 81 Revised Employer Cost Overview Single Plan Family Plan Gahanna per Plan Employer Cost $7,243.68 $21,328.08 County per Plan Average $6,834.48 $17,181.48 Difference $409.20 $4,146.60 Sub Total $12,276.00 $335,874.60
Total Annual Savings by Reducing Cost to County Average $348,150.60 USW Plan Participation Overview Single Plan Family Plan Gahanna Plan Counts 9 17 Revised Employer Cost Overview Single Plan Family Plan Gahanna per Plan Employer Cost $6,555.00 $20,012.04 County per Plan Average $6,834.48 $17,181.48 Difference N/A $2,830.56 Sub Total N/A $48,119.52
Total Annual Savings by Reducing Cost to County Average $48,119.52
Total Financial Impact of Reducing Insurance to County Average $396,270.12 Source: Gahanna and SERB Financial Implication: Gahanna could save $396,200 annually by bringing employer insurance costs in line with the county average.

City of Gahanna Performance Audit
Page 22
3. Collective Bargaining Background City Ordinance 13.03 defines two types of employees: unclassified and classified. Job description, pay, benefits, and work rules for classified employees are governed by collective bargaining agreements (CBA or contract). Unclassified employees are either elected or appointed by, and serving at the pleasure of, the Mayor, City Attorney, or City Council. A specific breakdown of the type of the employees in each category is as follows:
• Classified – includes all members of the following three bargaining units: o FOP - covers Police employees, excepting dispatch, with the current contract
valid through December 31, 2018. o FOP/OLC - covers dispatch, with the current contract valid through December
31, 2018. o USW - covers Service employees, with the current contract having been valid
through December 31, 2017, but not yet replaced by the updated agreement.6 • Unclassified – includes all elected officials, Chief of Police, City Administrator, all
temporary employees, part-time employees, department directors and assistant directors, professional engineers, superintendents, supervisors and management employees.
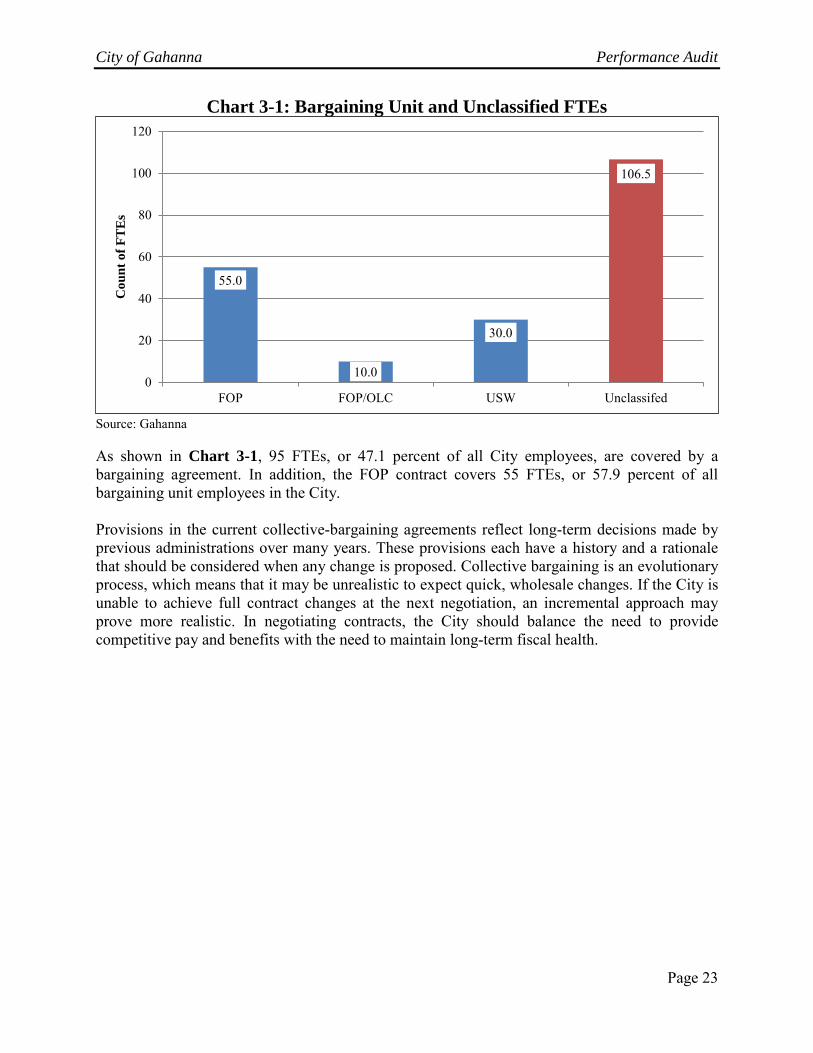
Chart 3-1 shows a breakdown of FTEs by bargaining unit and/or unclassified status for 2016. Showing FTEs by bargaining unit helps to illustrate the impact of CBAs on the City’s workforce.
6 An updated CBA has been approved and will be effective in June 2017.
City of Gahanna Performance Audit
Page 23
Chart 3-1: Bargaining Unit and Unclassified FTEs
Source: Gahanna As shown in Chart 3-1, 95 FTEs, or 47.1 percent of all City employees, are covered by a bargaining agreement. In addition, the FOP contract covers 55 FTEs, or 57.9 percent of all bargaining unit employees in the City. Provisions in the current collective-bargaining agreements reflect long-term decisions made by previous administrations over many years. These provisions each have a history and a rationale that should be considered when any change is proposed. Collective bargaining is an evolutionary process, which means that it may be unrealistic to expect quick, wholesale changes. If the City is unable to achieve full contract changes at the next negotiation, an incremental approach may prove more realistic. In negotiating contracts, the City should balance the need to provide competitive pay and benefits with the need to maintain long-term fiscal health.
55.0
10.0
30.0
106.5
0
20
40
60
80
100
120
FOP FOP/OLC USW Unclassifed
Cou
nt o
f FT
Es
City of Gahanna Performance Audit
Page 24
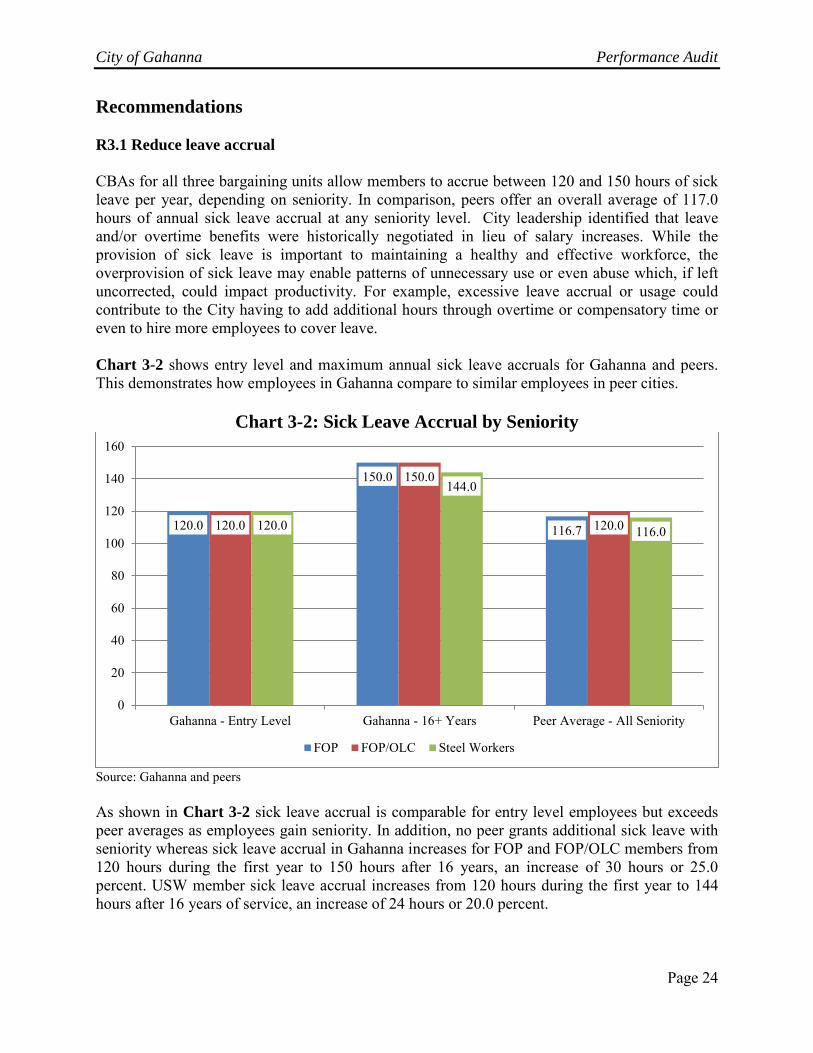
Recommendations R3.1 Reduce leave accrual CBAs for all three bargaining units allow members to accrue between 120 and 150 hours of sick leave per year, depending on seniority. In comparison, peers offer an overall average of 117.0 hours of annual sick leave accrual at any seniority level. City leadership identified that leave and/or overtime benefits were historically negotiated in lieu of salary increases. While the provision of sick leave is important to maintaining a healthy and effective workforce, the overprovision of sick leave may enable patterns of unnecessary use or even abuse which, if left uncorrected, could impact productivity. For example, excessive leave accrual or usage could contribute to the City having to add additional hours through overtime or compensatory time or even to hire more employees to cover leave. Chart 3-2 shows entry level and maximum annual sick leave accruals for Gahanna and peers. This demonstrates how employees in Gahanna compare to similar employees in peer cities.
Chart 3-2: Sick Leave Accrual by Seniority
Source: Gahanna and peers As shown in Chart 3-2 sick leave accrual is comparable for entry level employees but exceeds peer averages as employees gain seniority. In addition, no peer grants additional sick leave with seniority whereas sick leave accrual in Gahanna increases for FOP and FOP/OLC members from 120 hours during the first year to 150 hours after 16 years, an increase of 30 hours or 25.0 percent. USW member sick leave accrual increases from 120 hours during the first year to 144 hours after 16 years of service, an increase of 24 hours or 20.0 percent.
120.0
150.0
116.7 120.0
150.0
120.0 120.0
144.0
116.0
0
20
40
60
80
100
120
140
160
Gahanna - Entry Level Gahanna - 16+ Years Peer Average - All Seniority
FOP FOP/OLC Steel Workers

City of Gahanna Performance Audit
Page 25
Chart 3-3 shows the percentage of an FTE available for a police officer during each year of a 25-year career assuming an officer uses all available leave time. This analysis shows the effect of higher sick leave accrual by demonstrating an employee’s time available for work when leave usage is maximized. As previously noted, police officers make up nearly 60.0 percent of all bargaining unit employees. While sick leave accrual impacts all City employees and departments, police officers are the most common example of how that impact manifests.
Chart 3-3: Percent of an FTE Available Less Leave
Source: Gahanna As shown in Chart 3-3, leave time in excess of the peer average could result in the productivity loss of between 1.2 percent of an FTE during the first step of a 25-year career increasing to 3.4 percent of an FTE at the last step of a 25-year career. Based on a staffing level of 57.1 FTEs, the difference between City and peer leave accrual rates results in the potential for the loss of an average additional 3,019 work hours each year, or about 1.5 FTEs, across the entire Department. One additional potential impact of leave accrual is an increase in overtime used to cover for a shift when an employee uses leave. In addition, because the City allows employees to accrue overtime in either pay or compensatory time, excessive overtime accrual could compound the issues associated with excessive leave accruals.7 For a more in-depth analysis of overtime accrual policies, see R3.3 & R3.4. One way to statistically measure the potential relationship between overtime accrual and sick leave is by using the coefficient of determination. Chart 3-4 shows the relationship between overtime accrual and sick leave taken for police in 2016. This analysis is important in that it
7 Compensatory time is defined as time off with pay in lieu of overtime pay for irregular or occasional overtime work (OPM.gov, 2017).
70.0%
75.0%
80.0%
85.0%
90.0%
95.0%
100.0%
1 2 3 4 5 6 7 8 9 10 11 12 13 14 15 16 17 18 19 20 21 22 23 24 25
% o
f an
FTE
Years of Service
Gahanna % of FTE w/Sick Leave Peer % of FTE w/Sick Leave

City of Gahanna Performance Audit
Page 26
directly measures the effect that each hour of sick leave has on the accrual of overtime and highlights a potential hidden cost of both City overtime accrual and leave accrual policies.
Chart 3-4: Overtime Accrual in Relation to Sick Leave Usage
Source: Gahanna As shown in Chart 3-4, the adjusted coefficient of determination between sick leave used and overtime accrued is 13.0 percent. This means that for every hour of sick leave used, the City can expect overtime accrual to grow by 13.0 percent of an hour, or 7.8 minutes. The minimum overtime accrual rate is 1.5 times regular pay, so at minimum the City actually pays for 11.7 minutes of labor in addition to compensation for the hour of sick leave used. The City should negotiate a decrease in sick leave accrual. Excessive sick leave accrual can contribute to the City having to hire additional FTEs and can contribute to excessive overtime accrual. R3.2 Bring sick leave severance pay in line with peers All three CBAs pay out sick leave at two different levels (tiers) depending on the amount of leave accrued. The USW and FOP/OLC contracts allow a member to be paid for up to 50.0 percent of the first 1,200 hours in accrued sick leave (First Tier) and 25.0 percent over 1,200 hours (Second Tier). The FOP contract allows a member to receive 60.0 percent of the first 1,200 hours of accrued leave (First Tier) and 25.0 percent over 1,200 hours (Second Tier).
403020100
16
14
12
10
8
6
4
2
0
S 4.01400R-Sq 15.1%R-Sq(adj) 13.0%
Sick Leave Usage in Hours
Ove
rtim
e A
ccru
al in
Hou
rs

City of Gahanna Performance Audit
Page 27
Provisions in the USW CBA allow employees to be paid for up to 33 weeks of sick leave upon retirement, whereas similar peer CBAs allow for a median of 7.8 weeks of sick leave payout based on the maximum leave accruals over a 30-year career. The FOP/OLC allows for a maximum payout of 33.6 weeks compared to similar peer CBAs with a median of eight weeks based on the maximum sick leave accrual over a 30-year career. Also, the FOP contract allows an employee to be paid for 29.1 weeks upon retirement, based on maximum leave accrual over a 25-year career, whereas similar peers’ CBAs offer a median of 21.5 weeks of sick leave payout upon retirement. Excessive sick leave payout could make employee retirements more expensive than necessary. Chart 3-5 shows the maximum possible sick leave payout at retirement for Gahanna and peers. This demonstrates how employees in Gahanna compare to similar employees in peer cities.
Chart 3-5: Sick Leave Payout Comparisons
Source: Gahanna and peers As shown on Chart 3-5, Gahanna’s maximum sick leave payout exceeds the peers for each bargain unit. Paying employees more than necessary for sick leave at retirement may create a financial risk for the City. The City should negotiate a decrease in sick leave payout at retirement. Sick leave payouts in excess of benchmarks could lead to the City having to pay more for similar services when compared to peers. R3.3 Consider adjusting police overtime standards Law enforcement is a 24-hour operation, and, as such, has unique staffing needs that may require an employee to work unusually long and/or irregular shifts which may include overtime. If the City choses to review police overtime standards, City leadership should seek to find a balance between the unique needs of police scheduling, the City’s desire to offer competitive compensation, and the City’s need to maintain long-term fiscal sustainability.
1282.5 1342.5 1320.0
570.0
320.0 310.0
0.0
200.0
400.0
600.0
800.0
1000.0
1200.0
1400.0
1600.0
FOP FOP/OLC Steel Workers
Gahanna Peer Median

City of Gahanna Performance Audit
Page 28
The FOP CBA requires the City to pay police officers overtime for all hours worked in excess of eight hours a day and 80 hours per bi-weekly pay period. Overtime is paid at 1.5 times the normal rate of the bargaining unit member for the first eight hours of overtime, and 2.0 times the normal rate for any hours in excess of 48 in a workweek. Laws for overtime pay are governed by the Fair Labor Standards Act of 1938 (FLSA). According to section 7k of the FLSA, municipalities must pay overtime for law enforcement personnel8 on a “work period” basis of between seven and 28 days. Under the FLSA, the City is not obligated to pay overtime to law enforcement personnel until an officer has reached 86 hours of work in a bi-weekly pay period. This means that the City is not required to pay overtime solely for hours worked in excess of eight hours in a day or after 40 hours in a week. Under the FLSA, the City is also not required to pay overtime at a rate that exceeds 1.5 times the regular rate of pay for any hours worked. The peers all pay just 1.5 times the regular rate for overtime hours over 40 in a workweek.9 No peer City uses the FLSA section 7k standard. Table 3-1 shows the cost of paid overtime and compensatory time for the Gahanna Division of Police (GDP) from 2014 to 2016 compared to what the same number of hours would have cost if the City paid overtime in accordance with the FLSA section 7K. This analysis quantifies the City’s excess cost of overtime, and excludes any impact this compensation could have on employee retirement and insurance benefit costs.
Table 3-1: Paid Overtime Comparison
2014 2015 2016 Three-Year Avg.
Total Paid OT/Comp Hours 4,348 4,451 4,349 4,383 Total Paid OT/Comp Value $257,917 $260,785 $273,793 $264,165 FLSA-Required OT/Comp Value $194,892 $197,741 $209,021 $200,551 Difference in Paid Value $63,025 $63,044 $64,772 $63,614 % Difference in Paid Value 32.3% 31.9% 31.0% 31.7% Source: Gahanna and the FLSA As shown in Table 3-2, Gahanna paid an average of $63,614, or 31.7 percent, more in additional overtime wages each year over the past three years than would have been required by the FLSA. As a result the City is allocating more resources than necessary to pay for overtime when it could otherwise redirect those resources to other needs or reduce overall expenditures.
8 The FLSA defines law enforcement personnel as “…employees who are empowered by State or local ordinance to enforce laws designed to maintain peace and order, protect life and property, and to prevent and detect crimes; who have the power to arrest; and who have undergone training in law enforcement.” 9 Hilliard and Reynoldsburg pay 2.0 times the normal rate for overtime hours worked on the second consecutive regularly scheduled day off.

City of Gahanna Performance Audit
Page 29
R3.4 Consider adjusting police holiday overtime The Gahanna Division of Police provides law enforcement services to the community 24-hours a day, seven days a week, and 365 a year. Maintaining 365 day coverage means that officers will be asked to work holidays such as Thanksgiving, Christmas, etc. To compensate officers for these unusual scheduling demands, it is typical for any police bargaining agreement to include special provisions for additional compensation for officers that work on holidays. If the City choses to review these policies during future negotiations, City leadership should seek to find a balance between the community’s desire for 24-hour law enforcement service, the City’s desire to offer competitive compensation, and the City’s need to maintain fiscal sustainability. The FOP CBA requires the City to pay police officers varying rates for overtime earned by working on a holiday. Overtime is paid at 1.5 times the normal rate for overtime worked on a holiday where the shift began before the holiday; 2.0 times for Martin Luther King Day, Presidents’ Day, Columbus Day, and Veterans’ Day; and 2.5 times for the other eight observed holidays.10 Three of the six peers pay overtime worked on holidays at 1.5 times the normal rate, while the other three pay overtime for hours worked on holidays at 2.0 times the normal rate.11 Hilliard adjusts holiday overtime pay to 2.0 times the normal rate for working overtime on a second consecutive scheduled day off. Only Delaware pays overtime at 2.5 times the normal rate of pay for certain holidays.12 Grove City pays overtime for hours worked on the Independence Day holiday at 3.0 times the normal rate. Table 3-2 shows the cost of paid Police overtime from 2014 to 2016 compared to what the same number of hours would have cost if the City paid according to the practices of the peers who pay at lower holiday overtime rates. This analysis quantifies the impact of the City’s higher overtime rates.
10 Holidays paid a 2.5 times the normal rate are New Year’s Day, Easter Day, Memorial Day, Independence Day, Labor Day, Thanksgiving, Christmas Eve, and Christmas Day. 11 Grove City, Hilliard, and Upper Arlington pay overtime for holidays worked at 1.5 times the normal rate, while Delaware, Reynoldsburg, and Westerville pay holiday overtime at 2.0 times the normal rate. 12 There are six observed holidays for which Delaware pays at 2.5 times the normal rate of pay.

City of Gahanna Performance Audit
Page 30
Table 3-2: Paying Holiday Overtime in Accordance with Peers
2014 2015 2016 Three-Year
Avg. Total Paid Holiday OT/Comp Hours 82.5 84.5 100.5 89.2 Total Paid Holiday OT/Comp Value $5,946 $4,492 $9,870 $6,770 Total Projected Value at 2.0 Times $4,757 $3,593 $7,896 $5,416 Difference in Paid Value $1,189 $899 $1,974 $1,354 % Difference in Paid Value 20.0% 20.0% 20.0% 20.0% Total Projected Value at 1.5 Times $3,568 $2,695 $5,922 $4,062 Difference in Paid Value $2,378 $1,797 $3,948 $2,708 % Difference in Paid Value 40.0% 40.0% 40.0% 40.0% Source: Gahanna As shown in Table 3-2, Gahanna paid an average of $1,354, or 20 percent, more per year in additional holiday overtime between 2014 and 2016 than would have been required if all holiday overtime hours worked had been compensated at 2.0 times the normal rate. The City paid an average of $2,708, or 40 percent, more per year in holiday overtime than would have been necessary if all holiday hours worked had been compensated at 1.5 times the regular rate. As a result, the City is allocating more resources than necessary to pay for overtime which could otherwise be re-directed to meet other needs or reduce overall expenditures.

City of Gahanna Performance Audit
Page 31
4. Public Safety Background The Gahanna Division of Police (GDP or the Division) makes up the Department of Public Safety (Public Safety), which is led by the Director of Public Safety, who works with the Mayor and City Council to set public safety policies that govern the Division. The Gahanna Chief of Police (the Chief) is then responsible for implementing those policies. The Chief is supported by the Deputy Chief, who oversees day-to-day operations; and an Administrative Operations Manager, who provides administrative support to the Chief and Deputy Chief. The GDP provides 24-hour police services for the City through the employment of 58 sworn officers, or 57.1 FTEs13; and 14 non-sworn employees, or 14.0 FTEs, in support roles. Division functions are divided among the following bureaus:
• Administrative – the 1.0 FTE Administrative Lieutenant oversees the 0.5 FTE sworn Property Officer, who is responsible for handling all evidence; the 1.0 FTE Civilian Procurement Coordinator, who is responsible for obtaining all necessary uniforms and supplies; the 1.0 FTE Lead Dispatcher and 9.0 FTE dispatchers; and the 1.0 FTE sworn Administrative/Training Officer, who is responsible for training.
• Operations – the 1.0 FTE Operations Lieutenants oversees 4.0 FTE sergeants. The 1.0 FTE Operations Sergeant oversees the 3.0 FTE School Resource Officers (SROs), the volunteer Reserve Officers, and the 0.4 FTE Court Bailiff.14 Each of the 3.0 FTE Patrol Sergeants oversees a shift of Patrol Officers.
• Detective – the 1.0 FTE Detective Lieutenants oversees the 1.0 FTE Detective Sergeants, who oversees the 8.0 FTE Detectives as well as the 0.6 FTE Court Liaison Officer.
Table 4-1 shows the number of sworn officer and non-sworn positions within the GDP as well as the percent of sworn/unsworn and percent of total that the FTEs of each position represents for year to date 2017.15 Analyzing staffing structure illustrates which bureaus have the most personnel.
13 ORC § 109.71 defines a peace officer in the State Ohio as one whose job is to “...preserve the peace, to protect life and property, and to enforce the laws of this state, ordinances of a municipal corporation, resolutions of a township, or regulations of a board of county commissioners or board of township trustees…” 14 Bailiff duties are currently performed by first shift patrol following retirement of previous part-time officer. 15 Represents the staffing totals as of 3/9/2017.

City of Gahanna Performance Audit
Page 32
Table 4-1: GDP Staffing Structure Sworn Officers
Assignment Headcount FTEs % of Sworn % of Total Administration 5.0 4.5 7.8% 6.2%
Chief 1.0 1.0 1.7% 1.4% Deputy Chief 1.0 1.0 1.7% 1.4% Lieutenant 1.0 1.0 1.7% 1.4% Admin/Training Sergeant 1.0 1.0 1.7% 1.4% Property Officer-PT 1.0 0.5 1.0% 0.6%
Operations 42.0 42.0 73.6% 58.3% Lieutenant 1.0 1.0 1.7% 1.4% Sergeant 4.0 4.0 7.0% 5.5% Patrol Officer 1 31.0 31.0 54.3% 43.0% Officer in Training 2 3.0 3.0 5.3% 4.2% School Resource Officer 3.0 3.0 5.3% 4.2% Court Bailiff/Officer-PT 3 0.0 0.0 0.0% 0.0%
Detective 11.0 10.6 18.6% 14.7% Lieutenant 1.0 1.0 1.7% 1.4% Sergeant 1.0 1.0 1.7% 1.4% Detective/Investigator 8.0 8.0 14.1% 11.1% Court Liaison Officer-PT 1.0 0.6 1.1% 0.8%
Total Sworn Officers 58.0 57.1 100.0% 79.2% Non-Sworn Personnel
Assignment Headcount FTEs % of Non-Sworn % of Total Admin. Operations Manager 1.0 1.0 6.7% 1.4% Management Analyst 1.0 1.0 6.7% 1.4% Records Clerk 1.0 1.0 6.7% 1.4% Lead Dispatcher 1.0 1.0 6.7% 1.4% Dispatchers/Communications 9.0 9.0 59.8% 12.4% Procurement Coordinator 1.0 1.0 6.7% 1.4% Crime Analyst 1.0 1.0 6.7% 1.4% Total Non-Sworn 15.0 15.0 100.0% 20.8% Total Staff 73.0 72.1 100.0% 100.0% Source: Gahanna 1 A current patrol officer position is vacant on second shift. 2 Included in current Operations Bureau staffing, but do not complete the Ohio Peace Officer Training Academy until July 6, 2017. 3 Position was vacated by the retirement of a 0.4 FTE officer on January 31st, 2017. Duties are currently being handled by first-shift patrol staff. As shown in Table 4-1, patrol officers, dispatchers, and detectives collectively make up 68.0 percent of the total police force.16 Due to the relative prevalence of patrol officers, dispatchers,
16 Inclusive of 31.0 FTE patrol officers, 8.0 FTE detectives, 9.0 FTE dispatchers, and 1.0 FTE lead dispatcher.
City of Gahanna Performance Audit
Page 33
and detectives, the analyses that follow will focus heavily on analyzing staffing practices for those positions (see R4.1, R4.2, and R4.3).
City of Gahanna Performance Audit
Page 34
Recommendations R4.1 Develop a data-driven staffing plan for patrol officers Every community has unique circumstances, needs, and expectations that influence the size and duties of its public-safety forces. There is no one-size-fits-all recipe that can dictate how many police officers a given community should have. That decision rests with the city’s residents and elected leadership. Every municipality evolves and therefore should regularly review its public-safety staffing levels to ensure that they continue to meet the community’s expectations. The Patrol Bureau has a staffing level of 32.0 FTEs.17 Patrol officers are assigned to one of three eight-hour shifts: first shift from 6:00 a.m. to 2:00 p.m.; second shift from 2:00 p.m. to 10:00 p.m.; and third shift from 10:00 p.m. to 6:00 a.m. The City does not have a formal minimum manning requirement; however, it operates with no fewer than 5.0 FTE patrol officers on first shift, 6.0 FTE patrol officers on second shift, and 5.0 FTE patrol officers on third shift. In addition, while Gahanna’s website indicates that the Division has an authorized strength of 60 sworn officers, there is no documentation of this in City ordinances. Historically, decisions about adding or replacing officers in Gahanna have been made based on budget constraints, but without examining a data-driven assessment of officer workloads. An Analysis of Police Department Staffing: How Many Officers Do You Really Need? (International City/County Management Association (ICMA), 2013) states that police department staffing requirements are typically determined based on one or more of the following five methods:
• Per capita – a population or resident-based method of staffing usually based on officer-to-population ratios;
• Crime trends – staffing based on crime levels (formerly-popular staffing method not widely used anymore because it does not take into account how effective officers are at combating crime);
• Minimum-manning – staffing based on predetermined “hard” or “soft” minimums generally determined by past practice, policy, or supervisory judgment;
o As previously noted, the City does not have a minimum-manning ordinance. • Authorized/budgeted strength levels – a variant of the minimum-manning model,
where department staffing is based on authorized or budgeted numbers; o As previously noted, the City does not operate with an authorized or budgeted
strength level ordinance.
17 The GDP is currently staffed with 31.0 FTE patrol officers and an additional 3.0 FTE patrol officers in training. The City anticipates that the 3.0 FTE trainees attending the Ohio Peace Officer Training Academy (OPOTA) will eventually be assigned to patrol shifts to backfill a currently vacant position or to replace officers who are expected to retire in 2018. In total, this will bring the patrol division staffing to 32.0 FTE patrol officers.

City of Gahanna Performance Audit
Page 35
• Actual workload – a workload-based approach to staffing based on past calls for service, taking into account other operational commitments placed on the department such as patrol duties, community policing, and administrative tasks.
Each one of these staffing methods will be discussed in detail for the GDP; however, a staffing plan based on actual workload is the method that paints the most complete picture of staffing needs. As will be examined, the actual workload method takes into account crime trend and per capita staffing levels, but it also takes into account other typical community demands such as crime prevention and safety programs, community policing, and active patrolling. Per Capita One of the more popular approaches to police staffing, the per-capita approach is designed to show how the officer-to-population ratio of a department compares to the ratio of other similar-sized departments. Ratios are typically expressed in terms of the number of full-time officers per 1,000 residents. Gahanna currently has a ratio of 1.6 officers per 1,000 residents. Chart 4-1 shows per-capita staffing level of sworn officers in the City of Gahanna compared to all cities in Ohio with a population of between 30,000 and 40,000 citizens in 2016. By making comparisons to similar cities, the per-capita method can demonstrate a baseline for the expected service level.
Chart 4-1: Police Staffing per Capita
Sources: Gahanna, Ohio Police & Fire Pension Fund, and the U.S. Census Bureau As shown in Chart 4-1, the City’s staffing level of 1.6 officers per 1,000 residents is the sixth highest officer-to-resident ratio among 21 cities in Ohio with populations between 30,000 and 40,000 residents. This is just one dataset to determine the actual workload.
400003800036000340003200030000
2.2
2.0
1.8
1.6
1.4
1.2
1.0
Population
Offi
cers
Per
1,0
00
LimaMarionMasonMassillonNorth OlmstedNorth RidgevilleNorth RoyaltonReynoldsburgStowUpper Arlington
Bowling Green
WestervilleWestlake
BrunswickDelawareFairbornGahannaGrove CityHilliardHuber HeightsLancaster
1.11.2 1.21.2
1.21.3 1.3
1.31.41.41.4
1.41.5
1.51.61.61.6
1.7 1.7
1.9
2.2
Gahanna
Median

City of Gahanna Performance Audit
Page 36
Crime Trends Chart 4-2 and Chart 4-3 show crime levels in Gahanna relative to the peers and other similar-sized Ohio cities for 2015.18 Crime rates can be an important component for understanding the demand for police services.
Chart 4-2: Violent Crime per 1,000 Residents Comparison 1
Sources: Gahanna, Ohio Department of Public Safety Office of Criminal Justice Services (OCJS), and the U.S. Census Bureau 1 Complete data for Delaware, Hilliard, and Reynoldsburg was unavailable through the OCJS.
18 2015 crime data is the most recent data available as of the completion of field work in April, 2017.
0.8
1.2
0.3
0.7
1.7 1.6
0
0.5
1
1.5
2
Gahanna Grove City Upper Arlington Westerville Average(30,000-40,000
Population)
Average (AllOhio Cities)
Vio
lent
Cri
me
per
1,00
0 R
esid
ents
City of Gahanna Performance Audit
Page 37
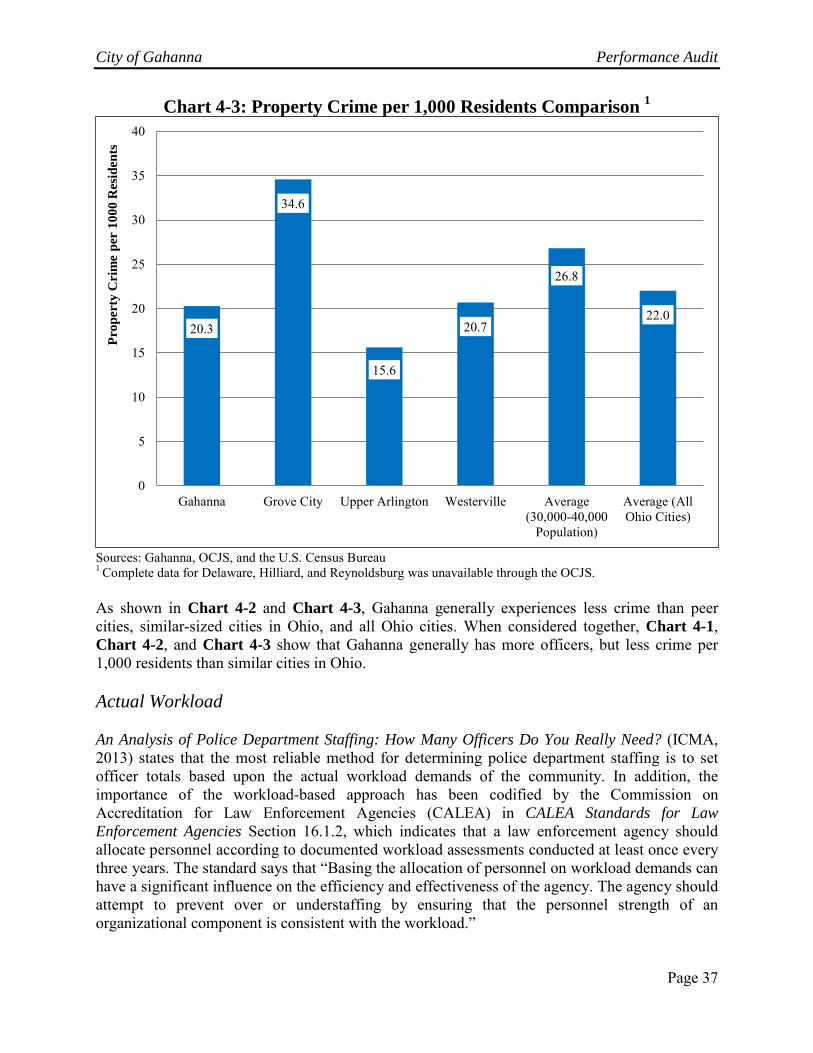
Chart 4-3: Property Crime per 1,000 Residents Comparison 1
Sources: Gahanna, OCJS, and the U.S. Census Bureau 1 Complete data for Delaware, Hilliard, and Reynoldsburg was unavailable through the OCJS. As shown in Chart 4-2 and Chart 4-3, Gahanna generally experiences less crime than peer cities, similar-sized cities in Ohio, and all Ohio cities. When considered together, Chart 4-1, Chart 4-2, and Chart 4-3 show that Gahanna generally has more officers, but less crime per 1,000 residents than similar cities in Ohio. Actual Workload An Analysis of Police Department Staffing: How Many Officers Do You Really Need? (ICMA, 2013) states that the most reliable method for determining police department staffing is to set officer totals based upon the actual workload demands of the community. In addition, the importance of the workload-based approach has been codified by the Commission on Accreditation for Law Enforcement Agencies (CALEA) in CALEA Standards for Law Enforcement Agencies Section 16.1.2, which indicates that a law enforcement agency should allocate personnel according to documented workload assessments conducted at least once every three years. The standard says that “Basing the allocation of personnel on workload demands can have a significant influence on the efficiency and effectiveness of the agency. The agency should attempt to prevent over or understaffing by ensuring that the personnel strength of an organizational component is consistent with the workload.”
20.3
34.6
15.6
20.7
26.8
22.0
0
5
10
15
20
25
30
35
40
Gahanna Grove City Upper Arlington Westerville Average(30,000-40,000
Population)
Average (AllOhio Cities)
Prop
erty
Cri
me
per
1000
Res
iden
ts
City of Gahanna Performance Audit
Page 38
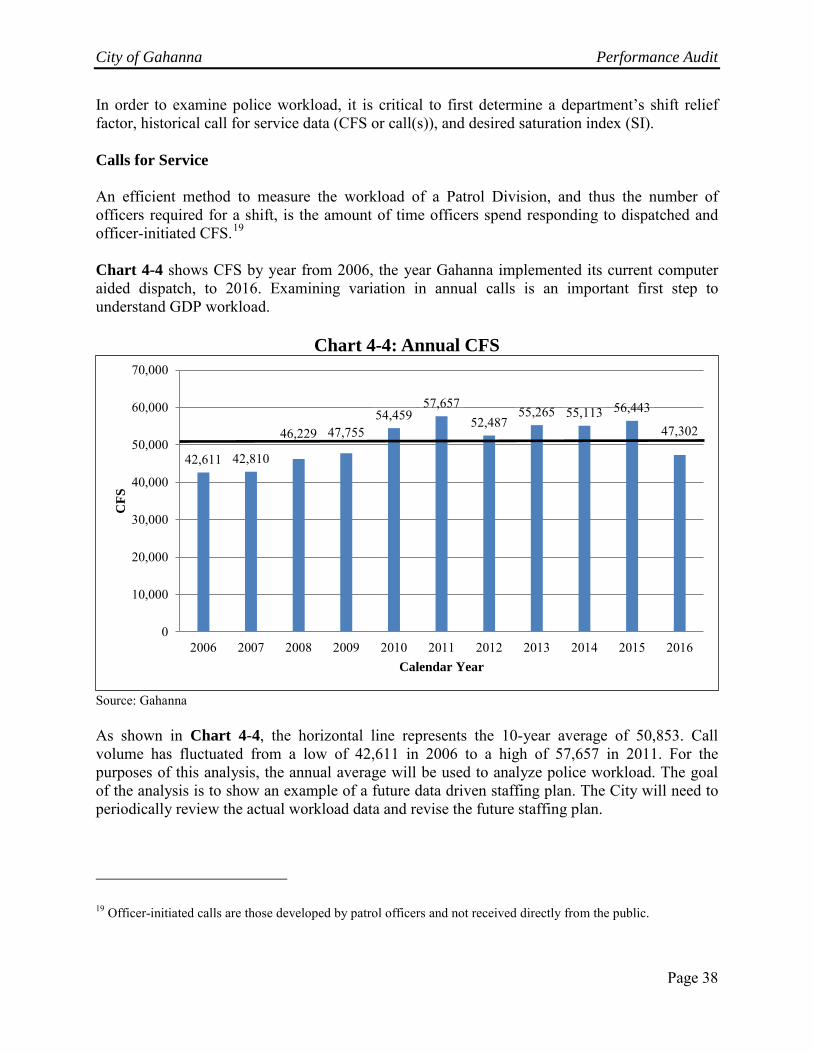
In order to examine police workload, it is critical to first determine a department’s shift relief factor, historical call for service data (CFS or call(s)), and desired saturation index (SI). Calls for Service An efficient method to measure the workload of a Patrol Division, and thus the number of officers required for a shift, is the amount of time officers spend responding to dispatched and officer-initiated CFS.19 Chart 4-4 shows CFS by year from 2006, the year Gahanna implemented its current computer aided dispatch, to 2016. Examining variation in annual calls is an important first step to understand GDP workload.
Chart 4-4: Annual CFS
Source: Gahanna As shown in Chart 4-4, the horizontal line represents the 10-year average of 50,853. Call volume has fluctuated from a low of 42,611 in 2006 to a high of 57,657 in 2011. For the purposes of this analysis, the annual average will be used to analyze police workload. The goal of the analysis is to show an example of a future data driven staffing plan. The City will need to periodically review the actual workload data and revise the future staffing plan.
19 Officer-initiated calls are those developed by patrol officers and not received directly from the public.
42,611 42,810
46,229 47,755 54,459
57,657 52,487
55,265 55,113 56,443
47,302
0
10,000
20,000
30,000
40,000
50,000
60,000
70,000
2006 2007 2008 2009 2010 2011 2012 2013 2014 2015 2016
CFS
Calendar Year

City of Gahanna Performance Audit
Page 39
According to the Division leadership, approximately 26.7 percent of all CFS involve a secondary officer (e.g., domestic situations, injury crashes, alarm runs, etc.).20 In addition, the length of a call is inherently different based upon its severity. Since 2006, the average length of a call has been 21.4 minutes. If 26.7 percent, or 13,578 of all calls, involve a second officer, the GDP averages 22,959 call hours per year. Chart 4-5 shows the average distribution of CFS by hour of the day and day of the week between 2006 and 2016. This chart is helpful for revealing the times of the day in which call volume is heaviest and lightest.
Chart 4-5: Average Dispatched CFS by Hour
Source: Gahanna As shown in Chart 4-5, on average, calls peak in the middle of second shift. This supports the GDP’s historical practice of assigning the most officers to second shift. However, the variation in call volume during the day also suggests that a more in-depth analysis of call volume could help further refine Division staffing.
20 From 2006 to 2016, only 5.0 percent of calls show a secondary officer assigned; however, Division leadership stated that second-officer calls were not being accurately depicted in the call log data. Therefore, a detailed review of each call type known to involve a second officer was performed for January 2017, and 26.7 percent of those calls were identified to be of the type that would typically necessitate a second officer.
0
500
1,000
1,500
2,000
2,500
3,000
3,500
06:0
0-06
:59
07:0
0-07
:59
08:0
0-08
:59
09:0
0-09
:59
10:0
0-10
:59
11:0
0-11
:59
12:0
0-12
:59
13:0
0-13
:59
14:0
0-14
:59
15:0
0-15
:59
16:0
0-16
:59
17:0
0-17
:59
18:0
0-18
:59
19:0
0-19
:59
20:0
0-20
:59
21:0
0-21
:59
22:0
0-22
:59
23:0
0-23
:59
00:0
0-00
:59
01:0
0-01
:59
02:0
0-02
:59
03:0
0-03
:59
04:0
0-04
:59
05:0
0-05
:59
1st Shift 2nd Shift 3rd Shift
Tot
al C
alls

City of Gahanna Performance Audit
Page 40
Saturation Index Before average annual call data can be used to determine staffing levels, City leadership must determine what percentage of an officer’s time should be spent handling calls and what percentage should be discretionary time spent on non-call activities (e.g., patrolling, community policing, administrative tasks, etc.). Establishing performance objectives is critical in determining the appropriate level of patrol staffing required to meet the expectations of the City and the community. According to An Analysis of Police Department Staffing: How Many Officers Do You Really Need? (ICMA, 2013), the ratio between the time that is dedicated to handling calls and discretionary time is known as the “saturation index” (SI). According to the ICMA, patrol staffing is optimally deployed when the SI is slightly less than 60.0 percent. “SI levels much lower than 60.0 percent, however, indicate patrol resources that are underutilized and signal an opportunity for a reduction in patrol resources or reallocation of police personnel.” In the case of an officer assigned to work an eight-hour shift, a 60.0 percent SI means that the officer is spending 4.8 of the available work hours of that shift handling calls. At a 100.0 percent SI, the officer would be spending the entire eight hours of the shift handling calls. Shift Relief Factor While an FTE is typically compensated for at least 2,080 hours per year, employees will be available for less than one full FTE of direct labor due to paid leave (such as sick vacation leave) and training. According to A Performance-Based Approach to Police Staffing and Allocation (Michigan State University, 2009), the relationship between the maximum number of days that an officer can work and what is actually worked is known as the “shift relief factor.” Knowing the shift relief factor is necessary to estimate the number of officers that should be assigned to a shift in order to ensure that the appropriate number of officers are working each day. A major factor that can impact the shift relief factor is the amount of leave available to police officers. Table 4-2 shows the calculation of the shift relief factor for patrol officers in Gahanna using operating data from 2013 through 2016. This is important for understanding how many total hours per year, on average, that an FTE patrol officer with the GDP is actually compensated relative to the average number of hours an officer can actually cover.
Table 4-2: GDP Shift Relief Factor Annual Compensated FTE hours 2,080 Average Annual Leave 452.5 Average Annual Training 92.2 Combined Leave and Training Hours 544.7 Annual Hours Available to Work 1,535.3 % of an FTE Available for Patrol 73.8% Total Hours Required for a Single Shift 1 2,920 Shift Relief Factor 2 1.9 Source: Gahanna 1 The hours required to put an officer on a single eight-hour shift for 365 days per year. 2 Hours required to staff a single shift divided by the annual hours available from a single FTE.
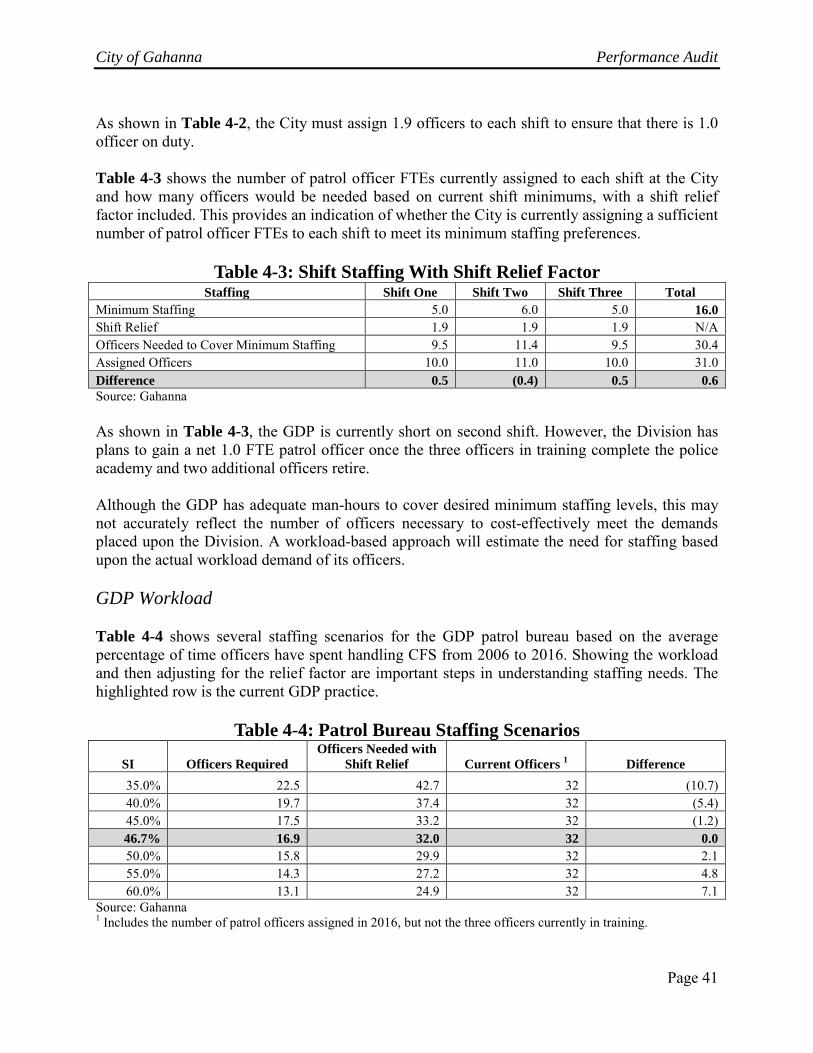
City of Gahanna Performance Audit
Page 41
As shown in Table 4-2, the City must assign 1.9 officers to each shift to ensure that there is 1.0 officer on duty. Table 4-3 shows the number of patrol officer FTEs currently assigned to each shift at the City and how many officers would be needed based on current shift minimums, with a shift relief factor included. This provides an indication of whether the City is currently assigning a sufficient number of patrol officer FTEs to each shift to meet its minimum staffing preferences.
Table 4-3: Shift Staffing With Shift Relief Factor Staffing Shift One Shift Two Shift Three Total
Minimum Staffing 5.0 6.0 5.0 16.0 Shift Relief 1.9 1.9 1.9 N/A Officers Needed to Cover Minimum Staffing 9.5 11.4 9.5 30.4 Assigned Officers 10.0 11.0 10.0 31.0 Difference 0.5 (0.4) 0.5 0.6 Source: Gahanna As shown in Table 4-3, the GDP is currently short on second shift. However, the Division has plans to gain a net 1.0 FTE patrol officer once the three officers in training complete the police academy and two additional officers retire. Although the GDP has adequate man-hours to cover desired minimum staffing levels, this may not accurately reflect the number of officers necessary to cost-effectively meet the demands placed upon the Division. A workload-based approach will estimate the need for staffing based upon the actual workload demand of its officers. GDP Workload Table 4-4 shows several staffing scenarios for the GDP patrol bureau based on the average percentage of time officers have spent handling CFS from 2006 to 2016. Showing the workload and then adjusting for the relief factor are important steps in understanding staffing needs. The highlighted row is the current GDP practice.
Table 4-4: Patrol Bureau Staffing Scenarios
SI Officers Required Officers Needed with
Shift Relief Current Officers 1 Difference 35.0% 22.5 42.7 32 (10.7) 40.0% 19.7 37.4 32 (5.4) 45.0% 17.5 33.2 32 (1.2) 46.7% 16.9 32.0 32 0.0 50.0% 15.8 29.9 32 2.1 55.0% 14.3 27.2 32 4.8 60.0% 13.1 24.9 32 7.1
Source: Gahanna 1 Includes the number of patrol officers assigned in 2016, but not the three officers currently in training.

City of Gahanna Performance Audit
Page 42
As shown in Table 4-4, GDP patrol officers currently dedicate 46.7 percent of time to handling calls. This analysis provides a general overview of the workload of the patrol bureau officers and the staffing options available to the City; however, to truly determine the appropriate level of desired staffing, it would be most beneficial to consider the workload of each individual patrol shift. In order to determine the workload levels of each shift, the total call volume received for each shift was examined. First Shift Since 2006, first-shift officers have handled an average of 15,502 CFS per year. The average call length on first shift was 20.6 minutes. If 26.7 percent or 4,139 first-shift calls are of the type that would involve two officers, first-shift officers have handled an average of 6,743 call hours per year. Table 4-5 shows staffing scenarios for first shift based on its historical call volume and SI across the entire shift. This analysis reflects the percentage of time first-shift officers have spent handling calls as well as how many officers would be required on first shift to meet performance measures established using SI percentages.
Table 4-5: Potential First Shift Staffing Scenarios
SI Officers Required Officers Needed with
Shift Relief Current Officers Difference 35.0% 6.6 12.5 10.0 (2.5) 40.0% 5.8 11.0 10.0 (1.0) 43.9% 5.3 10.0 10.0 0.0 45.0% 5.1 9.8 10.0 0.2 50.0% 4.6 8.8 10.0 1.2 55.0% 4.2 8.0 10.0 2.0 60.0% 3.9 7.3 10.0 2.7
Source: Gahanna As shown in Table 4-5, first-shift officers spend an average of 43.9 percent of their time handling CFS. If these officers were to spend 50.0 percent of their time handling calls, the patrol bureau staffing could operate with 9.0 FTE officers. If the patrol bureau were to staff 8.0 FTEs on first shift, that would result in an SI of 55.0 percent, still below the 60.0 percent level identified by the ICMA. Second Shift Since 2006, second-shift officers have handled an average of 23,094 CFS per year. The average call on second shift has lasted approximately 21.1 minutes. If 26.7 percent, or 6,166 second-shift calls are of the type that would involve two officers, second shift patrol officers handle an average of 10,290 hours per year.
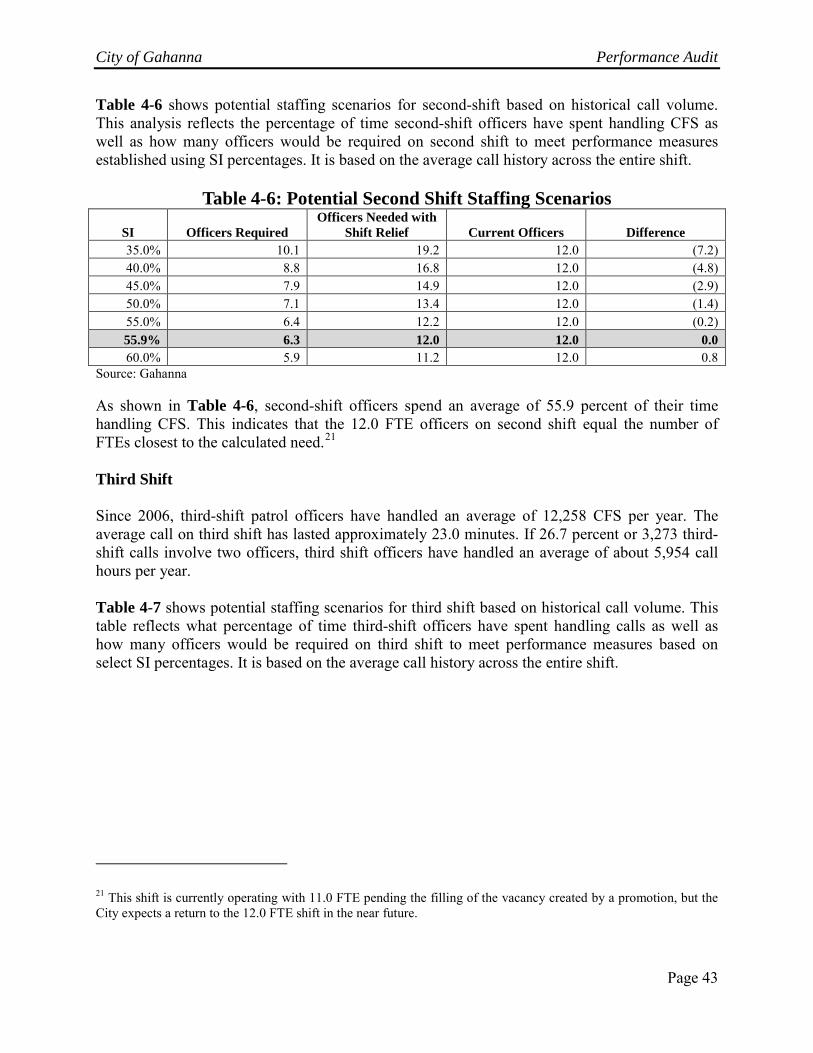
City of Gahanna Performance Audit
Page 43
Table 4-6 shows potential staffing scenarios for second-shift based on historical call volume. This analysis reflects the percentage of time second-shift officers have spent handling CFS as well as how many officers would be required on second shift to meet performance measures established using SI percentages. It is based on the average call history across the entire shift.
Table 4-6: Potential Second Shift Staffing Scenarios
SI Officers Required Officers Needed with
Shift Relief Current Officers Difference 35.0% 10.1 19.2 12.0 (7.2) 40.0% 8.8 16.8 12.0 (4.8) 45.0% 7.9 14.9 12.0 (2.9) 50.0% 7.1 13.4 12.0 (1.4) 55.0% 6.4 12.2 12.0 (0.2) 55.9% 6.3 12.0 12.0 0.0 60.0% 5.9 11.2 12.0 0.8
Source: Gahanna As shown in Table 4-6, second-shift officers spend an average of 55.9 percent of their time handling CFS. This indicates that the 12.0 FTE officers on second shift equal the number of FTEs closest to the calculated need.21 Third Shift Since 2006, third-shift patrol officers have handled an average of 12,258 CFS per year. The average call on third shift has lasted approximately 23.0 minutes. If 26.7 percent or 3,273 third-shift calls involve two officers, third shift officers have handled an average of about 5,954 call hours per year. Table 4-7 shows potential staffing scenarios for third shift based on historical call volume. This table reflects what percentage of time third-shift officers have spent handling calls as well as how many officers would be required on third shift to meet performance measures based on select SI percentages. It is based on the average call history across the entire shift.
21 This shift is currently operating with 11.0 FTE pending the filling of the vacancy created by a promotion, but the City expects a return to the 12.0 FTE shift in the near future.

City of Gahanna Performance Audit
Page 44
Table 4-7: Potential Third-Shift Staffing Scenarios
SI Officers Required Officers Needed with
Shift Relief Current Officers Difference 35.0% 5.8 11.1 10.0 (1.1) 38.7% 5.3 10.0 10.0 0.0 40.0% 5.1 9.7 10.0 0.3 45.0% 4.5 8.6 10.0 1.4 50.0% 4.1 7.8 10.0 2.2 55.0% 3.7 7.0 10.0 3.0 60.0% 3.4 6.5 10.0 3.5
Source: Gahanna As shown in Table 4-7, GDP patrol officers on third shift spend an average of 38.7 percent of their time on CFS. This signifies that the City could operate with 7.0 FTE officers on third shift and still not exceed the ICMA 60.0 percent SI threshold. As previously shown in Chart 4-5, third-shift call volume varies significantly from the beginning of the shift to the end. When examined further, the staffing need on third shift ranged from just 1.0 FTE during the 5:00 am hour on Mondays and Fridays to 7.1 FTEs during the 11:00 pm hour of Friday evening and 7.4 FTEs during the 10:00 pm hour on Saturday evening.22 Shift Staffing Table 4-8 shows the total number of officers needed on each shift to handle the average call volume for that shift at the 60.0 percent SI level. This is important for showing the actual minimum officers needed to handle the average workload of each shift, as well as the number of officers that should be assigned to each shift based on the GDP shift relief factor.
Table 4-8: Average Patrol Officers Needed per Shift Per ICMA Guidelines
Shift Avg. Workload per
Hour 1 60% SI Relief Factor Calculated Number
of Officers 2
First 2.3 3.9 1.9 8.0 Second 3.5 5.9 1.9 12.0 Third 2.0 3.4 1.9 8.0 Total 7.8 13.2 1.9 28.0 Source: Gahanna 1 This total reflects hours of work per shift hour. 2 Rounded up to nearest FTE officer. While GDP employs part-time patrol officers, the Division does not hire officers on a part-time basis. The calculated number for third shift was increased from 7.0 to 8.0 to account for the number of officers needed in order to remain under 100.0 percent SI during the early hours of the shift.
22 Third shift was the only shift where the calculated staffing level was not sufficient to remain below 100% SI during all hour blocks.

City of Gahanna Performance Audit
Page 45
As shown in Table 4-8, GDP requires 12.0 FTE officers to be assigned to second-shift and 8.0 FTE officers to be assigned to first and third shifts. While the third-shift staffing has been adjusted to reflect uneven peak workload, the Division could operate with 7.0 FTE officers on third-shift based on the average number of calls over the entire shift; however, the Division would require 8.0 FTE patrol officers on third-shift to handle the workload during the 11:00 pm hour on Friday and during the 10:00 pm hour on Saturday. Peak Call Volume The analysis above was based on the average call volume for a given shift. However, call volumes vary by hour of the day, day of the week, and month of the year; therefore, an examination of the peak call volume throughout a shift can be helpful for revealing the worst case scenario that the GDP might face. This can factor into how the Division might choose to staff each patrol shift, although staffing to the historical peak call volume is not the most economical or efficient method. Table 4-9 shows the number of patrol officers that would need to be assigned to a shift to handle the highest historical daily CFS between 2006 and 2016. This analysis provides an understanding of how many officers would be necessary to staff each shift relative to past peak call volume.
Table 4-9: Required Officers at 100% SI
Shift Peak Shift
Workload 1 100% SI Relief Factor Calculated Number
of Officers 2 First 61.7 7.7 1.9 15.0 Second 65.5 8.2 1.9 16.0 Third 43.2 5.4 1.9 11.0 Total 170.4 21.3 1.9 42.0 Source: Gahanna 1 Shows total workload for the busiest eight-hour shift that occurred between 2006 and 2016. 2 Rounded up to nearest FTE officer. While GDP employs part-time officers, the Division does not hire part-time patrol officers. As shown in Table 4-9, the peak historical call volume on each shift would require more officers than the City is currently assigning when accounting for shift relief factor. However, the 100.0 percent SI numbers indicate that the proposed staffing of 8.0 FTEs assigned to first and third shift and 12.0 FTEs assigned to second-shift would be adequate to handle the maximum historical call volume of those shifts if all officers were actually on duty and spent 100.0 percent of their time handling calls. There are some hours during which GDP patrol officers currently spend more than 60.0 percent of their time handling CFS on average, and other hour blocks in which the workload of the patrol officers is far below the 60.0 percent SI (see Appendix B, Tables B-1, B-2, B-3, and B-4). The ideal staffing situation would occur if the Division were able to assign the exact number of officers working at the exact hour to handle the call demand for that hour; however, the variable nature of workload demands and the fixed number of patrol officers assigned to each shift creates periods of personnel surplus and shortage throughout the day. The goal, therefore, is to
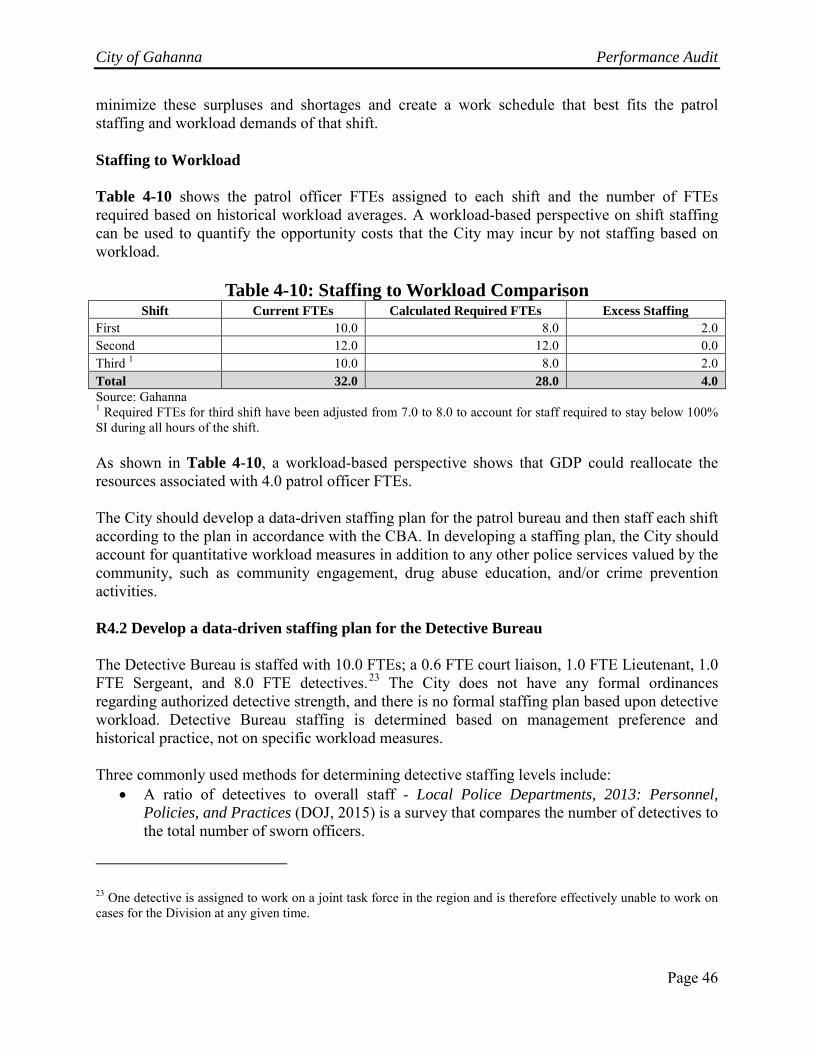
City of Gahanna Performance Audit
Page 46
minimize these surpluses and shortages and create a work schedule that best fits the patrol staffing and workload demands of that shift. Staffing to Workload Table 4-10 shows the patrol officer FTEs assigned to each shift and the number of FTEs required based on historical workload averages. A workload-based perspective on shift staffing can be used to quantify the opportunity costs that the City may incur by not staffing based on workload.
Table 4-10: Staffing to Workload Comparison Shift Current FTEs Calculated Required FTEs Excess Staffing
First 10.0 8.0 2.0 Second 12.0 12.0 0.0 Third 1 10.0 8.0 2.0 Total 32.0 28.0 4.0 Source: Gahanna 1 Required FTEs for third shift have been adjusted from 7.0 to 8.0 to account for staff required to stay below 100% SI during all hours of the shift. As shown in Table 4-10, a workload-based perspective shows that GDP could reallocate the resources associated with 4.0 patrol officer FTEs. The City should develop a data-driven staffing plan for the patrol bureau and then staff each shift according to the plan in accordance with the CBA. In developing a staffing plan, the City should account for quantitative workload measures in addition to any other police services valued by the community, such as community engagement, drug abuse education, and/or crime prevention activities. R4.2 Develop a data-driven staffing plan for the Detective Bureau The Detective Bureau is staffed with 10.0 FTEs; a 0.6 FTE court liaison, 1.0 FTE Lieutenant, 1.0 FTE Sergeant, and 8.0 FTE detectives.23 The City does not have any formal ordinances regarding authorized detective strength, and there is no formal staffing plan based upon detective workload. Detective Bureau staffing is determined based on management preference and historical practice, not on specific workload measures. Three commonly used methods for determining detective staffing levels include:
• A ratio of detectives to overall staff - Local Police Departments, 2013: Personnel, Policies, and Practices (DOJ, 2015) is a survey that compares the number of detectives to the total number of sworn officers.
23 One detective is assigned to work on a joint task force in the region and is therefore effectively unable to work on cases for the Division at any given time.
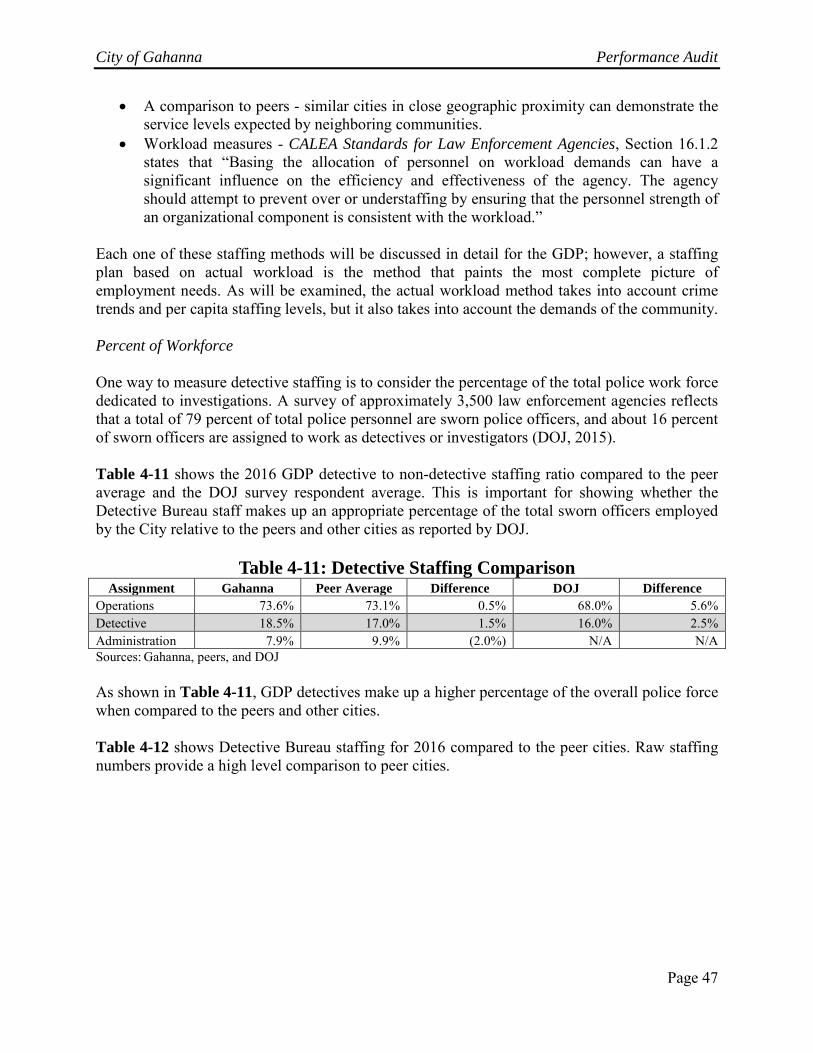
City of Gahanna Performance Audit
Page 47
• A comparison to peers - similar cities in close geographic proximity can demonstrate the service levels expected by neighboring communities.
• Workload measures - CALEA Standards for Law Enforcement Agencies, Section 16.1.2 states that “Basing the allocation of personnel on workload demands can have a significant influence on the efficiency and effectiveness of the agency. The agency should attempt to prevent over or understaffing by ensuring that the personnel strength of an organizational component is consistent with the workload.”
Each one of these staffing methods will be discussed in detail for the GDP; however, a staffing plan based on actual workload is the method that paints the most complete picture of employment needs. As will be examined, the actual workload method takes into account crime trends and per capita staffing levels, but it also takes into account the demands of the community. Percent of Workforce One way to measure detective staffing is to consider the percentage of the total police work force dedicated to investigations. A survey of approximately 3,500 law enforcement agencies reflects that a total of 79 percent of total police personnel are sworn police officers, and about 16 percent of sworn officers are assigned to work as detectives or investigators (DOJ, 2015). Table 4-11 shows the 2016 GDP detective to non-detective staffing ratio compared to the peer average and the DOJ survey respondent average. This is important for showing whether the Detective Bureau staff makes up an appropriate percentage of the total sworn officers employed by the City relative to the peers and other cities as reported by DOJ.
Table 4-11: Detective Staffing Comparison Assignment Gahanna Peer Average Difference DOJ Difference
Operations 73.6% 73.1% 0.5% 68.0% 5.6% Detective 18.5% 17.0% 1.5% 16.0% 2.5% Administration 7.9% 9.9% (2.0%) N/A N/A Sources: Gahanna, peers, and DOJ As shown in Table 4-11, GDP detectives make up a higher percentage of the overall police force when compared to the peers and other cities. Table 4-12 shows Detective Bureau staffing for 2016 compared to the peer cities. Raw staffing numbers provide a high level comparison to peer cities.
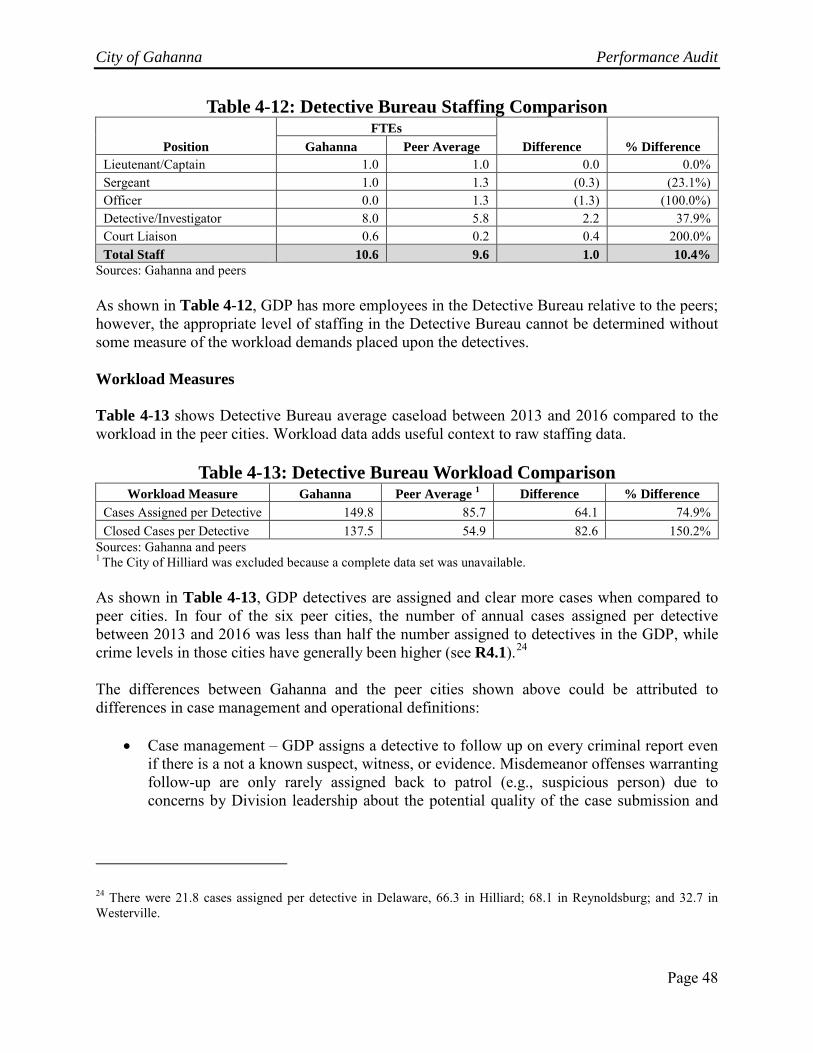
City of Gahanna Performance Audit
Page 48
Table 4-12: Detective Bureau Staffing Comparison
Position FTEs
Difference % Difference Gahanna Peer Average Lieutenant/Captain 1.0 1.0 0.0 0.0% Sergeant 1.0 1.3 (0.3) (23.1%) Officer 0.0 1.3 (1.3) (100.0%) Detective/Investigator 8.0 5.8 2.2 37.9% Court Liaison 0.6 0.2 0.4 200.0% Total Staff 10.6 9.6 1.0 10.4%
Sources: Gahanna and peers As shown in Table 4-12, GDP has more employees in the Detective Bureau relative to the peers; however, the appropriate level of staffing in the Detective Bureau cannot be determined without some measure of the workload demands placed upon the detectives. Workload Measures Table 4-13 shows Detective Bureau average caseload between 2013 and 2016 compared to the workload in the peer cities. Workload data adds useful context to raw staffing data.
Table 4-13: Detective Bureau Workload Comparison Workload Measure Gahanna Peer Average 1 Difference % Difference
Cases Assigned per Detective 149.8 85.7 64.1 74.9% Closed Cases per Detective 137.5 54.9 82.6 150.2%
Sources: Gahanna and peers 1 The City of Hilliard was excluded because a complete data set was unavailable. As shown in Table 4-13, GDP detectives are assigned and clear more cases when compared to peer cities. In four of the six peer cities, the number of annual cases assigned per detective between 2013 and 2016 was less than half the number assigned to detectives in the GDP, while crime levels in those cities have generally been higher (see R4.1).24 The differences between Gahanna and the peer cities shown above could be attributed to differences in case management and operational definitions:
• Case management – GDP assigns a detective to follow up on every criminal report even if there is a not a known suspect, witness, or evidence. Misdemeanor offenses warranting follow-up are only rarely assigned back to patrol (e.g., suspicious person) due to concerns by Division leadership about the potential quality of the case submission and
24 There were 21.8 cases assigned per detective in Delaware, 66.3 in Hilliard; 68.1 in Reynoldsburg; and 32.7 in Westerville.

City of Gahanna Performance Audit
Page 49
the likelihood of conviction when the case rests with the court. In five of six peers, a non-detective may be assigned the initial follow-up on a felony case.25
• Operational definitions – GDP detectives are responsible for closing all cases. This differs from the practices of four of the six peers, where a detective sergeant or lieutenant will review the cases and decide which can be closed.26 A GDP case is considered closed when no further action or follow up is warranted (e.g., arrest or evidence sent to the grand jury, unfounded, cleared by exception, warrant issued, etc.). An inactive case (e.g., victim refused to cooperate, no additional leads, etc.) is also considered closed, but can be re-opened if additional evidence, suspects, or witnesses emerge. This differs from the practices in the City of Delaware, where an inactive case is placed in “inactive pending additional information” status and is not considered closed.
Variations in case management practices and differing operational definitions render it difficult to make meaningful comparisons with peer cities. For this reason, the City could benefit from a staffing assessment based on its actual workload. One factor that can impact detective workload levels is the crime rate; however, crime levels in Gahanna are lower than in peers and similar-sized cities in Ohio (see R4.1). Another factor that has a bearing on workload measures are the types of cases handled by the detectives, since case types vary in length based on their complexity. Allocation of Personnel: Investigations (Pummel, 2007), calculated the average workload within the Charlotte County, Florida sheriff’s department based on how many cases could be closed annually given the case types handled by certain units. Homicide, robbery, and aggravated assault or battery cases were found to be the most complex and would therefore require the most resources to investigate. Chart 4-5 shows the number of homicide, robbery, and aggravated assault or battery cases reported to the FBI’s National Incident-Based Reporting System (NIBRS) by the GDP in 2015, the most recent year for which data was available. The numbers and types of cases are recognized as major drivers of detective workload.
25 Cities with this practice include Delaware, Hilliard, Reynoldsburg, Upper Arlington, and Westerville. 26 Cities with this practice include Grove City, Hilliard, Upper Arlington, and Westerville.
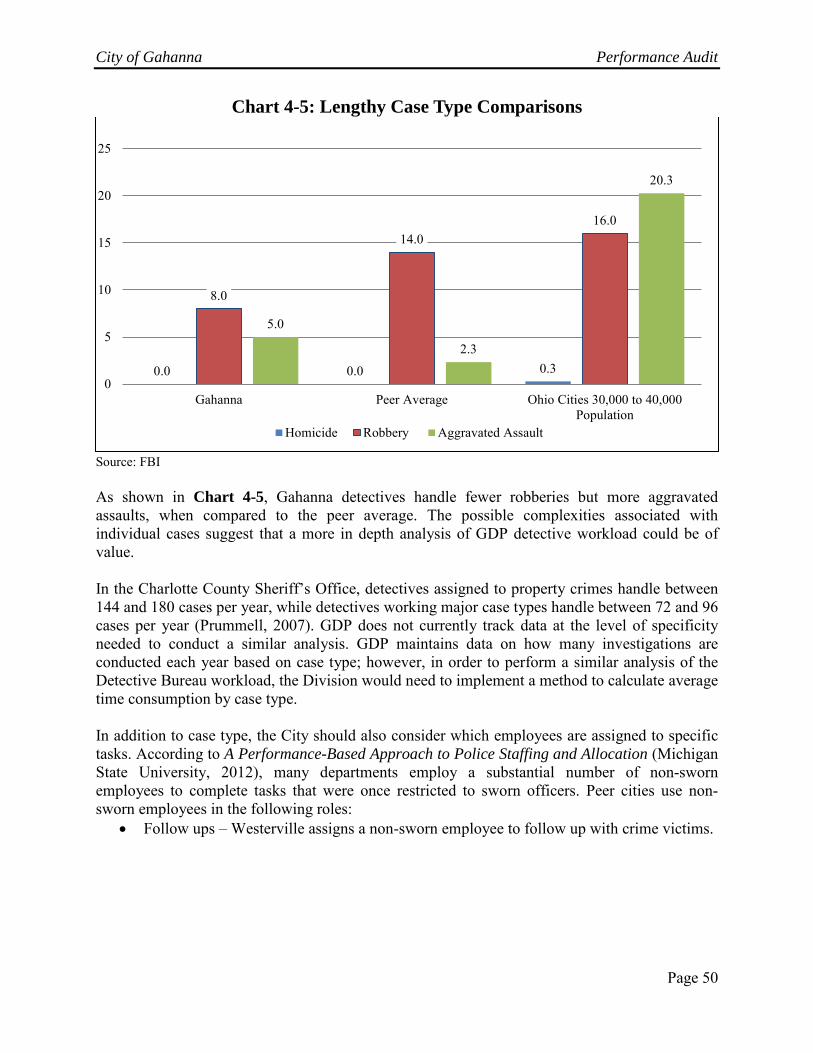
City of Gahanna Performance Audit
Page 50
Chart 4-5: Lengthy Case Type Comparisons
Source: FBI As shown in Chart 4-5, Gahanna detectives handle fewer robberies but more aggravated assaults, when compared to the peer average. The possible complexities associated with individual cases suggest that a more in depth analysis of GDP detective workload could be of value. In the Charlotte County Sheriff’s Office, detectives assigned to property crimes handle between 144 and 180 cases per year, while detectives working major case types handle between 72 and 96 cases per year (Prummell, 2007). GDP does not currently track data at the level of specificity needed to conduct a similar analysis. GDP maintains data on how many investigations are conducted each year based on case type; however, in order to perform a similar analysis of the Detective Bureau workload, the Division would need to implement a method to calculate average time consumption by case type. In addition to case type, the City should also consider which employees are assigned to specific tasks. According to A Performance-Based Approach to Police Staffing and Allocation (Michigan State University, 2012), many departments employ a substantial number of non-sworn employees to complete tasks that were once restricted to sworn officers. Peer cities use non-sworn employees in the following roles:
• Follow ups – Westerville assigns a non-sworn employee to follow up with crime victims.
0.0 0.0 0.3
8.0
14.0 16.0
5.0
2.3
20.3
0
5
10
15
20
25
Gahanna Peer Average Ohio Cities 30,000 to 40,000Population
Homicide Robbery Aggravated Assault

City of Gahanna Performance Audit
Page 51
• Court liaisons – Five out of six peers either do not employ a court liaison or assign those tasks to a non-sworn employee.27
• Property room – Five out of six peers use a non-sworn employee to manage the property room.28
The GDP should implement a process to track detective workload by specific case and use the collected data to build a data-driven staffing plan for the Detective Bureau. As part of the plan, the GDP should consider if it would be appropriate to shift some duties to non-sworn employees. If the City could shift additional duties to non-sworn employees, the reduction in the workload of sworn officers could allow the City to allocate resources more efficiently. As with all policies affecting public safety, the City should consider both the economic and non-economic implications before making a change of this type. R4.3 Reduce police dispatch overtime Gahanna provides 24-hour police dispatch service. In addition, the City has the technical ability to share call loads with the cities of Bexley, Reynoldsburg, New Albany, and Whitehall. The function is staffed by 9.0 FTE dispatchers and 1.0 FTE Lead Dispatcher.29 Gahanna lacks a data-driven staffing plan to determine the appropriate level of staffing needed to maintain current service levels. Instead, two dispatchers are assigned to each eight-hour shift on a staggered schedule, with each employee assigned to five days on duty and two days off each week. From 2014 through 2016, the City used an average of 18,415.4 dispatch hours per year, of which 3,313 hours, or 18.0 percent, were for overtime. The provision of overtime is governed by the FOP/OLC CBA (see R3.1). Overtime accrues if a dispatcher works more than eight hours in a single day or more than 40 hours in a week. Overtime may be used to cover a long call; for training; or to provide a second dispatcher when the shift is short-staffed, which is referred to as shift-coverage overtime. An employee can choose between two options for overtime compensation:
• Cash payout - An employee can elect to receive the cash value of the overtime calculated using base pay, plus any shift differential, multiplied by the appropriate overtime rate (from 1.5 times to 2.5 times the regular wage).
• Compensatory time – An employee can elect to receive the value of overtime as compensatory time (paid time off that can be used at a later date).30
The following analysis will evaluate overtime and compensatory time hours worked. For example, if a dispatcher worked one hour of overtime but was compensated at 2.5 times the
27 Delaware and Westerville do not employ a court liaison, while the court liaisons in Grove City, Reynoldsburg, and Upper Arlington are civilian employees. 28 Cities with this practice include Delaware, Grove City, Hilliard, Reynoldsburg, and Westerville. 29 The Lead Dispatcher covers shifts and makes the work schedule for other dispatchers. 30 Dispatchers can accrue a balance of up to 180 hours of compensatory time and can elect to receive the cash value of accrued compensatory time at the end of the calendar year.

City of Gahanna Performance Audit
Page 52
normal rate of pay, this analysis will focus on the hour worked as opposed to the 2.5 hours compensated. In addition, overtime and compensatory time will be calculated together and referred to collectively as “earned overtime”. In order to assess appropriate staffing levels, it is important to first determine the actual labor capacity of a dispatch FTE. While an FTE is typically compensated for at least 2,080 hours per year, employees will be available for less than one full FTE of direct labor due to leave and training. Table 4-14 shows the time available for direct labor after deducting average leave and training for 2016. Calculating available labor in this manner provides an indication of the average total annual hours that a dispatcher will be available for shift coverage.
Table 4-14: Dispatcher Direct Labor Regular Total Hours per FTE 2,080 Average Leave Hours per FTE 1 556 Average Training Hours per FTE 20 Available Direct Labor Hours per FTE 1,504 Available Direct Labor Hours as a % of FTE 72.3%
Dispatch FTEs (2016) 10.0 Compensated FTE Hours 20,800 Available Direct Labor Hours 15,040 Source: Gahanna 1 Includes vacation, compensatory time, and sick leave. As shown in Table 4-14, the City can expect a dispatcher FTE to be available for 1,504 hours per year for shift coverage, or 72.3 percent of one FTE. Leave can have a negative impact on available labor; therefore, negotiating CBA provisions to be more similar to peer cities could help the City reduce leave accrual and therefore increase the direct labor hours available for each FTE (see R3.1). Table 4-15 shows an analysis of dispatch staffing practices and makes comparisons between shift-hours needed and direct FTE hours available in 2016.

City of Gahanna Performance Audit
Page 53
Table 4-15: Dispatcher Staffing Practices Hours per Shift per Employee 8 Employees Assigned per Shift Staffing 2 Total Work Hours per Shift 16 Daily Shifts 3 Total Daily Shift Hours 48 Total Annual Shift Hours 17,520 Actual Available Direct Labor Hours 15,040 Labor Hours Deficit 2,480 Source: Gahanna As shown in Table 4-15, the City is 2,480 hours short of the direct labor hours needed to maintain 24-hour-per-day, two-dispatcher coverage. Currently, the majority of overtime is used to cover shift hours (see Chart 4-7). However, depending on the total hours needed and respective rates of pay, the practice of using overtime to cover these hours may or may not be more economically efficient relative to adding additional employees. Chart 4-6 shows earned overtime and regular hours for 2014 through 2016. Comparing overtime and regular hours is a useful way to understand the extent to which the dispatch function relies on overtime for routine operations.
Chart 4-6: Historical Dispatch Hours Breakdown
Source: Gahanna As shown in Chart 4-6, overtime has accounted for between 2,884.5 hours, or 20.1 percent of regular hours; and 3,844.8, or 25.6 percent of regular hours, for the last three years. In total,
2,884.5 3,844.8 3,210.8
14,339.3 15,027.3 15,939.8
0.0
5,000.0
10,000.0
15,000.0
20,000.0
25,000.0
2014 2015 2016
Hou
rs
Year
Earned Overtime Regular Hours

City of Gahanna Performance Audit
Page 54
overtime hours have accounted for an average of 3,313.3, or 21.9 percent of regular hours during the last three years. Chart 4-7 shows dispatcher overtime broken out by purpose for 2016. Examining overtime by type and purpose can help identify the causes of overtime so that strategies may be developed to mitigate potential inefficiencies.
Chart 4-7: Purpose of Earned Overtime
Source: Gahanna Note: While other shift coverage hours were identified by the City, detailed information was not available to specifically attribute these hours to first, second, or third shift. As shown in Chart 4-7, shift coverage overtime accounted for 2,991.6 hours, or 93.2 percent of the total amount of earned overtime hours for 2016. Specifically, third shift coverage required 1,251.5 hours. In addition, first shift coverage required 1,119.8 hours. Finally, second shift coverage required 586.8 hours. Chart 4-8 shows a comparison of the cost of overtime and an FTE at the regular rate. Showing overtime and full-time costs in this manner can be useful when deciding if it is more cost effective to accrue additional overtime or hire an additional FTE.
33.5
104.3
114.0
586.8
1,119.8
1,251.5
0.0 200.0 400.0 600.0 800.0 1,000.0 1,200.0 1,400.0
Other Shift Coverage
All Other
Training
Cover 2nd Shift
Cover 1st Shift
Cover 3rd Shift

City of Gahanna Performance Audit
Page 55
Chart 4-8: Overtime and Regular FTE Costs 1
Source: Gahanna 1 Overtime costs are equal to $50.49 per hour; regular hourly cost are $30.99 and include the starting dispatcher pay of $19.50 per hour base pay, $9.70 per hour for fringe benefits, and $1,348 for human resources costs (see R1.1). As shown in Chart 4-8, the cost of allowing existing employees to accrue overtime exceeds the cost of hiring an additional FTE at 1,303.3 hours per year. Because a newly hired FTE will be available for up to 1,860 direct labor hours per year, it could be cost beneficial for the City to replace overtime with an entry level dispatcher for between 1,303.3 and 1,860 direct labor hours per year.31 One factor that will affect potential hiring is the nature of needed shift coverage. While a newly hired FTE will have 1,860 labor hours available each year, the City’s highest need for shift coverage is 1,251.5 hours on third shift. In addition, it may be infeasible for the City to hire a dispatcher for less than 0.5 FTE, or 930 hours per year. Table 4-16 shows the cost of shift-coverage overtime compared to the cost of hiring additional dispatchers to cover the deficit in shift-coverage hours in 2016. Evaluating staffing decisions using this type of cost/benefit analysis will help the City optimize the dispatch staff and minimize overtime costs.
31 A newly-hired dispatcher will receive 80 hours of vacation, 120 hours of sick leave, and 20 hours of training. This leaves 1,860 hours, or 89.4 percent of an FTE, for direct labor.
$0
$20,000
$40,000
$60,000
$80,000
$100,000
$120,000
50 150
250
350
450
550
650
750
850
950
1,050
1,150
1,250
1,350
1,450
1,550
1,650
1,750
1,850
1,900
2,000
2,100C
osts
Labor Hours
Direct Labor Shift-Coverage Earned Overtime Cost of a Full FTE
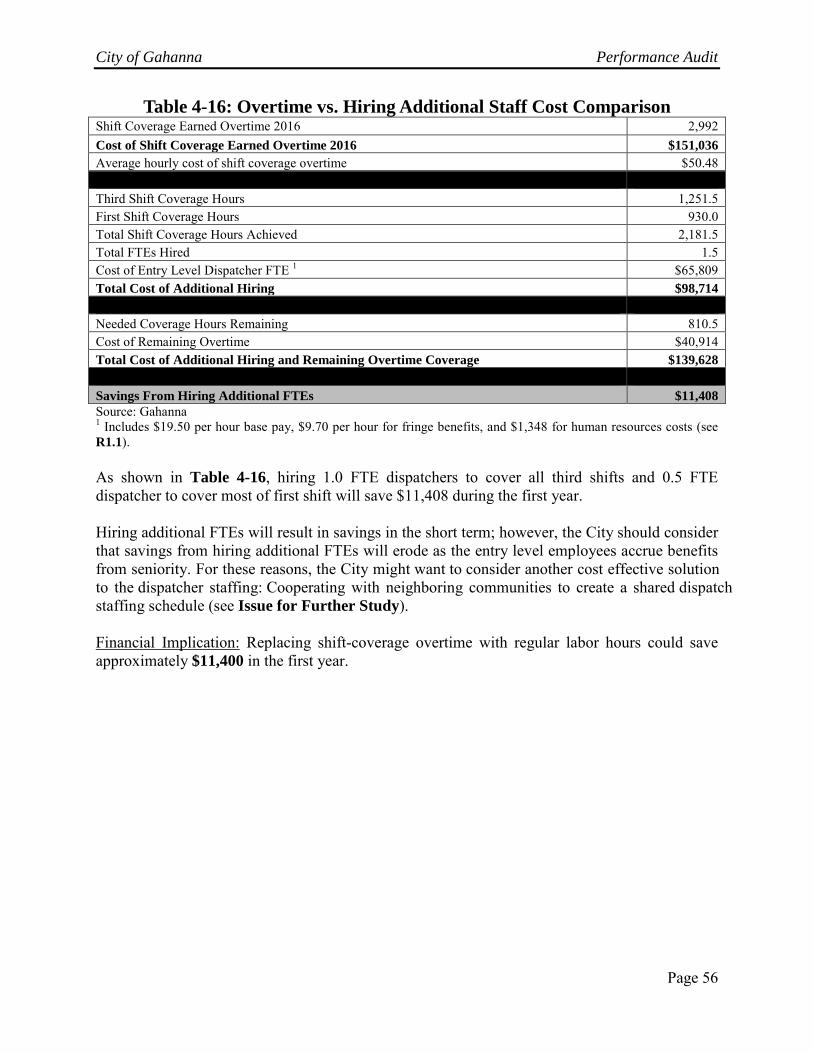
City of Gahanna Performance Audit
Page 56
Table 4-16: Overtime vs. Hiring Additional Staff Cost Comparison Shift Coverage Earned Overtime 2016 2,992 Cost of Shift Coverage Earned Overtime 2016 $151,036 Average hourly cost of shift coverage overtime $50.48 Third Shift Coverage Hours 1,251.5 First Shift Coverage Hours 930.0 Total Shift Coverage Hours Achieved 2,181.5 Total FTEs Hired 1.5 Cost of Entry Level Dispatcher FTE 1 $65,809 Total Cost of Additional Hiring $98,714 Needed Coverage Hours Remaining 810.5 Cost of Remaining Overtime $40,914 Total Cost of Additional Hiring and Remaining Overtime Coverage $139,628 Savings From Hiring Additional FTEs $11,408 Source: Gahanna 1 Includes $19.50 per hour base pay, $9.70 per hour for fringe benefits, and $1,348 for human resources costs (see R1.1). As shown in Table 4-16, hiring 1.0 FTE dispatchers to cover all third shifts and 0.5 FTE dispatcher to cover most of first shift will save $11,408 during the first year. Hiring additional FTEs will result in savings in the short term; however, the City should consider that savings from hiring additional FTEs will erode as the entry level employees accrue benefits from seniority. For these reasons, the City might want to consider another cost effective solution to the dispatcher staffing: Cooperating with neighboring communities to create a shared dispatchstaffing schedule (see Issue for Further Study). Financial Implication: Replacing shift-coverage overtime with regular labor hours could save approximately $11,400 in the first year.

City of Gahanna Performance Audit
Page 57
5. Public Service Background The Department of Public Service and Engineering (Service) is responsible for the planning, maintenance, and operation of the water, sewer, and storm sewer systems.32 In addition, Service plans and maintains streets and maintains all City-owned vehicles. Service is subdivided into the following functional areas:
• Service Administration (Administration) – responsible for overseeing all aspects of Department operations and executing policies set by elected officials. Staffing includes the 1.0 FTE Director, 1.0 FTE Deputy Director, 1.0 FTE Fleet Management Superintendent, 1.0 FTE Streets and Utilities Superintendent, and 3.0 FTE support personnel. Administration is funded by the General Fund.
• Building and Zoning (Building) – responsible for issuing building permits and investigating zoning issues. Staffing includes 1.0 FTE Chief Building and Zoning Official, 1.0 FTE Building and Heating Inspector and 3.4 FTE support personnel. Building is funded by the General Fund.
• Engineering – responsible for planning improvement projects for major City infrastructure. Staffing includes the 1.0 FTE City Engineer, 1.0 FTE Water Resource Engineer, and 2.1 FTE support personnel. Engineering is funded by the General Fund.
• Billing – responsible for billing residents for water, sewer, and storm sewer services. Staffing includes 3.0 FTE utility billing specialists. Billing is funded by the Utility Funds.
• Service Garage – responsible for maintaining City-owned vehicles and equipment. Staffing includes the 1.0 FTE Fleet Technician Foreman and 3.0 FTE fleet technicians (see R5.1). The Service Garage is funded primarily by the General Fund in addition to a flat $25,790 annual charge to the utility funds for services on utility vehicles.
• Streets – responsible for performing routine maintenance and construction on City streets, snow and ice control during the winter, and mowing during the summer. Staffing includes the 1.0 FTE Street Foreman, 5.0 FTE equipment operators, and 0.2 FTE seasonal service workers. Streets employees also perform work for Utilities on an as-needed basis. Streets are funded by the Streets Fund.
• Utilities – responsible for performing routine maintenance and construction on the water, sewer, and storm sewer infrastructure. Staffing includes the 1.0 FTE Utility Foreman, 7.0 FTE equipment operators, and 0.2 FTE seasonal workers. Utilities employees perform work for Streets as-needed. Utilities are funded by user fees.
• Maintenance – responsible for performing routine maintenance on City-owned facilities. Staffing includes 1.0 FTE employee. Maintenance is funded by the General Fund.
32 Gahanna purchases water and sewer service from the City of Columbus but is responsible for utility billing and the maintenance and operation of water, sewer, and storm sewer infrastructure within the City.

City of Gahanna Performance Audit
Page 58
Chart 5-1 shows Service expenditure allocation by fund for 2016. Showing expenditures by fund demonstrates the impact of each fund on total department expenditures.
Chart 5-1: Service All Fund Expenditure Allocation
Source: Gahanna As shown on Chart 5-1, approximately $15.4 million, or 77.3 percent of the Service’s overall expenditures, were in the Water and Sewer Funds. The General Fund is the third largest, with approximately $2.9 million, or 14.6 percent of overall expenditures. While the General Fund is the third largest expenditure category, it is the expenditure category over which the City has the most discretion. Chart 5-2 shows Service’s General Fund expenditures broken down by function for 2016. Showing General Fund expenditures in this manner provides an indication of the areas where Service allocates discretionary resources.
$9,543,852
$5,947,846
$2,923,703 $1,643,960
47.6%
29.7%
14.6%
8.2%
0.0%
5.0%
10.0%
15.0%
20.0%
25.0%
30.0%
35.0%
40.0%
45.0%
50.0%
$0
$2,000,000
$4,000,000
$6,000,000
$8,000,000
$10,000,000
$12,000,000
Water Sewer General Fund Streets
Perc
ent o
f Tot
al
2016
Exp
endi
ture
s

City of Gahanna Performance Audit
Page 59
Chart 5-2: Service General Fund Expenditure Allocation
Source: Gahanna As shown in Chart 5-2, of the $2.9 million in General Fund expenditures, 40.4 percent, or approximately $1.2 million, was spent on fleet maintenance. This includes parts and salaries and benefits for the City’s 1.0 FTE Fleet Superintendent and 4.0 FTE fleet technicians in the Service Garage. Due to its outsized impact on Service general fund expenditures, overall improvements in fleet maintenance may offer the best opportunity to reduce General Fund expenditures in Service.
40.4%
23.5%
15.5%
9.7% 7.3% 2.8%
0.8%
0.0%
5.0%
10.0%
15.0%
20.0%
25.0%
30.0%
35.0%
40.0%
45.0%
$0
$200,000
$400,000
$600,000
$800,000
$1,000,000
$1,200,000
$1,400,000
Perc
ent o
f Tot
al
2016
Exp
endi
ture
s
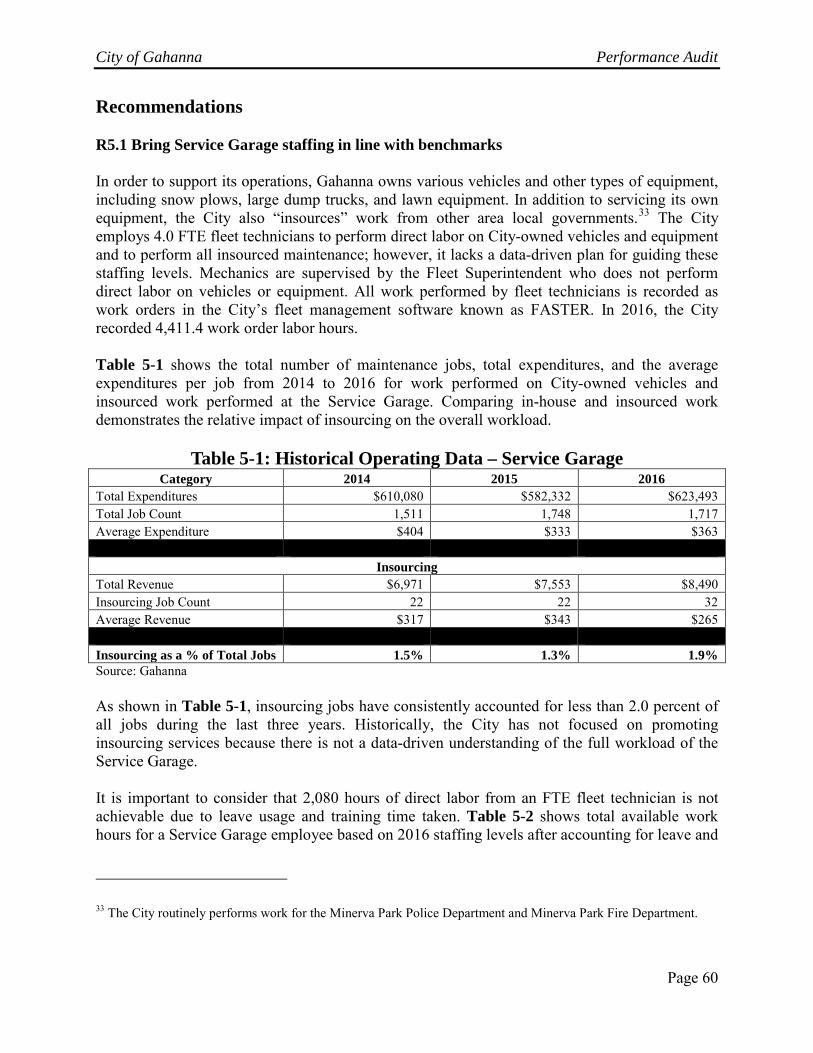
City of Gahanna Performance Audit
Page 60
Recommendations R5.1 Bring Service Garage staffing in line with benchmarks In order to support its operations, Gahanna owns various vehicles and other types of equipment, including snow plows, large dump trucks, and lawn equipment. In addition to servicing its own equipment, the City also “insources” work from other area local governments.33 The City employs 4.0 FTE fleet technicians to perform direct labor on City-owned vehicles and equipment and to perform all insourced maintenance; however, it lacks a data-driven plan for guiding these staffing levels. Mechanics are supervised by the Fleet Superintendent who does not perform direct labor on vehicles or equipment. All work performed by fleet technicians is recorded as work orders in the City’s fleet management software known as FASTER. In 2016, the City recorded 4,411.4 work order labor hours. Table 5-1 shows the total number of maintenance jobs, total expenditures, and the average expenditures per job from 2014 to 2016 for work performed on City-owned vehicles and insourced work performed at the Service Garage. Comparing in-house and insourced work demonstrates the relative impact of insourcing on the overall workload.
Table 5-1: Historical Operating Data – Service Garage Category 2014 2015 2016
Total Expenditures $610,080 $582,332 $623,493 Total Job Count 1,511 1,748 1,717 Average Expenditure $404 $333 $363
Insourcing
Total Revenue $6,971 $7,553 $8,490 Insourcing Job Count 22 22 32 Average Revenue $317 $343 $265
Insourcing as a % of Total Jobs 1.5% 1.3% 1.9% Source: Gahanna As shown in Table 5-1, insourcing jobs have consistently accounted for less than 2.0 percent of all jobs during the last three years. Historically, the City has not focused on promoting insourcing services because there is not a data-driven understanding of the full workload of the Service Garage. It is important to consider that 2,080 hours of direct labor from an FTE fleet technician is not achievable due to leave usage and training time taken. Table 5-2 shows total available work hours for a Service Garage employee based on 2016 staffing levels after accounting for leave and
33 The City routinely performs work for the Minerva Park Police Department and Minerva Park Fire Department.
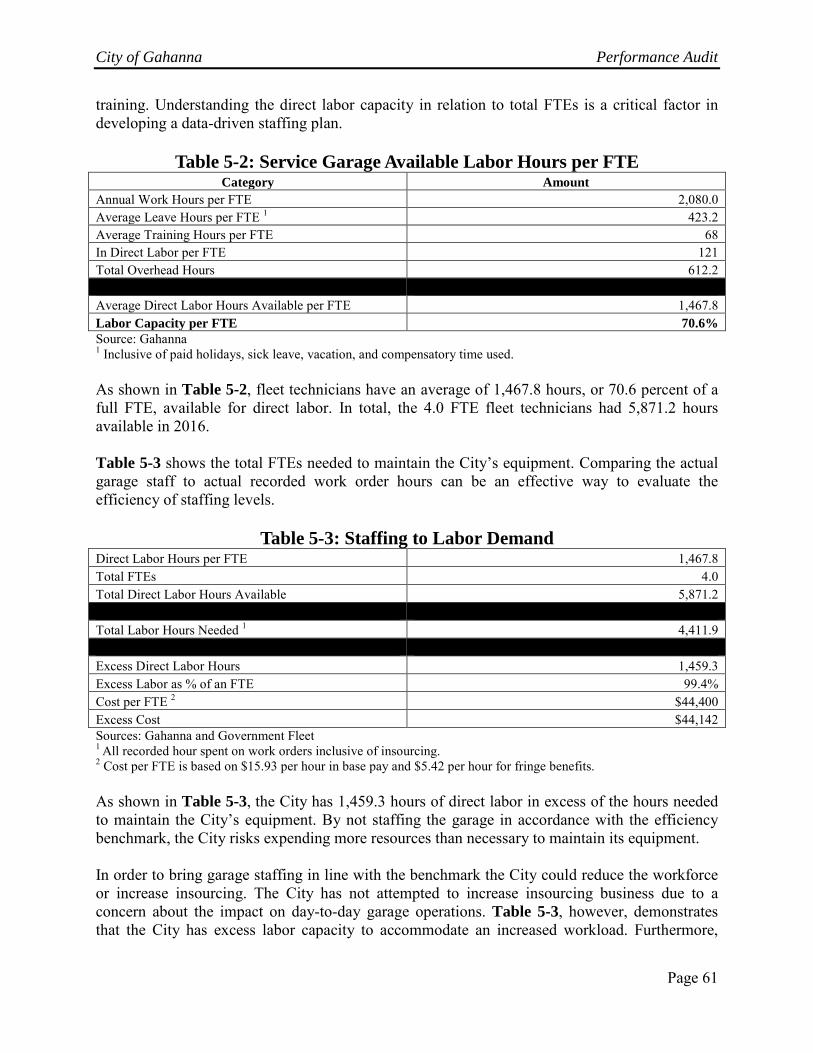
City of Gahanna Performance Audit
Page 61
training. Understanding the direct labor capacity in relation to total FTEs is a critical factor in developing a data-driven staffing plan.
Table 5-2: Service Garage Available Labor Hours per FTE Category Amount
Annual Work Hours per FTE 2,080.0 Average Leave Hours per FTE 1 423.2 Average Training Hours per FTE 68 In Direct Labor per FTE 121 Total Overhead Hours 612.2 Average Direct Labor Hours Available per FTE 1,467.8 Labor Capacity per FTE 70.6% Source: Gahanna 1 Inclusive of paid holidays, sick leave, vacation, and compensatory time used. As shown in Table 5-2, fleet technicians have an average of 1,467.8 hours, or 70.6 percent of a full FTE, available for direct labor. In total, the 4.0 FTE fleet technicians had 5,871.2 hours available in 2016. Table 5-3 shows the total FTEs needed to maintain the City’s equipment. Comparing the actual garage staff to actual recorded work order hours can be an effective way to evaluate the efficiency of staffing levels.
Table 5-3: Staffing to Labor Demand Direct Labor Hours per FTE 1,467.8 Total FTEs 4.0 Total Direct Labor Hours Available 5,871.2 Total Labor Hours Needed 1 4,411.9 Excess Direct Labor Hours 1,459.3 Excess Labor as % of an FTE 99.4% Cost per FTE 2 $44,400 Excess Cost $44,142 Sources: Gahanna and Government Fleet 1 All recorded hour spent on work orders inclusive of insourcing. 2 Cost per FTE is based on $15.93 per hour in base pay and $5.42 per hour for fringe benefits. As shown in Table 5-3, the City has 1,459.3 hours of direct labor in excess of the hours needed to maintain the City’s equipment. By not staffing the garage in accordance with the efficiency benchmark, the City risks expending more resources than necessary to maintain its equipment. In order to bring garage staffing in line with the benchmark the City could reduce the workforce or increase insourcing. The City has not attempted to increase insourcing business due to a concern about the impact on day-to-day garage operations. Table 5-3, however, demonstrates that the City has excess labor capacity to accommodate an increased workload. Furthermore,

City of Gahanna Performance Audit
Page 62
Gahanna entered into a non-binding shared services agreement with other central Ohio local governments in 2012, specifically focused on fleet services.34 The City could utilize the agreement to gain additional insourcing business. In addition to an increase in mechanic workload, shared services with other municipalities could promote other benefits, such as the sharing of ideas or community spaces. Table 5-4 shows the FTE reduction or insourcing increase needed to reduce excess labor. Increasing the workload of the Service Garage would allow for Gahanna to keep the current level of staffing and reach an industry benchmark level of efficiency.
Table 5-4: Scenarios to Reduce Costs Excessive Cost $44,142 Remaining Excess FTE .99
Increase Insourcing Excess Cost $44,142 Average Revenue per Job $265.32 Annual Jobs Needed to Cover Excess Cost 166.4 Financial Implication $44,142 Source: Gahanna 1 Inclusive of $15.93 per hour for wages and $5.42 per hour for fringe benefits. As shown in Table 5-4, 166.4 additional insourcing jobs per year would fully utilize the City’s excess labor and cost without reducing staff. Financial Implication: Reducing excess labor in the Service Garage through an increase in insourcing could save the City approximately $44,140 annually.
34 These partner cities include: Dublin, Grandview Heights, Hilliard, New Albany, Upper Arlington, Westerville, and Worthington.
City of Gahanna Performance Audit
Page 63
6. Parks and Recreation Background The Department of Parks and Recreation (Parks) maintains 26 parks consisting of 317.7 acres of parkland, 236.2 acres of open space, and 13.0 multi-use trail miles. Parks’ mission statement is “To conserve the natural environment through parks and open spaces as well as provide balanced, sustainable and accessible recreation opportunities and facilities.” Parks is governed by the Parks Board (the Board), which consists of seven members appointed by the Mayor and Council with day-to-day operations overseen by the Director of Parks and Recreation. Organization Parks accomplishes its mission through operating and maintaining parks and by offering the following recreation services and programs:
• Golf – the City operates an 18-hole golf course, including a rentable facility, golf shop, and concession stands.
• Ohio Herb Education Center (OHEC) – used for classes, parties, meetings and rentals. Includes a gift shop, parlor, and kitchen.
• Pools – the City operates three pools in two locations and offers daily passes or memberships to residents and non-residents.
o Hunters Ridge Pool – the newest location holds 256,000 gallons of water and has concessions, a playground, basketball/tennis courts, and a mechanical room.
o Gahanna Swimming Pool – the larger of the two locations, it operates a 250,000 gallon and a 500,000 gallon pool and has diving boards, a water slide, a basketball court, a concession stand building, and several other storage and/or mechanical buildings.
• Recreation – responsible for special events, family and youth outdoor programs, youth camps, teen programs, and adult and senior programs.
• Senior Center – offers classes and programs for seniors such as gardening classes and travel programs.
Participation Participation in recreation, pools, the golf course, the Senior Center, and the OHEC can be measured because each program tracks this data.35 Chart 6-1 shows the average annual participation for these Parks offerings from 2013 through 2016. Analyzing participation can provide an indication on the overall demand for the program. 35 Comparisons were made using 2014 visitor data because the OHEC no longer tracks visitors.
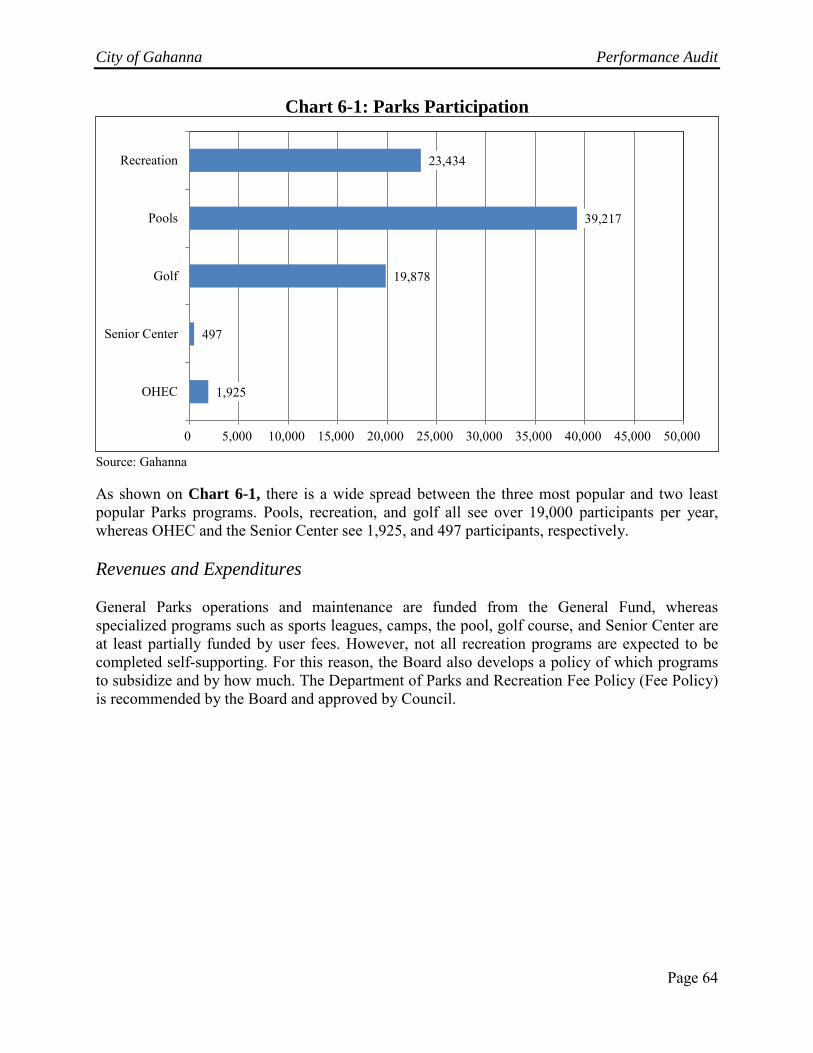
City of Gahanna Performance Audit
Page 64
Chart 6-1: Parks Participation
Source: Gahanna As shown on Chart 6-1, there is a wide spread between the three most popular and two least popular Parks programs. Pools, recreation, and golf all see over 19,000 participants per year, whereas OHEC and the Senior Center see 1,925, and 497 participants, respectively. Revenues and Expenditures General Parks operations and maintenance are funded from the General Fund, whereas specialized programs such as sports leagues, camps, the pool, golf course, and Senior Center are at least partially funded by user fees. However, not all recreation programs are expected to be completed self-supporting. For this reason, the Board also develops a policy of which programs to subsidize and by how much. The Department of Parks and Recreation Fee Policy (Fee Policy) is recommended by the Board and approved by Council.
1,925
497
19,878
39,217
23,434
0 5,000 10,000 15,000 20,000 25,000 30,000 35,000 40,000 45,000 50,000
OHEC
Senior Center
Golf
Pools
Recreation

City of Gahanna Performance Audit
Page 65
Recommendations
R6.1 Incorporate full cost/benefit evaluation into Parks subsidy policy The City is currently reviewing the existing Fee Policy for Parks.36 Parks’ policy divides services between those that are fully tax-supported, those that are partially tax-supported, and those that are not tax-supported. The City determines the level of available subsidy by classifying services into the following program types:
• Special Interest Programs – services that primarily benefit the program participant or user. The City sets fees to offset all direct, and in some cases a portion of indirect, costs associated with these services. Example services include the pools and golf course. Special interest programs may be subsidized up to 25 percent.
• Merit Programs – services that benefit both the user and, more generally, the larger population. Example services include the summer play center. Merit programs may be subsidized up to 75 percent.
• Service Programs – services that are beneficial to all citizens. The City considers parks and park maintenance an example of this type of program. Service programs may be subsidized up to 100 percent.
• Developmental Programs – services that are still being tested or are under development. Developmental programs may be subsidized up to 100 percent.
Table 6-1 shows the maximum allowable subsidy for select Parks programs. Considering the allowable subsidy provides important context for further analysis of the financial performance of Parks.
Table 6-1: Subsidy Analysis Program/Activity Tax Supported Type Subsidy %
Park Maintenance Staff Fully Service 100% Senior Center Fully Service 100% OHEC Partially Merit 50% Pools Partially Special Interest 25% Golf Partially Special Interest 20% Recreation Programs Partially Special Interest 20% Source: Gahanna As shown in Table 6-1, major programs related to the pools, golf course, and recreation are considered special interest. Parks accepts that the pools, the golf course, and the recreation programs may require up to a 25 percent subsidy. In addition, by classifying the pools, golf course, and recreation programs as “special interest”, the City’s policy recognizes that these programs are most directly beneficial to the program user.
36 The City’s current policy was approved by the City Council on March 21st, 2016; the revised policy has yet to be finalized and will be included in the 2018 budget proposal.

City of Gahanna Performance Audit
Page 66
The Fee Policy also differentiates between resident and non-resident fees. For example, the City charges resident seniors $20 per year for a Senior Center membership but $30 to non-resident seniors. In addition, the City charges non-residents more for recreation programs, the golf course, and pools (see R6.3). Charging additional fees to non-residents is one way the City acknowledges that residents have already contributed to the cost of Parks’ programming through local tax dollars. Table 6-2 shows expenditures, revenues, and the cost recovery for each program offered by Parks for 2016. Current cost recovery is one way to measure if the City is operating within the bounds of its own policies.
Table 6-2: Cost Recovery Analysis
Expenditure Revenue Difference Cost Recovery
General Fund Services Non-Fee Supported $2,272,628 N/A ($2,272,628) 0.0%
Fee-Supported Programs Recreation $375,796 $468,882 $93,086 124.8% Pools $518,951 $409,346 ($109,605) 78.9% Golf $330,003 $360,112 $30,109 109.1% Senior Center $137,701 $43,927 ($93,774) 31.9% OHEC $100,410 $87,827 ($12,583) 87.5% Subtotal Fee Supported $1,462,861 $1,370,094 ($92,767) 93.7% Total Parks $3,735,489 $1,370,094 ($2,365,395) 36.7% Source: Gahanna As shown in Table 6-2, fee-supported services had an overall cost recovery of 93.7 percent; however, there was significant variation in the cost recovery of each fee-supported service. Specifically, the recreation programs and golf course achieve a net profit, whereas the pools, Senior Center, and OHEC operate with a net loss. Citywide Cost of Services Study (MAXUS, 2005) states that “...many local government services are global in nature”, including police and fire, and furthermore that those services make sense to support through taxation. 37 In addition, the cost of services “…benefiting individuals – and not society as a whole – should be borne by the individual receiving the benefit.” Establishing expectations regarding the number of beneficiaries of a program is a necessary first step in establishing a fee and subsidy policy.
37 MAXUS is a consulting firm that works with the federal, state, and local government agencies. Citywide Cost of Services Study was completed for the City of Paso Robles, California.
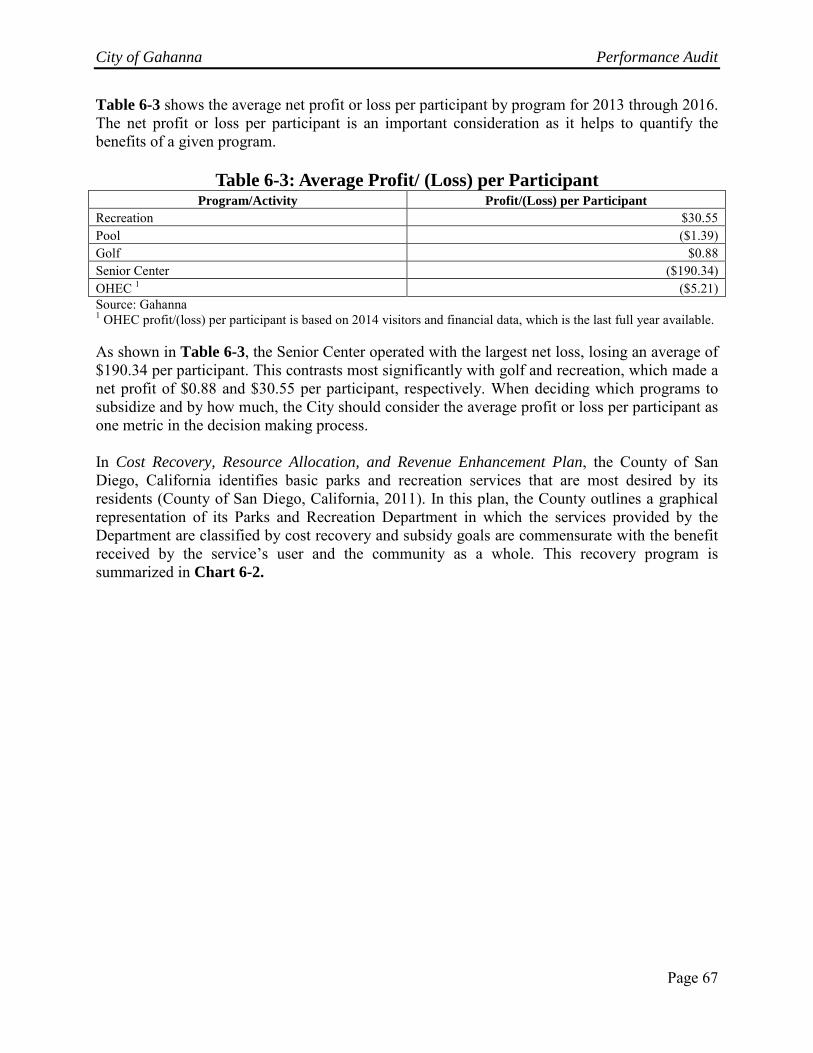
City of Gahanna Performance Audit
Page 67
Table 6-3 shows the average net profit or loss per participant by program for 2013 through 2016. The net profit or loss per participant is an important consideration as it helps to quantify the benefits of a given program.
Table 6-3: Average Profit/ (Loss) per Participant Program/Activity Profit/(Loss) per Participant
Recreation $30.55 Pool ($1.39) Golf $0.88 Senior Center ($190.34) OHEC 1 ($5.21) Source: Gahanna 1 OHEC profit/(loss) per participant is based on 2014 visitors and financial data, which is the last full year available. As shown in Table 6-3, the Senior Center operated with the largest net loss, losing an average of $190.34 per participant. This contrasts most significantly with golf and recreation, which made a net profit of $0.88 and $30.55 per participant, respectively. When deciding which programs to subsidize and by how much, the City should consider the average profit or loss per participant as one metric in the decision making process. In Cost Recovery, Resource Allocation, and Revenue Enhancement Plan, the County of San Diego, California identifies basic parks and recreation services that are most desired by its residents (County of San Diego, California, 2011). In this plan, the County outlines a graphical representation of its Parks and Recreation Department in which the services provided by the Department are classified by cost recovery and subsidy goals are commensurate with the benefit received by the service’s user and the community as a whole. This recovery program is summarized in Chart 6-2.
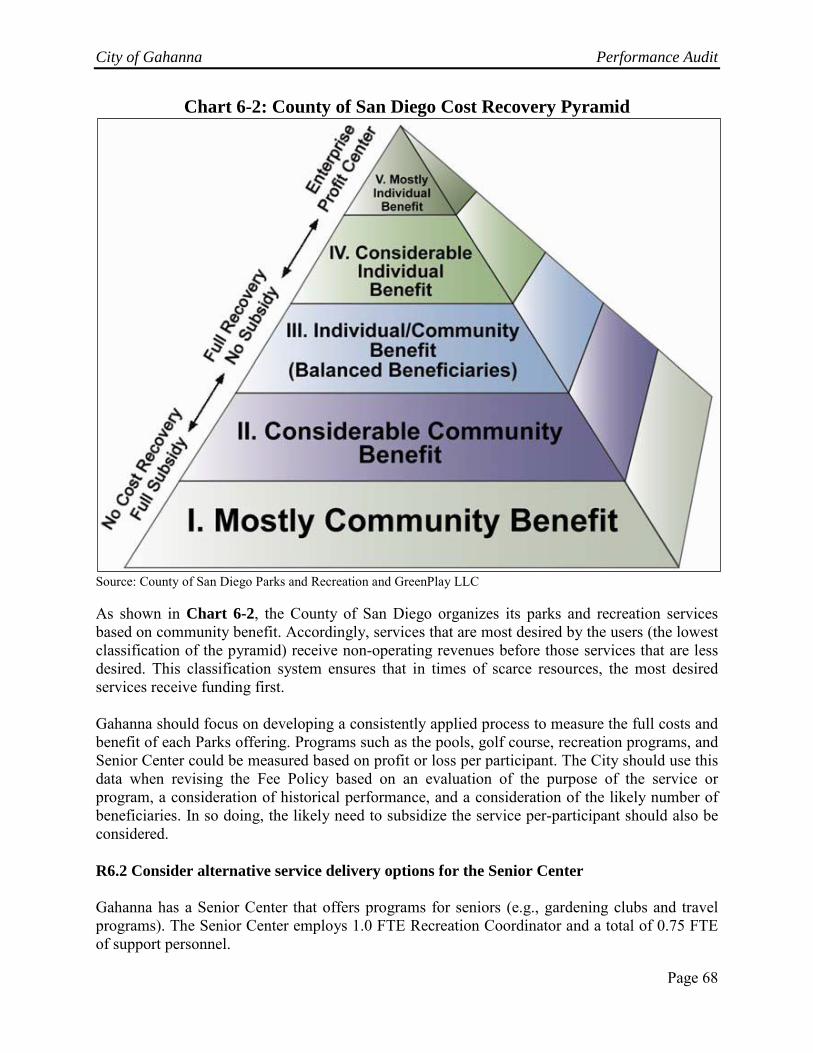
City of Gahanna Performance Audit
Page 68
Chart 6-2: County of San Diego Cost Recovery Pyramid
Source: County of San Diego Parks and Recreation and GreenPlay LLC As shown in Chart 6-2, the County of San Diego organizes its parks and recreation services based on community benefit. Accordingly, services that are most desired by the users (the lowest classification of the pyramid) receive non-operating revenues before those services that are less desired. This classification system ensures that in times of scarce resources, the most desired services receive funding first. Gahanna should focus on developing a consistently applied process to measure the full costs and benefit of each Parks offering. Programs such as the pools, golf course, recreation programs, and Senior Center could be measured based on profit or loss per participant. The City should use this data when revising the Fee Policy based on an evaluation of the purpose of the service or program, a consideration of historical performance, and a consideration of the likely number of beneficiaries. In so doing, the likely need to subsidize the service per-participant should also be considered. R6.2 Consider alternative service delivery options for the Senior Center Gahanna has a Senior Center that offers programs for seniors (e.g., gardening clubs and travel programs). The Senior Center employs 1.0 FTE Recreation Coordinator and a total of 0.75 FTE of support personnel.
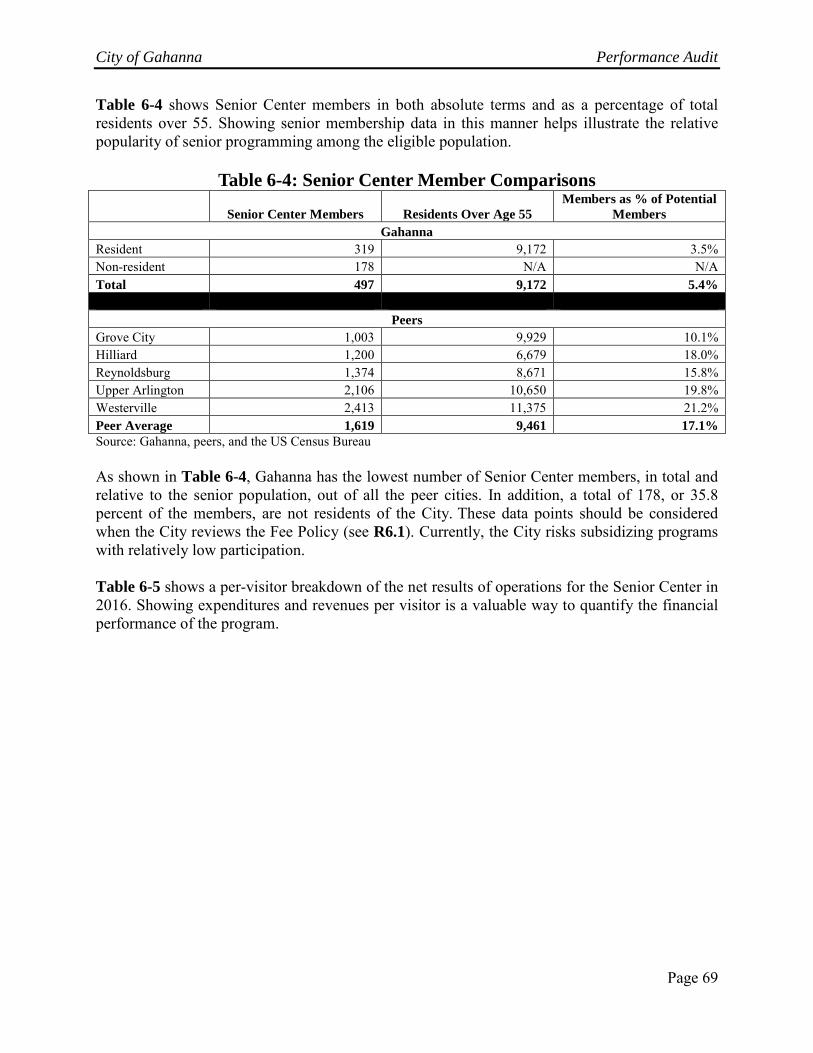
City of Gahanna Performance Audit
Page 69
Table 6-4 shows Senior Center members in both absolute terms and as a percentage of total residents over 55. Showing senior membership data in this manner helps illustrate the relative popularity of senior programming among the eligible population.
Table 6-4: Senior Center Member Comparisons
Senior Center Members Residents Over Age 55
Members as % of Potential Members
Gahanna Resident 319 9,172 3.5% Non-resident 178 N/A N/A Total 497 9,172 5.4%
Peers Grove City 1,003 9,929 10.1% Hilliard 1,200 6,679 18.0% Reynoldsburg 1,374 8,671 15.8% Upper Arlington 2,106 10,650 19.8% Westerville 2,413 11,375 21.2% Peer Average 1,619 9,461 17.1% Source: Gahanna, peers, and the US Census Bureau As shown in Table 6-4, Gahanna has the lowest number of Senior Center members, in total and relative to the senior population, out of all the peer cities. In addition, a total of 178, or 35.8 percent of the members, are not residents of the City. These data points should be considered when the City reviews the Fee Policy (see R6.1). Currently, the City risks subsidizing programs with relatively low participation. Table 6-5 shows a per-visitor breakdown of the net results of operations for the Senior Center in 2016. Showing expenditures and revenues per visitor is a valuable way to quantify the financial performance of the program.
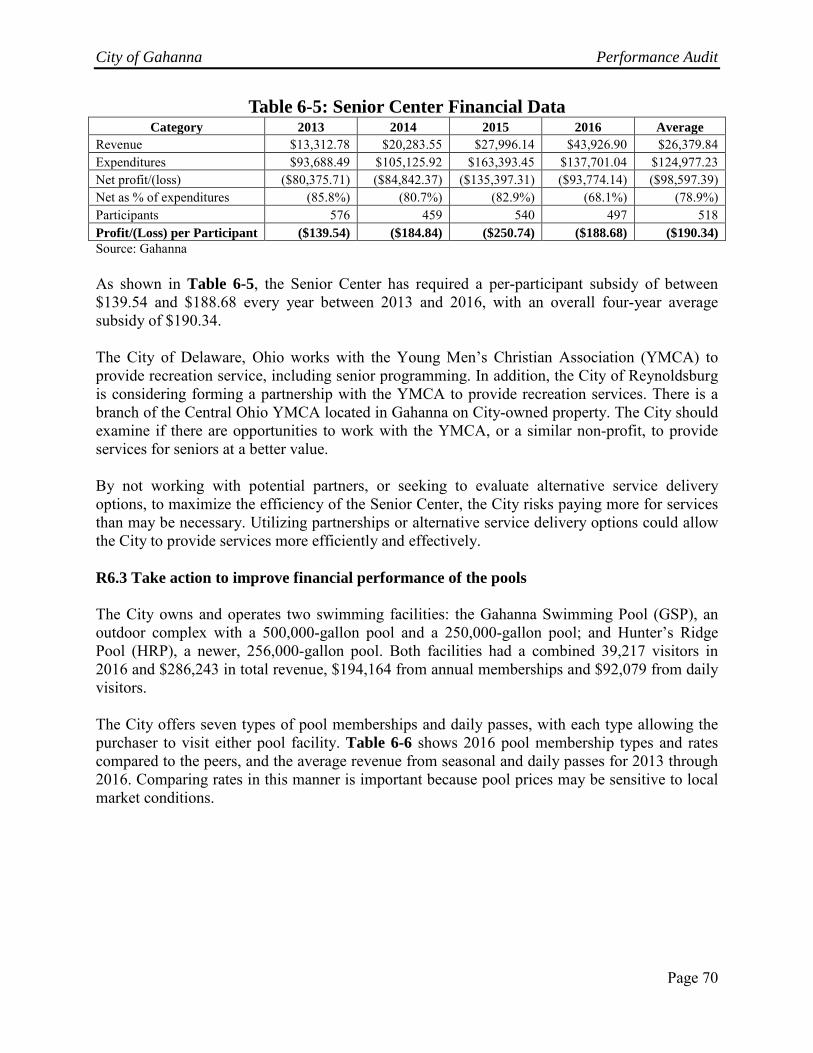
City of Gahanna Performance Audit
Page 70
Table 6-5: Senior Center Financial Data Category 2013 2014 2015 2016 Average
Revenue $13,312.78 $20,283.55 $27,996.14 $43,926.90 $26,379.84 Expenditures $93,688.49 $105,125.92 $163,393.45 $137,701.04 $124,977.23 Net profit/(loss) ($80,375.71) ($84,842.37) ($135,397.31) ($93,774.14) ($98,597.39) Net as % of expenditures (85.8%) (80.7%) (82.9%) (68.1%) (78.9%) Participants 576 459 540 497 518 Profit/(Loss) per Participant ($139.54) ($184.84) ($250.74) ($188.68) ($190.34) Source: Gahanna As shown in Table 6-5, the Senior Center has required a per-participant subsidy of between $139.54 and $188.68 every year between 2013 and 2016, with an overall four-year average subsidy of $190.34. The City of Delaware, Ohio works with the Young Men’s Christian Association (YMCA) to provide recreation service, including senior programming. In addition, the City of Reynoldsburg is considering forming a partnership with the YMCA to provide recreation services. There is a branch of the Central Ohio YMCA located in Gahanna on City-owned property. The City should examine if there are opportunities to work with the YMCA, or a similar non-profit, to provide services for seniors at a better value. By not working with potential partners, or seeking to evaluate alternative service delivery options, to maximize the efficiency of the Senior Center, the City risks paying more for services than may be necessary. Utilizing partnerships or alternative service delivery options could allow the City to provide services more efficiently and effectively. R6.3 Take action to improve financial performance of the pools The City owns and operates two swimming facilities: the Gahanna Swimming Pool (GSP), an outdoor complex with a 500,000-gallon pool and a 250,000-gallon pool; and Hunter’s Ridge Pool (HRP), a newer, 256,000-gallon pool. Both facilities had a combined 39,217 visitors in 2016 and $286,243 in total revenue, $194,164 from annual memberships and $92,079 from daily visitors. The City offers seven types of pool memberships and daily passes, with each type allowing the purchaser to visit either pool facility. Table 6-6 shows 2016 pool membership types and rates compared to the peers, and the average revenue from seasonal and daily passes for 2013 through 2016. Comparing rates in this manner is important because pool prices may be sensitive to local market conditions.

City of Gahanna Performance Audit
Page 71
Table 6-6: Pool Membership Rates Comparison Type Gahanna Peer Average 1 Difference % Difference
Individual Day Pass Rate $9.00 $7.50 $1.50 20.0% Single-Rate Membership-Resident $140.00 $98.75 $41.25 41.8% Single-Rate Membership Non-Resident $145.00 $167.34 ($22.34) (13.4%) Family Rate Membership-Resident $225.00 $205.00 $20.00 9.8% Family Rate Membership Non-Resident $275.00 $279.38 ($4.38) (1.6%) Senior Rate Membership-Resident $70.00 $64.38 $5.63 8.7% Senior Rate Membership-Non-Resident $90.00 $90.94 ($0.94) (1.0%) Avg. Total Revenue - Membership $205,229 Avg. Total Revenue - Daily Pass $67,491 Source: Gahanna and peers 1 The peers that operate pools are Grove City, Hilliard, Upper Arlington, and Westerville. As shown in Table 6-6, shaded rows highlight areas where Gahanna charges less than the peer average for similar services In addition, the City charges more than peers for individual day passes, single memberships for residents, family rates for residents, and senior rates for residents. From 2013 through 2016, the City collected an annual average $205,229 in seasonal membership and $67,491 in daily passes. Chart 6-7 shows a comparison of the financial results for the GSP and HRP for 2013 to 2016. Financial comparisons can be a useful metric to quantify the efficiency of services.
Table 6-7: Swimming Pool Facilities Financial Comparison Category 2013 2014 2015 2016
HRP Revenue 1 $66,569 $50,697 $56,717 $68,827 HRP Expenditure $161,311 $114,962 $164,933 $194,517 Net Profit/(Loss) ($94,742) ($64,265) ($108,216) ($125,690) Revenue as % of Expenditure 41.3% 44.1% 34.4% 35.4% GSP Revenue $102,575 $77,713 $111,117 $146,354 GSP Expenditure $315,832 $219,178 $222,479 $324,433 Net Profit/(Loss) ($213,257) ($141,465) ($111,362) ($178,079) Revenue as % of Expenditure 32.5% 35.5% 49.9% 45.1% Membership Revenue $228,722 $201,876 $196,155 $194,165 Net Pool Revenue $397,866 $330,286 $363,989 $409,346 Net Pool Expenditure $477,143 $334,140 $387,412 $518,950 Net Profit/(Loss) ($79,277) ($3,854) ($23,423) ($109,604) Participants 38,809 37,460 40,533 39,217 Net Profit/(Loss) per Participant ($2.04) ($0.10) ($0.58) ($2.79) Source: Gahanna 1 Non-membership revenue streams include daily passes and concessions. As shown in Table 6-7, financial performance improved from 2013 to 2014. However, relative to 2014, the financial performance of the pools declined in 2015 and even further in 2016.

City of Gahanna Performance Audit
Page 72
Expenditures for both pools increased partially due to the hiring of the Aquatics Supervisor at the beginning of 2016 pool season. In addition, the City tried to reduce costs by using contractors for pool management in 2014. However, City leadership identified that the contractor did not meet the City’s expectations for service and safety so the contract was canceled halfway through the 2015 season and then hired lifeguards for the remainder of the 2015 season. Finally, repairs increased due to needed repairs, including work on pool floor at the GSP. It is important to note that Table 6-7 underestimates the net loss experienced by the pools because not all maintenance costs have historically been included in total expenditures. For example, each year the GSP requires painting, which is completed by the facility maintenance staff at a cost of approximately $20,000 in labor and materials.38 These costs, however, are not charged back to the pools. In addition, other maintenance responsibilities such as time spent mowing and landscaping as well as the administrative costs of the Director and Deputy Director are also not charged back to the pools. The City began operating GSP in 2005, however, GSP was constructed in the 1960s and, going forward, the City will be faced with necessary repairs as this asset has far exceeded its 12 year expected useful life. Furthermore, this facility is located on a flood plain, which has caused leaks in the pool floor requiring additional repair and expense. Although these leaks have been patched each year, City leadership believes that it will need to fully replace the pool floor and add a lining to stop leaks from recurring. Table 6-8 shows currently excluded costs for both locations and necessary improvements for the GSP. Most repairs will themselves have an expected useful life of 10 years, and for that reason repair costs will be annualized. Capturing excluded costs is important for understanding the true cost of operations.
38 HRP is lined with stainless steel and therefore does not require regular painting.

City of Gahanna Performance Audit
Page 73
Table 6-8: Excluded and Capital Costs of Pool Operations
Costs
Total Annualized 1 Excluded Costs
Painting $20,000 $20,000 Pool Winterization/De-winterization $13,500 $13,500 Recreation Supervisor Salary Allocation 2 $2,315 $2,315 Maintenance/Grounds Keeping $1,000 $1,000 Subtotal $36,815 $36,815
Future Costs New Pool Floor $300,000 $30,000 New Lining $300,000 $30,000 Water Slide $80,000 $8,000 Operating Equipment 3 $65,000 $6,500 Subtotal $745,000 $74,500 Total Additional Costs $781,815 $111,315 Source: Gahanna 1 Estimated future cost items, on average, have an expected useful life of 10 years. 2 City leadership estimates the Recreation Supervisor allocates 10.0 percent of time to pool management. 3 Includes three new heaters at an estimated cost of $10,000 per heater and new pipes at a cost of $35,000. As shown in Table 6-8, it is estimated that the GSP understates its annual costs by $111,315 per year. In addition, HRP understates its expenses by $16,815 per year. Table 6-9 shows the impact of the excluded/future costs on both pools’ 2016 operations. Showing the full cost of operations is important for developing an accurate estimate of future subsidies.
Table 6-9: Impact of Excluded and Future Costs on Pool Operations Average 2016 Loss per Visitor ($2.79) Total Pool Revenues - 2016 $409,346 Total Pool Operating Expenditures - 2016 $518,950 Estimated Excluded Future Costs $128,130 Revised Total Cost $647,080 Revised Net Profit/(Loss) ($237,734) Average Annual Participation 1 39,005 Revised Loss per Participant ($6.09) Revised Subsidy 36.7% Additional Loss per Participant ($3.30) Source: Gahanna 1 Based on the 2014 through 2016 average. As shown in Table 6-9, upgrades needed to continue the operation of the GSP would have increased the 2016 net loss for both pools to a total of $237,734 increasing the subsidy of each
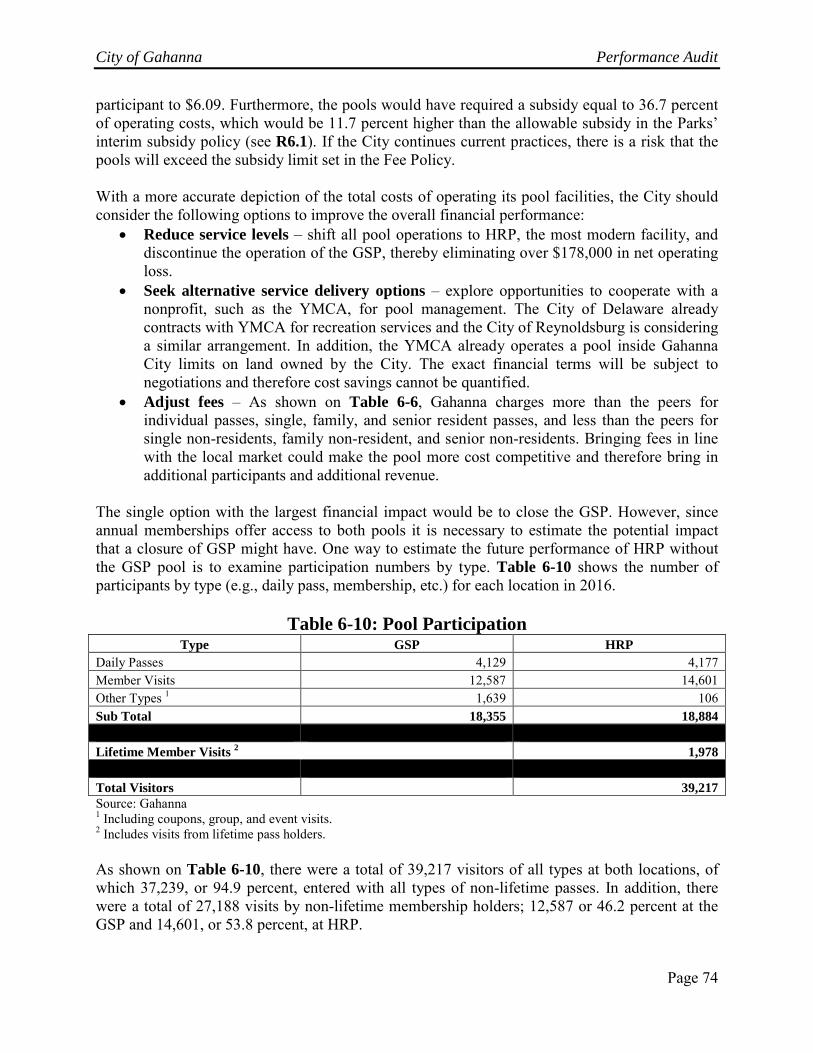
City of Gahanna Performance Audit
Page 74
participant to $6.09. Furthermore, the pools would have required a subsidy equal to 36.7 percent of operating costs, which would be 11.7 percent higher than the allowable subsidy in the Parks’ interim subsidy policy (see R6.1). If the City continues current practices, there is a risk that the pools will exceed the subsidy limit set in the Fee Policy. With a more accurate depiction of the total costs of operating its pool facilities, the City should consider the following options to improve the overall financial performance:
• Reduce service levels – shift all pool operations to HRP, the most modern facility, and discontinue the operation of the GSP, thereby eliminating over $178,000 in net operating loss.
• Seek alternative service delivery options – explore opportunities to cooperate with a nonprofit, such as the YMCA, for pool management. The City of Delaware already contracts with YMCA for recreation services and the City of Reynoldsburg is considering a similar arrangement. In addition, the YMCA already operates a pool inside Gahanna City limits on land owned by the City. The exact financial terms will be subject to negotiations and therefore cost savings cannot be quantified.
• Adjust fees – As shown on Table 6-6, Gahanna charges more than the peers for individual passes, single, family, and senior resident passes, and less than the peers for single non-residents, family non-resident, and senior non-residents. Bringing fees in line with the local market could make the pool more cost competitive and therefore bring in additional participants and additional revenue.
The single option with the largest financial impact would be to close the GSP. However, since annual memberships offer access to both pools it is necessary to estimate the potential impact that a closure of GSP might have. One way to estimate the future performance of HRP without the GSP pool is to examine participation numbers by type. Table 6-10 shows the number of participants by type (e.g., daily pass, membership, etc.) for each location in 2016.
Table 6-10: Pool Participation Type GSP HRP
Daily Passes 4,129 4,177 Member Visits 12,587 14,601 Other Types 1 1,639 106 Sub Total 18,355 18,884 Lifetime Member Visits 2 1,978 Total Visitors 39,217 Source: Gahanna 1 Including coupons, group, and event visits. 2 Includes visits from lifetime pass holders. As shown on Table 6-10, there were a total of 39,217 visitors of all types at both locations, of which 37,239, or 94.9 percent, entered with all types of non-lifetime passes. In addition, there were a total of 27,188 visits by non-lifetime membership holders; 12,587 or 46.2 percent at the GSP and 14,601, or 53.8 percent, at HRP.

City of Gahanna Performance Audit
Page 75
In 2016, a total of $194,164 in revenue was from memberships. Based on the breakdown between the locations shown on Table 6-10, future pool performance can be estimated by assuming that 53.8 percent of members would remain members in the future if GSP were closed. Table 6-11 shows a comparison of the expected revenues and expenditures from HRP with the assumption that the pool will only receive 53.8 percent of the total 2016 revenue from memberships.
Table 6-11: Future Cost and Revenue Scenarios Projected Performance – Both Pools
Projected Net Profit/(Loss) ($237,734) Projected Subsidy 36.7%
Projected Performance – HRP Only Non-member Revenue $68,827 53.8% Membership Revenue $104,460 Total Revenues $173,287 Expenditures $211,332 Net Profit/(Loss) ($38,045) Projected Profit/(Loss) Operating Both Facilities ($237,734) Projected Profit/(Loss) Operating Only HRP (38,045) Projected Subsidy 18.0% Difference $199,689 Source: Gahanna As shown in Table 6-11, if the City loses 46.2 percent of annual membership revenue after closing the GSP, it could reduce overall costs by shifting pool operations to HRP. In total, the net financial impact of closing the GSP would be $199,689. In addition, the City would have to subsidize 18.0 percent of the operating cost of HRP, which would keep operations consistent with the subsidy policy. Financial Implication: Discontinuing operations of the GSP could save approximately $199,600 per year over the next 10 years.
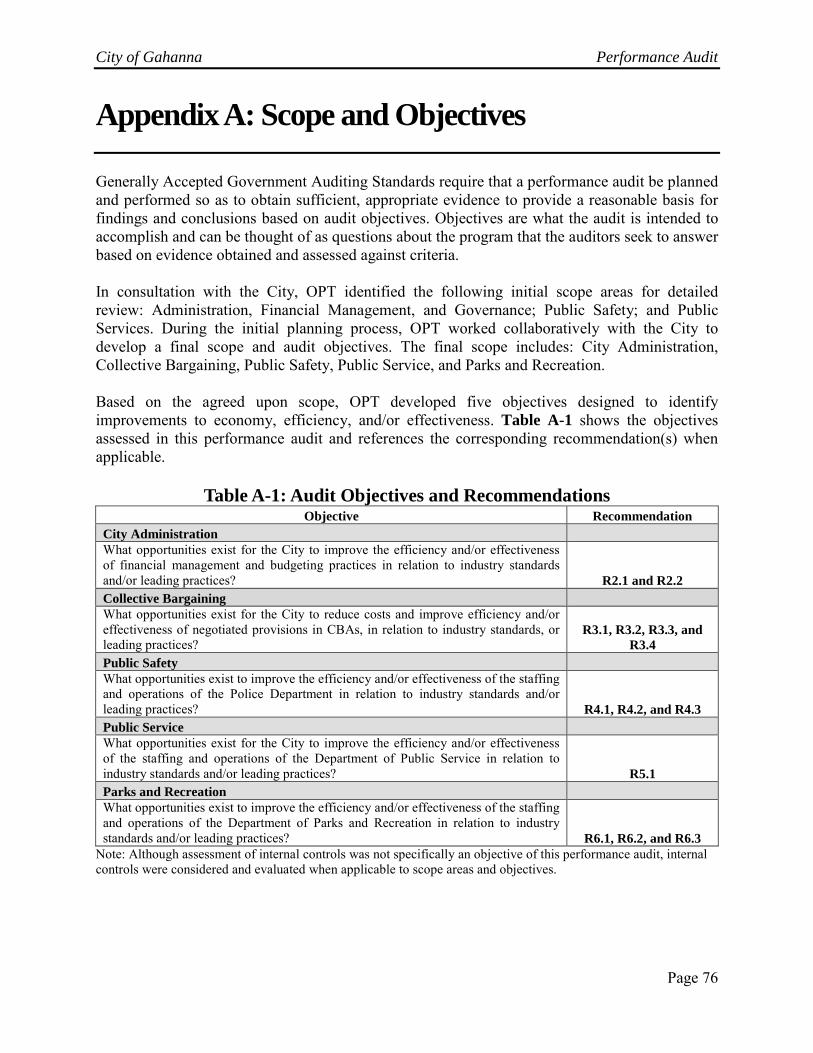
City of Gahanna Performance Audit
Page 76
Appendix A: Scope and Objectives Generally Accepted Government Auditing Standards require that a performance audit be planned and performed so as to obtain sufficient, appropriate evidence to provide a reasonable basis for findings and conclusions based on audit objectives. Objectives are what the audit is intended to accomplish and can be thought of as questions about the program that the auditors seek to answer based on evidence obtained and assessed against criteria. In consultation with the City, OPT identified the following initial scope areas for detailed review: Administration, Financial Management, and Governance; Public Safety; and Public Services. During the initial planning process, OPT worked collaboratively with the City to develop a final scope and audit objectives. The final scope includes: City Administration, Collective Bargaining, Public Safety, Public Service, and Parks and Recreation. Based on the agreed upon scope, OPT developed five objectives designed to identify improvements to economy, efficiency, and/or effectiveness. Table A-1 shows the objectives assessed in this performance audit and references the corresponding recommendation(s) when applicable.
Table A-1: Audit Objectives and Recommendations Objective Recommendation
City Administration What opportunities exist for the City to improve the efficiency and/or effectiveness of financial management and budgeting practices in relation to industry standards and/or leading practices? R2.1 and R2.2 Collective Bargaining What opportunities exist for the City to reduce costs and improve efficiency and/or effectiveness of negotiated provisions in CBAs, in relation to industry standards, or leading practices?
R3.1, R3.2, R3.3, and R3.4
Public Safety What opportunities exist to improve the efficiency and/or effectiveness of the staffing and operations of the Police Department in relation to industry standards and/or leading practices? R4.1, R4.2, and R4.3 Public Service What opportunities exist for the City to improve the efficiency and/or effectiveness of the staffing and operations of the Department of Public Service in relation to industry standards and/or leading practices? R5.1 Parks and Recreation What opportunities exist to improve the efficiency and/or effectiveness of the staffing and operations of the Department of Parks and Recreation in relation to industry standards and/or leading practices? R6.1, R6.2, and R6.3
Note: Although assessment of internal controls was not specifically an objective of this performance audit, internal controls were considered and evaluated when applicable to scope areas and objectives.

City of Gahanna Performance Audit
Page 77
Appendix B: Police Workload Comparisons Table B-1 shows the current average saturation index (SI) for each day of the week by shift. This is important for showing how close officers currently are to exceeding the 60 percent SI threshold on each shift.
Table B-1: Saturation Index by Shift Shift Sunday Monday Tuesday Wednesday Thursday Friday Saturday Average
First 31.3% 45.0% 46.8% 47.8% 47.0% 48.9% 38.9% 43.7% Second 46.3% 58.8% 59.4% 59.7% 60.4% 60.5% 47.5% 56.1% Third 48.9% 29.8% 30.6% 31.7% 37.7% 38.9% 50.5% 38.3% Average 42.2% 44.5% 45.6% 46.4% 48.4% 49.4% 45.6% 46.0% Source: Gahanna As shown in Table B-1, highlighted cells represent the only times that patrol officers spend more than 60.0 percent of their time handling calls is during second shift on Thursdays and Fridays. Even at those times the SI only exceeds the 60.0 percent by 0.4 percent and 0.5 percent, respectively. Table B-2 shows the average SI by hour for each day of the week under the current GDP shift assignment schedule with the specific hour blocks in which GDP patrol officers are currently dedicating more than 60 percent of their time to handling calls highlighted. This table is important for showing the variation in workload within the shifts.
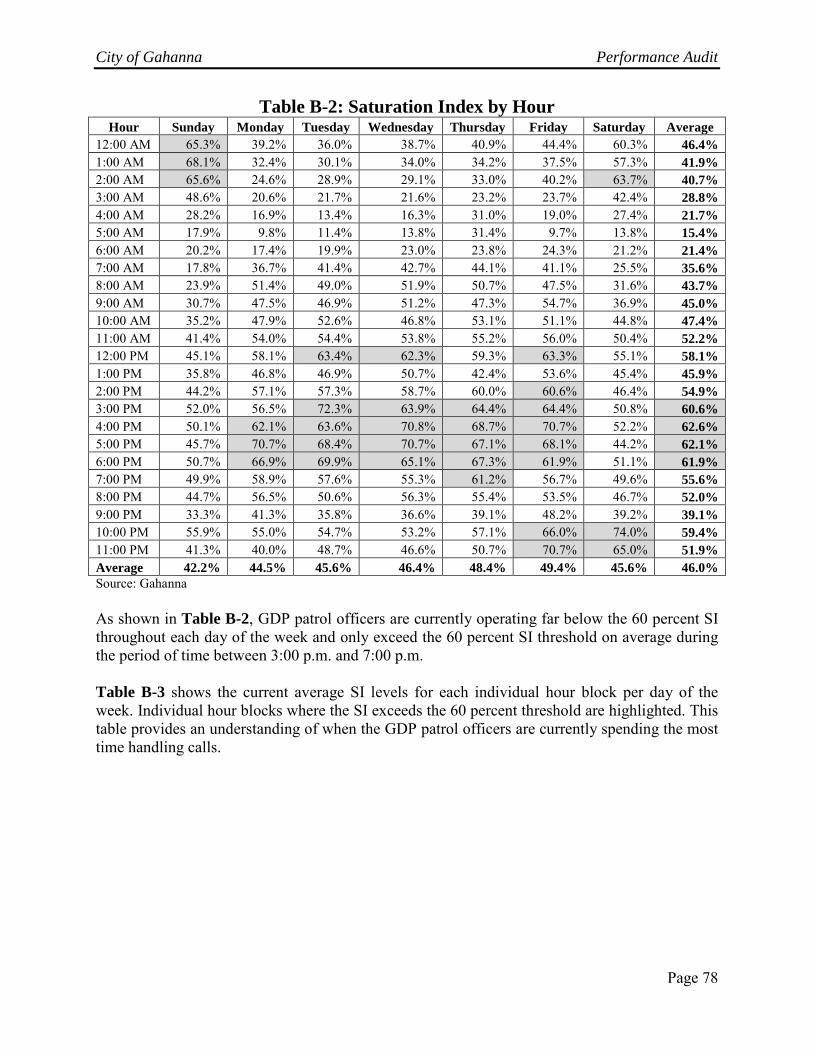
City of Gahanna Performance Audit
Page 78
Table B-2: Saturation Index by Hour Hour Sunday Monday Tuesday Wednesday Thursday Friday Saturday Average
12:00 AM 65.3% 39.2% 36.0% 38.7% 40.9% 44.4% 60.3% 46.4% 1:00 AM 68.1% 32.4% 30.1% 34.0% 34.2% 37.5% 57.3% 41.9% 2:00 AM 65.6% 24.6% 28.9% 29.1% 33.0% 40.2% 63.7% 40.7% 3:00 AM 48.6% 20.6% 21.7% 21.6% 23.2% 23.7% 42.4% 28.8% 4:00 AM 28.2% 16.9% 13.4% 16.3% 31.0% 19.0% 27.4% 21.7% 5:00 AM 17.9% 9.8% 11.4% 13.8% 31.4% 9.7% 13.8% 15.4% 6:00 AM 20.2% 17.4% 19.9% 23.0% 23.8% 24.3% 21.2% 21.4% 7:00 AM 17.8% 36.7% 41.4% 42.7% 44.1% 41.1% 25.5% 35.6% 8:00 AM 23.9% 51.4% 49.0% 51.9% 50.7% 47.5% 31.6% 43.7% 9:00 AM 30.7% 47.5% 46.9% 51.2% 47.3% 54.7% 36.9% 45.0% 10:00 AM 35.2% 47.9% 52.6% 46.8% 53.1% 51.1% 44.8% 47.4% 11:00 AM 41.4% 54.0% 54.4% 53.8% 55.2% 56.0% 50.4% 52.2% 12:00 PM 45.1% 58.1% 63.4% 62.3% 59.3% 63.3% 55.1% 58.1% 1:00 PM 35.8% 46.8% 46.9% 50.7% 42.4% 53.6% 45.4% 45.9% 2:00 PM 44.2% 57.1% 57.3% 58.7% 60.0% 60.6% 46.4% 54.9% 3:00 PM 52.0% 56.5% 72.3% 63.9% 64.4% 64.4% 50.8% 60.6% 4:00 PM 50.1% 62.1% 63.6% 70.8% 68.7% 70.7% 52.2% 62.6% 5:00 PM 45.7% 70.7% 68.4% 70.7% 67.1% 68.1% 44.2% 62.1% 6:00 PM 50.7% 66.9% 69.9% 65.1% 67.3% 61.9% 51.1% 61.9% 7:00 PM 49.9% 58.9% 57.6% 55.3% 61.2% 56.7% 49.6% 55.6% 8:00 PM 44.7% 56.5% 50.6% 56.3% 55.4% 53.5% 46.7% 52.0% 9:00 PM 33.3% 41.3% 35.8% 36.6% 39.1% 48.2% 39.2% 39.1% 10:00 PM 55.9% 55.0% 54.7% 53.2% 57.1% 66.0% 74.0% 59.4% 11:00 PM 41.3% 40.0% 48.7% 46.6% 50.7% 70.7% 65.0% 51.9% Average 42.2% 44.5% 45.6% 46.4% 48.4% 49.4% 45.6% 46.0% Source: Gahanna As shown in Table B-2, GDP patrol officers are currently operating far below the 60 percent SI throughout each day of the week and only exceed the 60 percent SI threshold on average during the period of time between 3:00 p.m. and 7:00 p.m. Table B-3 shows the current average SI levels for each individual hour block per day of the week. Individual hour blocks where the SI exceeds the 60 percent threshold are highlighted. This table provides an understanding of when the GDP patrol officers are currently spending the most time handling calls.
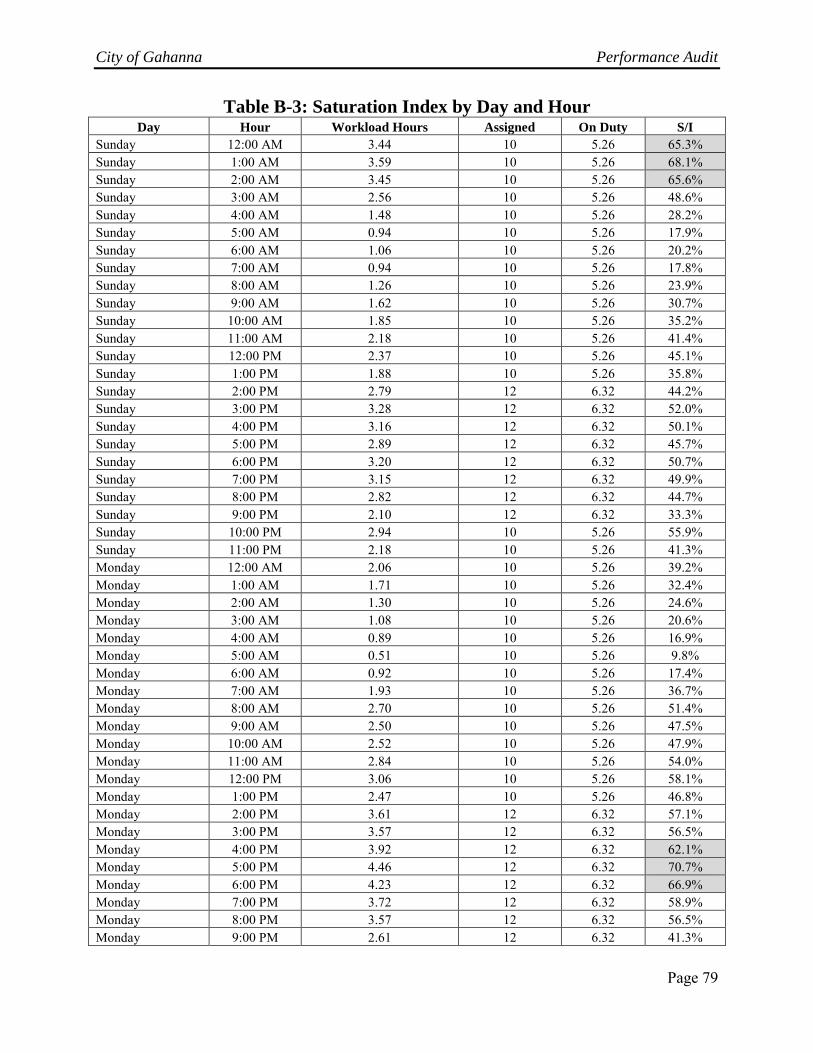
City of Gahanna Performance Audit
Page 79
Table B-3: Saturation Index by Day and Hour Day Hour Workload Hours Assigned On Duty S/I
Sunday 12:00 AM 3.44 10 5.26 65.3% Sunday 1:00 AM 3.59 10 5.26 68.1% Sunday 2:00 AM 3.45 10 5.26 65.6% Sunday 3:00 AM 2.56 10 5.26 48.6% Sunday 4:00 AM 1.48 10 5.26 28.2% Sunday 5:00 AM 0.94 10 5.26 17.9% Sunday 6:00 AM 1.06 10 5.26 20.2% Sunday 7:00 AM 0.94 10 5.26 17.8% Sunday 8:00 AM 1.26 10 5.26 23.9% Sunday 9:00 AM 1.62 10 5.26 30.7% Sunday 10:00 AM 1.85 10 5.26 35.2% Sunday 11:00 AM 2.18 10 5.26 41.4% Sunday 12:00 PM 2.37 10 5.26 45.1% Sunday 1:00 PM 1.88 10 5.26 35.8% Sunday 2:00 PM 2.79 12 6.32 44.2% Sunday 3:00 PM 3.28 12 6.32 52.0% Sunday 4:00 PM 3.16 12 6.32 50.1% Sunday 5:00 PM 2.89 12 6.32 45.7% Sunday 6:00 PM 3.20 12 6.32 50.7% Sunday 7:00 PM 3.15 12 6.32 49.9% Sunday 8:00 PM 2.82 12 6.32 44.7% Sunday 9:00 PM 2.10 12 6.32 33.3% Sunday 10:00 PM 2.94 10 5.26 55.9% Sunday 11:00 PM 2.18 10 5.26 41.3% Monday 12:00 AM 2.06 10 5.26 39.2% Monday 1:00 AM 1.71 10 5.26 32.4% Monday 2:00 AM 1.30 10 5.26 24.6% Monday 3:00 AM 1.08 10 5.26 20.6% Monday 4:00 AM 0.89 10 5.26 16.9% Monday 5:00 AM 0.51 10 5.26 9.8% Monday 6:00 AM 0.92 10 5.26 17.4% Monday 7:00 AM 1.93 10 5.26 36.7% Monday 8:00 AM 2.70 10 5.26 51.4% Monday 9:00 AM 2.50 10 5.26 47.5% Monday 10:00 AM 2.52 10 5.26 47.9% Monday 11:00 AM 2.84 10 5.26 54.0% Monday 12:00 PM 3.06 10 5.26 58.1% Monday 1:00 PM 2.47 10 5.26 46.8% Monday 2:00 PM 3.61 12 6.32 57.1% Monday 3:00 PM 3.57 12 6.32 56.5% Monday 4:00 PM 3.92 12 6.32 62.1% Monday 5:00 PM 4.46 12 6.32 70.7% Monday 6:00 PM 4.23 12 6.32 66.9% Monday 7:00 PM 3.72 12 6.32 58.9% Monday 8:00 PM 3.57 12 6.32 56.5% Monday 9:00 PM 2.61 12 6.32 41.3%

City of Gahanna Performance Audit
Page 80
Day Hour Workload Hours Assigned On Duty S/I Monday 10:00 PM 2.89 10 5.26 55.0% Monday 11:00 PM 2.11 10 5.26 40.0% Tuesday 12:00 AM 1.89 10 5.26 36.0% Tuesday 1:00 AM 1.59 10 5.26 30.1% Tuesday 2:00 AM 1.52 10 5.26 28.9% Tuesday 3:00 AM 1.14 10 5.26 21.7% Tuesday 4:00 AM 0.71 10 5.26 13.4% Tuesday 5:00 AM 0.60 10 5.26 11.4% Tuesday 6:00 AM 1.05 10 5.26 19.9% Tuesday 7:00 AM 2.18 10 5.26 41.4% Tuesday 8:00 AM 2.58 10 5.26 49.0% Tuesday 9:00 AM 2.47 10 5.26 46.9% Tuesday 10:00 AM 2.77 10 5.26 52.6% Tuesday 11:00 AM 2.86 10 5.26 54.4% Tuesday 12:00 PM 3.33 10 5.26 63.4% Tuesday 1:00 PM 2.47 10 5.26 46.9% Tuesday 2:00 PM 3.62 12 6.32 57.3% Tuesday 3:00 PM 4.57 12 6.32 72.3% Tuesday 4:00 PM 4.02 12 6.32 63.6% Tuesday 5:00 PM 4.32 12 6.32 68.4% Tuesday 6:00 PM 4.42 12 6.32 69.9% Tuesday 7:00 PM 3.64 12 6.32 57.6% Tuesday 8:00 PM 3.19 12 6.32 50.6% Tuesday 9:00 PM 2.26 12 6.32 35.8% Tuesday 10:00 PM 2.88 10 5.26 54.7% Tuesday 11:00 PM 2.56 10 5.26 48.7% Wednesday 12:00 AM 2.04 10 5.26 38.7% Wednesday 1:00 AM 1.79 10 5.26 34.0% Wednesday 2:00 AM 1.53 10 5.26 29.1% Wednesday 3:00 AM 1.14 10 5.26 21.6% Wednesday 4:00 AM 0.86 10 5.26 16.3% Wednesday 5:00 AM 0.73 10 5.26 13.8% Wednesday 6:00 AM 1.21 10 5.26 23.0% Wednesday 7:00 AM 2.25 10 5.26 42.7% Wednesday 8:00 AM 2.73 10 5.26 51.9% Wednesday 9:00 AM 2.69 10 5.26 51.2% Wednesday 10:00 AM 2.46 10 5.26 46.8% Wednesday 11:00 AM 2.83 10 5.26 53.8% Wednesday 12:00 PM 3.28 10 5.26 62.3% Wednesday 1:00 PM 2.67 10 5.26 50.7% Wednesday 2:00 PM 3.71 12 6.32 58.7% Wednesday 3:00 PM 4.04 12 6.32 63.9% Wednesday 4:00 PM 4.47 12 6.32 70.8% Wednesday 5:00 PM 4.46 12 6.32 70.7% Wednesday 6:00 PM 4.11 12 6.32 65.1% Wednesday 7:00 PM 3.49 12 6.32 55.3% Wednesday 8:00 PM 3.56 12 6.32 56.3%

City of Gahanna Performance Audit
Page 81
Day Hour Workload Hours Assigned On Duty S/I Wednesday 9:00 PM 2.31 12 6.32 36.6% Wednesday 10:00 PM 2.80 10 5.26 53.2% Wednesday 11:00 PM 2.45 10 5.26 46.6% Thursday 12:00 AM 2.15 10 5.26 40.9% Thursday 1:00 AM 1.80 10 5.26 34.2% Thursday 2:00 AM 1.74 10 5.26 33.0% Thursday 3:00 AM 1.22 10 5.26 23.2% Thursday 4:00 AM 1.63 10 5.26 31.0% Thursday 5:00 AM 1.65 10 5.26 31.4% Thursday 6:00 AM 1.25 10 5.26 23.8% Thursday 7:00 AM 2.32 10 5.26 44.1% Thursday 8:00 AM 2.67 10 5.26 50.7% Thursday 9:00 AM 2.49 10 5.26 47.3% Thursday 10:00 AM 2.80 10 5.26 53.1% Thursday 11:00 AM 2.90 10 5.26 55.2% Thursday 12:00 PM 3.12 10 5.26 59.3% Thursday 1:00 PM 2.23 10 5.26 42.4% Thursday 2:00 PM 3.79 12 6.32 60.0% Thursday 3:00 PM 4.07 12 6.32 64.4% Thursday 4:00 PM 4.34 12 6.32 68.7% Thursday 5:00 PM 4.24 12 6.32 67.1% Thursday 6:00 PM 4.25 12 6.32 67.3% Thursday 7:00 PM 3.87 12 6.32 61.2% Thursday 8:00 PM 3.50 12 6.32 55.4% Thursday 9:00 PM 2.47 12 6.32 39.1% Thursday 10:00 PM 3.01 10 5.26 57.1% Thursday 11:00 PM 2.67 10 5.26 50.7% Friday 12:00 AM 2.34 10 5.26 44.4% Friday 1:00 AM 1.97 10 5.26 37.5% Friday 2:00 AM 2.11 10 5.26 40.2% Friday 3:00 AM 1.25 10 5.26 23.7% Friday 4:00 AM 1.00 10 5.26 19.0% Friday 5:00 AM 0.51 10 5.26 9.7% Friday 6:00 AM 1.28 10 5.26 24.3% Friday 7:00 AM 2.16 10 5.26 41.1% Friday 8:00 AM 2.50 10 5.26 47.5% Friday 9:00 AM 2.88 10 5.26 54.7% Friday 10:00 AM 2.69 10 5.26 51.1% Friday 11:00 AM 2.95 10 5.26 56.0% Friday 12:00 PM 3.33 10 5.26 63.3% Friday 1:00 PM 2.82 10 5.26 53.6% Friday 2:00 PM 3.82 12 6.32 60.6% Friday 3:00 PM 4.07 12 6.32 64.4% Friday 4:00 PM 4.46 12 6.32 70.7% Friday 5:00 PM 4.30 12 6.32 68.1% Friday 6:00 PM 3.91 12 6.32 61.9% Friday 7:00 PM 3.58 12 6.32 56.7%
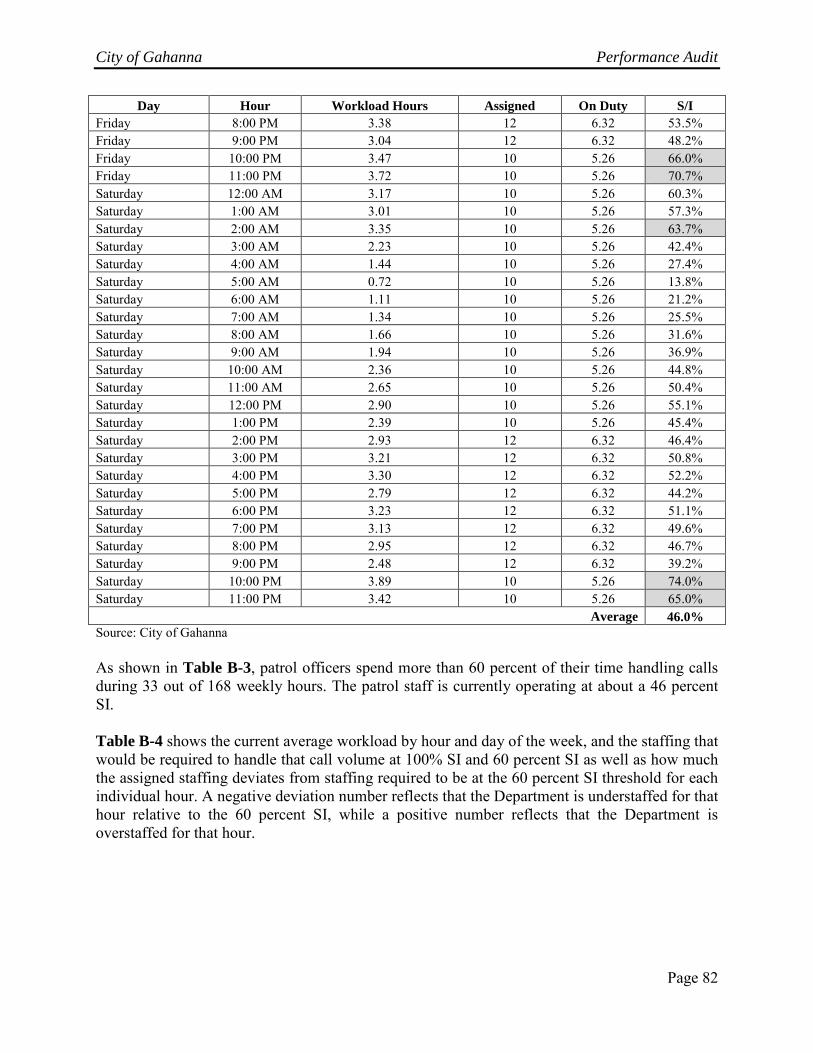
City of Gahanna Performance Audit
Page 82
Day Hour Workload Hours Assigned On Duty S/I Friday 8:00 PM 3.38 12 6.32 53.5% Friday 9:00 PM 3.04 12 6.32 48.2% Friday 10:00 PM 3.47 10 5.26 66.0% Friday 11:00 PM 3.72 10 5.26 70.7% Saturday 12:00 AM 3.17 10 5.26 60.3% Saturday 1:00 AM 3.01 10 5.26 57.3% Saturday 2:00 AM 3.35 10 5.26 63.7% Saturday 3:00 AM 2.23 10 5.26 42.4% Saturday 4:00 AM 1.44 10 5.26 27.4% Saturday 5:00 AM 0.72 10 5.26 13.8% Saturday 6:00 AM 1.11 10 5.26 21.2% Saturday 7:00 AM 1.34 10 5.26 25.5% Saturday 8:00 AM 1.66 10 5.26 31.6% Saturday 9:00 AM 1.94 10 5.26 36.9% Saturday 10:00 AM 2.36 10 5.26 44.8% Saturday 11:00 AM 2.65 10 5.26 50.4% Saturday 12:00 PM 2.90 10 5.26 55.1% Saturday 1:00 PM 2.39 10 5.26 45.4% Saturday 2:00 PM 2.93 12 6.32 46.4% Saturday 3:00 PM 3.21 12 6.32 50.8% Saturday 4:00 PM 3.30 12 6.32 52.2% Saturday 5:00 PM 2.79 12 6.32 44.2% Saturday 6:00 PM 3.23 12 6.32 51.1% Saturday 7:00 PM 3.13 12 6.32 49.6% Saturday 8:00 PM 2.95 12 6.32 46.7% Saturday 9:00 PM 2.48 12 6.32 39.2% Saturday 10:00 PM 3.89 10 5.26 74.0% Saturday 11:00 PM 3.42 10 5.26 65.0%
Average 46.0% Source: City of Gahanna As shown in Table B-3, patrol officers spend more than 60 percent of their time handling calls during 33 out of 168 weekly hours. The patrol staff is currently operating at about a 46 percent SI. Table B-4 shows the current average workload by hour and day of the week, and the staffing that would be required to handle that call volume at 100% SI and 60 percent SI as well as how much the assigned staffing deviates from staffing required to be at the 60 percent SI threshold for each individual hour. A negative deviation number reflects that the Department is understaffed for that hour relative to the 60 percent SI, while a positive number reflects that the Department is overstaffed for that hour.

City of Gahanna Performance Audit
Page 83
Table B-4: Staffing Deviation from Optimal by Hour and Day Day Hour Workload Hours 100% SI 60% SI Assigned Deviation
Sunday 12:00 AM 3.44 6.5 10.9 10 (0.9) Sunday 1:00 AM 3.59 6.8 11.4 10 (1.4) Sunday 2:00 AM 3.45 6.6 10.9 10 (0.9) Sunday 3:00 AM 2.56 4.9 8.1 10 1.9 Sunday 4:00 AM 1.48 2.8 4.7 10 5.3 Sunday 5:00 AM 0.94 1.8 3.0 10 7.0 Sunday 6:00 AM 1.06 2.0 3.4 10 6.6 Sunday 7:00 AM 0.94 1.8 3.0 10 7.0 Sunday 8:00 AM 1.26 2.4 4.0 10 6.0 Sunday 9:00 AM 1.62 3.1 5.1 10 4.9 Sunday 10:00 AM 1.85 3.5 5.9 10 4.1 Sunday 11:00 AM 2.18 4.1 6.9 10 3.1 Sunday 12:00 PM 2.37 4.5 7.5 10 2.5 Sunday 1:00 PM 1.88 3.6 6.0 10 4.0 Sunday 2:00 PM 2.79 5.3 8.8 12 3.2 Sunday 3:00 PM 3.28 6.2 10.4 12 1.6 Sunday 4:00 PM 3.16 6.0 10.0 12 2.0 Sunday 5:00 PM 2.89 5.5 9.1 12 2.9 Sunday 6:00 PM 3.20 6.1 10.1 12 1.9 Sunday 7:00 PM 3.15 6.0 10.0 12 2.0 Sunday 8:00 PM 2.82 5.4 8.9 12 3.1 Sunday 9:00 PM 2.10 4.0 6.7 12 5.3 Sunday 10:00 PM 2.94 5.6 9.3 10 0.7 Sunday 11:00 PM 2.18 4.1 6.9 10 3.1 Monday 12:00 AM 2.06 3.9 6.5 10 3.5 Monday 1:00 AM 1.71 3.2 5.4 10 4.6 Monday 2:00 AM 1.30 2.5 4.1 10 5.9 Monday 3:00 AM 1.08 2.1 3.4 10 6.6 Monday 4:00 AM 0.89 1.7 2.8 10 7.2 Monday 5:00 AM 0.51 1.0 1.6 10 8.4 Monday 6:00 AM 0.92 1.7 2.9 10 7.1 Monday 7:00 AM 1.93 3.7 6.1 10 3.9 Monday 8:00 AM 2.70 5.1 8.6 10 1.4 Monday 9:00 AM 2.50 4.8 7.9 10 2.1 Monday 10:00 AM 2.52 4.8 8.0 10 2.0 Monday 11:00 AM 2.84 5.4 9.0 10 1.0 Monday 12:00 PM 3.06 5.8 9.7 10 0.3 Monday 1:00 PM 2.47 4.7 7.8 10 2.2 Monday 2:00 PM 3.61 6.9 11.4 12 0.6 Monday 3:00 PM 3.57 6.8 11.3 12 0.7 Monday 4:00 PM 3.92 7.5 12.4 12 (0.4) Monday 5:00 PM 4.46 8.5 14.1 12 (2.1) Monday 6:00 PM 4.23 8.0 13.4 12 (1.4) Monday 7:00 PM 3.72 7.1 11.8 12 0.2 Monday 8:00 PM 3.57 6.8 11.3 12 0.7 Monday 9:00 PM 2.61 5.0 8.3 12 3.7
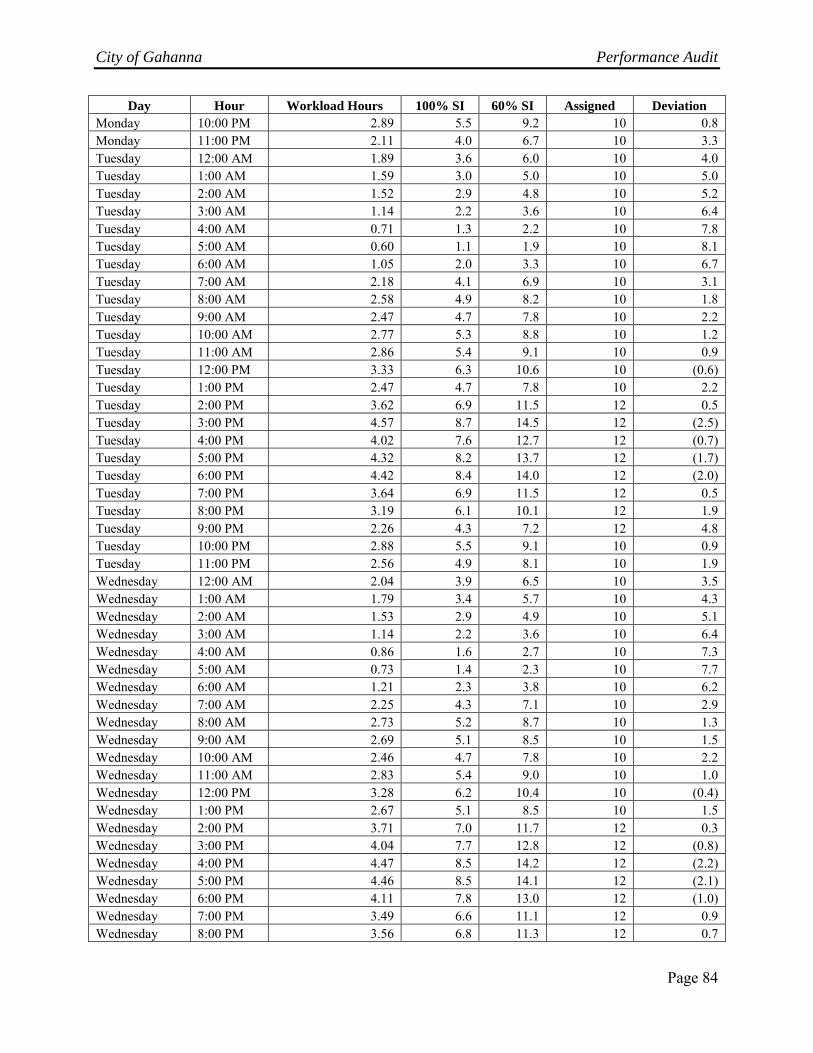
City of Gahanna Performance Audit
Page 84
Day Hour Workload Hours 100% SI 60% SI Assigned Deviation Monday 10:00 PM 2.89 5.5 9.2 10 0.8 Monday 11:00 PM 2.11 4.0 6.7 10 3.3 Tuesday 12:00 AM 1.89 3.6 6.0 10 4.0 Tuesday 1:00 AM 1.59 3.0 5.0 10 5.0 Tuesday 2:00 AM 1.52 2.9 4.8 10 5.2 Tuesday 3:00 AM 1.14 2.2 3.6 10 6.4 Tuesday 4:00 AM 0.71 1.3 2.2 10 7.8 Tuesday 5:00 AM 0.60 1.1 1.9 10 8.1 Tuesday 6:00 AM 1.05 2.0 3.3 10 6.7 Tuesday 7:00 AM 2.18 4.1 6.9 10 3.1 Tuesday 8:00 AM 2.58 4.9 8.2 10 1.8 Tuesday 9:00 AM 2.47 4.7 7.8 10 2.2 Tuesday 10:00 AM 2.77 5.3 8.8 10 1.2 Tuesday 11:00 AM 2.86 5.4 9.1 10 0.9 Tuesday 12:00 PM 3.33 6.3 10.6 10 (0.6) Tuesday 1:00 PM 2.47 4.7 7.8 10 2.2 Tuesday 2:00 PM 3.62 6.9 11.5 12 0.5 Tuesday 3:00 PM 4.57 8.7 14.5 12 (2.5) Tuesday 4:00 PM 4.02 7.6 12.7 12 (0.7) Tuesday 5:00 PM 4.32 8.2 13.7 12 (1.7) Tuesday 6:00 PM 4.42 8.4 14.0 12 (2.0) Tuesday 7:00 PM 3.64 6.9 11.5 12 0.5 Tuesday 8:00 PM 3.19 6.1 10.1 12 1.9 Tuesday 9:00 PM 2.26 4.3 7.2 12 4.8 Tuesday 10:00 PM 2.88 5.5 9.1 10 0.9 Tuesday 11:00 PM 2.56 4.9 8.1 10 1.9 Wednesday 12:00 AM 2.04 3.9 6.5 10 3.5 Wednesday 1:00 AM 1.79 3.4 5.7 10 4.3 Wednesday 2:00 AM 1.53 2.9 4.9 10 5.1 Wednesday 3:00 AM 1.14 2.2 3.6 10 6.4 Wednesday 4:00 AM 0.86 1.6 2.7 10 7.3 Wednesday 5:00 AM 0.73 1.4 2.3 10 7.7 Wednesday 6:00 AM 1.21 2.3 3.8 10 6.2 Wednesday 7:00 AM 2.25 4.3 7.1 10 2.9 Wednesday 8:00 AM 2.73 5.2 8.7 10 1.3 Wednesday 9:00 AM 2.69 5.1 8.5 10 1.5 Wednesday 10:00 AM 2.46 4.7 7.8 10 2.2 Wednesday 11:00 AM 2.83 5.4 9.0 10 1.0 Wednesday 12:00 PM 3.28 6.2 10.4 10 (0.4) Wednesday 1:00 PM 2.67 5.1 8.5 10 1.5 Wednesday 2:00 PM 3.71 7.0 11.7 12 0.3 Wednesday 3:00 PM 4.04 7.7 12.8 12 (0.8) Wednesday 4:00 PM 4.47 8.5 14.2 12 (2.2) Wednesday 5:00 PM 4.46 8.5 14.1 12 (2.1) Wednesday 6:00 PM 4.11 7.8 13.0 12 (1.0) Wednesday 7:00 PM 3.49 6.6 11.1 12 0.9 Wednesday 8:00 PM 3.56 6.8 11.3 12 0.7
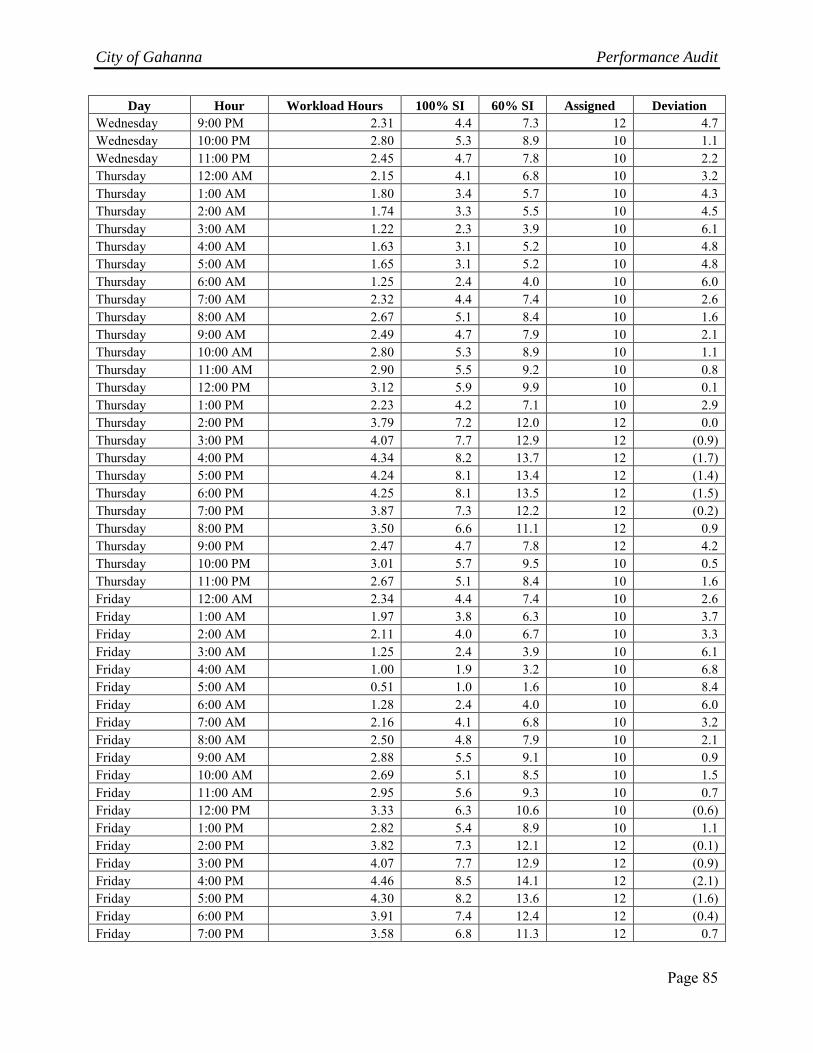
City of Gahanna Performance Audit
Page 85
Day Hour Workload Hours 100% SI 60% SI Assigned Deviation Wednesday 9:00 PM 2.31 4.4 7.3 12 4.7 Wednesday 10:00 PM 2.80 5.3 8.9 10 1.1 Wednesday 11:00 PM 2.45 4.7 7.8 10 2.2 Thursday 12:00 AM 2.15 4.1 6.8 10 3.2 Thursday 1:00 AM 1.80 3.4 5.7 10 4.3 Thursday 2:00 AM 1.74 3.3 5.5 10 4.5 Thursday 3:00 AM 1.22 2.3 3.9 10 6.1 Thursday 4:00 AM 1.63 3.1 5.2 10 4.8 Thursday 5:00 AM 1.65 3.1 5.2 10 4.8 Thursday 6:00 AM 1.25 2.4 4.0 10 6.0 Thursday 7:00 AM 2.32 4.4 7.4 10 2.6 Thursday 8:00 AM 2.67 5.1 8.4 10 1.6 Thursday 9:00 AM 2.49 4.7 7.9 10 2.1 Thursday 10:00 AM 2.80 5.3 8.9 10 1.1 Thursday 11:00 AM 2.90 5.5 9.2 10 0.8 Thursday 12:00 PM 3.12 5.9 9.9 10 0.1 Thursday 1:00 PM 2.23 4.2 7.1 10 2.9 Thursday 2:00 PM 3.79 7.2 12.0 12 0.0 Thursday 3:00 PM 4.07 7.7 12.9 12 (0.9) Thursday 4:00 PM 4.34 8.2 13.7 12 (1.7) Thursday 5:00 PM 4.24 8.1 13.4 12 (1.4) Thursday 6:00 PM 4.25 8.1 13.5 12 (1.5) Thursday 7:00 PM 3.87 7.3 12.2 12 (0.2) Thursday 8:00 PM 3.50 6.6 11.1 12 0.9 Thursday 9:00 PM 2.47 4.7 7.8 12 4.2 Thursday 10:00 PM 3.01 5.7 9.5 10 0.5 Thursday 11:00 PM 2.67 5.1 8.4 10 1.6 Friday 12:00 AM 2.34 4.4 7.4 10 2.6 Friday 1:00 AM 1.97 3.8 6.3 10 3.7 Friday 2:00 AM 2.11 4.0 6.7 10 3.3 Friday 3:00 AM 1.25 2.4 3.9 10 6.1 Friday 4:00 AM 1.00 1.9 3.2 10 6.8 Friday 5:00 AM 0.51 1.0 1.6 10 8.4 Friday 6:00 AM 1.28 2.4 4.0 10 6.0 Friday 7:00 AM 2.16 4.1 6.8 10 3.2 Friday 8:00 AM 2.50 4.8 7.9 10 2.1 Friday 9:00 AM 2.88 5.5 9.1 10 0.9 Friday 10:00 AM 2.69 5.1 8.5 10 1.5 Friday 11:00 AM 2.95 5.6 9.3 10 0.7 Friday 12:00 PM 3.33 6.3 10.6 10 (0.6) Friday 1:00 PM 2.82 5.4 8.9 10 1.1 Friday 2:00 PM 3.82 7.3 12.1 12 (0.1) Friday 3:00 PM 4.07 7.7 12.9 12 (0.9) Friday 4:00 PM 4.46 8.5 14.1 12 (2.1) Friday 5:00 PM 4.30 8.2 13.6 12 (1.6) Friday 6:00 PM 3.91 7.4 12.4 12 (0.4) Friday 7:00 PM 3.58 6.8 11.3 12 0.7

City of Gahanna Performance Audit
Page 86
Day Hour Workload Hours 100% SI 60% SI Assigned Deviation Friday 8:00 PM 3.38 6.4 10.7 12 1.3 Friday 9:00 PM 3.04 5.8 9.6 12 2.4 Friday 10:00 PM 3.47 6.6 11.0 10 (1.0) Friday 11:00 PM 3.72 7.1 11.8 10 (1.8) Saturday 12:00 AM 3.17 6.0 10.0 10 (0.0) Saturday 1:00 AM 3.01 5.7 9.5 10 0.5 Saturday 2:00 AM 3.35 6.4 10.6 10 (0.6) Saturday 3:00 AM 2.23 4.2 7.1 10 2.9 Saturday 4:00 AM 1.44 2.7 4.6 10 5.4 Saturday 5:00 AM 0.72 1.4 2.3 10 7.7 Saturday 6:00 AM 1.11 2.1 3.5 10 6.5 Saturday 7:00 AM 1.34 2.6 4.3 10 5.7 Saturday 8:00 AM 1.66 3.2 5.3 10 4.7 Saturday 9:00 AM 1.94 3.7 6.2 10 3.8 Saturday 10:00 AM 2.36 4.5 7.5 10 2.5 Saturday 11:00 AM 2.65 5.0 8.4 10 1.6 Saturday 12:00 PM 2.90 5.5 9.2 10 0.8 Saturday 1:00 PM 2.39 4.5 7.6 10 2.4 Saturday 2:00 PM 2.93 5.6 9.3 12 2.7 Saturday 3:00 PM 3.21 6.1 10.2 12 1.8 Saturday 4:00 PM 3.30 6.3 10.4 12 1.6 Saturday 5:00 PM 2.79 5.3 8.8 12 3.2 Saturday 6:00 PM 3.23 6.1 10.2 12 1.8 Saturday 7:00 PM 3.13 6.0 9.9 12 2.1 Saturday 8:00 PM 2.95 5.6 9.3 12 2.7 Saturday 9:00 PM 2.48 4.7 7.8 12 4.2 Saturday 10:00 PM 3.89 7.4 12.3 10 (2.3) Saturday 11:00 PM 3.42 6.5 10.8 10 (0.8)
Total Deviation 398.9 Average 2.4
Source: City of Gahanna As shown in Table B-4, the GDP has an average of 2.4 FTE more patrol officers per hour than would be needed to keep each shift at about 60 percent SI.

City of Gahanna Performance Audit
Page 87
Client Response The letter that follows is the City’s official response to the performance audit. Throughout the audit process, staff met with the City management to ensure substantial agreement on the factual information presented in the report. When management disagreed with information contained in the report, and provided supporting documentation, revisions were made to the audit report.

“HERB CAPITAL OF OHIO”
200 SOUTH HAMILTON ROAD GAHANNA, OHIO 43230
614.342.4000 PHONE 614.342.4100 FAX WWW.GAHANNA.GOV
August 3, 2017
Dave Yost, Auditor
Office of the Auditor of State
88 East Broad Street, 5th Floor
Columbus, Ohio 43215
Dear Auditor Yost,
The City of Gahanna would like to thank you and the audit team, led by Brent Grace, for conducting the
City of Gahanna Performance Audit. The audit, performed at the request of the City, confirms that the
City is on the right track in reducing expenditures and improving the efficiency of City programs and
services and provides recommendations for furthering these efforts.
Over the past few years, the City of Gahanna has worked hard to provide the best value to our
taxpayers, taking many steps to improve our financial management, reduce costs and improve our
efficiency. The successful development of a Sustainable Operating Model to keep our operating budgets
balanced and the implementation of Lean and Six Sigma tools through the Lean Gahanna program are
two examples of this work. This audit gives us the opportunity to take an unbiased look at our
operations, and identify further opportunities for improvement.
The audit provides several cost-saving recommendations for the City to consider. It also includes several
recommendations for changes to collective bargaining agreements. The City appreciates these
recommendations, and, in many cases, is already working toward solutions.
The audit report validates recent efforts by the Administration to develop the tools necessary to provide
accurate and meaningful indirect cost data for City programs. Through the development of department-
level Strategic Business Plans and the selection and implementation of a new financial accounting
system, the City will have the data and capacity to effectively manage and report indirect costs.
For the past year, our Director of Human Resources has been working to develop a cost-effective near-
site healthcare clinic concept, which the Administration hopes to implement in January 2018. We are
also working with the Central Ohio Health Care Consortium (COHCC) to identify the most cost-effective
insurance coverage possible, and will propose amendments to the COHCC’s governing documents in the
coming year to ensure that Gahanna’s insurance premiums reflect the many cost-saving efforts that we
have in place.

“HERB CAPITAL OF OHIO”
200 SOUTH HAMILTON ROAD GAHANNA, OHIO 43230
614.342.4000 PHONE 614.342.4100 FAX WWW.GAHANNA.GOV
The audit team made several recommendations related to the City’s collective bargaining agreements
pertaining to leave and overtime policies, with a focus on the true cost and impact of paid-leave policies
for the City. While we may be unable to directly address these recommendations in the short-term, they
will guide our bargaining processes in the years to come.
We are proud that the City was able to provide meaningful and in-depth call-related data to the audit
team so that could complete such a detailed and thoughtful analysis of police and dispatcher staffing.
We anticipate leveraging their analysis to develop data-driven staffing plans in public safety that provide
maximum impact for the community and reduce overtime expenditures.
We are carefully reviewing the recommendation to bring Service Garage staffing in line with
benchmarks. The City is actively pursuing partnerships with outside agencies to in-source additional fleet
maintenance jobs, and we will continue to evaluate garage staffing levels.
The recommendations related to Parks and Recreation highlight the importance and necessity for the
Administration and City Council to spend time to gain consensus on the desired and appropriate level of
subsidy that should be provided for recreation programs, particularly active adult and aquatics
programs. The Administration anticipates bringing the subsidy policy forward to City Council, prior to
2018 budget deliberations, for review and updates. Once updated, this policy will guide
recommendations about services provided and fee structures for recreation activities throughout the
City.
Once again, the City of Gahanna wishes to acknowledge the partnership formed with the audit team.
This process has validated much of the good work accomplished by the City in recent years to cut costs
and improve efficiencies, and has identified additional opportunities to do so. The audit team was
thorough, professional and thoughtful. This process has yielded insights that will benefit the City for
years to come.
Sincerely,
Thomas R. Kneeland
Mayor
Jennifer Teal
City Administrator
88EastBroadStreet,FourthFloor,Columbus,Ohio43215‐3506Phone:614‐466‐4514or800‐282‐0370Fax:614‐466‐4490
www.ohioauditor.gov
CITY OF GAHANNA
FRANKLIN COUNTY
CLERK’S CERTIFICATION This is a true and correct copy of the report which is required to be filed in the Office of the Auditor of State pursuant to Section 117.26, Revised Code, and which is filed in Columbus, Ohio.
CLERK OF THE BUREAU CERTIFIED AUGUST 10, 2017
Related Documents


![1. Overtime - NOVAtimeFull] NOVAtime California HR... · 1. Overtime • Misclassification • Unpaid overtime • Off-the-clock work 2. Meal & rest periods 3. Unreimbursed expenses](https://static.cupdf.com/doc/110x72/5a78b2877f8b9ae91b8e2619/1-overtime-full-novatime-california-hr1-overtime-misclassification-.jpg)