This article was originally published in a journal published by Elsevier, and the attached copy is provided by Elsevier for the author’s benefit and for the benefit of the author’s institution, for non-commercial research and educational use including without limitation use in instruction at your institution, sending it to specific colleagues that you know, and providing a copy to your institution’s administrator. All other uses, reproduction and distribution, including without limitation commercial reprints, selling or licensing copies or access, or posting on open internet sites, your personal or institution’s website or repository, are prohibited. For exceptions, permission may be sought for such use through Elsevier’s permissions site at: http://www.elsevier.com/locate/permissionusematerial

Welcome message from author
This document is posted to help you gain knowledge. Please leave a comment to let me know what you think about it! Share it to your friends and learn new things together.
Transcript
This article was originally published in a journal published byElsevier, and the attached copy is provided by Elsevier for the
author’s benefit and for the benefit of the author’s institution, fornon-commercial research and educational use including without
limitation use in instruction at your institution, sending it to specificcolleagues that you know, and providing a copy to your institution’s
administrator.
All other uses, reproduction and distribution, including withoutlimitation commercial reprints, selling or licensing copies or access,
or posting on open internet sites, your personal or institution’swebsite or repository, are prohibited. For exceptions, permission
may be sought for such use through Elsevier’s permissions site at:
http://www.elsevier.com/locate/permissionusematerial
Autho
r's
pers
onal
co
py
Development of an ultra-violet digital camerafor volcanic SO2 imaging
G.J.S. Bluth a,⁎, J.M. Shannon b, I.M. Watson c, A.J. Prata d, V.J. Realmuto e
a Department of Geological Engineering and Sciences, Michigan Technological University, Houghton, MI 49931, USAb Finlandia University, 601 Quincy Street, Hancock, MI 49930, USA
c Department of Earth Sciences, University of Bristol, Wills Memorial Building, Queen's Road, Bristol, BS8 1RJ, UKd Norwegian Institute for Air Research, P.O. Box 100, Instituttveien 18, NO-2027 Kjeller, Norwaye Jet Propulsion Laboratory, MS 183-501, 4800 Oak Grove Drive, Pasadena, CA 91109, USA
Received 28 June 2006; received in revised form 27 October 2006; accepted 10 November 2006Available online 4 January 2007
Abstract
In an effort to improve monitoring of passive volcano degassing, we have constructed and tested a digital camera for quantifyingthe sulfur dioxide (SO2) content of volcanic plumes. The camera utilizes a bandpass filter to collect photons in the ultra-violet (UV)region where SO2 selectively absorbs UV light. SO2 is quantified by imaging calibration cells of known SO2 concentrations.
Images of volcanic SO2 plumes were collected at four active volcanoes with persistent passive degassing: Villarrica, located inChile, and Santiaguito, Fuego, and Pacaya, located in Guatemala. Images were collected from distances ranging between 4 and28 km away, with acceptable detection up to approximately 16 km. Camera set-up time in the field ranges from 5–10 min andtemporal resolution of up to 6 images per minute is possible, which combined with the camera's field of view makes a continuousSO2 dataset attainable. Variable in-plume concentrations can be observed and accurate plume speeds (or rise rates) can readily bedetermined by tracing individual portions of the plume within sequential images.
Initial fluxes computed from camera images require a correction for the effects of environmental light scattered into the field ofview. At Fuego volcano, simultaneous measurements of corrected SO2 fluxes with the camera and a Correlation Spectrometer(COSPEC) agreed within 25%. Experiments at the other sites were equally encouraging, and demonstrated the camera's ability todetect SO2 under variable background meteorological and environmental conditions. This early work has shown great success inimaging SO2 plumes and offers promise for volcano monitoring due to its rapid deployment and data processing capabilities,relatively low cost, and improved interpretation afforded by synoptic coverage from a range of distances.© 2006 Elsevier B.V. All rights reserved.
Keywords: volcano monitoring; ultraviolet camera; degassing; sulfur dioxide
1. Introduction
Establishing baseline sulfur dioxide (SO2) emissionsand interpreting deviations from that baseline is an on-
going objective of volcano hazard monitoring. Changes inSO2 emissions from background levels can indicate majorchanges in the volcanic system, often foreshadowing achange in eruptive activity (e.g.,Malinconico, 1987; Daaget al., 1996; Gardner andWhite, 2002). SO2 is targeted forremote sensing due to its relative abundance in volcanicplumes (2–12%molarmass—Symonds et al., 1994), low
Journal of Volcanology and Geothermal Research 161 (2007) 47–56www.elsevier.com/locate/jvolgeores
⁎ Corresponding author. Tel.: +1 906 487 3554; fax: +1 906 487 3371.E-mail address: [email protected] (G.J.S. Bluth).
0377-0273/$ - see front matter © 2006 Elsevier B.V. All rights reserved.doi:10.1016/j.jvolgeores.2006.11.004

Autho
r's
pers
onal
co
py
atmospheric background concentrations (typically lessthan 10 parts per billion— Andres and Rose, 1995), andcharacteristic absorption bands in the ultra-violet (UV)wavelengths (Millan et al., 1976). Measuring SO2
emissions from active volcanoes has become a mainstayin monitoring and scientific efforts, since the developmentof the field-portable correlation spectrometer (COSPEC)in the early 1970s. This paper describes a new ground-based method of imaging and quantifying SO2 emissions,using a UV camera.
Ground-based SO2 monitoring has relied primarilyon two instruments: COSPEC (Stoiber et al., 1983) and,more recently, compact UV spectrometers adapted forground-based monitoring, collectively referred to hereby the retrieval technique employed — DOAS (Differ-ential Optical Absorption Spectroscopy; e.g., Galleet al., 2003). These instruments use scattered sunlight asthe UV light source, and take advantage of selectiveabsorption of UV light by SO2 (Moffat and Millan,1971; Millan et al., 1976; Platt, 1994). Transects of theemitted plume are taken either from a fixed position byrotating the instrument, or by keeping the sensor stableand scanning through the plume by means of automo-bile, boat, or aircraft traverses. SO2 fluxes are therebyderived from the measured cross-sectional burden andthe plume speed. COSPEC and DOAS field campaignsduring periods of volcanic unrest have significantlyadvanced our understanding of eruption processes andpre-eruption monitoring (e.g., Symonds et al., 1994;Stix and Gaonac'h, 2000; Edmonds et al., 2003a,b).
However, there are significant limitations to scanningtechniques. For example, the wind speed calculation cancontribute up to 40% to the overall error (Casadevall et al.,1981; Stoiber et al., 1983), as it must be derivedindependently from hand-held devices or local weatherstations that may or may not represent the wind profile atthe actual plume height and location. Measuring plumeswith multiple instruments can reduce this problem sign-ficantly (McGonigle et al., 2005; Williams-Jones et al.,2006). The field of view is relatively small for COSPECand compact UV spectrometers, and the data represent alocalized cross-section of themoving plume averaged overthe duration of the scan. Therefore variations in plumecomposition during the scan, or flux changes occurringfaster than the sampling rate, cannot be recognized.Fluctuations in calculated emission rates can result fromchanges in meteorological conditions and/or changes insubsurface magmatic processes or interactions. In addi-tion, SO2 begins to disperse and chemically convert tosulfuric acid aerosol immediately upon entering theatmosphere (Eatough et al., 1994), and down-windmeasurements may therefore progressively underestimate
the actual emission rates. However, McGonigle et al.(2004) found negligible impacts fromSO2 removal on fluxcalculations downwind of Masaya volcano, Nicaragua.
Thus, scanning method limitations can seriouslyimpact two common objectives of SO2 monitoring: (1)the need to collect continuous, accurate data for an ex-tended period of time; and (2) the need to identify andevaluate emission fluctuations. Measured SO2 emissionsmay vary due to volcanic processes, or as a result of in-homogeneous mixing caused by physical and chemicaldispersion processes in the atmosphere. During a volcanicprocess it is difficult to evaluate changes in SO2 degassingbased upon sporadic measurements, or compare thesesporadic SO2 emission rate estimates to continuousmeasurements such as seismicity or ground deformation(see Edmonds et al., 2003b, which describes a continuousscanning system employed at Montserrat to comparerelatively high-speed [10 measurements per hour] SO2
measurements to seismic data).Significant improvements to volcanic SO2 monitoring
may be possible through imaging, which ideally captures alarge extent of a volcanic plume in a single image andmapsthe spatial variations in SO2 content. UV satellite-basedimaging of volcanogenic SO2 has successfully monitoredlarge-scale volcanic activity for over 25 years, and themostadvanced system to date, OMI (Ozone Monitoring Instru-ment), can produce daily global SO2 maps at 13×24 km2
nadir resolution (Krotkov et al., 2006). Nguyn et al.(1995a,b) developed a method of UV imaging of SO2
pollution plumes in the laboratory, using optical interfer-ometry and a CCD detector. Sandsten et al. (1996) alsocreated a laboratory technique to image gas plumes by gas-correlation spectrometry (comparison of measured plumeabsorption to that of calibration cells) in the infrared.Bobrowski et al. (2006) have developed an imagingDOAS method capable of scanning through a completeplume to produce a gas distributionmap of SO2 and severalother gases, at a rate of approximately 15 min per image.
This research is based on a UV instrument concept thatwas tested at NASA's Jet Propulsion Laboratory, whichshowed that the digital response of a gas filter camera wasproportional to the line-of-sight burden of SO2 (Realmuto,1998). We describe the basics of a newly-developed UVcamera system, which builds upon many aspects ofprevious imaging efforts, and the first field tests conductedat four active volcanoes in South and Central America in2004–2005.
2. Methods and materials
Instrumentation includes an Apogee InstrumentsE6 Alta digital camera with a Kodak KAF-1001E-2
48 G.J.S. Bluth et al. / Journal of Volcanology and Geothermal Research 161 (2007) 47–56

Autho
r's
pers
onal
co
py
1024×1024 CCD array with 16-bit quantization levelper pixel, a 105 mm lens from Coastal Optics, and abandpass filter from Andover Optics centered at 307 nmwith a 12 nm full width half max bandwidth, mountedon a standard camera tripod, and powered by two drycell 6 volt batteries (Fig. 1). The total cost for thesecomponents was less than $18,000 (2005 prices). Cameraoperation is controlled by a laptop computer with MaxImDL computer software (by Diffraction Limited; includedwith the digital camera) via an Ethernet cable. The CCDincludes a thermo-electric cooler and fan system, but ourtests found that the CCD dark current remained belowbackground noise of the camera with only the fan in use.
Field set-up time is approximately 5–10 min and in-cludes taking sample images of the plume to adjust focusand exposure time. Focus is adjusted manually by usingthe top of the volcano as a target. The camera's field ofview (FOV) is approximately 13° (∼5 m resolution pixelsat 10 km range), which provides a relatively large imageof an emitted gas plume (see Figs. 2–5). Exposure time isadjusted to produce the best separation of plume frombackground without pixel saturation (typical middayexposure times are 0.5–0.8 s). Two fused-silica calibra-tion cells, made by Resonance Ltd., provided SO2 con-centration-pathlength products of 115 and 270 ppm m,respectively. These cells have flat absorption within 1% inthe 290–320 nm spectral range, and were imaged before,after, and roughly every 60 minutes during datacollection, although no evidence of instrument responsedrift was observed during our field tests.
Field measurement sites were selected to optimizeplume imaging, similar to criteria used for scanning
spectrometer placements: (1) the camera viewing directionis near perpendicular to plume direction; (2) a sufficientarea of open sky is available as background; and (3) thesun is directly overhead or behind the camera viewingdirection. In the field, a cardboard collimator is used toreduce the amount of direct and scattered light on the lens;therefore keeping the sun behind the camera reducesbackground noise, but is not a necessity for imaging.
An SO2 slant column densitymap is generated from theraw image. The background sky values are averaged toeliminate vignetting — a condition where light intensitydecreases toward the edges of the image. Most vignettingis an optical effect observed with longer lenses in whichoblique light does not illuminate the image corners. TheMaxIm software includes an interactive routine which
Fig. 1. Field set-up of UV camera and associated components. Thecamera and lens are mounted on a tripod, and connected to the laptopcomputer (kept under the towel, due to glare). The laptop and cameraare powered by two 6-volt batteries, although other power sources arepossible.
Fig. 2. a) Visible image of Villarrica taken with a digital camera from adistance of 16.5 km. b) Near-simultaneous image of Villarrica taken fromthe same location but using the UV camera, with a 0.8 s exposure, todiscriminate SO2. Plume absorbances are scaled to calibration cell results.Awind speed of 4.5 m s−1 was calculated from measuring movement ofdistinctive portions of the plume on consecutive images. Fluxes arecalculated on different portions of the plume using an air light correction(see text), with arrows indicating the cross-sectional slice orientation (t/d =tonnes per day). The faded blue circles are a result of particles or spots onthe camera optics.
49G.J.S. Bluth et al. / Journal of Volcanology and Geothermal Research 161 (2007) 47–56
Autho
r's
pers
onal
co
py
employs user-selected points to recalculate the back-ground sky to nearly uniform light intensity throughoutthe image. This algorithm does not significantly changethe magnitude of the plume to background ratio. Theabsorbance in each plume pixel is computed by comparingplume pixels with the average background, using therelationship
A ¼ log10ðIo=IÞ ð1Þwhere Io=light intensity before passing through SO2
(background sky), and I=light intensity after passingthrough SO2. The plume absorbances are then scaled toconcentration-pathlength products using measured cal-ibration cell absorbances, to derive an SO2 slant columnconcentration for any plume pixel.
The dimensions of a pixel in a given UV cameraimage can be easily calculated, knowing the size anddimension of the CCD array, the focal length of the lens,and measuring the distance from the camera to the target(Shannon, 2006). Plume velocity is thereby calculateddirectly by measuring the distance traveled of distinctiveplume features on consecutively timed images; however,
wind direction must be determined independently fordrifting plumes. SO2 fluxes can be calculated similarly toscanning methods, by integrating the abundance overtransects (correcting, as needed, for non-perpendicularplume viewing angles) and multiplying the integratedmass by the plume velocity. As the camera FOV covers abroad section of plume,multiple cross-sections (or areas)can be evaluated to eliminate problems from plumeheterogeneity.
3. Results
Wewere able to test the camera under a variety of fieldconditions, with variations in emission levels, distancefrom the volcano, atmospheric and meteorological condi-tions, and plume geometries, similar to what would beexpected in a volcano monitoring program. For the
Fig. 3. a) Visible still image of Santiaguito plume collected from videocamera footage. b) UV camera image of Santiaguito SO2 plume collectedat the same location and time using a 0.5 s exposure time. Fluxcalculations and plume absorbance characteristics as explained in Fig. 2.
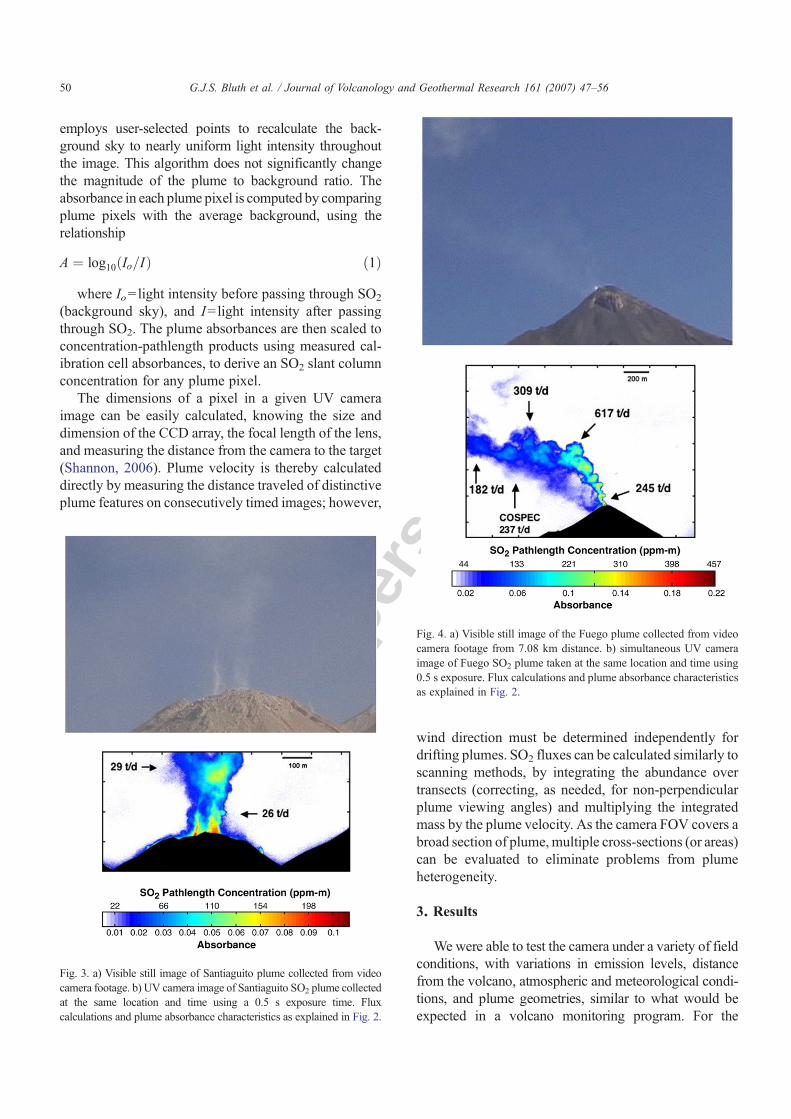
Fig. 4. a) Visible still image of the Fuego plume collected from videocamera footage from 7.08 km distance. b) simultaneous UV cameraimage of Fuego SO2 plume taken at the same location and time using0.5 s exposure. Flux calculations and plume absorbance characteristicsas explained in Fig. 2.
50 G.J.S. Bluth et al. / Journal of Volcanology and Geothermal Research 161 (2007) 47–56

Autho
r's
pers
onal
co
py
purpose of demonstrating this technique, cloud-freeimages are displayed for each field site. Many imageswere taken under conditions with significant meteorolog-ical clouds. Clouds behind the plume produced no sig-nificant effect on SO2 retrievals compared to clear-skybackgrounds. Meteorological clouds between the cameraand plume affected the SO2 retrievals, aswould be the casefor scanningmethods. However, even if the field of view ispartially obscured by meteorological clouds, it is possibleto derive SO2 fluxes from the cloud-free regions of the UVcamera image.
3.1. Villarrica
Villarrica volcano is a basaltic–andesitic stratovolca-no, located in southern Chile (39.42° S, 71.93° W), witha summit height of 2850 m. Volcanic activity consisted
of a persistent gas plume emanating from the lava lake.Visible and UV images of Villarrica were collected onNovember 17–18, 2004 from four different locationsranging from approximately 8–20 km from the volcano.At these distances, pixel resolutions ranged from 1.92 mto 4.79 m, respectively. Meteorological conditionsduring this period ranged from cloud-free, to abundant;meteorological clouds in the background had virtuallyno effect on SO2 discrimination.
Fig. 2 compares a visible and false color ultravioletimage of the Villarrica plume taken coincidentally from16.5 km N of the volcano. The clean, cloud-free atmo-sphere provided an ideal background, and absorption ofUV light by SO2 in the volcanic plume allows distinctdiscrimination from the background sky. The SO2 plumedemonstrates significant heterogeneity; calculated fluxesranged over at least a factor of three in this plume image,which might be difficult to resolve using a scanningtechnique.
3.2. Santiaguito
Santiaguito volcano is a dacitic lava dome located onthe WNW-trending volcanic front in Guatemala (14.756°N, 91.552° W). The SO2 plume was imaged with the UVcamera on January 17, 2005 from 4.12 km S of thevolcano. Activity during this time period consisted of acontinuous gas plume interspersed with moderately sized,ash-rich vulcanian eruptions every 0.5–2 h. Images werecollected in the mid-morning; low-level clouds typicallyform daily by noon and obscure the top of the dome.
Fig. 3a shows a (visible) photograph of the Santia-guito dome on themorning of January 17, 2005 collectedfrom a video camera and Fig. 3b shows a coincidentalimage taken with the UV camera using a 0.5 s exposuretime. Imaging conditions were challenging at Santia-guito; the frequent explosions produced small amountsof ash and steam that lingered several hundred metersabove the Santiaguito dome for several minutes to hoursdue to calm wind conditions. These constituents canabsorb and/or scatter UV light and interfere with SO2
retrievals (Krotkov et al., 1997). To reduce their in-terference, only a small portion of plume extending toapproximately 200 m above the vent was used for anal-ysis, resulting in consistent flux determinations. Whilewater vapor is a major constituent of volcanic plumesSO2 is a much stronger absorber in the 300–320 nmrange, which allows for resolution of the SO2 componentin UV scanning or imaging methods. The pixel re-solution from this location is ∼1 m per pixel and a timeseries of images was used to calculate a plume rise rate of5.5 m.
Fig. 5. a) Visible image of Pacaya volcano taken just prior to the UVcamera sequence. b) the Pacaya SO2 plume collected from 3.64 kmwith a 0.5 s exposure. Flux calculations and plume absorbancecharacteristics as explained in Fig. 2.
51G.J.S. Bluth et al. / Journal of Volcanology and Geothermal Research 161 (2007) 47–56
Autho
r's
pers
onal
co
py
3.3. Fuego
Fuego is a basaltic stratovolcano located on theWNW trending volcanic front in Guatemala (14.473° N,90.880° W) with a summit elevation of 3763 m. Activityconsisted of a continuous gas plume interrupted byinfrequent periods of more intense puffing and small,relatively ash-free, eruptions. Images of the Fuego SO2
plume were collected during January 18–20, 2005 fromfive different locations ranging from approximately 7 to28 km distance (close to the maximum distance where aplume could still be resolved). Visible air quality washindered locally by wind-driven dust, as well as vehicle-generated dust and particulates from the burning ofsugar cane fields.
Fig. 4a shows a still image of the Fuego plumeacquired from video camera footage in the visiblecompared to a simultaneous image collected with theUV camera (Fig. 4b) from 7.08 km SW. The UV imagewas acquired using a 0.5 second exposure. The pixelresolution is 1.7 m per pixel, and the image-determinedplume speed was 4.6 m s−1. The cloudless conditionsprovide uniform and consistent illumination, and the SO2
plume is detected with remarkable detail and displaying arange of dynamics in plume dispersal. Fluxes rangedover at least a factor of three within the plume image.With the exception of fluxes calculated immediatelyabove the vent, flux values decrease with distance fromthe volcano and suggest that the SO2 plume is dispersingbelow detection limits downwind as the plume mixeswith the ambient atmosphere.
3.4. Pacaya
Pacaya is a basaltic cone located on theWNW trendingvolcanic front in Guatemala (14.381° N, 90.601° W) witha summit elevation of 2552 meters. Images of the PacayaSO2 plume were collected on January 20, 2005 from3.64 kmW. Frequent lava spattering could be observed atthe summit during this time period along with a persistent,water-rich gas plume. During our image collection period,the plume hugged the downwind (south) slope of the cone.
Fig. 5a shows a visible image of the Pacaya cone andgas plume, and Fig. 5b shows the UV camera imagetaken minutes afterward, using an exposure time of 0.5 s.The pixel resolution is 0.87 m per pixel. A plume speedof 7.7 m s−1 was computed from subsequent images.
Fluxes calculated at various locations within a singleplume image exhibit large variability. This variabilityhas been observed at all the test volcanoes, especiallyVillarrica and Fuego. A possible explanation for thevariability observed at Pacaya may lie in turbulence
effects that concentrate parts of the plume resulting inpockets of higher SO2. As the plume spills down theleeward side of the cone, the surface causes turbulenteddies in the wind field. The fluxes calculated representminimum values, because the lower boundary of theplume is assumed to be the boundary where it meets thevolcano flank. However, some portions of the plumemay not be included in the cross-section since not all ofthe plume may be visible to the camera (some portionsmay have drifted behind or in front of the flank).
4. Discussion
The four volcanoes used as initial test sites for the UVcamera provided diverse field conditions to evaluate thecamera's effectiveness for volcanic SO2monitoring. Thecamera proved to be especially practical and efficient tooperate in the field. Set-up time is less than 10 min andseveral dozen images can be collected in under a half-hour. The camera system, laptop and batteries are lightenough to be brought to a site by backpack. A map ofSO2 abundance can be prepared in about 5minutes, and a(uncorrected) flux can be quickly computed using plumespeeds derived from a sequence of several images. Thus,the camera has the capability to be deployed quickly, anddetect rapid changes in SO2 fluxes, as well as day to daymonitoring tasks.
The camera CCD and optics are sensitive to theambient light intensity conditions, and therefore to sunangle and scattered light from surrounding objects (i.e.trees, soil, structures, etc.). Image quality (clarity, back-ground homogeneity) is best with the sun opposite theimaging direction (behind the operator). For each site,with unique conditions of sun angle, background skyconditions and light levels, it was necessary to adjustexposure time to maximize the plume separation frombackground.
The camera was able to produce images of the SO2
plumes from distances of 4 to 28 km. Obviously, atmo-spheric and plume conditions will affect the quality of theimages, but in the case of Villarrica with a significant SO2
plume and, clear atmospheric conditions, high-qualitydetection was obtained at a distance of 16 km. Our fieldtests of camera-plume distances versus image qualitysuggest 5–10 km distance is optimum, providing manysiting options for volcano monitoring considering bothsafety and viewing ability (balancing resolution andsufficient FOV). The detection distance, and consequentlyview angle, is also important considering that fixed-basescanning and imaging techniques measure “slant col-umns” through the plume, which represent SO2 amountsmeasured at viewing angles inclined from zenith (i.e. not
52 G.J.S. Bluth et al. / Journal of Volcanology and Geothermal Research 161 (2007) 47–56

Autho
r's
pers
onal
co
py
“vertical columns”, which is how traverse measurementsand satellite SO2 data are reported) and need to be con-verted to vertical columns to produce consistent measure-ments (e.g., Edmonds et al., 2003a).
Our tests demonstrated that the UV camera could easilydetect SO2 plumes, but our initial SO2 flux calculationswere more than an order of magnitude below those calc-ulated for coincident COSPEC measurements (Table 1).Weperformed a set of field tests at Fuego volcano, inwhichwe observed that the plume “contrast”, or the percentagedifference between target and background luminance(McCartney, 1976), decreased exponentially with distance.In other words, the plume signal becomes brighter (i.e. theplume absorbance decreases) with distance while thebackground level stays relatively the same. Through theabsorbance and Beer's Law relationships, lower plumeabsorbance translates to a lower estimate of SO2 abundanceand, consequently, an artificially lower mass flux.
The cause for the exponential reduction in contrastbetween the plume and the background with increasingdistance is due to molecular scattering (proportional toλ−4, hence much more significant at UV wavelengths).The source of light can be directly scattered sunlight,diffuse skylight, and ground-reflected light. The true/attenuated contrast is an exponential function of thedistance and the wavelength-dependent volume scatter-ing coefficient of the atmosphere (McCartney, 1976). Inthe UV, scattering of radiation by air molecules is anorder of magnitude larger than in the visible spectrum(Penndorf, 1957). Mori et al. (2006) found that thiseffect, in the 309–315 nm range, became significant at1.5 km distance, and caused up to 50% underestimationof fluxes at the shorter wavelengths.
Moffat and Millan (1971) describe a correction for theeffects of “dilution light” (i.e., molecular scattering) onCOSPEC data (more modern COSPEC instruments haveautomatic gain control to deal with changes in back-ground illumination and contrast). Similarly, we devel-
oped an empirical atmospheric scattering correctionscheme (Appendix 1; after Shannon, 2006).
With the exception of Santiaguito, applying thescattering correction resulted in fluxes that more closelymatched the results of COSPEC or values more com-monly measured at that particular volcano (Table 1). AtVillarrica, the correction produced an order of magnitudeincrease, from 21 t/day to a corrected flux of 352 t/day onthe least turbulent part of the plume, or an average of 444 t/day using all four measurements (Fig. 2b). The correctedfluxes fall between the 260 t/daymeasured in 2000 (Witteret al., 2000) and the 460 t/day measured in 2001 (Witteret al., 2001) at Villarrica using COSPEC under open-ventconditions, similar to those observed during our campaign.We also had access to a DOAS instrument at the 16.5 kmdistance site, but it was unable to discriminate the SO2
plume from background at that distance (L. Rodriguez,personal communication 2004).
At Santiaguito, correcting for scattering results in aflux of 26 t/day directly over the vent (Fig. 3b). Coin-cidental COSPEC measurements produced an averageflux of 160 t/day using a wind speed of 3.5 m s−1 derivedfrom a meteorological station at the nearby Santiaguitoobservatory (G. Chigna, personal communication 2005).However, COSPEC measurements targeted the plumewhere it stopped rising and began to drift horizontally,rather than in the vertical-rising part of the plume wherethe UV camera fluxes were calculated. On that morning,the plume stagnated and spread at an altitude approxi-mately 600–800 m above the vent. We suspect that thepooling of the plume artificially inflated the COSPECSO2 results. It is worth noting that COSPEC SO2 mea-surements collected in 2002 under similar volcanologicalconditions, but more active wind conditions, ranged from20–190 t/day (Rodriguez et al., 2004).
At Fuego volcano, applying the scattering correctionproduced a flux of 309 t/day approximately 600 mdownwind of the vent (Fig. 4b). Coincidental COSPEC
Table 1UV camera field test results: SO2 fluxes
Villarrica(t/day)
Santiaguito(t/day)
Fuego(t/day)
Pacaya(t/day)
Measurement date Nov 17, 2004 Jan 17, 2005 Jan 18, 2005 Jan 20, 2005UV camera (uncorrected) 21 10 34 127UV camera (corrected) 352 26 309 270COSPEC-derived fluxes 260, 460 a 210 b 237 b 300–400 c
Field observations Clear, clean atmosphere Sensors measured differentplume regions
Both sensors measuredsame location
Plume hugging flank
a Data from 2000 (Witter et al., 2000) and 2001(Witter et al., 2001).b Simultaneous measurements of UV camera and COSPEC.c Range of measurements from the previous 6 months (G. Chigna, personal communication 2005).
53G.J.S. Bluth et al. / Journal of Volcanology and Geothermal Research 161 (2007) 47–56

Autho
r's
pers
onal
co
py
measurements report 237 t/day using a wind speed of 5 ms−1 derived from a meteorological station located onneighboring Agua volcano, 20 km E (G. Chigna, personalcommunication 2005). The COSPEC transect locationwas similar to those measured in the UV camera image,and the COSPEC flux represents an average of measure-ments collected for about one hour surrounding this time.Thework at Fuego produced themost robust comparisons,considering the near-simultaneous measurements, andsimilar scanning region of the emitted plume, thus it isencouraging that the flux results were similar.
At Pacaya, condensed water droplets observed in theplume may affect SO2 retrievals by absorbing or scatteringUV light, so fluxes were computed in portions of the plumefurther downwind of the vent (N300 m) where most of thewater appeared to have evaporated; the corrected SO2
fluxes were 270 t/day about 400 m down the flank. Nocoincidental measurements of COSPEC or DOAS werepossible due to the difficult viewing conditions, but ourresults are similar to COSPEC measurements within theprevious 6 months of 300–400 t/day (G. Chigna, personalcommunication 2005). This example also shows that plumefluxes can be derived evenwhen a plume-free portion of thesky is not available on both sides of the plume— a necessityrelied upon for COSPEC and DOAS measurements.
The simple scattering correction allows us to quantifySO2 fluxes for the purposes of testing the utility of thecamera, but more experiments are needed to validate themethod. With the current broad-band filter approach, ascattering correction would be needed for each fieldsituation. Continuing work focuses on the effects ofatmospheric opacity on camera response, incorporation ofadditional, narrow-band UV camera filters (e.g., as withsatellite instruments such as OMI, reducing atmosphericinterference by using band ratios within the SO2 absorptionspectrum; Krotkov et al., 2006), as well as radiative transfermodeling to properly assess camera response.
5. Conclusions
We have successfully field-tested a digital ultravioletcamera to take images of passive volcanic SO2 plumes. Ata distance of 5–10 km, the camera provides a FOV ofseveral square kilometers, with pixel resolutions of appro-ximately 1–2 m, respectively. Calibrated images showsignificant variations in plume abundance, providing ameans for evaluating physical and chemical dispersionprocesses in the plume. Consequently, portions of theplume can easily be tracked in timed image sequences thatallow accurate plume velocities to be calculated directly.Measured plume absorbances are scaled to concentration-pathlength products using calibration cell measurements,
to derive an SO2 slant column concentration for any plumepixel, and SO2 fluxes can be derived using measuredplume speeds. The camera's current ability to produceaccurate SO2 fluxes requires significant additional work tocharacterize the local environmental conditions (e.g., winddirection, atmospheric scattering effects).
Field studies were undertaken at four different volcanicsettings, providing a good test of the camera under potentialmonitoring conditions. Volcanic SO2 plumes were detectedat distances ranging from about 3 to 28 km. Because theplume signal decreases with distance, scattered light by theintervening atmosphere is suspected to dilute the plumesignal, reducing plume-background contrast, and cause anoverall underestimate of plume concentrations.A scatteringcorrection was applied to subtract the effects of lightscattering — since we use a single, broad-band UV filterfor this stage of the camera development, using a DOAStechnique was not possible. Alternatively, more expensivenarrow-band filters could be used to match SO2 absorptionpeaks in the 300–320 nm range.
Themost robust evaluation of the camera was at Fuegovolcano, where simultaneous COSPEC and corrected UVcamera SO2 fluxes, using the same portions of the plume,agreed towithin 25%.AtVillarrica, results werewithin therange of recent COSPECmeasurements under similar acti-vity levels. At Pacaya, the UV camera fluxes were slightlyless than recent COSPEC measurements, but the plumewas hugging the volcano flank and was not fully visible.At Santiaguito volcano, the UV camera fluxes taken justabove the vent were well below those of the COSPECmeasurements, which scanned a portion of the plumewhere we suspect the SO2 “pooled” under stagnant windconditions.
The camera images demonstrate considerable hetero-geneity in all of the plumes owing either to emissionvariations or turbulence. The ability to determine the causeof flux variations by direct observation and interpretation ofa plume concentration map is a major step forward involcano gas monitoring. Future work will concentrate onaccurate camera calibration under laboratory as well as avariety of environmental and volcanological conditions.The UV camera holds great promise as a future SO2
monitoring instrument due to it's quick set-up, practicalfield use, timely processing of results, and relatively lowcost.
Acknowledgements
Funding for this research was provided by the NationalScience Foundation through EAR-0337120 to GJSB andEAR-0321869 to IMW. We appreciate Guatemalan fieldsupport from Gustavo Chigna of INSIVUMEH. This
54 G.J.S. Bluth et al. / Journal of Volcanology and Geothermal Research 161 (2007) 47–56

Autho
r's
pers
onal
co
py
paper is based upon the Ph.D. research of JMS with manyuseful suggestions by W. Rose and R. Shaw. This manu-script benefited greatly from thorough reviews by SimonCarn and an unidentified reviewer.
Appendix A. Correction procedure for atmosphericscattering
1. Plume contrast is computed from the followingequation (after McCartney, 1976):
C ¼ Lo−LbLb
ð2Þ
where C=contrast, Lo=object (plume) luminance, andLb=background luminance.
The luminance is simply the brightness value recordedby the camera CCD.
2. A set of plume measurements at different camera-target distances is used to construct a contrast attenuationcurve. The attenuation of this contrast with distance isdefined as:
CR ¼ C0expð−bRÞ ð3Þwhere CR=apparent contrast at distance R, C0=true con-trast at zero distance, β=volume scattering coefficient,and R=distance between object and observer.
3. Eq. (3) is fit to the distance-contrast data to estimateC0, the zero-distance (zero-scattering) plume contrast, andβ, which describes the degree to which a volume of air canscatter light per unit distance, defined for both moleculesand particles. At 310 nm in the ultra-violet (nearest our307 nm filter), β is approximately 0.125 km-1 for pure air(Penndorf, 1957). For the Fuego volcano field measure-ments, β was determined to be 0.2 km−1, suggesting thatthe atmosphere here was less clear.
4. The corrected plume contrast can then be used tocalculate a new plume absorbance. Recall that (uncor-rected) plume absorbances are calculated using Eq. (1),from an average plume and average background signal.To calculate a new plume signal, the average back-ground value and the new zero-scattering plume contrastare entered into the plume contrast Eq. (2) and solved forthe new average plume signal (Lo, new).
5. The difference (Lo, diff=Lo, new−Lo) between the oldand new average plume signal is the scaling factor used toreduce each plume pixel value, and calculate the newaverage plume cross-section. This new adjusted averageplume cross-section value is then used in Eq. (1) tocalculate a new cross-sectional average plume absorbance.
6. This new average cross-sectional absorbance isscaled to the calibration cells to convert to ppm m, andan atmospheric scattering corrected flux.
References
Andres, R.J., Rose, W.I., 1995. Remote sensing spectroscopy of volcanicplumes and clouds. In: McGuire, B., Kilburn, C.R.J., Murray, J.(Eds.), Monitoring Active Volcanoes. University College LondonPress, pp. 301–314.
Bobrowski, N., Hönninger, G., Lohberger, F., Platt, U., 2006. IDOAS: anew monitoring technique to study the 2D distribution of volcanicgas emissions. Journal of Volcanology and Geothermal Research150, 329–338.
Casadevall, T.J., Johnston, D.A., Harris, D.A., Rose Jr., W.I.,Malinconico Jr., L.L., Stoiber, R.E., Bornhorst, T.J., Williams, S.N.,Woodruff, L., Thompson, J.M., 1981. SO2 emission rates atMount St.Helens from March 29 through December 1980. In: Lipman, P.W.,Mullineaux, D.R. (Eds.), The 1980 Eruptions of Mount St. Helens.U.S. Geological Survey Professional Paper, vol. 1250, pp. 193–200.
Daag, A.S., Tubianosa, B.S., Newhall, C.G., Tungol, N.M., Javier, D.,Dolan, M.T., Reyes, P.J.D., Arboleda, R.A., Martinez, M.M.L.,Regalado, M.T.M., 1996. Monitoring Sulfur Dioxide Emission atMount Pinatubo, in Newhall, C.G. and Punongbayan, R.S. (Eds.),Fire and Mud: Eruptions and Lahars of Mount Pinatubo, Philippines,Philippine Institute of Volcanology and Seismology, Quezon City,and University of Washington Press, Seattle, 409–414.
Eatough, D.J., Caka, F.M., Farber, R.J., 1994. The conversion of SO2 tosulfate in the atmosphere. Israel Journal of Chemistry 34, 301–314.
Edmonds, M., Herd, R.A., Galle, B., Oppenheimer, C.M., 2003a.Automated, high time-resolution of SO2 flux at Soufrière HillsVolcano, Montserrat. Bulletin of Volcanology 65, 578–586.
Edmonds, M., Oppenheimer, C.M., Pyle, D.M., Herd, R.A., Thompson,G., 2003b. SO2 emissions from Soufrière Hills Volcano and theirrelationship to conduit permeability, hydrothermal interaction anddegassing regime. Journal of Volcanology and Geothermal Research124, 23–43.
Galle, B., Oppenheimer, C., Geyer, A., McGonigle, A., Edmonds, M.,2003. A mini-DOAS spectrometer in remote sensing of volcanicSO2 emissions. Journal of Volcanology and Geothermal Research119, 241–254.
Gardner, C.A., White, R.A., 2002. Seismicity, gas emission anddeformation from 18 July to 25 September 1995 during the initialphreatic phase of the eruption of Soufriere Hills Volcano, Montserrat.In: Druitt, T.H., Kokelaar, B.P. (Eds.), The Eruption of Soufriere HillsVolcano, Montserrat, from 1995 to 1999. . Memoirs, vol. 21. Geolo-gical Society, London, pp. 567–581.
Krotkov, N.A., Krueger, A.J., Bhartia, P.K., 1997. Ultraviolet opticalmodel of volcanic clouds for remote sensing of ash and sulfurdioxide. Journal of Geophysical Research 102, 21891–21904.
Krotkov, N.A., Carn, S.A., Krueger, A.J., Bhartia, P.K., Yang, K.,2006. Band residual difference algorithm for retrieval of SO2 fromthe AURA Ozone Monitoring Instrument (OMI). IEEE Transac-tions on Geoscience and Remote Sensing 44, 1259–1266.
Malinconico Jr., L.L., 1987. On the variation of SO2 emission fromvolcanoes. Journal of Volcanology and Geothermal Research 33,231–237.
McCartney, E.J., 1976. Optics of the Atmosphere. John Wiley & Sons,Inc., pp. 34–44.
McGonigle, A.J.S., Delmelle, P., Oppenheimer, C., Tsanev, V.I.,Delfosse, T., Williams-Jones, G., Horton, K., Mather, T.A., 2004.SO2 depletion in tropospheric volcanic plumes. GeophysicalResearch Letters 31. doi:10.1029/2004GL019990.
McGonigle, A.J.S., Hilton, D.R., Fischer, T.P., Oppenheimer, C., 2005.Plume velocity determination for volcanic SO2 flux measurements.Geophysical Research Letters 32. doi:10.1029/2005GL022470.
55G.J.S. Bluth et al. / Journal of Volcanology and Geothermal Research 161 (2007) 47–56

Autho
r's
pers
onal
co
py
Millan, M.M., Gallant, A.J., Turner, H.E., 1976. The application ofcorrelation spectroscopy to the study of dispersion from tall stacks.Atmospheric Environment 10, 499–511.
Moffat, A.J., Millan, M.M., 1971. The applications of optical correlationtechniques to the remote sensing of SO2 plumes using sky light.Atmospheric Environment 5, 677–690.
Mori, T., Mori, T., Kazahaya, K., Ohwada, M., Hirabayashi, J.,Yoshikawa, S., 2006. Effect of UV scattering on SO2 emission ratemeasurements. Geophysical Research Letters 33. doi:10.1029/2006GL026285.
Nguyn, C.T., Galais, A., Fortunato, G., 1995a. Pollution imagery byoptical interferometry: application to SO2 gas. Applied Optics 34,5398–5405.
Nguyn, C.T., Journet, B., Fortunato, G., 1995b. Description of anacquisition unit for optical interferometry treatment: application tothe pollution imagery of SO2 gas. Review of Scientific Instruments66, 5183–5191.
Penndorf, R., 1957. Tables of the refractive index for standard air andthe Rayleigh scattering coefficient for the spectral region between0.2 and 20.0 μm, and their application to atmospheric optics.Journal of the Optical Society of America 47, 176–182.
Platt, U., 1994. Differential optical absorption spectroscopy (DOAS).In: Sigrist, M.W. (Ed.), Air monitoring by spectroscopictechniques. Wiley, Chichester, pp. 27–84.
Realmuto, V.J., 1998. Final Report: Imaging Gas Correlation Camera.Contract NAS7-1260, Task Order RF152, Amendment 0778,NASA Jet Propulsion Laboratory.
Rodriguez, L.A., Watson, I.M., Rose,W.I., Branan, Y.K., Bluth, G.J.S.,Chigna, G., Matías, O., Escobar, D., Carn, S.A., Fischer, T.P., 2004.SO2 emissions to the atmosphere from active volcanoes inGuatemala and El Salvador, 1999–2002. Journal of Volcanologyand Geothermal Research 138, 325–344.
Sandsten, J., Edner, H., Svanberg, S., 1996. Gas imaging by infraredgas-correlation spectrometry. Optics Letters 21, 1945–1947.
Shannon, J.M., 2006. Development and application of new techniquesfor sulfur dioxide monitoring at active volcanoes. Ph.D. disserta-tion, Michigan Technological University.
Stix, J., Gaonac'h, H., 2000. Gas, plume and thermal monitoring.Encyclopedia of Volcanoes. Academic Press, pp. 1141–1163.
Stoiber, R.E., Malinconico Jr., L.L., Williams, S.N., 1983. Use of thecorrelation spectrometer at volcanoes. In: Tazieff, H., Sabroux, J.C.(Eds.), Forecasting Volcanic Events, pp. 425–444. Amsterdam-New York.
Symonds, R.B., Rose,W.I., Bluth, G.J.S., Gerlach, T.M., 1994. Volcanic-gas studies: Methods, results, and applications. In: Carroll, M.R.,Holloway, J.R. (Eds.), Volatiles in Magmas. Reviews in Mineralogy,vol. 30, pp. 1–60.
Williams-Jones, G., Horton, K.A., Elias, T., Garbeil, H., Mouginis-Mark,P.J., Sutton, A.J., Harris, A.J.L., 2006. Accuratelymeasuring volcanicplume velocity with multiple UV spectrometers. Bulletin of Volcano-logy 68, 328–332.
Witter, J.B., Kress, V.C., Calder, E.S., Delmelle, P., Stix, J., 2000.Passive degassing at Volcan Villarrica, south Chile. Eos, Transac-tions of the American Geophysical Union 81 (48) (Fall MeetingSupplement, Abstract V72C-03).
Witter, J.B., Kress, V.C., Delmelle, P., Hersum, T.G., 2001. Acid gasemissions measured by COSPEC, volatile trap, and filter pack atVolcan Villarrica, South Chile. Eos, Transactions of the AmericanGeophysical Union 82 (47) (Fall Meeting Supplement, AbstractV42B-1012).
56 G.J.S. Bluth et al. / Journal of Volcanology and Geothermal Research 161 (2007) 47–56
Related Documents