DRAFT ENVIRONMENTAL IMPACT ASSESSMENT & ENVIRONMENT MANAGEMENT PLAN “B1” CATEGORY – MINOR MINERAL IN CLUSTER OVER AN EXTENT OF 15.73.0 Ha At Girijapuram Village, Vembakkam Taluk, Tiruvannamalai District For THIRU. R. MOHANRAJ ROUGH STONE AND GRAVEL QUARRY In S. F. Nos. 176/1A, 1B, 1C, 2A, 2B, 3A, 3B, 3C, 3D, 3E, 3F,3G & 176/4B, Girijapuram Village, Vembakkam Taluk, Tiruvannamalai District, Oven an Extent: 2.94.5 ha Project Proponent Thiru. R. Mohanraj, S/o. Rajagopal, No. 33, Pillaiyarkovil, Puliyambedu, Ambattur Taluk, Thiruvallur District FOR OBTAINING Prior – Environmental Clearance under EIA Notification – 2006 Schedule Sl. No. 1 (a) (i): Mining Project Complied as per ToR obtained vide Lr.No.SEIAA-TN/F.No.7238/SEAC/ToR- 844/2019 Dated: 17.02.2021 Environmental Consultant GEO EXPLORATION AND MINING SOLUTIONS Old No. 260-B, New No. 17, Advaitha Ashram Road, Alagapuram, Salem – 636 004, Tamil Nadu, India Accredited for sector 1, 28 & 38 Category ‘A’ QUALITY COUNCIL OF INDIA NATIONAL ACCREDITATION BOARD FOR EDUCATION & TRAINING Certificate No : NABET/EIA/1821/RA0123 Phone: 0427-2431989, Email: [email protected], [email protected] Web: www.gemssalem.com SEPTEMBER 2021

Welcome message from author
This document is posted to help you gain knowledge. Please leave a comment to let me know what you think about it! Share it to your friends and learn new things together.
Transcript
DRAFT ENVIRONMENTAL IMPACT ASSESSMENT
&
ENVIRONMENT MANAGEMENT PLAN
“B1” CATEGORY – MINOR MINERAL
IN CLUSTER OVER AN EXTENT OF 15.73.0 Ha
At Girijapuram Village, Vembakkam Taluk, Tiruvannamalai District
For
THIRU. R. MOHANRAJ ROUGH STONE AND GRAVEL QUARRY
In S. F. Nos. 176/1A, 1B, 1C, 2A, 2B, 3A, 3B, 3C, 3D, 3E, 3F,3G & 176/4B, Girijapuram
Village, Vembakkam Taluk, Tiruvannamalai District, Oven an Extent: 2.94.5 ha
Project Proponent
Thiru. R. Mohanraj,
S/o. Rajagopal,
No. 33, Pillaiyarkovil,
Puliyambedu, Ambattur Taluk, Thiruvallur District
FOR OBTAINING
Prior – Environmental Clearance under EIA Notification – 2006
Schedule Sl. No. 1 (a) (i): Mining Project
Complied as per ToR obtained vide
Lr.No.SEIAA-TN/F.No.7238/SEAC/ToR- 844/2019 Dated: 17.02.2021
Environmental Consultant
GEO EXPLORATION AND MINING SOLUTIONS
Old No. 260-B, New No. 17, Advaitha Ashram Road, Alagapuram, Salem – 636 004, Tamil Nadu, India
Accredited for sector 1, 28 & 38 Category ‘A’
QUALITY COUNCIL OF INDIA NATIONAL ACCREDITATION BOARD FOR EDUCATION & TRAINING
Certificate No : NABET/EIA/1821/RA0123
Phone: 0427-2431989, Email: [email protected], [email protected]
Web: www.gemssalem.com
SEPTEMBER 2021
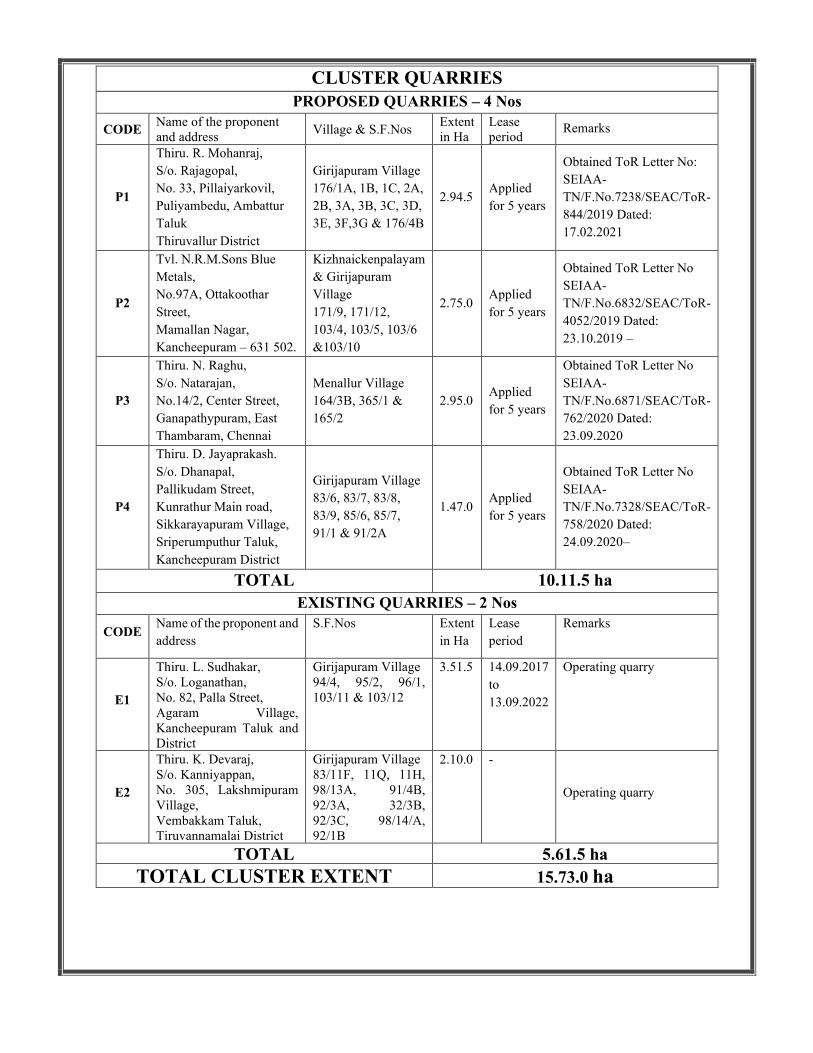
CLUSTER QUARRIES
PROPOSED QUARRIES – 4 Nos
CODE Name of the proponent
and address Village & S.F.Nos
Extent
in Ha
Lease
period Remarks
P1
Thiru. R. Mohanraj,
S/o. Rajagopal,
No. 33, Pillaiyarkovil,
Puliyambedu, Ambattur
Taluk
Thiruvallur District
Girijapuram Village
176/1A, 1B, 1C, 2A,
2B, 3A, 3B, 3C, 3D,
3E, 3F,3G & 176/4B
2.94.5 Applied
for 5 years
Obtained ToR Letter No:
SEIAA-
TN/F.No.7238/SEAC/ToR-
844/2019 Dated:
17.02.2021
P2
Tvl. N.R.M.Sons Blue
Metals,
No.97A, Ottakoothar
Street,
Mamallan Nagar,
Kancheepuram – 631 502.
Kizhnaickenpalayam
& Girijapuram
Village
171/9, 171/12,
103/4, 103/5, 103/6
&103/10
2.75.0 Applied
for 5 years
Obtained ToR Letter No
SEIAA-
TN/F.No.6832/SEAC/ToR-
4052/2019 Dated:
23.10.2019 –
P3
Thiru. N. Raghu,
S/o. Natarajan,
No.14/2, Center Street,
Ganapathypuram, East
Thambaram, Chennai
Menallur Village
164/3B, 365/1 &
165/2
2.95.0 Applied
for 5 years
Obtained ToR Letter No
SEIAA-
TN/F.No.6871/SEAC/ToR-
762/2020 Dated:
23.09.2020
P4
Thiru. D. Jayaprakash.
S/o. Dhanapal,
Pallikudam Street,
Kunrathur Main road,
Sikkarayapuram Village,
Sriperumputhur Taluk,
Kancheepuram District
Girijapuram Village
83/6, 83/7, 83/8,
83/9, 85/6, 85/7,
91/1 & 91/2A
1.47.0 Applied
for 5 years
Obtained ToR Letter No
SEIAA-
TN/F.No.7328/SEAC/ToR-
758/2020 Dated:
24.09.2020–
TOTAL 10.11.5 ha
EXISTING QUARRIES – 2 Nos
CODE Name of the proponent and
address
S.F.Nos Extent
in Ha
Lease
period
Remarks
E1
Thiru. L. Sudhakar,
S/o. Loganathan,
No. 82, Palla Street,
Agaram Village,
Kancheepuram Taluk and
District
Girijapuram Village
94/4, 95/2, 96/1,
103/11 & 103/12
3.51.5 14.09.2017
to
13.09.2022
Operating quarry
E2
Thiru. K. Devaraj,
S/o. Kanniyappan,
No. 305, Lakshmipuram
Village,
Vembakkam Taluk,
Tiruvannamalai District
Girijapuram Village
83/11F, 11Q, 11H,
98/13A, 91/4B,
92/3A, 32/3B,
92/3C, 98/14/A,
92/1B
2.10.0 -
Operating quarry
TOTAL 5.61.5 ha
TOTAL CLUSTER EXTENT 15.73.0 ha
A
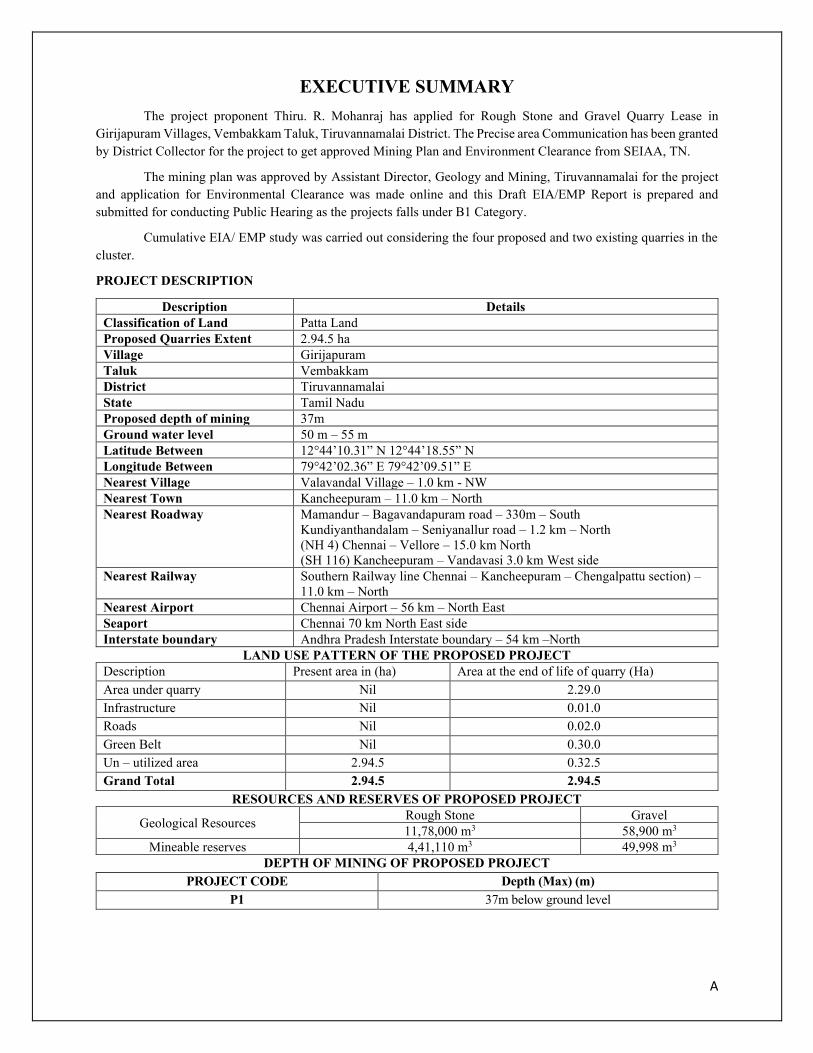
EXECUTIVE SUMMARY
The project proponent Thiru. R. Mohanraj has applied for Rough Stone and Gravel Quarry Lease in
Girijapuram Villages, Vembakkam Taluk, Tiruvannamalai District. The Precise area Communication has been granted
by District Collector for the project to get approved Mining Plan and Environment Clearance from SEIAA, TN.
The mining plan was approved by Assistant Director, Geology and Mining, Tiruvannamalai for the project
and application for Environmental Clearance was made online and this Draft EIA/EMP Report is prepared and
submitted for conducting Public Hearing as the projects falls under B1 Category.
Cumulative EIA/ EMP study was carried out considering the four proposed and two existing quarries in the
cluster.
PROJECT DESCRIPTION
Description Details
Classification of Land Patta Land
Proposed Quarries Extent 2.94.5 ha
Village Girijapuram
Taluk Vembakkam
District Tiruvannamalai
State Tamil Nadu
Proposed depth of mining 37m
Ground water level 50 m – 55 m
Latitude Between 12°44’10.31” N 12°44’18.55” N
Longitude Between 79°42’02.36” E 79°42’09.51” E
Nearest Village Valavandal Village – 1.0 km - NW
Nearest Town Kancheepuram – 11.0 km – North
Nearest Roadway Mamandur – Bagavandapuram road – 330m – South
Kundiyanthandalam – Seniyanallur road – 1.2 km – North
(NH 4) Chennai – Vellore – 15.0 km North
(SH 116) Kancheepuram – Vandavasi 3.0 km West side
Nearest Railway Southern Railway line Chennai – Kancheepuram – Chengalpattu section) –
11.0 km – North
Nearest Airport Chennai Airport – 56 km – North East
Seaport Chennai 70 km North East side
Interstate boundary Andhra Pradesh Interstate boundary – 54 km –North
LAND USE PATTERN OF THE PROPOSED PROJECT
Description Present area in (ha) Area at the end of life of quarry (Ha)
Area under quarry Nil 2.29.0
Infrastructure Nil 0.01.0
Roads Nil 0.02.0
Green Belt Nil 0.30.0
Un – utilized area 2.94.5 0.32.5
Grand Total 2.94.5 2.94.5
RESOURCES AND RESERVES OF PROPOSED PROJECT
Geological Resources Rough Stone Gravel
11,78,000 m3 58,900 m3
Mineable reserves 4,41,110 m3 49,998 m3
DEPTH OF MINING OF PROPOSED PROJECT
PROJECT CODE Depth (Max) (m)
P1 37m below ground level
B
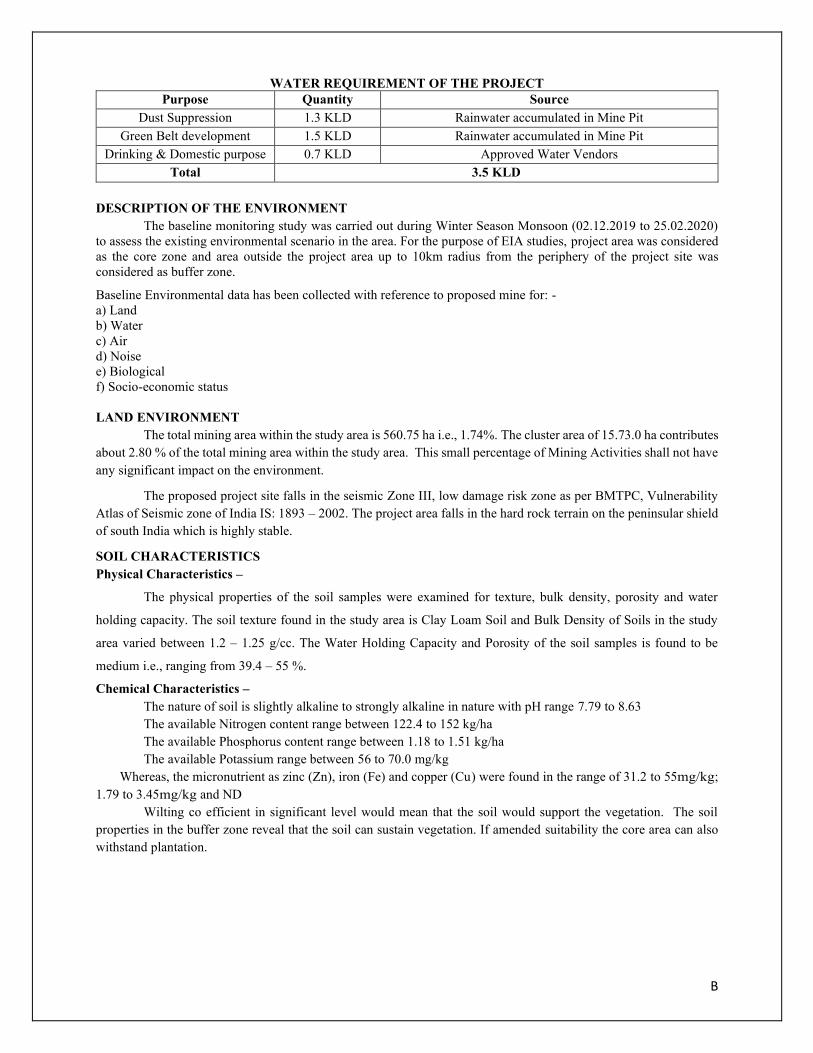
WATER REQUIREMENT OF THE PROJECT
Purpose Quantity Source
Dust Suppression 1.3 KLD Rainwater accumulated in Mine Pit
Green Belt development 1.5 KLD Rainwater accumulated in Mine Pit
Drinking & Domestic purpose 0.7 KLD Approved Water Vendors
Total 3.5 KLD
DESCRIPTION OF THE ENVIRONMENT
The baseline monitoring study was carried out during Winter Season Monsoon (02.12.2019 to 25.02.2020)
to assess the existing environmental scenario in the area. For the purpose of EIA studies, project area was considered
as the core zone and area outside the project area up to 10km radius from the periphery of the project site was
considered as buffer zone.
Baseline Environmental data has been collected with reference to proposed mine for: -
a) Land
b) Water
c) Air
d) Noise
e) Biological
f) Socio-economic status
LAND ENVIRONMENT
The total mining area within the study area is 560.75 ha i.e., 1.74%. The cluster area of 15.73.0 ha contributes
about 2.80 % of the total mining area within the study area. This small percentage of Mining Activities shall not have
any significant impact on the environment.
The proposed project site falls in the seismic Zone III, low damage risk zone as per BMTPC, Vulnerability
Atlas of Seismic zone of India IS: 1893 – 2002. The project area falls in the hard rock terrain on the peninsular shield
of south India which is highly stable.
SOIL CHARACTERISTICS
Physical Characteristics –
The physical properties of the soil samples were examined for texture, bulk density, porosity and water
holding capacity. The soil texture found in the study area is Clay Loam Soil and Bulk Density of Soils in the study
area varied between 1.2 – 1.25 g/cc. The Water Holding Capacity and Porosity of the soil samples is found to be
medium i.e., ranging from 39.4 – 55 %.
Chemical Characteristics –
The nature of soil is slightly alkaline to strongly alkaline in nature with pH range 7.79 to 8.63
The available Nitrogen content range between 122.4 to 152 kg/ha
The available Phosphorus content range between 1.18 to 1.51 kg/ha
The available Potassium range between 56 to 70.0 mg/kg
Whereas, the micronutrient as zinc (Zn), iron (Fe) and copper (Cu) were found in the range of 31.2 to 55mg/kg;
1.79 to 3.45mg/kg and ND
Wilting co efficient in significant level would mean that the soil would support the vegetation. The soil
properties in the buffer zone reveal that the soil can sustain vegetation. If amended suitability the core area can also
withstand plantation.
C
WATER ENVIRONMENT
Surface Water
The pH varied from 7.46 to 7.59 while turbidity found within the standards. Total Dissolved Solids varied
from 515 to 766mg/l and Chloride varied between 62.0 mg/l and 99.0 mg/l. Nitrates varied from 13.0 to 20.0 mg/l,
while sulphates varied from 39 to 61mg/l.
Ground Water
The pH of the water samples collected ranged from 7.04 to 7.66 and within the acceptable limit of 6.5 to
8.5. pH, Sulphates and Chlorides of water samples from all the sources are within the limits as per the Standard. on
Turbidity, the water samples meet the requirement. The Total Dissolved Solids were found in the range of 588-950
mg/l in all samples. The Total hardness varied between 280-419 mg/l for all samples.
On Microbiological parameters, the water samples from all the locations meet the requirement. The
parameters thus analysed were compared with IS 10500:2012 and are well within the prescribed limits.
AIR ENVIRONMENT
As per monitoring data, PM10 ranges from 31.0 µg/m3 to 62.3 µg/m3, PM2.5 data ranges from 19.7 µg/m3
to 39.7 µg/m3, SO2 ranges from 4.3 µg/m3 to 15.0 µg/m3 and NO2 data ranges from 10.1 µg/m3 to 23.1 µg/m3. The
concentration levels of the above criteria pollutants were observed to be well within the limits of NAAQS prescribed
by CPCB.
The minimum & maximum concentrations of PM10 were found to be 31.0 µg/m3 in Pulivoy village & 62.3
µg/m3 in near crusher respectively. The minimum & maximum concentrations of PM2.5 were found to be 19.7 µg/m3
in Pulivoy village & 39.7 µg/m3 in near Crusher area respectively. The maximum concentration in near the core zone
is due to the cluster of quarries situated within 500m radius.
NOISE ENVIRONMENT
Ambient noise levels were measured at 12 (Twelve) locations around the proposed quarry lease area. Noise
levels recorded in core zone during day time were from 47.01 – 52.5 dB (A) Leq and during night time were from
36.3 – 39.4 dB (A) Leq.
Noise levels recorded in buffer zone during day time were from 40.1 – 54.8 dB (A) Leq and during night
time were from 33.3 – 38.4 dB (A) Leq.
The values of noise observed in some of the areas are primarily owing to quarrying activities due to cluster
of quarries within 500m radius, movement of vehicles and other anthropogenic activities. Noise monitoring results
reveal that the maximum & minimum noise levels at day time were recorded in the range of 54.8 dB(A) in Near
crusher area and 40.1 dB(A) in night time 39.4 dB(A) in Core zone & 33.3 dB(A) in Akkur village respectively in day
and night. Thus, the noise level for Industrial and Residential area meets the requirements of CPCB.
BIOLOGICAL ENVIRONMENT
The core zone of the area is patta dry – barren land, no forest land is involved in the project area. The proposed
quarry area is covered by thorny bushes and prosopis juliaflora. There is no Wild Life Sanctuary or National Park
within the study area of 10km. There is no schedule I species of animals observed within study area as per Wildlife
Protection Act 1972 as well as no species is in vulnerable, endangered or threatened category as per IUCN. There is
no endangered red list species found in the study area. Hence this small mining operation over short period of time
will not have any significant impact on the surrounding flora and fauna.
SOCIO-ECONOMIC ENVIRONMENT
An attempt has been made to assess the impact of the proposed mining project at Girijapuram Village on
Socio-economic aspect of the study area. The various attributes that have been taken into account are population
composition, employment generation, occupational shift, household income and consumption pattern. Implementation
of the Proposed Mine Project will generate both direct and indirect employment. Besides, Mining operation will be
legally valid and it will bring income to the state exchequer. At present seasonal agriculture is the main occupation of
the people as more than half of the population depends on it. With the implementation of the proposed mining project
D
the occupational pattern of the people in the area will change making more people engaged in mining-based activities
rather in seasonal agriculture.
ANTICIPATED ENVIRONMENTAL IMPACTS AND MITIGATION MEASURES
IMPACT MITIGATION MEASURE
LAND ENVIRONMENT
▪ Destruction of natural landscapes
▪ Changes in soil characteristics
▪ Soil erosion and slope instability
▪ Mining will be carried out as per approved mine plan in
scientific and systematic way
▪ Safety Zone or Buffer area will be maintained and will not be
mined and instead plantation will be carried out in the safety
zone
▪ Barbed wire fencing will be provided all along the proposed
mine boundary
▪ At conceptual stage, the land use pattern of the quarry will be
changed into Greenbelt area and temporary reservoir
▪ Construction of garland
▪ Construction of garland drains all around the quarry pit and
construction of settling traps at strategic location in lower
elevations to prevent soil erosion due to surface runoff during
rainfall and also to collect the storm water for various uses
within the proposed area
WATER ENVIRONMENT
▪ Decrease in aquifer recharge and
increase in surface runoff;
▪ Disturbance to land drainage, overload
and erosion of watercourses;
▪ Changes to the surface over which
water flows;
▪ Changes to surface and groundwater
resources quantity and quality due to
stream blockage and contamination by
particulate matter or waste;
▪ Contamination of aquifers due to
removal of the natural filter medium.
▪ Construction of garland drains all around the quarry pit and
construction of settling traps at strategic location in lower
elevations to prevent soil erosion due to surface runoff during
rainfall and also to collect the storm water for various uses
within the proposed area
▪ De-silting will be carried out before and immediately after
the monsoon season and the settling tank and drains will be
cleaned weekly, especially during monsoons
▪ Domestic sewage from site office & urinals/latrines provided
in project area will be discharged through septic tank
followed by soak pit system.
▪ Tippers & HEMM will be washed in a designated area and
the washed water will be routed through drains to a settling
tank, which has an oil & grease trap, only clear water will be
reused for greenbelt development.
AIR ENVIRONMENT
▪ Generation of Fugitive Dust
▪ Dust will be generated mainly during
excavation, loading & unloading
activities.
▪ Gaseous pollutants will by generated
mostly by the traffic.
▪ Reduction in visibility due to dust
plumes.
▪ Coating of surfaces leading to
annoyance and loss of amenity.
▪ Physical and/or chemical
contamination and corrosion.
▪ Increase in the concentration of
suspended particles in runoff water.
▪ Coating of vegetation leading to
reduced photosynthesis,
▪ Inhibited growth, destroying of foliage,
degradation of crops;
▪ Haul roads will be well maintained by sprinkling water twice
a day
▪ The access road will be cleaned and brushed to ensure that
mud and dust deposits do not accumulate.
▪ To ensure that dust and debris is minimised on the access
road, all the tipper drivers will be instructed to use water
spray system on all the tyres and spray water on the loaded
material that is provided at the compound area before leaving
the site
▪ Speed restrictions will be imposed to avoid spillage of loaded
materials upon the road and to reduce wear and tear of the
road.
▪ Weekly inspections of the condition of the access road by
competent person employed, and immediate action will be
taken to address any potholes or damage to the road surface.
▪ Dust wetting agents can be mixed with the water applied to
haul roads during hot, dry weather conditions to increase the
duration that the road surface remains damp.
E
▪ Increase in health hazards due to
inhalation of dust.
▪ Personal Protective Equipment’s will be provided to all workers
▪ All drilling rods used will have dust suppression systems
fitted which injects water into the hole.
▪ Wet gunny bags will be used as a cover while drilling.
▪ The blast zone will be kept damp by the application of water
from the rain gun fitted to the water tanker prior to each blast
to control any fugitive dust emissions that could arise from
the surface during detonation.
▪ A daily visual inspection shall be conducted by the site
manager who will keep a daily log of all process operations
and site activities and note any malfunctions which could
lead to abnormal emissions from the quarry operations.
▪ A site speed limit of 20 km/h will be set to minimise the
potential for dust generation
▪ Weekly maintenance programme to identify machinery due
for maintenance, based on the number of hours it has been in
operation.
▪ Air filters are renewed after every 1000 hours of use, unless
otherwise indicated by an on-board computer system.
▪ All site machineries & tippers will be serviced and
maintained 6 months once and drivers will report any defects
immediately to the site manager to enable repairs to be
carried out promptly.
NOISE & VIBRATION
▪ Annoyance and deterioration of the
quality of life;
▪ Propelling of rocks fragments by
blasting.
▪ Shaking of buildings and people due to
blasting;
▪ Usage of sharp drill bits while drilling which will help in
reducing noise;
▪ Secondary blasting will be totally avoided and hydraulic rock
breaker will be used for breaking boulders;
▪ Controlled blasting with proper spacing, burden, stemming
and optimum charge/delay will be maintained;
▪ The blasting will be carried out during favourable
atmospheric condition and less human activity timings by
using nonelectrical initiation system;
▪ Proper maintenance, oiling and greasing of machines will be
done every week to reduce generation of noise;
▪ Provision of sound insulated chambers for the workers
working on machines (HEMM) producing higher levels of
noise;
▪ Silencers / mufflers will be installed in all machineries;
▪ Green Belt/Plantation will be developed around the project
area and along the haul roads. The plantation minimizes
propagation of noise;
▪ Personal Protective Equipment (PPE) like ear muffs/ear
plugs will be provided to the operators of HEMM and persons
working near HEMM and their use will be ensured though
training and awareness.
BIOLOGICAL ENVIRONMENT
▪ Direct impacts include land clearance
and excavation causing destruction of
flora and fauna and loss of habitats;
▪ Indirect impacts include habitat
degradation due to noise, dust, and
human activity.
▪ Only some common herbs, shrubs and grass will be cleared.
So, there will be no impact on the biodiversity.
▪ Green belt development with suitable species will enhance
the biodiversity of the project area.
▪ The core zone or buffer zone does not encompass any
threatened flora or fauna species.
SOCIO-ECONOMIC ENVIRONMENT
▪ Health and safety of workers and the
general public;
▪ The mining activity puts negligible change in the socio-
economic profile.
F
▪ Increase in traffic volumes and sizes of
road vehicles;
▪ Economic issues, including the increase
in employment opportunities;
▪ Around 38 local workers will get employment opportunities
along with periodical training to generate local skills.
▪ New patterns of indirect employment/ income will generate.
▪ Regular health check-up camp.
▪ Assistance to schools and scholarship to children will be
provided.
OCCUPATIONAL HEALTH & SAFETY
▪ Exposure to Dust
▪ Noise and Vibration Exposure
▪ Physical Hazards
▪ Respiratory hazards due to Dust
exposure
▪ Provision of rest shelters for mine workers with amenities
like drinking water etc.
▪ All safety measures like use of safety appliances, such as dust
masks, helmets, shoes, safety awareness programs, awards,
posters, slogans related to safety etc.
▪ Training of employees for use of safety appliances and first
aid in vocational training center.
▪ Weekly maintenance and testing of all equipment as per
manufacturers’ guidelines. ▪ Pre placement and Yearly Medical Examination of all
workers by a medical Officer
▪ First Aid facility will be provided at the mine site.
▪ Close surveillance of the factors in working environment and
work practices which may affect environment and worker’s health by the mines manager employed.
▪ Working of mine as per approved mining plan and
environmental plans
ENVIRONMENTAL MONITORING PROGRAM
Environmental Monitoring program will be conducted for various environmental components as per
conditions stipulated in Environmental Clearance Letter issued by SEIAA & Consent to Operate issued by TNPCB.
PROJECT BENEFITS
The quarrying operation in the area will create rural employment. It has been observed that conditions of the
villages around quarry areas are better than that of distant villages. This will enhance the socio-economic activities in
the adjoining areas and will result in the following benefits
The project envisages a direct job opportunity to the local persons, and this includes both technical and non-
technical persons. Literacy is future expected to increase because of increase income and awareness amongst the
people. Part of the royalty is given to local bodies by the State Govt. for the welfare and development of the village.
District Mineral Fund @30% of the Royalty shall be given to the Dept. of Geology and Mining, Tiruvannamalai
District. The State Government will also benefit directly from the mine, through increased revenue from royalties,
excise duty and etc.
ENVIRONMENTAL MANAGEMENT PLAN
In order to implement the environmental protection measures, an amount of Rs. 4.26 lakhs as capital cost and
recurring cost as Rs. 1.66 lakhs as recurring cost is proposed considering present market price considering present
market scenario.
I
Terms of Reference (TOR) – Thiru. R. Mohanraj
“ToR issued vide Letter No. SEIAA-TN/F.No.7238/SEAC/ToR- 844/2019 Dated: 17.02.2021”
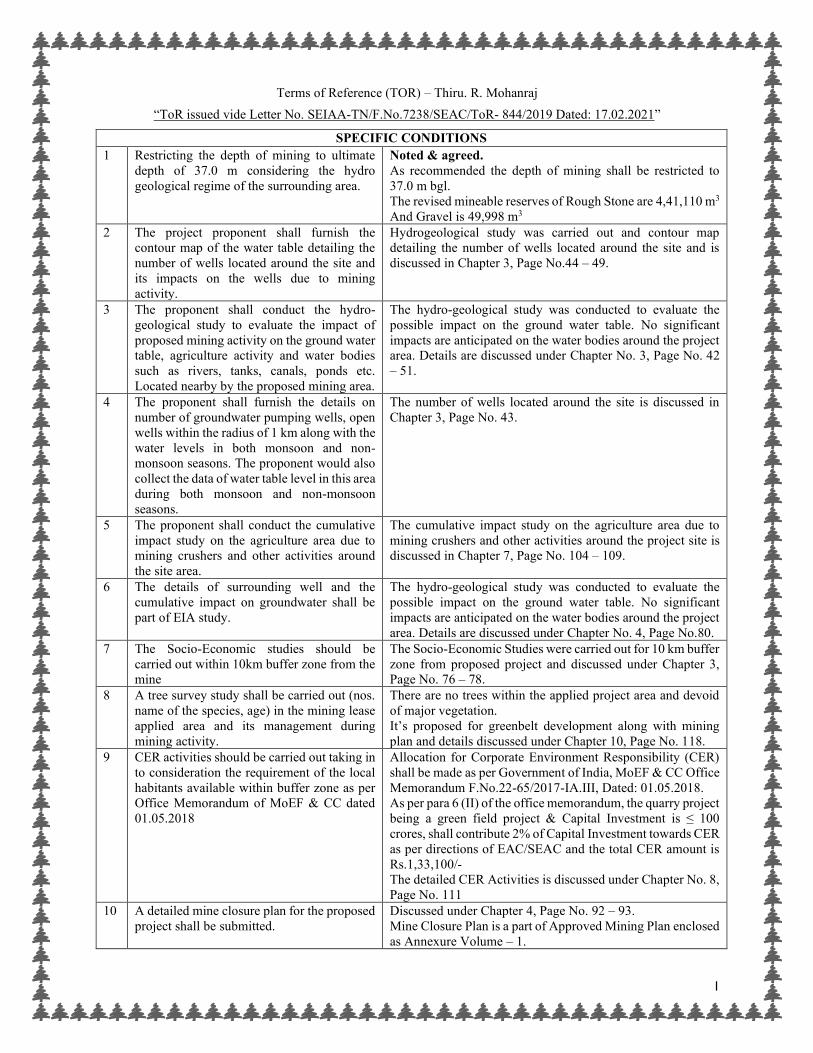
SPECIFIC CONDITIONS
1 Restricting the depth of mining to ultimate
depth of 37.0 m considering the hydro
geological regime of the surrounding area.
Noted & agreed.
As recommended the depth of mining shall be restricted to
37.0 m bgl.
The revised mineable reserves of Rough Stone are 4,41,110 m3
And Gravel is 49,998 m3
2 The project proponent shall furnish the
contour map of the water table detailing the
number of wells located around the site and
its impacts on the wells due to mining
activity.
Hydrogeological study was carried out and contour map
detailing the number of wells located around the site and is
discussed in Chapter 3, Page No.44 – 49.
3 The proponent shall conduct the hydro-
geological study to evaluate the impact of
proposed mining activity on the ground water
table, agriculture activity and water bodies
such as rivers, tanks, canals, ponds etc.
Located nearby by the proposed mining area.
The hydro-geological study was conducted to evaluate the
possible impact on the ground water table. No significant
impacts are anticipated on the water bodies around the project
area. Details are discussed under Chapter No. 3, Page No. 42
– 51.
4 The proponent shall furnish the details on
number of groundwater pumping wells, open
wells within the radius of 1 km along with the
water levels in both monsoon and non-
monsoon seasons. The proponent would also
collect the data of water table level in this area
during both monsoon and non-monsoon
seasons.
The number of wells located around the site is discussed in
Chapter 3, Page No. 43.
5 The proponent shall conduct the cumulative
impact study on the agriculture area due to
mining crushers and other activities around
the site area.
The cumulative impact study on the agriculture area due to
mining crushers and other activities around the project site is
discussed in Chapter 7, Page No. 104 – 109.
6 The details of surrounding well and the
cumulative impact on groundwater shall be
part of EIA study.
The hydro-geological study was conducted to evaluate the
possible impact on the ground water table. No significant
impacts are anticipated on the water bodies around the project
area. Details are discussed under Chapter No. 4, Page No.80.
7 The Socio-Economic studies should be
carried out within 10km buffer zone from the
mine
The Socio-Economic Studies were carried out for 10 km buffer
zone from proposed project and discussed under Chapter 3,
Page No. 76 – 78.
8 A tree survey study shall be carried out (nos.
name of the species, age) in the mining lease
applied area and its management during
mining activity.
There are no trees within the applied project area and devoid
of major vegetation.
It’s proposed for greenbelt development along with mining
plan and details discussed under Chapter 10, Page No. 118.
9 CER activities should be carried out taking in
to consideration the requirement of the local
habitants available within buffer zone as per
Office Memorandum of MoEF & CC dated
01.05.2018
Allocation for Corporate Environment Responsibility (CER)
shall be made as per Government of India, MoEF & CC Office
Memorandum F.No.22-65/2017-IA.III, Dated: 01.05.2018.
As per para 6 (II) of the office memorandum, the quarry project
being a green field project & Capital Investment is ≤ 100 crores, shall contribute 2% of Capital Investment towards CER
as per directions of EAC/SEAC and the total CER amount is
Rs.1,33,100/-
The detailed CER Activities is discussed under Chapter No. 8,
Page No. 111
10 A detailed mine closure plan for the proposed
project shall be submitted.
Discussed under Chapter 4, Page No. 92 – 93.
Mine Closure Plan is a part of Approved Mining Plan enclosed
as Annexure Volume – 1.
II
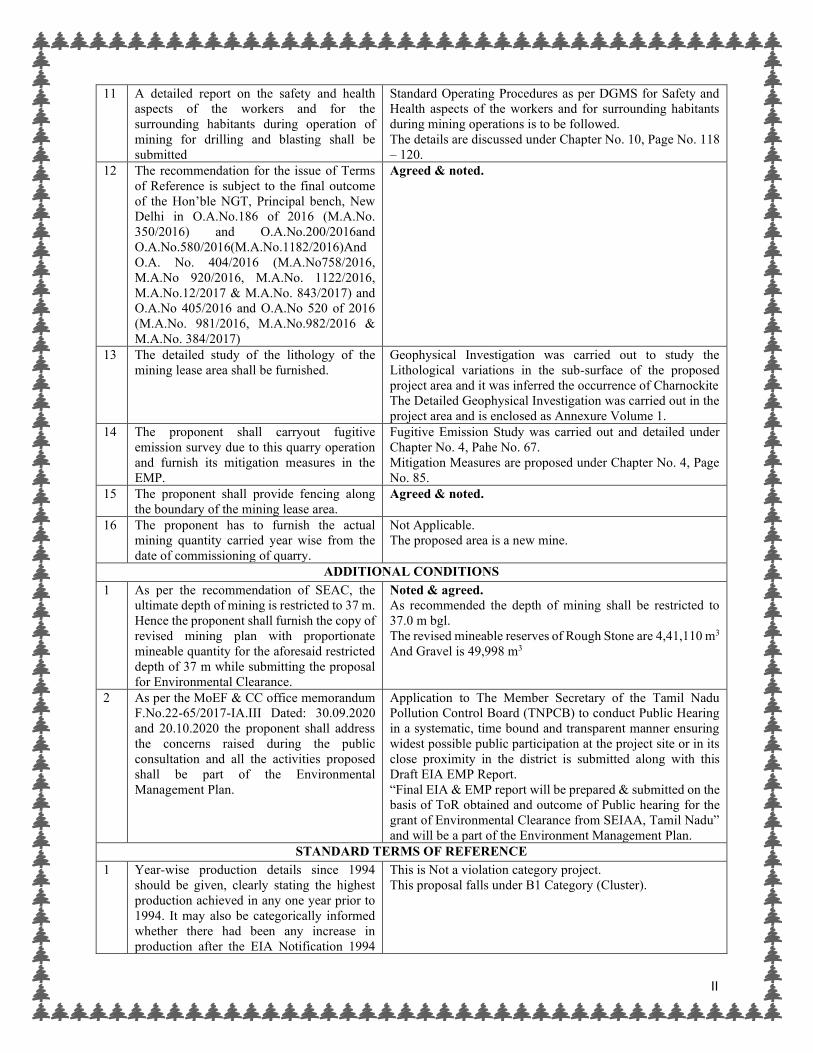
11 A detailed report on the safety and health
aspects of the workers and for the
surrounding habitants during operation of
mining for drilling and blasting shall be
submitted
Standard Operating Procedures as per DGMS for Safety and
Health aspects of the workers and for surrounding habitants
during mining operations is to be followed.
The details are discussed under Chapter No. 10, Page No. 118
– 120.
12 The recommendation for the issue of Terms
of Reference is subject to the final outcome
of the Hon’ble NGT, Principal bench, New Delhi in O.A.No.186 of 2016 (M.A.No.
350/2016) and O.A.No.200/2016and
O.A.No.580/2016(M.A.No.1182/2016)And
O.A. No. 404/2016 (M.A.No758/2016,
M.A.No 920/2016, M.A.No. 1122/2016,
M.A.No.12/2017 & M.A.No. 843/2017) and
O.A.No 405/2016 and O.A.No 520 of 2016
(M.A.No. 981/2016, M.A.No.982/2016 &
M.A.No. 384/2017)
Agreed & noted.
13 The detailed study of the lithology of the
mining lease area shall be furnished.
Geophysical Investigation was carried out to study the
Lithological variations in the sub-surface of the proposed
project area and it was inferred the occurrence of Charnockite
The Detailed Geophysical Investigation was carried out in the
project area and is enclosed as Annexure Volume 1.
14 The proponent shall carryout fugitive
emission survey due to this quarry operation
and furnish its mitigation measures in the
EMP.
Fugitive Emission Study was carried out and detailed under
Chapter No. 4, Pahe No. 67.
Mitigation Measures are proposed under Chapter No. 4, Page
No. 85.
15 The proponent shall provide fencing along
the boundary of the mining lease area.
Agreed & noted.
16 The proponent has to furnish the actual
mining quantity carried year wise from the
date of commissioning of quarry.
Not Applicable.
The proposed area is a new mine.
ADDITIONAL CONDITIONS
1 As per the recommendation of SEAC, the
ultimate depth of mining is restricted to 37 m.
Hence the proponent shall furnish the copy of
revised mining plan with proportionate
mineable quantity for the aforesaid restricted
depth of 37 m while submitting the proposal
for Environmental Clearance.
Noted & agreed.
As recommended the depth of mining shall be restricted to
37.0 m bgl.
The revised mineable reserves of Rough Stone are 4,41,110 m3
And Gravel is 49,998 m3
2 As per the MoEF & CC office memorandum
F.No.22-65/2017-IA.III Dated: 30.09.2020
and 20.10.2020 the proponent shall address
the concerns raised during the public
consultation and all the activities proposed
shall be part of the Environmental
Management Plan.
Application to The Member Secretary of the Tamil Nadu
Pollution Control Board (TNPCB) to conduct Public Hearing
in a systematic, time bound and transparent manner ensuring
widest possible public participation at the project site or in its
close proximity in the district is submitted along with this
Draft EIA EMP Report.
“Final EIA & EMP report will be prepared & submitted on the
basis of ToR obtained and outcome of Public hearing for the
grant of Environmental Clearance from SEIAA, Tamil Nadu”
and will be a part of the Environment Management Plan.
STANDARD TERMS OF REFERENCE
1 Year-wise production details since 1994
should be given, clearly stating the highest
production achieved in any one year prior to
1994. It may also be categorically informed
whether there had been any increase in
production after the EIA Notification 1994
This is Not a violation category project.
This proposal falls under B1 Category (Cluster).
III
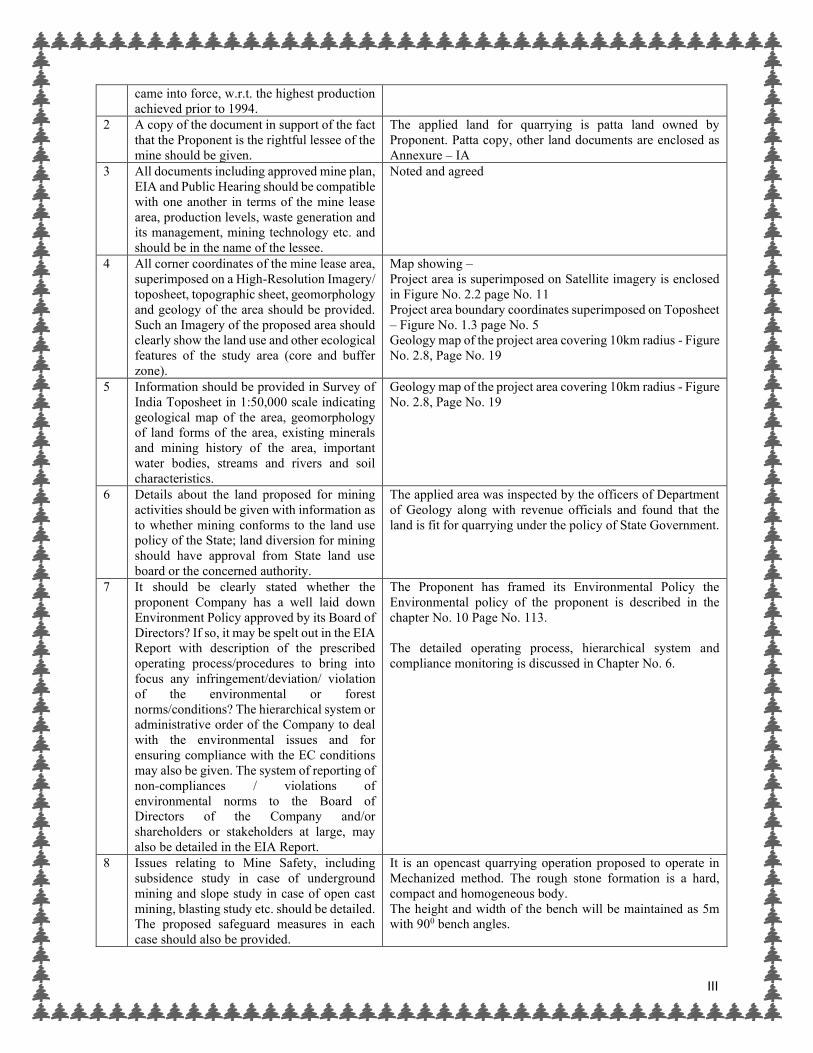
came into force, w.r.t. the highest production
achieved prior to 1994.
2 A copy of the document in support of the fact
that the Proponent is the rightful lessee of the
mine should be given.
The applied land for quarrying is patta land owned by
Proponent. Patta copy, other land documents are enclosed as
Annexure – IA
3 All documents including approved mine plan,
EIA and Public Hearing should be compatible
with one another in terms of the mine lease
area, production levels, waste generation and
its management, mining technology etc. and
should be in the name of the lessee.
Noted and agreed
4 All corner coordinates of the mine lease area,
superimposed on a High-Resolution Imagery/
toposheet, topographic sheet, geomorphology
and geology of the area should be provided.
Such an Imagery of the proposed area should
clearly show the land use and other ecological
features of the study area (core and buffer
zone).
Map showing –
Project area is superimposed on Satellite imagery is enclosed
in Figure No. 2.2 page No. 11
Project area boundary coordinates superimposed on Toposheet
– Figure No. 1.3 page No. 5
Geology map of the project area covering 10km radius - Figure
No. 2.8, Page No. 19
5 Information should be provided in Survey of
India Toposheet in 1:50,000 scale indicating
geological map of the area, geomorphology
of land forms of the area, existing minerals
and mining history of the area, important
water bodies, streams and rivers and soil
characteristics.
Geology map of the project area covering 10km radius - Figure
No. 2.8, Page No. 19
6 Details about the land proposed for mining
activities should be given with information as
to whether mining conforms to the land use
policy of the State; land diversion for mining
should have approval from State land use
board or the concerned authority.
The applied area was inspected by the officers of Department
of Geology along with revenue officials and found that the
land is fit for quarrying under the policy of State Government.
7 It should be clearly stated whether the
proponent Company has a well laid down
Environment Policy approved by its Board of
Directors? If so, it may be spelt out in the EIA
Report with description of the prescribed
operating process/procedures to bring into
focus any infringement/deviation/ violation
of the environmental or forest
norms/conditions? The hierarchical system or
administrative order of the Company to deal
with the environmental issues and for
ensuring compliance with the EC conditions
may also be given. The system of reporting of
non-compliances / violations of
environmental norms to the Board of
Directors of the Company and/or
shareholders or stakeholders at large, may
also be detailed in the EIA Report.
The Proponent has framed its Environmental Policy the
Environmental policy of the proponent is described in the
chapter No. 10 Page No. 113.
The detailed operating process, hierarchical system and
compliance monitoring is discussed in Chapter No. 6.
8 Issues relating to Mine Safety, including
subsidence study in case of underground
mining and slope study in case of open cast
mining, blasting study etc. should be detailed.
The proposed safeguard measures in each
case should also be provided.
It is an opencast quarrying operation proposed to operate in
Mechanized method. The rough stone formation is a hard,
compact and homogeneous body.
The height and width of the bench will be maintained as 5m
with 900 bench angles.
IV
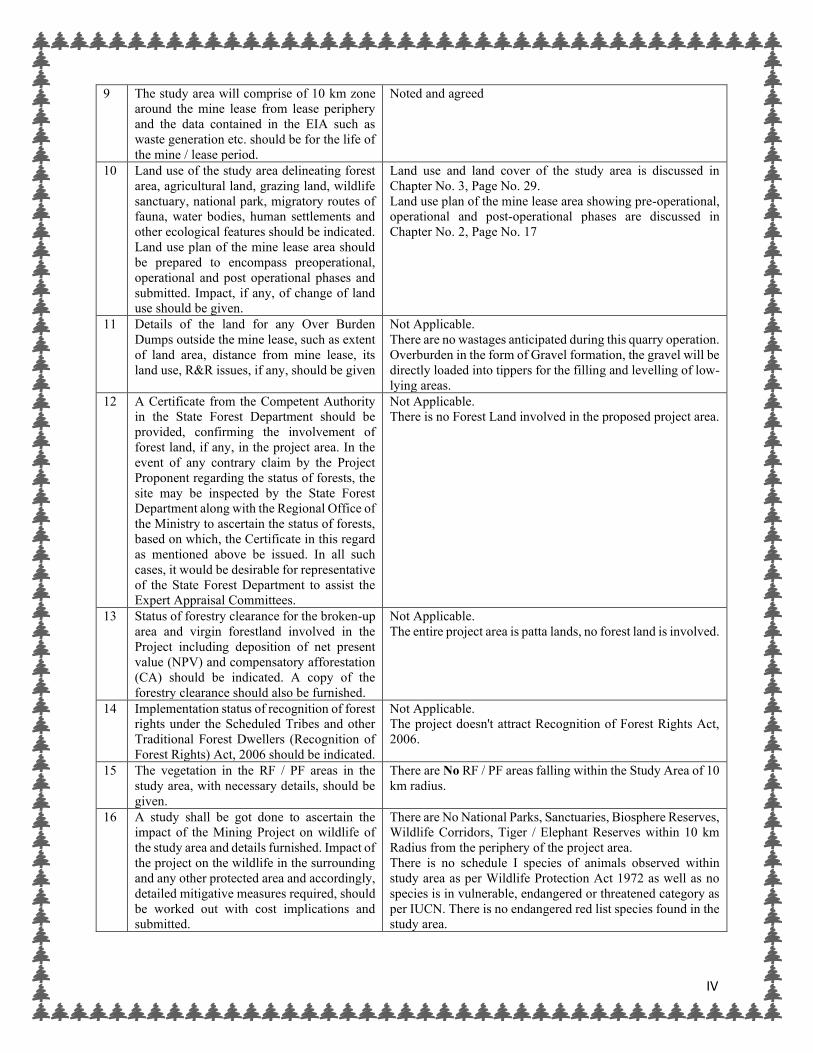
9 The study area will comprise of 10 km zone
around the mine lease from lease periphery
and the data contained in the EIA such as
waste generation etc. should be for the life of
the mine / lease period.
Noted and agreed
10 Land use of the study area delineating forest
area, agricultural land, grazing land, wildlife
sanctuary, national park, migratory routes of
fauna, water bodies, human settlements and
other ecological features should be indicated.
Land use plan of the mine lease area should
be prepared to encompass preoperational,
operational and post operational phases and
submitted. Impact, if any, of change of land
use should be given.
Land use and land cover of the study area is discussed in
Chapter No. 3, Page No. 29.
Land use plan of the mine lease area showing pre-operational,
operational and post-operational phases are discussed in
Chapter No. 2, Page No. 17
11 Details of the land for any Over Burden
Dumps outside the mine lease, such as extent
of land area, distance from mine lease, its
land use, R&R issues, if any, should be given
Not Applicable.
There are no wastages anticipated during this quarry operation.
Overburden in the form of Gravel formation, the gravel will be
directly loaded into tippers for the filling and levelling of low-
lying areas.
12 A Certificate from the Competent Authority
in the State Forest Department should be
provided, confirming the involvement of
forest land, if any, in the project area. In the
event of any contrary claim by the Project
Proponent regarding the status of forests, the
site may be inspected by the State Forest
Department along with the Regional Office of
the Ministry to ascertain the status of forests,
based on which, the Certificate in this regard
as mentioned above be issued. In all such
cases, it would be desirable for representative
of the State Forest Department to assist the
Expert Appraisal Committees.
Not Applicable.
There is no Forest Land involved in the proposed project area.
13 Status of forestry clearance for the broken-up
area and virgin forestland involved in the
Project including deposition of net present
value (NPV) and compensatory afforestation
(CA) should be indicated. A copy of the
forestry clearance should also be furnished.
Not Applicable.
The entire project area is patta lands, no forest land is involved.
14 Implementation status of recognition of forest
rights under the Scheduled Tribes and other
Traditional Forest Dwellers (Recognition of
Forest Rights) Act, 2006 should be indicated.
Not Applicable.
The project doesn't attract Recognition of Forest Rights Act,
2006.
15 The vegetation in the RF / PF areas in the
study area, with necessary details, should be
given.
There are No RF / PF areas falling within the Study Area of 10
km radius.
16 A study shall be got done to ascertain the
impact of the Mining Project on wildlife of
the study area and details furnished. Impact of
the project on the wildlife in the surrounding
and any other protected area and accordingly,
detailed mitigative measures required, should
be worked out with cost implications and
submitted.
There are No National Parks, Sanctuaries, Biosphere Reserves,
Wildlife Corridors, Tiger / Elephant Reserves within 10 km
Radius from the periphery of the project area.
There is no schedule I species of animals observed within
study area as per Wildlife Protection Act 1972 as well as no
species is in vulnerable, endangered or threatened category as
per IUCN. There is no endangered red list species found in the
study area.
V
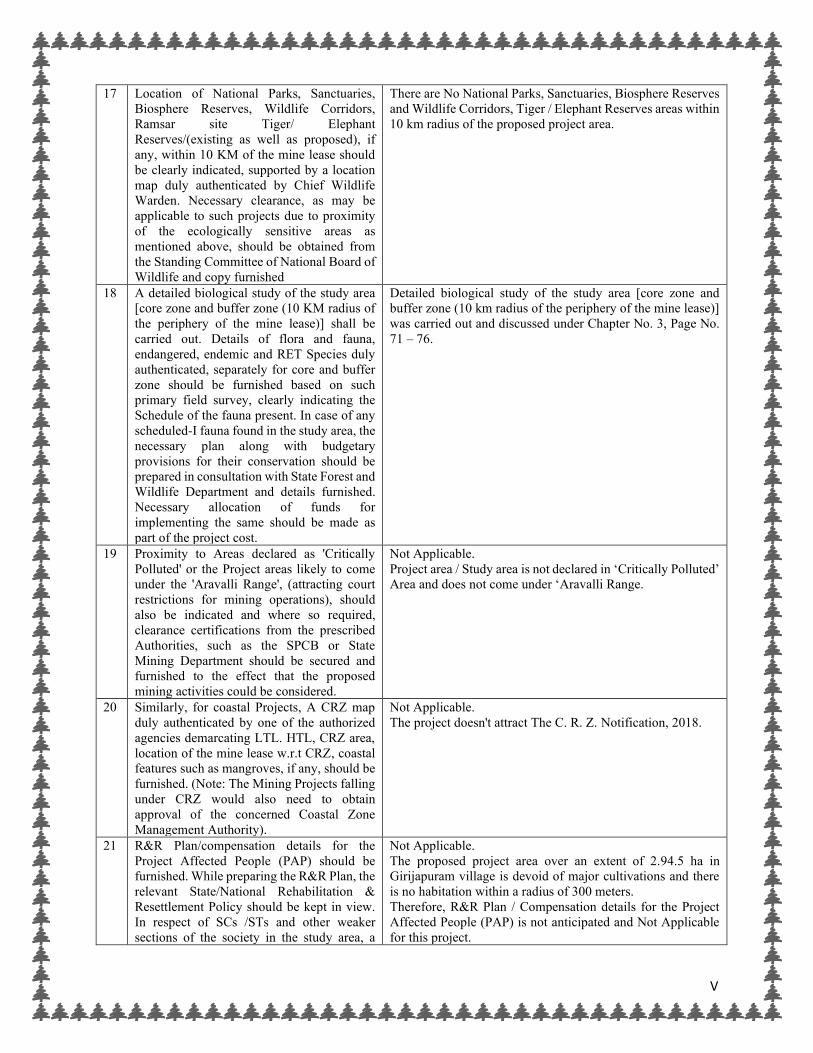
17 Location of National Parks, Sanctuaries,
Biosphere Reserves, Wildlife Corridors,
Ramsar site Tiger/ Elephant
Reserves/(existing as well as proposed), if
any, within 10 KM of the mine lease should
be clearly indicated, supported by a location
map duly authenticated by Chief Wildlife
Warden. Necessary clearance, as may be
applicable to such projects due to proximity
of the ecologically sensitive areas as
mentioned above, should be obtained from
the Standing Committee of National Board of
Wildlife and copy furnished
There are No National Parks, Sanctuaries, Biosphere Reserves
and Wildlife Corridors, Tiger / Elephant Reserves areas within
10 km radius of the proposed project area.
18 A detailed biological study of the study area
[core zone and buffer zone (10 KM radius of
the periphery of the mine lease)] shall be
carried out. Details of flora and fauna,
endangered, endemic and RET Species duly
authenticated, separately for core and buffer
zone should be furnished based on such
primary field survey, clearly indicating the
Schedule of the fauna present. In case of any
scheduled-I fauna found in the study area, the
necessary plan along with budgetary
provisions for their conservation should be
prepared in consultation with State Forest and
Wildlife Department and details furnished.
Necessary allocation of funds for
implementing the same should be made as
part of the project cost.
Detailed biological study of the study area [core zone and
buffer zone (10 km radius of the periphery of the mine lease)]
was carried out and discussed under Chapter No. 3, Page No.
71 – 76.
19 Proximity to Areas declared as 'Critically
Polluted' or the Project areas likely to come
under the 'Aravalli Range', (attracting court
restrictions for mining operations), should
also be indicated and where so required,
clearance certifications from the prescribed
Authorities, such as the SPCB or State
Mining Department should be secured and
furnished to the effect that the proposed
mining activities could be considered.
Not Applicable.
Project area / Study area is not declared in ‘Critically Polluted’ Area and does not come under ‘Aravalli Range.
20 Similarly, for coastal Projects, A CRZ map
duly authenticated by one of the authorized
agencies demarcating LTL. HTL, CRZ area,
location of the mine lease w.r.t CRZ, coastal
features such as mangroves, if any, should be
furnished. (Note: The Mining Projects falling
under CRZ would also need to obtain
approval of the concerned Coastal Zone
Management Authority).
Not Applicable.
The project doesn't attract The C. R. Z. Notification, 2018.
21 R&R Plan/compensation details for the
Project Affected People (PAP) should be
furnished. While preparing the R&R Plan, the
relevant State/National Rehabilitation &
Resettlement Policy should be kept in view.
In respect of SCs /STs and other weaker
sections of the society in the study area, a
Not Applicable.
The proposed project area over an extent of 2.94.5 ha in
Girijapuram village is devoid of major cultivations and there
is no habitation within a radius of 300 meters.
Therefore, R&R Plan / Compensation details for the Project
Affected People (PAP) is not anticipated and Not Applicable
for this project.
VI
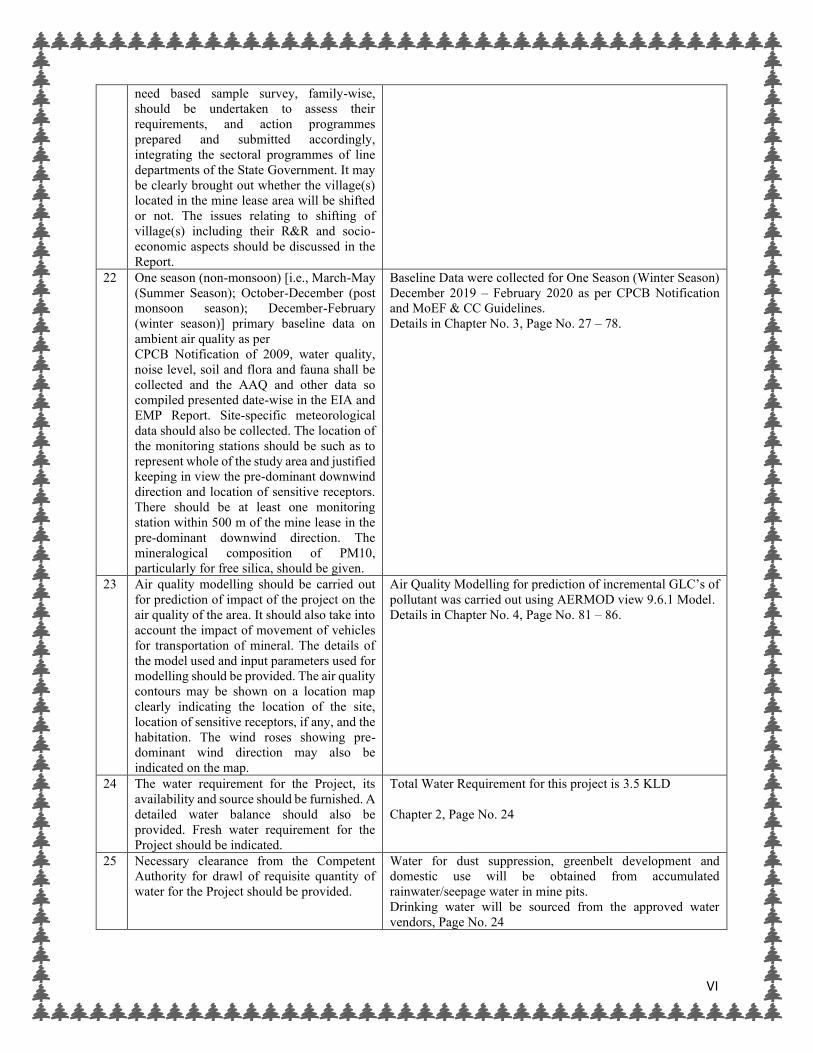
need based sample survey, family-wise,
should be undertaken to assess their
requirements, and action programmes
prepared and submitted accordingly,
integrating the sectoral programmes of line
departments of the State Government. It may
be clearly brought out whether the village(s)
located in the mine lease area will be shifted
or not. The issues relating to shifting of
village(s) including their R&R and socio-
economic aspects should be discussed in the
Report.
22 One season (non-monsoon) [i.e., March-May
(Summer Season); October-December (post
monsoon season); December-February
(winter season)] primary baseline data on
ambient air quality as per
CPCB Notification of 2009, water quality,
noise level, soil and flora and fauna shall be
collected and the AAQ and other data so
compiled presented date-wise in the EIA and
EMP Report. Site-specific meteorological
data should also be collected. The location of
the monitoring stations should be such as to
represent whole of the study area and justified
keeping in view the pre-dominant downwind
direction and location of sensitive receptors.
There should be at least one monitoring
station within 500 m of the mine lease in the
pre-dominant downwind direction. The
mineralogical composition of PM10,
particularly for free silica, should be given.
Baseline Data were collected for One Season (Winter Season)
December 2019 – February 2020 as per CPCB Notification
and MoEF & CC Guidelines.
Details in Chapter No. 3, Page No. 27 – 78.
23 Air quality modelling should be carried out
for prediction of impact of the project on the
air quality of the area. It should also take into
account the impact of movement of vehicles
for transportation of mineral. The details of
the model used and input parameters used for
modelling should be provided. The air quality
contours may be shown on a location map
clearly indicating the location of the site,
location of sensitive receptors, if any, and the
habitation. The wind roses showing pre-
dominant wind direction may also be
indicated on the map.
Air Quality Modelling for prediction of incremental GLC’s of pollutant was carried out using AERMOD view 9.6.1 Model.
Details in Chapter No. 4, Page No. 81 – 86.
24 The water requirement for the Project, its
availability and source should be furnished. A
detailed water balance should also be
provided. Fresh water requirement for the
Project should be indicated.
Total Water Requirement for this project is 3.5 KLD
Chapter 2, Page No. 24
25 Necessary clearance from the Competent
Authority for drawl of requisite quantity of
water for the Project should be provided.
Water for dust suppression, greenbelt development and
domestic use will be obtained from accumulated
rainwater/seepage water in mine pits.
Drinking water will be sourced from the approved water
vendors, Page No. 24
VII
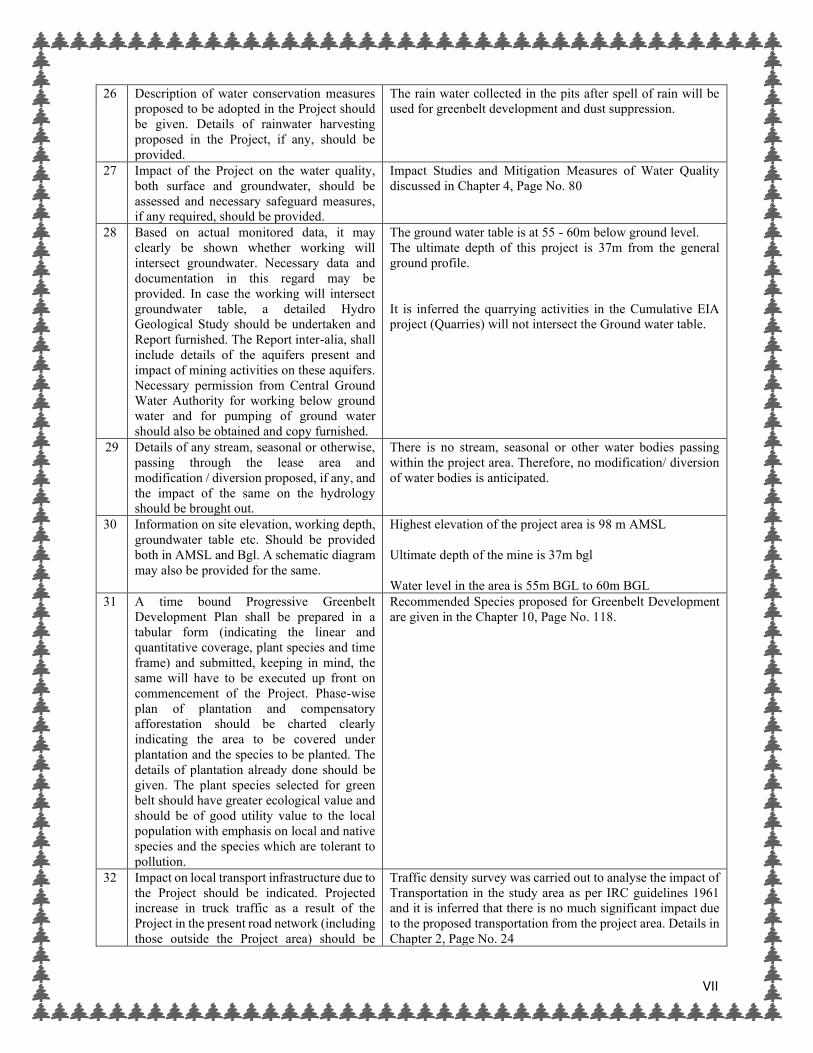
26 Description of water conservation measures
proposed to be adopted in the Project should
be given. Details of rainwater harvesting
proposed in the Project, if any, should be
provided.
The rain water collected in the pits after spell of rain will be
used for greenbelt development and dust suppression.
27 Impact of the Project on the water quality,
both surface and groundwater, should be
assessed and necessary safeguard measures,
if any required, should be provided.
Impact Studies and Mitigation Measures of Water Quality
discussed in Chapter 4, Page No. 80
28 Based on actual monitored data, it may
clearly be shown whether working will
intersect groundwater. Necessary data and
documentation in this regard may be
provided. In case the working will intersect
groundwater table, a detailed Hydro
Geological Study should be undertaken and
Report furnished. The Report inter-alia, shall
include details of the aquifers present and
impact of mining activities on these aquifers.
Necessary permission from Central Ground
Water Authority for working below ground
water and for pumping of ground water
should also be obtained and copy furnished.
The ground water table is at 55 - 60m below ground level.
The ultimate depth of this project is 37m from the general
ground profile.
It is inferred the quarrying activities in the Cumulative EIA
project (Quarries) will not intersect the Ground water table.
29 Details of any stream, seasonal or otherwise,
passing through the lease area and
modification / diversion proposed, if any, and
the impact of the same on the hydrology
should be brought out.
There is no stream, seasonal or other water bodies passing
within the project area. Therefore, no modification/ diversion
of water bodies is anticipated.
30 Information on site elevation, working depth,
groundwater table etc. Should be provided
both in AMSL and Bgl. A schematic diagram
may also be provided for the same.
Highest elevation of the project area is 98 m AMSL
Ultimate depth of the mine is 37m bgl
Water level in the area is 55m BGL to 60m BGL
31 A time bound Progressive Greenbelt
Development Plan shall be prepared in a
tabular form (indicating the linear and
quantitative coverage, plant species and time
frame) and submitted, keeping in mind, the
same will have to be executed up front on
commencement of the Project. Phase-wise
plan of plantation and compensatory
afforestation should be charted clearly
indicating the area to be covered under
plantation and the species to be planted. The
details of plantation already done should be
given. The plant species selected for green
belt should have greater ecological value and
should be of good utility value to the local
population with emphasis on local and native
species and the species which are tolerant to
pollution.
Recommended Species proposed for Greenbelt Development
are given in the Chapter 10, Page No. 118.
32 Impact on local transport infrastructure due to
the Project should be indicated. Projected
increase in truck traffic as a result of the
Project in the present road network (including
those outside the Project area) should be
Traffic density survey was carried out to analyse the impact of
Transportation in the study area as per IRC guidelines 1961
and it is inferred that there is no much significant impact due
to the proposed transportation from the project area. Details in
Chapter 2, Page No. 24
VIII
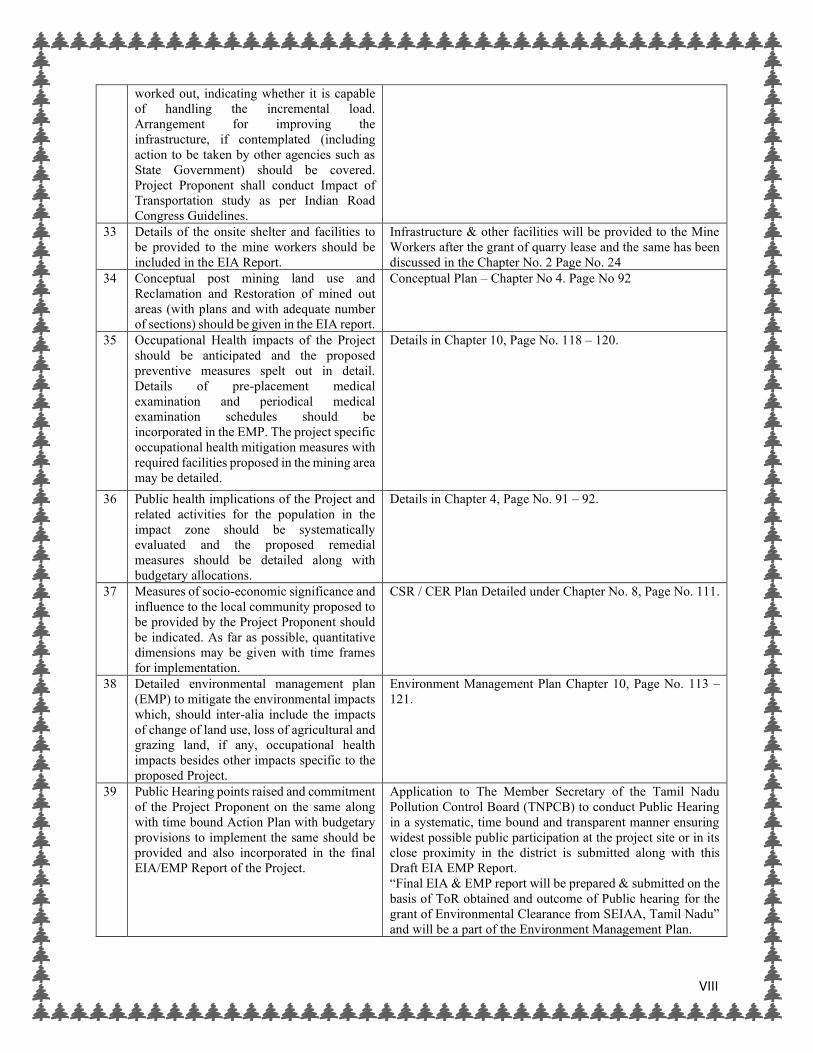
worked out, indicating whether it is capable
of handling the incremental load.
Arrangement for improving the
infrastructure, if contemplated (including
action to be taken by other agencies such as
State Government) should be covered.
Project Proponent shall conduct Impact of
Transportation study as per Indian Road
Congress Guidelines.
33 Details of the onsite shelter and facilities to
be provided to the mine workers should be
included in the EIA Report.
Infrastructure & other facilities will be provided to the Mine
Workers after the grant of quarry lease and the same has been
discussed in the Chapter No. 2 Page No. 24
34 Conceptual post mining land use and
Reclamation and Restoration of mined out
areas (with plans and with adequate number
of sections) should be given in the EIA report.
Conceptual Plan – Chapter No 4. Page No 92
35 Occupational Health impacts of the Project
should be anticipated and the proposed
preventive measures spelt out in detail.
Details of pre-placement medical
examination and periodical medical
examination schedules should be
incorporated in the EMP. The project specific
occupational health mitigation measures with
required facilities proposed in the mining area
may be detailed.
Details in Chapter 10, Page No. 118 – 120.
36 Public health implications of the Project and
related activities for the population in the
impact zone should be systematically
evaluated and the proposed remedial
measures should be detailed along with
budgetary allocations.
Details in Chapter 4, Page No. 91 – 92.
37 Measures of socio-economic significance and
influence to the local community proposed to
be provided by the Project Proponent should
be indicated. As far as possible, quantitative
dimensions may be given with time frames
for implementation.
CSR / CER Plan Detailed under Chapter No. 8, Page No. 111.
38 Detailed environmental management plan
(EMP) to mitigate the environmental impacts
which, should inter-alia include the impacts
of change of land use, loss of agricultural and
grazing land, if any, occupational health
impacts besides other impacts specific to the
proposed Project.
Environment Management Plan Chapter 10, Page No. 113 –
121.
39 Public Hearing points raised and commitment
of the Project Proponent on the same along
with time bound Action Plan with budgetary
provisions to implement the same should be
provided and also incorporated in the final
EIA/EMP Report of the Project.
Application to The Member Secretary of the Tamil Nadu
Pollution Control Board (TNPCB) to conduct Public Hearing
in a systematic, time bound and transparent manner ensuring
widest possible public participation at the project site or in its
close proximity in the district is submitted along with this
Draft EIA EMP Report.
“Final EIA & EMP report will be prepared & submitted on the
basis of ToR obtained and outcome of Public hearing for the
grant of Environmental Clearance from SEIAA, Tamil Nadu”
and will be a part of the Environment Management Plan.
IX
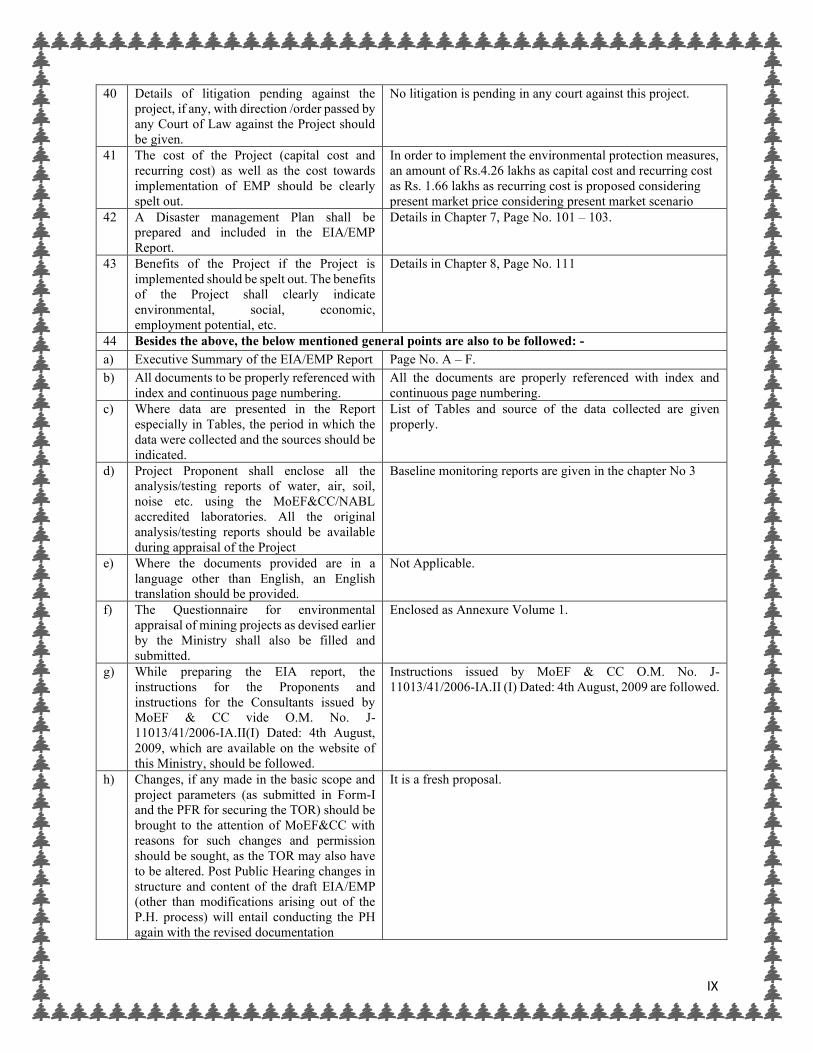
40 Details of litigation pending against the
project, if any, with direction /order passed by
any Court of Law against the Project should
be given.
No litigation is pending in any court against this project.
41 The cost of the Project (capital cost and
recurring cost) as well as the cost towards
implementation of EMP should be clearly
spelt out.
In order to implement the environmental protection measures,
an amount of Rs.4.26 lakhs as capital cost and recurring cost
as Rs. 1.66 lakhs as recurring cost is proposed considering
present market price considering present market scenario
42 A Disaster management Plan shall be
prepared and included in the EIA/EMP
Report.
Details in Chapter 7, Page No. 101 – 103.
43 Benefits of the Project if the Project is
implemented should be spelt out. The benefits
of the Project shall clearly indicate
environmental, social, economic,
employment potential, etc.
Details in Chapter 8, Page No. 111
44 Besides the above, the below mentioned general points are also to be followed: -
a) Executive Summary of the EIA/EMP Report Page No. A – F.
b) All documents to be properly referenced with
index and continuous page numbering.
All the documents are properly referenced with index and
continuous page numbering.
c) Where data are presented in the Report
especially in Tables, the period in which the
data were collected and the sources should be
indicated.
List of Tables and source of the data collected are given
properly.
d) Project Proponent shall enclose all the
analysis/testing reports of water, air, soil,
noise etc. using the MoEF&CC/NABL
accredited laboratories. All the original
analysis/testing reports should be available
during appraisal of the Project
Baseline monitoring reports are given in the chapter No 3
e) Where the documents provided are in a
language other than English, an English
translation should be provided.
Not Applicable.
f) The Questionnaire for environmental
appraisal of mining projects as devised earlier
by the Ministry shall also be filled and
submitted.
Enclosed as Annexure Volume 1.
g) While preparing the EIA report, the
instructions for the Proponents and
instructions for the Consultants issued by
MoEF & CC vide O.M. No. J-
11013/41/2006-IA.II(I) Dated: 4th August,
2009, which are available on the website of
this Ministry, should be followed.
Instructions issued by MoEF & CC O.M. No. J-
11013/41/2006-IA.II (I) Dated: 4th August, 2009 are followed.
h) Changes, if any made in the basic scope and
project parameters (as submitted in Form-I
and the PFR for securing the TOR) should be
brought to the attention of MoEF&CC with
reasons for such changes and permission
should be sought, as the TOR may also have
to be altered. Post Public Hearing changes in
structure and content of the draft EIA/EMP
(other than modifications arising out of the
P.H. process) will entail conducting the PH
again with the revised documentation
It is a fresh proposal.
X
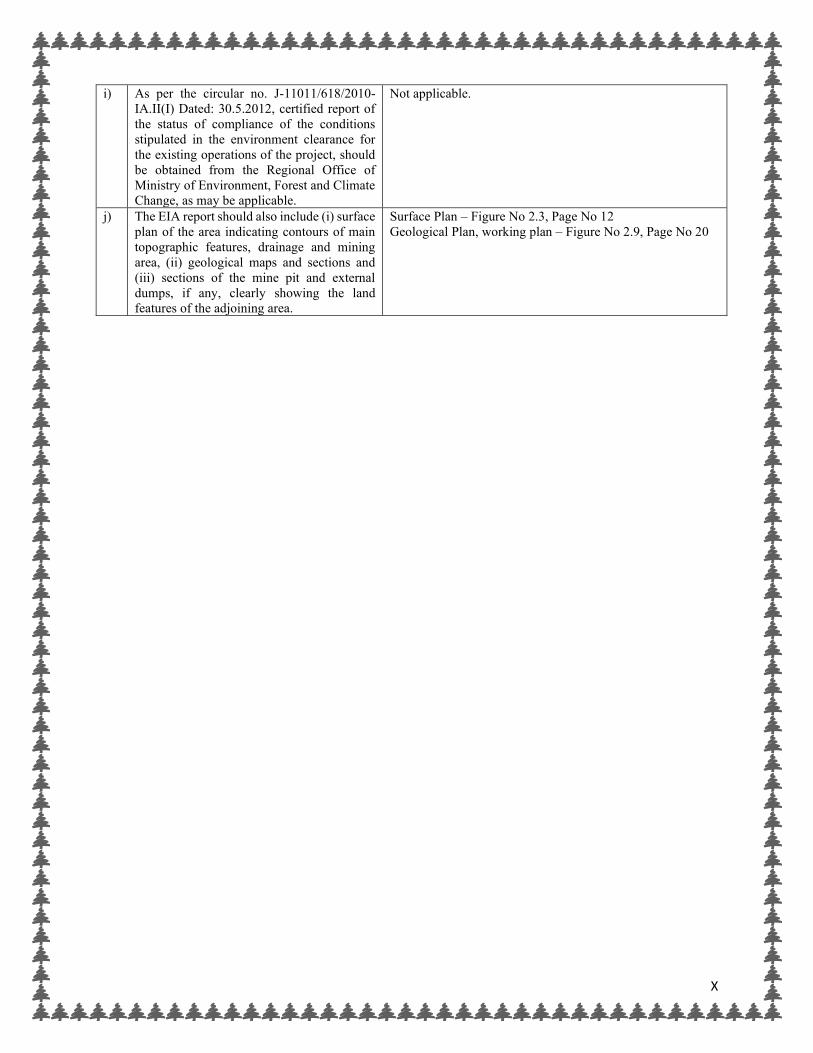
i) As per the circular no. J-11011/618/2010-
IA.II(I) Dated: 30.5.2012, certified report of
the status of compliance of the conditions
stipulated in the environment clearance for
the existing operations of the project, should
be obtained from the Regional Office of
Ministry of Environment, Forest and Climate
Change, as may be applicable.
Not applicable.
j) The EIA report should also include (i) surface
plan of the area indicating contours of main
topographic features, drainage and mining
area, (ii) geological maps and sections and
(iii) sections of the mine pit and external
dumps, if any, clearly showing the land
features of the adjoining area.
Surface Plan – Figure No 2.3, Page No 12
Geological Plan, working plan – Figure No 2.9, Page No 20
i | P a g e
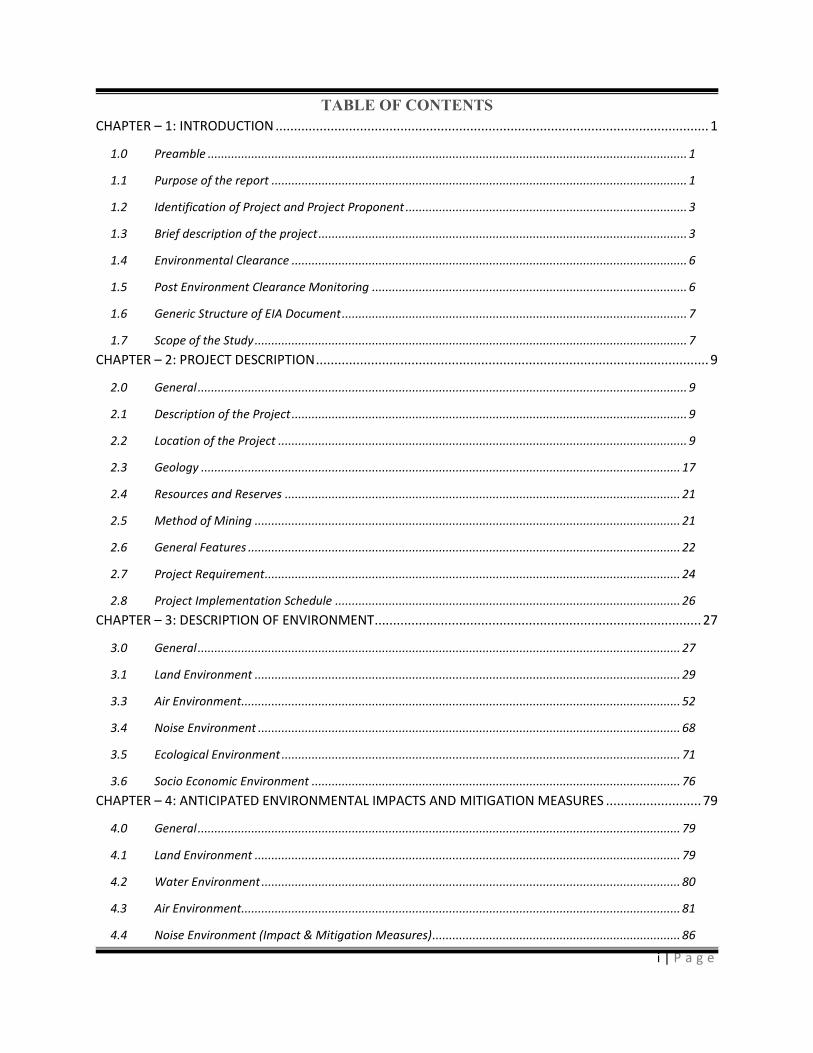
TABLE OF CONTENTS
CHAPTER – 1: INTRODUCTION ...................................................................................................................... 1
1.0 Preamble ............................................................................................................................................... 1
1.1 Purpose of the report ............................................................................................................................ 1
1.2 Identification of Project and Project Proponent .................................................................................... 3
1.3 Brief description of the project .............................................................................................................. 3
1.4 Environmental Clearance ...................................................................................................................... 6
1.5 Post Environment Clearance Monitoring .............................................................................................. 6
1.6 Generic Structure of EIA Document ....................................................................................................... 7
1.7 Scope of the Study ................................................................................................................................. 7
CHAPTER – 2: PROJECT DESCRIPTION ........................................................................................................... 9
2.0 General .................................................................................................................................................. 9
2.1 Description of the Project ...................................................................................................................... 9
2.2 Location of the Project .......................................................................................................................... 9
2.3 Geology ............................................................................................................................................... 17
2.4 Resources and Reserves ...................................................................................................................... 21
2.5 Method of Mining ............................................................................................................................... 21
2.6 General Features ................................................................................................................................. 22
2.7 Project Requirement ............................................................................................................................ 24
2.8 Project Implementation Schedule ....................................................................................................... 26
CHAPTER – 3: DESCRIPTION OF ENVIRONMENT ......................................................................................... 27
3.0 General ................................................................................................................................................ 27
3.1 Land Environment ............................................................................................................................... 29
3.3 Air Environment................................................................................................................................... 52
3.4 Noise Environment .............................................................................................................................. 68
3.5 Ecological Environment ....................................................................................................................... 71
3.6 Socio Economic Environment .............................................................................................................. 76
CHAPTER – 4: ANTICIPATED ENVIRONMENTAL IMPACTS AND MITIGATION MEASURES .......................... 79
4.0 General ................................................................................................................................................ 79
4.1 Land Environment ............................................................................................................................... 79
4.2 Water Environment ............................................................................................................................. 80
4.3 Air Environment................................................................................................................................... 81
4.4 Noise Environment (Impact & Mitigation Measures) .......................................................................... 86
ii | P a g e
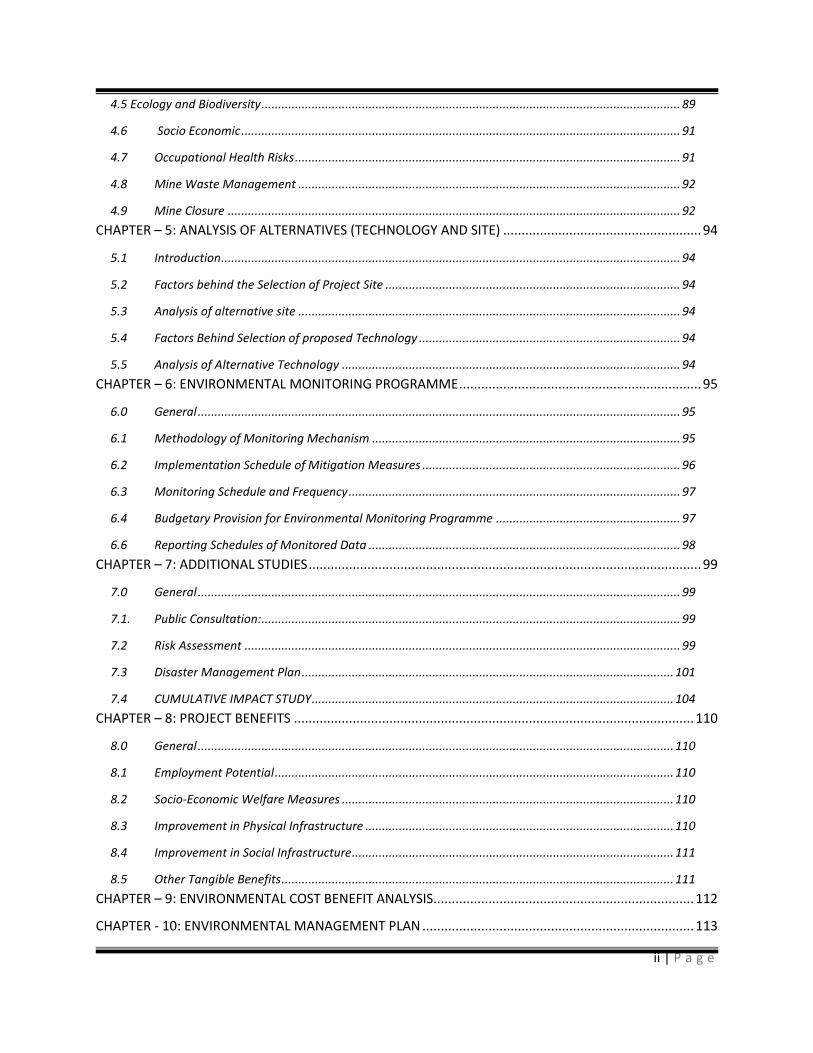
4.5 Ecology and Biodiversity ............................................................................................................................. 89
4.6 Socio Economic ................................................................................................................................... 91
4.7 Occupational Health Risks ................................................................................................................... 91
4.8 Mine Waste Management .................................................................................................................. 92
4.9 Mine Closure ....................................................................................................................................... 92
CHAPTER – 5: ANALYSIS OF ALTERNATIVES (TECHNOLOGY AND SITE) ...................................................... 94
5.1 Introduction ......................................................................................................................................... 94
5.2 Factors behind the Selection of Project Site ........................................................................................ 94
5.3 Analysis of alternative site .................................................................................................................. 94
5.4 Factors Behind Selection of proposed Technology .............................................................................. 94
5.5 Analysis of Alternative Technology ..................................................................................................... 94
CHAPTER – 6: ENVIRONMENTAL MONITORING PROGRAMME .................................................................. 95
6.0 General ................................................................................................................................................ 95
6.1 Methodology of Monitoring Mechanism ............................................................................................ 95
6.2 Implementation Schedule of Mitigation Measures ............................................................................. 96
6.3 Monitoring Schedule and Frequency ................................................................................................... 97
6.4 Budgetary Provision for Environmental Monitoring Programme ....................................................... 97
6.6 Reporting Schedules of Monitored Data ............................................................................................. 98
CHAPTER – 7: ADDITIONAL STUDIES ........................................................................................................... 99
7.0 General ................................................................................................................................................ 99
7.1. Public Consultation: ............................................................................................................................. 99
7.2 Risk Assessment .................................................................................................................................. 99
7.3 Disaster Management Plan ............................................................................................................... 101
7.4 CUMULATIVE IMPACT STUDY ............................................................................................................ 104
CHAPTER – 8: PROJECT BENEFITS ............................................................................................................. 110
8.0 General .............................................................................................................................................. 110
8.1 Employment Potential ....................................................................................................................... 110
8.2 Socio-Economic Welfare Measures ................................................................................................... 110
8.3 Improvement in Physical Infrastructure ............................................................................................ 110
8.4 Improvement in Social Infrastructure ................................................................................................ 111
8.5 Other Tangible Benefits ..................................................................................................................... 111
CHAPTER – 9: ENVIRONMENTAL COST BENEFIT ANALYSIS....................................................................... 112
CHAPTER - 10: ENVIRONMENTAL MANAGEMENT PLAN .......................................................................... 113
iii | P a g e
10.0 General .............................................................................................................................................. 113
10.1 Environmental Policy ......................................................................................................................... 113
10.1 Land Environment Management – .................................................................................................... 114
10.2 Soil Management .............................................................................................................................. 114
10.3 Water Management .......................................................................................................................... 114
10.4 Air Quality Management ................................................................................................................... 115
10.5 Noise Management ........................................................................................................................... 116
10.6 Ground Vibration and Fly Rock Control ............................................................................................. 117
10.7 Biological Environment Management ............................................................................................... 117
10.8 Occupational Safety & Health Management .................................................................................... 118
CHAPTER – 11: SUMMARY AND CONCLUSIONS ....................................................................................... 122
11.0 Introduction ............................................................................................................................................ 122
11.1 Scope of the Project ........................................................................................................................... 122
11.2 Project Description ............................................................................................................................ 122
11.3 Description of the environment ......................................................................................................... 123
11.4 ANTICIPATED ENVIRONMENTAL IMPACTS AND MITIGATION MEASURES ........................................ 126
11.5 ANALYSIS OF ALTERNATIVES ............................................................................................................. 128
11.6 ENVIRONMENTAL MONITORING PROGRAM .................................................................................... 129
11.7 PROJECT BENEFITS ............................................................................................................................ 129
11.8 ENVIRONMENTAL MANAGEMENT PLAN .......................................................................................... 130
11.10 CONCLUSION ..................................................................................................................................... 130
CHAPTER 12.0: DISCLOSURE OF CONSULTANTS ....................................................................................... 131
iv | P a g e
LIST OF TABLES
TABLE 1.1: IDENTIFICATION OF PROJECT ......................................................................... 3
TABLE 1.2: DETAILS OF PROJECT PROPONENT ................................................................ 3
TABLE 1.3: SALIENT FEATURES OF THE PROPOSED PROJECT .................................... 3
TABLE 1.4: STRUCTURE OF THE EIA REPORT ................................................................... 7
TABLE 1.5 ENVIRONMENT ATTRIBUTES ............................................................................. 8
TABLE 2.1 SITE CONNECTIVITY ............................................................................................. 9
TABLE 2.2: BOUNDARY CO-ORDINATES OF PROPOSED PROJECT ............................. 10
TABLE 2.3: LAND USE PATTERN OF THE PROPOSED PROJECT .................................. 17
TABLE 2.4: OPERATIONAL DETAILS FOR PROPOSED PROJECT ................................. 17
TABLE 2.5: AVAILABLE GEOLOGICAL RESOURCES OF PROPOSED PROJECT ........ 21
TABLE 2.6: AVAILABLE MINEABLE RESERVES OF PROPOSED PROJECT ................ 21
TABLE 2.7 MACHINERY DETAILS FOR PROPOSED PROJECTS .................................... 22
TABLE 2.8 TRAFFIC SURVEY LOCATION’S ........................................................................ 23
TABLE 2.9 EXISTING TRAFFIC VOLUME ........................................................................... 24
TABLE 2.10 SUMMARY OF TRAFFIC VOLUME.................................................................. 24
TABLE 2.11 WATER REQUIREMENT .................................................................................... 24
TABLE 2.12: EMPLOYMENT POTENTIAL ............................................................................ 25
TABLE 2.13 PROJECT COST OF PROPOSED PROJECT .................................................... 26
TABLE 2.14 EXPECTED TIME SCHEDULE FOR THE PROJECT .................................... 26
TABLE 3.1 ENVIRONMENTAL MONITORING ATTRIBUTES AND FREQUENCY OF
MONITORING ..................................................................................................................... 28
TABLE 3.2: LAND USE / LAND COVER TABLE 10 KM RADIUS ....................................... 29
TABLE 3.3: DETAILS OF ENVIRONMENT SENSITIVITY AROUND THE CLUSTER ... 32
TABLE 3.4: WATER BODIES FROM PROPOSED PROJECT .............................................. 32
v | P a g e
TABLE 3.5: SOIL SAMPLING LOCATIONS ........................................................................... 33
TABLE 3.6: METHODOLOGY OF SAMPLING COLLECTION ........................................... 33
TABLE 3.7 SOIL QUALITY MONITORING DATA ................................................................ 36
TABLE 3.8: WATER SAMPLING LOCATIONS ...................................................................... 38
TABLE 3.9 GROUND WATER ANALYSIS RESULTS ............................................................ 40
TABLE 3.10: SURFACE WATER ANALYSIS RESULTS ....................................................... 42
TABLE 3.11: POST MONSOON WATER LEVEL OF OPEN WELLS 1 KM RADIUS ........ 44
TABLE 3.12: POST MONSOON WATER LEVEL OF BOREWELLS 1 KM RADIUS ......... 44
TABLE 3.13: RAINFALL DATA................................................................................................ 53
TABLE 3.14: METEOROLOGICAL DATA RECORDED AT SITE ....................................... 53
TABLE 3.15: METHODOLOGY AND INSTRUMENT USED FOR AIR QUALITY
ANALYSIS ............................................................................................................................ 54
TABLE 3.16: NATIONAL AMBIENT AIR QUALITY STANDARDS..................................... 54
TABLE 3.17: AMBIENT AIR QUALITY (AAQ) MONITORING LOCATIONS .................... 55
TABLE 3.18: AAQ1- CORE ZONE ............................................................................................ 57
TABLE 3.19: AAQ2 - SOTHIYAMPAKKAM VILLAGE (BUFFER ZONE) .......................... 58
TABLE 3.20: AAQ3 - AKKUR VILLAGE (BUFFER ZONE) .................................................. 59
TABLE 3.21: AAQ4 – – PERUMBULIMEDU VILLAGE (BUFFER ZONE) ........................ 60
TABLE 3.22: AAQ5 -VADAKALPAKKAM VILLAGE (BUFFER ZONE) ............................. 61
TABLE 3.23: AAQ6 - ARPAKKAM VILLAGE (BUFFER ZONE) .......................................... 62
TABLE 3.24 AAQ7 - PULIVOY VILLAGE (BUFFER ZONE)................................................ 63
TABLE 3.25 AAQ8 – NEAR CRUSHER WEST SIDE (BUFFER ZONE).............................. 64
TABLE 3.26: ABSTRACT OF AMBIENT AIR QUALITY DATA ........................................... 65
Table 3.27: AVERAGE FUGITIVE DUST SAMPLE VALUES IN μg/m3 .............................. 67
Table 3.28: FUGITIVE DUST SAMPLE VALUES IN μg/m3 – ............................................... 67
vi | P a g e
TABLE 3.29 DETAILS OF SURFACE NOISE MONITORING LOCATIONS...................... 68
TABLE 3.30: NOISE MONITORING RESULTS IN CORE AND BUFFER ZONE ............. 70
TABLE 3.31: LIST OF FLORA .................................................................................................. 72
TABLE 3.32: LIST OF FAUNA ................................................................................................. 74
TABLE 3.33: POPULATION CHARACTERISTICS AROUND 10KM RADIUS ................... 77
TABLE 3.34: OCCUPATIONAL CHARACTERISTICS AROUND 10KM RADIUS ............. 77
TABLE 4.1: WATER REQUIREMENTS .................................................................................. 80
TABLE 4.2: ESTIMATED EMISSION RATE FOR PM10 ....................................................... 81
TABLE 4.3: ESTIMATED EMISSION RATE FOR SO2 ......................................................... 82
TABLE 4.4: ESTIMATED EMISSION RATE FOR NOX ........................................................ 82
TABLE 4.5: PREDICTED GLC OF PM10 AT RECEPTOR LOCATIONS ............................. 83
TABLE 4.6: PREDICTED GLC OF PM2.5 AT RECEPTOR LOCATIONS............................. 83
TABLE 4.7: PREDICTED GLC OF SO2 AT RECEPTOR LOCATIONS ............................... 84
TABLE 4.8: PREDICTED GLC OF NO2 AT RECEPTOR LOCATIONS ............................... 85
TABLE 4.9: ACTIVITY AND NOISE LEVEL PRODUCED BY MACHINERY .................... 87
TABLE 4.10: PREDICTED NOISE INCREMENTAL VALUES ............................................ 87
TABLE 4.11: GREEN BELT DEVELOPMENT PROGRAMME ............................................ 90
TABLE 6.1 IMPLEMENTATION SCHEDULE ....................................................................... 96
TABLE 6.2: MONITORING SCHEDULE ................................................................................ 97
TABLE 6.3 ENVIRONMENTAL MONITORING BUDGET (PROJECT AREA) .................. 98
TABLE 7.1 RISK ASSESSMENT ............................................................................................... 99
TABLE 7.2: PROPOSED TEAMS TO DEAL WITH EMERGENCY SITUATION ............. 101
TABLE 7.3: PROPOSED FIRE EXTINGUISHERS AT DIFFERENT LOCATIONS ........ 103
TABLE 7.4: LIST OF QUARRIES WITHIN 500 METER RADIUS FROM THIS
PROPOSAL ........................................................................................................................ 104
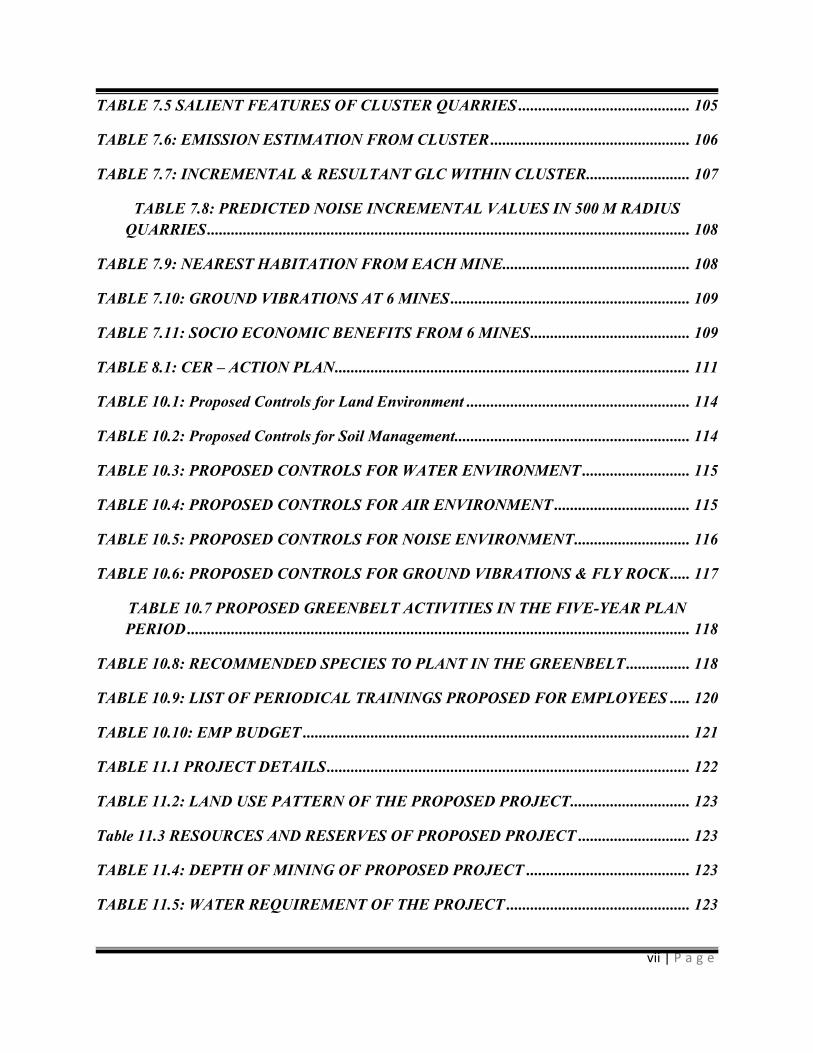
vii | P a g e
TABLE 7.5 SALIENT FEATURES OF CLUSTER QUARRIES ........................................... 105
TABLE 7.6: EMISSION ESTIMATION FROM CLUSTER .................................................. 106
TABLE 7.7: INCREMENTAL & RESULTANT GLC WITHIN CLUSTER .......................... 107
TABLE 7.8: PREDICTED NOISE INCREMENTAL VALUES IN 500 M RADIUS
QUARRIES ......................................................................................................................... 108
TABLE 7.9: NEAREST HABITATION FROM EACH MINE............................................... 108
TABLE 7.10: GROUND VIBRATIONS AT 6 MINES ............................................................ 109
TABLE 7.11: SOCIO ECONOMIC BENEFITS FROM 6 MINES ........................................ 109
TABLE 8.1: CER – ACTION PLAN ......................................................................................... 111
TABLE 10.1: Proposed Controls for Land Environment ........................................................ 114
TABLE 10.2: Proposed Controls for Soil Management........................................................... 114
TABLE 10.3: PROPOSED CONTROLS FOR WATER ENVIRONMENT ........................... 115
TABLE 10.4: PROPOSED CONTROLS FOR AIR ENVIRONMENT .................................. 115
TABLE 10.5: PROPOSED CONTROLS FOR NOISE ENVIRONMENT ............................. 116
TABLE 10.6: PROPOSED CONTROLS FOR GROUND VIBRATIONS & FLY ROCK ..... 117
TABLE 10.7 PROPOSED GREENBELT ACTIVITIES IN THE FIVE-YEAR PLAN
PERIOD .............................................................................................................................. 118
TABLE 10.8: RECOMMENDED SPECIES TO PLANT IN THE GREENBELT ................ 118
TABLE 10.9: LIST OF PERIODICAL TRAININGS PROPOSED FOR EMPLOYEES ..... 120
TABLE 10.10: EMP BUDGET ................................................................................................. 121
TABLE 11.1 PROJECT DETAILS ........................................................................................... 122
TABLE 11.2: LAND USE PATTERN OF THE PROPOSED PROJECT .............................. 123
Table 11.3 RESOURCES AND RESERVES OF PROPOSED PROJECT ............................ 123
TABLE 11.4: DEPTH OF MINING OF PROPOSED PROJECT ......................................... 123
TABLE 11.5: WATER REQUIREMENT OF THE PROJECT .............................................. 123

viii | P a g e
TABLE 11.6: LAND USE / LAND COVER TABLE 10 KM RADIUS ................................... 124
TABLE 11.7: ANTICIPATED IMPACTS & MITIGATION MEASURES ............................ 126
TABLE 11.8: POST PROJECT MONITORING PROGRAM ................................................ 129
TABLE 11.9: EMP BUDGET ................................................................................................... 130
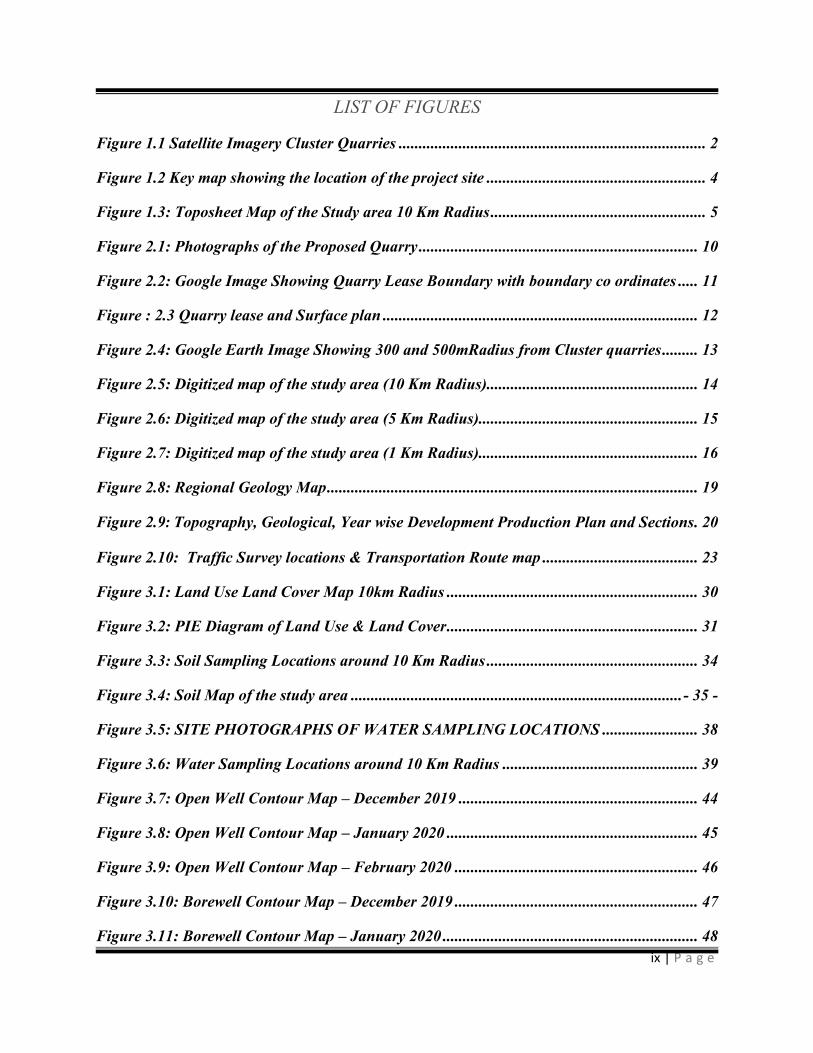
ix | P a g e
LIST OF FIGURES
Figure 1.1 Satellite Imagery Cluster Quarries ............................................................................. 2
Figure 1.2 Key map showing the location of the project site ....................................................... 4
Figure 1.3: Toposheet Map of the Study area 10 Km Radius ...................................................... 5
Figure 2.1: Photographs of the Proposed Quarry ...................................................................... 10
Figure 2.2: Google Image Showing Quarry Lease Boundary with boundary co ordinates ..... 11
Figure : 2.3 Quarry lease and Surface plan ............................................................................... 12
Figure 2.4: Google Earth Image Showing 300 and 500mRadius from Cluster quarries ......... 13
Figure 2.5: Digitized map of the study area (10 Km Radius) ..................................................... 14
Figure 2.6: Digitized map of the study area (5 Km Radius) ....................................................... 15
Figure 2.7: Digitized map of the study area (1 Km Radius) ....................................................... 16
Figure 2.8: Regional Geology Map ............................................................................................. 19
Figure 2.9: Topography, Geological, Year wise Development Production Plan and Sections . 20
Figure 2.10: Traffic Survey locations & Transportation Route map ....................................... 23
Figure 3.1: Land Use Land Cover Map 10km Radius ............................................................... 30
Figure 3.2: PIE Diagram of Land Use & Land Cover ............................................................... 31
Figure 3.3: Soil Sampling Locations around 10 Km Radius ..................................................... 34
Figure 3.4: Soil Map of the study area ................................................................................... - 35 -
Figure 3.5: SITE PHOTOGRAPHS OF WATER SAMPLING LOCATIONS ........................ 38
Figure 3.6: Water Sampling Locations around 10 Km Radius ................................................. 39
Figure 3.7: Open Well Contour Map – December 2019 ............................................................ 44
Figure 3.8: Open Well Contour Map – January 2020 ............................................................... 45
Figure 3.9: Open Well Contour Map – February 2020 ............................................................. 46
Figure 3.10: Borewell Contour Map – December 2019 ............................................................. 47
Figure 3.11: Borewell Contour Map – January 2020 ................................................................ 48
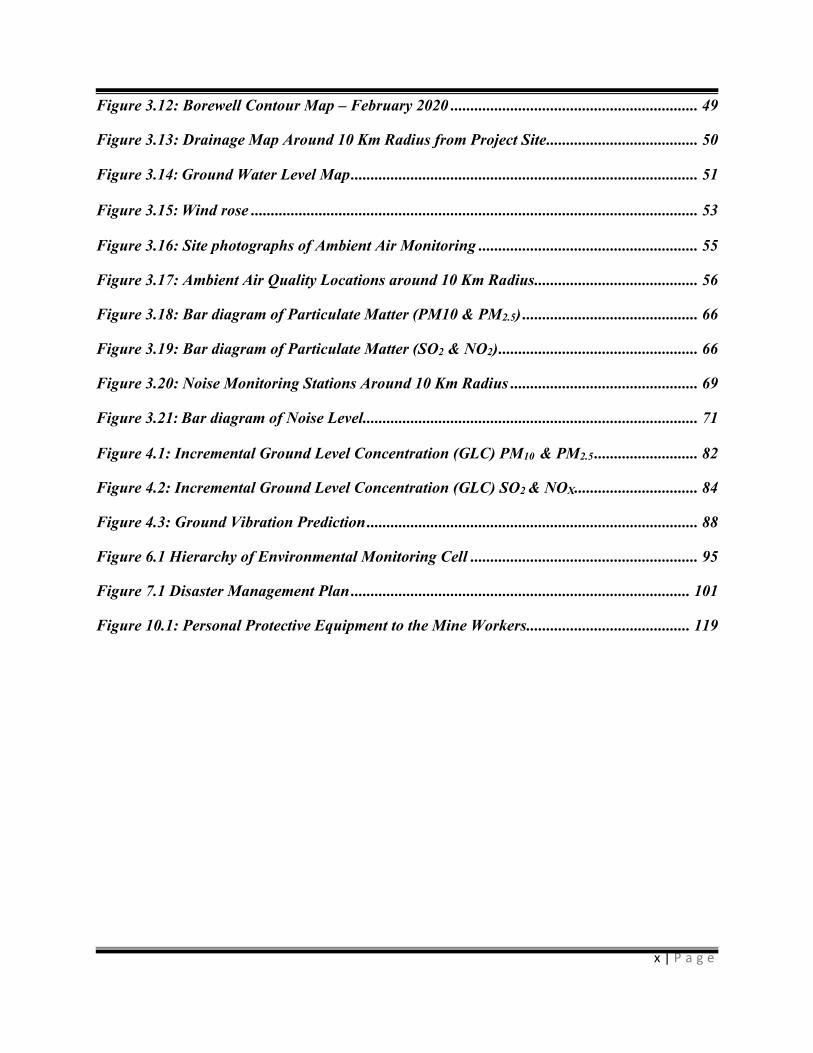
x | P a g e
Figure 3.12: Borewell Contour Map – February 2020 .............................................................. 49
Figure 3.13: Drainage Map Around 10 Km Radius from Project Site ...................................... 50
Figure 3.14: Ground Water Level Map ....................................................................................... 51
Figure 3.15: Wind rose ................................................................................................................ 53
Figure 3.16: Site photographs of Ambient Air Monitoring ....................................................... 55
Figure 3.17: Ambient Air Quality Locations around 10 Km Radius ......................................... 56
Figure 3.18: Bar diagram of Particulate Matter (PM10 & PM2.5) ............................................ 66
Figure 3.19: Bar diagram of Particulate Matter (SO2 & NO2) .................................................. 66
Figure 3.20: Noise Monitoring Stations Around 10 Km Radius ............................................... 69
Figure 3.21: Bar diagram of Noise Level .................................................................................... 71
Figure 4.1: Incremental Ground Level Concentration (GLC) PM10 & PM2.5 .......................... 82
Figure 4.2: Incremental Ground Level Concentration (GLC) SO2 & NOX ............................... 84
Figure 4.3: Ground Vibration Prediction ................................................................................... 88
Figure 6.1 Hierarchy of Environmental Monitoring Cell ......................................................... 95
Figure 7.1 Disaster Management Plan ..................................................................................... 101
Figure 10.1: Personal Protective Equipment to the Mine Workers......................................... 119
Thiru. R. Mohanraj Rough Stone & Gravel Quarry Final EIA EMP
Geo Exploration and Mining Solutions 1 | P a g e
CHAPTER – 1: INTRODUCTION
1.0 Preamble
Environmental Impact Assessment (EIA) is the management tool to ensure the sustainable development and
it is a process, used to identify the environmental, social and economic impacts of a project prior to decision-making.
It is a decision-making tool, which guides the decision makers in taking appropriate decisions for any project. EIA
systematically examines both beneficial and adverse consequences of the project and ensures that these impacts are
taken into account during the project designing. It also reduces conflicts by promoting community participation,
information, decision makers, and helps in developing the base for environmentally sound project.
Rough Stone and Gravel are the major requirements for construction industry. This EIA report is prepared
by considering Cumulative load of all proposed & existing quarries of Girijapuram Rough Stone and Gravel Cluster
Quarries consisting of Four Proposed and Two Existing Quarries with total extent of Cluster of 15.73.0 ha in
Girijapuram Village, Vembakkam Taluk, Tiruvannamalai District and Tamil Nadu State, cluster area calculated as
per MoEF & CC Notification S.O. 2269(E) Dated 1st July 2016.
This EIA Report is prepared in compliance with ToR obtained vide Lr.No.SEIAA-
TN/F.No.7238/SEAC/ToR- 844/2019 Dated: 17.02.2021. The Baseline Monitoring study has been carried out during
Post monsoon season (December 2019 – February 2020).
1.1 Purpose of the report
The Ministry of Environment and Forests, Govt. of India, through its EIA notification S.O. 1533(E) of 14 th
September 2006 and its subsequent amendments as per Gazette Notification S.O. 3977 (E) of 14thAugust 2018, Mining
Projects are classified under two categories i.e. A (> 100 Ha) and B (≤ 100 Ha), and Schematic Presentation of Requirements on Environmental Clearance of Minor Minerals including cluster situation in Appendix – XI.
Now, as per Order Dated: 04.09.2018 & 13.09.2018 passed by Hon'ble National Green Tribunal, New Delhi
in O.A. No. 173 of 2018 & O.A. No, 186 of 2016 and MoEF & CC Office Memorandum F. No. L-11011/175/2018-
IA-II (M) Dated: 12.12.2018 clarified the requirement for EIA, EMP and therefore, Public Consultation for all areas
from 5 to 25 ha falling in Category B - 1 and appraised by SEAC/ SEIAA as well as for cluster situation.
The proposed project is categorized under category “B1” Activity 1(a) (mining lease area in cluster situation)
and will be considered at SEIAA – TN after conducting Public Hearing and Submission of EIA/EMP Report for Grant
of Environmental Clearance.
Application to The Member Secretary of the Tamil Nadu Pollution Control Board (TNPCB) to conduct Public
Hearing in a systematic, time bound and transparent manner ensuring widest possible public participation at the project
site or in its close proximity in the district is submitted along with this draft EIA EMP Report.
“Draft EIA & EMP report prepared on the basis of ToR obtained for the grant of Environmental Clearance
from SEIAA, Tamil Nadu”
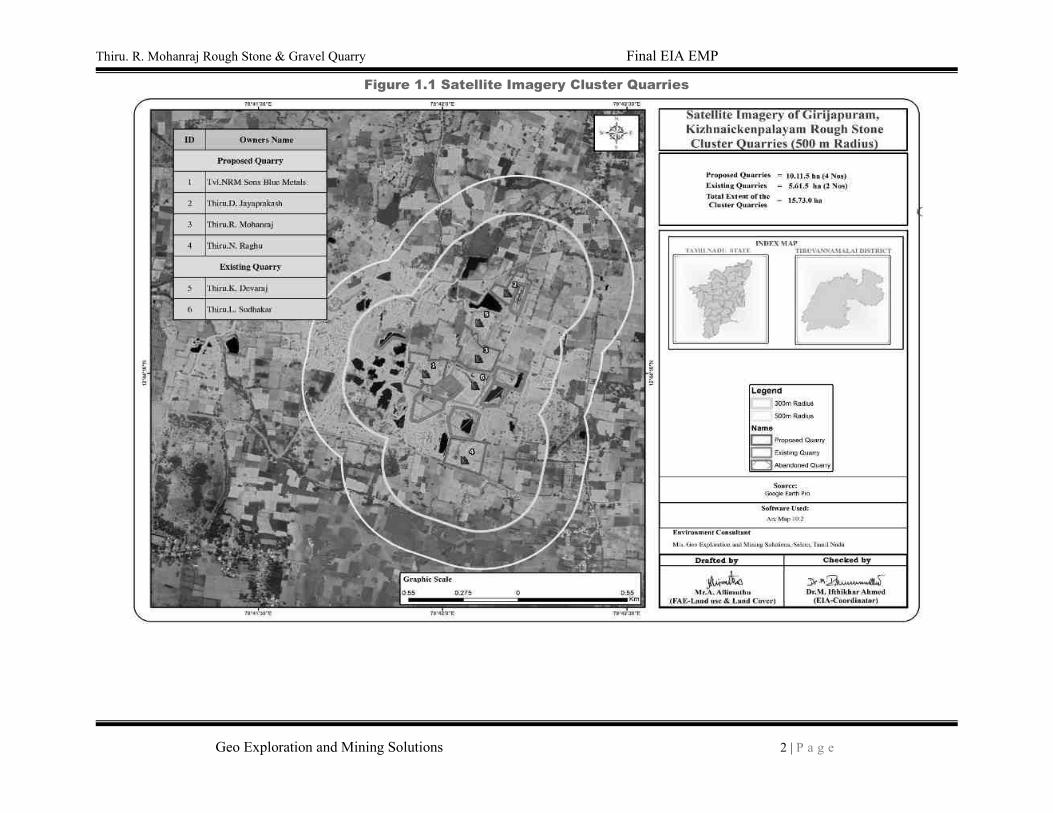
Thiru. R. Mohanraj Rough Stone & Gravel Quarry Final EIA EMP
Geo Exploration and Mining Solutions 2 | P a g e
Figure 1.1 Satellite Imagery Cluster Quarries
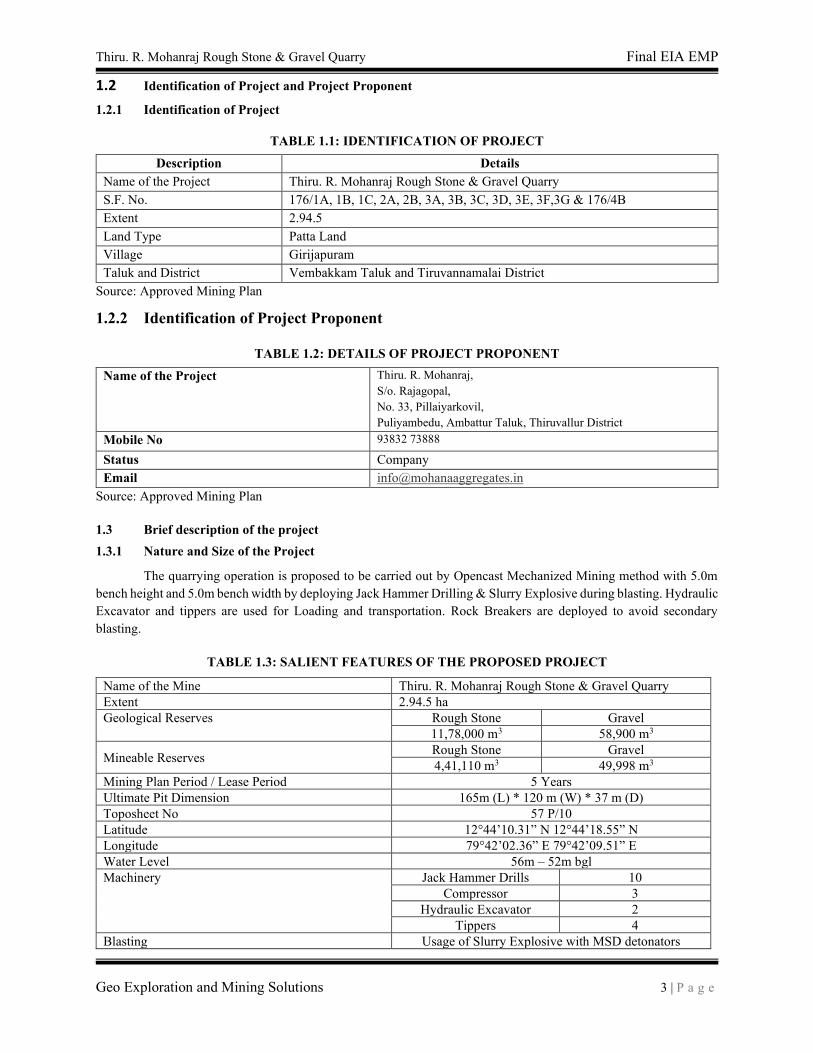
Thiru. R. Mohanraj Rough Stone & Gravel Quarry Final EIA EMP
Geo Exploration and Mining Solutions 3 | P a g e
1.2 Identification of Project and Project Proponent
1.2.1 Identification of Project
TABLE 1.1: IDENTIFICATION OF PROJECT
Description Details
Name of the Project Thiru. R. Mohanraj Rough Stone & Gravel Quarry
S.F. No. 176/1A, 1B, 1C, 2A, 2B, 3A, 3B, 3C, 3D, 3E, 3F,3G & 176/4B
Extent 2.94.5
Land Type Patta Land
Village Girijapuram
Taluk and District Vembakkam Taluk and Tiruvannamalai District
Source: Approved Mining Plan
1.2.2 Identification of Project Proponent
TABLE 1.2: DETAILS OF PROJECT PROPONENT
Name of the Project Thiru. R. Mohanraj,
S/o. Rajagopal,
No. 33, Pillaiyarkovil,
Puliyambedu, Ambattur Taluk, Thiruvallur District
Mobile No 93832 73888
Status Company
Email [email protected]
Source: Approved Mining Plan
1.3 Brief description of the project
1.3.1 Nature and Size of the Project
The quarrying operation is proposed to be carried out by Opencast Mechanized Mining method with 5.0m
bench height and 5.0m bench width by deploying Jack Hammer Drilling & Slurry Explosive during blasting. Hydraulic
Excavator and tippers are used for Loading and transportation. Rock Breakers are deployed to avoid secondary
blasting.
TABLE 1.3: SALIENT FEATURES OF THE PROPOSED PROJECT
Name of the Mine Thiru. R. Mohanraj Rough Stone & Gravel Quarry
Extent 2.94.5 ha
Geological Reserves Rough Stone Gravel
11,78,000 m3 58,900 m3
Mineable Reserves Rough Stone Gravel
4,41,110 m3 49,998 m3
Mining Plan Period / Lease Period 5 Years
Ultimate Pit Dimension 165m (L) * 120 m (W) * 37 m (D)
Toposheet No 57 P/10
Latitude 12°44’10.31” N 12°44’18.55” N
Longitude 79°42’02.36” E 79°42’09.51” E
Water Level 56m – 52m bgl
Machinery Jack Hammer Drills 10
Compressor 3
Hydraulic Excavator 2
Tippers 4
Blasting Usage of Slurry Explosive with MSD detonators
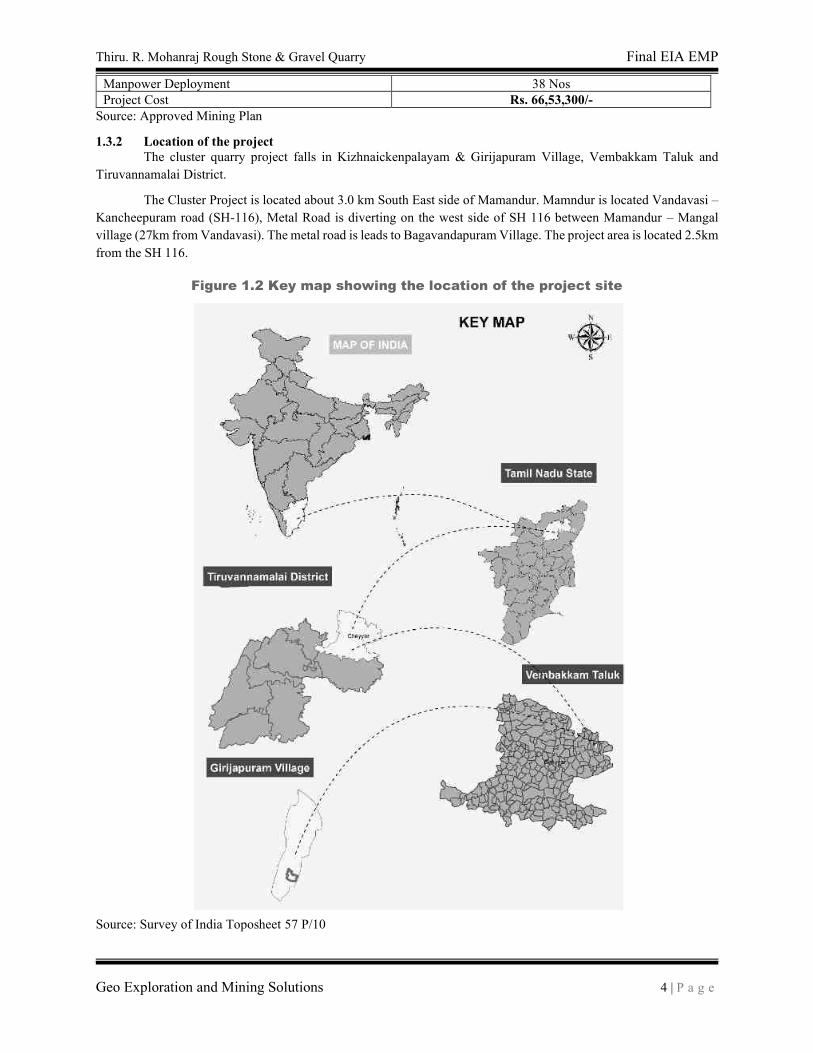
Thiru. R. Mohanraj Rough Stone & Gravel Quarry Final EIA EMP
Geo Exploration and Mining Solutions 4 | P a g e
Manpower Deployment 38 Nos
Project Cost Rs. 66,53,300/-
Source: Approved Mining Plan
1.3.2 Location of the project
The cluster quarry project falls in Kizhnaickenpalayam & Girijapuram Village, Vembakkam Taluk and
Tiruvannamalai District.
The Cluster Project is located about 3.0 km South East side of Mamandur. Mamndur is located Vandavasi –
Kancheepuram road (SH-116), Metal Road is diverting on the west side of SH 116 between Mamandur – Mangal
village (27km from Vandavasi). The metal road is leads to Bagavandapuram Village. The project area is located 2.5km
from the SH 116.
Figure 1.2 Key map showing the location of the project site
Source: Survey of India Toposheet 57 P/10
Thiru. R. Mohanraj Rough Stone & Gravel Quarry Final EIA EMP
Geo Exploration and Mining Solutions 5 | P a g e
Figure 1.3: Toposheet Map of the Study area 10 Km Radius
Thiru. R. Mohanraj Rough Stone & Gravel Quarry Final EIA EMP
Geo Exploration and Mining Solutions 6 | P a g e
1.4 Environmental Clearance
The Environmental Clearance process for the project will comprise of four stages. These stages in sequential
order are given below: -
1. Screening,
2. Scoping
3. Public consultation &
4. Appraisal
SCREENING –
• The proponent applied for Rough Stone and Gravel Quarry Lease, Dated: 06.06.2019
• Precise Area Communication Letter was issued by the District Collector, Tiruvannamalai, vide Rc.No.
377/Kanimam/2019, Dated 31.07.2019
• The Mining Plan was prepared and got approved by Assistant Director, Geology and Mining, Tiruvannamalai
District, vide Rc.No: 377/Kanimam/2019, Dated 10.09.2019
• Proponent applied for ToR for Environmental Clearance vides online Proposal No.
SIA/TN/MIN/45343/2019 Dated: 23.10.2019
SCOPING –
• The proposal was placed in 191st SEAC Meeting held on 30.12.2020 and the committee recommended for
issue of ToR.
• The proposal was considered in 420th SEIAA Meeting Dated: 04.02.2021 and issued ToR vide Letter No
SEIAA-TN/F.No.7238/SEAC/ToR- 844/2019 Dated: 17.02.2021
Public Consultation –
Application to The Member Secretary of the Tamil Nadu Pollution Control Board (TNPCB) to conduct Public
Hearing in a systematic, time bound and transparent manner ensuring widest possible public participation at the project
site or in its close proximity in the district is submitted along with this Draft EIA EMP Report.
Appraisal –
Appraisal is the detailed scrutiny by the State Expert Appraisal Committee (SEAC) of the application and
other documents like the final EIA & EMP Report, outcome of the Public Consultations including Public Hearing
Proceedings, submitted by the proponent to the regulatory authority concerned for grant of environmental clearance.
The report has been prepared using the following references:
• Guidance Manual of Environmental Impact Assessment for Mining of Minerals, Ministry of Environment
and Forests, 2010
• EIA Notification, 14thSeptember, 2006
• ToR Letter No. SEIAA-TN/F.No.7238/SEAC/ToR- 844/2019 Dated: 17.02.2021
• Approved Mining Plan
1.5 Post Environment Clearance Monitoring
The Project Proponent will submit a half-yearly compliance report in respect of stipulated Environmental
Clearance terms and conditions to MoEF & CC Regional Office & SEIAA after grant of EC on 1st June and 1st
December of every year.
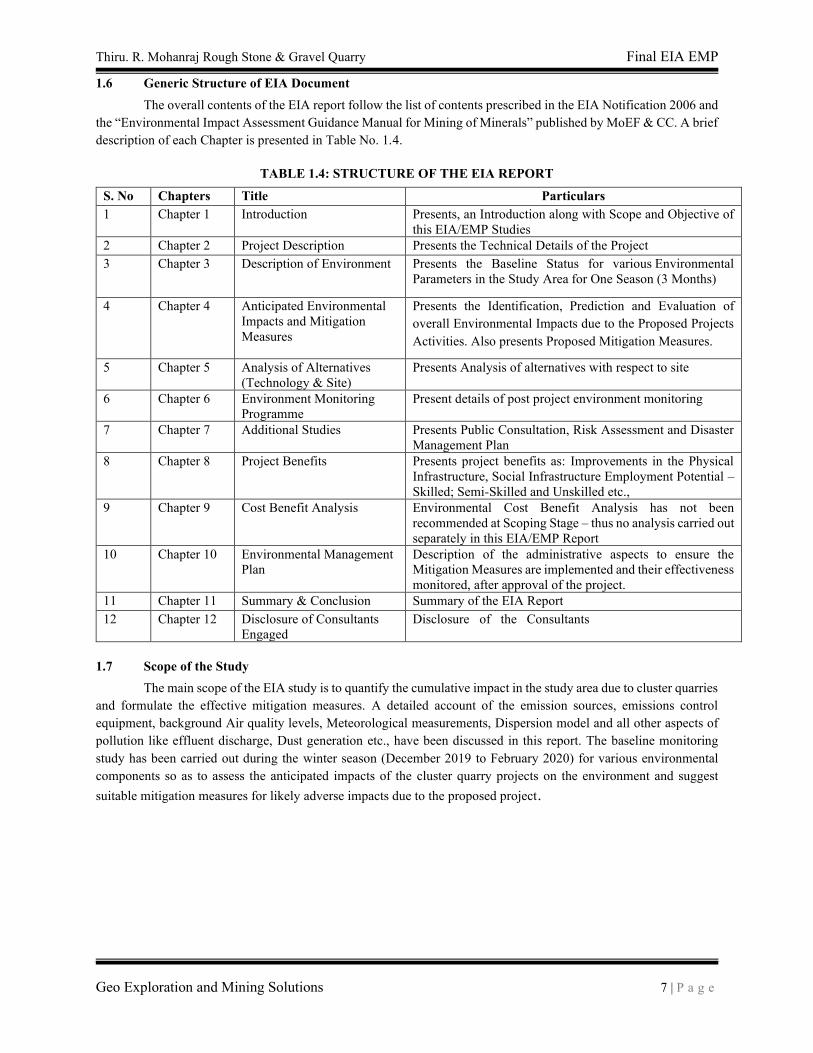
Thiru. R. Mohanraj Rough Stone & Gravel Quarry Final EIA EMP
Geo Exploration and Mining Solutions 7 | P a g e
1.6 Generic Structure of EIA Document
The overall contents of the EIA report follow the list of contents prescribed in the EIA Notification 2006 and
the “Environmental Impact Assessment Guidance Manual for Mining of Minerals” published by MoEF & CC. A brief description of each Chapter is presented in Table No. 1.4.
TABLE 1.4: STRUCTURE OF THE EIA REPORT
S. No Chapters Title Particulars
1 Chapter 1 Introduction Presents, an Introduction along with Scope and Objective of
this EIA/EMP Studies
2 Chapter 2 Project Description Presents the Technical Details of the Project
3 Chapter 3 Description of Environment Presents the Baseline Status for various Environmental
Parameters in the Study Area for One Season (3 Months)
4 Chapter 4 Anticipated Environmental
Impacts and Mitigation
Measures
Presents the Identification, Prediction and Evaluation of
overall Environmental Impacts due to the Proposed Projects
Activities. Also presents Proposed Mitigation Measures.
5 Chapter 5 Analysis of Alternatives
(Technology & Site)
Presents Analysis of alternatives with respect to site
6 Chapter 6 Environment Monitoring
Programme
Present details of post project environment monitoring
7 Chapter 7 Additional Studies Presents Public Consultation, Risk Assessment and Disaster
Management Plan
8 Chapter 8 Project Benefits Presents project benefits as: Improvements in the Physical
Infrastructure, Social Infrastructure Employment Potential –Skilled; Semi-Skilled and Unskilled etc.,
9 Chapter 9 Cost Benefit Analysis Environmental Cost Benefit Analysis has not been
recommended at Scoping Stage – thus no analysis carried out
separately in this EIA/EMP Report
10 Chapter 10 Environmental Management
Plan
Description of the administrative aspects to ensure the
Mitigation Measures are implemented and their effectiveness
monitored, after approval of the project.
11 Chapter 11 Summary & Conclusion Summary of the EIA Report
12 Chapter 12 Disclosure of Consultants
Engaged
Disclosure of the Consultants
1.7 Scope of the Study
The main scope of the EIA study is to quantify the cumulative impact in the study area due to cluster quarries
and formulate the effective mitigation measures. A detailed account of the emission sources, emissions control
equipment, background Air quality levels, Meteorological measurements, Dispersion model and all other aspects of
pollution like effluent discharge, Dust generation etc., have been discussed in this report. The baseline monitoring
study has been carried out during the winter season (December 2019 to February 2020) for various environmental
components so as to assess the anticipated impacts of the cluster quarry projects on the environment and suggest
suitable mitigation measures for likely adverse impacts due to the proposed project.
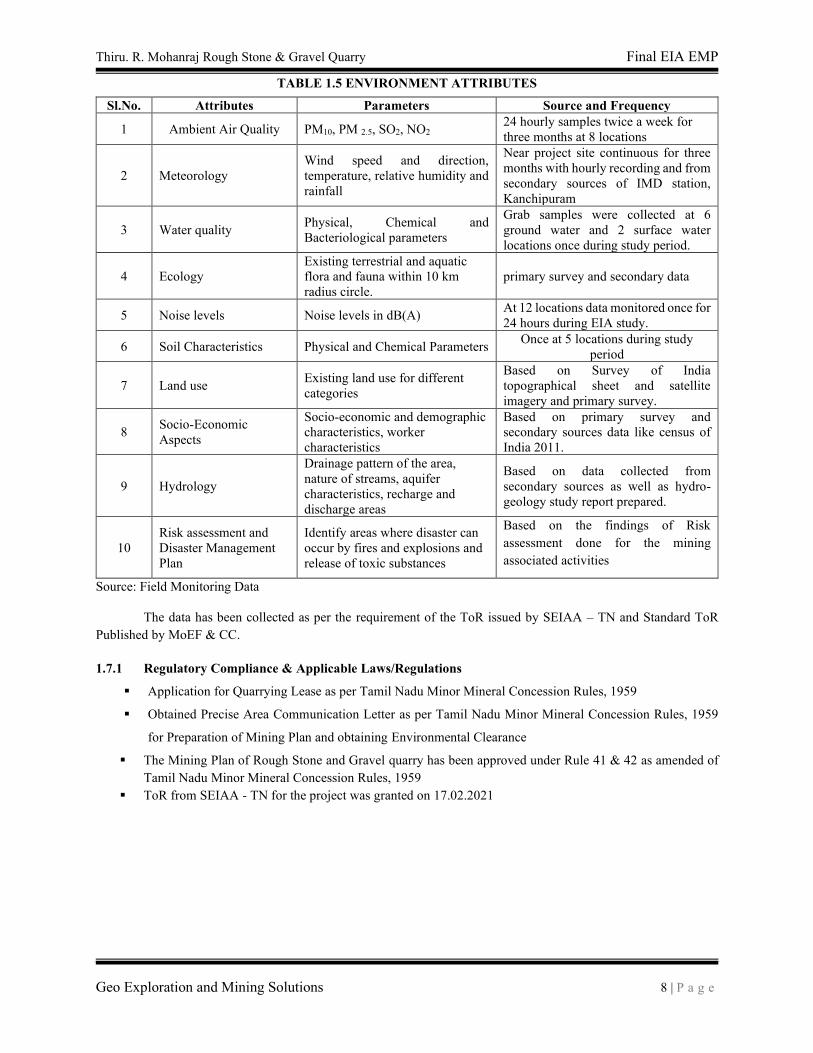
Thiru. R. Mohanraj Rough Stone & Gravel Quarry Final EIA EMP
Geo Exploration and Mining Solutions 8 | P a g e
TABLE 1.5 ENVIRONMENT ATTRIBUTES
Sl.No. Attributes Parameters Source and Frequency
1 Ambient Air Quality PM10, PM 2.5, SO2, NO2 24 hourly samples twice a week for
three months at 8 locations
2 Meteorology
Wind speed and direction,
temperature, relative humidity and
rainfall
Near project site continuous for three
months with hourly recording and from
secondary sources of IMD station,
Kanchipuram
3 Water quality Physical, Chemical and
Bacteriological parameters
Grab samples were collected at 6
ground water and 2 surface water
locations once during study period.
4 Ecology
Existing terrestrial and aquatic
flora and fauna within 10 km
radius circle.
primary survey and secondary data
5 Noise levels Noise levels in dB(A) At 12 locations data monitored once for
24 hours during EIA study.
6 Soil Characteristics Physical and Chemical Parameters Once at 5 locations during study
period
7 Land use Existing land use for different
categories
Based on Survey of India
topographical sheet and satellite
imagery and primary survey.
8 Socio-Economic
Aspects
Socio-economic and demographic
characteristics, worker
characteristics
Based on primary survey and
secondary sources data like census of
India 2011.
9 Hydrology
Drainage pattern of the area,
nature of streams, aquifer
characteristics, recharge and
discharge areas
Based on data collected from
secondary sources as well as hydro-
geology study report prepared.
10
Risk assessment and
Disaster Management
Plan
Identify areas where disaster can
occur by fires and explosions and
release of toxic substances
Based on the findings of Risk
assessment done for the mining
associated activities
Source: Field Monitoring Data
The data has been collected as per the requirement of the ToR issued by SEIAA – TN and Standard ToR
Published by MoEF & CC.
1.7.1 Regulatory Compliance & Applicable Laws/Regulations
▪ Application for Quarrying Lease as per Tamil Nadu Minor Mineral Concession Rules, 1959
▪ Obtained Precise Area Communication Letter as per Tamil Nadu Minor Mineral Concession Rules, 1959
for Preparation of Mining Plan and obtaining Environmental Clearance
▪ The Mining Plan of Rough Stone and Gravel quarry has been approved under Rule 41 & 42 as amended of
Tamil Nadu Minor Mineral Concession Rules, 1959
▪ ToR from SEIAA - TN for the project was granted on 17.02.2021
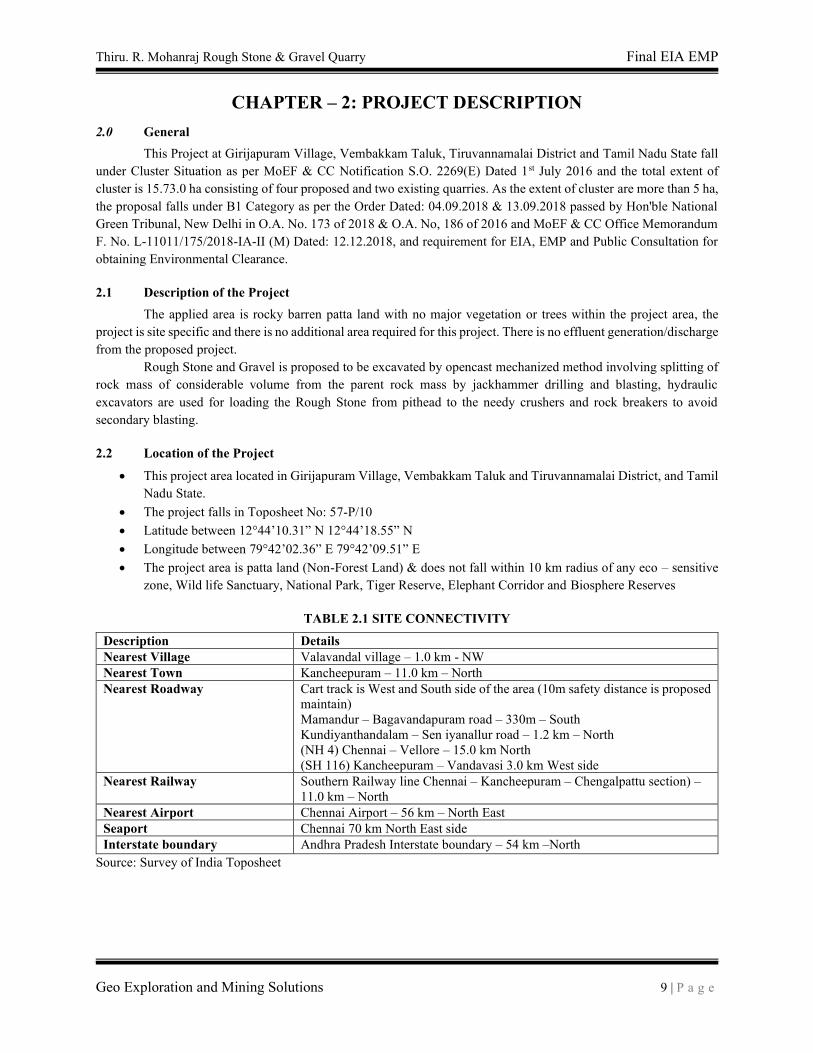
Thiru. R. Mohanraj Rough Stone & Gravel Quarry Final EIA EMP
Geo Exploration and Mining Solutions 9 | P a g e
CHAPTER – 2: PROJECT DESCRIPTION
2.0 General
This Project at Girijapuram Village, Vembakkam Taluk, Tiruvannamalai District and Tamil Nadu State fall
under Cluster Situation as per MoEF & CC Notification S.O. 2269(E) Dated 1st July 2016 and the total extent of
cluster is 15.73.0 ha consisting of four proposed and two existing quarries. As the extent of cluster are more than 5 ha,
the proposal falls under B1 Category as per the Order Dated: 04.09.2018 & 13.09.2018 passed by Hon'ble National
Green Tribunal, New Delhi in O.A. No. 173 of 2018 & O.A. No, 186 of 2016 and MoEF & CC Office Memorandum
F. No. L-11011/175/2018-IA-II (M) Dated: 12.12.2018, and requirement for EIA, EMP and Public Consultation for
obtaining Environmental Clearance.
2.1 Description of the Project
The applied area is rocky barren patta land with no major vegetation or trees within the project area, the
project is site specific and there is no additional area required for this project. There is no effluent generation/discharge
from the proposed project.
Rough Stone and Gravel is proposed to be excavated by opencast mechanized method involving splitting of
rock mass of considerable volume from the parent rock mass by jackhammer drilling and blasting, hydraulic
excavators are used for loading the Rough Stone from pithead to the needy crushers and rock breakers to avoid
secondary blasting.
2.2 Location of the Project
• This project area located in Girijapuram Village, Vembakkam Taluk and Tiruvannamalai District, and Tamil
Nadu State.
• The project falls in Toposheet No: 57-P/10
• Latitude between 12°44’10.31” N 12°44’18.55” N
• Longitude between 79°42’02.36” E 79°42’09.51” E
• The project area is patta land (Non-Forest Land) & does not fall within 10 km radius of any eco – sensitive
zone, Wild life Sanctuary, National Park, Tiger Reserve, Elephant Corridor and Biosphere Reserves
TABLE 2.1 SITE CONNECTIVITY
Description Details
Nearest Village Valavandal village – 1.0 km - NW
Nearest Town Kancheepuram – 11.0 km – North
Nearest Roadway Cart track is West and South side of the area (10m safety distance is proposed
maintain)
Mamandur – Bagavandapuram road – 330m – South
Kundiyanthandalam – Sen iyanallur road – 1.2 km – North
(NH 4) Chennai – Vellore – 15.0 km North
(SH 116) Kancheepuram – Vandavasi 3.0 km West side
Nearest Railway Southern Railway line Chennai – Kancheepuram – Chengalpattu section) –
11.0 km – North
Nearest Airport Chennai Airport – 56 km – North East
Seaport Chennai 70 km North East side
Interstate boundary Andhra Pradesh Interstate boundary – 54 km –North
Source: Survey of India Toposheet
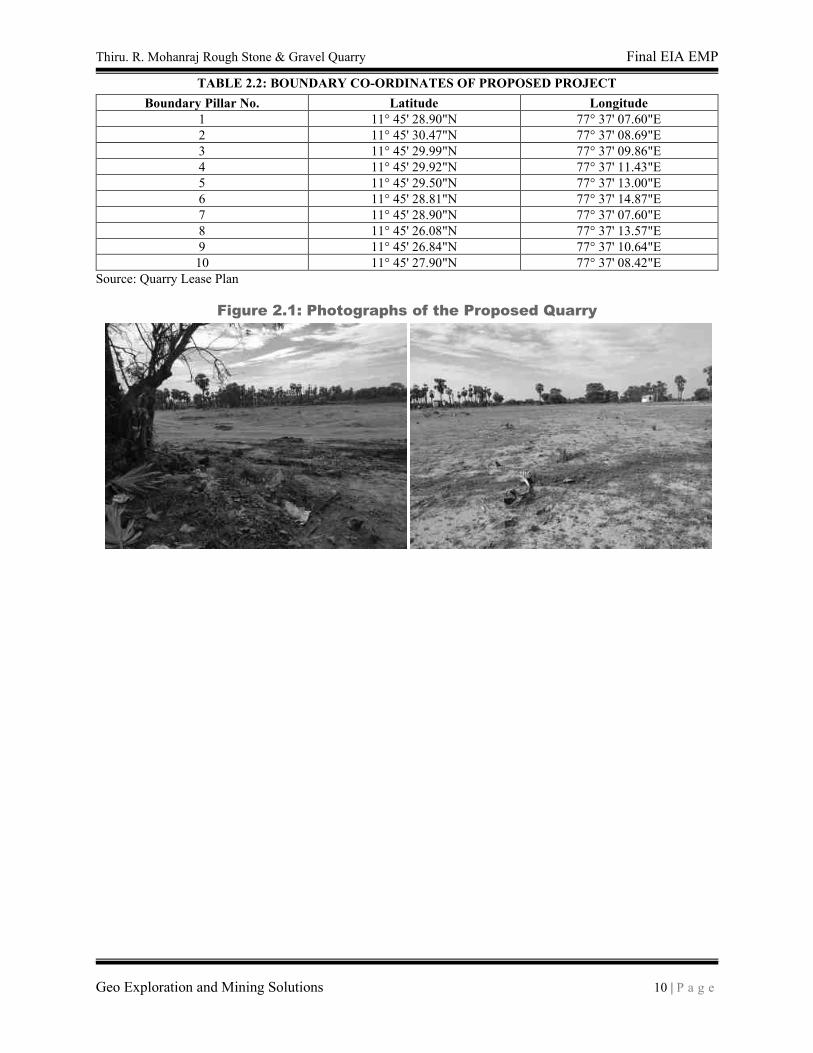
Thiru. R. Mohanraj Rough Stone & Gravel Quarry Final EIA EMP
Geo Exploration and Mining Solutions 10 | P a g e
TABLE 2.2: BOUNDARY CO-ORDINATES OF PROPOSED PROJECT
Boundary Pillar No. Latitude Longitude
1 11° 45' 28.90"N 77° 37' 07.60"E
2 11° 45' 30.47"N 77° 37' 08.69"E
3 11° 45' 29.99"N 77° 37' 09.86"E
4 11° 45' 29.92"N 77° 37' 11.43"E
5 11° 45' 29.50"N 77° 37' 13.00"E
6 11° 45' 28.81"N 77° 37' 14.87"E
7 11° 45' 28.90"N 77° 37' 07.60"E
8 11° 45' 26.08"N 77° 37' 13.57"E
9 11° 45' 26.84"N 77° 37' 10.64"E
10 11° 45' 27.90"N 77° 37' 08.42"E
Source: Quarry Lease Plan
Figure 2.1: Photographs of the Proposed Quarry
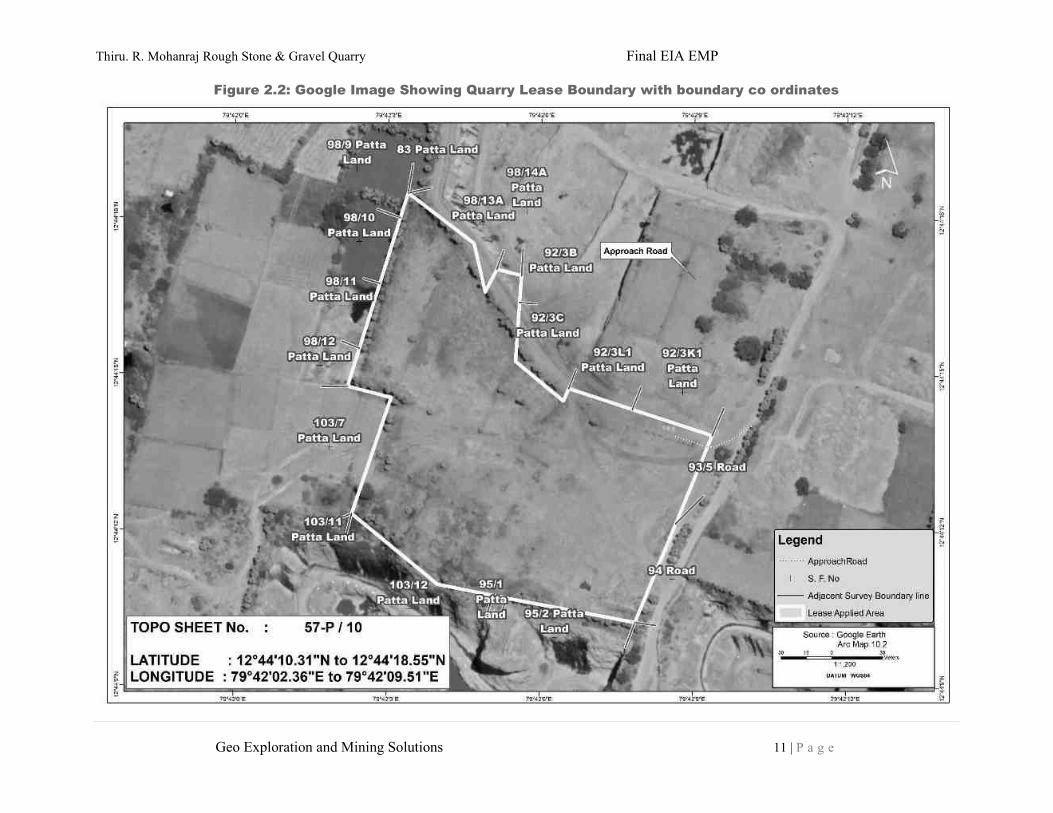
Thiru. R. Mohanraj Rough Stone & Gravel Quarry Final EIA EMP
Geo Exploration and Mining Solutions 11 | P a g e
Figure 2.2: Google Image Showing Quarry Lease Boundary with boundary co ordinates
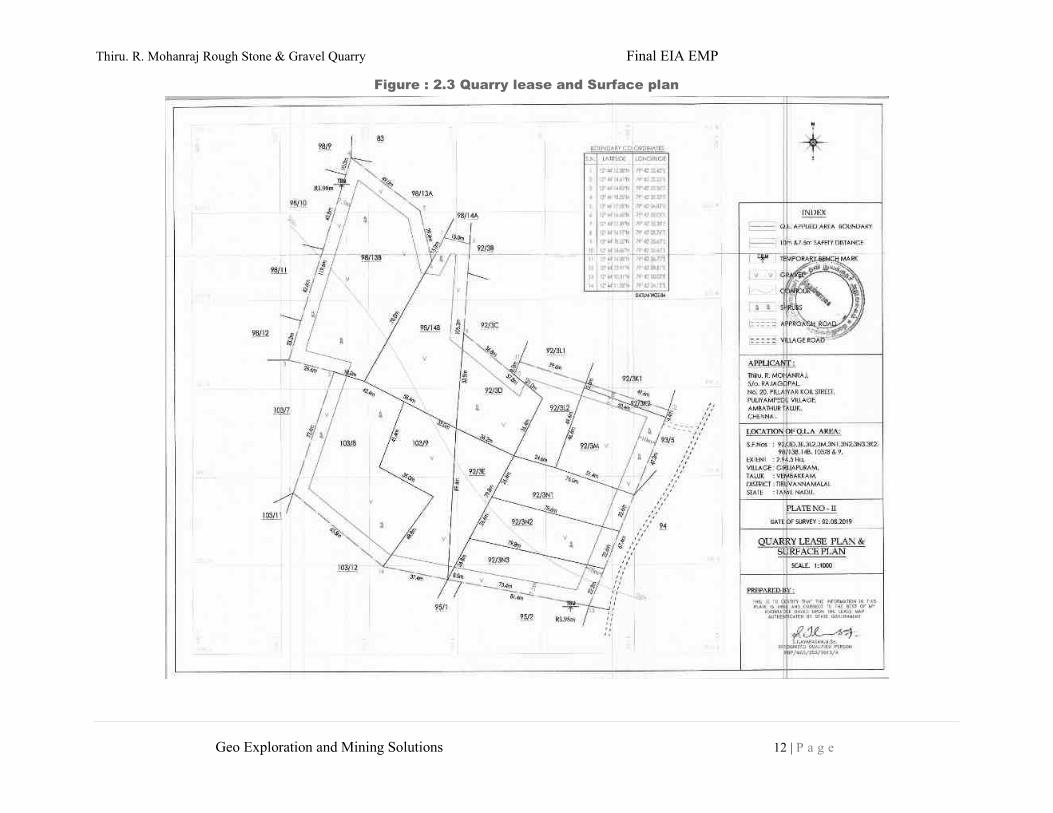
Thiru. R. Mohanraj Rough Stone & Gravel Quarry Final EIA EMP
Geo Exploration and Mining Solutions 12 | P a g e
Figure : 2.3 Quarry lease and Surface plan
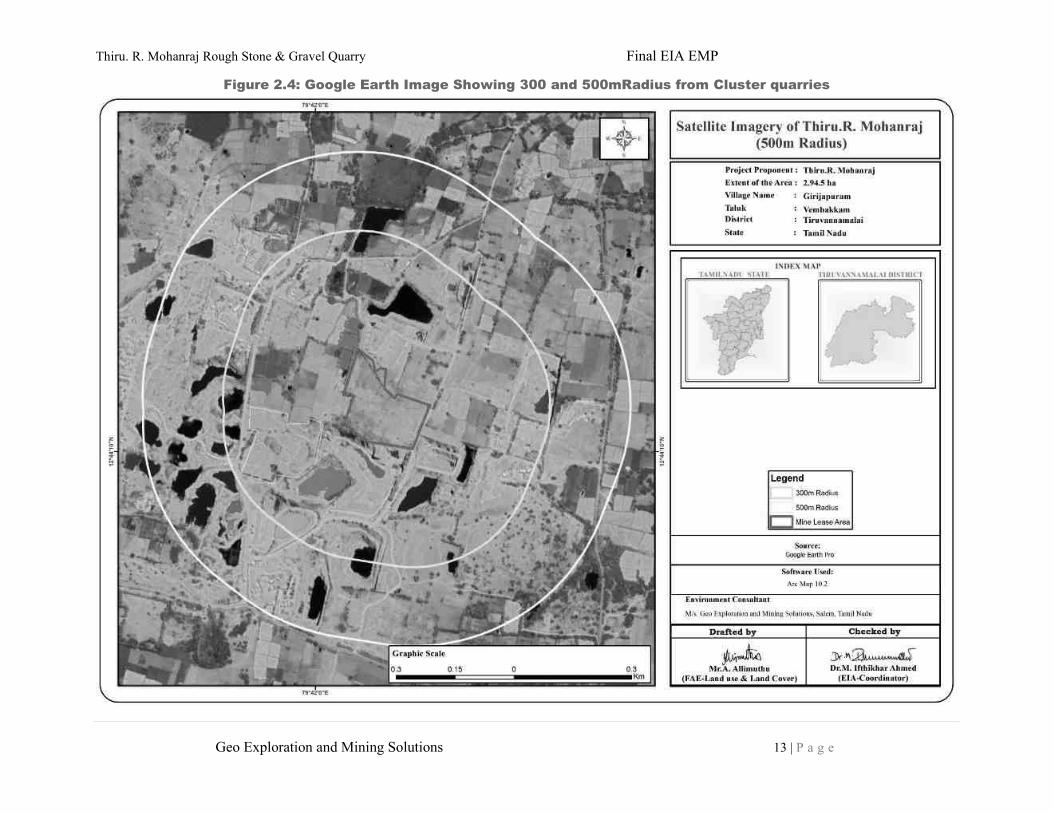
Thiru. R. Mohanraj Rough Stone & Gravel Quarry Final EIA EMP
Geo Exploration and Mining Solutions 13 | P a g e
Figure 2.4: Google Earth Image Showing 300 and 500mRadius from Cluster quarries
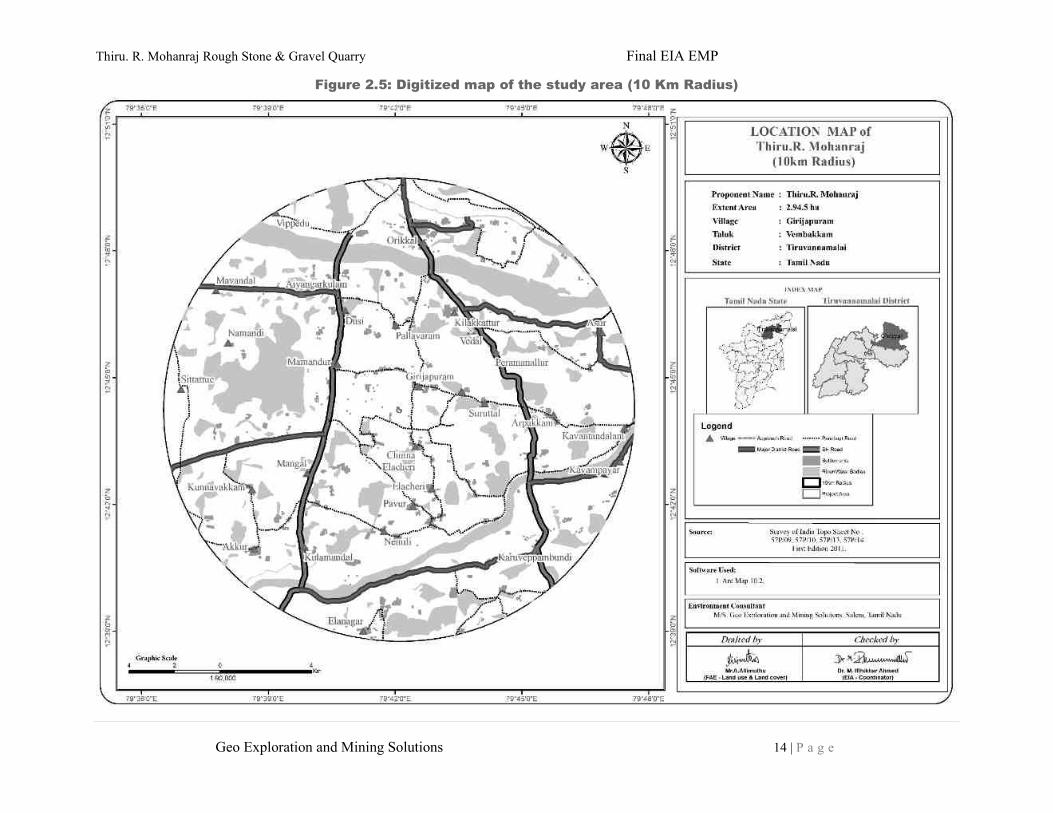
Thiru. R. Mohanraj Rough Stone & Gravel Quarry Final EIA EMP
Geo Exploration and Mining Solutions 14 | P a g e
Figure 2.5: Digitized map of the study area (10 Km Radius)
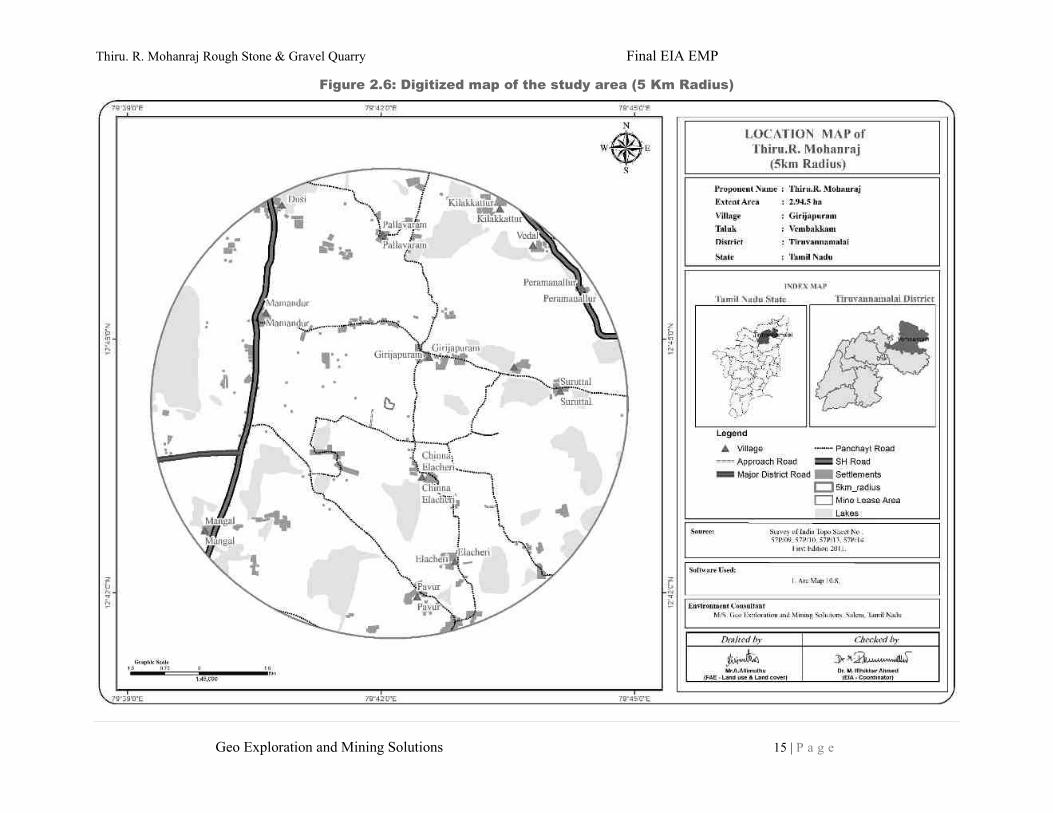
Thiru. R. Mohanraj Rough Stone & Gravel Quarry Final EIA EMP
Geo Exploration and Mining Solutions 15 | P a g e
Figure 2.6: Digitized map of the study area (5 Km Radius)
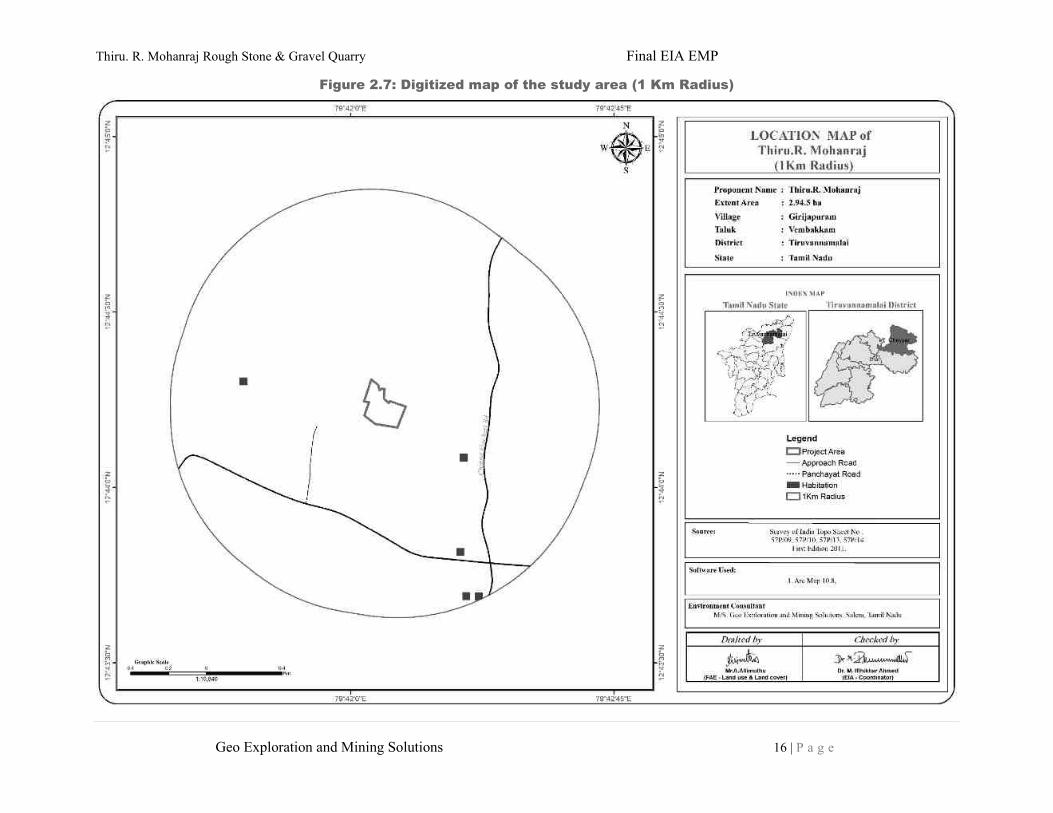
Thiru. R. Mohanraj Rough Stone & Gravel Quarry Final EIA EMP
Geo Exploration and Mining Solutions 16 | P a g e
Figure 2.7: Digitized map of the study area (1 Km Radius)
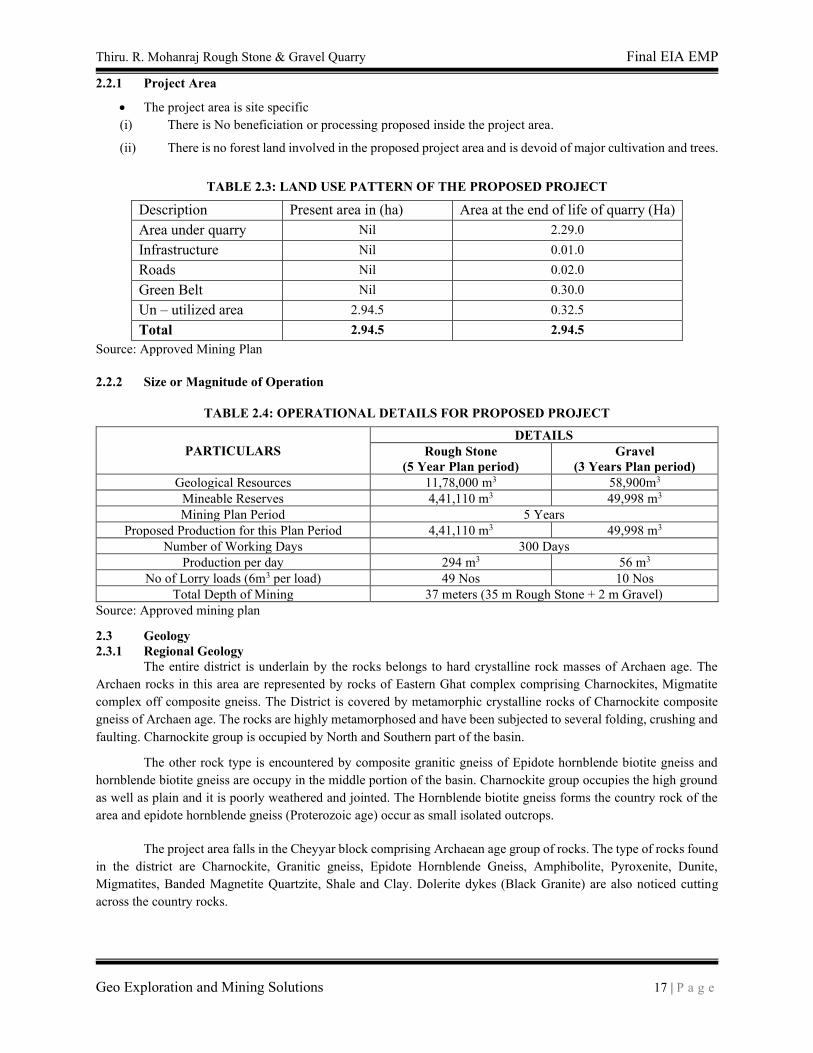
Thiru. R. Mohanraj Rough Stone & Gravel Quarry Final EIA EMP
Geo Exploration and Mining Solutions 17 | P a g e
2.2.1 Project Area
• The project area is site specific
(i) There is No beneficiation or processing proposed inside the project area.
(ii) There is no forest land involved in the proposed project area and is devoid of major cultivation and trees.
TABLE 2.3: LAND USE PATTERN OF THE PROPOSED PROJECT
Description Present area in (ha) Area at the end of life of quarry (Ha)
Area under quarry Nil 2.29.0
Infrastructure Nil 0.01.0
Roads Nil 0.02.0
Green Belt Nil 0.30.0
Un – utilized area 2.94.5 0.32.5
Total 2.94.5 2.94.5
Source: Approved Mining Plan
2.2.2 Size or Magnitude of Operation
TABLE 2.4: OPERATIONAL DETAILS FOR PROPOSED PROJECT
PARTICULARS
DETAILS
Rough Stone
(5 Year Plan period)
Gravel
(3 Years Plan period)
Geological Resources 11,78,000 m3 58,900m3
Mineable Reserves 4,41,110 m3 49,998 m3
Mining Plan Period 5 Years
Proposed Production for this Plan Period 4,41,110 m3 49,998 m3
Number of Working Days 300 Days
Production per day 294 m3 56 m3
No of Lorry loads (6m3 per load) 49 Nos 10 Nos
Total Depth of Mining 37 meters (35 m Rough Stone + 2 m Gravel)
Source: Approved mining plan
2.3 Geology
2.3.1 Regional Geology
The entire district is underlain by the rocks belongs to hard crystalline rock masses of Archaen age. The
Archaen rocks in this area are represented by rocks of Eastern Ghat complex comprising Charnockites, Migmatite
complex off composite gneiss. The District is covered by metamorphic crystalline rocks of Charnockite composite
gneiss of Archaen age. The rocks are highly metamorphosed and have been subjected to several folding, crushing and
faulting. Charnockite group is occupied by North and Southern part of the basin.
The other rock type is encountered by composite granitic gneiss of Epidote hornblende biotite gneiss and
hornblende biotite gneiss are occupy in the middle portion of the basin. Charnockite group occupies the high ground
as well as plain and it is poorly weathered and jointed. The Hornblende biotite gneiss forms the country rock of the
area and epidote hornblende gneiss (Proterozoic age) occur as small isolated outcrops.
The project area falls in the Cheyyar block comprising Archaean age group of rocks. The type of rocks found
in the district are Charnockite, Granitic gneiss, Epidote Hornblende Gneiss, Amphibolite, Pyroxenite, Dunite,
Migmatites, Banded Magnetite Quartzite, Shale and Clay. Dolerite dykes (Black Granite) are also noticed cutting
across the country rocks.
Thiru. R. Mohanraj Rough Stone & Gravel Quarry Final EIA EMP
Geo Exploration and Mining Solutions 18 | P a g e
Peninsular gneiss forms the oldest rock formations, in which the massive formation of Charnockite lies over
with rich accumulation of recent quaternary formation. On regional scale the Charnockite body N550E–S550W with
dip towards SE450E.
The general geological sequences of the rocks in this area are given below:
AGE FORMATION
Recent - Quaternary
Formation (Gravel)
---------Unconformity-----------
Archaean - Charnockite
Peninsular Gneiss complex Local Geology: -
The study area follows the regional trend and mainly comprises of Hard Rock Formation as a homogeneous
formation / Batholith formation of Charnockite. The project area is a plain terrain, with gentle slope toward north east
and with a highest altitude of 98 m AMSL. The project area is covered with Gravel formation of 2m thickness followed
by Massive Charnockite formation.
Hydrogeology The origin, occurrence and movement of groundwater are controlled by geological setup of a terrain. During
the study it is inferred that the entire cluster area is a Hard rock terrain and the low resistance encountered at the depth
between 50 – 55m, hence it is assumed that the possibility of Ground water occurrence will be below this level and it
also proved that this hard batholith above 50m will not encounter any subsurface water.
There is a possibility of seepage water from the surface levels i.e., below 20m, this surface water will be
collected in the mine pits and later used for dust suppression and afforestation. In the geophysical study it has been
clearly inferred that the depth of the quarrying operation will not intersect the ground water table.
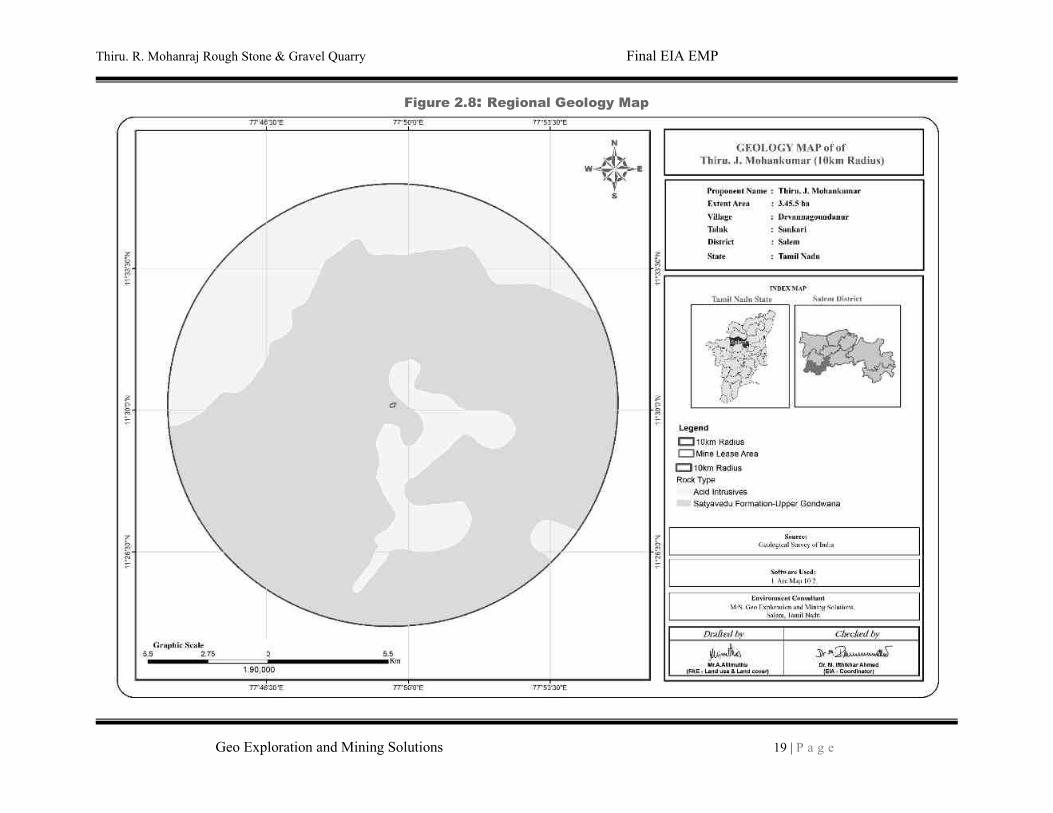
Thiru. R. Mohanraj Rough Stone & Gravel Quarry Final EIA EMP
Geo Exploration and Mining Solutions 19 | P a g e
Figure 2.8: Regional Geology Map
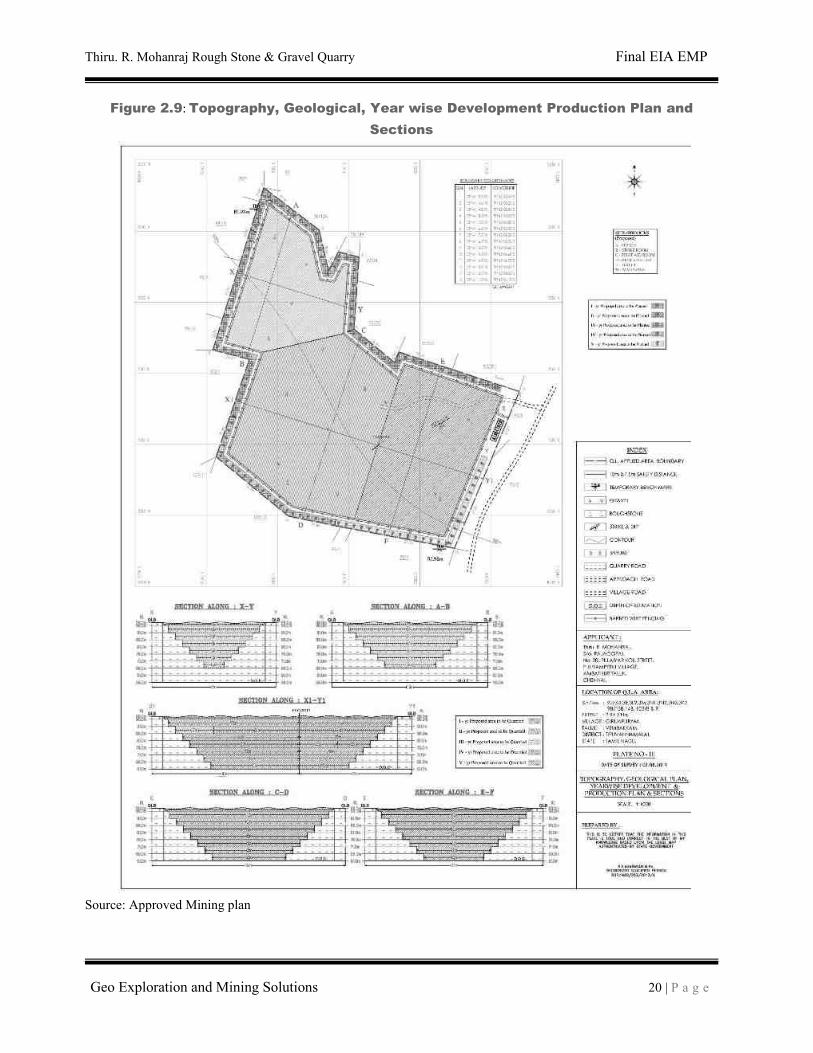
Thiru. R. Mohanraj Rough Stone & Gravel Quarry Final EIA EMP
Geo Exploration and Mining Solutions 20 | P a g e
Figure 2.9: Topography, Geological, Year wise Development Production Plan and
Sections
Source: Approved Mining plan
Thiru. R. Mohanraj Rough Stone & Gravel Quarry Final EIA EMP
Geo Exploration and Mining Solutions 21 | P a g e
2.4 Resources and Reserves
The Resources and Reserves of Rough Stone and Gravel were calculated based on Cross-Section Method by to
cover the maximum lease area.
TABLE 2.5: AVAILABLE GEOLOGICAL RESOURCES OF PROPOSED PROJECT
Geological Resources Rough Stone Gravel
11,78,000 m3 58,900m3
Mineable reserves 4,41,110 m3 49,998 m3
Source: Approved Mining Plan
Now based on the availability of Geological Resources the Mineable Reserves are calculated by considering
excavation system of bench formation and leaving essential safety distance of 7.5 m (Safety Barrier all around the applied
area) and safety distance as per precise area communication letter and deducting the locked up reserves during bench
formation (Also called as Bench Loss) and the Mineable Reserves is calculated considering there is no waste / overburden
/ side burden (100% Recovery Anticipated).
TABLE 2.6: AVAILABLE MINEABLE RESERVES OF PROPOSED PROJECT
Year Rough Stone in m3 Gravel in m3
1st year 91580 14688
2nd year 91840 22420
3rd year 93890 12880
4th year 95210 -
5th year 68590 -
Total 441110 49988
Source: Modified Reserves as per ToR
Disposal of Waste
There is no waste anticipated in this Rough Stone and Gravel quarrying operation. The entire quarried out
materials will be utilized (100%).
2.5 Method of Mining
The method of mining Opencast Mechanized Mining Method is being proposed by formation of 5.0 meter
height bench with a bench width not less than the bench height. However, as far as the quarrying of Rough Stone is
concerned, observance of the provisions of Regulation 106 (2) (b) as above is seldom possible due to various inherent
petro genetic factors coupled with mining difficulties. Hence it is proposed to obtain relaxation to the provisions of
the above regulation from the Director of Mines Safety for which necessary provision is available with the Regulation
106 (2) (b) of MMR-1961, under Mine Act – 1952.
The top layer of overburden (Gravel) will be Excavate directly by Hydraulic Excavators and loaded into
tippers directly and sold to needy customers. The Rough Stone is a batholith formation and the splitting of rock mass
of considerable volume from the parent rock mass will be carried out by deploying jackhammer drilling and Slurry
Explosives will be used for blasting. Hydraulic Excavators attached with Rock Breakers unit will be deployed for
breaking large boulders to required fragmented sizes to avoid secondary blasting and hydraulic excavators attached
with bucket unit will be deployed for loading the Rough Stone into the tippers and then the stone is transported from
pithead to the nearby crushers.
Thiru. R. Mohanraj Rough Stone & Gravel Quarry Final EIA EMP
Geo Exploration and Mining Solutions 22 | P a g e
2.5.1 Drilling & Blasting Parameters
Drilling & Blasting will be carried out as per parameters given below: -
Spacing – 1.2m
Burden – 1.0 m
Depth of hole – 1.5 m
Charge per hole – 0.50 – 0.75kg
Powder factor – 6.0 tonnes/kg
Diameter of hole – 32 mm
No of Holes to be drilled per day: -
Volume of Rough Stone will be excavated from one hole = 3 Tonnes
Total Volume = 4,41,110 m3
= 4,41,110/5
= 88,222/300
= 294 m3 * 2.6 (Specific Gravity)
= 765 Tonnes per day
Therefore, Number of Holes per day = 816/3
= 255 Holes per day
Type of Explosives to be used –
Slurry explosives (An explosive material containing substantial portions of a liquid, oxidizers, and fuel, plus
a thickener), NONEL / Electric Detonator & Detonating Fuse
Storage of Explosives –
No proposal for storage of explosives within the project area, the proponent has made agreement with
authorized explosives agencies for carrying out blasting activities and competent person as per DGMS guidelines will
be employed for safety and supervision of overall quarrying activities.
The explosives will be sourced from the blasting agency on daily basis and the blasting will be carried out
under the supervision of competent qualified Blaster and it will be ensured that there shall be no balance of explosive
stock; any balance stock will be taken back by the supplier.
2.5.3 Extent of Mechanization
TABLE 2.7 MACHINERY DETAILS FOR PROPOSED PROJECTS
S.NO. TYPE NOS SIZE/CAPACITY MOTIVE POWER
1 Jack hammers 10 1.2m to 2.0m Compressed air
2 Compressor 3 50 HP Diesel Drive
3 Excavator 2 150-200 HP Diesel Drive
4 Tippers / Dumpers 4 20 Tonnes Diesel Drive
Source: Approved Mining Plan
2.6 General Features
2.6.1 Existing Infrastructures Infrastructures like Mine office, Temporary Rest shelters for workers, Latrine and Urinal Facilities will be
constructed as per the Mine Rule after the grant of quarry lease in the proposed quarries.
2.6.2 Drainage Pattern
The general drainage pattern of the area is dendritic. There are no streams, canals or water bodies crossing
within the project area, hence there is no requirement of stream or canals diversion in the near future.
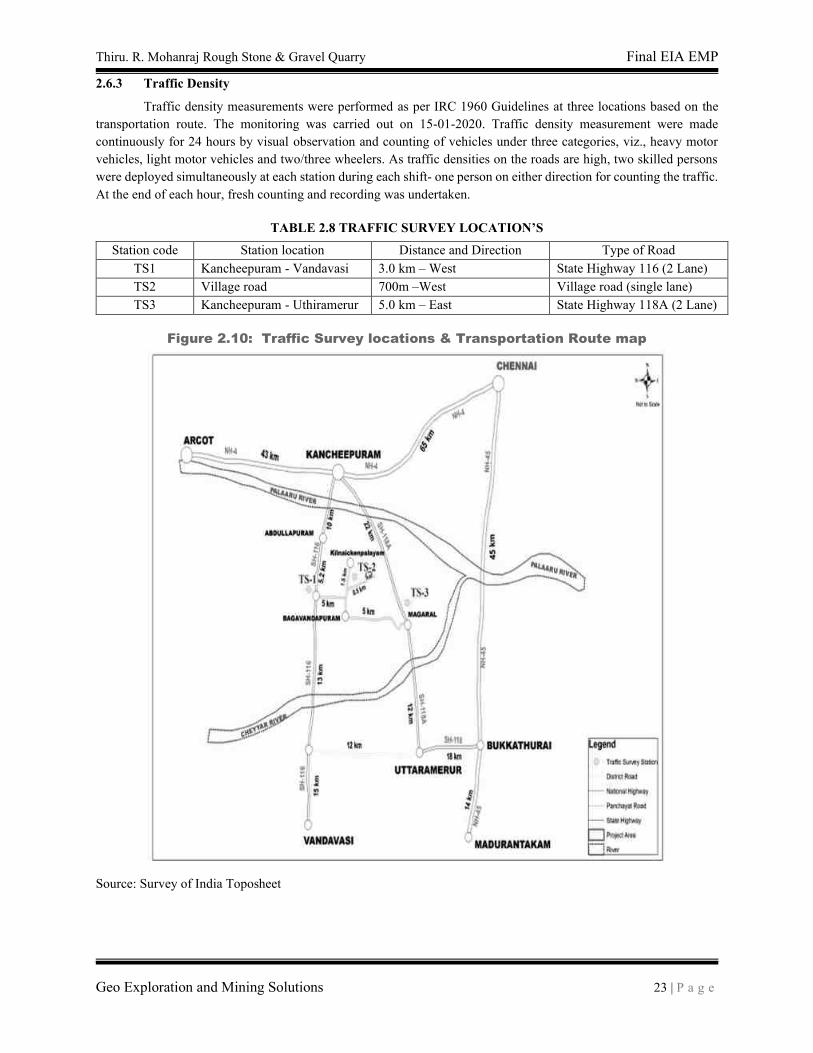
Thiru. R. Mohanraj Rough Stone & Gravel Quarry Final EIA EMP
Geo Exploration and Mining Solutions 23 | P a g e
2.6.3 Traffic Density
Traffic density measurements were performed as per IRC 1960 Guidelines at three locations based on the
transportation route. The monitoring was carried out on 15-01-2020. Traffic density measurement were made
continuously for 24 hours by visual observation and counting of vehicles under three categories, viz., heavy motor
vehicles, light motor vehicles and two/three wheelers. As traffic densities on the roads are high, two skilled persons
were deployed simultaneously at each station during each shift- one person on either direction for counting the traffic.
At the end of each hour, fresh counting and recording was undertaken.
TABLE 2.8 TRAFFIC SURVEY LOCATION’S
Station code Station location Distance and Direction Type of Road
TS1 Kancheepuram - Vandavasi 3.0 km – West State Highway 116 (2 Lane)
TS2 Village road 700m –West Village road (single lane)
TS3 Kancheepuram - Uthiramerur 5.0 km – East State Highway 118A (2 Lane)
Figure 2.10: Traffic Survey locations & Transportation Route map
Source: Survey of India Toposheet
Thiru. R. Mohanraj Rough Stone & Gravel Quarry Final EIA EMP
Geo Exploration and Mining Solutions 24 | P a g e
TABLE 2.9 EXISTING TRAFFIC VOLUME
Station
code HMV (Hourly Average) LMV hourly average 2/3 Hourly average Total PCU
per hour No PCU No PCU No PCU
TS1 51 153 65 65 128 64 282
TS2 16 48 10 10 24 12 70
TS3 47 141 74 74 145 87 302
Source: On-site monitoring by GEMS FAE & TM
• PCU conversion factor for HMV (Trucks and Bus) = 3, LMV (Car, Jeep and Auto) = 1 and 0.5 for Motor Vehicles
(2/3 Wheelers)
Transportation of Rough stone and Gravel per day = 52 Loads ie., 7 Trips per hour
(7 Volume in PCU)
TABLE 2.10 SUMMARY OF TRAFFIC VOLUME
Route
Existing
traffic value in
PCU
Incremental traffic
from the quarry in
PCU
Total
traffic
volume
Hourly Capacity in
PCU as per IRC
guidelines
Kancheepuram – Vandavasi 282 7 289 1500
Village road 70 7 77 500
Kancheepuram – Uttiramerur 302 7 309 1500
Source: On-site monitoring analysis summary by GEMS FAE & TM
As per the IRC 1960 this existing road can handle 1,200 PCU in hour and Major district road can handle
1500 PCU in hour hence there will not be any conjunction due to this transportation.
2.6.3 Mineral Beneficiation and Processing
There is no proposal for the mineral processing or ore beneficiation in these projects
2.7 Project Requirement
2.7.1 Water Source & Requirement
Detail of Total water requirements in KLD as given below:
TABLE 2.11 WATER REQUIREMENT
*Purpose Quantity Source
Dust Suppression 1.3 KLD Rainwater accumulated in Mine Pit/ Water Tanker
Green Belt development 1.5 KLD Rainwater accumulated in Mine Pit/ Water Tanker
Domestic purpose 0.7 KLD Water Tankers
Total 3.5 KLD
Source: Prefeasibility report
* Drinking water will be sourced from Approved Water Vendors
Thiru. R. Mohanraj Rough Stone & Gravel Quarry Final EIA EMP
Geo Exploration and Mining Solutions 25 | P a g e
2.7.2 Power and Other Infrastructure Requirement
The project does not require power supply for the mining operations. The quarrying activity is proposed
during day time only (General Shift 8 AM – 5 PM, Lunch Break 1 PM – 2 PM). Electricity for use in office and other
internal infrastructure will be obtained from SEB.
No workshops are proposed inside the project area hence there will not be any process effluent generation
from the project area. Domestic effluent from the mine office will be discharged to septic tank and soak pit. There is
no toxic effluent expected to generate in the form of solid, liquid or gaseous form hence there is no requirement of
waste treatment plant.
2.7.3 Fuel Requirement
High speed Diesel (HSD) will be used for mining machineries. Diesel will be brought from nearby Fuel
Stations.
1. For Gravel:
Per hour Excavator will consume = 10 liters / hour
Per hour Excavator will excavate = 60m3 of Gravel
For 49988m3 = 49988/60
= 833 hours
Diesel consume 833 working hours = 833 hours x 10 liters
Total diesel consumption = 8330 Liters of HSD will be utilized for Gravel
2. For Rough stone:
Per hour Excavator will consume = 16 liters / hour
Per hour Excavator will excavate = 20m3 of Rough stone
For 441110m3 = 441110/20
= 23535 hours
Diesel consume 23535 working hours = 23535 hours x 16 liters
Total diesel consumption = 352880 Liters of HSD will be utilized for Rough stone
Total diesel consumption is around = 3,52,880 Liters of HSD for the entire period of life.
2.7.4 Employment Requirement:
The skilled, competent qualified statutory persons will be engaged for quarrying operation, preference will be given to the local community.
TABLE 2.12: EMPLOYMENT POTENTIAL
Skilled labour Mine Foreman 1
Blaster/Mate 1
Excavator – Operator & Driver 6
Jack Hammer Operators 20
Semi – skilled
Security 1
Unskilled
Labour & Helper 3
Cleaner and Co-Operator 6
Total 38
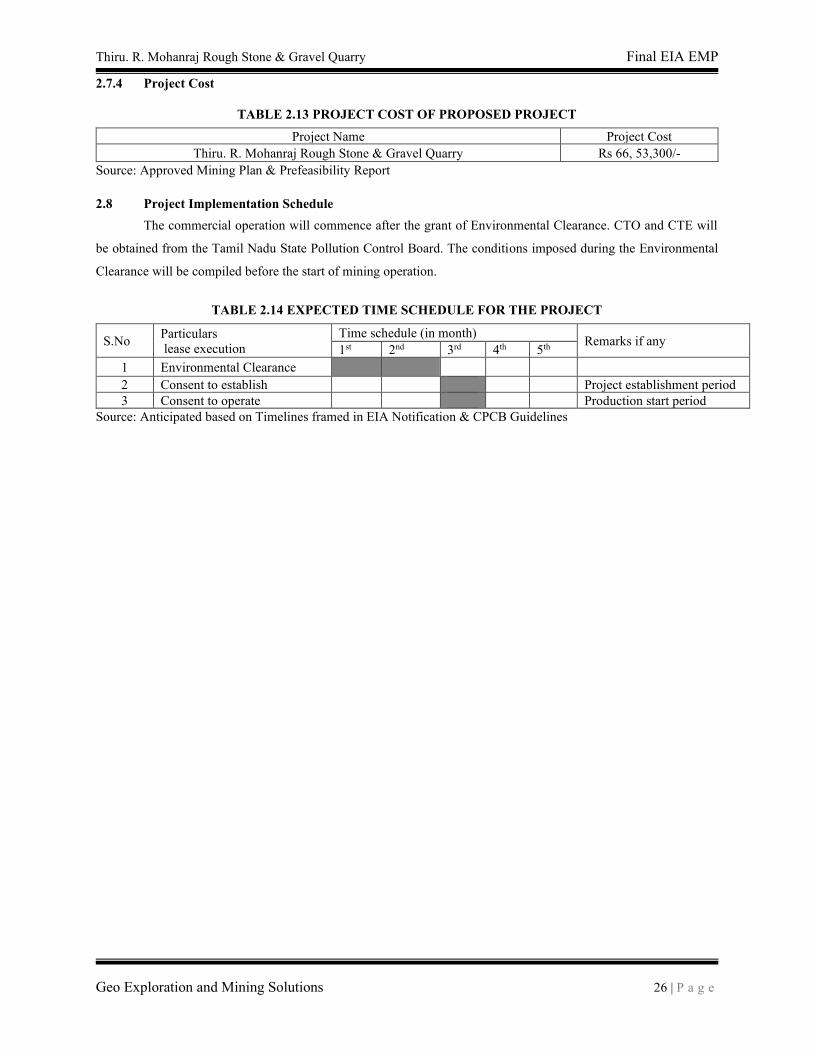
Thiru. R. Mohanraj Rough Stone & Gravel Quarry Final EIA EMP
Geo Exploration and Mining Solutions 26 | P a g e
2.7.4 Project Cost
TABLE 2.13 PROJECT COST OF PROPOSED PROJECT
Project Name Project Cost
Thiru. R. Mohanraj Rough Stone & Gravel Quarry Rs 66, 53,300/-
Source: Approved Mining Plan & Prefeasibility Report
2.8 Project Implementation Schedule
The commercial operation will commence after the grant of Environmental Clearance. CTO and CTE will
be obtained from the Tamil Nadu State Pollution Control Board. The conditions imposed during the Environmental
Clearance will be compiled before the start of mining operation.
TABLE 2.14 EXPECTED TIME SCHEDULE FOR THE PROJECT
S.No Particulars
lease execution
Time schedule (in month) Remarks if any
1st 2nd 3rd 4th 5th
1 Environmental Clearance
2 Consent to establish Project establishment period
3 Consent to operate Production start period
Source: Anticipated based on Timelines framed in EIA Notification & CPCB Guidelines
Thiru. R. Mohanraj Rough Stone & Gravel Quarry Final EIA EMP
Geo Exploration and Mining Solutions 27 | P a g e
CHAPTER – 3: DESCRIPTION OF ENVIRONMENT
3.0 General
This chapter presents a regional background to the baseline data at the very onset, which will help in better
appreciation of micro-level field data, generated on several environmental and ecological attributes of the study area.
The baseline status of the project environment is described section wise for better understanding of the broad-spectrum
conditions. The baseline environment quality represents the background environmental scenario of various
environmental components such as Land, Water, Air, Noise, Biological and Socio-economic status of the study area.
Field monitoring studies to evaluate the base line status of the project site were carried out during the Winter Season
(02.12.2019 to 25.02.2020) with CPCB guidelines. Environmental data has been collected with reference to proposed
mine by OMEGAA LABORATORIES ISO 9001: 2008, OHSAS 18001: 2007 Certified & MoEF Notified Laboratory,
for the below attributes –
o Land
o Water
o Air
o Noise
o Biological
o Socio-economic status
Study Area
An area of 10 km radius (aerial distance) from the periphery of the cluster is considered for EIA study. The
data collection has been used to understand the existing environment scenario around the cluster against which the
potential impacts of the project can be assessed. The study area has been divided into two zones viz core zone and
buffer zone where core zone is considered as cluster and buffer zone taken as 10km radius from the periphery of the
Cluster. Both Core zone and Buffer zone is taken as the study area.
Study Period
The baseline study was conducted during the Winter Season i.e., December 2019 – February 2020
Study Methodology
1. The project area was surveyed in detail with the help of Total Station survey instrument and the boundary
pillars were picked up with the help of handheld GPS. The boundary coordinates were superimposed on the
satellite imagery to understand the relief of the area, besides Land use pattern of the area was studied through
the Bhuvan (ISRO).
2. Soil samples were collected and analysed for relevant physico-chemical characteristics, exchangeable
cations, nutrients & micro nutrients etc., in order to assess the impact of mining activities and proposed
greenbelt development
3. Ground water samples were collected during the study period from the open wells and bore wells, while
surface water was collected from river and lake in the buffer zone. The samples were analysed for parameters
necessary to determine water quality (based on IS: 10500:2012 criteria) and those which are relevant from
the point of view of environmental impact of the proposed quarries.
4. A meteorological station was setup in cluster area, to collect data about Wind speed, Wind direction, Dry and
wet bulb temperature, Relative humidity, Rainfall with cloud cover and general weather conditions were
recorded throughout the study period.
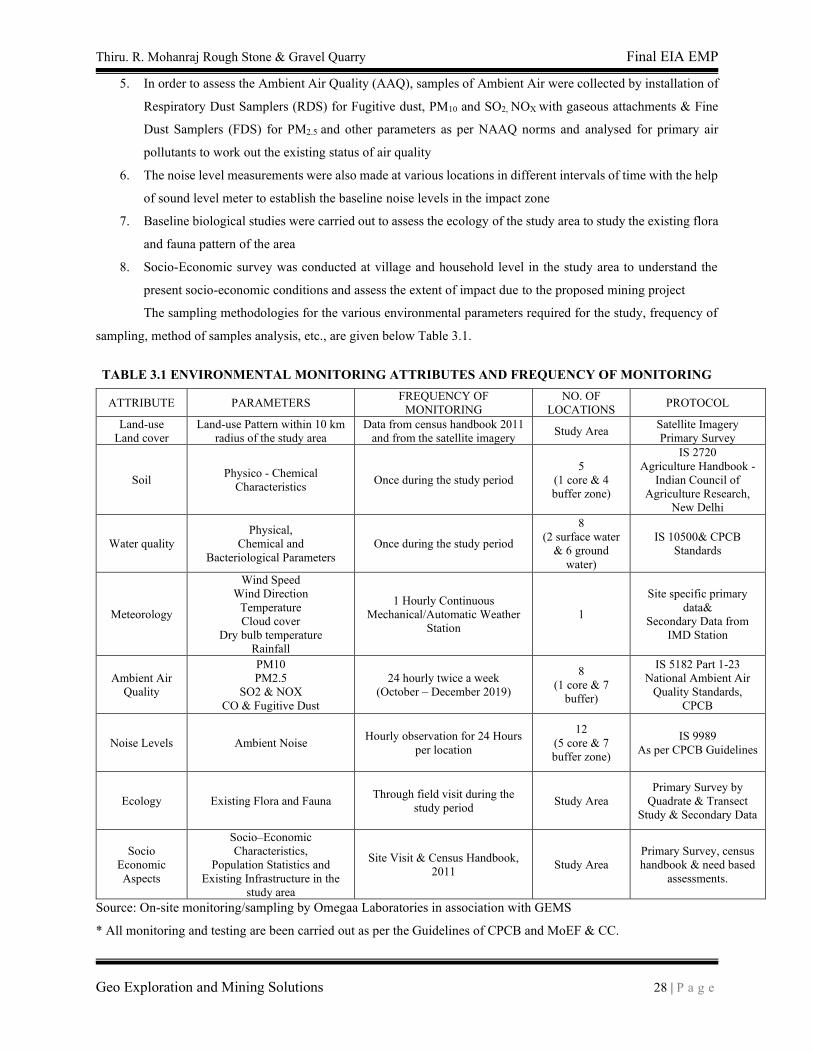
Thiru. R. Mohanraj Rough Stone & Gravel Quarry Final EIA EMP
Geo Exploration and Mining Solutions 28 | P a g e
5. In order to assess the Ambient Air Quality (AAQ), samples of Ambient Air were collected by installation of
Respiratory Dust Samplers (RDS) for Fugitive dust, PM10 and SO2, NOX with gaseous attachments & Fine
Dust Samplers (FDS) for PM2.5 and other parameters as per NAAQ norms and analysed for primary air
pollutants to work out the existing status of air quality
6. The noise level measurements were also made at various locations in different intervals of time with the help
of sound level meter to establish the baseline noise levels in the impact zone
7. Baseline biological studies were carried out to assess the ecology of the study area to study the existing flora
and fauna pattern of the area
8. Socio-Economic survey was conducted at village and household level in the study area to understand the
present socio-economic conditions and assess the extent of impact due to the proposed mining project
The sampling methodologies for the various environmental parameters required for the study, frequency of
sampling, method of samples analysis, etc., are given below Table 3.1.
TABLE 3.1 ENVIRONMENTAL MONITORING ATTRIBUTES AND FREQUENCY OF MONITORING
ATTRIBUTE PARAMETERS FREQUENCY OF
MONITORING
NO. OF
LOCATIONS PROTOCOL
Land-use
Land cover
Land-use Pattern within 10 km
radius of the study area
Data from census handbook 2011
and from the satellite imagery Study Area
Satellite Imagery
Primary Survey
Soil Physico - Chemical
Characteristics Once during the study period
5
(1 core & 4
buffer zone)
IS 2720
Agriculture Handbook -
Indian Council of
Agriculture Research,
New Delhi
Water quality
Physical,
Chemical and
Bacteriological Parameters
Once during the study period
8
(2 surface water
& 6 ground
water)
IS 10500& CPCB
Standards
Meteorology
Wind Speed
Wind Direction
Temperature
Cloud cover
Dry bulb temperature
Rainfall
1 Hourly Continuous
Mechanical/Automatic Weather
Station
1
Site specific primary
data&
Secondary Data from
IMD Station
Ambient Air
Quality
PM10
PM2.5
SO2 & NOX
CO & Fugitive Dust
24 hourly twice a week
(October – December 2019)
8
(1 core & 7
buffer)
IS 5182 Part 1-23
National Ambient Air
Quality Standards,
CPCB
Noise Levels Ambient Noise Hourly observation for 24 Hours
per location
12
(5 core & 7
buffer zone)
IS 9989
As per CPCB Guidelines
Ecology Existing Flora and Fauna Through field visit during the
study period Study Area
Primary Survey by
Quadrate & Transect
Study & Secondary Data
Socio
Economic
Aspects
Socio–Economic
Characteristics,
Population Statistics and
Existing Infrastructure in the
study area
Site Visit & Census Handbook,
2011 Study Area
Primary Survey, census
handbook & need based
assessments.
Source: On-site monitoring/sampling by Omegaa Laboratories in association with GEMS
* All monitoring and testing are been carried out as per the Guidelines of CPCB and MoEF & CC.
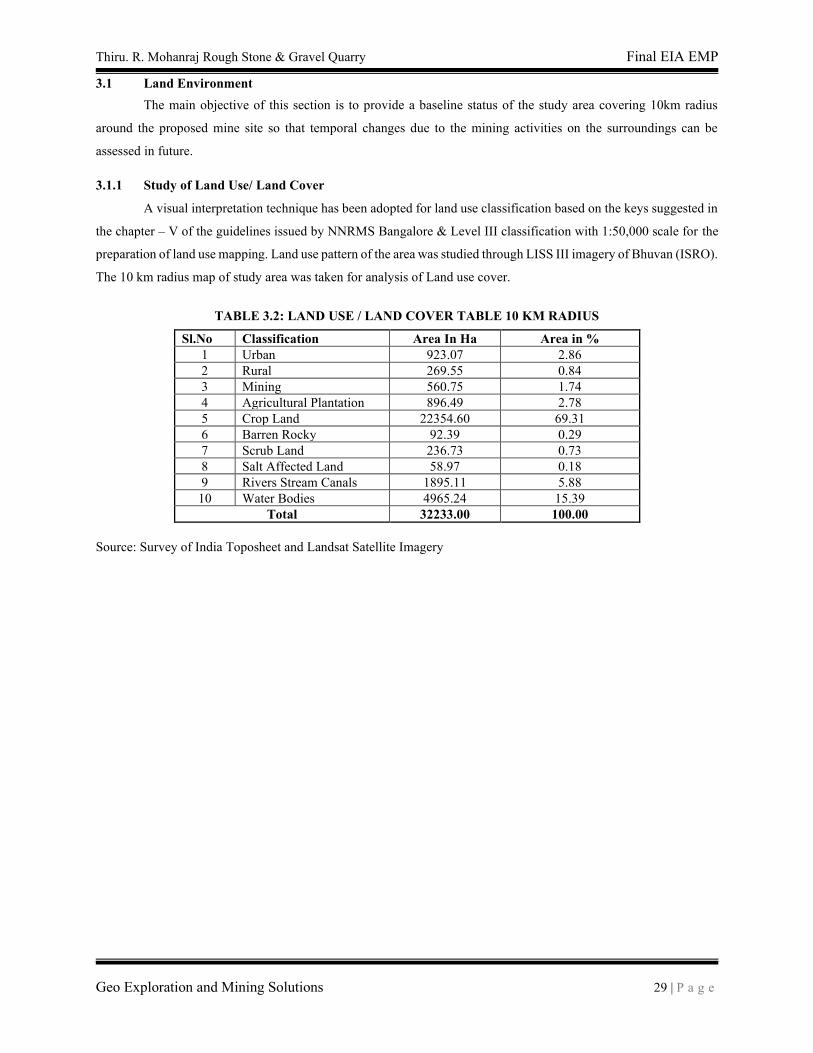
Thiru. R. Mohanraj Rough Stone & Gravel Quarry Final EIA EMP
Geo Exploration and Mining Solutions 29 | P a g e
3.1 Land Environment
The main objective of this section is to provide a baseline status of the study area covering 10km radius
around the proposed mine site so that temporal changes due to the mining activities on the surroundings can be
assessed in future.
3.1.1 Study of Land Use/ Land Cover
A visual interpretation technique has been adopted for land use classification based on the keys suggested in
the chapter – V of the guidelines issued by NNRMS Bangalore & Level III classification with 1:50,000 scale for the
preparation of land use mapping. Land use pattern of the area was studied through LISS III imagery of Bhuvan (ISRO).
The 10 km radius map of study area was taken for analysis of Land use cover.
TABLE 3.2: LAND USE / LAND COVER TABLE 10 KM RADIUS
Sl.No Classification Area In Ha Area in %
1 Urban 923.07 2.86
2 Rural 269.55 0.84
3 Mining 560.75 1.74
4 Agricultural Plantation 896.49 2.78
5 Crop Land 22354.60 69.31
6 Barren Rocky 92.39 0.29
7 Scrub Land 236.73 0.73
8 Salt Affected Land 58.97 0.18
9 Rivers Stream Canals 1895.11 5.88
10 Water Bodies 4965.24 15.39
Total 32233.00 100.00
Source: Survey of India Toposheet and Landsat Satellite Imagery
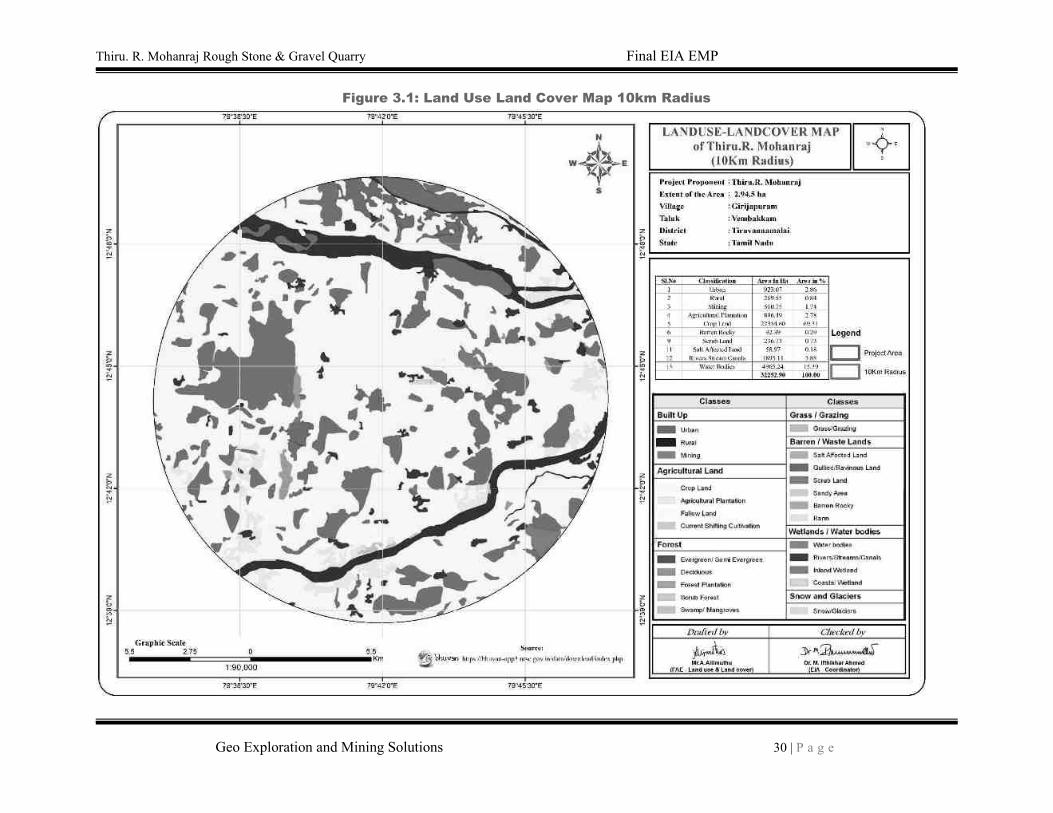
Thiru. R. Mohanraj Rough Stone & Gravel Quarry Final EIA EMP
Geo Exploration and Mining Solutions 30 | P a g e
Figure 3.1: Land Use Land Cover Map 10km Radius
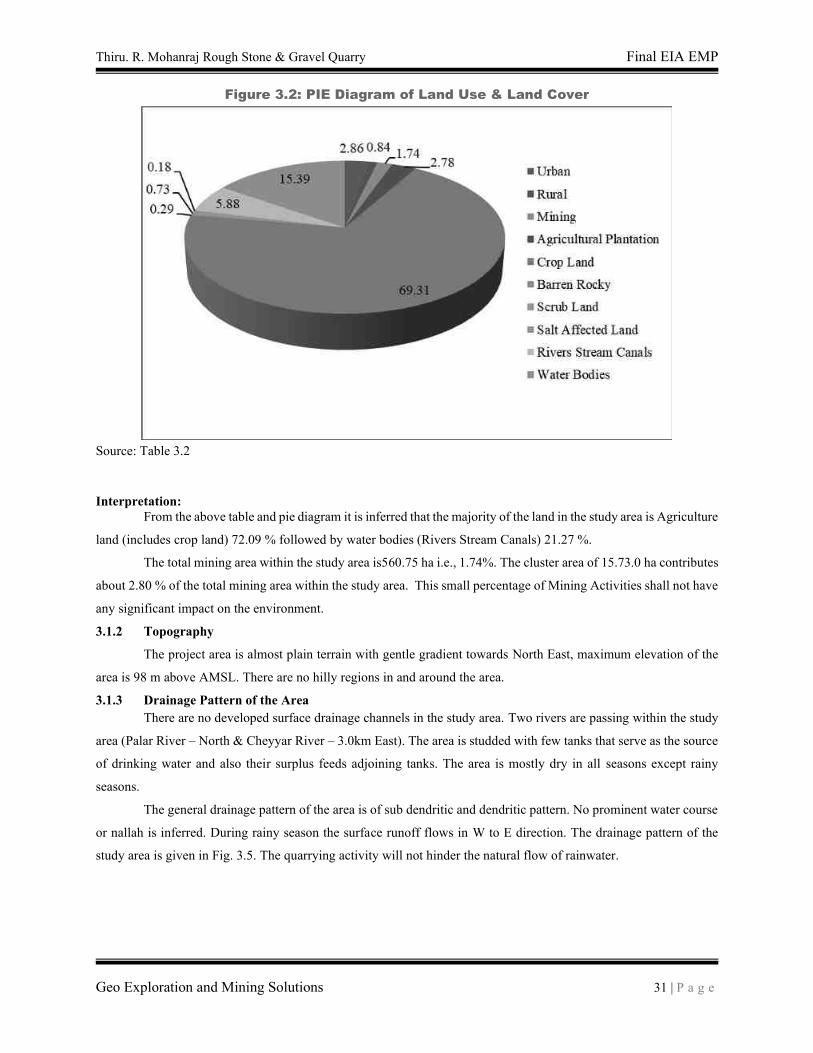
Thiru. R. Mohanraj Rough Stone & Gravel Quarry Final EIA EMP
Geo Exploration and Mining Solutions 31 | P a g e
Figure 3.2: PIE Diagram of Land Use & Land Cover
Source: Table 3.2
Interpretation:
From the above table and pie diagram it is inferred that the majority of the land in the study area is Agriculture
land (includes crop land) 72.09 % followed by water bodies (Rivers Stream Canals) 21.27 %.
The total mining area within the study area is560.75 ha i.e., 1.74%. The cluster area of 15.73.0 ha contributes
about 2.80 % of the total mining area within the study area. This small percentage of Mining Activities shall not have
any significant impact on the environment.
3.1.2 Topography
The project area is almost plain terrain with gentle gradient towards North East, maximum elevation of the
area is 98 m above AMSL. There are no hilly regions in and around the area.
3.1.3 Drainage Pattern of the Area
There are no developed surface drainage channels in the study area. Two rivers are passing within the study
area (Palar River – North & Cheyyar River – 3.0km East). The area is studded with few tanks that serve as the source
of drinking water and also their surplus feeds adjoining tanks. The area is mostly dry in all seasons except rainy
seasons.
The general drainage pattern of the area is of sub dendritic and dendritic pattern. No prominent water course
or nallah is inferred. During rainy season the surface runoff flows in W to E direction. The drainage pattern of the
study area is given in Fig. 3.5. The quarrying activity will not hinder the natural flow of rainwater.
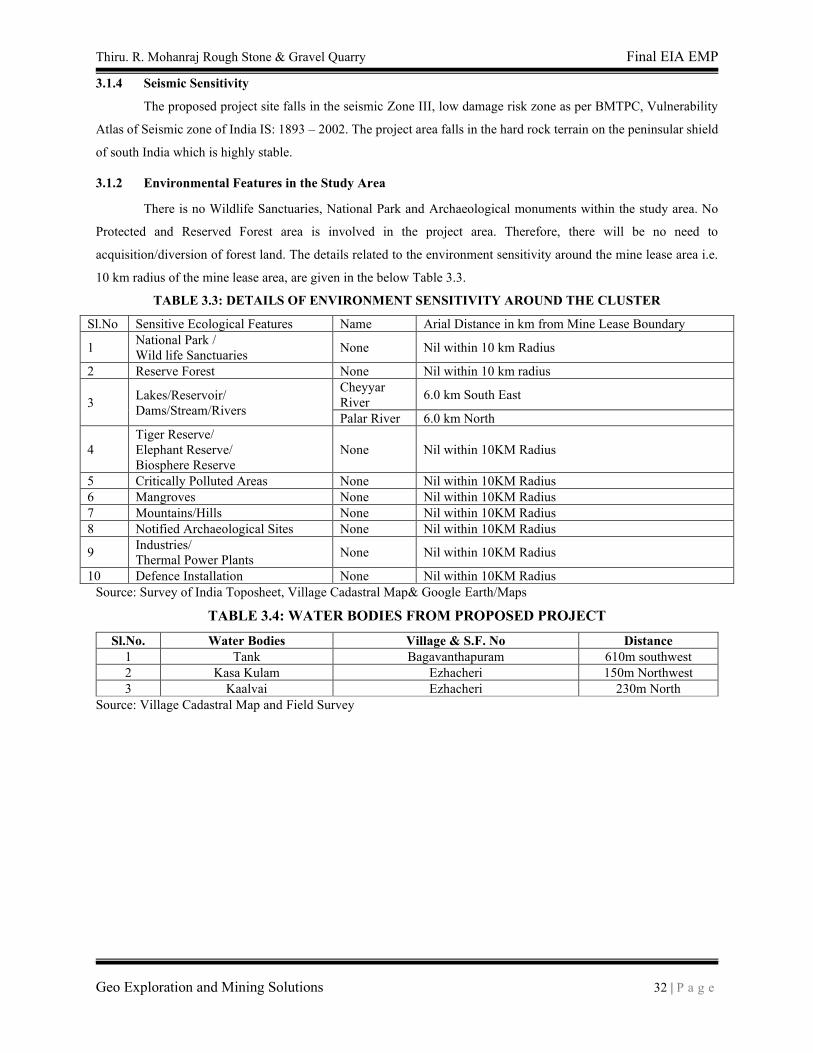
Thiru. R. Mohanraj Rough Stone & Gravel Quarry Final EIA EMP
Geo Exploration and Mining Solutions 32 | P a g e
3.1.4 Seismic Sensitivity
The proposed project site falls in the seismic Zone III, low damage risk zone as per BMTPC, Vulnerability
Atlas of Seismic zone of India IS: 1893 – 2002. The project area falls in the hard rock terrain on the peninsular shield
of south India which is highly stable.
3.1.2 Environmental Features in the Study Area
There is no Wildlife Sanctuaries, National Park and Archaeological monuments within the study area. No
Protected and Reserved Forest area is involved in the project area. Therefore, there will be no need to
acquisition/diversion of forest land. The details related to the environment sensitivity around the mine lease area i.e.
10 km radius of the mine lease area, are given in the below Table 3.3.
TABLE 3.3: DETAILS OF ENVIRONMENT SENSITIVITY AROUND THE CLUSTER
Sl.No Sensitive Ecological Features Name Arial Distance in km from Mine Lease Boundary
1 National Park /
Wild life Sanctuaries None Nil within 10 km Radius
2 Reserve Forest None Nil within 10 km radius
3 Lakes/Reservoir/
Dams/Stream/Rivers
Cheyyar
River 6.0 km South East
Palar River 6.0 km North
4
Tiger Reserve/
Elephant Reserve/
Biosphere Reserve
None Nil within 10KM Radius
5 Critically Polluted Areas None Nil within 10KM Radius
6 Mangroves None Nil within 10KM Radius
7 Mountains/Hills None Nil within 10KM Radius
8 Notified Archaeological Sites None Nil within 10KM Radius
9 Industries/
Thermal Power Plants None Nil within 10KM Radius
10 Defence Installation None Nil within 10KM Radius
Source: Survey of India Toposheet, Village Cadastral Map& Google Earth/Maps
TABLE 3.4: WATER BODIES FROM PROPOSED PROJECT
Sl.No. Water Bodies Village & S.F. No Distance
1 Tank Bagavanthapuram 610m southwest
2 Kasa Kulam Ezhacheri 150m Northwest
3 Kaalvai Ezhacheri 230m North
Source: Village Cadastral Map and Field Survey
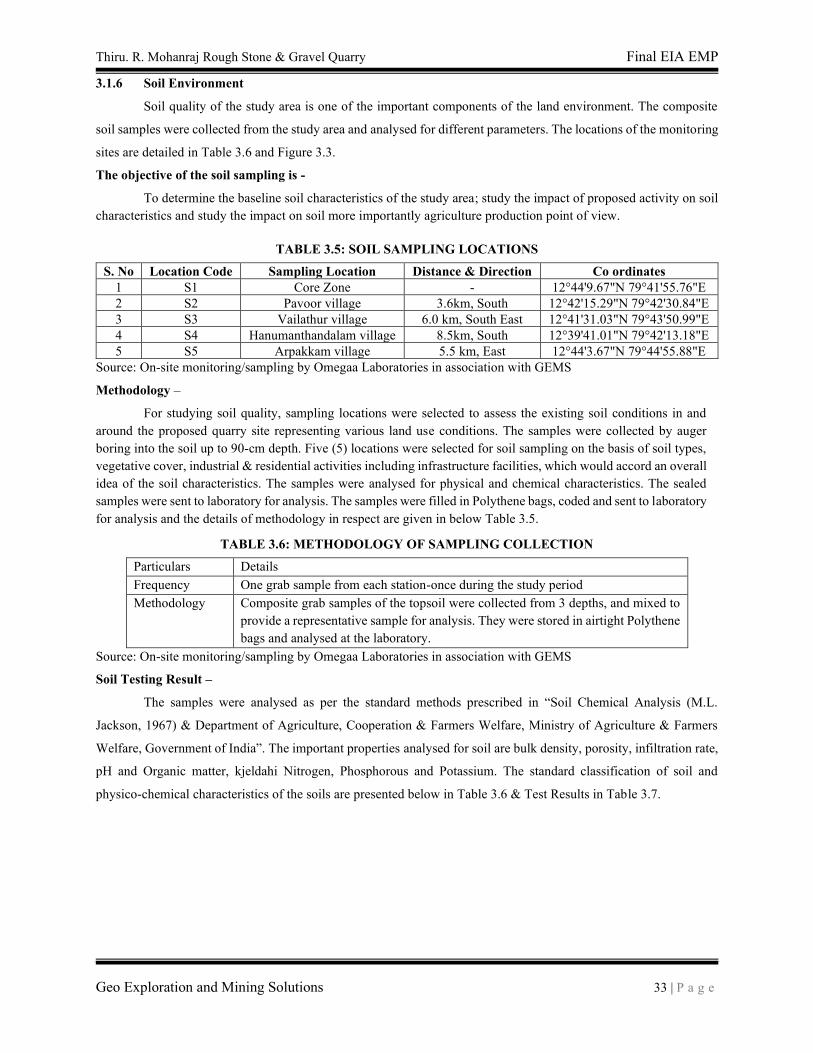
Thiru. R. Mohanraj Rough Stone & Gravel Quarry Final EIA EMP
Geo Exploration and Mining Solutions 33 | P a g e
3.1.6 Soil Environment
Soil quality of the study area is one of the important components of the land environment. The composite
soil samples were collected from the study area and analysed for different parameters. The locations of the monitoring
sites are detailed in Table 3.6 and Figure 3.3.
The objective of the soil sampling is -
To determine the baseline soil characteristics of the study area; study the impact of proposed activity on soil
characteristics and study the impact on soil more importantly agriculture production point of view.
TABLE 3.5: SOIL SAMPLING LOCATIONS
S. No Location Code Sampling Location Distance & Direction Co ordinates
1 S1 Core Zone - 12°44'9.67"N 79°41'55.76"E
2 S2 Pavoor village 3.6km, South 12°42'15.29"N 79°42'30.84"E
3 S3 Vailathur village 6.0 km, South East 12°41'31.03"N 79°43'50.99"E
4 S4 Hanumanthandalam village 8.5km, South 12°39'41.01"N 79°42'13.18"E
5 S5 Arpakkam village 5.5 km, East 12°44'3.67"N 79°44'55.88"E
Source: On-site monitoring/sampling by Omegaa Laboratories in association with GEMS
Methodology –
For studying soil quality, sampling locations were selected to assess the existing soil conditions in and
around the proposed quarry site representing various land use conditions. The samples were collected by auger
boring into the soil up to 90-cm depth. Five (5) locations were selected for soil sampling on the basis of soil types,
vegetative cover, industrial & residential activities including infrastructure facilities, which would accord an overall
idea of the soil characteristics. The samples were analysed for physical and chemical characteristics. The sealed
samples were sent to laboratory for analysis. The samples were filled in Polythene bags, coded and sent to laboratory
for analysis and the details of methodology in respect are given in below Table 3.5.
TABLE 3.6: METHODOLOGY OF SAMPLING COLLECTION
Particulars Details
Frequency One grab sample from each station-once during the study period
Methodology Composite grab samples of the topsoil were collected from 3 depths, and mixed to
provide a representative sample for analysis. They were stored in airtight Polythene
bags and analysed at the laboratory.
Source: On-site monitoring/sampling by Omegaa Laboratories in association with GEMS
Soil Testing Result –
The samples were analysed as per the standard methods prescribed in “Soil Chemical Analysis (M.L.
Jackson, 1967) & Department of Agriculture, Cooperation & Farmers Welfare, Ministry of Agriculture & Farmers
Welfare, Government of India”. The important properties analysed for soil are bulk density, porosity, infiltration rate,
pH and Organic matter, kjeldahi Nitrogen, Phosphorous and Potassium. The standard classification of soil and
physico-chemical characteristics of the soils are presented below in Table 3.6 & Test Results in Table 3.7.
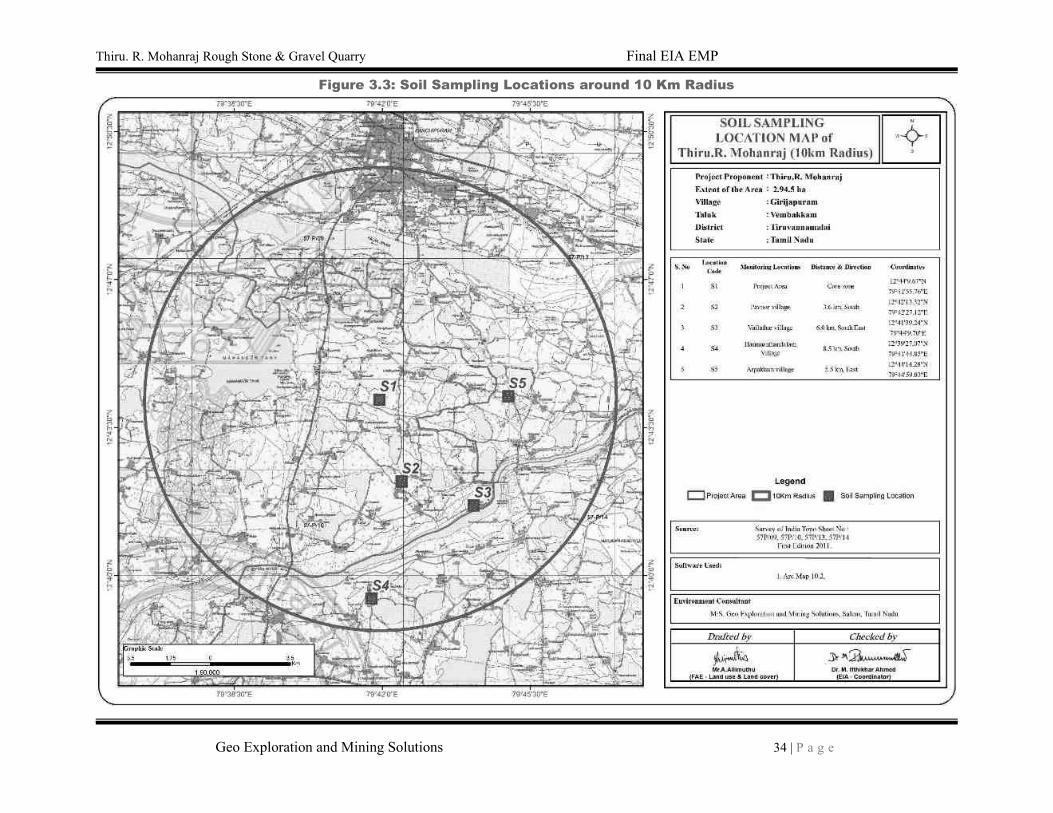
Thiru. R. Mohanraj Rough Stone & Gravel Quarry Final EIA EMP
Geo Exploration and Mining Solutions 34 | P a g e
Figure 3.3: Soil Sampling Locations around 10 Km Radius
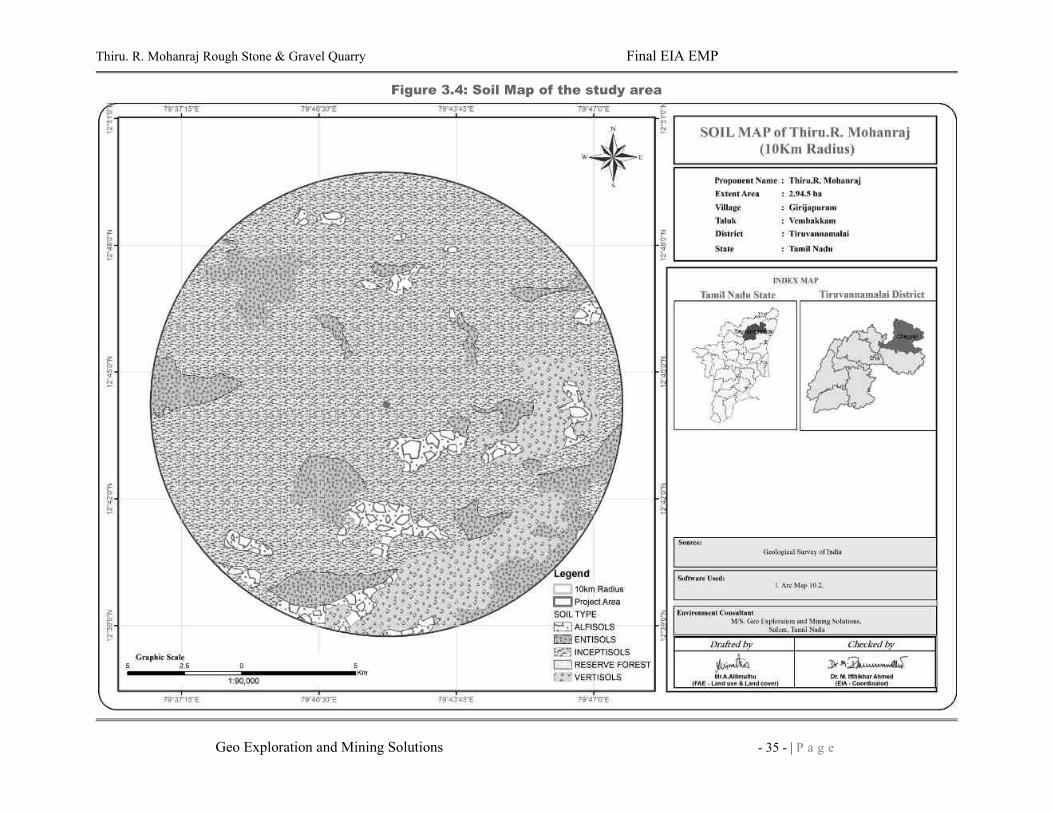
Thiru. R. Mohanraj Rough Stone & Gravel Quarry Final EIA EMP
Geo Exploration and Mining Solutions - 35 - | P a g e
Figure 3.4: Soil Map of the study area
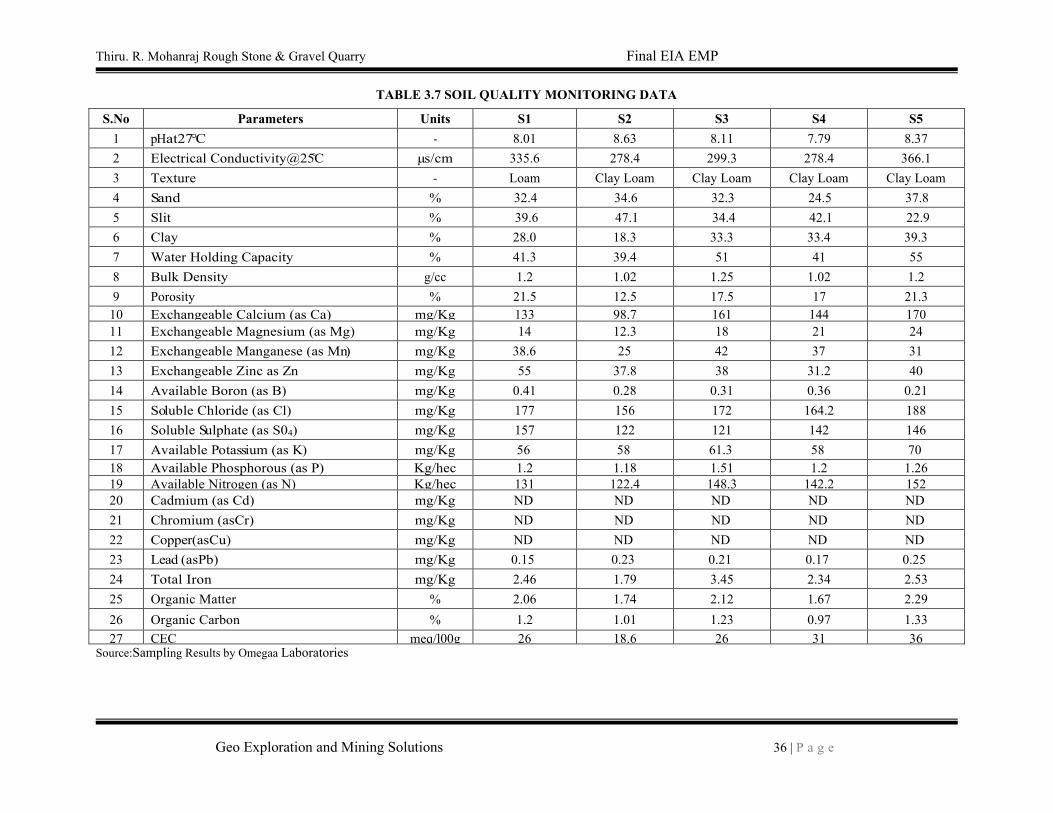
Thiru. R. Mohanraj Rough Stone & Gravel Quarry Final EIA EMP
Geo Exploration and Mining Solutions 36 | P a g e
TABLE 3.7 SOIL QUALITY MONITORING DATA
S.No Parameters Units S1 S2 S3 S4 S5
1 pHat27°C - 8.01 8.63 8.11 7.79 8.37
2 Electrical Conductivity@25̊C µs/cm 335.6 278.4 299.3 278.4 366.1
3 Texture - Loam Clay Loam Clay Loam Clay Loam Clay Loam
4 Sand % 32.4 34.6 32.3 24.5 37.8
5 Slit % 39.6 47.1 34.4 42.1 22.9
6 Clay % 28.0 18.3 33.3 33.4 39.3
7 Water Holding Capacity % 41.3 39.4 51 41 55
8 Bulk Density g/cc 1.2 1.02 1.25 1.02 1.2
9 Porosity % 21.5 12.5 17.5 17 21.3
10 Exchangeable Calcium (as Ca) mg/Kg 133 98.7 161 144 170
11 Exchangeable Magnesium (as Mg) mg/Kg 14 12.3 18 21 24
12 Exchangeable Manganese (as Mn) mg/Kg 38.6 25 42 37 31
13 Exchangeable Zinc as Zn mg/Kg 55 37.8 38 31.2 40
14 Available Boron (as B) mg/Kg 0.41 0.28 0.31 0.36 0.21
15 Soluble Chloride (as Cl) mg/Kg 177 156 172 164.2 188
16 Soluble Sulphate (as S04) mg/Kg 157 122 121 142 146
17 Available Potassium (as K) mg/Kg 56 58 61.3 58 70
18 Available Phosphorous (as P) Kg/hec 1.2 1.18 1.51 1.2 1.26
19 Available Nitrogen (as N) Kg/hec 131 122.4 148.3 142.2 152
20 Cadmium (as Cd) mg/Kg ND ND ND ND ND
21 Chromium (asCr) mg/Kg ND ND ND ND ND
22 Copper(asCu) mg/Kg ND ND ND ND ND
23 Lead (asPb) mg/Kg 0.15 0.23 0.21 0.17 0.25
24 Total Iron mg/Kg 2.46 1.79 3.45 2.34 2.53
25 Organic Matter % 2.06 1.74 2.12 1.67 2.29
26 Organic Carbon % 1.2 1.01 1.23 0.97 1.33
27 CEC meq/l00g 26 18.6 26 31 36 Source:Sampling Results by Omegaa Laboratories
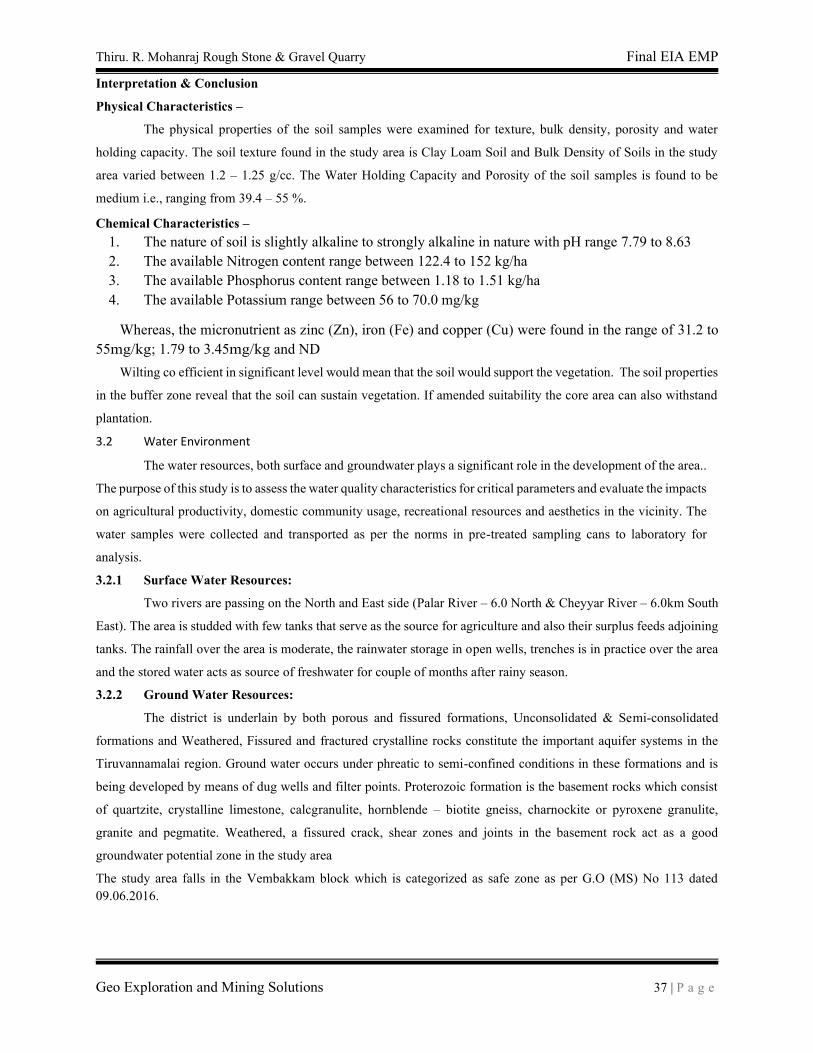
Thiru. R. Mohanraj Rough Stone & Gravel Quarry Final EIA EMP
Geo Exploration and Mining Solutions 37 | P a g e
Interpretation & Conclusion
Physical Characteristics –
The physical properties of the soil samples were examined for texture, bulk density, porosity and water
holding capacity. The soil texture found in the study area is Clay Loam Soil and Bulk Density of Soils in the study
area varied between 1.2 – 1.25 g/cc. The Water Holding Capacity and Porosity of the soil samples is found to be
medium i.e., ranging from 39.4 – 55 %.
Chemical Characteristics –
1. The nature of soil is slightly alkaline to strongly alkaline in nature with pH range 7.79 to 8.63
2. The available Nitrogen content range between 122.4 to 152 kg/ha
3. The available Phosphorus content range between 1.18 to 1.51 kg/ha
4. The available Potassium range between 56 to 70.0 mg/kg
Whereas, the micronutrient as zinc (Zn), iron (Fe) and copper (Cu) were found in the range of 31.2 to
55mg/kg; 1.79 to 3.45mg/kg and ND
Wilting co efficient in significant level would mean that the soil would support the vegetation. The soil properties
in the buffer zone reveal that the soil can sustain vegetation. If amended suitability the core area can also withstand
plantation.
3.2 Water Environment
The water resources, both surface and groundwater plays a significant role in the development of the area..
The purpose of this study is to assess the water quality characteristics for critical parameters and evaluate the impacts
on agricultural productivity, domestic community usage, recreational resources and aesthetics in the vicinity. The
water samples were collected and transported as per the norms in pre-treated sampling cans to laboratory for
analysis.
3.2.1 Surface Water Resources:
Two rivers are passing on the North and East side (Palar River – 6.0 North & Cheyyar River – 6.0km South
East). The area is studded with few tanks that serve as the source for agriculture and also their surplus feeds adjoining
tanks. The rainfall over the area is moderate, the rainwater storage in open wells, trenches is in practice over the area
and the stored water acts as source of freshwater for couple of months after rainy season.
3.2.2 Ground Water Resources:
The district is underlain by both porous and fissured formations, Unconsolidated & Semi-consolidated
formations and Weathered, Fissured and fractured crystalline rocks constitute the important aquifer systems in the
Tiruvannamalai region. Ground water occurs under phreatic to semi-confined conditions in these formations and is
being developed by means of dug wells and filter points. Proterozoic formation is the basement rocks which consist
of quartzite, crystalline limestone, calcgranulite, hornblende – biotite gneiss, charnockite or pyroxene granulite,
granite and pegmatite. Weathered, a fissured crack, shear zones and joints in the basement rock act as a good
groundwater potential zone in the study area
The study area falls in the Vembakkam block which is categorized as safe zone as per G.O (MS) No 113 dated
09.06.2016.
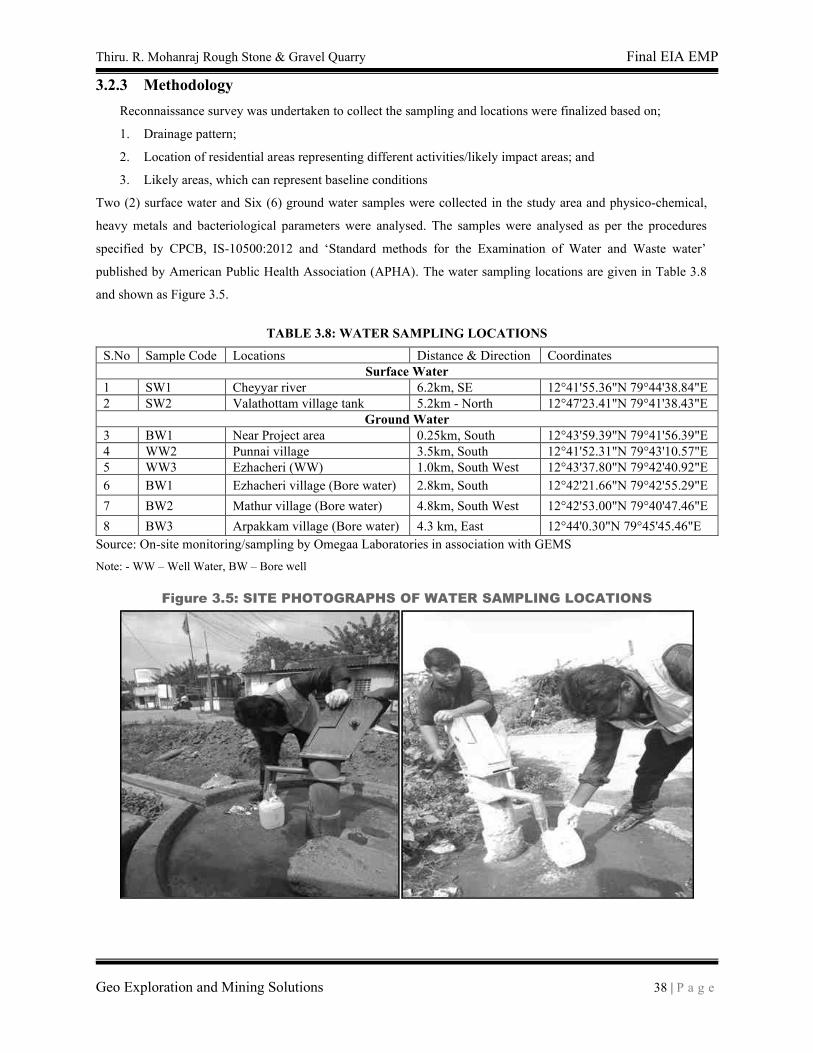
Thiru. R. Mohanraj Rough Stone & Gravel Quarry Final EIA EMP
Geo Exploration and Mining Solutions 38 | P a g e
3.2.3 Methodology
Reconnaissance survey was undertaken to collect the sampling and locations were finalized based on;
1. Drainage pattern;
2. Location of residential areas representing different activities/likely impact areas; and
3. Likely areas, which can represent baseline conditions
Two (2) surface water and Six (6) ground water samples were collected in the study area and physico-chemical,
heavy metals and bacteriological parameters were analysed. The samples were analysed as per the procedures
specified by CPCB, IS-10500:2012 and ‘Standard methods for the Examination of Water and Waste water’
published by American Public Health Association (APHA). The water sampling locations are given in Table 3.8
and shown as Figure 3.5.
TABLE 3.8: WATER SAMPLING LOCATIONS
S.No Sample Code Locations Distance & Direction Coordinates
Surface Water
1 SW1 Cheyyar river 6.2km, SE 12°41'55.36"N 79°44'38.84"E
2 SW2 Valathottam village tank 5.2km - North 12°47'23.41"N 79°41'38.43"E
Ground Water
3 BW1 Near Project area 0.25km, South 12°43'59.39"N 79°41'56.39"E
4 WW2 Punnai village 3.5km, South 12°41'52.31"N 79°43'10.57"E
5 WW3 Ezhacheri (WW) 1.0km, South West 12°43'37.80"N 79°42'40.92"E
6 BW1 Ezhacheri village (Bore water) 2.8km, South 12°42'21.66"N 79°42'55.29"E
7 BW2 Mathur village (Bore water) 4.8km, South West 12°42'53.00"N 79°40'47.46"E
8 BW3 Arpakkam village (Bore water) 4.3 km, East 12°44'0.30"N 79°45'45.46"E
Source: On-site monitoring/sampling by Omegaa Laboratories in association with GEMS
Note: - WW – Well Water, BW – Bore well
Figure 3.5: SITE PHOTOGRAPHS OF WATER SAMPLING LOCATIONS
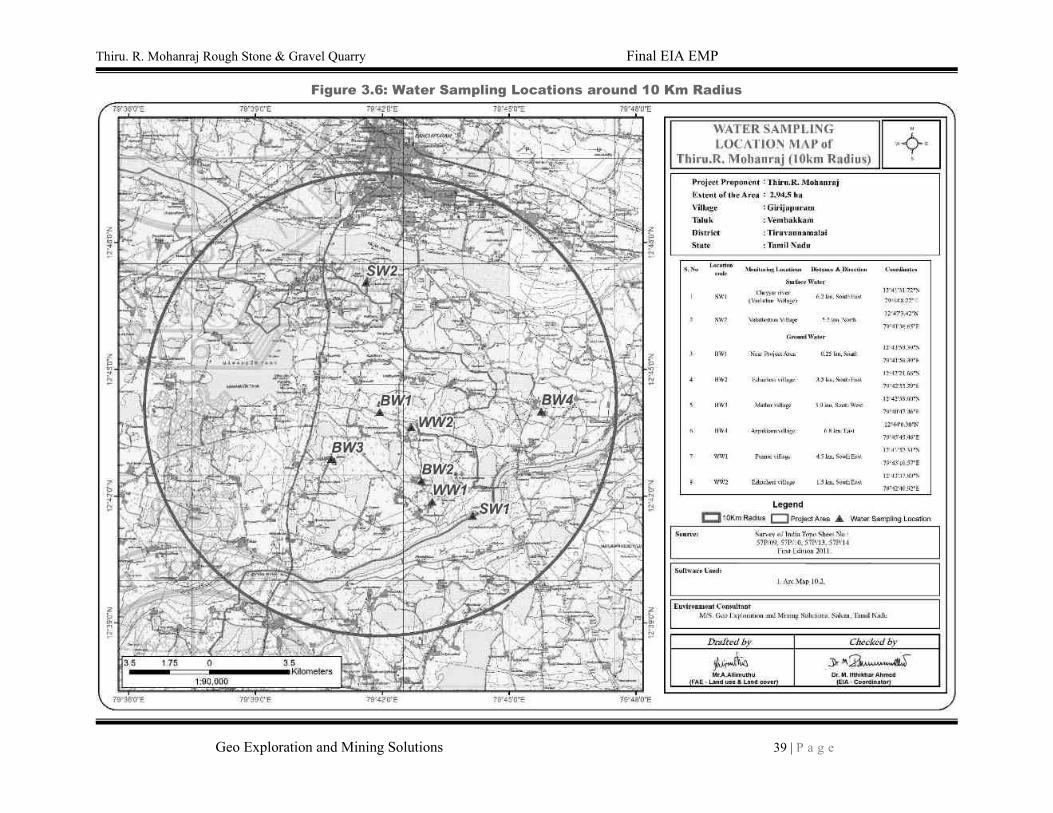
Thiru. R. Mohanraj Rough Stone & Gravel Quarry Final EIA EMP
Geo Exploration and Mining Solutions 39 | P a g e
Figure 3.6: Water Sampling Locations around 10 Km Radius
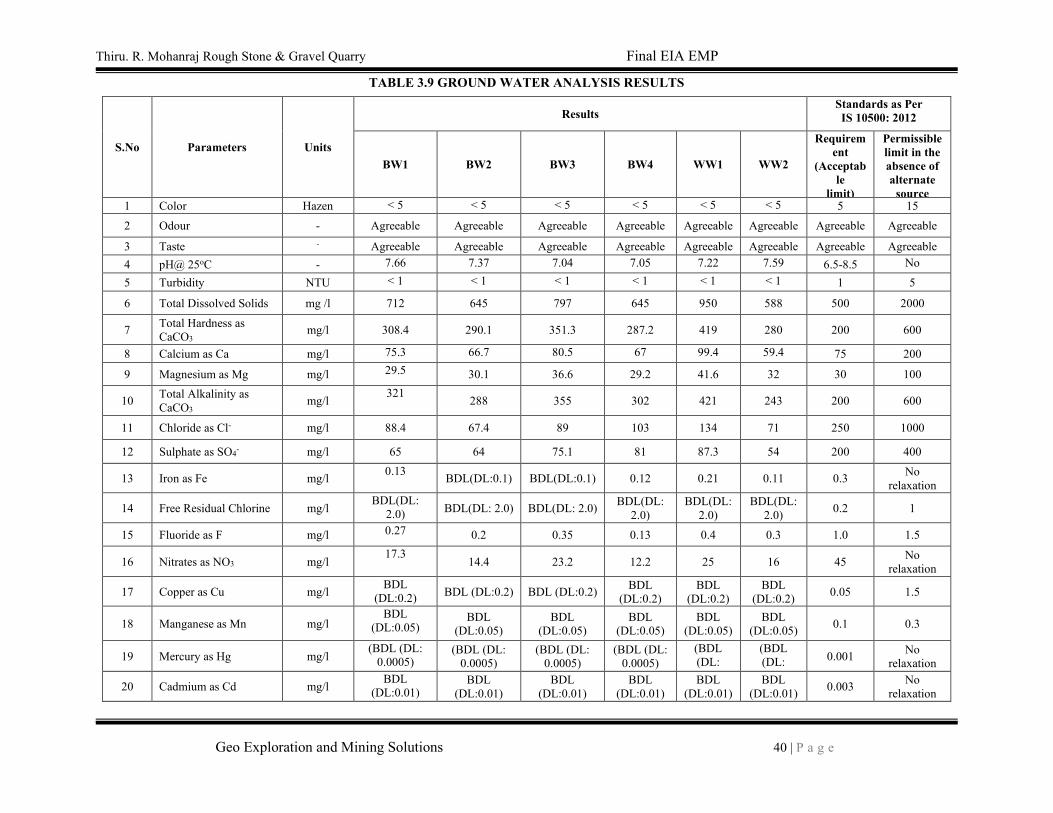
Thiru. R. Mohanraj Rough Stone & Gravel Quarry Final EIA EMP
Geo Exploration and Mining Solutions 40 | P a g e
TABLE 3.9 GROUND WATER ANALYSIS RESULTS
S.No Parameters Units
Results Standards as Per
IS 10500: 2012
BW1 BW2 BW3 BW4 WW1 WW2
Requirem
ent
(Acceptab
le
limit)
Permissible
limit in the
absence of
alternate
source 1 Color Hazen < 5 < 5 < 5 < 5 < 5 < 5 5 15
2 Odour - Agreeable Agreeable Agreeable Agreeable Agreeable Agreeable Agreeable Agreeable
3 Taste - Agreeable Agreeable Agreeable Agreeable Agreeable Agreeable Agreeable Agreeable
4 pH@ 25oC - 7.66 7.37 7.04 7.05 7.22 7.59 6.5-8.5 No
relaxation 5 Turbidity NTU < 1 < 1 < 1 < 1 < 1 < 1 1 5
6 Total Dissolved Solids mg /l 712 645 797 645 950 588 500 2000
7 Total Hardness as
CaCO3 mg/l 308.4 290.1 351.3 287.2 419 280 200 600
8 Calcium as Ca mg/l 75.3 66.7 80.5 67 99.4 59.4 75 200
9 Magnesium as Mg mg/l 29.5 30.1 36.6 29.2 41.6 32 30 100
10 Total Alkalinity as
CaCO3 mg/l
321 288 355 302 421 243 200 600
11 Chloride as Cl- mg/l 88.4 67.4 89 103 134 71 250 1000
12 Sulphate as SO4- mg/l 65 64 75.1 81 87.3 54 200 400
13 Iron as Fe mg/l 0.13
BDL(DL:0.1) BDL(DL:0.1) 0.12 0.21 0.11 0.3 No
relaxation
14 Free Residual Chlorine mg/l BDL(DL:
2.0) BDL(DL: 2.0) BDL(DL: 2.0)
BDL(DL:
2.0)
BDL(DL:
2.0)
BDL(DL:
2.0) 0.2 1
15 Fluoride as F mg/l 0.27 0.2 0.35 0.13 0.4 0.3 1.0 1.5
16 Nitrates as NO3 mg/l 17.3
14.4 23.2 12.2 25 16 45 No
relaxation
17 Copper as Cu mg/l BDL
(DL:0.2) BDL (DL:0.2) BDL (DL:0.2)
BDL
(DL:0.2)
BDL
(DL:0.2)
BDL
(DL:0.2) 0.05 1.5
18 Manganese as Mn mg/l BDL
(DL:0.05) BDL
(DL:0.05)
BDL
(DL:0.05)
BDL
(DL:0.05)
BDL
(DL:0.05)
BDL
(DL:0.05) 0.1 0.3
19 Mercury as Hg mg/l (BDL (DL:
0.0005) (BDL (DL:
0.0005)
(BDL (DL:
0.0005)
(BDL (DL:
0.0005)
(BDL
(DL:
0.0005)
(BDL
(DL:
0.0005)
0.001 No
relaxation
20 Cadmium as Cd mg/l BDL
(DL:0.01) BDL
(DL:0.01)
BDL
(DL:0.01)
BDL
(DL:0.01)
BDL
(DL:0.01)
BDL
(DL:0.01) 0.003
No
relaxation
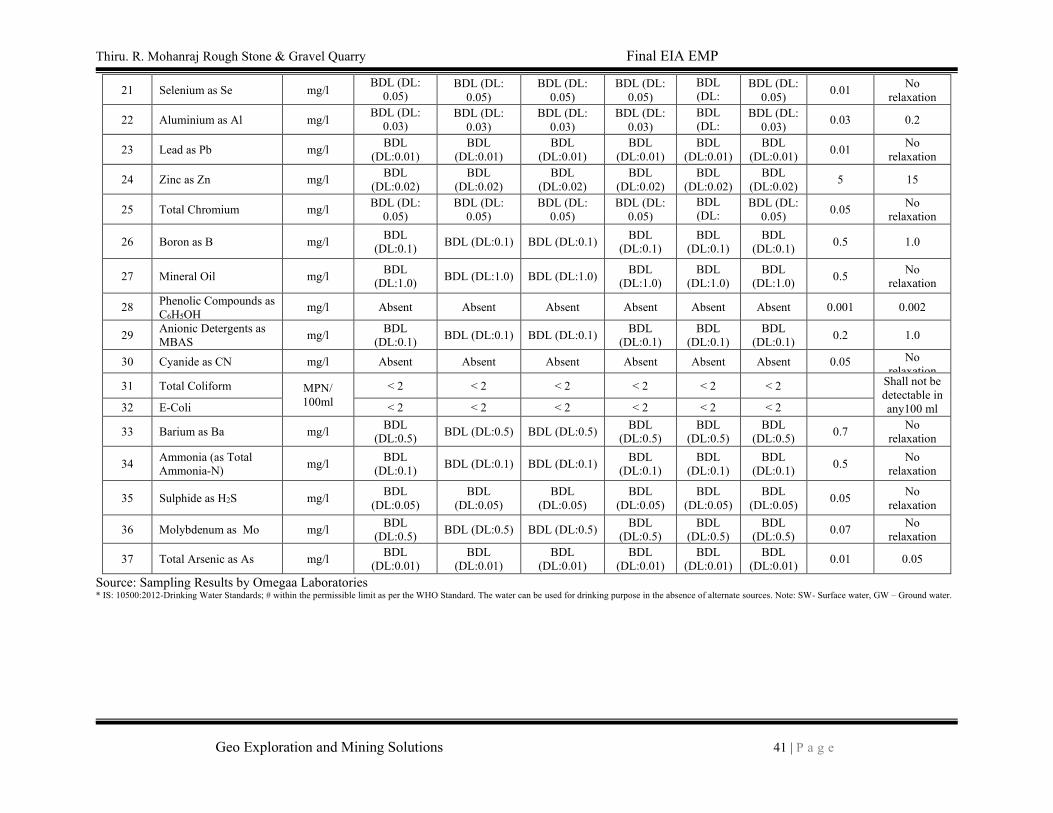
Thiru. R. Mohanraj Rough Stone & Gravel Quarry Final EIA EMP
Geo Exploration and Mining Solutions 41 | P a g e
21 Selenium as Se mg/l BDL (DL:
0.05) BDL (DL:
0.05)
BDL (DL:
0.05)
BDL (DL:
0.05)
BDL
(DL:
0.05)
BDL (DL:
0.05) 0.01
No
relaxation
22 Aluminium as Al mg/l BDL (DL:
0.03) BDL (DL:
0.03)
BDL (DL:
0.03)
BDL (DL:
0.03)
BDL
(DL:
0.03)
BDL (DL:
0.03) 0.03 0.2
23 Lead as Pb mg/l BDL
(DL:0.01)
BDL
(DL:0.01)
BDL
(DL:0.01)
BDL
(DL:0.01)
BDL
(DL:0.01)
BDL
(DL:0.01) 0.01
No
relaxation
24 Zinc as Zn mg/l BDL
(DL:0.02)
BDL
(DL:0.02)
BDL
(DL:0.02)
BDL
(DL:0.02)
BDL
(DL:0.02)
BDL
(DL:0.02) 5 15
25 Total Chromium mg/l BDL (DL:
0.05)
BDL (DL:
0.05)
BDL (DL:
0.05)
BDL (DL:
0.05)
BDL
(DL:
0.05)
BDL (DL:
0.05) 0.05
No
relaxation
26 Boron as B mg/l BDL
(DL:0.1) BDL (DL:0.1) BDL (DL:0.1)
BDL
(DL:0.1)
BDL
(DL:0.1)
BDL
(DL:0.1) 0.5 1.0
27 Mineral Oil mg/l BDL
(DL:1.0) BDL (DL:1.0) BDL (DL:1.0)
BDL
(DL:1.0)
BDL
(DL:1.0)
BDL
(DL:1.0) 0.5
No
relaxation
28 Phenolic Compounds as
C6H5OH mg/l Absent Absent Absent Absent Absent Absent 0.001 0.002
29 Anionic Detergents as
MBAS mg/l
BDL
(DL:0.1) BDL (DL:0.1) BDL (DL:0.1)
BDL
(DL:0.1)
BDL
(DL:0.1)
BDL
(DL:0.1) 0.2 1.0
30 Cyanide as CN mg/l Absent Absent Absent Absent Absent Absent 0.05 No
relaxation
31 Total Coliform MPN/
100ml
< 2 < 2 < 2 < 2 < 2 < 2 Shall not be
detectable in
any100 ml 32 E-Coli < 2 < 2 < 2 < 2 < 2 < 2
33 Barium as Ba mg/l BDL
(DL:0.5) BDL (DL:0.5) BDL (DL:0.5)
BDL
(DL:0.5)
BDL
(DL:0.5)
BDL
(DL:0.5) 0.7
No
relaxation
34 Ammonia (as Total
Ammonia-N) mg/l
BDL
(DL:0.1) BDL (DL:0.1) BDL (DL:0.1)
BDL
(DL:0.1)
BDL
(DL:0.1)
BDL
(DL:0.1) 0.5
No
relaxation
35 Sulphide as H2S mg/l BDL
(DL:0.05)
BDL
(DL:0.05)
BDL
(DL:0.05)
BDL
(DL:0.05)
BDL
(DL:0.05)
BDL
(DL:0.05) 0.05
No
relaxation
36 Molybdenum as Mo mg/l BDL
(DL:0.5) BDL (DL:0.5) BDL (DL:0.5)
BDL
(DL:0.5)
BDL
(DL:0.5)
BDL
(DL:0.5) 0.07
No
relaxation
37 Total Arsenic as As mg/l BDL
(DL:0.01)
BDL
(DL:0.01)
BDL
(DL:0.01)
BDL
(DL:0.01)
BDL
(DL:0.01)
BDL
(DL:0.01) 0.01 0.05
Source: Sampling Results by Omegaa Laboratories * IS: 10500:2012-Drinking Water Standards; # within the permissible limit as per the WHO Standard. The water can be used for drinking purpose in the absence of alternate sources. Note: SW- Surface water, GW – Ground water.
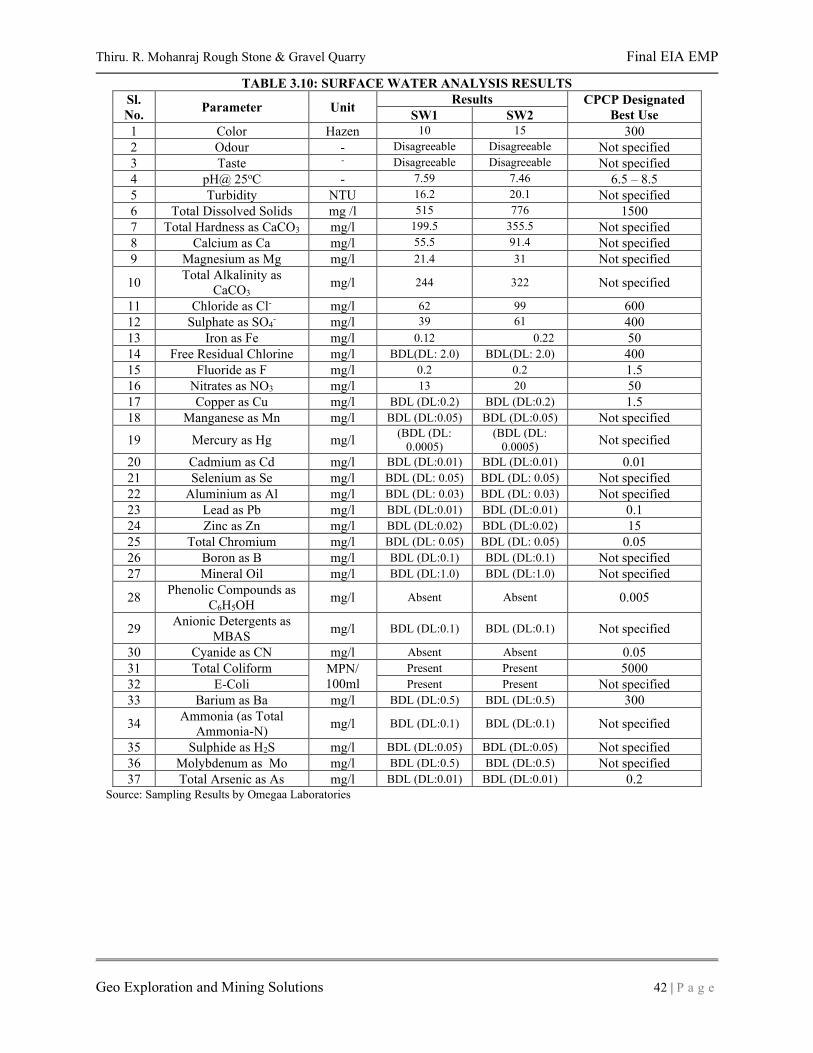
Thiru. R. Mohanraj Rough Stone & Gravel Quarry Final EIA EMP
Geo Exploration and Mining Solutions 42 | P a g e
TABLE 3.10: SURFACE WATER ANALYSIS RESULTS
Sl.
No. Parameter Unit
Results CPCP Designated
Best Use SW1 SW2
1 Color Hazen 10 15 300
2 Odour - Disagreeable Disagreeable Not specified
3 Taste - Disagreeable Disagreeable Not specified
4 pH@ 25oC - 7.59 7.46 6.5 – 8.5
5 Turbidity NTU 16.2 20.1 Not specified
6 Total Dissolved Solids mg /l 515 776 1500
7 Total Hardness as CaCO3 mg/l 199.5 355.5 Not specified
8 Calcium as Ca mg/l 55.5 91.4 Not specified
9 Magnesium as Mg mg/l 21.4 31 Not specified
10 Total Alkalinity as
CaCO3 mg/l 244 322 Not specified
11 Chloride as Cl- mg/l 62 99 600
12 Sulphate as SO4- mg/l 39 61 400
13 Iron as Fe mg/l 0.12 0.22 50
14 Free Residual Chlorine mg/l BDL(DL: 2.0) BDL(DL: 2.0) 400
15 Fluoride as F mg/l 0.2 0.2 1.5
16 Nitrates as NO3 mg/l 13 20 50
17 Copper as Cu mg/l BDL (DL:0.2) BDL (DL:0.2) 1.5
18 Manganese as Mn mg/l BDL (DL:0.05) BDL (DL:0.05) Not specified
19 Mercury as Hg mg/l (BDL (DL:
0.0005)
(BDL (DL:
0.0005) Not specified
20 Cadmium as Cd mg/l BDL (DL:0.01) BDL (DL:0.01) 0.01
21 Selenium as Se mg/l BDL (DL: 0.05) BDL (DL: 0.05) Not specified
22 Aluminium as Al mg/l BDL (DL: 0.03) BDL (DL: 0.03) Not specified
23 Lead as Pb mg/l BDL (DL:0.01) BDL (DL:0.01) 0.1
24 Zinc as Zn mg/l BDL (DL:0.02) BDL (DL:0.02) 15
25 Total Chromium mg/l BDL (DL: 0.05) BDL (DL: 0.05) 0.05
26 Boron as B mg/l BDL (DL:0.1) BDL (DL:0.1) Not specified
27 Mineral Oil mg/l BDL (DL:1.0) BDL (DL:1.0) Not specified
28 Phenolic Compounds as
C6H5OH mg/l Absent Absent 0.005
29 Anionic Detergents as
MBAS mg/l BDL (DL:0.1) BDL (DL:0.1) Not specified
30 Cyanide as CN mg/l Absent Absent 0.05
31 Total Coliform MPN/
100ml
Present Present 5000
32 E-Coli Present Present Not specified
33 Barium as Ba mg/l BDL (DL:0.5) BDL (DL:0.5) 300
34 Ammonia (as Total
Ammonia-N) mg/l BDL (DL:0.1) BDL (DL:0.1) Not specified
35 Sulphide as H2S mg/l BDL (DL:0.05) BDL (DL:0.05) Not specified
36 Molybdenum as Mo mg/l BDL (DL:0.5) BDL (DL:0.5) Not specified
37 Total Arsenic as As mg/l BDL (DL:0.01) BDL (DL:0.01) 0.2 Source: Sampling Results by Omegaa Laboratories
Thiru. R. Mohanraj Rough Stone & Gravel Quarry Final EIA EMP
Geo Exploration and Mining Solutions 43 | P a g e
3.2.4 Interpretation& Conclusion
Surface Water
The pH varied from 7.46 to 7.59 while turbidity found within the standards. Total Dissolved Solids varied
from 515 to 766mg/l and Chloride varied between 62.0 mg/l and 99.0 mg/l. Nitrates varied from 13.0 to 20.0 mg/l,
while sulphates varied from 39 to 61mg/l.
Ground Water
The pH of the water samples collected ranged from 7.04 to 7.66 and within the acceptable limit of 6.5 to
8.5. pH, Sulphates and Chlorides of water samples from all the sources are within the limits as per the Standard. on
Turbidity, the water samples meet the requirement. The Total Dissolved Solids were found in the range of 588-950
mg/l in all samples. The Total hardness varied between 280-419 mg/l for all samples.
On Microbiological parameters, the water samples from all the locations meet the requirement. The
parameters thus analysed were compared with IS 10500:2012 and are well within the prescribed limits.
3.2.5 Hydrology and Hydrogeological studies
The district is underlain by both porous and fissured formations. Unconsolidated & Semi-consolidated
formations and Weathered, Fissured and Fractured crystalline rocks constitute the important aquifer systems in the
district. The porous formations in the district include sandstones and clays of Recent to sub recent and Tertiary age
(Quaternary). The alluvial formations comprising mainly sands, clays and gravels are confined to major drainage
courses in the district. The area falls in two major river basins namely Palar River and Cheyyar River. River Palar
originates from the Nandi hills in Chikkabalapur District, Karnataka State and flows in the easterly and south-eastern
direction before it debouches into Gulf of Mannar. The river has a number of tributaries and major tributes of Ponnai
and Cheyyar river.
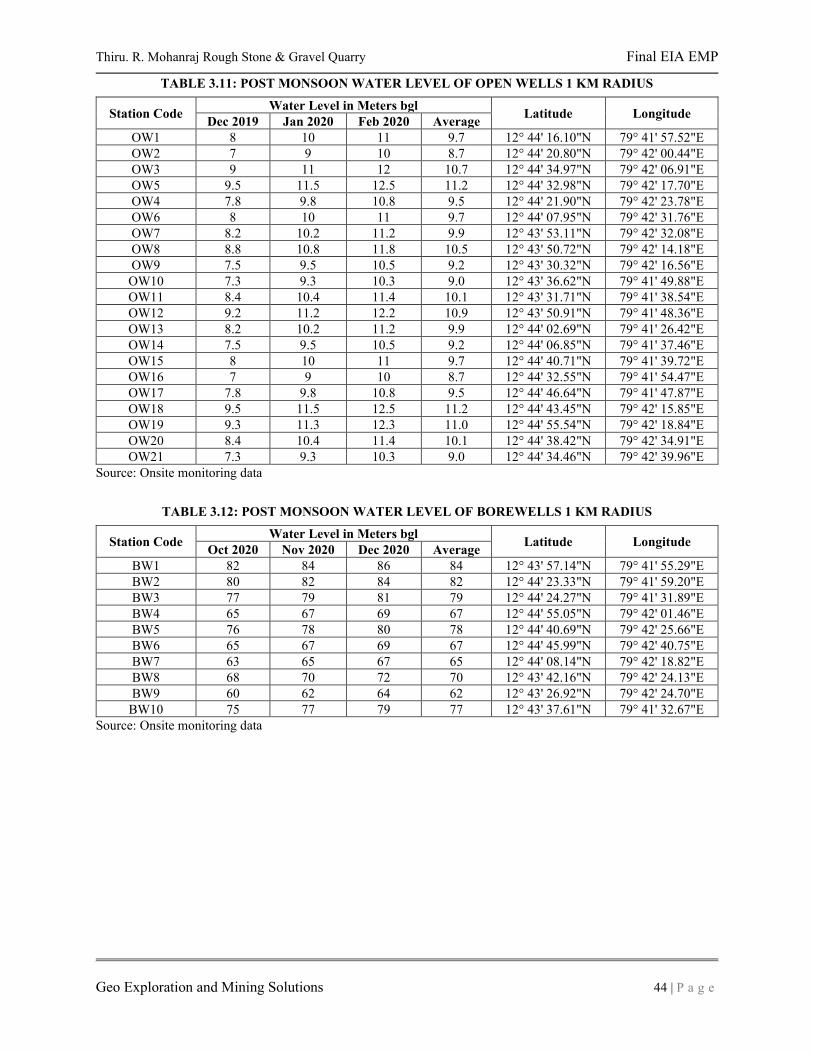
Thiru. R. Mohanraj Rough Stone & Gravel Quarry Final EIA EMP
Geo Exploration and Mining Solutions 44 | P a g e
TABLE 3.11: POST MONSOON WATER LEVEL OF OPEN WELLS 1 KM RADIUS
Station Code Water Level in Meters bgl
Latitude Longitude Dec 2019 Jan 2020 Feb 2020 Average
OW1 8 10 11 9.7 12° 44' 16.10"N 79° 41' 57.52"E
OW2 7 9 10 8.7 12° 44' 20.80"N 79° 42' 00.44"E
OW3 9 11 12 10.7 12° 44' 34.97"N 79° 42' 06.91"E
OW5 9.5 11.5 12.5 11.2 12° 44' 32.98"N 79° 42' 17.70"E
OW4 7.8 9.8 10.8 9.5 12° 44' 21.90"N 79° 42' 23.78"E
OW6 8 10 11 9.7 12° 44' 07.95"N 79° 42' 31.76"E
OW7 8.2 10.2 11.2 9.9 12° 43' 53.11"N 79° 42' 32.08"E
OW8 8.8 10.8 11.8 10.5 12° 43' 50.72"N 79° 42' 14.18"E
OW9 7.5 9.5 10.5 9.2 12° 43' 30.32"N 79° 42' 16.56"E
OW10 7.3 9.3 10.3 9.0 12° 43' 36.62"N 79° 41' 49.88"E
OW11 8.4 10.4 11.4 10.1 12° 43' 31.71"N 79° 41' 38.54"E
OW12 9.2 11.2 12.2 10.9 12° 43' 50.91"N 79° 41' 48.36"E
OW13 8.2 10.2 11.2 9.9 12° 44' 02.69"N 79° 41' 26.42"E
OW14 7.5 9.5 10.5 9.2 12° 44' 06.85"N 79° 41' 37.46"E
OW15 8 10 11 9.7 12° 44' 40.71"N 79° 41' 39.72"E
OW16 7 9 10 8.7 12° 44' 32.55"N 79° 41' 54.47"E
OW17 7.8 9.8 10.8 9.5 12° 44' 46.64"N 79° 41' 47.87"E
OW18 9.5 11.5 12.5 11.2 12° 44' 43.45"N 79° 42' 15.85"E
OW19 9.3 11.3 12.3 11.0 12° 44' 55.54"N 79° 42' 18.84"E
OW20 8.4 10.4 11.4 10.1 12° 44' 38.42"N 79° 42' 34.91"E
OW21 7.3 9.3 10.3 9.0 12° 44' 34.46"N 79° 42' 39.96"E
Source: Onsite monitoring data
TABLE 3.12: POST MONSOON WATER LEVEL OF BOREWELLS 1 KM RADIUS
Station Code Water Level in Meters bgl
Latitude Longitude Oct 2020 Nov 2020 Dec 2020 Average
BW1 82 84 86 84 12° 43' 57.14"N 79° 41' 55.29"E
BW2 80 82 84 82 12° 44' 23.33"N 79° 41' 59.20"E
BW3 77 79 81 79 12° 44' 24.27"N 79° 41' 31.89"E
BW4 65 67 69 67 12° 44' 55.05"N 79° 42' 01.46"E
BW5 76 78 80 78 12° 44' 40.69"N 79° 42' 25.66"E
BW6 65 67 69 67 12° 44' 45.99"N 79° 42' 40.75"E
BW7 63 65 67 65 12° 44' 08.14"N 79° 42' 18.82"E
BW8 68 70 72 70 12° 43' 42.16"N 79° 42' 24.13"E
BW9 60 62 64 62 12° 43' 26.92"N 79° 42' 24.70"E
BW10 75 77 79 77 12° 43' 37.61"N 79° 41' 32.67"E
Source: Onsite monitoring data
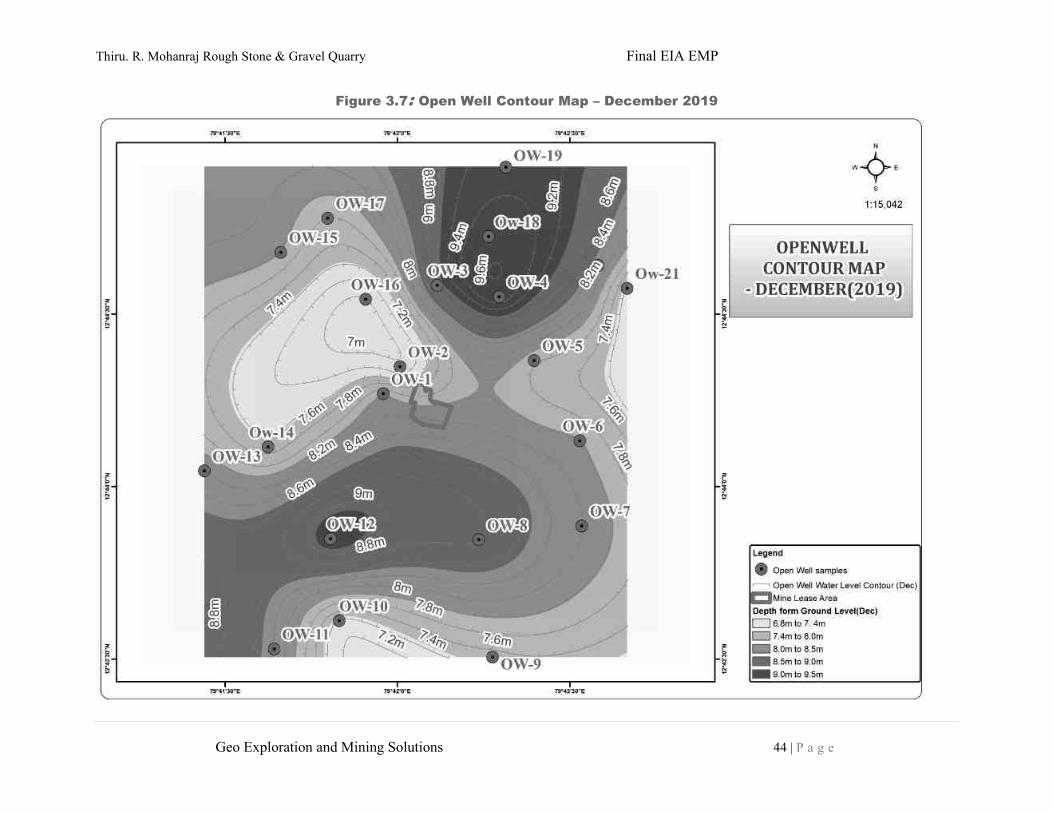
Thiru. R. Mohanraj Rough Stone & Gravel Quarry Final EIA EMP
Geo Exploration and Mining Solutions 44 | P a g e
Figure 3.7: Open Well Contour Map – December 2019

Thiru. R. Mohanraj Rough Stone & Gravel Quarry Final EIA EMP
Geo Exploration and Mining Solutions 45 | P a g e
Figure 3.8: Open Well Contour Map – January 2020
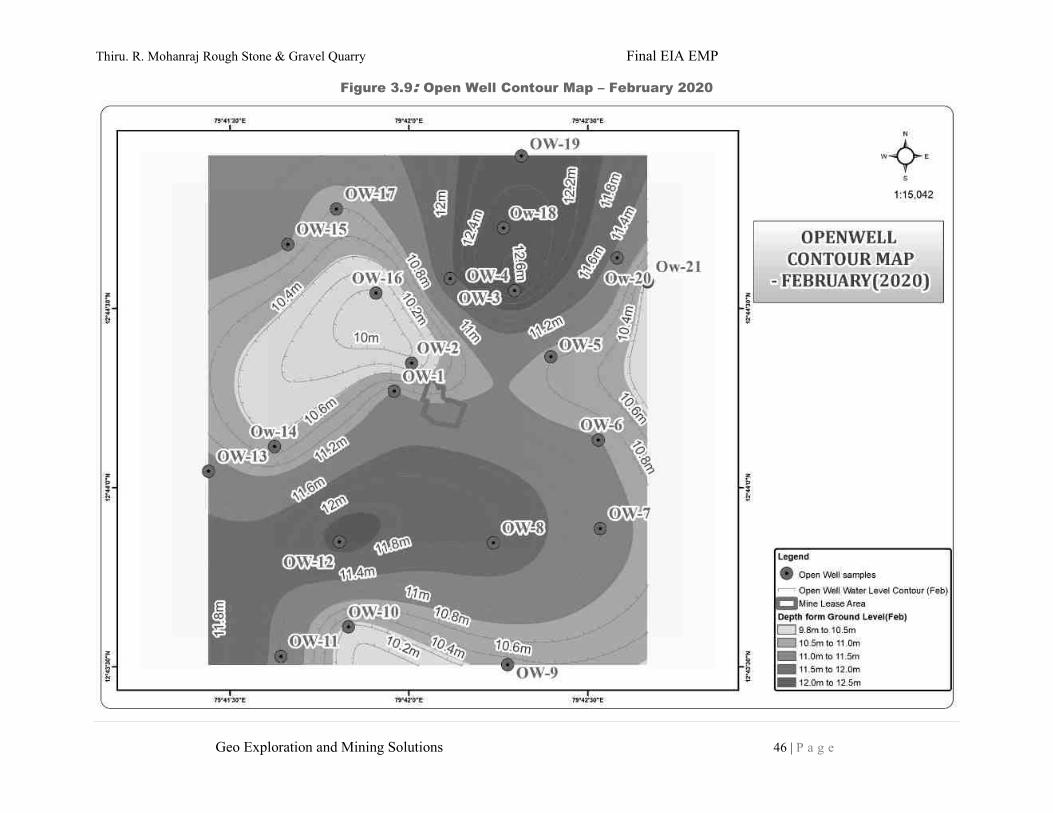
Thiru. R. Mohanraj Rough Stone & Gravel Quarry Final EIA EMP
Geo Exploration and Mining Solutions 46 | P a g e
Figure 3.9: Open Well Contour Map – February 2020

Thiru. R. Mohanraj Rough Stone & Gravel Quarry Final EIA EMP
Geo Exploration and Mining Solutions 47 | P a g e
Figure 3.10: Borewell Contour Map – December 2019

Thiru. R. Mohanraj Rough Stone & Gravel Quarry Final EIA EMP
Geo Exploration and Mining Solutions 48 | P a g e
Figure 3.11: Borewell Contour Map – January 2020
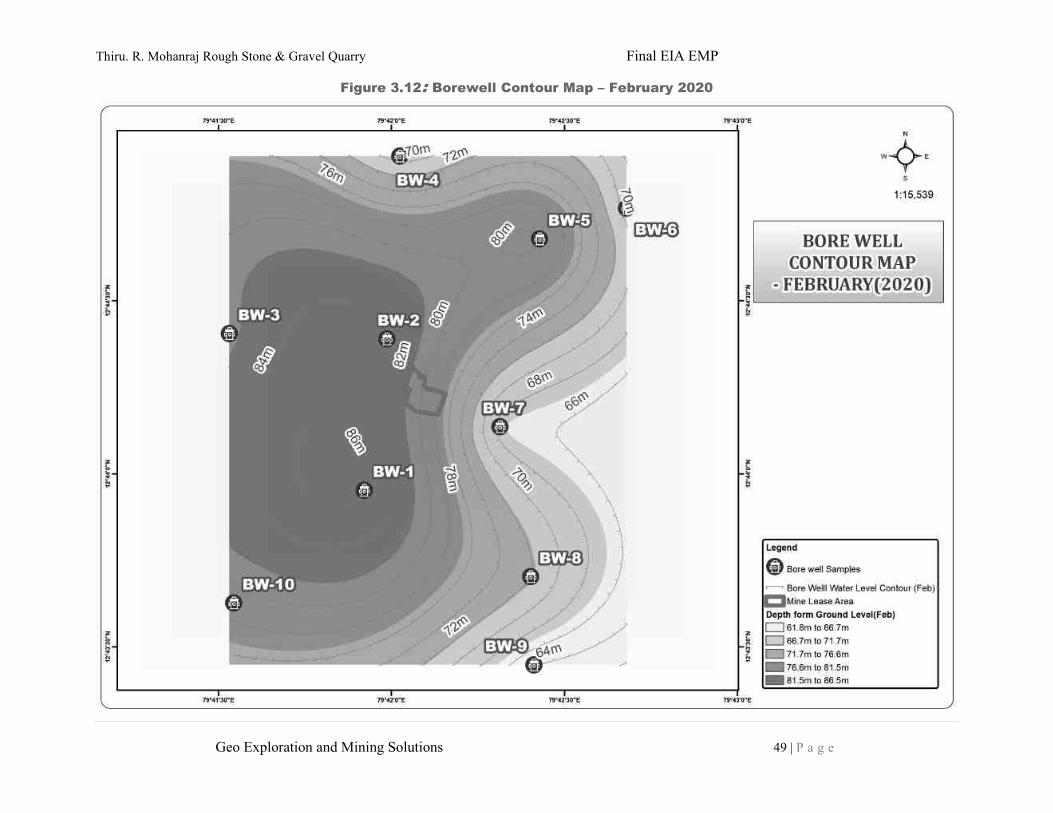
Thiru. R. Mohanraj Rough Stone & Gravel Quarry Final EIA EMP
Geo Exploration and Mining Solutions 49 | P a g e
Figure 3.12: Borewell Contour Map – February 2020
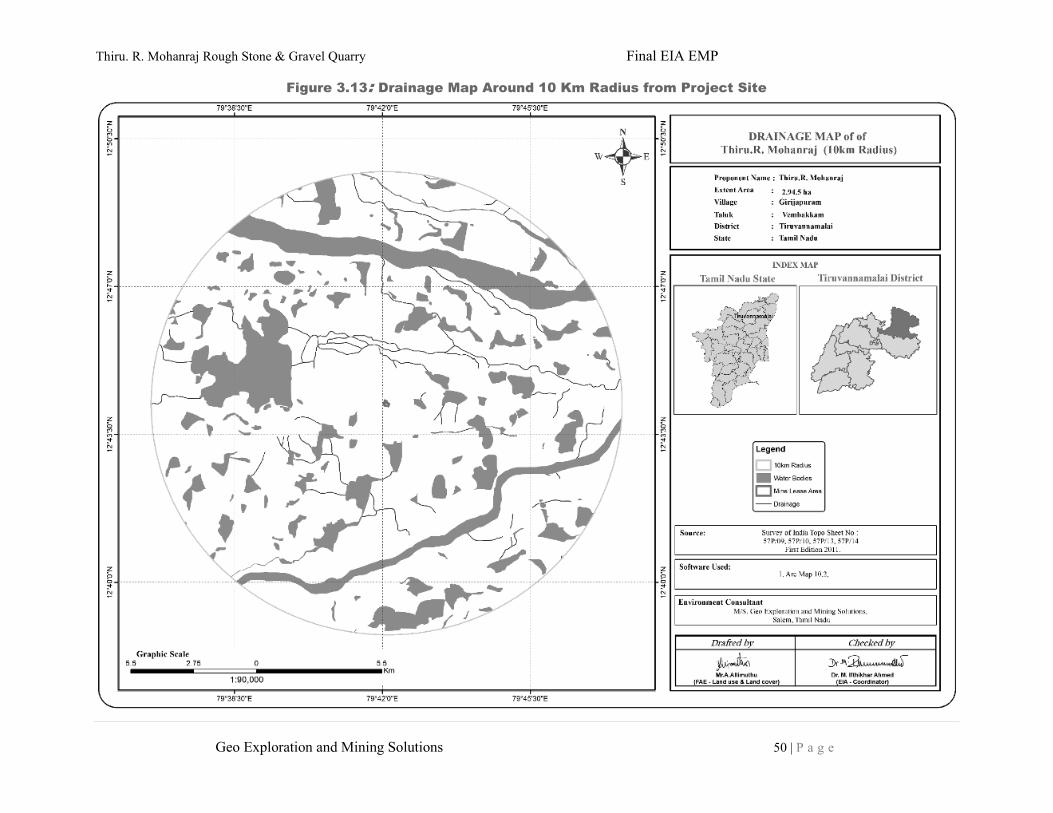
Thiru. R. Mohanraj Rough Stone & Gravel Quarry Final EIA EMP
Geo Exploration and Mining Solutions 50 | P a g e
Figure 3.13: Drainage Map Around 10 Km Radius from Project Site
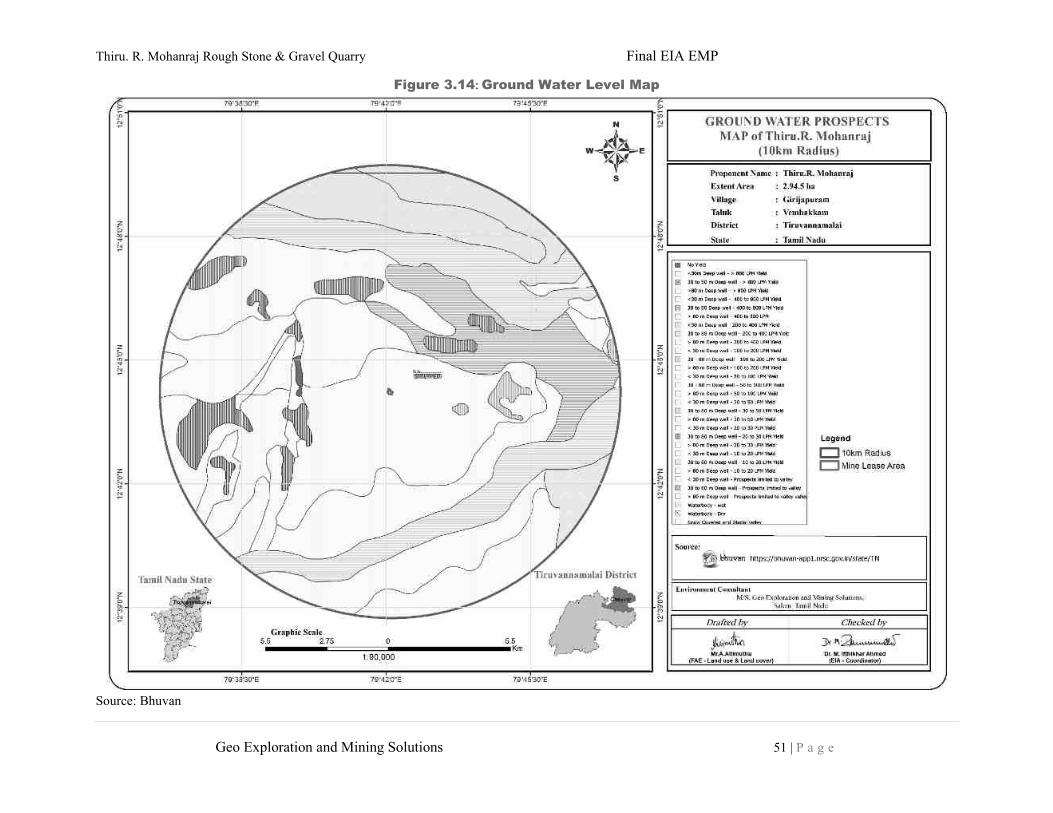
Thiru. R. Mohanraj Rough Stone & Gravel Quarry Final EIA EMP
Geo Exploration and Mining Solutions 51 | P a g e
Figure 3.14: Ground Water Level Map
Source: Bhuvan
Thiru. R. Mohanraj Rough Stone & Gravel Quarry Final EIA EMP
Geo Exploration and Mining Solutions 52 | P a g e
3.3 Air Environment
The existing ambient air quality of the area is important for evaluating the impact of mining activities on the
ambient air quality.
The baseline studies on air environment include identification of specific air pollution parameters and their
existing levels in ambient air. The ambient air quality with respect to the study zone of 10 km radius around the
proposed quarry forms the baseline information. The sources of air pollution in the region are mostly due to vehicular
traffic, dust arising from unpaved village road and domestic & agricultural activities. The prime objective of the
baseline air quality study was to establish the existing ambient air quality of the study area. These will also be useful
for assessing the conformity to standards of the ambient air quality during the operation of proposed mine.
This section describes the identification of sampling locations, methodology adopted during the monitoring
period and sampling frequency.
3.3.1 Meteorology & Climate
Meteorology is the key to understand the air quality. The essential relationship between meteorological
condition and atmospheric dispersion involves the wind in the broadest sense. Wind fluctuations over a very wide
range of time, accomplish dispersion and strongly influence other processes associated with them.
A temporary meteorological station was installed at project site. The station was installed at a height of 4 m
above the ground level in such a way that there are no obstructions facilitating flow of wind, wind speed, wind
direction, humidity and temperature are recorded on hourly basis.
Climate –
1. The climate of the region is semi-arid tropic.
2. The district receives the rain under the influence of both southwest and northeast monsoons.
3. The northeast monsoon chiefly contributes to the rainfall in the district.
4. Most of the precipitation occurs in the form of cyclonic storms caused due to the depressions in Bay of
Bengal.
The southwest monsoon rainfall is highly erratic and summer rains are negligible.
5. The average Rainfall of the area is 1039.66 Mm (2013 – 2017) normal annual rainfall over the district varies
from about 684.7 to 1251.3 Mm
6. The period from April to June is generally hot and dry. The weather is pleasant during the period from
November to January. Usually, mornings are more humid than afternoons. The relative humidity is on an
average between 65 and 85% in the mornings.
7. Relative Humidity in ranges from 78 to 93%
8. The daytime heat is oppressive and the temperature is as high as 31.2° C. The lowest temperature recorded
is of the order of 22.3° C. During the study period
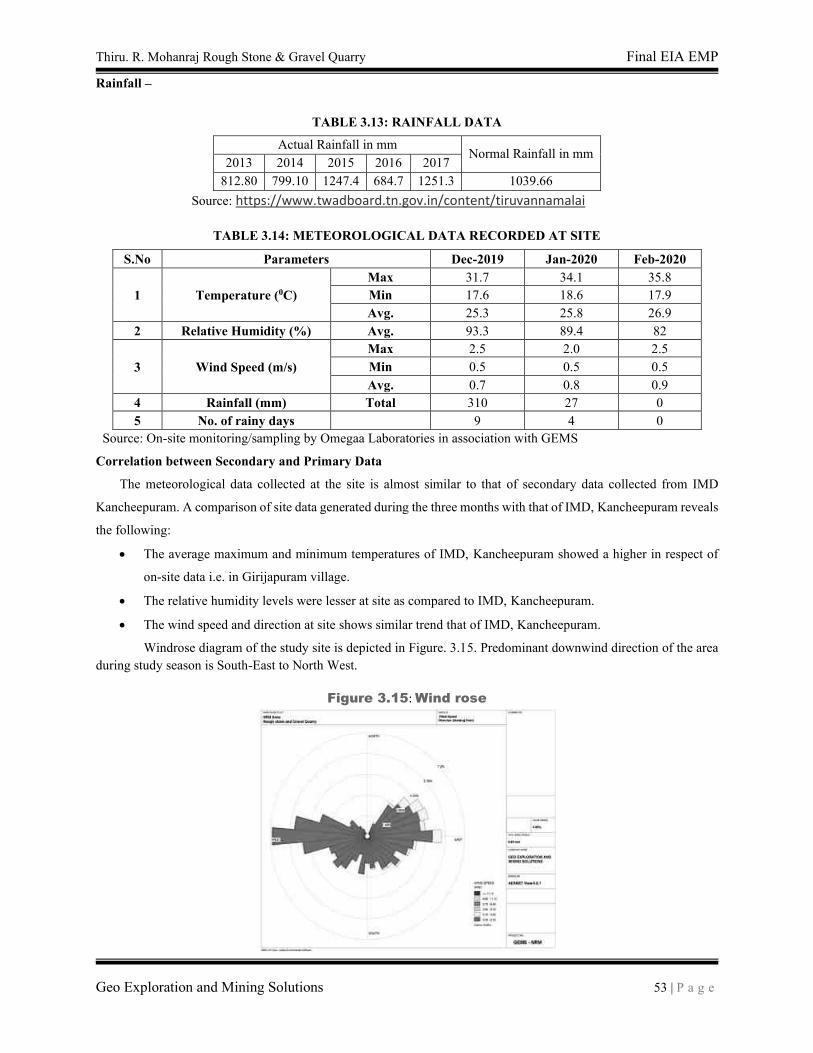
Thiru. R. Mohanraj Rough Stone & Gravel Quarry Final EIA EMP
Geo Exploration and Mining Solutions 53 | P a g e
Rainfall –
TABLE 3.13: RAINFALL DATA
Actual Rainfall in mm Normal Rainfall in mm
2013 2014 2015 2016 2017
812.80 799.10 1247.4 684.7 1251.3 1039.66
Source: https://www.twadboard.tn.gov.in/content/tiruvannamalai
TABLE 3.14: METEOROLOGICAL DATA RECORDED AT SITE
S.No Parameters Dec-2019 Jan-2020 Feb-2020
1 Temperature (0C)
Max 31.7 34.1 35.8
Min 17.6 18.6 17.9
Avg. 25.3 25.8 26.9
2 Relative Humidity (%) Avg. 93.3 89.4 82
3 Wind Speed (m/s)
Max 2.5 2.0 2.5
Min 0.5 0.5 0.5
Avg. 0.7 0.8 0.9
4 Rainfall (mm) Total 310 27 0
5 No. of rainy days 9 4 0
Source: On-site monitoring/sampling by Omegaa Laboratories in association with GEMS
Correlation between Secondary and Primary Data
The meteorological data collected at the site is almost similar to that of secondary data collected from IMD
Kancheepuram. A comparison of site data generated during the three months with that of IMD, Kancheepuram reveals
the following:
• The average maximum and minimum temperatures of IMD, Kancheepuram showed a higher in respect of
on-site data i.e. in Girijapuram village.
• The relative humidity levels were lesser at site as compared to IMD, Kancheepuram.
• The wind speed and direction at site shows similar trend that of IMD, Kancheepuram.
Windrose diagram of the study site is depicted in Figure. 3.15. Predominant downwind direction of the area
during study season is South-East to North West.
Figure 3.15: Wind rose
Thiru. R. Mohanraj Rough Stone & Gravel Quarry Final EIA EMP
Geo Exploration and Mining Solutions 54 | P a g e
Environmental in the abstract of collected data wind rose were drawn on presented in figure No.3.15 during the
monitoring period in the study area
1. Predominant winds were from East - West
2. Wind velocity readings were recorded between 0.50 to 11.10 km / hour
3. Calm conditions prevail of about 6% of the monitoring period
4. Temperature readings ranging from 17.6 to 35.80C
5. Relative humidity ranging from 82 to 93.3 %
6. The monitoring was carried out continuously for three months
3.3.2 Methodology and Objective
The prime objective of the ambient air quality study is to assess the existing air quality of study area and its
conformity to NAAQS. The observed sources of air pollution in the study area are industrial, traffic and domestic
activities. The baseline status of the ambient air quality has been established through a scientifically designed ambient
air quality monitoring network considering the followings:
• Meteorological condition on synoptic scale;
• Topography of the study area;
• Representatives of regional background air quality for obtaining baseline status;
▪ Location of residential areas representing different activities;
▪ Accessibility and power availability; etc
3.3.3 Sampling and Analytical Techniques
TABLE 3.15: METHODOLOGY AND INSTRUMENT USED FOR AIR QUALITY ANALYSIS
Parameter Method Instrument
PM2.5 Gravimetric Method
Beta attenuation Method
Fine Particulate Sampler
Make – Thermo Environmental Instruments – TEI 121
PM10 Gravimetric Method
Beta attenuation Method
Respirable Dust Sampler
Make –Thermo Environmental Instruments – TEI 108
SO2 IS-5182 Part II
(Improved West & Gaeke method) Respirable Dust Sampler withgaseous attachment
NOx IS-5182 Part II
(Jacob & Hochheiser modified method) Respirable Dust Sampler with gaseous attachment
Free Silica NIOSH – 7601 Visible Spectrophotometry
Source: Sampling Methodology followed by Omegaa Laboratories & CPCB Notification
TABLE 3.16: NATIONAL AMBIENT AIR QUALITY STANDARDS
Sl.
No.
Pollutant Time Weighted
Average
Concentration in ambient air
Industrial, Residential,
Rural & other areas
Ecologically Sensitive area
(Notified by Central Govt.)
1 Sulphur Dioxide (μg/m3) Annual Avg.*
24 hours**
50.0
80.0
20.0
80.0
2 Nitrogen Dioxide (μg/m3) Annual Avg.
24 hours
40.0
80.0
30.0
80.0
3 Particulate matter (size less
than 10µm) PM10 (μg/m3)
Annual Avg.
24 hours
60.0
100.0
60.0
100.0
4 Particulate matter (size less
than 2.5 µm PM2.5 (μg/m3)
Annual Avg.
24 hours
40.0
60.0
40.0
60.0
Source: NAAQS CPCB Notification No. B-29016/20/90/PCI-I Dated: 18th Nov 2009 *Annual Arithmetic mean of minimum 104 measurements in a year taken twice a Week 24 hourly at uniform interval,
** 24 hourly / 8 hourly or 1 hourly monitored value as applicable shall be complied with 98 % of the time in a year. However, 2% of the time, they may exceed the
limits but not on two consecutive days of monitoring.
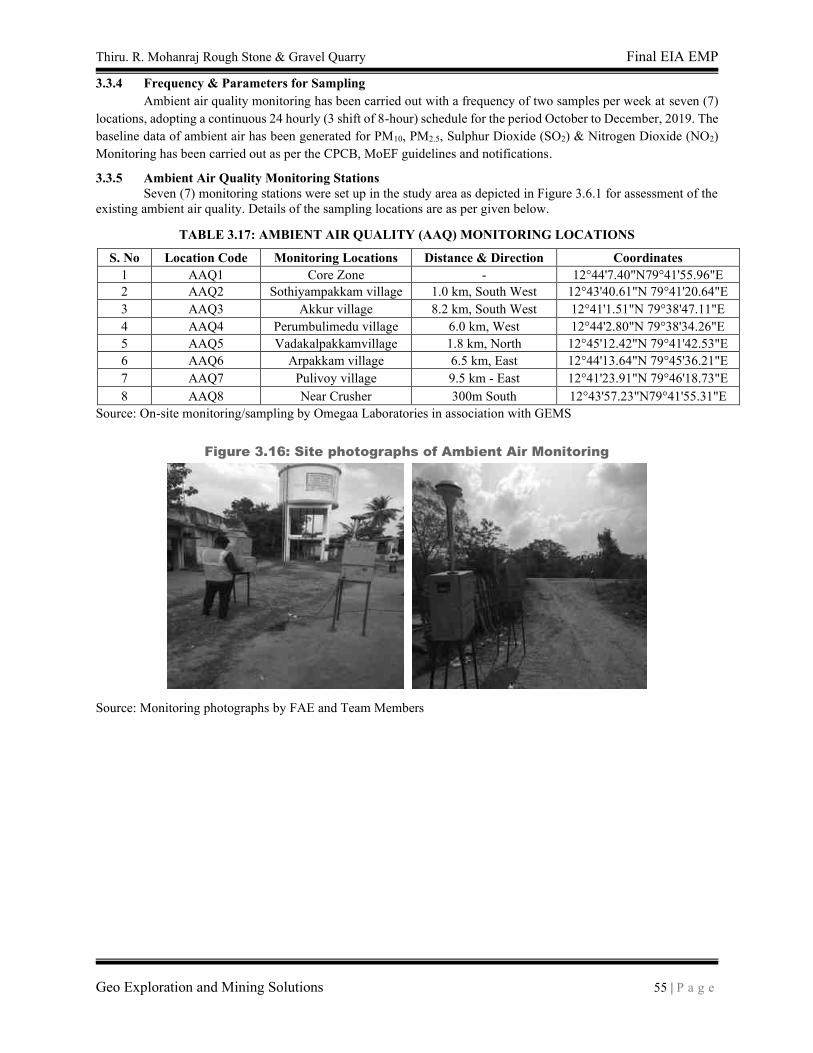
Thiru. R. Mohanraj Rough Stone & Gravel Quarry Final EIA EMP
Geo Exploration and Mining Solutions 55 | P a g e
3.3.4 Frequency & Parameters for Sampling
Ambient air quality monitoring has been carried out with a frequency of two samples per week at seven (7)
locations, adopting a continuous 24 hourly (3 shift of 8-hour) schedule for the period October to December, 2019. The
baseline data of ambient air has been generated for PM10, PM2.5, Sulphur Dioxide (SO2) & Nitrogen Dioxide (NO2)
Monitoring has been carried out as per the CPCB, MoEF guidelines and notifications.
3.3.5 Ambient Air Quality Monitoring Stations
Seven (7) monitoring stations were set up in the study area as depicted in Figure 3.6.1 for assessment of the
existing ambient air quality. Details of the sampling locations are as per given below.
TABLE 3.17: AMBIENT AIR QUALITY (AAQ) MONITORING LOCATIONS
S. No Location Code Monitoring Locations Distance & Direction Coordinates
1 AAQ1 Core Zone - 12°44'7.40"N79°41'55.96"E
2 AAQ2 Sothiyampakkam village 1.0 km, South West 12°43'40.61"N 79°41'20.64"E
3 AAQ3 Akkur village 8.2 km, South West 12°41'1.51"N 79°38'47.11"E
4 AAQ4 Perumbulimedu village 6.0 km, West 12°44'2.80"N 79°38'34.26"E
5 AAQ5 Vadakalpakkamvillage 1.8 km, North 12°45'12.42"N 79°41'42.53"E
6 AAQ6 Arpakkam village 6.5 km, East 12°44'13.64"N 79°45'36.21"E
7 AAQ7 Pulivoy village 9.5 km - East 12°41'23.91"N 79°46'18.73"E
8 AAQ8 Near Crusher 300m South 12°43'57.23"N79°41'55.31"E
Source: On-site monitoring/sampling by Omegaa Laboratories in association with GEMS
Figure 3.16: Site photographs of Ambient Air Monitoring
Source: Monitoring photographs by FAE and Team Members
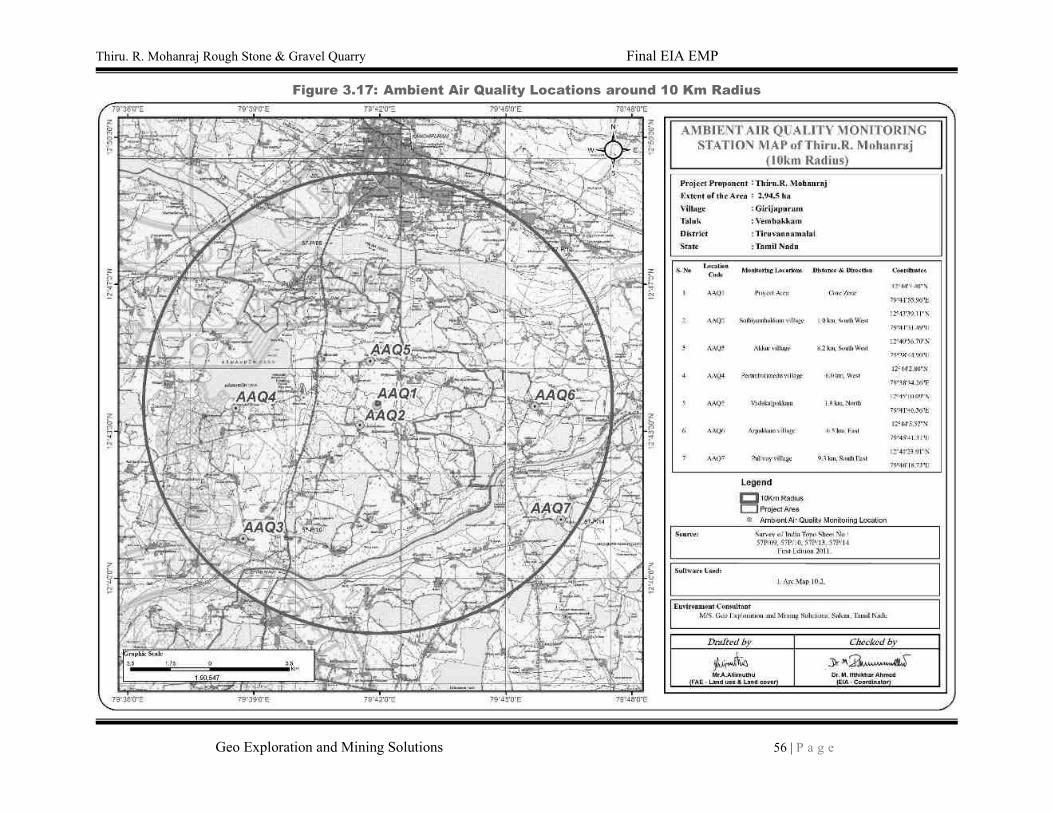
Thiru. R. Mohanraj Rough Stone & Gravel Quarry Final EIA EMP
Geo Exploration and Mining Solutions 56 | P a g e
Figure 3.17: Ambient Air Quality Locations around 10 Km Radius
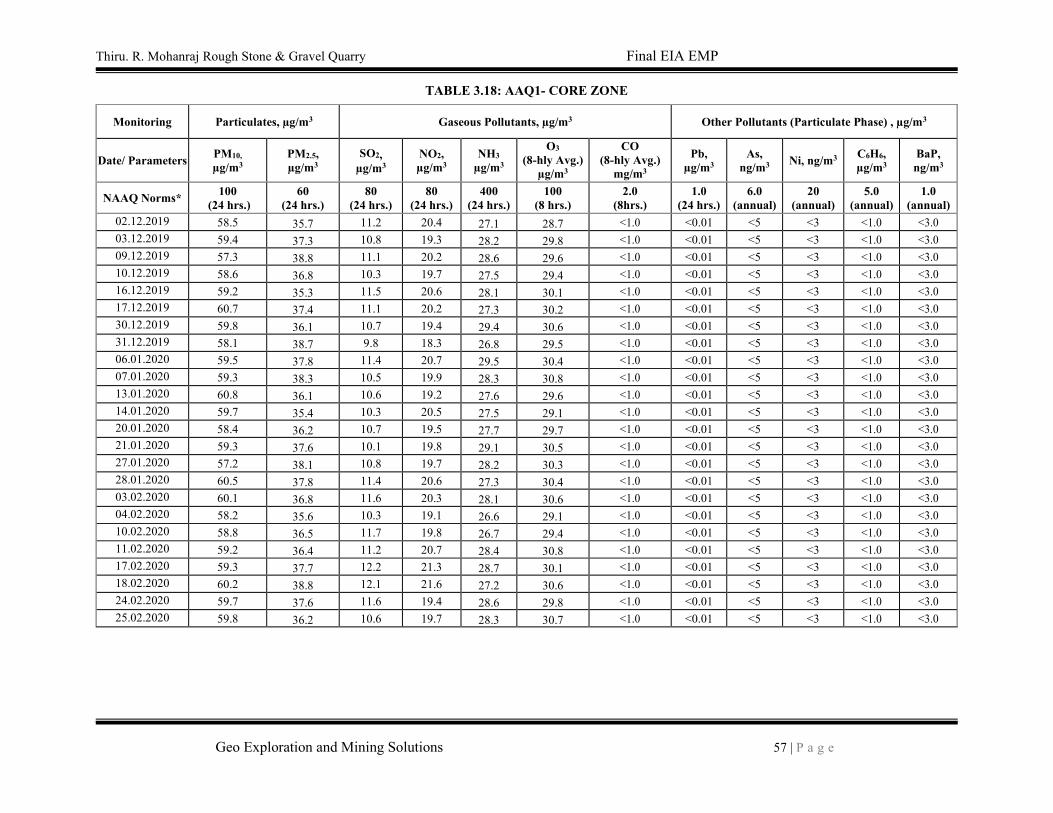
Thiru. R. Mohanraj Rough Stone & Gravel Quarry Final EIA EMP
Geo Exploration and Mining Solutions 57 | P a g e
TABLE 3.18: AAQ1- CORE ZONE
Monitoring Particulates, µg/m3 Gaseous Pollutants, µg/m3 Other Pollutants (Particulate Phase) , µg/m3
Date/ Parameters PM10,
µg/m3
PM2.5,
µg/m3
SO2,
µg/m3
NO2,
µg/m3
NH3
µg/m3
O3 (8-hly Avg.)
µg/m3
CO
(8-hly Avg.)
mg/m3
Pb,
µg/m3
As,
ng/m3 Ni, ng/m3
C6H6, µg/m3
BaP,
ng/m3
NAAQ Norms* 100
(24 hrs.)
60
(24 hrs.)
80
(24 hrs.)
80
(24 hrs.)
400
(24 hrs.)
100
(8 hrs.)
2.0
(8hrs.)
1.0
(24 hrs.)
6.0
(annual)
20
(annual)
5.0
(annual)
1.0
(annual)
02.12.2019 58.5 35.7 11.2 20.4 27.1 28.7 <1.0 <0.01 <5 <3 <1.0 <3.0
03.12.2019 59.4 37.3 10.8 19.3 28.2 29.8 <1.0 <0.01 <5 <3 <1.0 <3.0
09.12.2019 57.3 38.8 11.1 20.2 28.6 29.6 <1.0 <0.01 <5 <3 <1.0 <3.0
10.12.2019 58.6 36.8 10.3 19.7 27.5 29.4 <1.0 <0.01 <5 <3 <1.0 <3.0
16.12.2019 59.2 35.3 11.5 20.6 28.1 30.1 <1.0 <0.01 <5 <3 <1.0 <3.0
17.12.2019 60.7 37.4 11.1 20.2 27.3 30.2 <1.0 <0.01 <5 <3 <1.0 <3.0
30.12.2019 59.8 36.1 10.7 19.4 29.4 30.6 <1.0 <0.01 <5 <3 <1.0 <3.0
31.12.2019 58.1 38.7 9.8 18.3 26.8 29.5 <1.0 <0.01 <5 <3 <1.0 <3.0
06.01.2020 59.5 37.8 11.4 20.7 29.5 30.4 <1.0 <0.01 <5 <3 <1.0 <3.0
07.01.2020 59.3 38.3 10.5 19.9 28.3 30.8 <1.0 <0.01 <5 <3 <1.0 <3.0
13.01.2020 60.8 36.1 10.6 19.2 27.6 29.6 <1.0 <0.01 <5 <3 <1.0 <3.0
14.01.2020 59.7 35.4 10.3 20.5 27.5 29.1 <1.0 <0.01 <5 <3 <1.0 <3.0
20.01.2020 58.4 36.2 10.7 19.5 27.7 29.7 <1.0 <0.01 <5 <3 <1.0 <3.0
21.01.2020 59.3 37.6 10.1 19.8 29.1 30.5 <1.0 <0.01 <5 <3 <1.0 <3.0
27.01.2020 57.2 38.1 10.8 19.7 28.2 30.3 <1.0 <0.01 <5 <3 <1.0 <3.0
28.01.2020 60.5 37.8 11.4 20.6 27.3 30.4 <1.0 <0.01 <5 <3 <1.0 <3.0
03.02.2020 60.1 36.8 11.6 20.3 28.1 30.6 <1.0 <0.01 <5 <3 <1.0 <3.0
04.02.2020 58.2 35.6 10.3 19.1 26.6 29.1 <1.0 <0.01 <5 <3 <1.0 <3.0
10.02.2020 58.8 36.5 11.7 19.8 26.7 29.4 <1.0 <0.01 <5 <3 <1.0 <3.0
11.02.2020 59.2 36.4 11.2 20.7 28.4 30.8 <1.0 <0.01 <5 <3 <1.0 <3.0
17.02.2020 59.3 37.7 12.2 21.3 28.7 30.1 <1.0 <0.01 <5 <3 <1.0 <3.0
18.02.2020 60.2 38.8 12.1 21.6 27.2 30.6 <1.0 <0.01 <5 <3 <1.0 <3.0
24.02.2020 59.7 37.6 11.6 19.4 28.6 29.8 <1.0 <0.01 <5 <3 <1.0 <3.0
25.02.2020 59.8 36.2 10.6 19.7 28.3 30.7 <1.0 <0.01 <5 <3 <1.0 <3.0

Thiru. R. Mohanraj Rough Stone & Gravel Quarry Final EIA EMP
Geo Exploration and Mining Solutions 58 | P a g e
TABLE 3.19: AAQ2 - SOTHIYAMPAKKAM VILLAGE (BUFFER ZONE)
Monitoring Particulates, µg/m3 Gaseous Pollutants, µg/m3 Other Pollutants (Particulate Phase) , µg/m3
Date/ Parameters PM10,
µg/m3
PM2.5,
µg/m3
SO2,
µg/m3
NO2,
µg/m3
NH3
µg/m3
O3 (8-hly Avg.)
µg/m3
CO
(8-hly Avg.)
mg/m3
Pb,
µg/m3
As,
ng/m3 Ni, ng/m3
C6H6, µg/m3
BaP,
ng/m3
NAAQ Norms* 100
(24 hrs.)
60
(24 hrs.)
80
(24 hrs.)
80
(24 hrs.)
400
(24 hrs.)
100
(8 hrs.)
2.0
(8hrs.)
1.0
(24 hrs.)
6.0
(annual)
20
(annual)
5.0
(annual)
1.0
(annual)
02.12.2019 51.7 29.2 8.3 15.7 24.2 26.6 <1.0 <0.01 <5 <3 <1.0 <3.0
03.12.2019 51.8 30.1 8.5 14.8 25.3 26.4 <1.0 <0.01 <5 <3 <1.0 <3.0
09.12.2019 52.1 31 9.4 15.3 25.7 26.3 <1.0 <0.01 <5 <3 <1.0 <3.0
10.12.2019 51.5 29.6 8.6 15.1 24.1 26.7 <1.0 <0.01 <5 <3 <1.0 <3.0
16.12.2019 50.4 30.5 9.8 15.6 25.2 27.5 <1.0 <0.01 <5 <3 <1.0 <3.0
17.12.2019 50.1 30.2 9.4 15.2 24.4 26.1 <1.0 <0.01 <5 <3 <1.0 <3.0
30.12.2019 51.6 29.6 9.2 14.7 25.5 28.5 <1.0 <0.01 <5 <3 <1.0 <3.0
31.12.2019 49.4 31.5 8.1 13.6 23.4 27.4 <1.0 <0.01 <5 <3 <1.0 <3.0
06.01.2020 50.2 30.6 9.7 14.5 25.6 27.1 <1.0 <0.01 <5 <3 <1.0 <3.0
07.01.2020 50.5 31.7 8.8 15.2 25.4 27.7 <1.0 <0.01 <5 <3 <1.0 <3.0
13.01.2020 52.4 30.3 8.6 14.4 25.1 26.1 <1.0 <0.01 <5 <3 <1.0 <3.0
14.01.2020 51.5 31.4 9.2 15.8 24.6 27.5 <1.0 <0.01 <5 <3 <1.0 <3.0
20.01.2020 50.6 29.2 8.5 14.8 24.7 28.2 <1.0 <0.01 <5 <3 <1.0 <3.0
21.01.2020 51.2 30.4 8.4 14.3 25.5 28.4 <1.0 <0.01 <5 <3 <1.0 <3.0
27.01.2020 50.1 30.1 9.1 15.5 25.3 27.8 <1.0 <0.01 <5 <3 <1.0 <3.0
28.01.2020 52.8 30.6 9.3 15.3 24.4 28.3 <1.0 <0.01 <5 <3 <1.0 <3.0
03.02.2020 51.7 29.6 9.7 15.6 25.2 27.6 <1.0 <0.01 <5 <3 <1.0 <3.0
04.02.2020 50.1 29.8 8.6 14.4 23.7 26.4 <1.0 <0.01 <5 <3 <1.0 <3.0
10.02.2020 50.7 29.3 9.8 15.1 24 26.7 <1.0 <0.01 <5 <3 <1.0 <3.0
11.02.2020 51.1 29.2 9.5 16.3 25.5 27.2 <1.0 <0.01 <5 <3 <1.0 <3.0
17.02.2020 51.2 30.5 8.8 16.6 25.1 26.5 <1.0 <0.01 <5 <3 <1.0 <3.0
18.02.2020 52.1 31.6 9.4 16.3 24.3 27.3 <1.0 <0.01 <5 <3 <1.0 <3.0
24.02.2020 51.6 30.7 9.7 15.8 25.7 26.5 <1.0 <0.01 <5 <3 <1.0 <3.0
25.02.2020 51.4 29.3 9.2 15.2 25.4 27.6 <1.0 <0.01 <5 <3 <1.0 <3.0
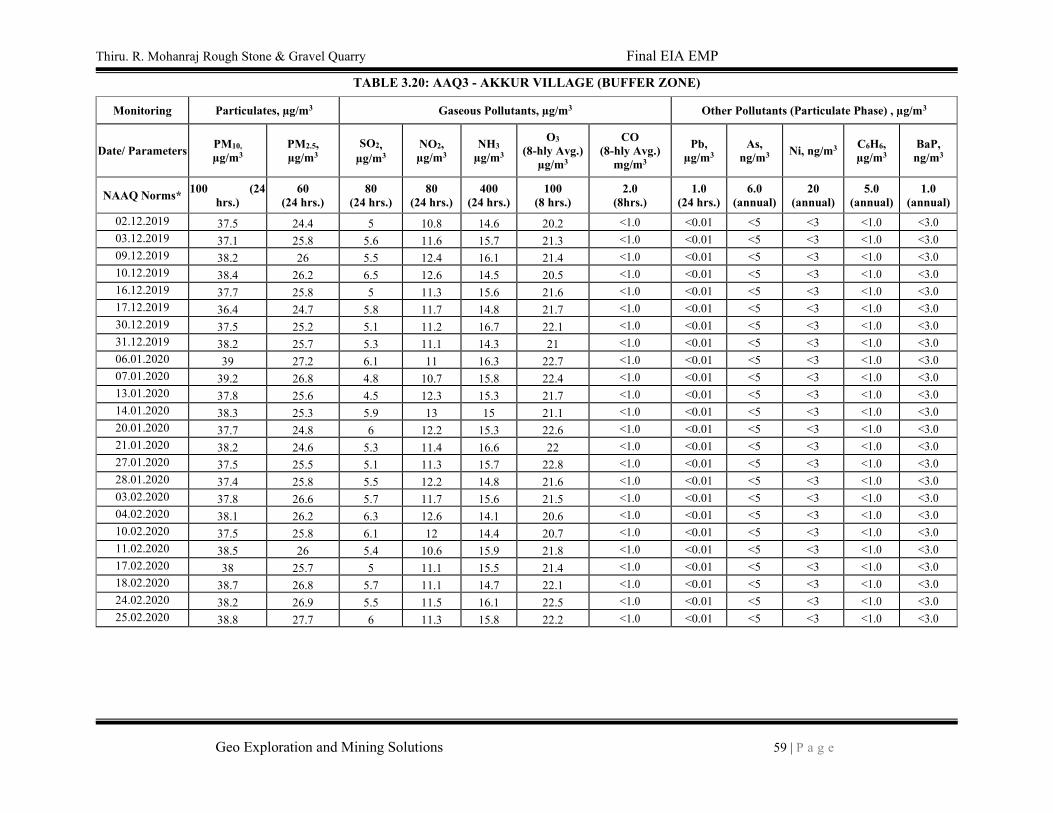
Thiru. R. Mohanraj Rough Stone & Gravel Quarry Final EIA EMP
Geo Exploration and Mining Solutions 59 | P a g e
TABLE 3.20: AAQ3 - AKKUR VILLAGE (BUFFER ZONE)
Monitoring Particulates, µg/m3 Gaseous Pollutants, µg/m3 Other Pollutants (Particulate Phase) , µg/m3
Date/ Parameters PM10,
µg/m3
PM2.5,
µg/m3
SO2,
µg/m3
NO2,
µg/m3
NH3
µg/m3
O3 (8-hly Avg.)
µg/m3
CO
(8-hly Avg.)
mg/m3
Pb,
µg/m3
As,
ng/m3 Ni, ng/m3
C6H6, µg/m3
BaP,
ng/m3
NAAQ Norms* 100 (24
hrs.)
60
(24 hrs.)
80
(24 hrs.)
80
(24 hrs.)
400
(24 hrs.)
100
(8 hrs.)
2.0
(8hrs.)
1.0
(24 hrs.)
6.0
(annual)
20
(annual)
5.0
(annual)
1.0
(annual)
02.12.2019 37.5 24.4 5 10.8 14.6 20.2 <1.0 <0.01 <5 <3 <1.0 <3.0
03.12.2019 37.1 25.8 5.6 11.6 15.7 21.3 <1.0 <0.01 <5 <3 <1.0 <3.0
09.12.2019 38.2 26 5.5 12.4 16.1 21.4 <1.0 <0.01 <5 <3 <1.0 <3.0
10.12.2019 38.4 26.2 6.5 12.6 14.5 20.5 <1.0 <0.01 <5 <3 <1.0 <3.0
16.12.2019 37.7 25.8 5 11.3 15.6 21.6 <1.0 <0.01 <5 <3 <1.0 <3.0
17.12.2019 36.4 24.7 5.8 11.7 14.8 21.7 <1.0 <0.01 <5 <3 <1.0 <3.0
30.12.2019 37.5 25.2 5.1 11.2 16.7 22.1 <1.0 <0.01 <5 <3 <1.0 <3.0
31.12.2019 38.2 25.7 5.3 11.1 14.3 21 <1.0 <0.01 <5 <3 <1.0 <3.0
06.01.2020 39 27.2 6.1 11 16.3 22.7 <1.0 <0.01 <5 <3 <1.0 <3.0
07.01.2020 39.2 26.8 4.8 10.7 15.8 22.4 <1.0 <0.01 <5 <3 <1.0 <3.0
13.01.2020 37.8 25.6 4.5 12.3 15.3 21.7 <1.0 <0.01 <5 <3 <1.0 <3.0
14.01.2020 38.3 25.3 5.9 13 15 21.1 <1.0 <0.01 <5 <3 <1.0 <3.0
20.01.2020 37.7 24.8 6 12.2 15.3 22.6 <1.0 <0.01 <5 <3 <1.0 <3.0
21.01.2020 38.2 24.6 5.3 11.4 16.6 22 <1.0 <0.01 <5 <3 <1.0 <3.0
27.01.2020 37.5 25.5 5.1 11.3 15.7 22.8 <1.0 <0.01 <5 <3 <1.0 <3.0
28.01.2020 37.4 25.8 5.5 12.2 14.8 21.6 <1.0 <0.01 <5 <3 <1.0 <3.0
03.02.2020 37.8 26.6 5.7 11.7 15.6 21.5 <1.0 <0.01 <5 <3 <1.0 <3.0
04.02.2020 38.1 26.2 6.3 12.6 14.1 20.6 <1.0 <0.01 <5 <3 <1.0 <3.0
10.02.2020 37.5 25.8 6.1 12 14.4 20.7 <1.0 <0.01 <5 <3 <1.0 <3.0
11.02.2020 38.5 26 5.4 10.6 15.9 21.8 <1.0 <0.01 <5 <3 <1.0 <3.0
17.02.2020 38 25.7 5 11.1 15.5 21.4 <1.0 <0.01 <5 <3 <1.0 <3.0
18.02.2020 38.7 26.8 5.7 11.1 14.7 22.1 <1.0 <0.01 <5 <3 <1.0 <3.0
24.02.2020 38.2 26.9 5.5 11.5 16.1 22.5 <1.0 <0.01 <5 <3 <1.0 <3.0
25.02.2020 38.8 27.7 6 11.3 15.8 22.2 <1.0 <0.01 <5 <3 <1.0 <3.0
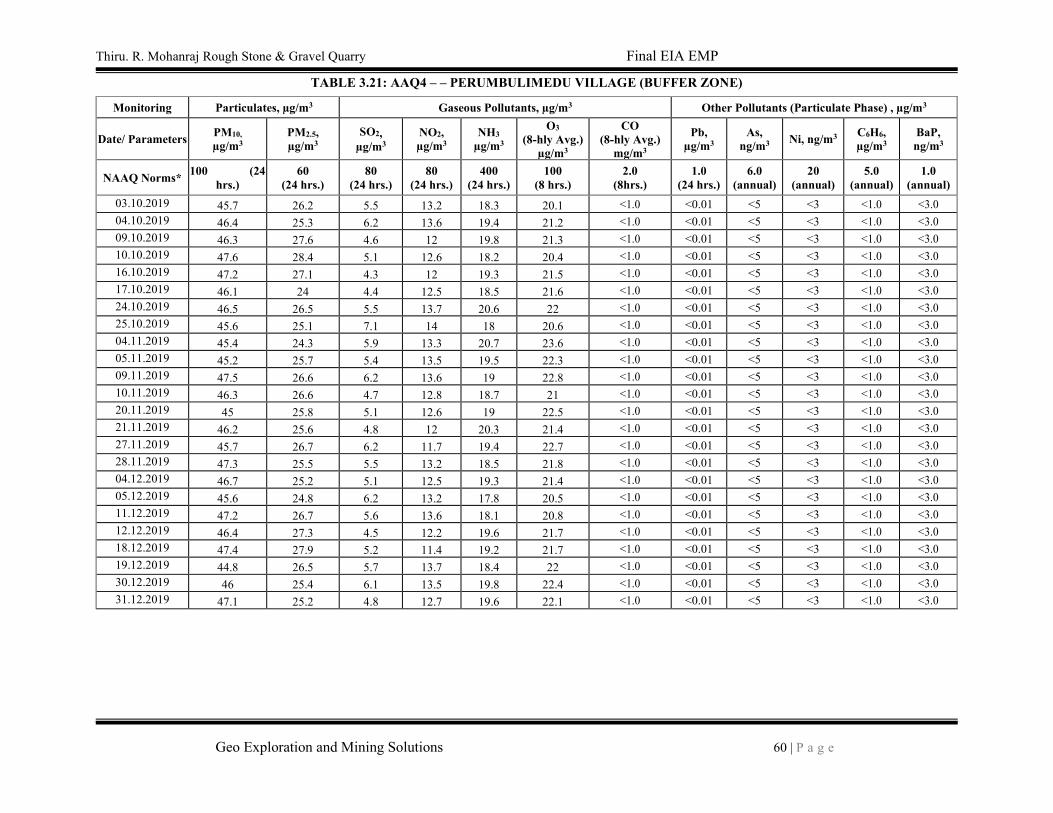
Thiru. R. Mohanraj Rough Stone & Gravel Quarry Final EIA EMP
Geo Exploration and Mining Solutions 60 | P a g e
TABLE 3.21: AAQ4 – – PERUMBULIMEDU VILLAGE (BUFFER ZONE)
Monitoring Particulates, µg/m3 Gaseous Pollutants, µg/m3 Other Pollutants (Particulate Phase) , µg/m3
Date/ Parameters PM10,
µg/m3
PM2.5,
µg/m3
SO2,
µg/m3
NO2,
µg/m3
NH3
µg/m3
O3 (8-hly Avg.)
µg/m3
CO
(8-hly Avg.)
mg/m3
Pb,
µg/m3
As,
ng/m3 Ni, ng/m3
C6H6, µg/m3
BaP,
ng/m3
NAAQ Norms* 100 (24
hrs.)
60
(24 hrs.)
80
(24 hrs.)
80
(24 hrs.)
400
(24 hrs.)
100
(8 hrs.)
2.0
(8hrs.)
1.0
(24 hrs.)
6.0
(annual)
20
(annual)
5.0
(annual)
1.0
(annual)
03.10.2019 45.7 26.2 5.5 13.2 18.3 20.1 <1.0 <0.01 <5 <3 <1.0 <3.0
04.10.2019 46.4 25.3 6.2 13.6 19.4 21.2 <1.0 <0.01 <5 <3 <1.0 <3.0
09.10.2019 46.3 27.6 4.6 12 19.8 21.3 <1.0 <0.01 <5 <3 <1.0 <3.0
10.10.2019 47.6 28.4 5.1 12.6 18.2 20.4 <1.0 <0.01 <5 <3 <1.0 <3.0
16.10.2019 47.2 27.1 4.3 12 19.3 21.5 <1.0 <0.01 <5 <3 <1.0 <3.0
17.10.2019 46.1 24 4.4 12.5 18.5 21.6 <1.0 <0.01 <5 <3 <1.0 <3.0
24.10.2019 46.5 26.5 5.5 13.7 20.6 22 <1.0 <0.01 <5 <3 <1.0 <3.0
25.10.2019 45.6 25.1 7.1 14 18 20.6 <1.0 <0.01 <5 <3 <1.0 <3.0
04.11.2019 45.4 24.3 5.9 13.3 20.7 23.6 <1.0 <0.01 <5 <3 <1.0 <3.0
05.11.2019 45.2 25.7 5.4 13.5 19.5 22.3 <1.0 <0.01 <5 <3 <1.0 <3.0
09.11.2019 47.5 26.6 6.2 13.6 19 22.8 <1.0 <0.01 <5 <3 <1.0 <3.0
10.11.2019 46.3 26.6 4.7 12.8 18.7 21 <1.0 <0.01 <5 <3 <1.0 <3.0
20.11.2019 45 25.8 5.1 12.6 19 22.5 <1.0 <0.01 <5 <3 <1.0 <3.0
21.11.2019 46.2 25.6 4.8 12 20.3 21.4 <1.0 <0.01 <5 <3 <1.0 <3.0
27.11.2019 45.7 26.7 6.2 11.7 19.4 22.7 <1.0 <0.01 <5 <3 <1.0 <3.0
28.11.2019 47.3 25.5 5.5 13.2 18.5 21.8 <1.0 <0.01 <5 <3 <1.0 <3.0
04.12.2019 46.7 25.2 5.1 12.5 19.3 21.4 <1.0 <0.01 <5 <3 <1.0 <3.0
05.12.2019 45.6 24.8 6.2 13.2 17.8 20.5 <1.0 <0.01 <5 <3 <1.0 <3.0
11.12.2019 47.2 26.7 5.6 13.6 18.1 20.8 <1.0 <0.01 <5 <3 <1.0 <3.0
12.12.2019 46.4 27.3 4.5 12.2 19.6 21.7 <1.0 <0.01 <5 <3 <1.0 <3.0
18.12.2019 47.4 27.9 5.2 11.4 19.2 21.7 <1.0 <0.01 <5 <3 <1.0 <3.0
19.12.2019 44.8 26.5 5.7 13.7 18.4 22 <1.0 <0.01 <5 <3 <1.0 <3.0
30.12.2019 46 25.4 6.1 13.5 19.8 22.4 <1.0 <0.01 <5 <3 <1.0 <3.0
31.12.2019 47.1 25.2 4.8 12.7 19.6 22.1 <1.0 <0.01 <5 <3 <1.0 <3.0

Thiru. R. Mohanraj Rough Stone & Gravel Quarry Final EIA EMP
Geo Exploration and Mining Solutions 61 | P a g e
TABLE 3.22: AAQ5 -VADAKALPAKKAM VILLAGE (BUFFER ZONE)
Monitoring Particulates, µg/m3 Gaseous Pollutants, µg/m3 Other Pollutants (Particulate Phase) , µg/m3
Date/ Parameters PM10,
µg/m3
PM2.5,
µg/m3
SO2,
µg/m3
NO2,
µg/m3
NH3
µg/m3
O3 (8-hly Avg.)
µg/m3
CO
(8-hly Avg.)
mg/m3
Pb,
µg/m3
As,
ng/m3 Ni, ng/m3
C6H6, µg/m3
BaP,
ng/m3
NAAQ Norms* 100 (24
hrs.)
60
(24 hrs.)
80
(24 hrs.)
80
(24 hrs.)
400
(24 hrs.)
100
(8 hrs.)
2.0
(8hrs.)
1.0
(24 hrs.)
6.0
(annual)
20
(annual)
5.0
(annual)
1.0
(annual)
02.12.2019 40.2 26.7 8 13.6 20.1 23.5 <1.0 <0.01 <5 <3 <1.0 <3.0
03.12.2019 40.4 25.6 7.2 12.3 21.2 24.6 <1.0 <0.01 <5 <3 <1.0 <3.0
09.12.2019 38.7 25.4 8.8 13.4 21.6 24.7 <1.0 <0.01 <5 <3 <1.0 <3.0
10.12.2019 38.5 25.7 8.2 12.8 20 23.8 <1.0 <0.01 <5 <3 <1.0 <3.0
16.12.2019 38.4 24.6 8.8 12.9 21.1 24.3 <1.0 <0.01 <5 <3 <1.0 <3.0
17.12.2019 38.3 26 7.6 13.5 20.3 25 <1.0 <0.01 <5 <3 <1.0 <3.0
30.12.2019 38.7 25.4 7.3 12.8 22.4 25.4 <1.0 <0.01 <5 <3 <1.0 <3.0
31.12.2019 38.5 25.5 7.4 12.4 19.8 24.3 <1.0 <0.01 <5 <3 <1.0 <3.0
06.01.2020 39.1 25.8 7.7 13 22.5 27 <1.0 <0.01 <5 <3 <1.0 <3.0
07.01.2020 39.3 26.6 8 13.8 21.3 25.7 <1.0 <0.01 <5 <3 <1.0 <3.0
13.01.2020 38.7 27.1 8 13.3 20.8 26.2 <1.0 <0.01 <5 <3 <1.0 <3.0
14.01.2020 38.8 25.6 7.4 12.7 20.5 24.4 <1.0 <0.01 <5 <3 <1.0 <3.0
20.01.2020 37.6 24.4 6.8 12.3 20.8 25.9 <1.0 <0.01 <5 <3 <1.0 <3.0
21.01.2020 39 25.3 7.6 12.7 22.1 25.3 <1.0 <0.01 <5 <3 <1.0 <3.0
27.01.2020 39.5 25.7 7.8 13.4 21.2 26.1 <1.0 <0.01 <5 <3 <1.0 <3.0
28.01.2020 39.2 26.4 8 13.6 20.4 25.5 <1.0 <0.01 <5 <3 <1.0 <3.0
03.02.2020 39.4 26.6 7.5 12.4 21.1 24.8 <1.0 <0.01 <5 <3 <1.0 <3.0
04.02.2020 39.7 27.4 8.2 13.1 19.6 23.7 <1.0 <0.01 <5 <3 <1.0 <3.0
10.02.2020 40 27 9 14 19.5 24.2 <1.0 <0.01 <5 <3 <1.0 <3.0
11.02.2020 38.7 26.5 9.2 14.2 21.4 25.1 <1.0 <0.01 <5 <3 <1.0 <3.0
17.02.2020 39.5 27.3 9.6 13.8 21 25.1 <1.0 <0.01 <5 <3 <1.0 <3.0
18.02.2020 40.5 25.3 8.4 14.7 20.2 25.4 <1.0 <0.01 <5 <3 <1.0 <3.0
24.02.2020 38.6 25 7.1 12.3 21.6 25.8 <1.0 <0.01 <5 <3 <1.0 <3.0
25.02.2020 40.2 26.8 8.7 13.7 21.3 25.5 <1.0 <0.01 <5 <3 <1.0 <3.0
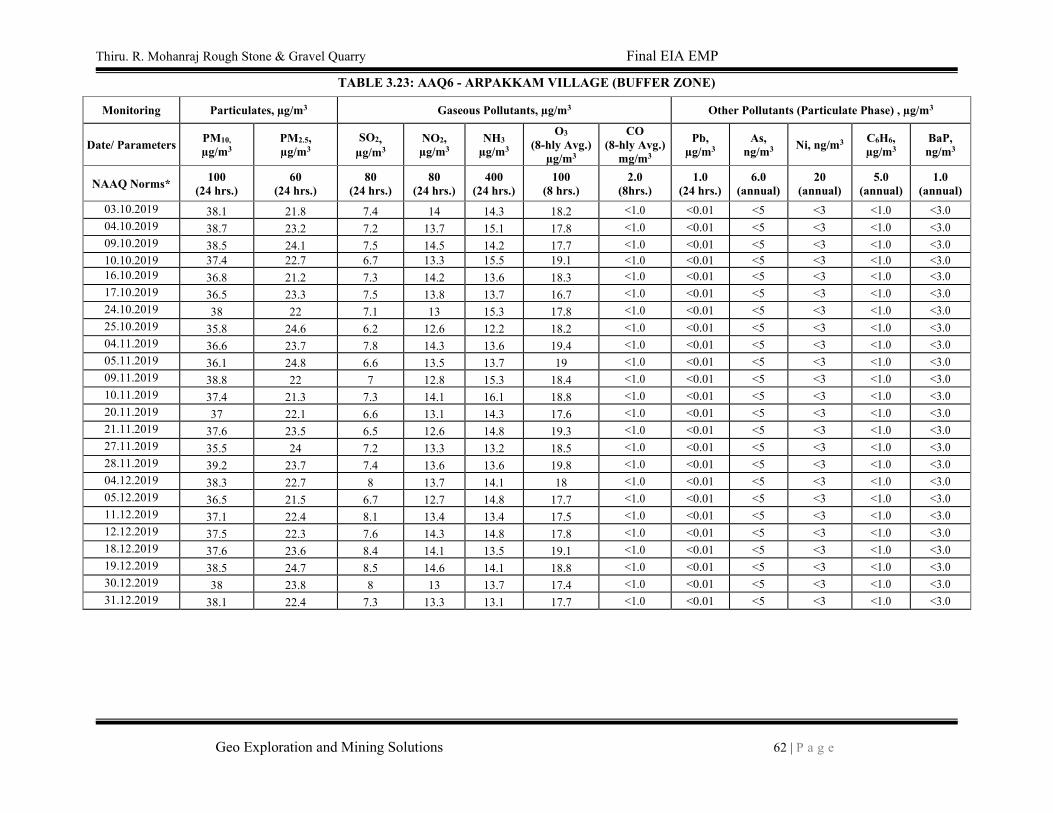
Thiru. R. Mohanraj Rough Stone & Gravel Quarry Final EIA EMP
Geo Exploration and Mining Solutions 62 | P a g e
TABLE 3.23: AAQ6 - ARPAKKAM VILLAGE (BUFFER ZONE)
Monitoring Particulates, µg/m3 Gaseous Pollutants, µg/m3 Other Pollutants (Particulate Phase) , µg/m3
Date/ Parameters PM10,
µg/m3
PM2.5,
µg/m3
SO2,
µg/m3
NO2,
µg/m3
NH3
µg/m3
O3 (8-hly Avg.)
µg/m3
CO
(8-hly Avg.)
mg/m3
Pb,
µg/m3
As,
ng/m3 Ni, ng/m3
C6H6, µg/m3
BaP,
ng/m3
NAAQ Norms* 100
(24 hrs.)
60
(24 hrs.)
80
(24 hrs.)
80
(24 hrs.)
400
(24 hrs.)
100
(8 hrs.)
2.0
(8hrs.)
1.0
(24 hrs.)
6.0
(annual)
20
(annual)
5.0
(annual)
1.0
(annual)
03.10.2019 38.1 21.8 7.4 14 14.3 18.2 <1.0 <0.01 <5 <3 <1.0 <3.0
04.10.2019 38.7 23.2 7.2 13.7 15.1 17.8 <1.0 <0.01 <5 <3 <1.0 <3.0
09.10.2019 38.5 24.1 7.5 14.5 14.2 17.7 <1.0 <0.01 <5 <3 <1.0 <3.0
10.10.2019 37.4 22.7 6.7 13.3 15.5 19.1 <1.0 <0.01 <5 <3 <1.0 <3.0
16.10.2019 36.8 21.2 7.3 14.2 13.6 18.3 <1.0 <0.01 <5 <3 <1.0 <3.0
17.10.2019 36.5 23.3 7.5 13.8 13.7 16.7 <1.0 <0.01 <5 <3 <1.0 <3.0
24.10.2019 38 22 7.1 13 15.3 17.8 <1.0 <0.01 <5 <3 <1.0 <3.0
25.10.2019 35.8 24.6 6.2 12.6 12.2 18.2 <1.0 <0.01 <5 <3 <1.0 <3.0
04.11.2019 36.6 23.7 7.8 14.3 13.6 19.4 <1.0 <0.01 <5 <3 <1.0 <3.0
05.11.2019 36.1 24.8 6.6 13.5 13.7 19 <1.0 <0.01 <5 <3 <1.0 <3.0
09.11.2019 38.8 22 7 12.8 15.3 18.4 <1.0 <0.01 <5 <3 <1.0 <3.0
10.11.2019 37.4 21.3 7.3 14.1 16.1 18.8 <1.0 <0.01 <5 <3 <1.0 <3.0
20.11.2019 37 22.1 6.6 13.1 14.3 17.6 <1.0 <0.01 <5 <3 <1.0 <3.0
21.11.2019 37.6 23.5 6.5 12.6 14.8 19.3 <1.0 <0.01 <5 <3 <1.0 <3.0
27.11.2019 35.5 24 7.2 13.3 13.2 18.5 <1.0 <0.01 <5 <3 <1.0 <3.0
28.11.2019 39.2 23.7 7.4 13.6 13.6 19.8 <1.0 <0.01 <5 <3 <1.0 <3.0
04.12.2019 38.3 22.7 8 13.7 14.1 18 <1.0 <0.01 <5 <3 <1.0 <3.0
05.12.2019 36.5 21.5 6.7 12.7 14.8 17.7 <1.0 <0.01 <5 <3 <1.0 <3.0
11.12.2019 37.1 22.4 8.1 13.4 13.4 17.5 <1.0 <0.01 <5 <3 <1.0 <3.0
12.12.2019 37.5 22.3 7.6 14.3 14.8 17.8 <1.0 <0.01 <5 <3 <1.0 <3.0
18.12.2019 37.6 23.6 8.4 14.1 13.5 19.1 <1.0 <0.01 <5 <3 <1.0 <3.0
19.12.2019 38.5 24.7 8.5 14.6 14.1 18.8 <1.0 <0.01 <5 <3 <1.0 <3.0
30.12.2019 38 23.8 8 13 13.7 17.4 <1.0 <0.01 <5 <3 <1.0 <3.0
31.12.2019 38.1 22.4 7.3 13.3 13.1 17.7 <1.0 <0.01 <5 <3 <1.0 <3.0
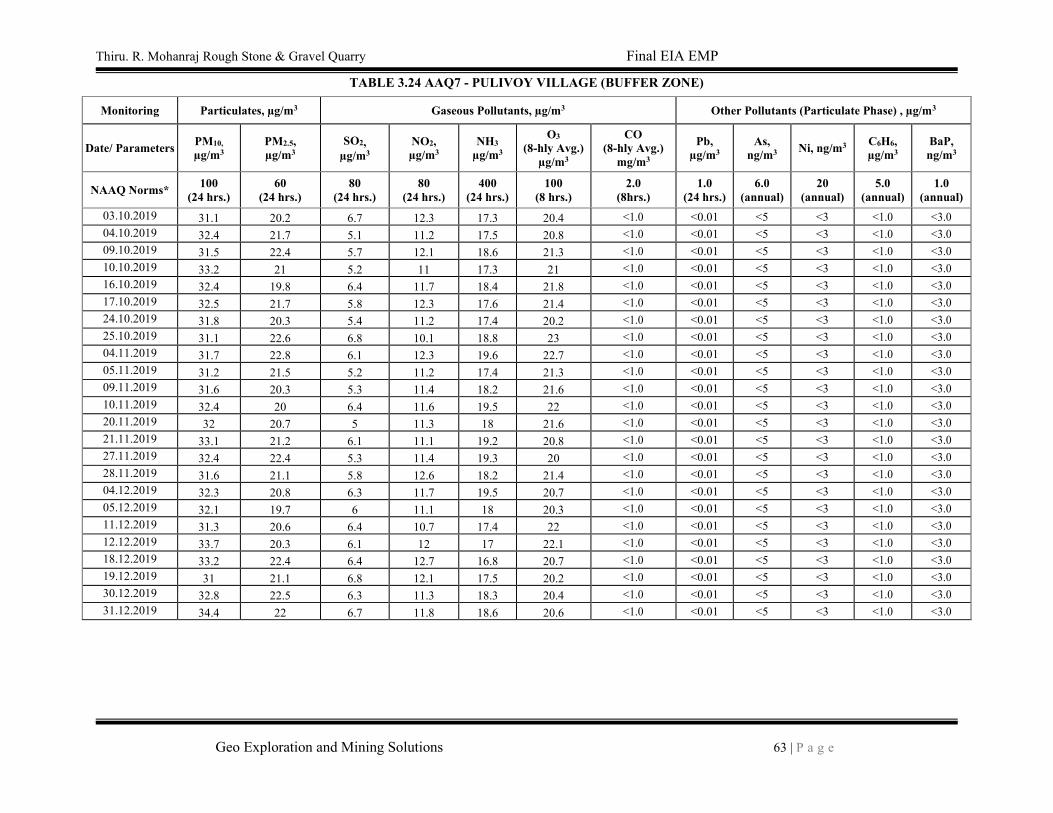
Thiru. R. Mohanraj Rough Stone & Gravel Quarry Final EIA EMP
Geo Exploration and Mining Solutions 63 | P a g e
TABLE 3.24 AAQ7 - PULIVOY VILLAGE (BUFFER ZONE)
Monitoring Particulates, µg/m3 Gaseous Pollutants, µg/m3 Other Pollutants (Particulate Phase) , µg/m3
Date/ Parameters PM10,
µg/m3
PM2.5,
µg/m3
SO2,
µg/m3
NO2,
µg/m3
NH3
µg/m3
O3 (8-hly Avg.)
µg/m3
CO
(8-hly Avg.)
mg/m3
Pb,
µg/m3
As,
ng/m3 Ni, ng/m3
C6H6, µg/m3
BaP,
ng/m3
NAAQ Norms* 100
(24 hrs.)
60
(24 hrs.)
80
(24 hrs.)
80
(24 hrs.)
400
(24 hrs.)
100
(8 hrs.)
2.0
(8hrs.)
1.0
(24 hrs.)
6.0
(annual)
20
(annual)
5.0
(annual)
1.0
(annual)
03.10.2019 31.1 20.2 6.7 12.3 17.3 20.4 <1.0 <0.01 <5 <3 <1.0 <3.0
04.10.2019 32.4 21.7 5.1 11.2 17.5 20.8 <1.0 <0.01 <5 <3 <1.0 <3.0
09.10.2019 31.5 22.4 5.7 12.1 18.6 21.3 <1.0 <0.01 <5 <3 <1.0 <3.0
10.10.2019 33.2 21 5.2 11 17.3 21 <1.0 <0.01 <5 <3 <1.0 <3.0
16.10.2019 32.4 19.8 6.4 11.7 18.4 21.8 <1.0 <0.01 <5 <3 <1.0 <3.0
17.10.2019 32.5 21.7 5.8 12.3 17.6 21.4 <1.0 <0.01 <5 <3 <1.0 <3.0
24.10.2019 31.8 20.3 5.4 11.2 17.4 20.2 <1.0 <0.01 <5 <3 <1.0 <3.0
25.10.2019 31.1 22.6 6.8 10.1 18.8 23 <1.0 <0.01 <5 <3 <1.0 <3.0
04.11.2019 31.7 22.8 6.1 12.3 19.6 22.7 <1.0 <0.01 <5 <3 <1.0 <3.0
05.11.2019 31.2 21.5 5.2 11.2 17.4 21.3 <1.0 <0.01 <5 <3 <1.0 <3.0
09.11.2019 31.6 20.3 5.3 11.4 18.2 21.6 <1.0 <0.01 <5 <3 <1.0 <3.0
10.11.2019 32.4 20 6.4 11.6 19.5 22 <1.0 <0.01 <5 <3 <1.0 <3.0
20.11.2019 32 20.7 5 11.3 18 21.6 <1.0 <0.01 <5 <3 <1.0 <3.0
21.11.2019 33.1 21.2 6.1 11.1 19.2 20.8 <1.0 <0.01 <5 <3 <1.0 <3.0
27.11.2019 32.4 22.4 5.3 11.4 19.3 20 <1.0 <0.01 <5 <3 <1.0 <3.0
28.11.2019 31.6 21.1 5.8 12.6 18.2 21.4 <1.0 <0.01 <5 <3 <1.0 <3.0
04.12.2019 32.3 20.8 6.3 11.7 19.5 20.7 <1.0 <0.01 <5 <3 <1.0 <3.0
05.12.2019 32.1 19.7 6 11.1 18 20.3 <1.0 <0.01 <5 <3 <1.0 <3.0
11.12.2019 31.3 20.6 6.4 10.7 17.4 22 <1.0 <0.01 <5 <3 <1.0 <3.0
12.12.2019 33.7 20.3 6.1 12 17 22.1 <1.0 <0.01 <5 <3 <1.0 <3.0
18.12.2019 33.2 22.4 6.4 12.7 16.8 20.7 <1.0 <0.01 <5 <3 <1.0 <3.0
19.12.2019 31 21.1 6.8 12.1 17.5 20.2 <1.0 <0.01 <5 <3 <1.0 <3.0
30.12.2019 32.8 22.5 6.3 11.3 18.3 20.4 <1.0 <0.01 <5 <3 <1.0 <3.0
31.12.2019 34.4 22 6.7 11.8 18.6 20.6 <1.0 <0.01 <5 <3 <1.0 <3.0
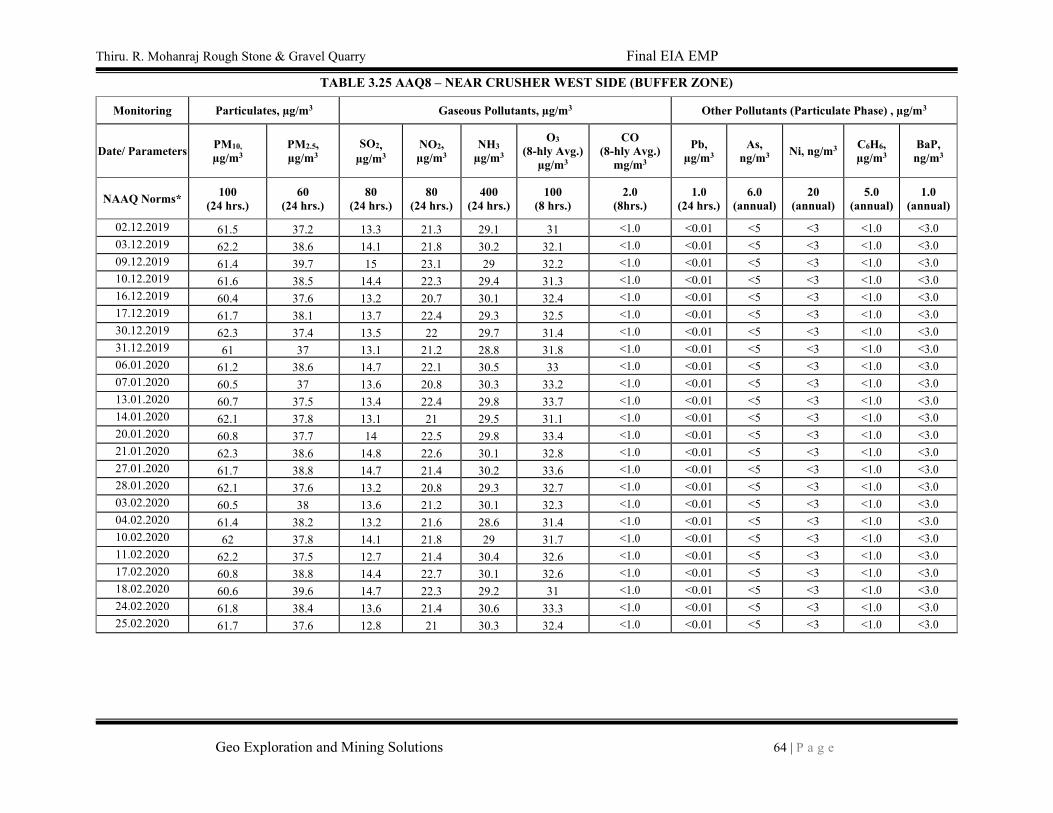
Thiru. R. Mohanraj Rough Stone & Gravel Quarry Final EIA EMP
Geo Exploration and Mining Solutions 64 | P a g e
TABLE 3.25 AAQ8 – NEAR CRUSHER WEST SIDE (BUFFER ZONE)
Monitoring Particulates, µg/m3 Gaseous Pollutants, µg/m3 Other Pollutants (Particulate Phase) , µg/m3
Date/ Parameters PM10,
µg/m3
PM2.5,
µg/m3
SO2,
µg/m3
NO2,
µg/m3
NH3
µg/m3
O3 (8-hly Avg.)
µg/m3
CO
(8-hly Avg.)
mg/m3
Pb,
µg/m3
As,
ng/m3 Ni, ng/m3
C6H6, µg/m3
BaP,
ng/m3
NAAQ Norms* 100
(24 hrs.)
60
(24 hrs.)
80
(24 hrs.)
80
(24 hrs.)
400
(24 hrs.)
100
(8 hrs.)
2.0
(8hrs.)
1.0
(24 hrs.)
6.0
(annual)
20
(annual)
5.0
(annual)
1.0
(annual)
02.12.2019 61.5 37.2 13.3 21.3 29.1 31 <1.0 <0.01 <5 <3 <1.0 <3.0
03.12.2019 62.2 38.6 14.1 21.8 30.2 32.1 <1.0 <0.01 <5 <3 <1.0 <3.0
09.12.2019 61.4 39.7 15 23.1 29 32.2 <1.0 <0.01 <5 <3 <1.0 <3.0
10.12.2019 61.6 38.5 14.4 22.3 29.4 31.3 <1.0 <0.01 <5 <3 <1.0 <3.0
16.12.2019 60.4 37.6 13.2 20.7 30.1 32.4 <1.0 <0.01 <5 <3 <1.0 <3.0
17.12.2019 61.7 38.1 13.7 22.4 29.3 32.5 <1.0 <0.01 <5 <3 <1.0 <3.0
30.12.2019 62.3 37.4 13.5 22 29.7 31.4 <1.0 <0.01 <5 <3 <1.0 <3.0
31.12.2019 61 37 13.1 21.2 28.8 31.8 <1.0 <0.01 <5 <3 <1.0 <3.0
06.01.2020 61.2 38.6 14.7 22.1 30.5 33 <1.0 <0.01 <5 <3 <1.0 <3.0
07.01.2020 60.5 37 13.6 20.8 30.3 33.2 <1.0 <0.01 <5 <3 <1.0 <3.0
13.01.2020 60.7 37.5 13.4 22.4 29.8 33.7 <1.0 <0.01 <5 <3 <1.0 <3.0
14.01.2020 62.1 37.8 13.1 21 29.5 31.1 <1.0 <0.01 <5 <3 <1.0 <3.0
20.01.2020 60.8 37.7 14 22.5 29.8 33.4 <1.0 <0.01 <5 <3 <1.0 <3.0
21.01.2020 62.3 38.6 14.8 22.6 30.1 32.8 <1.0 <0.01 <5 <3 <1.0 <3.0
27.01.2020 61.7 38.8 14.7 21.4 30.2 33.6 <1.0 <0.01 <5 <3 <1.0 <3.0
28.01.2020 62.1 37.6 13.2 20.8 29.3 32.7 <1.0 <0.01 <5 <3 <1.0 <3.0
03.02.2020 60.5 38 13.6 21.2 30.1 32.3 <1.0 <0.01 <5 <3 <1.0 <3.0
04.02.2020 61.4 38.2 13.2 21.6 28.6 31.4 <1.0 <0.01 <5 <3 <1.0 <3.0
10.02.2020 62 37.8 14.1 21.8 29 31.7 <1.0 <0.01 <5 <3 <1.0 <3.0
11.02.2020 62.2 37.5 12.7 21.4 30.4 32.6 <1.0 <0.01 <5 <3 <1.0 <3.0
17.02.2020 60.8 38.8 14.4 22.7 30.1 32.6 <1.0 <0.01 <5 <3 <1.0 <3.0
18.02.2020 60.6 39.6 14.7 22.3 29.2 31 <1.0 <0.01 <5 <3 <1.0 <3.0
24.02.2020 61.8 38.4 13.6 21.4 30.6 33.3 <1.0 <0.01 <5 <3 <1.0 <3.0
25.02.2020 61.7 37.6 12.8 21 30.3 32.4 <1.0 <0.01 <5 <3 <1.0 <3.0
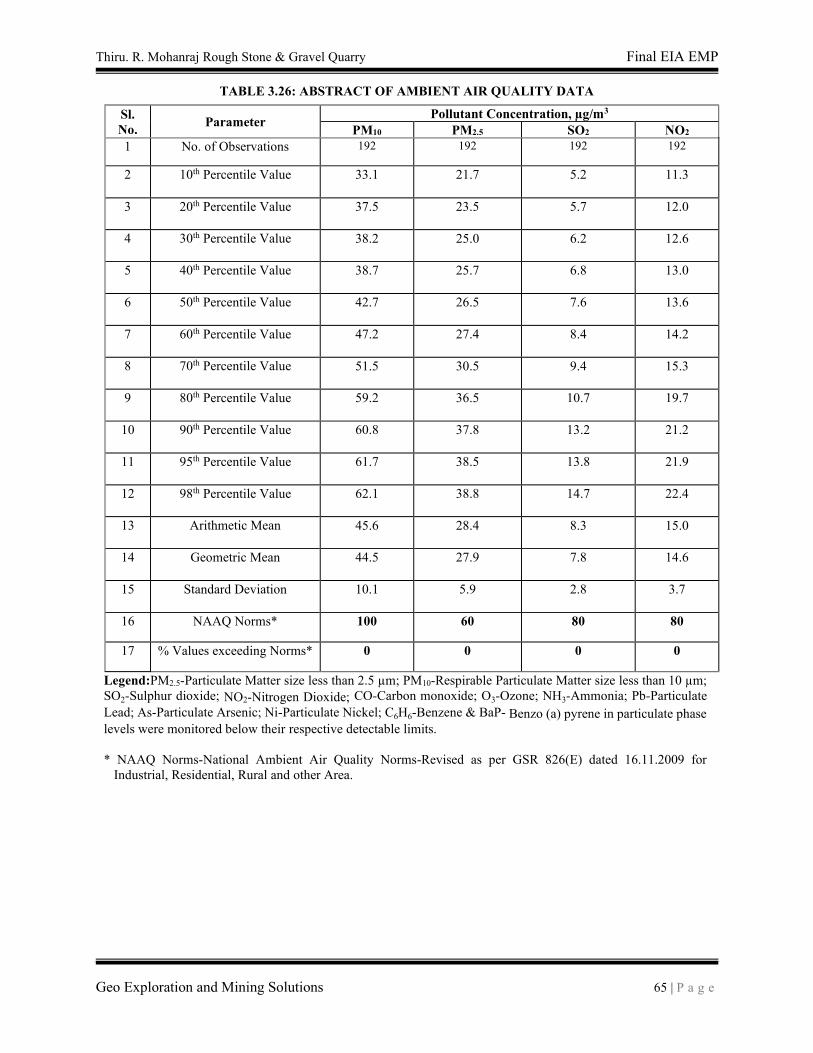
Thiru. R. Mohanraj Rough Stone & Gravel Quarry Final EIA EMP
Geo Exploration and Mining Solutions 65 | P a g e
TABLE 3.26: ABSTRACT OF AMBIENT AIR QUALITY DATA
Sl.
No. Parameter
Pollutant Concentration, µg/m3
PM10 PM2.5 SO2 NO2
1 No. of Observations 192 192 192 192
2 10th Percentile Value 33.1 21.7 5.2 11.3
3 20th Percentile Value 37.5 23.5 5.7 12.0
4 30th Percentile Value 38.2 25.0 6.2 12.6
5 40th Percentile Value 38.7 25.7 6.8 13.0
6 50th Percentile Value 42.7 26.5 7.6 13.6
7 60th Percentile Value 47.2 27.4 8.4 14.2
8 70th Percentile Value 51.5 30.5 9.4 15.3
9 80th Percentile Value 59.2 36.5 10.7 19.7
10 90th Percentile Value 60.8 37.8 13.2 21.2
11 95th Percentile Value 61.7 38.5 13.8 21.9
12 98th Percentile Value 62.1 38.8 14.7 22.4
13 Arithmetic Mean 45.6 28.4 8.3 15.0
14 Geometric Mean 44.5 27.9 7.8 14.6
15 Standard Deviation 10.1 5.9 2.8 3.7
16 NAAQ Norms* 100 60 80 80
17 % Values exceeding Norms* 0 0 0 0
Legend:PM2.5-Particulate Matter size less than 2.5 µm; PM10-Respirable Particulate Matter size less than 10 µm;
SO2-Sulphur dioxide; NO2-Nitrogen Dioxide; CO-Carbon monoxide; O3-Ozone; NH3-Ammonia; Pb-Particulate
Lead; As-Particulate Arsenic; Ni-Particulate Nickel; C6H6-Benzene & BaP- Benzo (a) pyrene in particulate phase
levels were monitored below their respective detectable limits.
* NAAQ Norms-National Ambient Air Quality Norms-Revised as per GSR 826(E) dated 16.11.2009 for
Industrial, Residential, Rural and other Area.
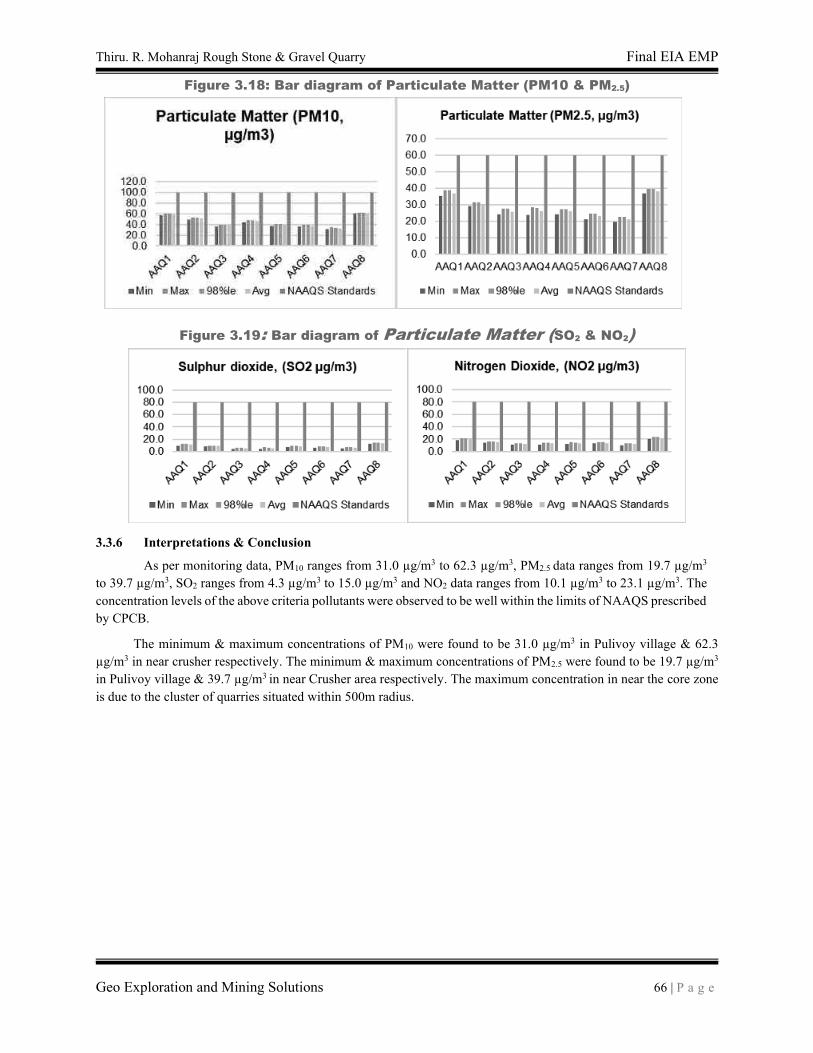
Thiru. R. Mohanraj Rough Stone & Gravel Quarry Final EIA EMP
Geo Exploration and Mining Solutions 66 | P a g e
Figure 3.18: Bar diagram of Particulate Matter (PM10 & PM2.5)
Figure 3.19: Bar diagram of Particulate Matter (SO2 & NO2)
3.3.6 Interpretations & Conclusion
As per monitoring data, PM10 ranges from 31.0 µg/m3 to 62.3 µg/m3, PM2.5 data ranges from 19.7 µg/m3
to 39.7 µg/m3, SO2 ranges from 4.3 µg/m3 to 15.0 µg/m3 and NO2 data ranges from 10.1 µg/m3 to 23.1 µg/m3. The
concentration levels of the above criteria pollutants were observed to be well within the limits of NAAQS prescribed
by CPCB.
The minimum & maximum concentrations of PM10 were found to be 31.0 µg/m3 in Pulivoy village & 62.3
µg/m3 in near crusher respectively. The minimum & maximum concentrations of PM2.5 were found to be 19.7 µg/m3
in Pulivoy village & 39.7 µg/m3 in near Crusher area respectively. The maximum concentration in near the core zone
is due to the cluster of quarries situated within 500m radius.
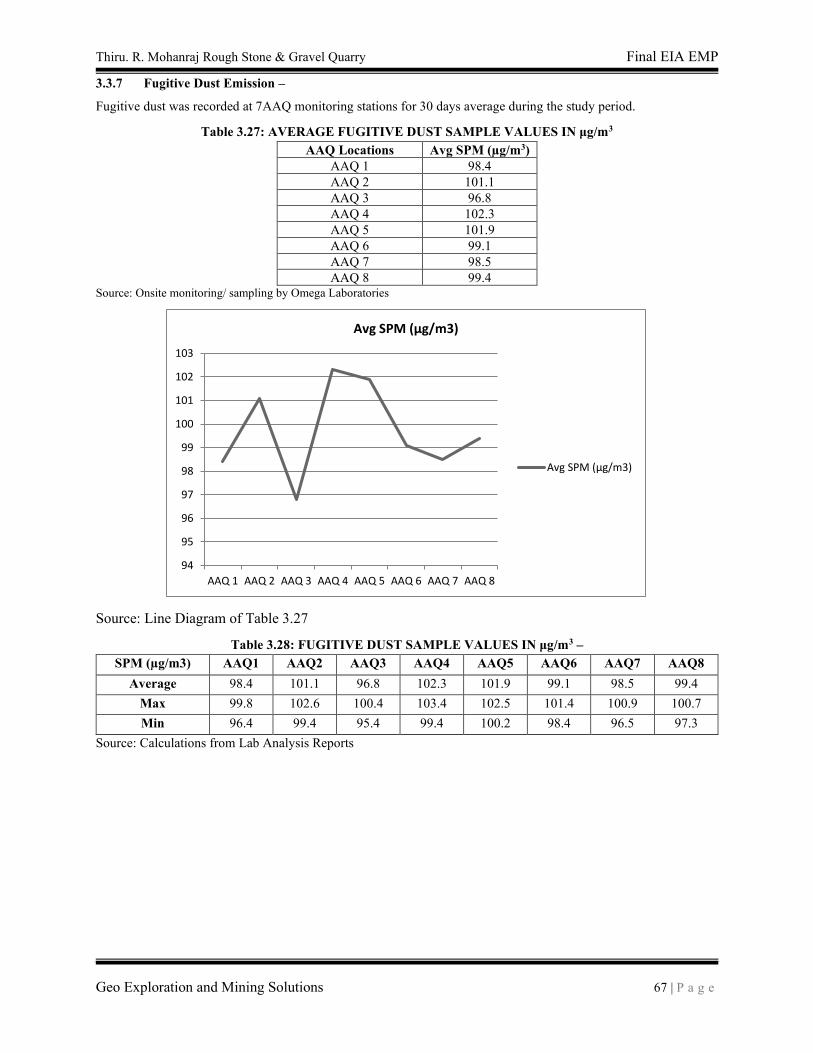
Thiru. R. Mohanraj Rough Stone & Gravel Quarry Final EIA EMP
Geo Exploration and Mining Solutions 67 | P a g e
3.3.7 Fugitive Dust Emission –
Fugitive dust was recorded at 7AAQ monitoring stations for 30 days average during the study period.
Table 3.27: AVERAGE FUGITIVE DUST SAMPLE VALUES IN μg/m3
AAQ Locations Avg SPM (µg/m3)
AAQ 1 98.4
AAQ 2 101.1
AAQ 3 96.8
AAQ 4 102.3
AAQ 5 101.9
AAQ 6 99.1
AAQ 7 98.5
AAQ 8 99.4 Source: Onsite monitoring/ sampling by Omega Laboratories
Source: Line Diagram of Table 3.27
Table 3.28: FUGITIVE DUST SAMPLE VALUES IN μg/m3 –
SPM (µg/m3) AAQ1 AAQ2 AAQ3 AAQ4 AAQ5 AAQ6 AAQ7 AAQ8
Average 98.4 101.1 96.8 102.3 101.9 99.1 98.5 99.4
Max 99.8 102.6 100.4 103.4 102.5 101.4 100.9 100.7
Min 96.4 99.4 95.4 99.4 100.2 98.4 96.5 97.3
Source: Calculations from Lab Analysis Reports
94
95
96
97
98
99
100
101
102
103
AAQ 1 AAQ 2 AAQ 3 AAQ 4 AAQ 5 AAQ 6 AAQ 7 AAQ 8
Avg SPM (µg/m3)
Avg SPM (µg/m3)
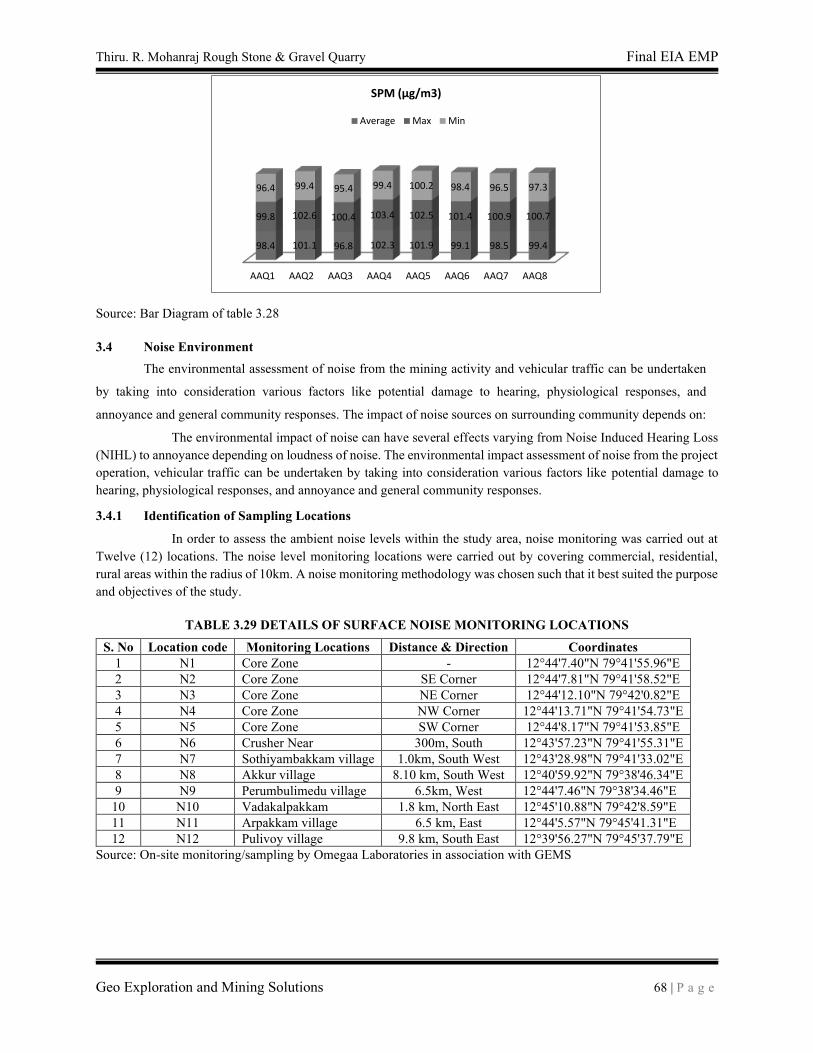
Thiru. R. Mohanraj Rough Stone & Gravel Quarry Final EIA EMP
Geo Exploration and Mining Solutions 68 | P a g e
Source: Bar Diagram of table 3.28
3.4 Noise Environment
The environmental assessment of noise from the mining activity and vehicular traffic can be undertaken
by taking into consideration various factors like potential damage to hearing, physiological responses, and
annoyance and general community responses. The impact of noise sources on surrounding community depends on:
The environmental impact of noise can have several effects varying from Noise Induced Hearing Loss
(NIHL) to annoyance depending on loudness of noise. The environmental impact assessment of noise from the project
operation, vehicular traffic can be undertaken by taking into consideration various factors like potential damage to
hearing, physiological responses, and annoyance and general community responses.
3.4.1 Identification of Sampling Locations
In order to assess the ambient noise levels within the study area, noise monitoring was carried out at
Twelve (12) locations. The noise level monitoring locations were carried out by covering commercial, residential,
rural areas within the radius of 10km. A noise monitoring methodology was chosen such that it best suited the purpose
and objectives of the study.
TABLE 3.29 DETAILS OF SURFACE NOISE MONITORING LOCATIONS
S. No Location code Monitoring Locations Distance & Direction Coordinates
1 N1 Core Zone - 12°44'7.40"N 79°41'55.96"E
2 N2 Core Zone SE Corner 12°44'7.81"N 79°41'58.52"E
3 N3 Core Zone NE Corner 12°44'12.10"N 79°42'0.82"E
4 N4 Core Zone NW Corner 12°44'13.71"N 79°41'54.73"E
5 N5 Core Zone SW Corner 12°44'8.17"N 79°41'53.85"E
6 N6 Crusher Near 300m, South 12°43'57.23"N 79°41'55.31"E
7 N7 Sothiyambakkam village 1.0km, South West 12°43'28.98"N 79°41'33.02"E
8 N8 Akkur village 8.10 km, South West 12°40'59.92"N 79°38'46.34"E
9 N9 Perumbulimedu village 6.5km, West 12°44'7.46"N 79°38'34.46"E
10 N10 Vadakalpakkam 1.8 km, North East 12°45'10.88"N 79°42'8.59"E
11 N11 Arpakkam village 6.5 km, East 12°44'5.57"N 79°45'41.31"E
12 N12 Pulivoy village 9.8 km, South East 12°39'56.27"N 79°45'37.79"E
Source: On-site monitoring/sampling by Omegaa Laboratories in association with GEMS
AAQ1 AAQ2 AAQ3 AAQ4 AAQ5 AAQ6 AAQ7 AAQ8
98.4 101.1 96.8 102.3 101.9 99.1 98.5 99.4
99.8 102.6 100.4 103.4 102.5 101.4 100.9 100.7
96.4 99.4 95.4 99.4 100.2 98.4 96.5 97.3
SPM (µg/m3)
Average Max Min
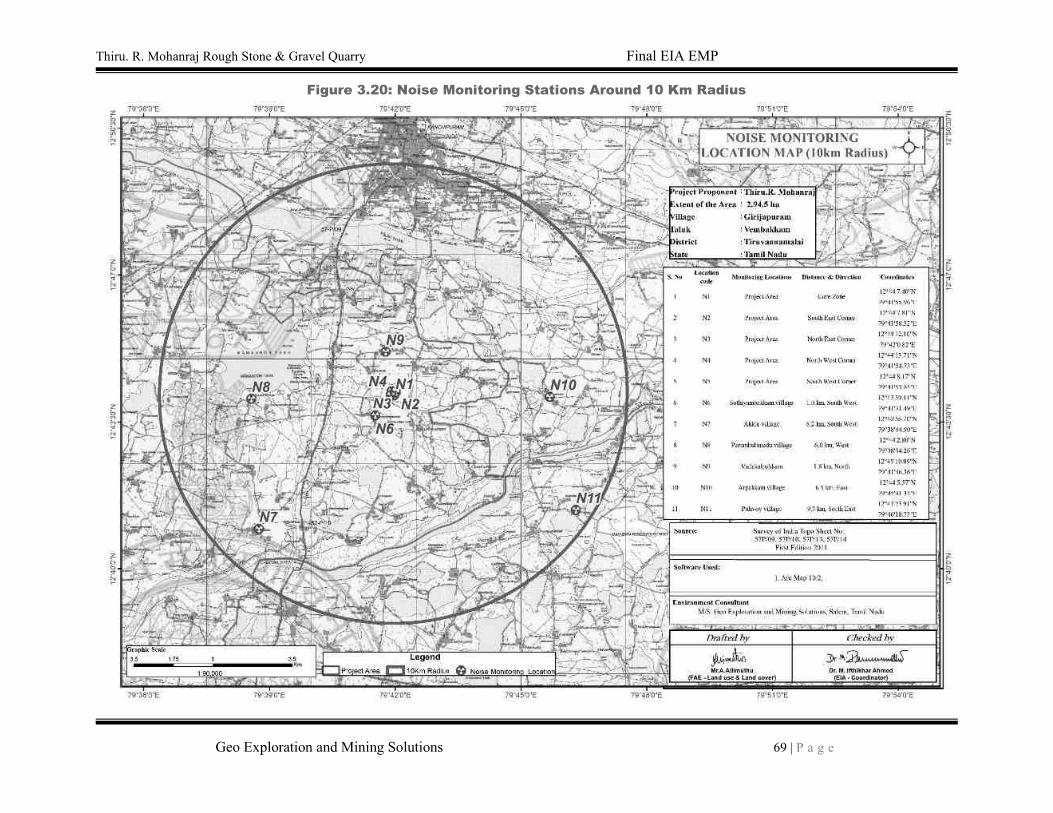
Thiru. R. Mohanraj Rough Stone & Gravel Quarry Final EIA EMP
Geo Exploration and Mining Solutions 69 | P a g e
Figure 3.20: Noise Monitoring Stations Around 10 Km Radius
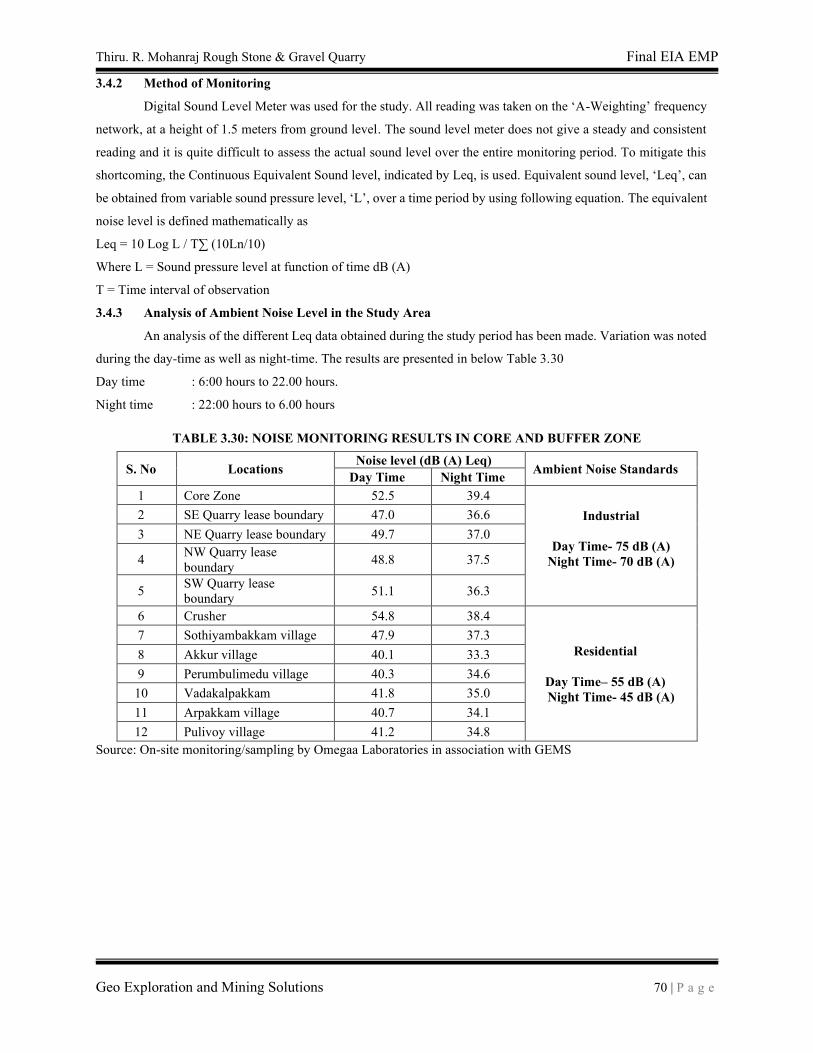
Thiru. R. Mohanraj Rough Stone & Gravel Quarry Final EIA EMP
Geo Exploration and Mining Solutions 70 | P a g e
3.4.2 Method of Monitoring
Digital Sound Level Meter was used for the study. All reading was taken on the ‘A-Weighting’ frequency
network, at a height of 1.5 meters from ground level. The sound level meter does not give a steady and consistent
reading and it is quite difficult to assess the actual sound level over the entire monitoring period. To mitigate this
shortcoming, the Continuous Equivalent Sound level, indicated by Leq, is used. Equivalent sound level, ‘Leq’, can
be obtained from variable sound pressure level, ‘L’, over a time period by using following equation. The equivalent
noise level is defined mathematically as
Leq = 10 Log L / T∑ (10Ln/10)
Where L = Sound pressure level at function of time dB (A)
T = Time interval of observation
3.4.3 Analysis of Ambient Noise Level in the Study Area
An analysis of the different Leq data obtained during the study period has been made. Variation was noted
during the day-time as well as night-time. The results are presented in below Table 3.30
Day time : 6:00 hours to 22.00 hours.
Night time : 22:00 hours to 6.00 hours
TABLE 3.30: NOISE MONITORING RESULTS IN CORE AND BUFFER ZONE
S. No Locations Noise level (dB (A) Leq)
Ambient Noise Standards Day Time Night Time
1 Core Zone 52.5 39.4
Industrial
Day Time- 75 dB (A)
Night Time- 70 dB (A)
2 SE Quarry lease boundary 47.0 36.6
3 NE Quarry lease boundary 49.7 37.0
4 NW Quarry lease
boundary 48.8 37.5
5 SW Quarry lease
boundary 51.1 36.3
6 Crusher 54.8 38.4
Residential
Day Time– 55 dB (A)
Night Time- 45 dB (A)
7 Sothiyambakkam village 47.9 37.3
8 Akkur village 40.1 33.3
9 Perumbulimedu village 40.3 34.6
10 Vadakalpakkam 41.8 35.0
11 Arpakkam village 40.7 34.1
12 Pulivoy village 41.2 34.8
Source: On-site monitoring/sampling by Omegaa Laboratories in association with GEMS
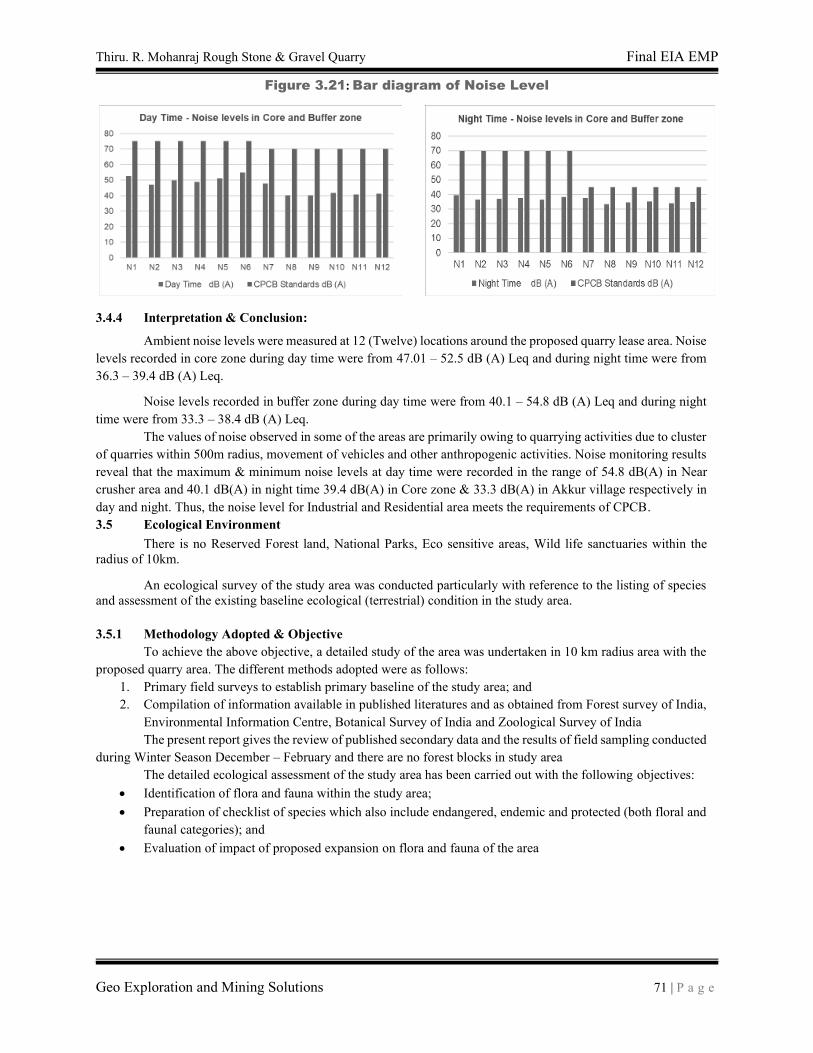
Thiru. R. Mohanraj Rough Stone & Gravel Quarry Final EIA EMP
Geo Exploration and Mining Solutions 71 | P a g e
Figure 3.21: Bar diagram of Noise Level
3.4.4 Interpretation & Conclusion:
Ambient noise levels were measured at 12 (Twelve) locations around the proposed quarry lease area. Noise
levels recorded in core zone during day time were from 47.01 – 52.5 dB (A) Leq and during night time were from
36.3 – 39.4 dB (A) Leq.
Noise levels recorded in buffer zone during day time were from 40.1 – 54.8 dB (A) Leq and during night
time were from 33.3 – 38.4 dB (A) Leq.
The values of noise observed in some of the areas are primarily owing to quarrying activities due to cluster
of quarries within 500m radius, movement of vehicles and other anthropogenic activities. Noise monitoring results
reveal that the maximum & minimum noise levels at day time were recorded in the range of 54.8 dB(A) in Near
crusher area and 40.1 dB(A) in night time 39.4 dB(A) in Core zone & 33.3 dB(A) in Akkur village respectively in
day and night. Thus, the noise level for Industrial and Residential area meets the requirements of CPCB.
3.5 Ecological Environment
There is no Reserved Forest land, National Parks, Eco sensitive areas, Wild life sanctuaries within the
radius of 10km.
An ecological survey of the study area was conducted particularly with reference to the listing of species
and assessment of the existing baseline ecological (terrestrial) condition in the study area.
3.5.1 Methodology Adopted & Objective
To achieve the above objective, a detailed study of the area was undertaken in 10 km radius area with the
proposed quarry area. The different methods adopted were as follows:
1. Primary field surveys to establish primary baseline of the study area; and
2. Compilation of information available in published literatures and as obtained from Forest survey of India,
Environmental Information Centre, Botanical Survey of India and Zoological Survey of India
The present report gives the review of published secondary data and the results of field sampling conducted
during Winter Season December – February and there are no forest blocks in study area
The detailed ecological assessment of the study area has been carried out with the following objectives:
• Identification of flora and fauna within the study area;
• Preparation of checklist of species which also include endangered, endemic and protected (both floral and
faunal categories); and
• Evaluation of impact of proposed expansion on flora and fauna of the area
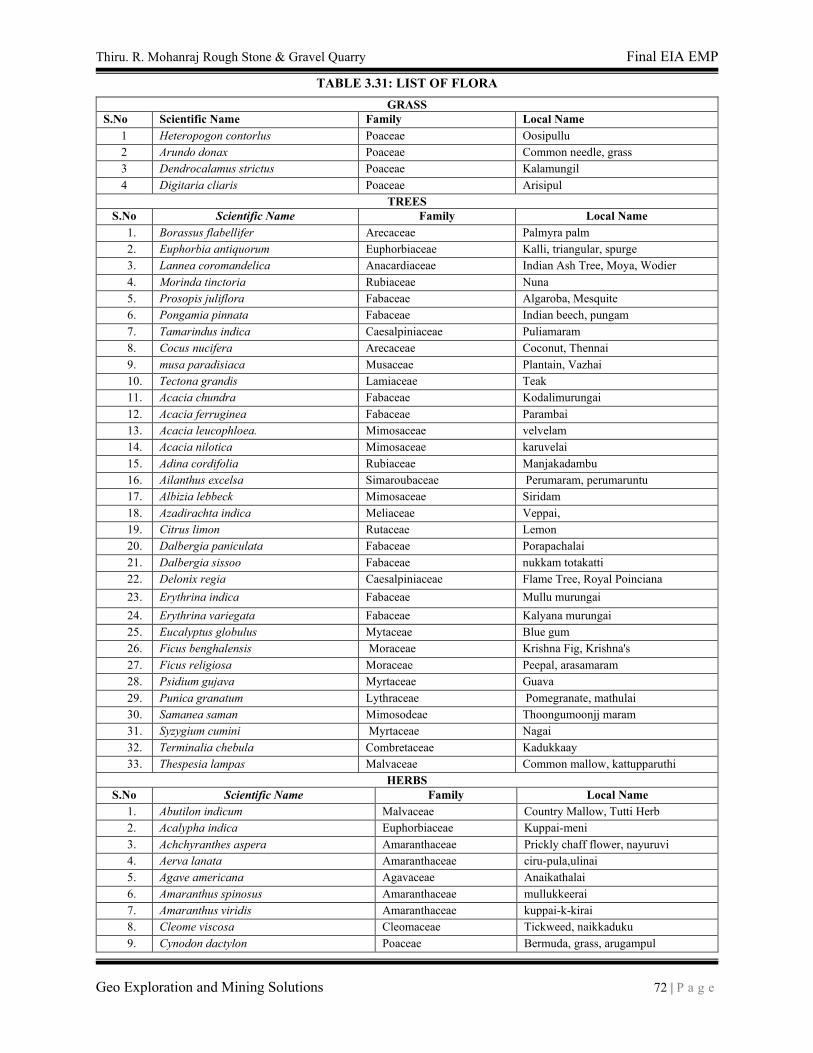
Thiru. R. Mohanraj Rough Stone & Gravel Quarry Final EIA EMP
Geo Exploration and Mining Solutions 72 | P a g e
TABLE 3.31: LIST OF FLORA
GRASS
S.No Scientific Name Family Local Name
1 Heteropogon contorlus Poaceae Oosipullu
2 Arundo donax Poaceae Common needle, grass
3 Dendrocalamus strictus Poaceae Kalamungil
4 Digitaria cliaris Poaceae Arisipul
TREES
S.No Scientific Name Family Local Name
1. Borassus flabellifer Arecaceae Palmyra palm
2. Euphorbia antiquorum Euphorbiaceae Kalli, triangular, spurge
3. Lannea coromandelica Anacardiaceae Indian Ash Tree, Moya, Wodier
4. Morinda tinctoria Rubiaceae Nuna
5. Prosopis juliflora Fabaceae Algaroba, Mesquite
6. Pongamia pinnata Fabaceae Indian beech, pungam
7. Tamarindus indica Caesalpiniaceae Puliamaram
8. Cocus nucifera Arecaceae Coconut, Thennai
9. musa paradisiaca Musaceae Plantain, Vazhai
10. Tectona grandis Lamiaceae Teak
11. Acacia chundra Fabaceae Kodalimurungai
12. Acacia ferruginea Fabaceae Parambai
13. Acacia leucophloea. Mimosaceae velvelam
14. Acacia nilotica Mimosaceae karuvelai
15. Adina cordifolia Rubiaceae Manjakadambu
16. Ailanthus excelsa Simaroubaceae Perumaram, perumaruntu
17. Albizia lebbeck Mimosaceae Siridam
18. Azadirachta indica Meliaceae Veppai,
19. Citrus limon Rutaceae Lemon
20. Dalbergia paniculata Fabaceae Porapachalai
21. Dalbergia sissoo Fabaceae nukkam totakatti
22. Delonix regia Caesalpiniaceae Flame Tree, Royal Poinciana
23. Erythrina indica Fabaceae Mullu murungai
24. Erythrina variegata Fabaceae Kalyana murungai
25. Eucalyptus globulus Mytaceae Blue gum
26. Ficus benghalensis Moraceae Krishna Fig, Krishna's
27. Ficus religiosa Moraceae Peepal, arasamaram
28. Psidium gujava Myrtaceae Guava
29. Punica granatum Lythraceae Pomegranate, mathulai
30. Samanea saman Mimosodeae Thoongumoonjj maram
31. Syzygium cumini Myrtaceae Nagai
32. Terminalia chebula Combretaceae Kadukkaay
33. Thespesia lampas Malvaceae Common mallow, kattupparuthi
HERBS
S.No Scientific Name Family Local Name
1. Abutilon indicum Malvaceae Country Mallow, Tutti Herb
2. Acalypha indica Euphorbiaceae Kuppai-meni
3. Achchyranthes aspera Amaranthaceae Prickly chaff flower, nayuruvi
4. Aerva lanata Amaranthaceae ciru-pula,ulinai
5. Agave americana Agavaceae Anaikathalai
6. Amaranthus spinosus Amaranthaceae mullukkeerai
7. Amaranthus viridis Amaranthaceae kuppai-k-kirai
8. Cleome viscosa Cleomaceae Tickweed, naikkaduku
9. Cynodon dactylon Poaceae Bermuda, grass, arugampul
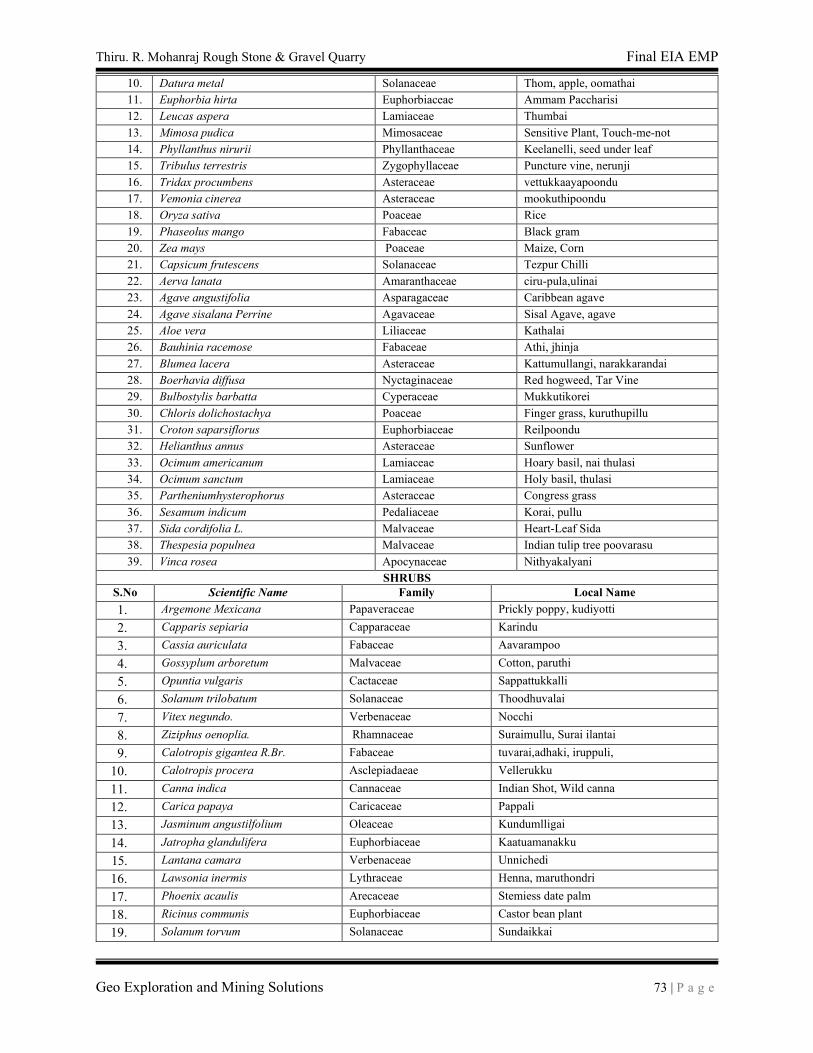
Thiru. R. Mohanraj Rough Stone & Gravel Quarry Final EIA EMP
Geo Exploration and Mining Solutions 73 | P a g e
10. Datura metal Solanaceae Thom, apple, oomathai
11. Euphorbia hirta Euphorbiaceae Ammam Paccharisi
12. Leucas aspera Lamiaceae Thumbai
13. Mimosa pudica Mimosaceae Sensitive Plant, Touch-me-not
14. Phyllanthus nirurii Phyllanthaceae Keelanelli, seed under leaf
15. Tribulus terrestris Zygophyllaceae Puncture vine, nerunji
16. Tridax procumbens Asteraceae vettukkaayapoondu
17. Vemonia cinerea Asteraceae mookuthipoondu
18. Oryza sativa Poaceae Rice
19. Phaseolus mango Fabaceae Black gram
20. Zea mays Poaceae Maize, Corn
21. Capsicum frutescens Solanaceae Tezpur Chilli
22. Aerva lanata Amaranthaceae ciru-pula,ulinai
23. Agave angustifolia Asparagaceae Caribbean agave
24. Agave sisalana Perrine Agavaceae Sisal Agave, agave
25. Aloe vera Liliaceae Kathalai
26. Bauhinia racemose Fabaceae Athi, jhinja
27. Blumea lacera Asteraceae Kattumullangi, narakkarandai
28. Boerhavia diffusa Nyctaginaceae Red hogweed, Tar Vine
29. Bulbostylis barbatta Cyperaceae Mukkutikorei
30. Chloris dolichostachya Poaceae Finger grass, kuruthupillu
31. Croton saparsiflorus Euphorbiaceae Reilpoondu
32. Helianthus annus Asteraceae Sunflower
33. Ocimum americanum Lamiaceae Hoary basil, nai thulasi
34. Ocimum sanctum Lamiaceae Holy basil, thulasi
35. Partheniumhysterophorus Asteraceae Congress grass
36. Sesamum indicum Pedaliaceae Korai, pullu
37. Sida cordifolia L. Malvaceae Heart-Leaf Sida
38. Thespesia populnea Malvaceae Indian tulip tree poovarasu
39. Vinca rosea Apocynaceae Nithyakalyani
SHRUBS
S.No Scientific Name Family Local Name
1. Argemone Mexicana Papaveraceae Prickly poppy, kudiyotti
2. Capparis sepiaria Capparaceae Karindu
3. Cassia auriculata Fabaceae Aavarampoo
4. Gossyplum arboretum Malvaceae Cotton, paruthi
5. Opuntia vulgaris Cactaceae Sappattukkalli
6. Solanum trilobatum Solanaceae Thoodhuvalai
7. Vitex negundo. Verbenaceae Nocchi
8. Ziziphus oenoplia. Rhamnaceae Suraimullu, Surai ilantai
9. Calotropis gigantea R.Br. Fabaceae tuvarai,adhaki, iruppuli,
10. Calotropis procera Asclepiadaeae Vellerukku
11. Canna indica Cannaceae Indian Shot, Wild canna
12. Carica papaya Caricaceae Pappali
13. Jasminum angustilfolium Oleaceae Kundumlligai
14. Jatropha glandulifera Euphorbiaceae Kaatuamanakku
15. Lantana camara Verbenaceae Unnichedi
16. Lawsonia inermis Lythraceae Henna, maruthondri
17. Phoenix acaulis Arecaceae Stemiess date palm
18. Ricinus communis Euphorbiaceae Castor bean plant
19. Solanum torvum Solanaceae Sundaikkai
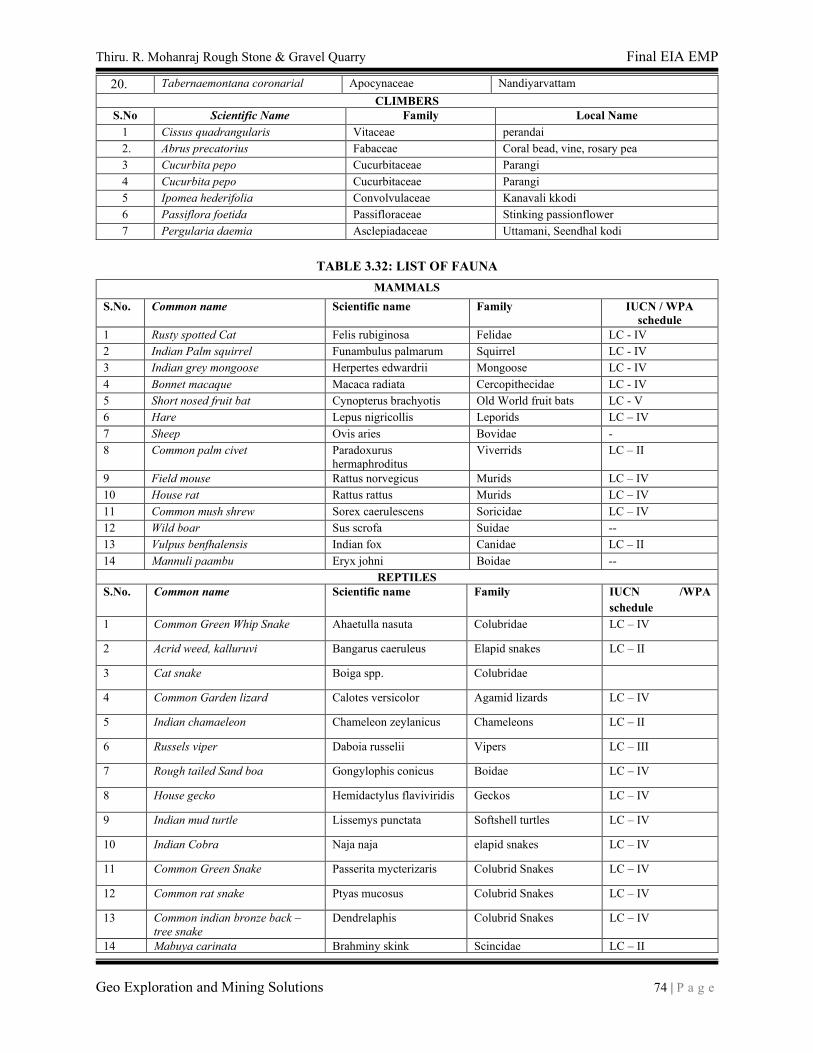
Thiru. R. Mohanraj Rough Stone & Gravel Quarry Final EIA EMP
Geo Exploration and Mining Solutions 74 | P a g e
20. Tabernaemontana coronarial Apocynaceae Nandiyarvattam
CLIMBERS
S.No Scientific Name Family Local Name
1 Cissus quadrangularis Vitaceae perandai
2. Abrus precatorius Fabaceae Coral bead, vine, rosary pea
3 Cucurbita pepo Cucurbitaceae Parangi
4 Cucurbita pepo Cucurbitaceae Parangi
5 Ipomea hederifolia Convolvulaceae Kanavali kkodi
6 Passiflora foetida Passifloraceae Stinking passionflower
7 Pergularia daemia Asclepiadaceae Uttamani, Seendhal kodi
TABLE 3.32: LIST OF FAUNA
MAMMALS
S.No. Common name Scientific name Family IUCN / WPA
schedule
1 Rusty spotted Cat Felis rubiginosa Felidae LC - IV
2 Indian Palm squirrel Funambulus palmarum Squirrel LC - IV
3 Indian grey mongoose Herpertes edwardrii Mongoose LC - IV
4 Bonnet macaque Macaca radiata Cercopithecidae LC - IV
5 Short nosed fruit bat Cynopterus brachyotis Old World fruit bats LC - V
6 Hare Lepus nigricollis Leporids LC – IV
7 Sheep Ovis aries Bovidae -
8 Common palm civet Paradoxurus
hermaphroditus
Viverrids LC – II
9 Field mouse Rattus norvegicus Murids LC – IV
10 House rat Rattus rattus Murids LC – IV
11 Common mush shrew Sorex caerulescens Soricidae LC – IV
12 Wild boar Sus scrofa Suidae --
13 Vulpus benfhalensis Indian fox Canidae LC – II
14 Mannuli paambu Eryx johni Boidae --
REPTILES
S.No. Common name Scientific name Family IUCN /WPA
schedule
1 Common Green Whip Snake Ahaetulla nasuta Colubridae LC – IV
2 Acrid weed, kalluruvi Bangarus caeruleus Elapid snakes LC – II
3 Cat snake Boiga spp. Colubridae
4 Common Garden lizard Calotes versicolor Agamid lizards LC – IV
5 Indian chamaeleon Chameleon zeylanicus Chameleons LC – II
6 Russels viper Daboia russelii Vipers LC – III
7 Rough tailed Sand boa Gongylophis conicus Boidae LC – IV
8 House gecko Hemidactylus flaviviridis Geckos LC – IV
9 Indian mud turtle Lissemys punctata Softshell turtles LC – IV
10 Indian Cobra Naja naja elapid snakes LC – IV
11 Common Green Snake Passerita mycterizaris Colubrid Snakes LC – IV
12 Common rat snake Ptyas mucosus Colubrid Snakes LC – IV
13 Common indian bronze back –
tree snake
Dendrelaphis Colubrid Snakes LC – IV
14 Mabuya carinata Brahminy skink Scincidae LC – II
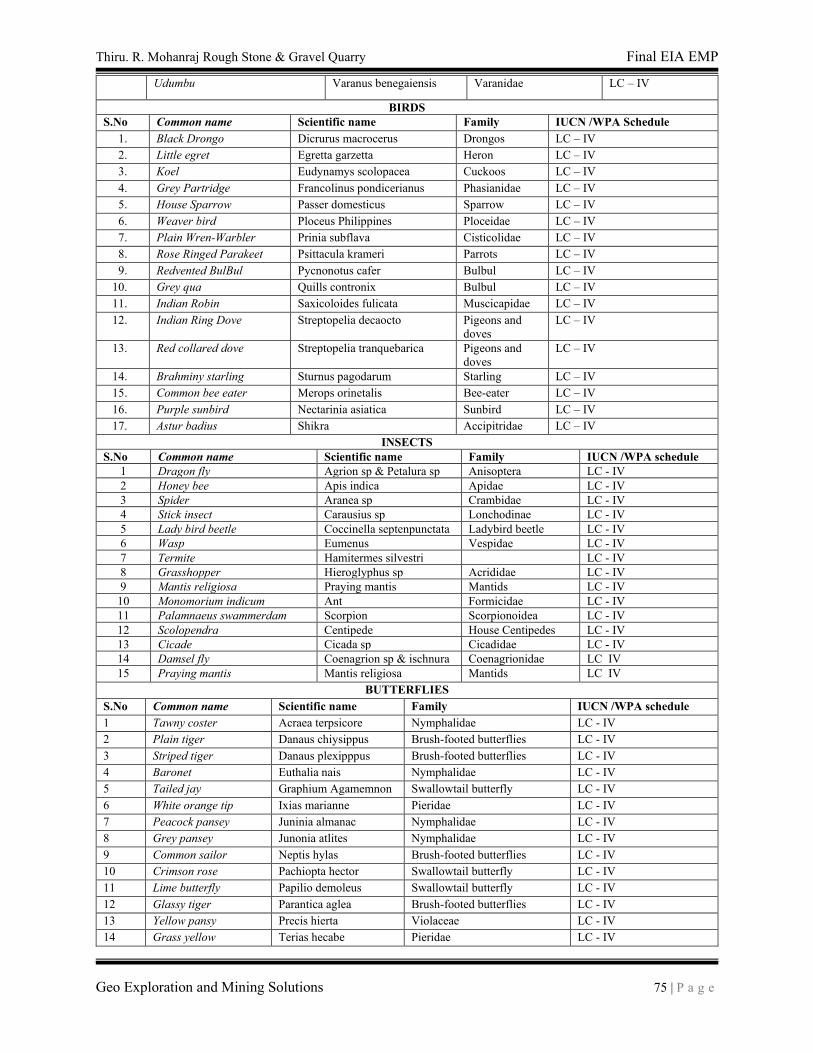
Thiru. R. Mohanraj Rough Stone & Gravel Quarry Final EIA EMP
Geo Exploration and Mining Solutions 75 | P a g e
Udumbu Varanus benegaiensis Varanidae LC – IV
BIRDS
S.No Common name Scientific name Family IUCN /WPA Schedule
1. Black Drongo Dicrurus macrocerus Drongos LC – IV
2. Little egret Egretta garzetta Heron LC – IV
3. Koel Eudynamys scolopacea Cuckoos LC – IV
4. Grey Partridge Francolinus pondicerianus Phasianidae LC – IV
5. House Sparrow Passer domesticus Sparrow LC – IV
6. Weaver bird Ploceus Philippines Ploceidae LC – IV
7. Plain Wren-Warbler Prinia subflava Cisticolidae LC – IV
8. Rose Ringed Parakeet Psittacula krameri Parrots LC – IV
9. Redvented BulBul Pycnonotus cafer Bulbul LC – IV
10. Grey qua Quills contronix Bulbul LC – IV
11. Indian Robin Saxicoloides fulicata Muscicapidae LC – IV
12. Indian Ring Dove Streptopelia decaocto Pigeons and
doves
LC – IV
13. Red collared dove Streptopelia tranquebarica Pigeons and
doves
LC – IV
14. Brahminy starling Sturnus pagodarum Starling LC – IV
15. Common bee eater Merops orinetalis Bee-eater LC – IV
16. Purple sunbird Nectarinia asiatica Sunbird LC – IV
17. Astur badius Shikra Accipitridae LC – IV
INSECTS
S.No Common name Scientific name Family IUCN /WPA schedule
1 Dragon fly Agrion sp & Petalura sp Anisoptera LC - IV
2 Honey bee Apis indica Apidae LC - IV
3 Spider Aranea sp Crambidae LC - IV
4 Stick insect Carausius sp Lonchodinae LC - IV
5 Lady bird beetle Coccinella septenpunctata Ladybird beetle LC - IV
6 Wasp Eumenus Vespidae LC - IV
7 Termite Hamitermes silvestri LC - IV
8 Grasshopper Hieroglyphus sp Acrididae LC - IV
9 Mantis religiosa Praying mantis Mantids LC - IV
10 Monomorium indicum Ant Formicidae LC - IV
11 Palamnaeus swammerdam Scorpion Scorpionoidea LC - IV
12 Scolopendra Centipede House Centipedes LC - IV
13 Cicade Cicada sp Cicadidae LC - IV
14 Damsel fly Coenagrion sp & ischnura Coenagrionidae LC IV
15 Praying mantis Mantis religiosa Mantids LC IV
BUTTERFLIES
S.No Common name Scientific name Family IUCN /WPA schedule
1 Tawny coster Acraea terpsicore Nymphalidae LC - IV
2 Plain tiger Danaus chiysippus Brush-footed butterflies LC - IV
3 Striped tiger Danaus plexipppus Brush-footed butterflies LC - IV
4 Baronet Euthalia nais Nymphalidae LC - IV
5 Tailed jay Graphium Agamemnon Swallowtail butterfly LC - IV
6 White orange tip Ixias marianne Pieridae LC - IV
7 Peacock pansey Juninia almanac Nymphalidae LC - IV
8 Grey pansey Junonia atlites Nymphalidae LC - IV
9 Common sailor Neptis hylas Brush-footed butterflies LC - IV
10 Crimson rose Pachiopta hector Swallowtail butterfly LC - IV
11 Lime butterfly Papilio demoleus Swallowtail butterfly LC - IV
12 Glassy tiger Parantica aglea Brush-footed butterflies LC - IV
13 Yellow pansy Precis hierta Violaceae LC - IV
14 Grass yellow Terias hecabe Pieridae LC - IV
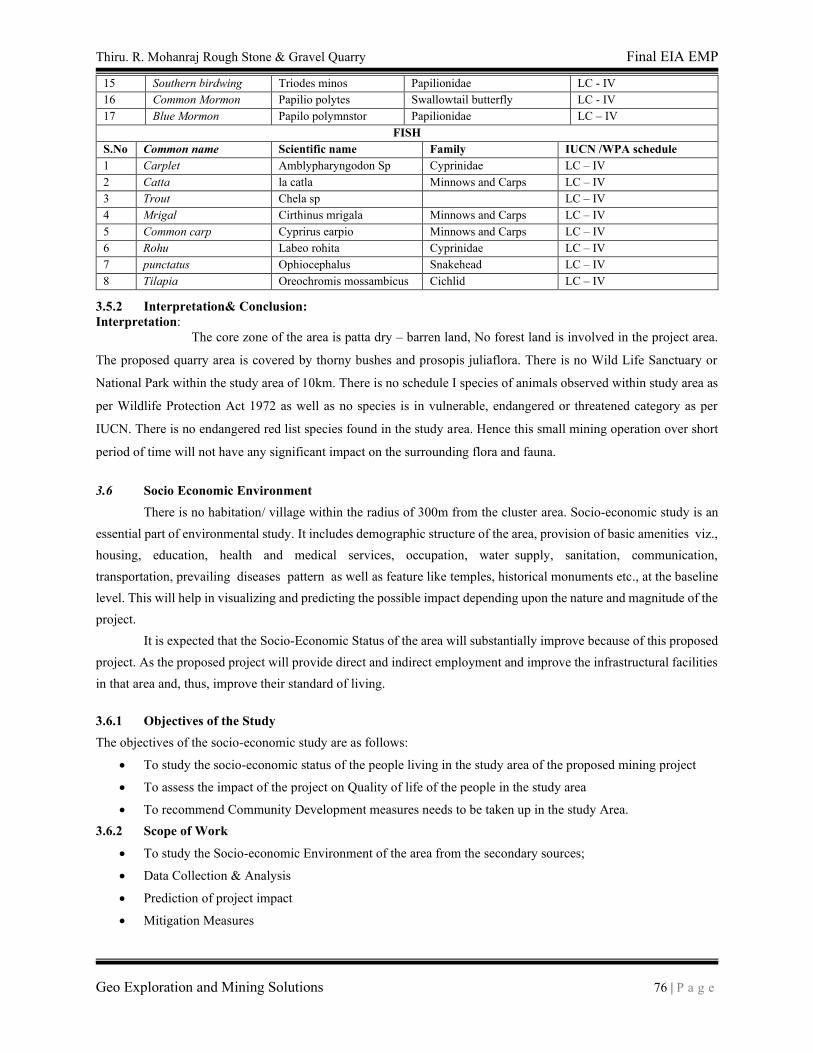
Thiru. R. Mohanraj Rough Stone & Gravel Quarry Final EIA EMP
Geo Exploration and Mining Solutions 76 | P a g e
15 Southern birdwing Triodes minos Papilionidae LC - IV
16 Common Mormon Papilio polytes Swallowtail butterfly LC - IV
17 Blue Mormon Papilo polymnstor Papilionidae LC – IV
FISH
S.No Common name Scientific name Family IUCN /WPA schedule
1 Carplet Amblypharyngodon Sp Cyprinidae LC – IV
2 Catta la catla Minnows and Carps LC – IV
3 Trout Chela sp LC – IV
4 Mrigal Cirthinus mrigala Minnows and Carps LC – IV
5 Common carp Cyprirus earpio Minnows and Carps LC – IV
6 Rohu Labeo rohita Cyprinidae LC – IV
7 punctatus Ophiocephalus Snakehead LC – IV
8 Tilapia Oreochromis mossambicus Cichlid LC – IV
3.5.2 Interpretation& Conclusion:
Interpretation:
The core zone of the area is patta dry – barren land, No forest land is involved in the project area.
The proposed quarry area is covered by thorny bushes and prosopis juliaflora. There is no Wild Life Sanctuary or
National Park within the study area of 10km. There is no schedule I species of animals observed within study area as
per Wildlife Protection Act 1972 as well as no species is in vulnerable, endangered or threatened category as per
IUCN. There is no endangered red list species found in the study area. Hence this small mining operation over short
period of time will not have any significant impact on the surrounding flora and fauna.
3.6 Socio Economic Environment
There is no habitation/ village within the radius of 300m from the cluster area. Socio-economic study is an
essential part of environmental study. It includes demographic structure of the area, provision of basic amenities viz.,
housing, education, health and medical services, occupation, water supply, sanitation, communication,
transportation, prevailing diseases pattern as well as feature like temples, historical monuments etc., at the baseline
level. This will help in visualizing and predicting the possible impact depending upon the nature and magnitude of the
project.
It is expected that the Socio-Economic Status of the area will substantially improve because of this proposed
project. As the proposed project will provide direct and indirect employment and improve the infrastructural facilities
in that area and, thus, improve their standard of living.
3.6.1 Objectives of the Study
The objectives of the socio-economic study are as follows:
• To study the socio-economic status of the people living in the study area of the proposed mining project
• To assess the impact of the project on Quality of life of the people in the study area
• To recommend Community Development measures needs to be taken up in the study Area.
3.6.2 Scope of Work
• To study the Socio-economic Environment of the area from the secondary sources;
• Data Collection & Analysis
• Prediction of project impact
• Mitigation Measures
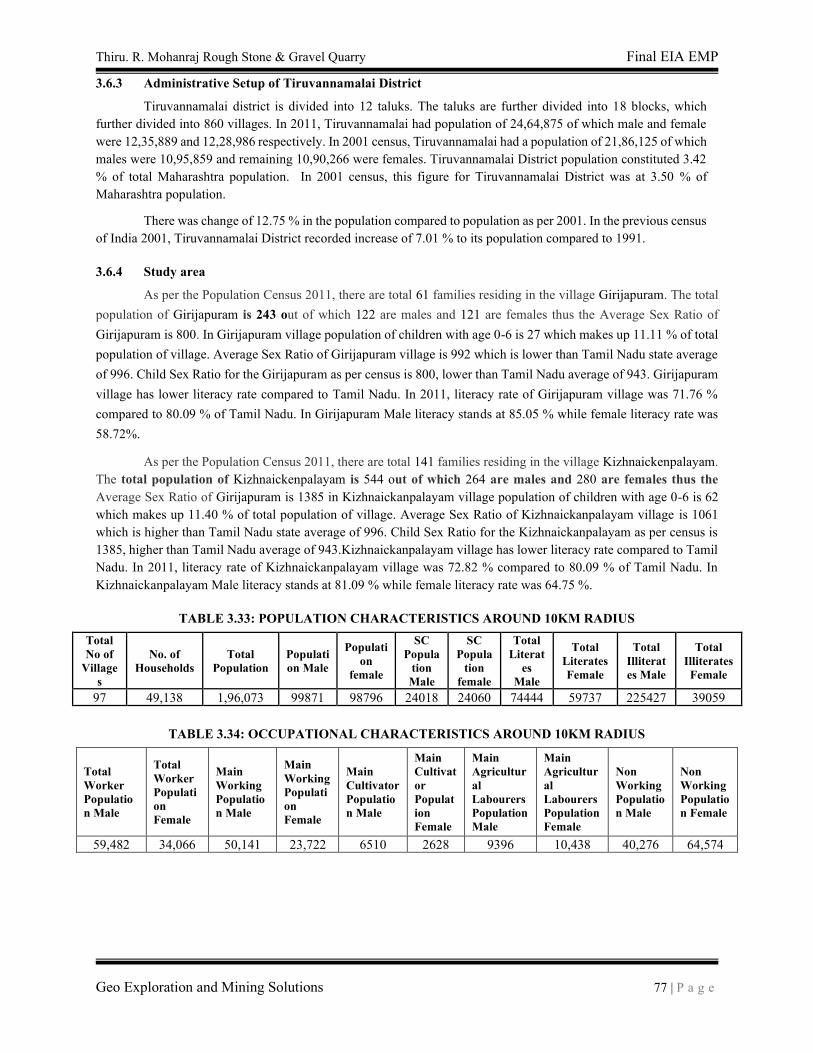
Thiru. R. Mohanraj Rough Stone & Gravel Quarry Final EIA EMP
Geo Exploration and Mining Solutions 77 | P a g e
3.6.3 Administrative Setup of Tiruvannamalai District
Tiruvannamalai district is divided into 12 taluks. The taluks are further divided into 18 blocks, which
further divided into 860 villages. In 2011, Tiruvannamalai had population of 24,64,875 of which male and female
were 12,35,889 and 12,28,986 respectively. In 2001 census, Tiruvannamalai had a population of 21,86,125 of which
males were 10,95,859 and remaining 10,90,266 were females. Tiruvannamalai District population constituted 3.42
% of total Maharashtra population. In 2001 census, this figure for Tiruvannamalai District was at 3.50 % of
Maharashtra population.
There was change of 12.75 % in the population compared to population as per 2001. In the previous census
of India 2001, Tiruvannamalai District recorded increase of 7.01 % to its population compared to 1991.
3.6.4 Study area
As per the Population Census 2011, there are total 61 families residing in the village Girijapuram. The total
population of Girijapuram is 243 out of which 122 are males and 121 are females thus the Average Sex Ratio of
Girijapuram is 800. In Girijapuram village population of children with age 0-6 is 27 which makes up 11.11 % of total
population of village. Average Sex Ratio of Girijapuram village is 992 which is lower than Tamil Nadu state average
of 996. Child Sex Ratio for the Girijapuram as per census is 800, lower than Tamil Nadu average of 943. Girijapuram
village has lower literacy rate compared to Tamil Nadu. In 2011, literacy rate of Girijapuram village was 71.76 %
compared to 80.09 % of Tamil Nadu. In Girijapuram Male literacy stands at 85.05 % while female literacy rate was
58.72%.
As per the Population Census 2011, there are total 141 families residing in the village Kizhnaickenpalayam.
The total population of Kizhnaickenpalayam is 544 out of which 264 are males and 280 are females thus the
Average Sex Ratio of Girijapuram is 1385 in Kizhnaickanpalayam village population of children with age 0-6 is 62
which makes up 11.40 % of total population of village. Average Sex Ratio of Kizhnaickanpalayam village is 1061
which is higher than Tamil Nadu state average of 996. Child Sex Ratio for the Kizhnaickanpalayam as per census is
1385, higher than Tamil Nadu average of 943.Kizhnaickanpalayam village has lower literacy rate compared to Tamil
Nadu. In 2011, literacy rate of Kizhnaickanpalayam village was 72.82 % compared to 80.09 % of Tamil Nadu. In
Kizhnaickanpalayam Male literacy stands at 81.09 % while female literacy rate was 64.75 %.
TABLE 3.33: POPULATION CHARACTERISTICS AROUND 10KM RADIUS
Total
No of
Village
s
No. of
Households
Total
Population
Populati
on Male
Populati
on
female
SC
Popula
tion
Male
SC
Popula
tion
female
Total
Literat
es
Male
Total
Literates
Female
Total
Illiterat
es Male
Total
Illiterates
Female
97 49,138 1,96,073 99871 98796 24018 24060 74444 59737 225427 39059
TABLE 3.34: OCCUPATIONAL CHARACTERISTICS AROUND 10KM RADIUS
Total
Worker
Populatio
n Male
Total
Worker
Populati
on
Female
Main
Working
Populatio
n Male
Main
Working
Populati
on
Female
Main
Cultivator
Populatio
n Male
Main
Cultivat
or
Populat
ion
Female
Main
Agricultur
al
Labourers
Population
Male
Main
Agricultur
al
Labourers
Population
Female
Non
Working
Populatio
n Male
Non
Working
Populatio
n Female
59,482 34,066 50,141 23,722 6510 2628 9396 10,438 40,276 64,574
Thiru. R. Mohanraj Rough Stone & Gravel Quarry Final EIA EMP
Geo Exploration and Mining Solutions 78 | P a g e
3.6.5 Basic Amenities
A better network of physical infrastructure facilities (well-built roads, rail links, irrigation, power and
telecommunication, information technology, market-network and social infrastructure support, viz., health and
education, water and sanitation, veterinary services and co-operative) is essential for development of the rural
economy.
A review of infrastructure facilities available in the area has been given on the basis of field survey. In this
study the villages which fall within 10 km radius around the site has been covered. Infrastructure facilities available
in the area are presented below.
All basic amenities Education (higher education, colleges, universities, Medical College, Transport
facilities, Railway station, Bus station area available in the district headquarters. Tiruvannamalai at a distance of
90km – South west)
3.6.6 Recommendation and Suggestion
• Awareness program to be conducted to make the population aware to get education and a better livelihood.
• Health care centre and ambulance facility can be provided to the population to get easy and accessible medical
facilities.
• Vocational training programme can be organized to make the people self - employed, particularly for women
and unemployed youth.
• On the basis of qualification and skills local community may be preferred.
• Long term and short-term employments can be generated.
• Maternity facility should be made available at the place to avoid going too far-off places for treatment which
involves risks. Apart from that as these areas are prone to various diseases a hospital with modern facilities
should be opened on a priority basis in a central place to provide better health facilities to the villagers around
the project.
• While developing an Action Plan, it is very important to identify the population who falls under the
marginalized and vulnerable groups. So that special attention can be given to these groups with special
provisions while making action plans.
3.6.7 Conclusion
The socio-economic study of surveyed villages gives a clear picture of its population, average household
size, literacy rate and sex ratio etc. It is also found that a part of population is suffering from lack of permanent job
to run their day-to-day life. Their expectation is to earn some income for their sustainability on a long-term basis.
The proposed project will aim to provide preferential employment to the local people there by improving
the employment opportunity in the area and in turn the social standards will improve.
The nearby villages within 5kms radius has PHC, Anganwadi school, Post office, Telegram, Government
and Private school, bus connectivity besides.
Thiru. R. Mohanraj Rough Stone & Gravel Quarry Final EIA EMP
Geo Exploration and Mining Solutions 79 | P a g e
CHAPTER – 4: ANTICIPATED ENVIRONMENTAL IMPACTS AND
MITIGATION MEASURES
4.0 General
Environmental impacts both direct and indirect on various environmental attributes due to cluster quarries will
be created in the surrounding environment, during the operational and post–operational phases. The occurrence of mineral
deposits, being site specific, their exploitation, often, does not allow for any choice except adoption of eco-friendly
operation. The methods are required to be selected in such a manner, so as to maintain environmental equilibrium ensuring
sustainable development.
In order to maintain the environmental commensuration with the mining operation, it is essential to undertake
studies on the existing environmental scenario and assess the impact on different environmental components. This would
help in formulating suitable management plans sustainable resource extraction.
- Land environment
- Water Environment
- Air Environment
- Noise Environment
- Socio economic environment
- Solid waste
- Soil environment
Based on the baseline environmental status at the existing mine site, the environmental factors that are likely to
be affected (Impacts) are identified, quantified and assessed.
4.1 Land Environment
4.1.1 Anticipated Impact
The main anticipated impact on the Land Environment due to quarrying operation is change in Landscape, change
in Land – use Pattern. The total extent of the proposed area is 2.29.0 ha and proposed depth of the quarrying is 37m
Maximum below the ground level and will not intersect the ground water table. The project is site specific.
4.1.2 Mitigation measures
Due to the quarrying activities in the lease area the land use pattern will be altered. In order to minimize the
adverse effects, the following control measures will be implemented:
In the Rough stone and Gravel quarrying operation the degradation of land is insignificant, after completion of
the quarrying operation the land will be allowed to collect rain water which will act as temporary reservoir, this rough
stone does not produce any toxic effluents in the form of solid, liquid or gas. It is a simple quarrying operation where 100%
of stones will be removed systematically as per the approved Mining plan. The periphery of the mining lease area will be
converted to a greenbelt to prevent Noise and sound propagation to the nearby lands.
• Construction of garland drains all around the quarry pit and construction of check dam at strategic location in
lower elevations to prevent soil erosion due to surface runoff during rainfall and also to collect the storm water
for various uses within the proposed area
• Barbed wire fencing will be carried out at the conceptual stage, Security will be posted round the clock, to prevent
inherent entry of the public and cattle.
4.1.3 Soil Environment
4.1.4 Impact on Soil Environment
There is no top soil anticipated in this project, the surface consists of gravelly formation followed by Rough stone
which is proposed to excavate completely during the quarrying operation, hence preservation of top soil does not exist.
Erosion of top layer (gravel), extracted fine material can result in substantial sediment loading to surface waters and
drainage ways. During rainy season surface run off may cause siltation in low lying areas.
Thiru. R. Mohanraj Rough Stone & Gravel Quarry Final EIA EMP
Geo Exploration and Mining Solutions 80 | P a g e
4.1.5 Mitigation measures for Soil Erosion and Soil Conservation
• Garland drains will be constructed around the project area with silt traps to control the surface erosion during
rainy seasons.
▪ Greenbelt development all along the periphery of the project area (i.e., 7.5 m safety barrier) will ensure
binding strength and minimizes soil erosion.
▪ Soil sampling will be carried out in the core zone for every six months to ensure the soil quality is not affected
due to the quarrying activities.
4.1.6 Waste Dump Management
There are no wastages anticipated in this Rough stone and Gravel quarrying operation. The entire quarried out
materials will be utilized (100%).
The overburden in the form of Gravel formation the gravel will be also sold to needy customers for the filling
and levelling of low-lying areas.
4.2 Water Environment
4.2.1 Anticipated Impact on Surface and ground water
The impact due to quarrying on the water quality is expected to be insignificant because of no use of
chemicals or hazardous substances during quarrying process. The quarrying activity will not intersect ground water
table as quarrying is proposed upto 37 m and water table is found at a depth of 50 - 55m BGL.
The quarrying operation will be carried out well above the water table. There is no intersection of surface
water bodies (Streams, Canal, Odai etc.,) in the project area. During rainy season rain water will be collected in the
quarry pit and later used for greenbelt development and for the water sprinkling in the haul roads. There is no proposal
for discharging of quarry pit water outside the project area Rough stone processing
Detail of water requirements in KLD as given below:
TABLE 4.1: WATER REQUIREMENTS
*Purpose Quantity Source
Dust Suppression 1.3 KLD Rainwater accumulated in Mine Pit/ Water Tanker
Green Belt development 1.5 KLD Rainwater accumulated in Mine Pit/ Water Tanker
Domestic purpose 0.7 KLD Water Tankers
Total 3.5 KLD
* Water for drinking purpose will be brought from approved water vendors
Source: Approved Mining Plan Pre-Feasibility Report
4.2.2 Mitigation measures
▪ The following mitigation measures are suggested for water management for the cluster quarries Rainwater
will be collected in lower part of the quarry pit by construction of garland drains to divert surface run-off
and will be connected to setting tank of 5m (l) x 5m (w) x 3m (d) to allow suspended solids to settle down
if any. This collected water will act as a rain water harvesting system and will be used for dust suppression
and greenbelt development.
▪ Six months once analysis of quarry pit water and ground water quality in nearby villages will be carried out
to ensure the water quality is not affected due to the quarrying activities.
▪ Domestic sewage from site office & urinals/latrines provided in project area will be discharged through
septic tank followed by soak pit system.
▪ Only clear and settled water free from silt content will be used for dust suppression and greenbelt
development.
Thiru. R. Mohanraj Rough Stone & Gravel Quarry Final EIA EMP
Geo Exploration and Mining Solutions 81 | P a g e
▪ De-silting will be carried out before and immediately after the monsoon season and the settling tank and
drains will be cleaned weekly, especially during monsoons.
• Tippers & HEMM will be washed in a designated area and the washed water will be routed through drains
to a settling tank, which has an oil & grease trap, only clear water will be reused for greenbelt development.
4.3 Air Environment
The air borne particulate matter is the main air pollutant in this opencast mining. The mining operation will
be carried out by jackhammer drilling (35mm dia) and Hydraulic Excavators will be utilized for excavation of Rough
Stone and Gravel.
4.3.1. Anticipated Impact
Wind erosion of the exposed areas and the air borne particulate matter generated by quarrying operation, and
transportation are mainly PM10 & PM2.5 and emissions of Sulphur dioxide (SO2) & Oxides of Nitrogen (NOx) due to
excavation/loading equipment and vehicles plying on haul roads are the cause of air pollution in the project area.
Similarly, loading - unloading and transportation of Rough Stone and Gravel, wind erosion of the exposed
area and movement of light vehicles will be a cause of pollution due to quarrying activities within a radius of 500
meters from the project area. This leads to a cumulative impact on the ambient air environment around the project
area.
Anticipated incremental concentration due to this quarrying activity and net increase in emissions due to
quarrying activities within 500 meters around the project area is predicted by Open Pit Source modelling using
AERMOD Software.
4.3.2.1 Emission Estimation
An emissions factor is a representative value that attempts to relate the quantity of a pollutant released to the
atmosphere with an activity associated with the release of that pollutant.
The general equation for emissions estimation is:
E = A x EF x (1-ER/100) Where:
E = emissions;
A = activity rate;
EF = emission factor, and
ER =overall emission reduction efficiency, %
The proposed mining activity includes various activities like ground preparation, excavation, handling and
transport of ore. These activities have been analysed systematically basing on USEPA-Emission Estimation Technique
Manual, for Mining AP-42, to arrive at possible emissions to the atmosphere and estimated emissions are given in
Table 4-2.
TABLE 4.2: ESTIMATED EMISSION RATE FOR PM10
Activity Source type Value Unit
Drilling Point Source 0.100634916 g/s
Blasting Point Source 0.002496651 g/s
Mineral Loading Point Source 0.044737773 g/s
Haul Road Line Source 0.002498957 g/s/m
Overall Mine Area Source 0.062434655 g/s
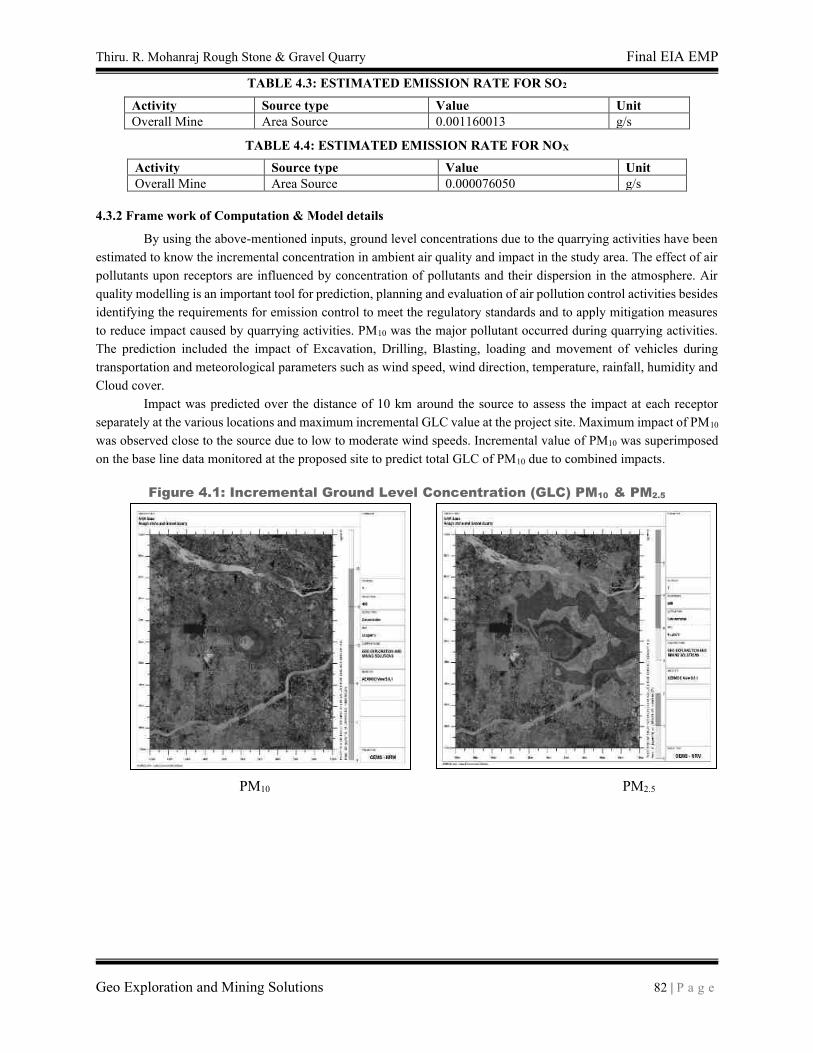
Thiru. R. Mohanraj Rough Stone & Gravel Quarry Final EIA EMP
Geo Exploration and Mining Solutions 82 | P a g e
TABLE 4.3: ESTIMATED EMISSION RATE FOR SO2
Activity Source type Value Unit
Overall Mine Area Source 0.001160013 g/s
TABLE 4.4: ESTIMATED EMISSION RATE FOR NOX
Activity Source type Value Unit
Overall Mine Area Source 0.000076050 g/s
4.3.2 Frame work of Computation & Model details
By using the above-mentioned inputs, ground level concentrations due to the quarrying activities have been
estimated to know the incremental concentration in ambient air quality and impact in the study area. The effect of air
pollutants upon receptors are influenced by concentration of pollutants and their dispersion in the atmosphere. Air
quality modelling is an important tool for prediction, planning and evaluation of air pollution control activities besides
identifying the requirements for emission control to meet the regulatory standards and to apply mitigation measures
to reduce impact caused by quarrying activities. PM10 was the major pollutant occurred during quarrying activities.
The prediction included the impact of Excavation, Drilling, Blasting, loading and movement of vehicles during
transportation and meteorological parameters such as wind speed, wind direction, temperature, rainfall, humidity and
Cloud cover.
Impact was predicted over the distance of 10 km around the source to assess the impact at each receptor
separately at the various locations and maximum incremental GLC value at the project site. Maximum impact of PM10
was observed close to the source due to low to moderate wind speeds. Incremental value of PM10 was superimposed
on the base line data monitored at the proposed site to predict total GLC of PM10 due to combined impacts.
Figure 4.1: Incremental Ground Level Concentration (GLC) PM10 & PM2.5
PM10 PM2.5
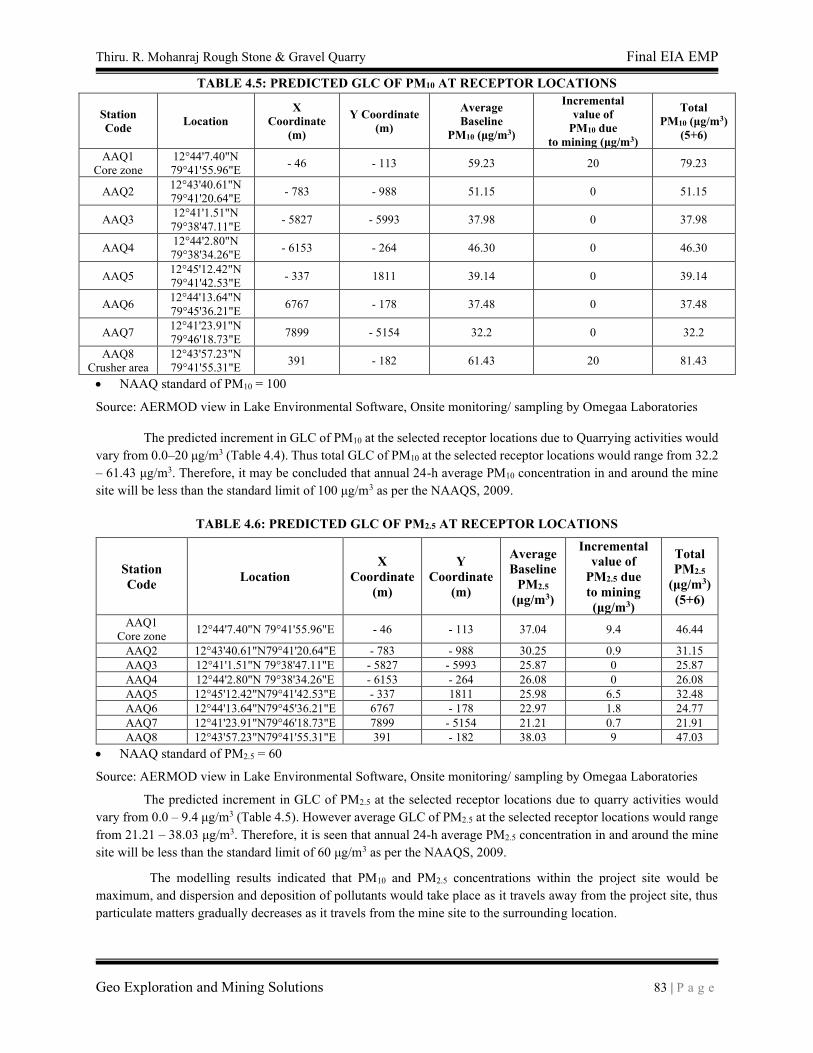
Thiru. R. Mohanraj Rough Stone & Gravel Quarry Final EIA EMP
Geo Exploration and Mining Solutions 83 | P a g e
TABLE 4.5: PREDICTED GLC OF PM10 AT RECEPTOR LOCATIONS
Station
Code Location
X
Coordinate
(m)
Y Coordinate
(m)
Average
Baseline
PM10 (μg/m3)
Incremental
value of
PM10 due
to mining (μg/m3)
Total
PM10 (μg/m3)
(5+6)
AAQ1
Core zone
12°44'7.40"N
79°41'55.96"E - 46 - 113 59.23 20 79.23
AAQ2 12°43'40.61"N
79°41'20.64"E - 783 - 988 51.15 0 51.15
AAQ3 12°41'1.51"N
79°38'47.11"E - 5827 - 5993 37.98 0 37.98
AAQ4 12°44'2.80"N
79°38'34.26"E - 6153 - 264 46.30 0 46.30
AAQ5 12°45'12.42"N
79°41'42.53"E - 337 1811 39.14 0 39.14
AAQ6 12°44'13.64"N
79°45'36.21"E 6767 - 178 37.48 0 37.48
AAQ7 12°41'23.91"N
79°46'18.73"E 7899 - 5154 32.2 0 32.2
AAQ8
Crusher area
12°43'57.23"N
79°41'55.31"E 391 - 182 61.43 20 81.43
• NAAQ standard of PM10 = 100
Source: AERMOD view in Lake Environmental Software, Onsite monitoring/ sampling by Omegaa Laboratories
The predicted increment in GLC of PM10 at the selected receptor locations due to Quarrying activities would
vary from 0.0–20 μg/m3 (Table 4.4). Thus total GLC of PM10 at the selected receptor locations would range from 32.2
– 61.43 μg/m3. Therefore, it may be concluded that annual 24-h average PM10 concentration in and around the mine
site will be less than the standard limit of 100 μg/m3 as per the NAAQS, 2009.
TABLE 4.6: PREDICTED GLC OF PM2.5 AT RECEPTOR LOCATIONS
Station
Code Location
X
Coordinate
(m)
Y
Coordinate
(m)
Average
Baseline
PM2.5
(μg/m3)
Incremental
value of
PM2.5 due
to mining
(μg/m3)
Total
PM2.5
(μg/m3)
(5+6)
AAQ1
Core zone 12°44'7.40"N 79°41'55.96"E - 46 - 113 37.04 9.4 46.44
AAQ2 12°43'40.61"N79°41'20.64"E - 783 - 988 30.25 0.9 31.15
AAQ3 12°41'1.51"N 79°38'47.11"E - 5827 - 5993 25.87 0 25.87
AAQ4 12°44'2.80"N 79°38'34.26"E - 6153 - 264 26.08 0 26.08
AAQ5 12°45'12.42"N79°41'42.53"E - 337 1811 25.98 6.5 32.48
AAQ6 12°44'13.64"N79°45'36.21"E 6767 - 178 22.97 1.8 24.77
AAQ7 12°41'23.91"N79°46'18.73"E 7899 - 5154 21.21 0.7 21.91
AAQ8 12°43'57.23"N79°41'55.31"E 391 - 182 38.03 9 47.03
• NAAQ standard of PM2.5 = 60
Source: AERMOD view in Lake Environmental Software, Onsite monitoring/ sampling by Omegaa Laboratories
The predicted increment in GLC of PM2.5 at the selected receptor locations due to quarry activities would
vary from 0.0 – 9.4 μg/m3 (Table 4.5). However average GLC of PM2.5 at the selected receptor locations would range
from 21.21 – 38.03 μg/m3. Therefore, it is seen that annual 24-h average PM2.5 concentration in and around the mine
site will be less than the standard limit of 60 μg/m3 as per the NAAQS, 2009.
The modelling results indicated that PM10 and PM2.5 concentrations within the project site would be
maximum, and dispersion and deposition of pollutants would take place as it travels away from the project site, thus
particulate matters gradually decreases as it travels from the mine site to the surrounding location.
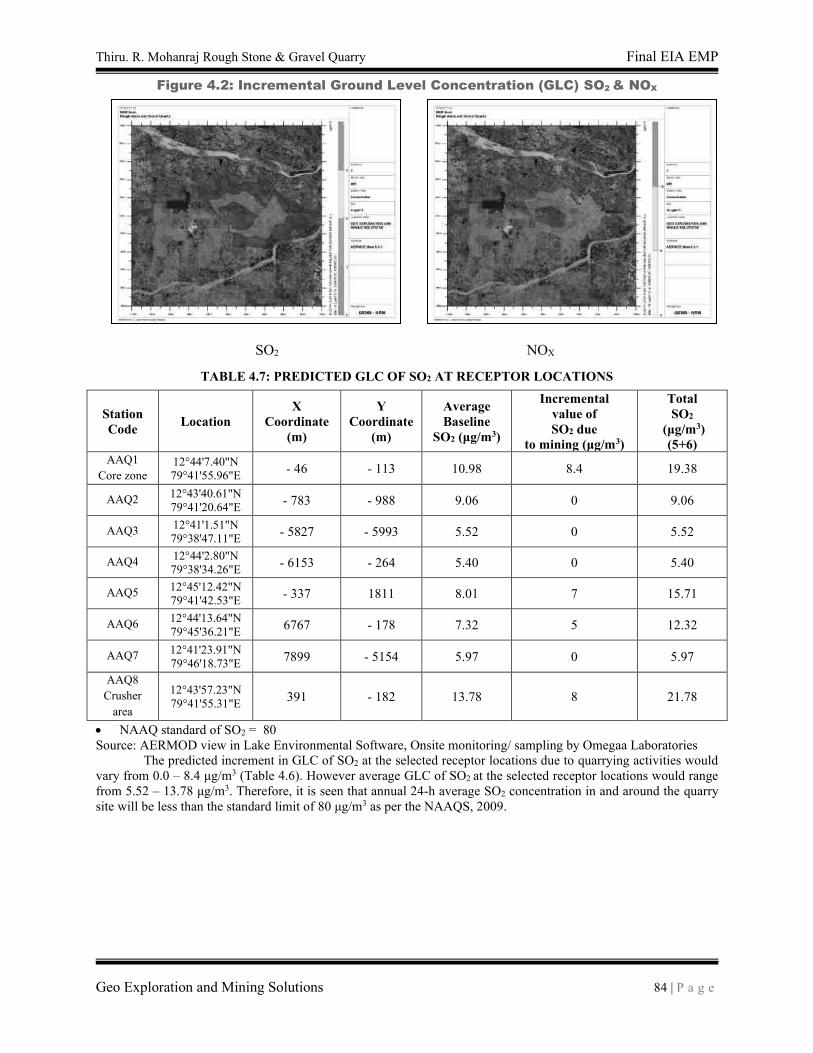
Thiru. R. Mohanraj Rough Stone & Gravel Quarry Final EIA EMP
Geo Exploration and Mining Solutions 84 | P a g e
Figure 4.2: Incremental Ground Level Concentration (GLC) SO2 & NOX
SO2 NOX
TABLE 4.7: PREDICTED GLC OF SO2 AT RECEPTOR LOCATIONS
Station
Code Location
X
Coordinate
(m)
Y
Coordinate
(m)
Average
Baseline
SO2 (μg/m3)
Incremental
value of
SO2 due
to mining (μg/m3)
Total
SO2
(μg/m3)
(5+6)
AAQ1
Core zone
12°44'7.40"N
79°41'55.96"E - 46 - 113 10.98 8.4 19.38
AAQ2 12°43'40.61"N
79°41'20.64"E - 783 - 988 9.06 0 9.06
AAQ3 12°41'1.51"N
79°38'47.11"E - 5827 - 5993 5.52 0 5.52
AAQ4 12°44'2.80"N
79°38'34.26"E - 6153 - 264 5.40 0 5.40
AAQ5 12°45'12.42"N
79°41'42.53"E - 337 1811 8.01 7 15.71
AAQ6 12°44'13.64"N
79°45'36.21"E 6767 - 178 7.32 5 12.32
AAQ7 12°41'23.91"N
79°46'18.73"E 7899 - 5154 5.97 0 5.97
AAQ8
Crusher
area
12°43'57.23"N
79°41'55.31"E 391 - 182 13.78 8 21.78
• NAAQ standard of SO2 = 80
Source: AERMOD view in Lake Environmental Software, Onsite monitoring/ sampling by Omegaa Laboratories
The predicted increment in GLC of SO2 at the selected receptor locations due to quarrying activities would
vary from 0.0 – 8.4 μg/m3 (Table 4.6). However average GLC of SO2 at the selected receptor locations would range
from 5.52 – 13.78 μg/m3. Therefore, it is seen that annual 24-h average SO2 concentration in and around the quarry
site will be less than the standard limit of 80 μg/m3 as per the NAAQS, 2009.
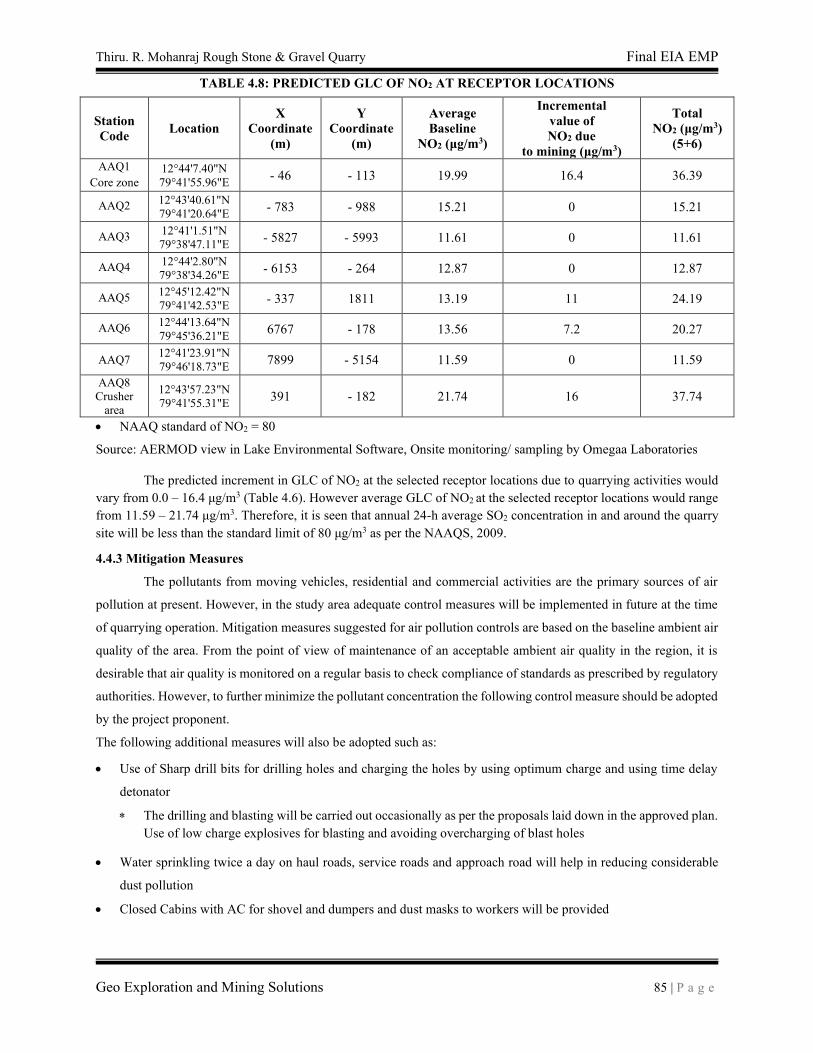
Thiru. R. Mohanraj Rough Stone & Gravel Quarry Final EIA EMP
Geo Exploration and Mining Solutions 85 | P a g e
TABLE 4.8: PREDICTED GLC OF NO2 AT RECEPTOR LOCATIONS
Station
Code Location
X
Coordinate
(m)
Y
Coordinate
(m)
Average
Baseline
NO2 (μg/m3)
Incremental
value of
NO2 due
to mining (μg/m3)
Total
NO2 (μg/m3)
(5+6)
AAQ1
Core zone
12°44'7.40"N
79°41'55.96"E - 46 - 113 19.99 16.4 36.39
AAQ2 12°43'40.61"N
79°41'20.64"E - 783 - 988 15.21 0 15.21
AAQ3 12°41'1.51"N
79°38'47.11"E - 5827 - 5993 11.61 0 11.61
AAQ4 12°44'2.80"N
79°38'34.26"E - 6153 - 264 12.87 0 12.87
AAQ5 12°45'12.42"N
79°41'42.53"E - 337 1811 13.19 11 24.19
AAQ6 12°44'13.64"N
79°45'36.21"E 6767 - 178 13.56 7.2 20.27
AAQ7 12°41'23.91"N
79°46'18.73"E 7899 - 5154 11.59 0 11.59
AAQ8
Crusher
area
12°43'57.23"N
79°41'55.31"E 391 - 182 21.74 16 37.74
• NAAQ standard of NO2 = 80
Source: AERMOD view in Lake Environmental Software, Onsite monitoring/ sampling by Omegaa Laboratories
The predicted increment in GLC of NO2 at the selected receptor locations due to quarrying activities would
vary from 0.0 – 16.4 μg/m3 (Table 4.6). However average GLC of NO2 at the selected receptor locations would range
from 11.59 – 21.74 μg/m3. Therefore, it is seen that annual 24-h average SO2 concentration in and around the quarry
site will be less than the standard limit of 80 μg/m3 as per the NAAQS, 2009.
4.4.3 Mitigation Measures
The pollutants from moving vehicles, residential and commercial activities are the primary sources of air
pollution at present. However, in the study area adequate control measures will be implemented in future at the time
of quarrying operation. Mitigation measures suggested for air pollution controls are based on the baseline ambient air
quality of the area. From the point of view of maintenance of an acceptable ambient air quality in the region, it is
desirable that air quality is monitored on a regular basis to check compliance of standards as prescribed by regulatory
authorities. However, to further minimize the pollutant concentration the following control measure should be adopted
by the project proponent.
The following additional measures will also be adopted such as:
• Use of Sharp drill bits for drilling holes and charging the holes by using optimum charge and using time delay
detonator
The drilling and blasting will be carried out occasionally as per the proposals laid down in the approved plan.
Use of low charge explosives for blasting and avoiding overcharging of blast holes
• Water sprinkling twice a day on haul roads, service roads and approach road will help in reducing considerable
dust pollution
• Closed Cabins with AC for shovel and dumpers and dust masks to workers will be provided
Thiru. R. Mohanraj Rough Stone & Gravel Quarry Final EIA EMP
Geo Exploration and Mining Solutions 86 | P a g e
• Comprehensive green belt in the safety zone will be carried out to reduce to propagation of fugitive dust emissions
in order to create clean and healthy environment
• Weekly maintenance of quarrying equipment’s will be carried out
• Transport of Rough stone and Gravel in tippers covered with tarpaulin
• Information on wind direction and meteorology will be considered while planning, so that pollutants, which
cannot be fully suppressed by engineering technique, will be prevented from reaching the nearby agriculture area
• PPE will be provided to all workers
• Regular health check–up of workers and nearby villagers in the near vicinity of the project area will be carried
out and also yearly occupational health assessment of employees will be carried out as per DGMS Guidelines
• Ambient Air Quality Monitoring will be conducted on half-yearly basis to assess the quality of ambient air
As discussed above under each activity, there will be increase in terms of dust load and gaseous emissions.
However, it can be stated that these incremental contributions will remain within the prescribed limits/norms. Further,
the mitigation measures will further bring down these concentrations making the mining activities more Eco friendly.
4.4 Noise Environment (Impact & Mitigation Measures)
Noise pollution is mainly due to operation like drilling & blasting and plying of trucks & HEMM. These
activities will not cause any problem to the inhabitants of this area because there is no human settlement in close
proximity to the project area. Noise modelling has been carried out considering blasting and compressor operation
(drilling) and transportation activities.
Predictions have been carried out to compute the noise level at various distances around the working pit due
to these major noise-generating sources. Noise modelling has been carried out to assess the impact on
surrounding ambient noise levels.
Basic phenomenon of the model is the geometric attenuation of sound. Noise at a point generates spherical
waves, which are propagated outwards from the source through the air at a speed of 1,100 ft/sec, with the first wave
making an ever-increasing sphere with time. As the wave spreads the intensity of noise diminishes as the fixed amount
of energy is spread over an increasing surface area of the sphere. The assumption of the model is based on point source
relationship i.e., for every doubling of the distance the noise levels are decreased by 6 dB (A).
For hemispherical sound wave propagation through homogeneous loss free medium, one can estimate noise
levels at various locations at different sources using model based on first principle.
Lp2 = Lp1 - 20 log (r2/r1) - Ae1, 2
Where:
Lp1& Lp2 are sound levels at points located at distances r1& r2 from the source.
Ae1, 2 is the excess attenuation due to environmental conditions. Combined effect of all sources can be determined at
various locations by logarithmic addition.
Lptotal = 10 log {10(Lp1/10) + 10(Lp2/10) + 10(Lp3/10) +……}
4.4.1 Anticipated Impact
Attenuation due to Green Belt has been taken to be 4.9 dB (A). The inputs required for the model are:
• Source data
• Receptor data
• Attenuation factor
Thiru. R. Mohanraj Rough Stone & Gravel Quarry Final EIA EMP
Geo Exploration and Mining Solutions 87 | P a g e
Source data has been computed taking into account of all the machinery and activities used in the mining process.
Same has been listed in Table 4-9.
TABLE 4.9: ACTIVITY AND NOISE LEVEL PRODUCED BY MACHINERY
Sl.No. Machinery / Activity Impact on Environment? Noise Produced in dB(A) at 50 ft from source*
1 Blasting Yes 94
2 Jack Hammer Yes 88
3 Compressor No 81
4 Excavator No 85
5 Tipper No 84
Total Noise Produced 95.8
*50 feet from source = 15.24 meters
Source: U.S. Department of Transportation (Federal Highway Administration) – Construction Noise Handbook
The total noise to be produced by mining activity is calculated to be 95.8 dB (A). Generally most mining
operations produce noise between 100-109 dB (A). We have considered equipment and operation noise levels (max)
to be approx. 105 dB (A) for nose prediction modelling.
TABLE 4.10: PREDICTED NOISE INCREMENTAL VALUES
Location ID N1 N2 N3 N4 N5 N6 N7 N8 N9 N10 N11 N12
Monitored Value (Day) dB(A) 52.5 47.0 49.7 48.8 51.1 52.8 47.9 40.1 40.3 41.8 40.7 41.2
Incremental Value dB(A) 66.1 64.5 63.2 62.0 60.1 50.6 40.1 21.9 23.8 35.0 23.8 20.3
Total Predicted Noise level
dB(A)
66.3 64.6 63.4 62.2 60.6 54.8 48.6 40.2 40.4 42.6 40.8 41.2
NAAQ Standards Industrial Day Time- 75 dB (A) & Night Time- 70 dB (A)
Residential Day Time– 55 dB (A) & Night Time- 45 dB (A)
The incremental noise level is found within the range of54.8 –66.1 dB (A) in Core Zone and 40.2-48.6 dB
(A) in Buffer zone. The noise level at different receptors in buffer zone is lower due to the distance involved and
other topographical features adding to the noise attenuation. The resultant Noise level due to monitored values and
calculated values at the receptors are based on the mathematical formula considering attenuation due to Green Belt as
4.9 dB (A) the barrier effect. From the above table, it can be seen that the ambient noise levels at all the locations are
within permissible limits of Industrial area (core zone) & Residential area (buffer zone) as per THE NOISE
POLLUTION (REGULATION AND CONTROL) RULES, 2000 (The Principal Rules were published in the Gazette
of India, vide S.O. 123(E), dated 14.2.2000 and subsequently amended vide S.O. 1046(E), dated 22.11.2000, S.O.
1088(E), dated 11.10.2002, S.O. 1569 (E), dated 19.09.2006 and S.O. 50 (E) dated 11.01.2010 under the Environment
(Protection) Act, 1986.).
4.4.2 Mitigation measures for Control of Noise
The following noise mitigation measures are proposed for control of Noise
• Usage of sharp drill bits while drilling which will help in reducing noise;
• Secondary blasting will be totally avoided and hydraulic rock breaker are utilized for breaking boulders;
• Controlled blasting with proper spacing, burden, stemming and optimum charge/delay will reduce noise;
• The blasting will be carried out during favourable atmospheric condition and less human activity timings by
using nonelectrical initiation system;
• Proper maintenance, oiling and greasing of machines will be done every week to reduce generation of noise;
• Provision of sound insulated chambers for the workers working on machines (HEMM) producing higher
levels of noise;
• Silencers / mufflers will be installed in all machineries;
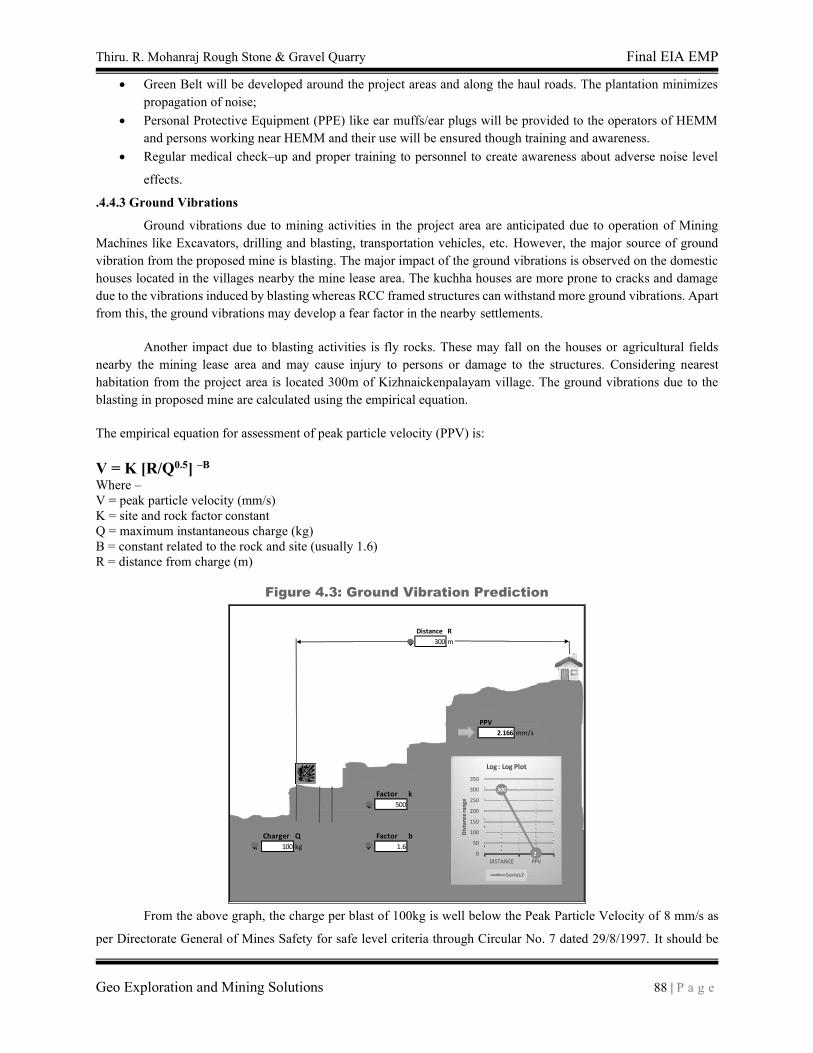
Thiru. R. Mohanraj Rough Stone & Gravel Quarry Final EIA EMP
Geo Exploration and Mining Solutions 88 | P a g e
• Green Belt will be developed around the project areas and along the haul roads. The plantation minimizes
propagation of noise;
• Personal Protective Equipment (PPE) like ear muffs/ear plugs will be provided to the operators of HEMM
and persons working near HEMM and their use will be ensured though training and awareness.
• Regular medical check–up and proper training to personnel to create awareness about adverse noise level
effects.
.4.4.3 Ground Vibrations
Ground vibrations due to mining activities in the project area are anticipated due to operation of Mining
Machines like Excavators, drilling and blasting, transportation vehicles, etc. However, the major source of ground
vibration from the proposed mine is blasting. The major impact of the ground vibrations is observed on the domestic
houses located in the villages nearby the mine lease area. The kuchha houses are more prone to cracks and damage
due to the vibrations induced by blasting whereas RCC framed structures can withstand more ground vibrations. Apart
from this, the ground vibrations may develop a fear factor in the nearby settlements.
Another impact due to blasting activities is fly rocks. These may fall on the houses or agricultural fields
nearby the mining lease area and may cause injury to persons or damage to the structures. Considering nearest
habitation from the project area is located 300m of Kizhnaickenpalayam village. The ground vibrations due to the
blasting in proposed mine are calculated using the empirical equation.
The empirical equation for assessment of peak particle velocity (PPV) is:
V = K [R/Q0.5] –B Where –
V = peak particle velocity (mm/s)
K = site and rock factor constant
Q = maximum instantaneous charge (kg)
B = constant related to the rock and site (usually 1.6)
R = distance from charge (m)
Figure 4.3: Ground Vibration Prediction
From the above graph, the charge per blast of 100kg is well below the Peak Particle Velocity of 8 mm/s as
per Directorate General of Mines Safety for safe level criteria through Circular No. 7 dated 29/8/1997. It should be
Distance R
300 m
PPV
2.166 mm/s
Factor k
500
Charger Q Factor b
100 kg 1.6
300
20
50
100
150
200
250
300
350
DISTANCE PPV
Dis
tan
ce r
an
ge
Log : Log Plot
Series2
Thiru. R. Mohanraj Rough Stone & Gravel Quarry Final EIA EMP
Geo Exploration and Mining Solutions 89 | P a g e
ensured that the explosives used for blasting at one blast should not exceed more than 100kg at any point of time.
However, as per statutory requirement control measures will be adopted to avoid the impacts due to ground vibrations
and fly rocks due to blasting.
4.4.3.1 Mitigation measures for Control of Vibration
▪ The blasting operations in the mine are proposed to be carried out by jackhammer drilling and blasting using
delay detonators, which reduces the ground vibrations;
▪ Proper quantity of explosive, suitable stemming materials and appropriate delay system should be adopted
to avoid overcharging and for safe blasting;
▪ Adequate safe distance from blasting should be maintained as per DGMS guidelines;
▪ Blasting shelter should be provided as per DGMS guidelines;
▪ Blasting operations shall be carried out only during day time;
▪ The charge per delay shall be minimized and preferably more number of delays will be used per blasts;
▪ During blasting, other activities in the immediate vicinity shall be temporarily stopped;
▪ Drilling parameters like depth, diameter and spacing will be properly designed to give proper blast;
▪ A fully trained explosives blast man (Mining Mate, Mines Foreman, 2nd Class Mines Manager/ 1st Class
Mines Manager) will be appointed.
▪ A set of shot firing rules will be drawn up and blasting shall commence outlining the detailed operating
procedures that will be followed to ensure that shot firing operations on site take place without endangering
the workforce or public.
▪ Sufficient angular stemming material will be used to confine the explosive force and minimise environmental
disturbance caused by venting / misfire.
▪ The detonators will be connected in a predetermined sequence to ensure that only one charge is detonated at
any one time and a NONEL or similar type initiation system will be used.
▪ The detonation delay sequence shall be designed so as to ensure that firing of the holes is in the direction of
free faces so as to minimise vibration effects.
▪ Appropriate blasting techniques shall be adopted such that the predicted peak particle velocity shall not
exceed 8 Hz.
▪ Vibration monitoring should be carried out every 6 months to check the efficacy of blasting practices.
4.5 Ecology and Biodiversity
4.5.1 Impact on Ecology and Biodiversity
There are no migratory corridors, migratory Avian-Fauna, Rare endemic, Endangered species and wild animals
in the area. No breeding and nesting site were identified in project site. No National park and Wildlife Sanctuary found
within 10km radius.
The project area is dry barren land and devoid of plantation, the area is surround by seasonal agriculture lands,
Existing Rough stone quarries and crushers hence no requirement for the uprooting of trees due to this quarry project.
Barbed wire fencing will be constructed around the project area to prevent the entry of cattles. In the post mining stage,
fencing is proposed constructed all around the mined-out void to prevent fall of animals in the mine pits.
No medicinal plant identified in core and buffer area.
The fauna in the vicinity of the project site is restricted to few common small species. There will be no impact on
fauna due to this quarry project.
Even though there are no impact on bio diversity and flora/fauna status due to project operations, positive impacts
will arise due to well-planned reclamation measures for restoration of land status in the area ultimately to productive land
category with elaborately planned green belt development activities and along with creation of water resources in the
working pits.
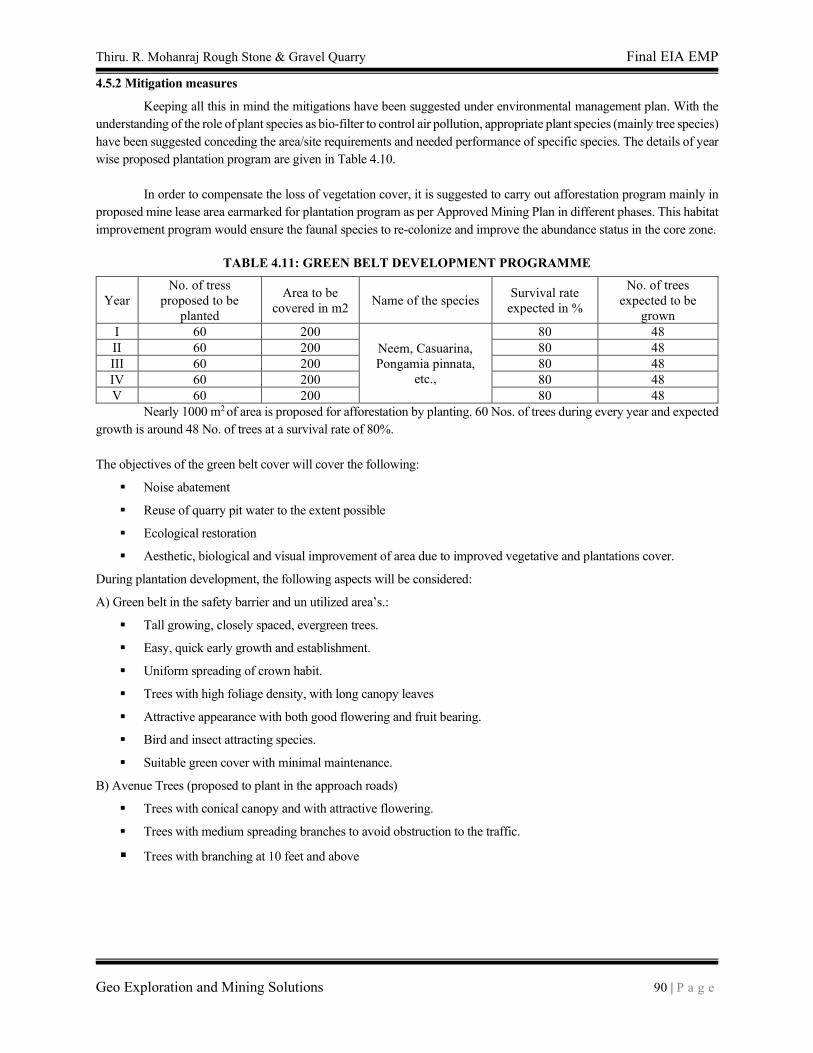
Thiru. R. Mohanraj Rough Stone & Gravel Quarry Final EIA EMP
Geo Exploration and Mining Solutions 90 | P a g e
4.5.2 Mitigation measures
Keeping all this in mind the mitigations have been suggested under environmental management plan. With the
understanding of the role of plant species as bio-filter to control air pollution, appropriate plant species (mainly tree species)
have been suggested conceding the area/site requirements and needed performance of specific species. The details of year
wise proposed plantation program are given in Table 4.10.
In order to compensate the loss of vegetation cover, it is suggested to carry out afforestation program mainly in
proposed mine lease area earmarked for plantation program as per Approved Mining Plan in different phases. This habitat
improvement program would ensure the faunal species to re-colonize and improve the abundance status in the core zone.
TABLE 4.11: GREEN BELT DEVELOPMENT PROGRAMME
Year
No. of tress
proposed to be
planted
Area to be
covered in m2 Name of the species
Survival rate
expected in %
No. of trees
expected to be
grown
I 60 200
Neem, Casuarina,
Pongamia pinnata,
etc.,
80 48
II 60 200 80 48
III 60 200 80 48
IV 60 200 80 48
V 60 200 80 48
Nearly 1000 m2 of area is proposed for afforestation by planting. 60 Nos. of trees during every year and expected
growth is around 48 No. of trees at a survival rate of 80%.
The objectives of the green belt cover will cover the following:
▪ Noise abatement
▪ Reuse of quarry pit water to the extent possible
▪ Ecological restoration
▪ Aesthetic, biological and visual improvement of area due to improved vegetative and plantations cover.
During plantation development, the following aspects will be considered:
A) Green belt in the safety barrier and un utilized area’s.:
▪ Tall growing, closely spaced, evergreen trees.
▪ Easy, quick early growth and establishment.
▪ Uniform spreading of crown habit.
▪ Trees with high foliage density, with long canopy leaves
▪ Attractive appearance with both good flowering and fruit bearing.
▪ Bird and insect attracting species.
▪ Suitable green cover with minimal maintenance.
B) Avenue Trees (proposed to plant in the approach roads)
▪ Trees with conical canopy and with attractive flowering.
▪ Trees with medium spreading branches to avoid obstruction to the traffic.
▪ Trees with branching at 10 feet and above
Thiru. R. Mohanraj Rough Stone & Gravel Quarry Final EIA EMP
Geo Exploration and Mining Solutions 91 | P a g e
4.6 Socio Economic
The socio-economic impacts of mining are many. Impacts of a mine project may be positive or Negative. The
adverse impacts attribute to physical displacement due to land acquisition, which is followed by loss of livelihood, mental
agony, changes in social structure, and risk to food security etc., People are also directly affected due to pollution. Social
Impact Assessment (SIA) is a process of analysis, monitoring and managing the social consequences of a project. Study
on Socio-economic status has already been carried out using primary socio-economic survey for generating the baseline
data of Socio-economic status.
4.6.1 Anticipated Impact
From the primary Socio-economic survey & through secondary data available from established literature and
census data 2011, it is found that there would be positive impact on Socio-economic condition of the nearby area. There
is no habitation within 300 m of the proposed mining lease area. Therefore, no major impact is anticipated on the nearby
habitation during the entire life of the mine
4.6.2 Mitigation Measures
▪ Mining in this cluster quarries area will give job opportunities to 24 Nos of the local people. Local people mainly
depend upon agricultural and small cottage industries where the income is irregular and low. Jobs in the mines
will increase their per capita income and improve the life style of the people.
▪ With the operation of proposed mining lease, various indirect employment opportunities will also be generated.
Several persons of the neighbouring villages will be benefited with contract works, employment through
contractors, running jeeps, trucks, tractors and buses on hire, running canteens, different kinds of shops and
transport related business avenues.
▪ Local Villagers will be provided with either direct employment or indirect employment such as business, contract
works and development work like roads etc. Villagers also get access to the other welfare amenities such as
drinking water, foods and provisions, shed etc.,
▪ Benefit to the State and the Central governments through financial revenues by way of royalty, tax, duties, etc..,
from this project directly and indirectly.
▪ Proper arrangements will be made for safe and healthy conditions such as dust suppression during loading,
unloading & transporting, etc. Development of allied business centres and other small-scale industries will help
to improve social standards of the surrounding villagers
▪ Mine management will contribute for the upliftment of these villages by conducting regular medical camps,
assistance in developing necessary infrastructure facilities like maintenance of schools, village roads, drinking
water supply, etc.,
4.7 Occupational Health Risks
Occupational health and safety hazards occur during the operational phase of mining and primarily include the following:
▪ Respiratory hazards
▪ Noise
▪ Physical hazards
▪ Explosive storage and handling
Thiru. R. Mohanraj Rough Stone & Gravel Quarry Final EIA EMP
Geo Exploration and Mining Solutions 92 | P a g e
4.7.1 Respiratory Hazards
Long-term exposure to silica dust may cause silicosis the following measures are proposed:
▪ Cabins of excavators and tippers will be enclosed with AC and sound proof
▪ Use of personal dust masks will be made compulsory
4.7.2 Noise
Workers are likely to get exposed to excessive noise levels during mining activities. The following measures are proposed
for implementation
▪ No employee will be exposed to a noise level greater than 85 dB(A) for a duration of more than 8 hours per day
without hearing protection
▪ The use of hearing protection will be enforced actively when the equivalent sound level over 8 hours reaches 85
dB(A), the peak sound levels reach 140 dB(C), or the average maximum sound level reaches 110 dB(A)
▪ Ear muffs provided will be capable of reducing sound levels at the ear to at least 85 dB(A)
▪ Periodic medical hearing checks will be performed on workers exposed to high noise levels
4.7.3 Physical Hazards
The following measures are proposed for control of physical hazards
▪ Specific personnel training on work-site safety management will be taken up;
▪ Work site assessment will be done by rock scaling of each surface exposed to workers to prevent accidental rock
falling and / or landslide, especially after blasting activities;
▪ Natural barriers, temporary railing, or specific danger signals will be provided along rock benches or other pit
areas where work is performed at heights more than 2m from ground level;
▪ Maintenance of yards, roads and footpaths, providing sufficient water drainage and preventing slippery surfaces
with an all-weather surface, such as coarse gravel will be taken up
4.7.4 Occupational Health Survey
All the persons will undergo pre-employment and periodic medical examination. Employees will be monitored for
occupational diseases by conducting the following tests
▪ General physical tests
▪ Audiometric tests
▪ Full chest, X-ray, Lung function tests, Spirometric tests
▪ Periodic medical examination – yearly
▪ Lung function/ Silicosis test – yearly, those who are exposed to dust
▪ Eye test
Essential medicines will be provided at the site. The medicines and other test facilities will be provided at free of
cost. The first aid box will be made available at the mine for immediate treatment.
First aid training will be imparted to the selected employees regularly. The lists of first aid trained members shall
be displayed at strategic places.
4.8 Mine Waste Management
As per approved mining plan there is practically no solid waste and overburden in present mining area. The
mining area lies on plain terrain having rocky exposure and has no soil cover; therefore, storage of soil is not required. And
the proposed recovery is 100% and there is no waste anticipated for storage or removal.
4.9 Mine Closure
Mine closure plan is the most important environmental requirement in mineral mining projects. The mine closure
plan should cover technical, environmental, social, legal and financial aspects dealing with progressive and post closure
Thiru. R. Mohanraj Rough Stone & Gravel Quarry Final EIA EMP
Geo Exploration and Mining Solutions 93 | P a g e
activities. The closure operation is a continuous series of activities starting from the decommissioning of the project.
Therefore, progressive mine closure plan should be specifically dealt with in the mining plan and is to be reviewed every
five years in the scheme of mining. As progressive mine closure is a continuous series of activities, it is obvious that the
proposals of scientific mining have included most of the activities to be included in the closure plan. While formulating
the closure objectives for the site, it is important to consider the existing or the pre-mining land use of the site; and how
the operation will affect this activity.
The primary aim is to ensure that the following broad objectives along with the abandonment of the mine can be
successfully achieved:
▪ To create a productive and sustainable after-use for the site, acceptable to mine owners, regulatory agencies, and
the public
▪ To protect public health and safety of the surrounding habitation
▪ To minimize environmental damage
▪ To conserve valuable attributes and aesthetics
▪ To overcome adverse socio-economic impacts.
4.9.1 Mine Closure criteria
The criteria involved in mine closure are discussed below:
4.9.1.1 Physical Stability
All anthropogenic structures, which include mine workings, buildings, rest shelters etc., remaining after mine
decommissioning should be physically stable. They should present no hazard to public health and safety as a result of
failure or physical deterioration and they should continue to perform the functions for which they were designed. The
design periods and factors of safety proposed should take full account of extreme events such as floods, hurricane, winds
or earthquakes, etc. and other natural perpetual forces like erosion, etc.
4.9.1.2 Chemical Stability
The solid wastes on the mine site should be chemically stable. This means that the consequences of chemical
changes or conditions leading to leaching of metals, salts or organic compounds should not endanger public health and
safety nor result in the deterioration of environmental attributes. If the pollutant discharge likely to cause adverse impacts
is predicted in advance, appropriate mitigation measures like settling of suspended solids or passive treatment to improve
water quality as well as quantity, etc. could be planned. Monitoring should demonstrate that there is no adverse effect of
pollutant concentrations exceeding the statutory limits for the water, soil and air qualities in the area around the closed
mine.
4.9.1.3 Biological Stability
The stability of the surrounding environment is primarily dependent upon the physical and chemical
characteristics of the site, whereas the biological stability of the mine site itself is closely related to rehabilitation and final
land use. Nevertheless, biological stability can significantly influence physical or chemical stability by stabilizing soil
cover, prevention of erosion/wash off, leaching, etc.,
A vegetation cover over the disturbed site is usually one of the main objectives of the rehabilitation programme,
as vegetation cover is the best long-term method of stabilizing the site. When the major earthwork components of the
rehabilitation programme have been completed, the process of establishing a stable vegetation community begins. For re-
vegetation, management of soil nutrient levels is an important consideration. Additions of nutrients are useful under three
situations.
▪ Where the nutrient level of spread topsoil is lower than material in-situ e.g. for development of social forestry
▪ Where it is intended to grow plants with a higher nutrient requirement than those occurring naturally e.g. planning
for agriculture
▪ Where it is desirable to get a quick growth response from the native flora during those times when moisture is
not a limiting factor e.g. development of green barriers
The Mine closure plan should be as per the approved mine plan. The mine closure is a part of approved mine plan and
activities of closure shall be carried out as per the process described in mine closure plan (Annexure I)
Thiru. R. Mohanraj Rough Stone & Gravel Quarry Final EIA EMP
Geo Exploration and Mining Solutions 94 | P a g e
CHAPTER – 5: ANALYSIS OF ALTERNATIVES (TECHNOLOGY AND
SITE)
5.1 Introduction
Consideration of alternatives to a project proposal is a requirement of EIA process. During the scoping
process, alternatives to a proposal can be considered or refined, either directly or by reference to the key issues
identified. A comparison of alternatives helps to determine the best method of achieving the project objectives with
minimum environmental impacts or indicates the most environmentally friendly and cost-effective options.
5.2 Factors behind the Selection of Project Site
Girijapuram Rough Stone and Gravel Quarry Project at Girijapuram Village is a mining project for
excavation of Rough stone and Gravel, which is site specific. The proposed mining lease area has following
advantages: -
▪ The mineral deposit occurs in a non-forest area.
▪ There is no habitation within the project area; hence no R & R issues exist.
▪ There is no river, stream, nallah and water bodies in the applied mine lease area.
▪ Availability of skilled, semi-skilled and unskilled workers in this region.
▪ All the basic amenities such as medical, firefighting, education, transportation, communication and
infrastructural facilities are well connected and accessible.
▪ The mining operations will not intersect the ground water level. Hence, no impact on ground water
environment.
▪ Study area falls in seismic zone – III, there is no major history of landslides, earthquake, subsidence etc.,
recorded in the past history
5.3 Analysis of alternative site
No alternatives are suggested as the mine site is mineral specific
5.4 Factors Behind Selection of proposed Technology
Mechanized open cast mining operation with drilling and blasting method will be used to extract Rough
Stone and Gravel in the area. The applied mining lease area has following advantages –
▪ As the mineral deposition is homogeneous and batholith formation, therefore opencast method of working
out deposit is preferred over underground method
▪ The material will be loaded after sprinkling with water with the help of excavators into dumpers / trippers
and transported to the needy customers.
▪ Blasting and availability of drills along with controlled blasting technology gives desired fragmentation so
that the mineral is handled safely and used without secondary blasting.
▪ Semi-skilled labours fit for quarrying operations are easily available around the nearby villages
5.5 Analysis of Alternative Technology
Open cast mechanized method has been selected for this project. This technology is having least
gestation period, economically viable, safest and less labour intensive. The method has inbuilt flexibility for increasing
or decreasing the production as per market condition.
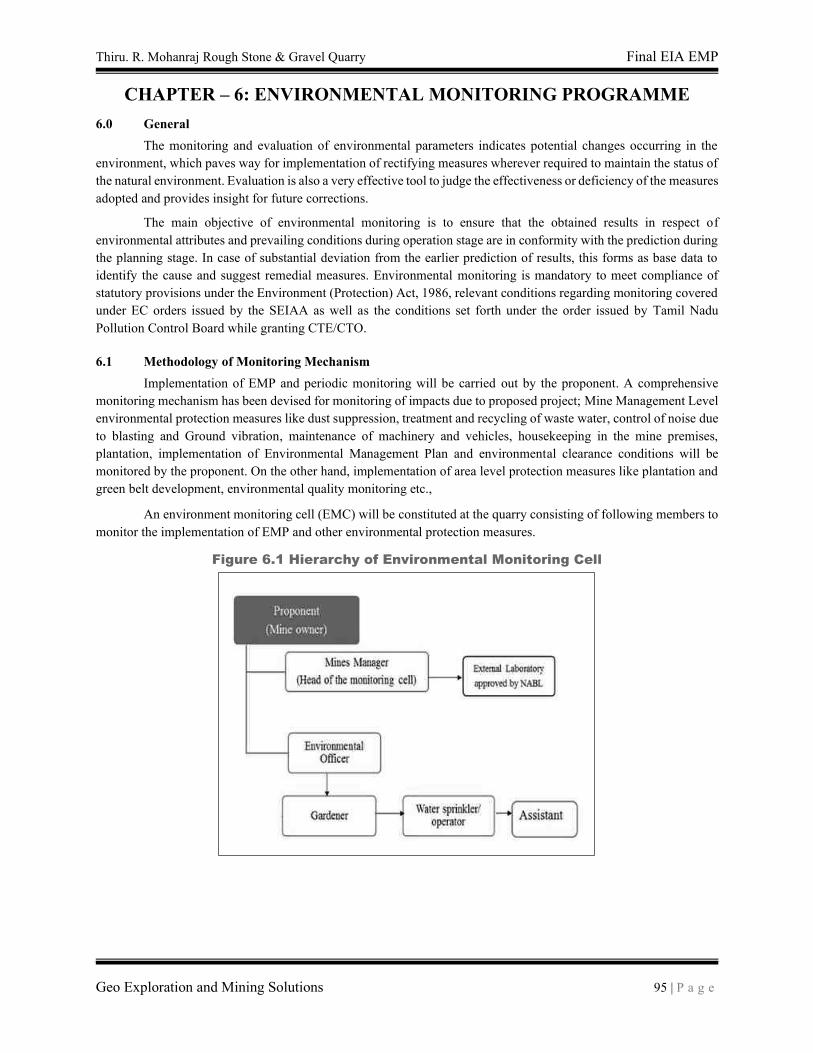
Thiru. R. Mohanraj Rough Stone & Gravel Quarry Final EIA EMP
Geo Exploration and Mining Solutions 95 | P a g e
CHAPTER – 6: ENVIRONMENTAL MONITORING PROGRAMME
6.0 General
The monitoring and evaluation of environmental parameters indicates potential changes occurring in the
environment, which paves way for implementation of rectifying measures wherever required to maintain the status of
the natural environment. Evaluation is also a very effective tool to judge the effectiveness or deficiency of the measures
adopted and provides insight for future corrections.
The main objective of environmental monitoring is to ensure that the obtained results in respect of
environmental attributes and prevailing conditions during operation stage are in conformity with the prediction during
the planning stage. In case of substantial deviation from the earlier prediction of results, this forms as base data to
identify the cause and suggest remedial measures. Environmental monitoring is mandatory to meet compliance of
statutory provisions under the Environment (Protection) Act, 1986, relevant conditions regarding monitoring covered
under EC orders issued by the SEIAA as well as the conditions set forth under the order issued by Tamil Nadu
Pollution Control Board while granting CTE/CTO.
6.1 Methodology of Monitoring Mechanism
Implementation of EMP and periodic monitoring will be carried out by the proponent. A comprehensive
monitoring mechanism has been devised for monitoring of impacts due to proposed project; Mine Management Level
environmental protection measures like dust suppression, treatment and recycling of waste water, control of noise due
to blasting and Ground vibration, maintenance of machinery and vehicles, housekeeping in the mine premises,
plantation, implementation of Environmental Management Plan and environmental clearance conditions will be
monitored by the proponent. On the other hand, implementation of area level protection measures like plantation and
green belt development, environmental quality monitoring etc.,
An environment monitoring cell (EMC) will be constituted at the quarry consisting of following members to
monitor the implementation of EMP and other environmental protection measures.
Figure 6.1 Hierarchy of Environmental Monitoring Cell
Thiru. R. Mohanraj Rough Stone & Gravel Quarry Final EIA EMP
Geo Exploration and Mining Solutions 96 | P a g e
The responsibilities of this cell will be:
• Implementation of pollution control measures
• Monitoring programme implementation
• Post-plantation care
• To check the efficiency of pollution control measures taken
• Any other activity as may be related to environment
• Seeking expert’s advice when needed
The environmental monitoring cell will co-ordinate all monitoring programs at site and data thus generated
will be regularly furnished to the State regulatory agencies.
The sampling and analysis report of the monitored environmental attributes will be submitted to the Tamil
Nadu Pollution Control Board (TNPCB) at a frequency of monthly, half-yearly and yearly. The half-yearly reports
will be submitted to Ministry of Environment and Forest, Regional Office and SEIAA as well.
The sampling and analysis of the environmental attributes will be as per the guidelines of Central Pollution
Control Board (CPCB)/Ministry of Environment, Forest and Climate Change (MoEF & CC).
6.2 Implementation Schedule of Mitigation Measures
The mitigation measures proposed in Chapter-4 will be implemented so as to reduce the impact on the
environment due to the operations of the proposed project. Implementation schedule of mitigation measures is given
in Table 6.1.
TABLE 6.1 IMPLEMENTATION SCHEDULE
Sl No. Recommendations Time Period Schedule
1 Land Environment Control
Measures Before commissioning of the project
Immediately after the
commencement of project
2 Soil Quality Control
Measures Before commissioning of the project
Immediately after the
commencement of project
3 Water Pollution Control
Measures
Before commissioning of the project
and along with mining operation
Immediately after the
commencement of project
4 Air Pollution Control
Measures
Before commissioning of the project
and along with mining operation
Immediately after the
commencement of project
5 Noise Pollution Control
Measures
Before commissioning of the project
and along with mining operation
Immediately after the
commencement of project
6 Ecological Environment Phase wise implementation every year
along with mine operations
Immediately after the
commencement of project
Thiru. R. Mohanraj Rough Stone & Gravel Quarry Final EIA EMP
Geo Exploration and Mining Solutions 97 | P a g e
6.3 Monitoring Schedule and Frequency
The environmental monitoring will be conducted in the mine operations as follows:
• Air quality;
• Water and wastewater quality;
• Noise levels;
• Soil Quality; and
• Greenbelt Development
The details of monitoring are detailed in Table 6.2
TABLE 6.2: MONITORING SCHEDULE
S. No.
Environment
Attributes
Monitoring Parameters
Duration Duration
1 Air Quality
8 locations (One station in
the core zone and one in 500
m radius, two stations in the
upwind, three stations on the
downwind direction)
24 hours
Twice in a week
for every 6
months
Fugitive Dust, PM2.5,
PM10,
SO2 and NOx.
2 Meteorology
At mine site before start of
Air Quality Monitoring &
IMD Secondary Data
Hourly /
Daily
Continuous
online
monitoring
Wind speed,
Wind direction,
Temperature,
Relative humidity and
Rainfall
3 Water Quality
Monitoring
Mine Pit Water, Nearby
project area (Surface water
and ground water)
- Once in 6
months
Parameters specified
under IS:10500, 1993
& CPCB Norms
4 Hydrology
Water level in open wells in
buffer zone around 1km at
specific wells
- Once in
6months Depth in BGL
5 Noise
Near Mine Equipment /
machineries, Mines Office,
Operator Cabin, Surrounding
Villages in Buffer Area
Hourly –
1 Day
Once in 6
months
Leq, Lmax, Lmin, Leq
Day &Leq Night
6 Vibration At the nearest habitation (in
case of reporting) –
During
blasting
Operation
Peak Particle Velocity
7 Soil Core Zone and Buffer
zone (Grab samples) –
Once In six
months
Physical
And Chemical
Characteristics
8 Greenbelt Within the Project Area Daily Monthly Maintenance
Source: Guidance of manual for mining of minerals, February 2010
6.4 Budgetary Provision for Environmental Monitoring Programme
The cost in respect of monitoring of environmental attributes, parameter to be monitored,
sampling/monitoring locations with frequency and cost provision against each is shown in Table 6.3. Monitoring work
will be outsourced to external laboratory approved by NABL / MoEF.
The proposed capital cost for Environmental Monitoring Programme is Rs 76,000/- and the recurring cost is
Rs 76,000/- per annum.
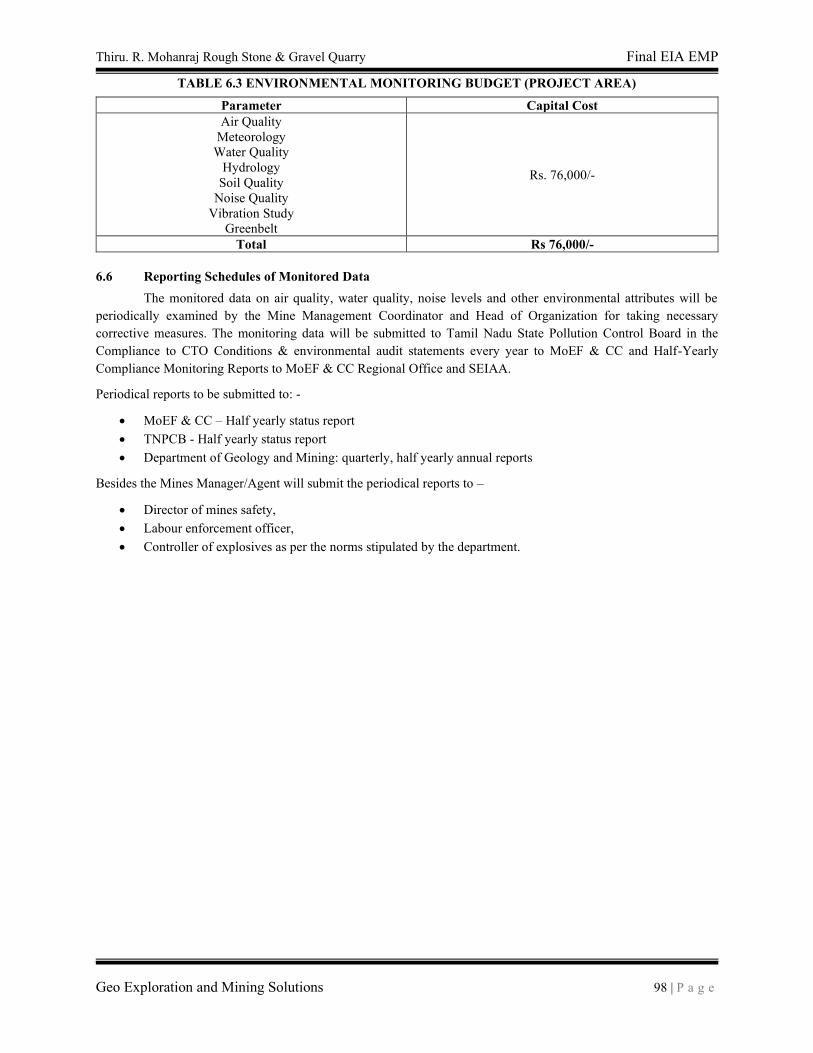
Thiru. R. Mohanraj Rough Stone & Gravel Quarry Final EIA EMP
Geo Exploration and Mining Solutions 98 | P a g e
TABLE 6.3 ENVIRONMENTAL MONITORING BUDGET (PROJECT AREA)
Parameter Capital Cost
Air Quality
Meteorology
Water Quality
Hydrology
Soil Quality
Noise Quality
Vibration Study
Greenbelt
Rs. 76,000/-
Total Rs 76,000/-
6.6 Reporting Schedules of Monitored Data
The monitored data on air quality, water quality, noise levels and other environmental attributes will be
periodically examined by the Mine Management Coordinator and Head of Organization for taking necessary
corrective measures. The monitoring data will be submitted to Tamil Nadu State Pollution Control Board in the
Compliance to CTO Conditions & environmental audit statements every year to MoEF & CC and Half-Yearly
Compliance Monitoring Reports to MoEF & CC Regional Office and SEIAA.
Periodical reports to be submitted to: -
• MoEF & CC – Half yearly status report
• TNPCB - Half yearly status report
• Department of Geology and Mining: quarterly, half yearly annual reports
Besides the Mines Manager/Agent will submit the periodical reports to –
• Director of mines safety,
• Labour enforcement officer,
• Controller of explosives as per the norms stipulated by the department.
Thiru. R. Mohanraj Rough Stone & Gravel Quarry Final EIA EMP
Geo Exploration and Mining Solutions 99 | P a g e
CHAPTER – 7: ADDITIONAL STUDIES
7.0 General
The following Additional Studies were done as per items identified by project proponent and items identified by
regulatory authority. And items identified by public and other stakeholders will be incorporated after Public Hearing.
▪ Public Consultation
▪ Risk Assessment
▪ Disaster Management Plan
▪ Cumulative Impact Study
7.1. Public Consultation:
Application to The Member Secretary of the Tamil Nadu Pollution Control Board (TNPCB) to conduct Public
Hearing in a systematic, time bound and transparent manner ensuring widest possible public participation at the project
site or in its close proximity in the district is submitted along with this Draft EIA EMP Report.
7.2 Risk Assessment
The methodology for the risk assessment has been based on the specific risk assessment guidance issued by
the Directorate General of Mine Safety (DGMS), Dhanbad, vide Circular No.13 of 2002, dated 31st December, 2002.
The DGMS risk assessment process is intended to identify existing and probable hazards in the work environment and
all operations and assess the risk levels of those hazards in order to prioritize those that need immediate attention.
Further, mechanisms responsible for these hazards are identified and their control measures, set to timetable are
recorded along with pinpointed responsibilities.
The cluster quarry operation will be carried out under the direction of a Qualified Competent Mine manager
holding certificate of competency to manage a metalliferous mine granted by the DGMS, Dhanbad. Risk Assessment
is all about prevention of accidents and to take necessary steps to prevent it from happening.
Factors of risks involved due to human induced activities in connection with mining & allied activities with
detailed analysis of causes and control measures for the mine is given in below Table 7.1.
TABLE 7.1 RISK ASSESSMENT
S. No Risk factors Causes of risk Control measures
1 Accidents due to
explosives and heavy
mining machineries
Improper handling and
unsafe working practice
All safety precautions and provisions of Mine
Act, 1952, Metalliferrous Mines Regulation,
1961 and Mines Rules, 1955 will be strictly
followed during all mining operations;
Entry of unauthorized persons will be
prohibited;
Firefighting and first-aid provisions in the mine
office complex and mining area;
Provisions of all the safety appliances such as
safety boot, helmets, goggles etc. will be made
available to the employees and regular check for
their use
Working of quarry, as per approved plans and
regularly updating the mine plans;
Cleaning of mine faces shall be daily done in
order to avoid any overhang or undercut;
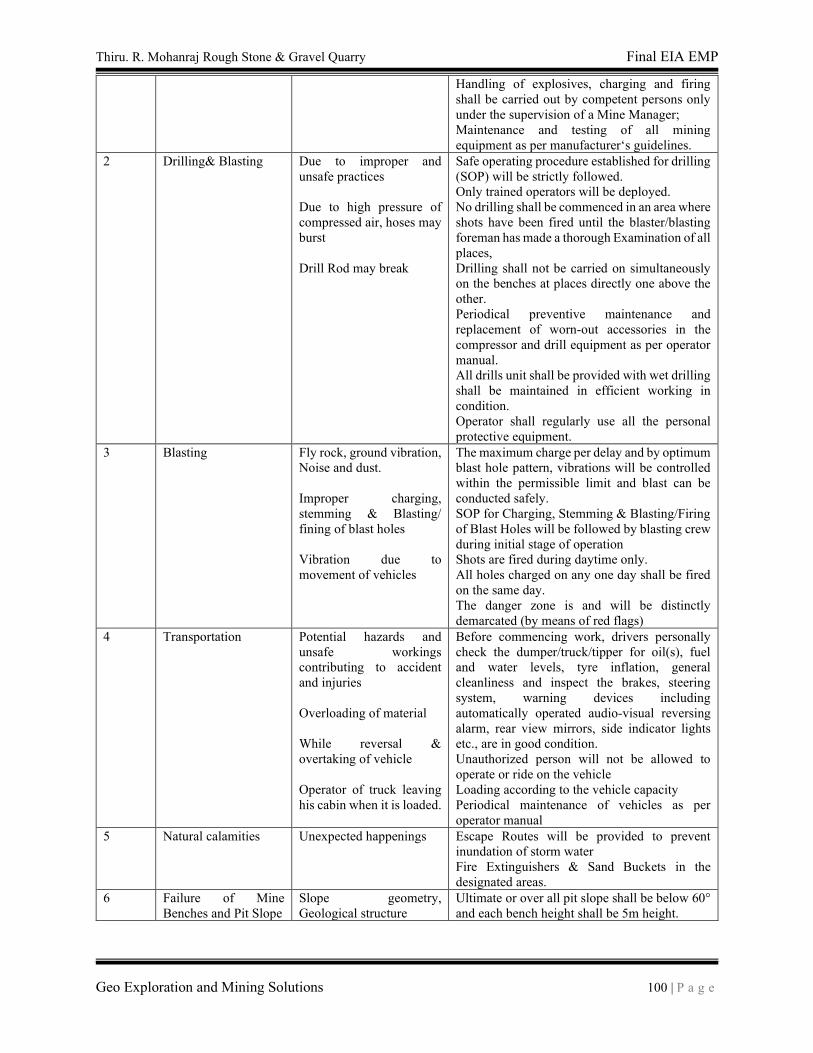
Thiru. R. Mohanraj Rough Stone & Gravel Quarry Final EIA EMP
Geo Exploration and Mining Solutions 100 | P a g e
Handling of explosives, charging and firing
shall be carried out by competent persons only
under the supervision of a Mine Manager;
Maintenance and testing of all mining
equipment as per manufacturer‘s guidelines. 2 Drilling& Blasting Due to improper and
unsafe practices
Due to high pressure of
compressed air, hoses may
burst
Drill Rod may break
Safe operating procedure established for drilling
(SOP) will be strictly followed.
Only trained operators will be deployed.
No drilling shall be commenced in an area where
shots have been fired until the blaster/blasting
foreman has made a thorough Examination of all
places,
Drilling shall not be carried on simultaneously
on the benches at places directly one above the
other.
Periodical preventive maintenance and
replacement of worn-out accessories in the
compressor and drill equipment as per operator
manual.
All drills unit shall be provided with wet drilling
shall be maintained in efficient working in
condition.
Operator shall regularly use all the personal
protective equipment.
3 Blasting Fly rock, ground vibration,
Noise and dust.
Improper charging,
stemming & Blasting/
fining of blast holes
Vibration due to
movement of vehicles
The maximum charge per delay and by optimum
blast hole pattern, vibrations will be controlled
within the permissible limit and blast can be
conducted safely.
SOP for Charging, Stemming & Blasting/Firing
of Blast Holes will be followed by blasting crew
during initial stage of operation
Shots are fired during daytime only.
All holes charged on any one day shall be fired
on the same day.
The danger zone is and will be distinctly
demarcated (by means of red flags)
4 Transportation Potential hazards and
unsafe workings
contributing to accident
and injuries
Overloading of material
While reversal &
overtaking of vehicle
Operator of truck leaving
his cabin when it is loaded.
Before commencing work, drivers personally
check the dumper/truck/tipper for oil(s), fuel
and water levels, tyre inflation, general
cleanliness and inspect the brakes, steering
system, warning devices including
automatically operated audio-visual reversing
alarm, rear view mirrors, side indicator lights
etc., are in good condition.
Unauthorized person will not be allowed to
operate or ride on the vehicle
Loading according to the vehicle capacity
Periodical maintenance of vehicles as per
operator manual
5 Natural calamities Unexpected happenings Escape Routes will be provided to prevent
inundation of storm water
Fire Extinguishers & Sand Buckets in the
designated areas.
6 Failure of Mine
Benches and Pit Slope
Slope geometry,
Geological structure
Ultimate or over all pit slope shall be below 60°
and each bench height shall be 5m height.
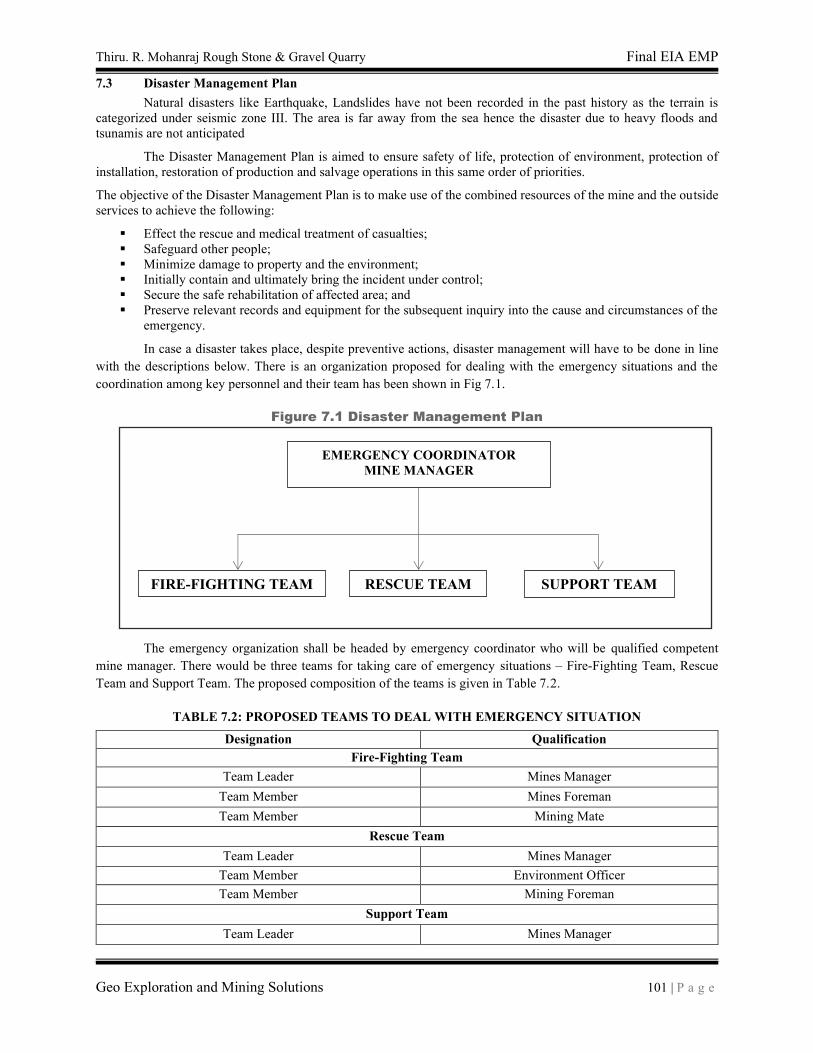
Thiru. R. Mohanraj Rough Stone & Gravel Quarry Final EIA EMP
Geo Exploration and Mining Solutions 101 | P a g e
7.3 Disaster Management Plan
Natural disasters like Earthquake, Landslides have not been recorded in the past history as the terrain is
categorized under seismic zone III. The area is far away from the sea hence the disaster due to heavy floods and
tsunamis are not anticipated
The Disaster Management Plan is aimed to ensure safety of life, protection of environment, protection of
installation, restoration of production and salvage operations in this same order of priorities.
The objective of the Disaster Management Plan is to make use of the combined resources of the mine and the outside
services to achieve the following:
▪ Effect the rescue and medical treatment of casualties;
▪ Safeguard other people;
▪ Minimize damage to property and the environment;
▪ Initially contain and ultimately bring the incident under control;
▪ Secure the safe rehabilitation of affected area; and
▪ Preserve relevant records and equipment for the subsequent inquiry into the cause and circumstances of the
emergency.
In case a disaster takes place, despite preventive actions, disaster management will have to be done in line
with the descriptions below. There is an organization proposed for dealing with the emergency situations and the
coordination among key personnel and their team has been shown in Fig 7.1.
Figure 7.1 Disaster Management Plan
The emergency organization shall be headed by emergency coordinator who will be qualified competent
mine manager. There would be three teams for taking care of emergency situations – Fire-Fighting Team, Rescue
Team and Support Team. The proposed composition of the teams is given in Table 7.2.
TABLE 7.2: PROPOSED TEAMS TO DEAL WITH EMERGENCY SITUATION
Designation Qualification
Fire-Fighting Team
Team Leader Mines Manager
Team Member Mines Foreman
Team Member Mining Mate
Rescue Team
Team Leader Mines Manager
Team Member Environment Officer
Team Member Mining Foreman
Support Team
Team Leader Mines Manager
EMERGENCY COORDINATOR
MINE MANAGER
SUPPORT TEAM RESCUE TEAM FIRE-FIGHTING TEAM
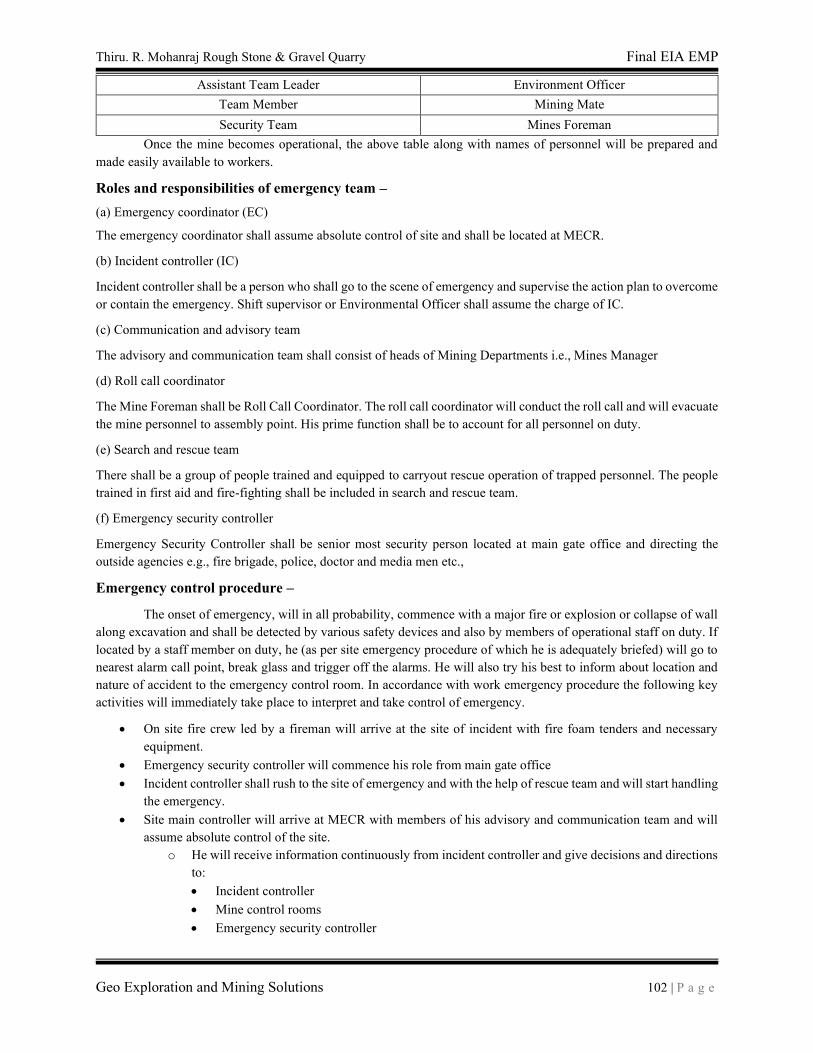
Thiru. R. Mohanraj Rough Stone & Gravel Quarry Final EIA EMP
Geo Exploration and Mining Solutions 102 | P a g e
Assistant Team Leader Environment Officer
Team Member Mining Mate
Security Team Mines Foreman
Once the mine becomes operational, the above table along with names of personnel will be prepared and
made easily available to workers.
Roles and responsibilities of emergency team –
(a) Emergency coordinator (EC)
The emergency coordinator shall assume absolute control of site and shall be located at MECR.
(b) Incident controller (IC)
Incident controller shall be a person who shall go to the scene of emergency and supervise the action plan to overcome
or contain the emergency. Shift supervisor or Environmental Officer shall assume the charge of IC.
(c) Communication and advisory team
The advisory and communication team shall consist of heads of Mining Departments i.e., Mines Manager
(d) Roll call coordinator
The Mine Foreman shall be Roll Call Coordinator. The roll call coordinator will conduct the roll call and will evacuate
the mine personnel to assembly point. His prime function shall be to account for all personnel on duty.
(e) Search and rescue team
There shall be a group of people trained and equipped to carryout rescue operation of trapped personnel. The people
trained in first aid and fire-fighting shall be included in search and rescue team.
(f) Emergency security controller
Emergency Security Controller shall be senior most security person located at main gate office and directing the
outside agencies e.g., fire brigade, police, doctor and media men etc.,
Emergency control procedure –
The onset of emergency, will in all probability, commence with a major fire or explosion or collapse of wall
along excavation and shall be detected by various safety devices and also by members of operational staff on duty. If
located by a staff member on duty, he (as per site emergency procedure of which he is adequately briefed) will go to
nearest alarm call point, break glass and trigger off the alarms. He will also try his best to inform about location and
nature of accident to the emergency control room. In accordance with work emergency procedure the following key
activities will immediately take place to interpret and take control of emergency.
• On site fire crew led by a fireman will arrive at the site of incident with fire foam tenders and necessary
equipment.
• Emergency security controller will commence his role from main gate office
• Incident controller shall rush to the site of emergency and with the help of rescue team and will start handling
the emergency.
• Site main controller will arrive at MECR with members of his advisory and communication team and will
assume absolute control of the site.
o He will receive information continuously from incident controller and give decisions and directions
to:
• Incident controller
• Mine control rooms
• Emergency security controller

Thiru. R. Mohanraj Rough Stone & Gravel Quarry Final EIA EMP
Geo Exploration and Mining Solutions 103 | P a g e
Proposed fire extinguishers at different locations –
The following type of fire extinguishers has been proposed at strategic locations within the mine.
TABLE 7.3: PROPOSED FIRE EXTINGUISHERS AT DIFFERENT LOCATIONS
LOCATION TYPE OF FIRE EXTINGUISHERS
Electrical Equipment’s CO2 type, foam type, dry chemical powder type
Fuel Storage Area CO2 type, foam type, dry chemical powder type, Sand bucket
Office Area Dry chemical type, foam type
Alarm system to be followed during disaster –
On receiving the message of disaster from Site Controller, fire-fighting team, the mine control room attendant
will sound siren wailing for 5 minutes. Incident controller will arrange to broadcast disaster message through public
address system.
On receiving the message of "Emergency Over" from Incident Controller the emergency control room attendant will
give "All Clear Signal”, by sounding alarm straight for 2 minutes.
The features of alarm system will be explained to one and all to avoid panic or misunderstanding during disaster.
In order to prevent or take care of hazard / disasters if any the following control measures have been adopted.
▪ All safety precautions and provisions of Metalliferous Mines Regulations (MMR), 1961 is strictly followed
during all mining operations.
▪ Observance of all safety precautions for blasting and storage of explosives as per MMR 1961.
▪ Entry of unauthorized persons into mine & allied areas is completely prohibited.
▪ Fire-fighting and first-aid provisions in the mines office complex and mining area are provided.
▪ Provisions of all the safety appliances such as safety boot, helmets, goggles, dust masks, ear plugs and ear
muffs etc. are made available to the employees and the use of same is strictly adhered to through regular
monitoring.
▪ Training and refresher courses for all the employees working in hazardous premises.
▪ Working of mine, as per approved plans and regularly updating the mine plans.
▪ Cleaning of mine faces is regularly done.
▪ Handling of explosives, charging and blasting are carried out only by qualified persons following SOP.
▪ Checking and regular maintenance of garland drains and earthen bunds to avoid any inflow of surface water
in the mine pit.
▪ Provision of high-capacity standby pumps with generator sets with enough quantity of diesel for emergency
pumping especially during monsoon.
▪ A blasting SIREN is used at the time of blasting for audio signal.
▪ Before blasting and after blasting, red and green flags are displayed as visual signals.
▪ Warning notice boards indicating the time of blasting and NOT TO TRESPASS are displayed at prominent
places.
▪ Regular maintenance and testing of all mining equipment were carried out as per manufacturer’s guidelines
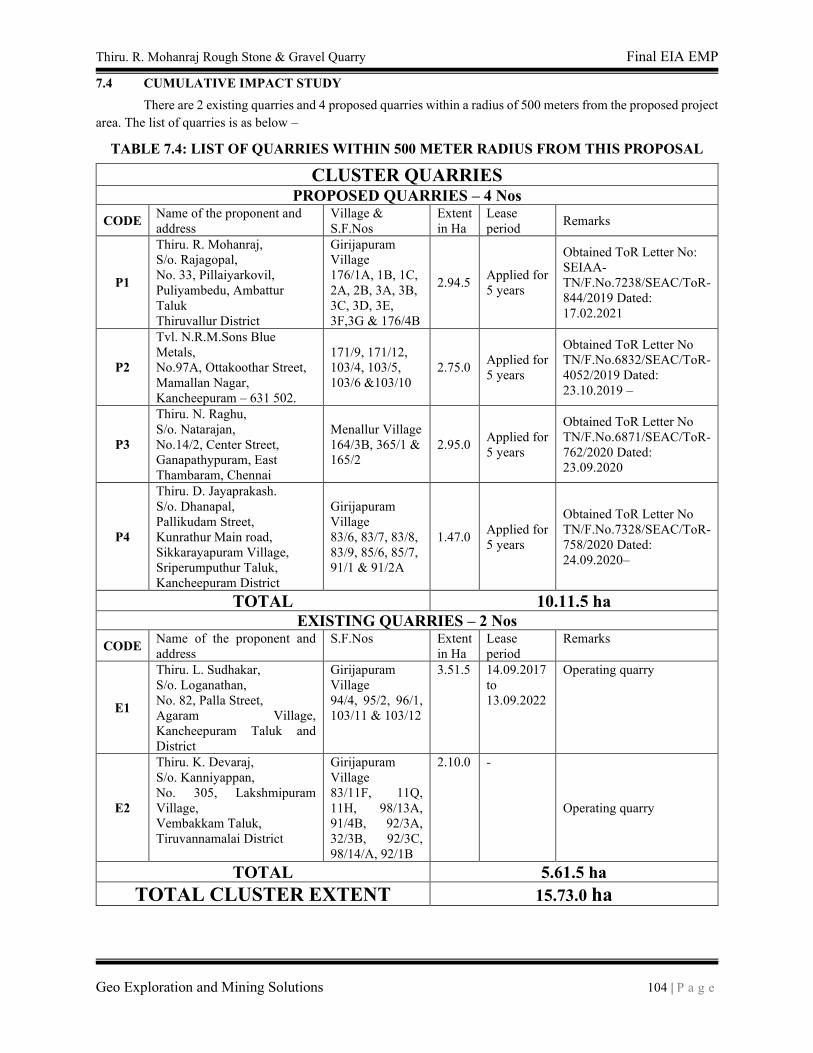
Thiru. R. Mohanraj Rough Stone & Gravel Quarry Final EIA EMP
Geo Exploration and Mining Solutions 104 | P a g e
7.4 CUMULATIVE IMPACT STUDY
There are 2 existing quarries and 4 proposed quarries within a radius of 500 meters from the proposed project
area. The list of quarries is as below –
TABLE 7.4: LIST OF QUARRIES WITHIN 500 METER RADIUS FROM THIS PROPOSAL
CLUSTER QUARRIES PROPOSED QUARRIES – 4 Nos
CODE Name of the proponent and
address
Village &
S.F.Nos
Extent
in Ha
Lease
period Remarks
P1
Thiru. R. Mohanraj,
S/o. Rajagopal,
No. 33, Pillaiyarkovil,
Puliyambedu, Ambattur
Taluk
Thiruvallur District
Girijapuram
Village
176/1A, 1B, 1C,
2A, 2B, 3A, 3B,
3C, 3D, 3E,
3F,3G & 176/4B
2.94.5 Applied for
5 years
Obtained ToR Letter No:
SEIAA-
TN/F.No.7238/SEAC/ToR-
844/2019 Dated:
17.02.2021
P2
Tvl. N.R.M.Sons Blue
Metals,
No.97A, Ottakoothar Street,
Mamallan Nagar,
Kancheepuram – 631 502.
171/9, 171/12,
103/4, 103/5,
103/6 &103/10
2.75.0 Applied for
5 years
Obtained ToR Letter No
TN/F.No.6832/SEAC/ToR-
4052/2019 Dated:
23.10.2019 –
P3
Thiru. N. Raghu,
S/o. Natarajan,
No.14/2, Center Street,
Ganapathypuram, East
Thambaram, Chennai
Menallur Village
164/3B, 365/1 &
165/2
2.95.0 Applied for
5 years
Obtained ToR Letter No
TN/F.No.6871/SEAC/ToR-
762/2020 Dated:
23.09.2020
P4
Thiru. D. Jayaprakash.
S/o. Dhanapal,
Pallikudam Street,
Kunrathur Main road,
Sikkarayapuram Village,
Sriperumputhur Taluk,
Kancheepuram District
Girijapuram
Village
83/6, 83/7, 83/8,
83/9, 85/6, 85/7,
91/1 & 91/2A
1.47.0 Applied for
5 years
Obtained ToR Letter No
TN/F.No.7328/SEAC/ToR-
758/2020 Dated:
24.09.2020–
TOTAL 10.11.5 ha EXISTING QUARRIES – 2 Nos
CODE Name of the proponent and
address
S.F.Nos Extent
in Ha
Lease
period
Remarks
E1
Thiru. L. Sudhakar,
S/o. Loganathan,
No. 82, Palla Street,
Agaram Village,
Kancheepuram Taluk and
District
Girijapuram
Village
94/4, 95/2, 96/1,
103/11 & 103/12
3.51.5 14.09.2017
to
13.09.2022
Operating quarry
E2
Thiru. K. Devaraj,
S/o. Kanniyappan,
No. 305, Lakshmipuram
Village,
Vembakkam Taluk,
Tiruvannamalai District
Girijapuram
Village
83/11F, 11Q,
11H, 98/13A,
91/4B, 92/3A,
32/3B, 92/3C,
98/14/A, 92/1B
2.10.0 -
Operating quarry
TOTAL 5.61.5 ha
TOTAL CLUSTER EXTENT 15.73.0 ha
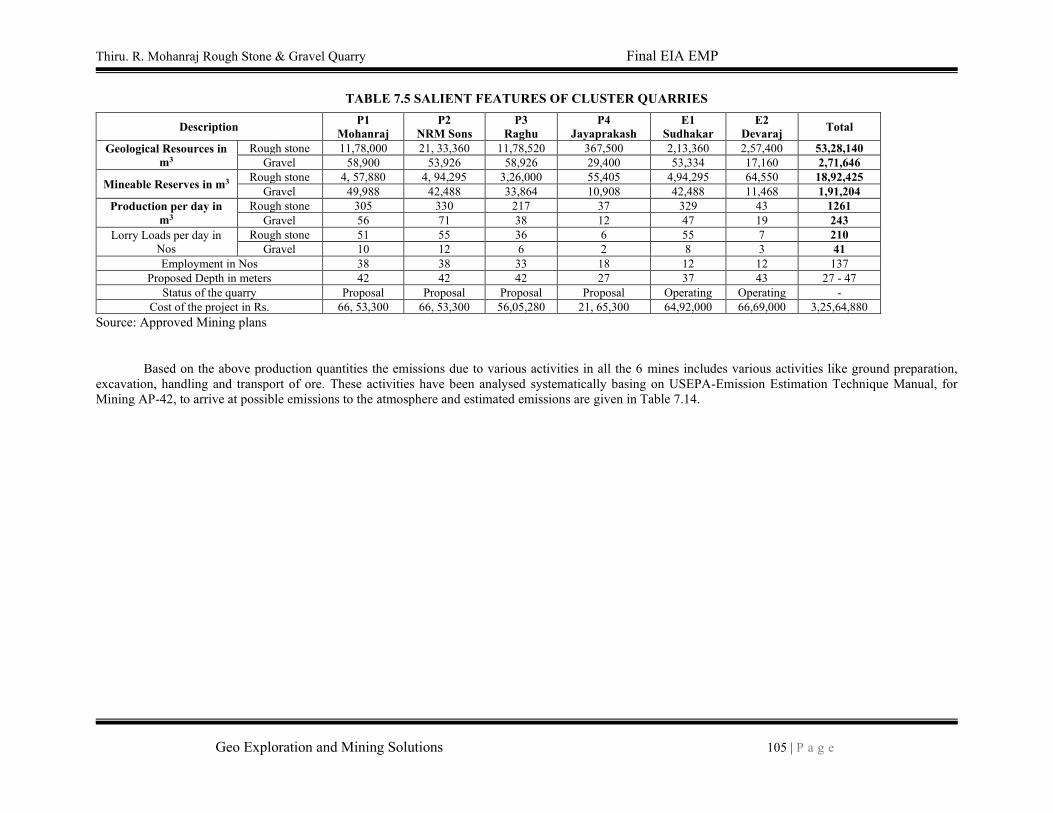
Thiru. R. Mohanraj Rough Stone & Gravel Quarry Final EIA EMP
Geo Exploration and Mining Solutions 105 | P a g e
TABLE 7.5 SALIENT FEATURES OF CLUSTER QUARRIES
Description P1
Mohanraj
P2
NRM Sons
P3
Raghu
P4
Jayaprakash
E1
Sudhakar
E2
Devaraj Total
Geological Resources in
m3
Rough stone 11,78,000 21, 33,360 11,78,520 367,500 2,13,360 2,57,400 53,28,140
Gravel 58,900 53,926 58,926 29,400 53,334 17,160 2,71,646
Mineable Reserves in m3 Rough stone 4, 57,880 4, 94,295 3,26,000 55,405 4,94,295 64,550 18,92,425
Gravel 49,988 42,488 33,864 10,908 42,488 11,468 1,91,204
Production per day in
m3
Rough stone 305 330 217 37 329 43 1261
Gravel 56 71 38 12 47 19 243
Lorry Loads per day in
Nos
Rough stone 51 55 36 6 55 7 210
Gravel 10 12 6 2 8 3 41
Employment in Nos 38 38 33 18 12 12 137
Proposed Depth in meters 42 42 42 27 37 43 27 - 47
Status of the quarry Proposal Proposal Proposal Proposal Operating Operating -
Cost of the project in Rs. 66, 53,300 66, 53,300 56,05,280 21, 65,300 64,92,000 66,69,000 3,25,64,880
Source: Approved Mining plans
Based on the above production quantities the emissions due to various activities in all the 6 mines includes various activities like ground preparation,
excavation, handling and transport of ore. These activities have been analysed systematically basing on USEPA-Emission Estimation Technique Manual, for
Mining AP-42, to arrive at possible emissions to the atmosphere and estimated emissions are given in Table 7.14.
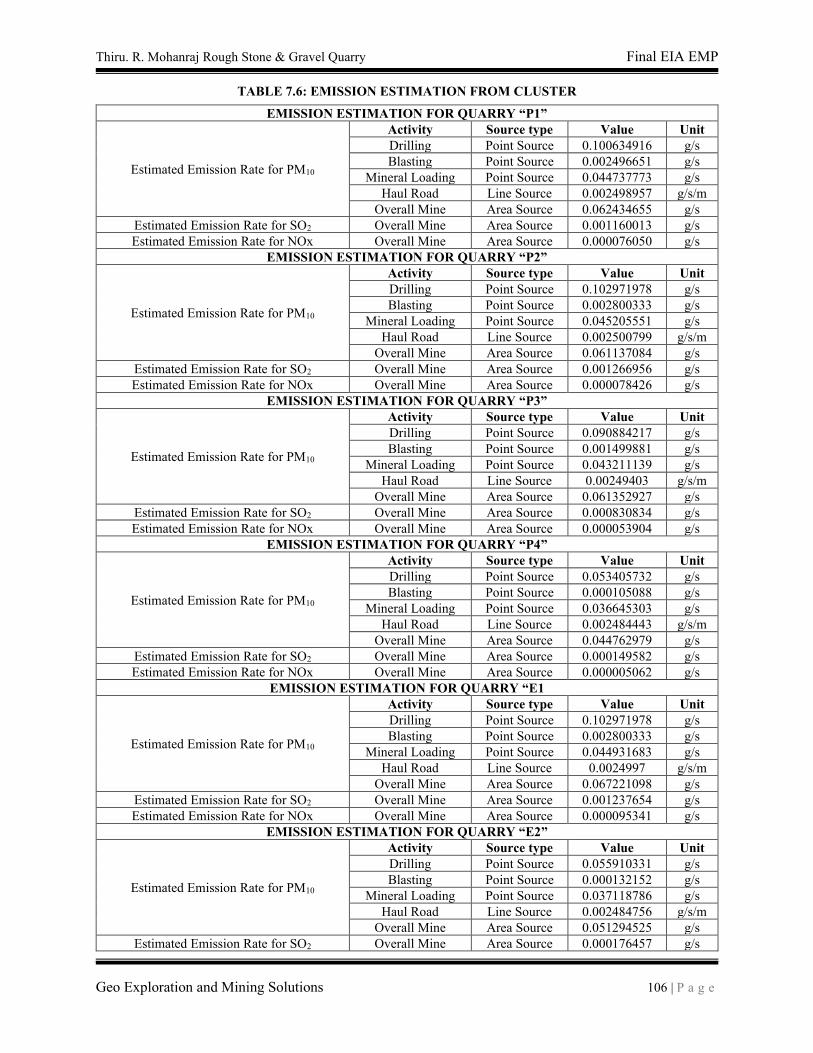
Thiru. R. Mohanraj Rough Stone & Gravel Quarry Final EIA EMP
Geo Exploration and Mining Solutions 106 | P a g e
TABLE 7.6: EMISSION ESTIMATION FROM CLUSTER
EMISSION ESTIMATION FOR QUARRY “P1”
Estimated Emission Rate for PM10
Activity Source type Value Unit
Drilling Point Source 0.100634916 g/s
Blasting Point Source 0.002496651 g/s
Mineral Loading Point Source 0.044737773 g/s
Haul Road Line Source 0.002498957 g/s/m
Overall Mine Area Source 0.062434655 g/s
Estimated Emission Rate for SO2 Overall Mine Area Source 0.001160013 g/s
Estimated Emission Rate for NOx Overall Mine Area Source 0.000076050 g/s
EMISSION ESTIMATION FOR QUARRY “P2”
Estimated Emission Rate for PM10
Activity Source type Value Unit
Drilling Point Source 0.102971978 g/s
Blasting Point Source 0.002800333 g/s
Mineral Loading Point Source 0.045205551 g/s
Haul Road Line Source 0.002500799 g/s/m
Overall Mine Area Source 0.061137084 g/s
Estimated Emission Rate for SO2 Overall Mine Area Source 0.001266956 g/s
Estimated Emission Rate for NOx Overall Mine Area Source 0.000078426 g/s
EMISSION ESTIMATION FOR QUARRY “P3”
Estimated Emission Rate for PM10
Activity Source type Value Unit
Drilling Point Source 0.090884217 g/s
Blasting Point Source 0.001499881 g/s
Mineral Loading Point Source 0.043211139 g/s
Haul Road Line Source 0.00249403 g/s/m
Overall Mine Area Source 0.061352927 g/s
Estimated Emission Rate for SO2 Overall Mine Area Source 0.000830834 g/s
Estimated Emission Rate for NOx Overall Mine Area Source 0.000053904 g/s
EMISSION ESTIMATION FOR QUARRY “P4”
Estimated Emission Rate for PM10
Activity Source type Value Unit
Drilling Point Source 0.053405732 g/s
Blasting Point Source 0.000105088 g/s
Mineral Loading Point Source 0.036645303 g/s
Haul Road Line Source 0.002484443 g/s/m
Overall Mine Area Source 0.044762979 g/s
Estimated Emission Rate for SO2 Overall Mine Area Source 0.000149582 g/s
Estimated Emission Rate for NOx Overall Mine Area Source 0.000005062 g/s
EMISSION ESTIMATION FOR QUARRY “E1
Estimated Emission Rate for PM10
Activity Source type Value Unit
Drilling Point Source 0.102971978 g/s
Blasting Point Source 0.002800333 g/s
Mineral Loading Point Source 0.044931683 g/s
Haul Road Line Source 0.0024997 g/s/m
Overall Mine Area Source 0.067221098 g/s
Estimated Emission Rate for SO2 Overall Mine Area Source 0.001237654 g/s
Estimated Emission Rate for NOx Overall Mine Area Source 0.000095341 g/s
EMISSION ESTIMATION FOR QUARRY “E2”
Estimated Emission Rate for PM10
Activity Source type Value Unit
Drilling Point Source 0.055910331 g/s
Blasting Point Source 0.000132152 g/s
Mineral Loading Point Source 0.037118786 g/s
Haul Road Line Source 0.002484756 g/s/m
Overall Mine Area Source 0.051294525 g/s
Estimated Emission Rate for SO2 Overall Mine Area Source 0.000176457 g/s
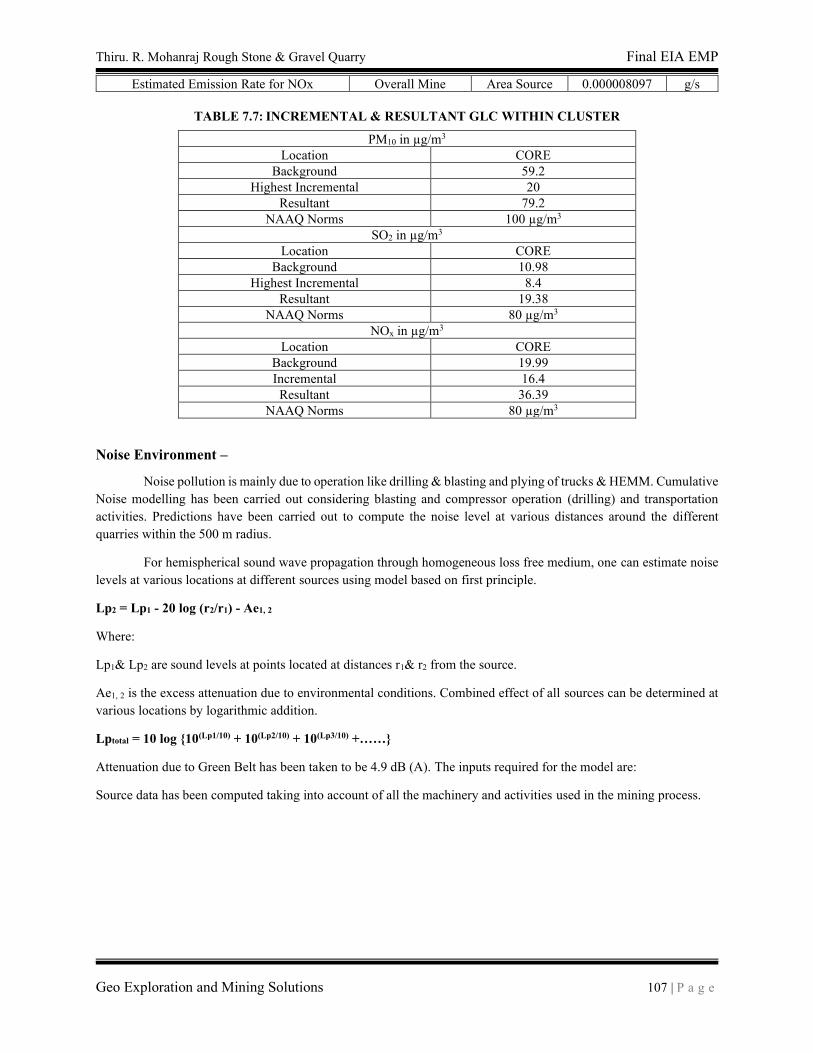
Thiru. R. Mohanraj Rough Stone & Gravel Quarry Final EIA EMP
Geo Exploration and Mining Solutions 107 | P a g e
Estimated Emission Rate for NOx Overall Mine Area Source 0.000008097 g/s
TABLE 7.7: INCREMENTAL & RESULTANT GLC WITHIN CLUSTER
PM10 in µg/m3
Location CORE
Background 59.2
Highest Incremental 20
Resultant 79.2
NAAQ Norms 100 µg/m3
SO2 in µg/m3
Location CORE
Background 10.98
Highest Incremental 8.4
Resultant 19.38
NAAQ Norms 80 µg/m3
NOx in µg/m3
Location CORE
Background 19.99
Incremental 16.4
Resultant 36.39
NAAQ Norms 80 µg/m3
Noise Environment –
Noise pollution is mainly due to operation like drilling & blasting and plying of trucks & HEMM. Cumulative
Noise modelling has been carried out considering blasting and compressor operation (drilling) and transportation
activities. Predictions have been carried out to compute the noise level at various distances around the different
quarries within the 500 m radius.
For hemispherical sound wave propagation through homogeneous loss free medium, one can estimate noise
levels at various locations at different sources using model based on first principle.
Lp2 = Lp1 - 20 log (r2/r1) - Ae1, 2
Where:
Lp1& Lp2 are sound levels at points located at distances r1& r2 from the source.
Ae1, 2 is the excess attenuation due to environmental conditions. Combined effect of all sources can be determined at
various locations by logarithmic addition.
Lptotal = 10 log {10(Lp1/10) + 10(Lp2/10) + 10(Lp3/10) +……}
Attenuation due to Green Belt has been taken to be 4.9 dB (A). The inputs required for the model are:
Source data has been computed taking into account of all the machinery and activities used in the mining process.
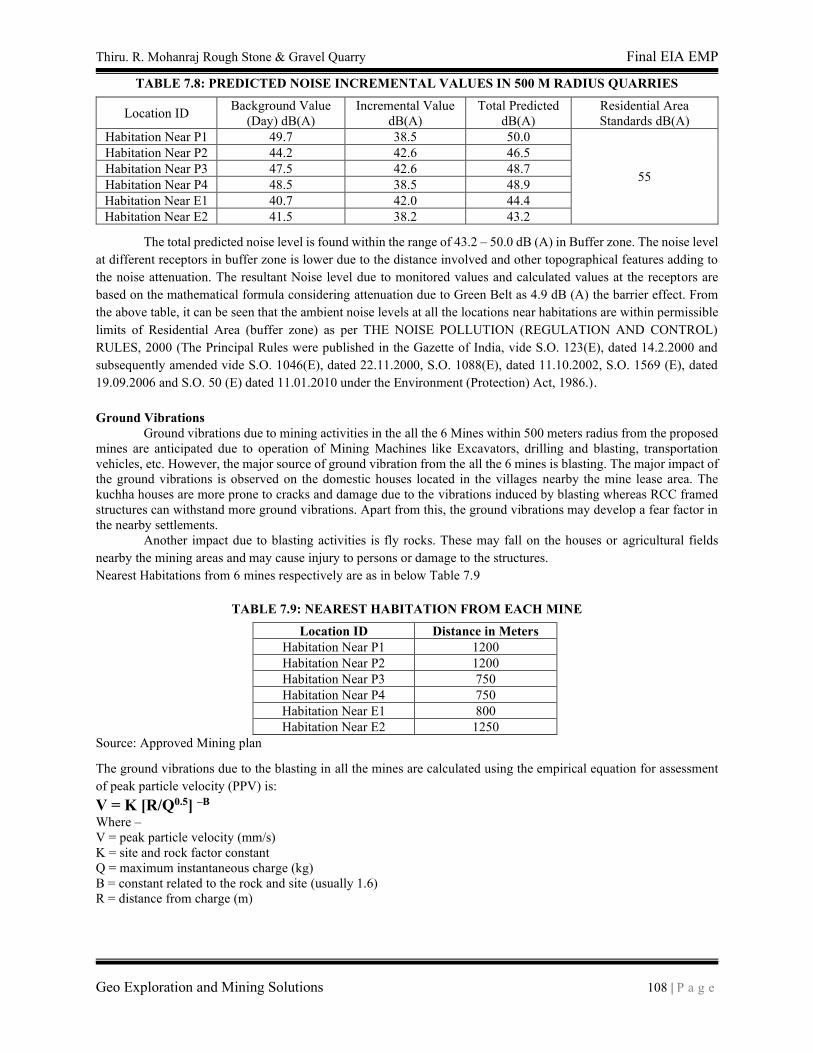
Thiru. R. Mohanraj Rough Stone & Gravel Quarry Final EIA EMP
Geo Exploration and Mining Solutions 108 | P a g e
TABLE 7.8: PREDICTED NOISE INCREMENTAL VALUES IN 500 M RADIUS QUARRIES
Location ID Background Value
(Day) dB(A)
Incremental Value
dB(A)
Total Predicted
dB(A)
Residential Area
Standards dB(A)
Habitation Near P1 49.7 38.5 50.0
55
Habitation Near P2 44.2 42.6 46.5
Habitation Near P3 47.5 42.6 48.7
Habitation Near P4 48.5 38.5 48.9
Habitation Near E1 40.7 42.0 44.4
Habitation Near E2 41.5 38.2 43.2
The total predicted noise level is found within the range of 43.2 – 50.0 dB (A) in Buffer zone. The noise level
at different receptors in buffer zone is lower due to the distance involved and other topographical features adding to
the noise attenuation. The resultant Noise level due to monitored values and calculated values at the receptors are
based on the mathematical formula considering attenuation due to Green Belt as 4.9 dB (A) the barrier effect. From
the above table, it can be seen that the ambient noise levels at all the locations near habitations are within permissible
limits of Residential Area (buffer zone) as per THE NOISE POLLUTION (REGULATION AND CONTROL)
RULES, 2000 (The Principal Rules were published in the Gazette of India, vide S.O. 123(E), dated 14.2.2000 and
subsequently amended vide S.O. 1046(E), dated 22.11.2000, S.O. 1088(E), dated 11.10.2002, S.O. 1569 (E), dated
19.09.2006 and S.O. 50 (E) dated 11.01.2010 under the Environment (Protection) Act, 1986.).
Ground Vibrations
Ground vibrations due to mining activities in the all the 6 Mines within 500 meters radius from the proposed
mines are anticipated due to operation of Mining Machines like Excavators, drilling and blasting, transportation
vehicles, etc. However, the major source of ground vibration from the all the 6 mines is blasting. The major impact of
the ground vibrations is observed on the domestic houses located in the villages nearby the mine lease area. The
kuchha houses are more prone to cracks and damage due to the vibrations induced by blasting whereas RCC framed
structures can withstand more ground vibrations. Apart from this, the ground vibrations may develop a fear factor in
the nearby settlements.
Another impact due to blasting activities is fly rocks. These may fall on the houses or agricultural fields
nearby the mining areas and may cause injury to persons or damage to the structures.
Nearest Habitations from 6 mines respectively are as in below Table 7.9
TABLE 7.9: NEAREST HABITATION FROM EACH MINE
Location ID Distance in Meters
Habitation Near P1 1200
Habitation Near P2 1200
Habitation Near P3 750
Habitation Near P4 750
Habitation Near E1 800
Habitation Near E2 1250
Source: Approved Mining plan
The ground vibrations due to the blasting in all the mines are calculated using the empirical equation for assessment
of peak particle velocity (PPV) is:
V = K [R/Q0.5] –B Where –
V = peak particle velocity (mm/s)
K = site and rock factor constant
Q = maximum instantaneous charge (kg)
B = constant related to the rock and site (usually 1.6)
R = distance from charge (m)
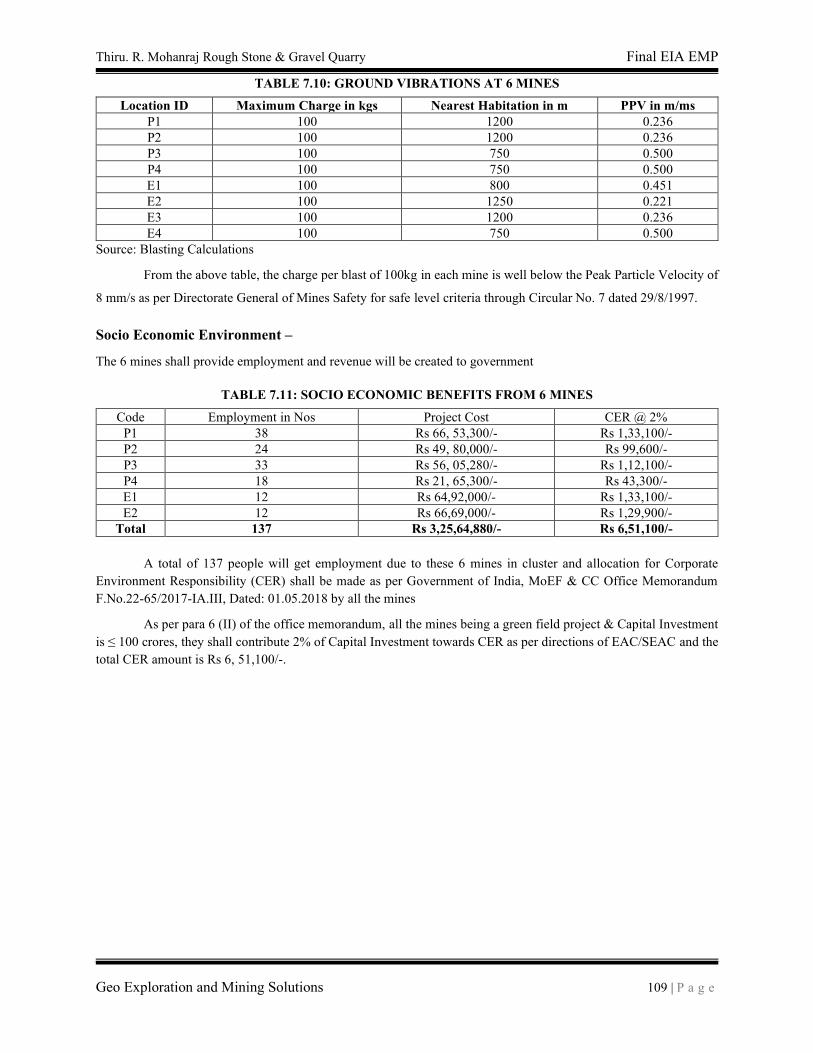
Thiru. R. Mohanraj Rough Stone & Gravel Quarry Final EIA EMP
Geo Exploration and Mining Solutions 109 | P a g e
TABLE 7.10: GROUND VIBRATIONS AT 6 MINES
Location ID Maximum Charge in kgs Nearest Habitation in m PPV in m/ms
P1 100 1200 0.236
P2 100 1200 0.236
P3 100 750 0.500
P4 100 750 0.500
E1 100 800 0.451
E2 100 1250 0.221
E3 100 1200 0.236
E4 100 750 0.500
Source: Blasting Calculations
From the above table, the charge per blast of 100kg in each mine is well below the Peak Particle Velocity of
8 mm/s as per Directorate General of Mines Safety for safe level criteria through Circular No. 7 dated 29/8/1997.
Socio Economic Environment –
The 6 mines shall provide employment and revenue will be created to government
TABLE 7.11: SOCIO ECONOMIC BENEFITS FROM 6 MINES
Code Employment in Nos Project Cost CER @ 2%
P1 38 Rs 66, 53,300/- Rs 1,33,100/-
P2 24 Rs 49, 80,000/- Rs 99,600/-
P3 33 Rs 56, 05,280/- Rs 1,12,100/-
P4 18 Rs 21, 65,300/- Rs 43,300/-
E1 12 Rs 64,92,000/- Rs 1,33,100/-
E2 12 Rs 66,69,000/- Rs 1,29,900/-
Total 137 Rs 3,25,64,880/- Rs 6,51,100/-
A total of 137 people will get employment due to these 6 mines in cluster and allocation for Corporate
Environment Responsibility (CER) shall be made as per Government of India, MoEF & CC Office Memorandum
F.No.22-65/2017-IA.III, Dated: 01.05.2018 by all the mines
As per para 6 (II) of the office memorandum, all the mines being a green field project & Capital Investment
is ≤ 100 crores, they shall contribute 2% of Capital Investment towards CER as per directions of EAC/SEAC and the
total CER amount is Rs 6, 51,100/-.
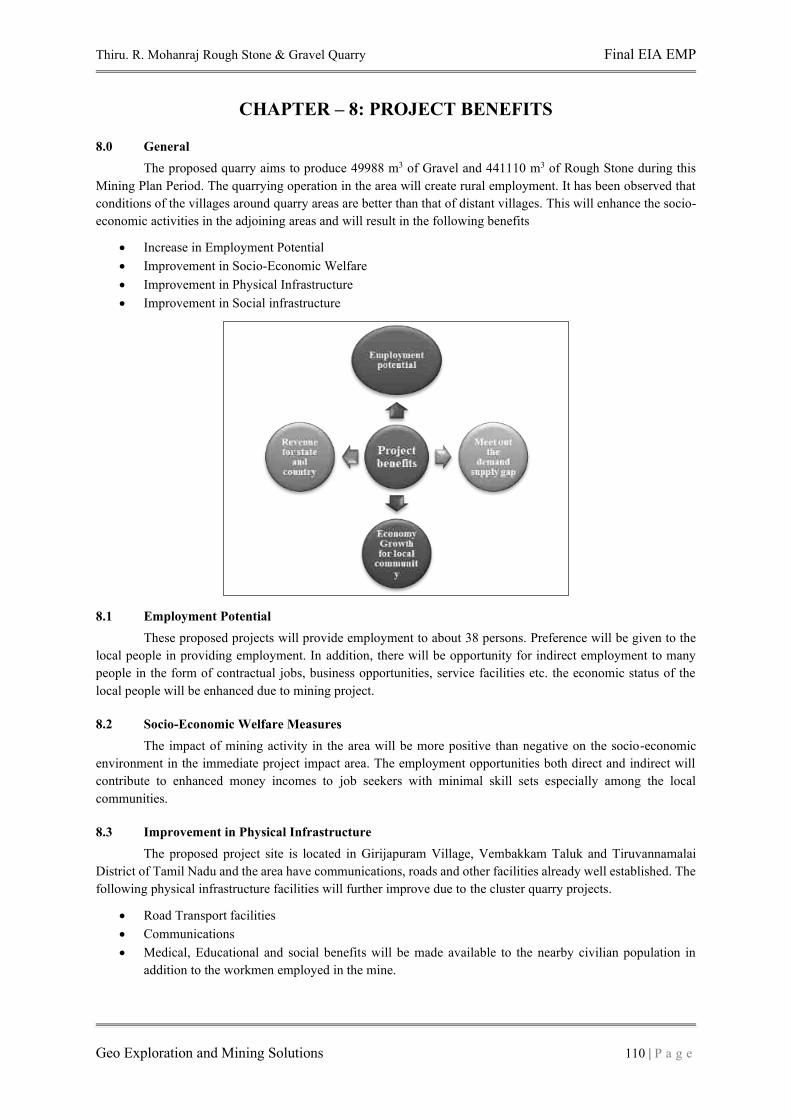
Thiru. R. Mohanraj Rough Stone & Gravel Quarry Final EIA EMP
Geo Exploration and Mining Solutions 110 | P a g e
CHAPTER – 8: PROJECT BENEFITS
8.0 General
The proposed quarry aims to produce 49988 m3 of Gravel and 441110 m3 of Rough Stone during this
Mining Plan Period. The quarrying operation in the area will create rural employment. It has been observed that
conditions of the villages around quarry areas are better than that of distant villages. This will enhance the socio-
economic activities in the adjoining areas and will result in the following benefits
• Increase in Employment Potential
• Improvement in Socio-Economic Welfare
• Improvement in Physical Infrastructure
• Improvement in Social infrastructure
8.1 Employment Potential
These proposed projects will provide employment to about 38 persons. Preference will be given to the
local people in providing employment. In addition, there will be opportunity for indirect employment to many
people in the form of contractual jobs, business opportunities, service facilities etc. the economic status of the
local people will be enhanced due to mining project.
8.2 Socio-Economic Welfare Measures
The impact of mining activity in the area will be more positive than negative on the socio-economic
environment in the immediate project impact area. The employment opportunities both direct and indirect will
contribute to enhanced money incomes to job seekers with minimal skill sets especially among the local
communities.
8.3 Improvement in Physical Infrastructure
The proposed project site is located in Girijapuram Village, Vembakkam Taluk and Tiruvannamalai
District of Tamil Nadu and the area have communications, roads and other facilities already well established. The
following physical infrastructure facilities will further improve due to the cluster quarry projects.
• Road Transport facilities
• Communications
• Medical, Educational and social benefits will be made available to the nearby civilian population in
addition to the workmen employed in the mine.
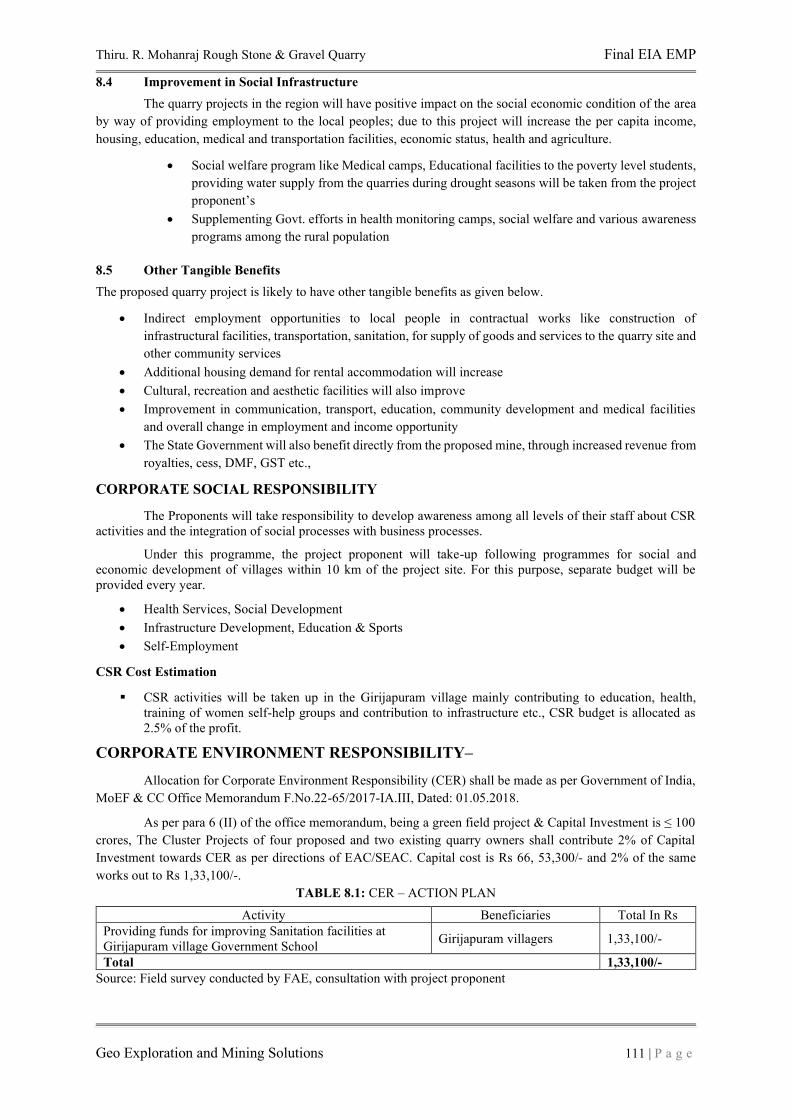
Thiru. R. Mohanraj Rough Stone & Gravel Quarry Final EIA EMP
Geo Exploration and Mining Solutions 111 | P a g e
8.4 Improvement in Social Infrastructure
The quarry projects in the region will have positive impact on the social economic condition of the area
by way of providing employment to the local peoples; due to this project will increase the per capita income,
housing, education, medical and transportation facilities, economic status, health and agriculture.
• Social welfare program like Medical camps, Educational facilities to the poverty level students,
providing water supply from the quarries during drought seasons will be taken from the project
proponent’s
• Supplementing Govt. efforts in health monitoring camps, social welfare and various awareness
programs among the rural population
8.5 Other Tangible Benefits
The proposed quarry project is likely to have other tangible benefits as given below.
• Indirect employment opportunities to local people in contractual works like construction of
infrastructural facilities, transportation, sanitation, for supply of goods and services to the quarry site and
other community services
• Additional housing demand for rental accommodation will increase
• Cultural, recreation and aesthetic facilities will also improve
• Improvement in communication, transport, education, community development and medical facilities
and overall change in employment and income opportunity
• The State Government will also benefit directly from the proposed mine, through increased revenue from
royalties, cess, DMF, GST etc.,
CORPORATE SOCIAL RESPONSIBILITY
The Proponents will take responsibility to develop awareness among all levels of their staff about CSR
activities and the integration of social processes with business processes.
Under this programme, the project proponent will take-up following programmes for social and
economic development of villages within 10 km of the project site. For this purpose, separate budget will be
provided every year.
• Health Services, Social Development
• Infrastructure Development, Education & Sports
• Self-Employment
CSR Cost Estimation
▪ CSR activities will be taken up in the Girijapuram village mainly contributing to education, health,
training of women self-help groups and contribution to infrastructure etc., CSR budget is allocated as
2.5% of the profit.
CORPORATE ENVIRONMENT RESPONSIBILITY–
Allocation for Corporate Environment Responsibility (CER) shall be made as per Government of India,
MoEF & CC Office Memorandum F.No.22-65/2017-IA.III, Dated: 01.05.2018.
As per para 6 (II) of the office memorandum, being a green field project & Capital Investment is ≤ 100 crores, The Cluster Projects of four proposed and two existing quarry owners shall contribute 2% of Capital
Investment towards CER as per directions of EAC/SEAC. Capital cost is Rs 66, 53,300/- and 2% of the same
works out to Rs 1,33,100/-.
TABLE 8.1: CER – ACTION PLAN
Activity Beneficiaries Total In Rs
Providing funds for improving Sanitation facilities at
Girijapuram village Government School Girijapuram villagers 1,33,100/-
Total 1,33,100/-
Source: Field survey conducted by FAE, consultation with project proponent
Thiru. R. Mohanraj Rough Stone & Gravel Quarry Final EIA EMP
Geo Exploration and Mining Solutions 112 | P a g e
CHAPTER – 9: ENVIRONMENTAL COST BENEFIT ANALYSIS
Not Applicable, Since Environmental Cost Benefit Analysis not recommended at the Scoping stage.
Thiru. R. Mohanraj Rough Stone & Gravel Quarry Final EIA EMP
Geo Exploration and Mining Solutions 113 | P a g e
CHAPTER - 10: ENVIRONMENTAL MANAGEMENT PLAN
10.0 General
Environment Management Plan (EMP) aims at the preservation of ecological system by considering in-built
pollution abatement facilities at the proposed site. Good practices of Environmental Management plan will ensure to
keep all the environmental parameters of the project in respect of Ambient Air quality, Water quality, Socio –
economic improvement standards.
Mitigation measures at the source level and an overall environment management plan at the study area are
elicited so as to improve the supportive capacity of the receiving bodies. The EMP presented in this chapter discusses
the administrative aspects of ensuring that mitigative measures are implemented and their effectiveness monitored
after approval of the EIA.
10.1 Environmental Policy
The Project Proponent shall be committed to conducting all its operations and activities in an environmentally
responsible manner and to continually improve environmental performance.
The Proponent will –
• Meet the requirements of all laws, acts, regulations, and standards relevant to its operations and activities
• Implement a program to train employees in general environmental issues and individual workplace
environmental responsibilities
• Allocate necessary resources to ensure the implementation of the environmental policy
• Ensure that an effective closure strategy is in place at all stages of project development and that progressive
reclamation is undertaken as early as possible to reduce potential long-term environmental and community
impacts
• Implement monitoring programmes to provide early warning of any deficiency or unanticipated performance
in environmental safeguards
• Conduct periodic reviews to verify environmental performance and to continuously strive towards
improvement
Description of the Administration and Technical Setup –
The Environment Monitoring Cell discussed under Chapter 6 will ensure effective implementation of
environment management plan and to ensure compliance of environmental statutory guidelines through Mine
Management Level.
The said team will be responsible for:
• Monitoring of the water/ waste water quality, air quality and solid waste generated
• Analysis of the water and air samples collected through external laboratory
• Implementation and monitoring of the pollution control and protective measures/ devices which shall include
financial estimation, ordering, installation of air pollution control equipment, waste water treatment plant,
etc.
• Co-ordination of the environment related activities within the project as well as with outside agencies
• Collection of health statistics of the workers and population of the surrounding villages
• Green belt development
• Monitoring the progress of implementation of the environmental monitoring programme
• Compliance to statutory provisions, norms of State Pollution Control Board, Ministry of Environment and
Forests and the conditions of the environmental clearance as well as the consents to establish and consents
to operate.
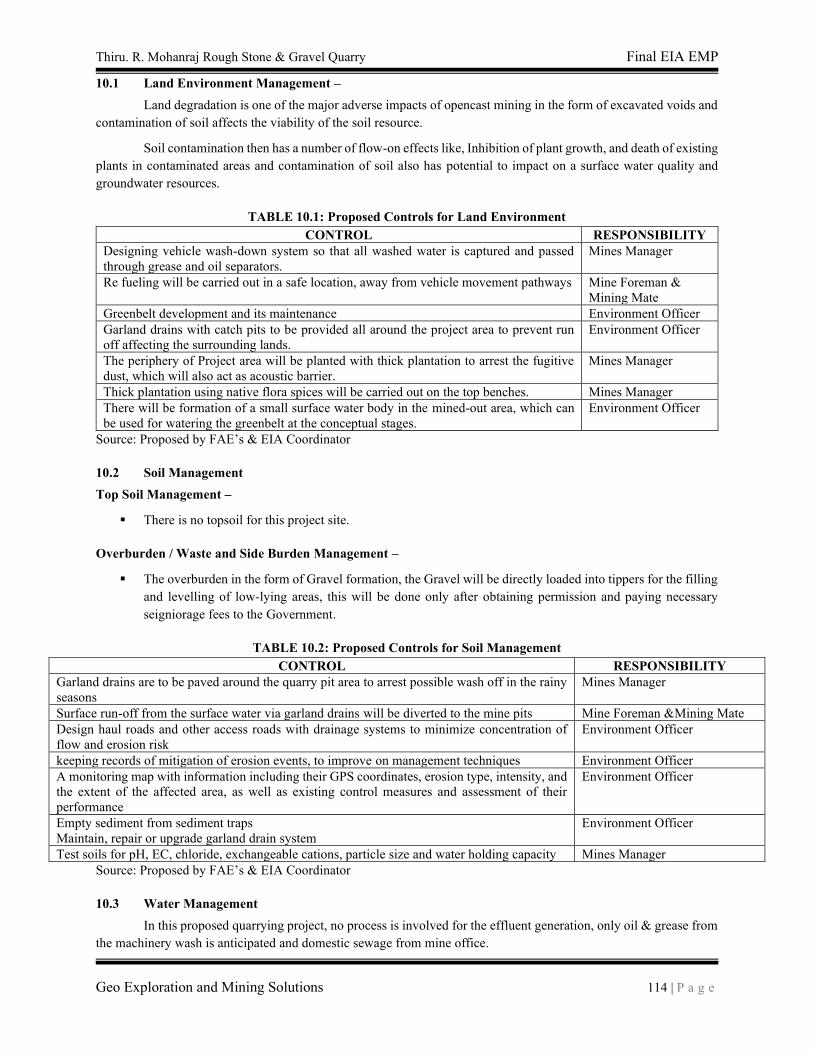
Thiru. R. Mohanraj Rough Stone & Gravel Quarry Final EIA EMP
Geo Exploration and Mining Solutions 114 | P a g e
10.1 Land Environment Management –
Land degradation is one of the major adverse impacts of opencast mining in the form of excavated voids and
contamination of soil affects the viability of the soil resource.
Soil contamination then has a number of flow-on effects like, Inhibition of plant growth, and death of existing
plants in contaminated areas and contamination of soil also has potential to impact on a surface water quality and
groundwater resources.
TABLE 10.1: Proposed Controls for Land Environment
CONTROL RESPONSIBILITY
Designing vehicle wash-down system so that all washed water is captured and passed
through grease and oil separators.
Mines Manager
Re fueling will be carried out in a safe location, away from vehicle movement pathways Mine Foreman &
Mining Mate
Greenbelt development and its maintenance Environment Officer
Garland drains with catch pits to be provided all around the project area to prevent run
off affecting the surrounding lands.
Environment Officer
The periphery of Project area will be planted with thick plantation to arrest the fugitive
dust, which will also act as acoustic barrier.
Mines Manager
Thick plantation using native flora spices will be carried out on the top benches. Mines Manager
There will be formation of a small surface water body in the mined-out area, which can
be used for watering the greenbelt at the conceptual stages.
Environment Officer
Source: Proposed by FAE’s & EIA Coordinator
10.2 Soil Management
Top Soil Management –
▪ There is no topsoil for this project site.
Overburden / Waste and Side Burden Management –
▪ The overburden in the form of Gravel formation, the Gravel will be directly loaded into tippers for the filling
and levelling of low-lying areas, this will be done only after obtaining permission and paying necessary
seigniorage fees to the Government.
TABLE 10.2: Proposed Controls for Soil Management
CONTROL RESPONSIBILITY
Garland drains are to be paved around the quarry pit area to arrest possible wash off in the rainy
seasons
Mines Manager
Surface run-off from the surface water via garland drains will be diverted to the mine pits Mine Foreman &Mining Mate
Design haul roads and other access roads with drainage systems to minimize concentration of
flow and erosion risk
Environment Officer
keeping records of mitigation of erosion events, to improve on management techniques Environment Officer
A monitoring map with information including their GPS coordinates, erosion type, intensity, and
the extent of the affected area, as well as existing control measures and assessment of their
performance
Environment Officer
Empty sediment from sediment traps
Maintain, repair or upgrade garland drain system
Environment Officer
Test soils for pH, EC, chloride, exchangeable cations, particle size and water holding capacity Mines Manager
Source: Proposed by FAE’s & EIA Coordinator
10.3 Water Management
In this proposed quarrying project, no process is involved for the effluent generation, only oil & grease from
the machinery wash is anticipated and domestic sewage from mine office.
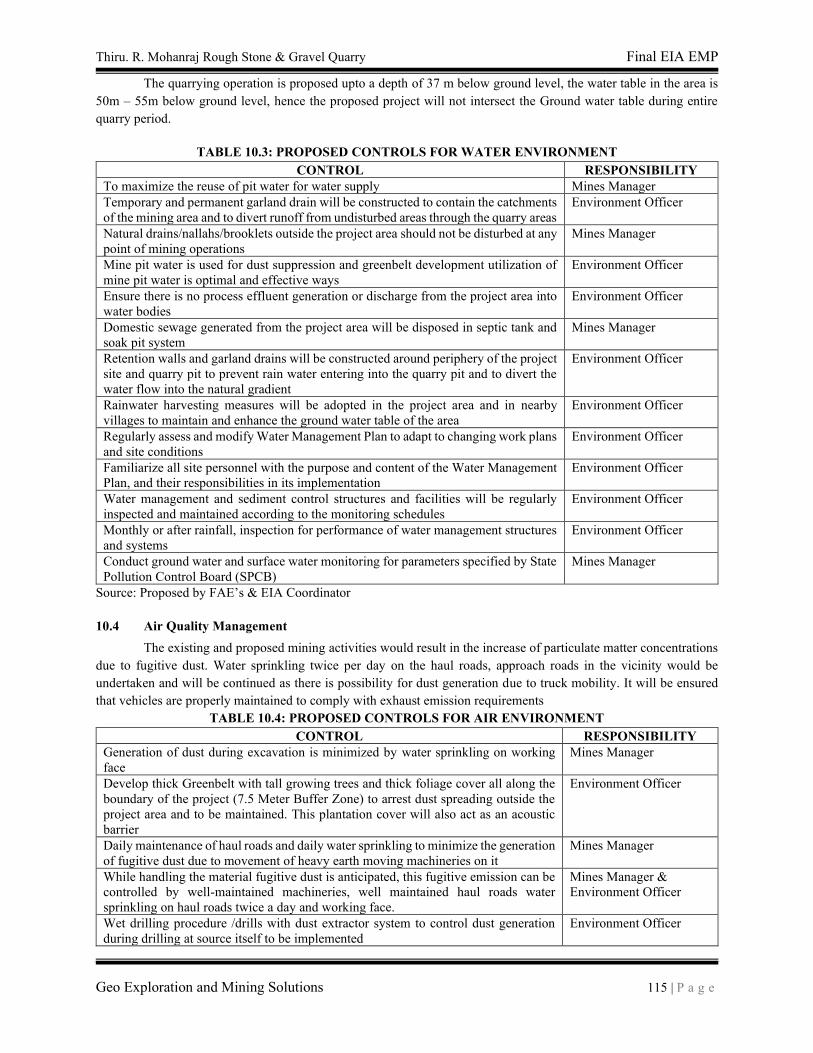
Thiru. R. Mohanraj Rough Stone & Gravel Quarry Final EIA EMP
Geo Exploration and Mining Solutions 115 | P a g e
The quarrying operation is proposed upto a depth of 37 m below ground level, the water table in the area is
50m – 55m below ground level, hence the proposed project will not intersect the Ground water table during entire
quarry period.
TABLE 10.3: PROPOSED CONTROLS FOR WATER ENVIRONMENT
CONTROL RESPONSIBILITY
To maximize the reuse of pit water for water supply Mines Manager
Temporary and permanent garland drain will be constructed to contain the catchments
of the mining area and to divert runoff from undisturbed areas through the quarry areas
Environment Officer
Natural drains/nallahs/brooklets outside the project area should not be disturbed at any
point of mining operations
Mines Manager
Mine pit water is used for dust suppression and greenbelt development utilization of
mine pit water is optimal and effective ways
Environment Officer
Ensure there is no process effluent generation or discharge from the project area into
water bodies
Environment Officer
Domestic sewage generated from the project area will be disposed in septic tank and
soak pit system
Mines Manager
Retention walls and garland drains will be constructed around periphery of the project
site and quarry pit to prevent rain water entering into the quarry pit and to divert the
water flow into the natural gradient
Environment Officer
Rainwater harvesting measures will be adopted in the project area and in nearby
villages to maintain and enhance the ground water table of the area
Environment Officer
Regularly assess and modify Water Management Plan to adapt to changing work plans
and site conditions
Environment Officer
Familiarize all site personnel with the purpose and content of the Water Management
Plan, and their responsibilities in its implementation
Environment Officer
Water management and sediment control structures and facilities will be regularly
inspected and maintained according to the monitoring schedules
Environment Officer
Monthly or after rainfall, inspection for performance of water management structures
and systems
Environment Officer
Conduct ground water and surface water monitoring for parameters specified by State
Pollution Control Board (SPCB)
Mines Manager
Source: Proposed by FAE’s & EIA Coordinator
10.4 Air Quality Management
The existing and proposed mining activities would result in the increase of particulate matter concentrations
due to fugitive dust. Water sprinkling twice per day on the haul roads, approach roads in the vicinity would be
undertaken and will be continued as there is possibility for dust generation due to truck mobility. It will be ensured
that vehicles are properly maintained to comply with exhaust emission requirements
TABLE 10.4: PROPOSED CONTROLS FOR AIR ENVIRONMENT
CONTROL RESPONSIBILITY
Generation of dust during excavation is minimized by water sprinkling on working
face
Mines Manager
Develop thick Greenbelt with tall growing trees and thick foliage cover all along the
boundary of the project (7.5 Meter Buffer Zone) to arrest dust spreading outside the
project area and to be maintained. This plantation cover will also act as an acoustic
barrier
Environment Officer
Daily maintenance of haul roads and daily water sprinkling to minimize the generation
of fugitive dust due to movement of heavy earth moving machineries on it
Mines Manager
While handling the material fugitive dust is anticipated, this fugitive emission can be
controlled by well-maintained machineries, well maintained haul roads water
sprinkling on haul roads twice a day and working face.
Mines Manager &
Environment Officer
Wet drilling procedure /drills with dust extractor system to control dust generation
during drilling at source itself to be implemented
Environment Officer
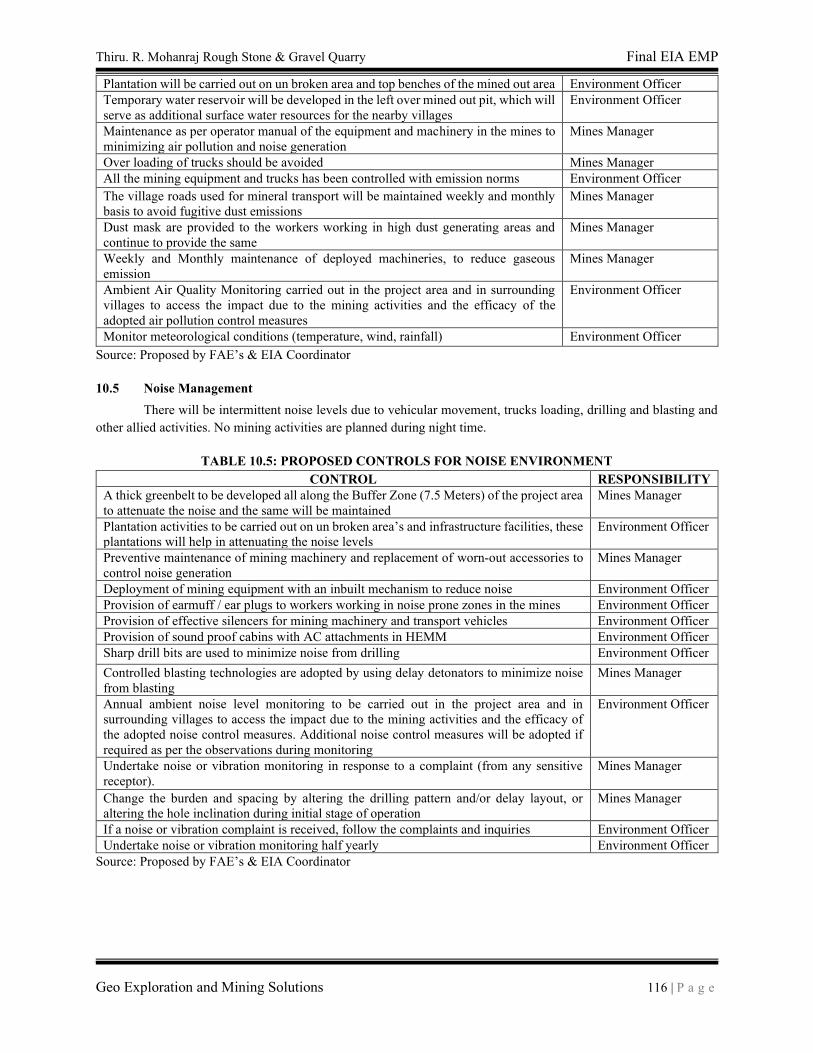
Thiru. R. Mohanraj Rough Stone & Gravel Quarry Final EIA EMP
Geo Exploration and Mining Solutions 116 | P a g e
Plantation will be carried out on un broken area and top benches of the mined out area Environment Officer
Temporary water reservoir will be developed in the left over mined out pit, which will
serve as additional surface water resources for the nearby villages
Environment Officer
Maintenance as per operator manual of the equipment and machinery in the mines to
minimizing air pollution and noise generation
Mines Manager
Over loading of trucks should be avoided Mines Manager
All the mining equipment and trucks has been controlled with emission norms Environment Officer
The village roads used for mineral transport will be maintained weekly and monthly
basis to avoid fugitive dust emissions
Mines Manager
Dust mask are provided to the workers working in high dust generating areas and
continue to provide the same
Mines Manager
Weekly and Monthly maintenance of deployed machineries, to reduce gaseous
emission
Mines Manager
Ambient Air Quality Monitoring carried out in the project area and in surrounding
villages to access the impact due to the mining activities and the efficacy of the
adopted air pollution control measures
Environment Officer
Monitor meteorological conditions (temperature, wind, rainfall) Environment Officer
Source: Proposed by FAE’s & EIA Coordinator
10.5 Noise Management
There will be intermittent noise levels due to vehicular movement, trucks loading, drilling and blasting and
other allied activities. No mining activities are planned during night time.
TABLE 10.5: PROPOSED CONTROLS FOR NOISE ENVIRONMENT
CONTROL RESPONSIBILITY
A thick greenbelt to be developed all along the Buffer Zone (7.5 Meters) of the project area
to attenuate the noise and the same will be maintained
Mines Manager
Plantation activities to be carried out on un broken area’s and infrastructure facilities, these
plantations will help in attenuating the noise levels
Environment Officer
Preventive maintenance of mining machinery and replacement of worn-out accessories to
control noise generation
Mines Manager
Deployment of mining equipment with an inbuilt mechanism to reduce noise Environment Officer
Provision of earmuff / ear plugs to workers working in noise prone zones in the mines Environment Officer
Provision of effective silencers for mining machinery and transport vehicles Environment Officer
Provision of sound proof cabins with AC attachments in HEMM Environment Officer
Sharp drill bits are used to minimize noise from drilling Environment Officer
Controlled blasting technologies are adopted by using delay detonators to minimize noise
from blasting
Mines Manager
Annual ambient noise level monitoring to be carried out in the project area and in
surrounding villages to access the impact due to the mining activities and the efficacy of
the adopted noise control measures. Additional noise control measures will be adopted if
required as per the observations during monitoring
Environment Officer
Undertake noise or vibration monitoring in response to a complaint (from any sensitive
receptor).
Mines Manager
Change the burden and spacing by altering the drilling pattern and/or delay layout, or
altering the hole inclination during initial stage of operation
Mines Manager
If a noise or vibration complaint is received, follow the complaints and inquiries Environment Officer
Undertake noise or vibration monitoring half yearly Environment Officer
Source: Proposed by FAE’s & EIA Coordinator
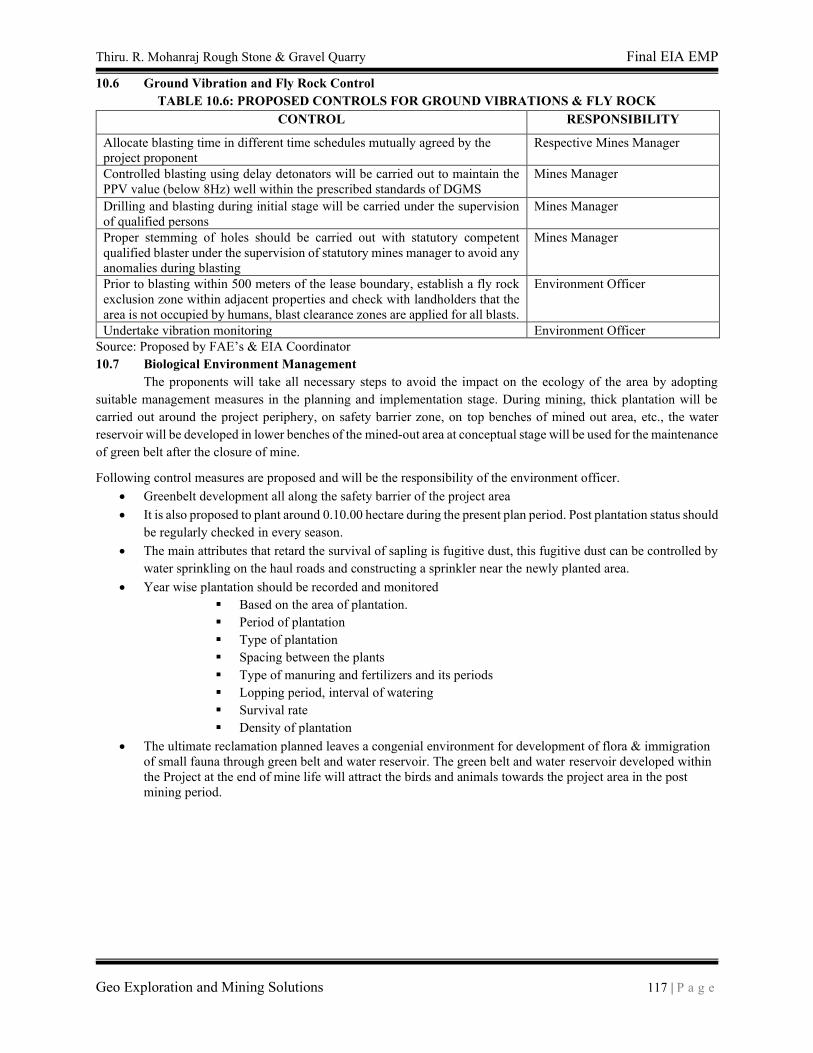
Thiru. R. Mohanraj Rough Stone & Gravel Quarry Final EIA EMP
Geo Exploration and Mining Solutions 117 | P a g e
10.6 Ground Vibration and Fly Rock Control
TABLE 10.6: PROPOSED CONTROLS FOR GROUND VIBRATIONS & FLY ROCK
CONTROL RESPONSIBILITY
Allocate blasting time in different time schedules mutually agreed by the
project proponent
Respective Mines Manager
Controlled blasting using delay detonators will be carried out to maintain the
PPV value (below 8Hz) well within the prescribed standards of DGMS
Mines Manager
Drilling and blasting during initial stage will be carried under the supervision
of qualified persons
Mines Manager
Proper stemming of holes should be carried out with statutory competent
qualified blaster under the supervision of statutory mines manager to avoid any
anomalies during blasting
Mines Manager
Prior to blasting within 500 meters of the lease boundary, establish a fly rock
exclusion zone within adjacent properties and check with landholders that the
area is not occupied by humans, blast clearance zones are applied for all blasts.
Environment Officer
Undertake vibration monitoring Environment Officer
Source: Proposed by FAE’s & EIA Coordinator 10.7 Biological Environment Management
The proponents will take all necessary steps to avoid the impact on the ecology of the area by adopting
suitable management measures in the planning and implementation stage. During mining, thick plantation will be
carried out around the project periphery, on safety barrier zone, on top benches of mined out area, etc., the water
reservoir will be developed in lower benches of the mined-out area at conceptual stage will be used for the maintenance
of green belt after the closure of mine.
Following control measures are proposed and will be the responsibility of the environment officer.
• Greenbelt development all along the safety barrier of the project area
• It is also proposed to plant around 0.10.00 hectare during the present plan period. Post plantation status should
be regularly checked in every season.
• The main attributes that retard the survival of sapling is fugitive dust, this fugitive dust can be controlled by
water sprinkling on the haul roads and constructing a sprinkler near the newly planted area.
• Year wise plantation should be recorded and monitored
▪ Based on the area of plantation.
▪ Period of plantation
▪ Type of plantation
▪ Spacing between the plants
▪ Type of manuring and fertilizers and its periods
▪ Lopping period, interval of watering
▪ Survival rate
▪ Density of plantation
• The ultimate reclamation planned leaves a congenial environment for development of flora & immigration
of small fauna through green belt and water reservoir. The green belt and water reservoir developed within
the Project at the end of mine life will attract the birds and animals towards the project area in the post
mining period.
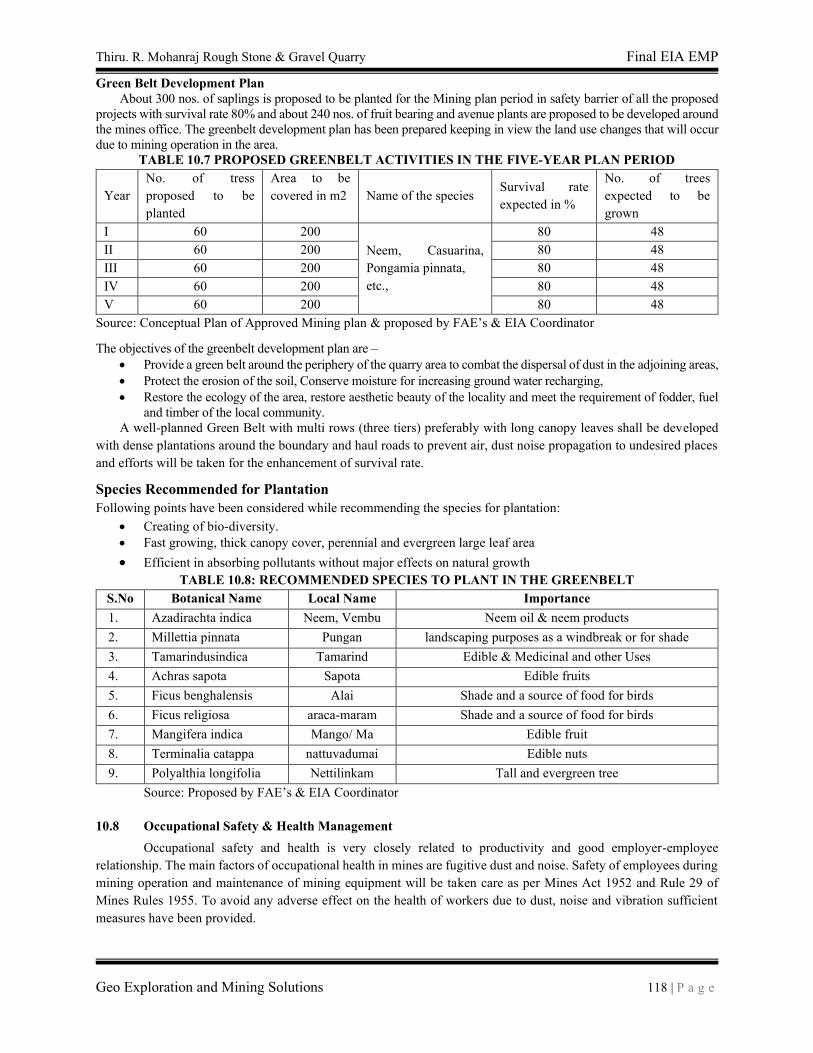
Thiru. R. Mohanraj Rough Stone & Gravel Quarry Final EIA EMP
Geo Exploration and Mining Solutions 118 | P a g e
Green Belt Development Plan
About 300 nos. of saplings is proposed to be planted for the Mining plan period in safety barrier of all the proposed
projects with survival rate 80% and about 240 nos. of fruit bearing and avenue plants are proposed to be developed around
the mines office. The greenbelt development plan has been prepared keeping in view the land use changes that will occur
due to mining operation in the area.
TABLE 10.7 PROPOSED GREENBELT ACTIVITIES IN THE FIVE-YEAR PLAN PERIOD
Year
No. of tress
proposed to be
planted
Area to be
covered in m2 Name of the species Survival rate
expected in %
No. of trees
expected to be
grown
I 60 200
Neem, Casuarina,
Pongamia pinnata,
etc.,
80 48
II 60 200 80 48
III 60 200 80 48
IV 60 200 80 48
V 60 200 80 48
Source: Conceptual Plan of Approved Mining plan & proposed by FAE’s & EIA Coordinator
The objectives of the greenbelt development plan are –
• Provide a green belt around the periphery of the quarry area to combat the dispersal of dust in the adjoining areas,
• Protect the erosion of the soil, Conserve moisture for increasing ground water recharging,
• Restore the ecology of the area, restore aesthetic beauty of the locality and meet the requirement of fodder, fuel
and timber of the local community.
A well-planned Green Belt with multi rows (three tiers) preferably with long canopy leaves shall be developed
with dense plantations around the boundary and haul roads to prevent air, dust noise propagation to undesired places
and efforts will be taken for the enhancement of survival rate.
Species Recommended for Plantation
Following points have been considered while recommending the species for plantation:
• Creating of bio-diversity.
• Fast growing, thick canopy cover, perennial and evergreen large leaf area
• Efficient in absorbing pollutants without major effects on natural growth
TABLE 10.8: RECOMMENDED SPECIES TO PLANT IN THE GREENBELT
S.No Botanical Name Local Name Importance
1. Azadirachta indica Neem, Vembu Neem oil & neem products
2. Millettia pinnata Pungan landscaping purposes as a windbreak or for shade
3. Tamarindusindica Tamarind Edible & Medicinal and other Uses
4. Achras sapota Sapota Edible fruits
5. Ficus benghalensis Alai Shade and a source of food for birds
6. Ficus religiosa araca-maram Shade and a source of food for birds
7. Mangifera indica Mango/ Ma Edible fruit
8. Terminalia catappa nattuvadumai Edible nuts
9. Polyalthia longifolia Nettilinkam Tall and evergreen tree
Source: Proposed by FAE’s & EIA Coordinator
10.8 Occupational Safety & Health Management
Occupational safety and health is very closely related to productivity and good employer-employee
relationship. The main factors of occupational health in mines are fugitive dust and noise. Safety of employees during
mining operation and maintenance of mining equipment will be taken care as per Mines Act 1952 and Rule 29 of
Mines Rules 1955. To avoid any adverse effect on the health of workers due to dust, noise and vibration sufficient
measures have been provided.
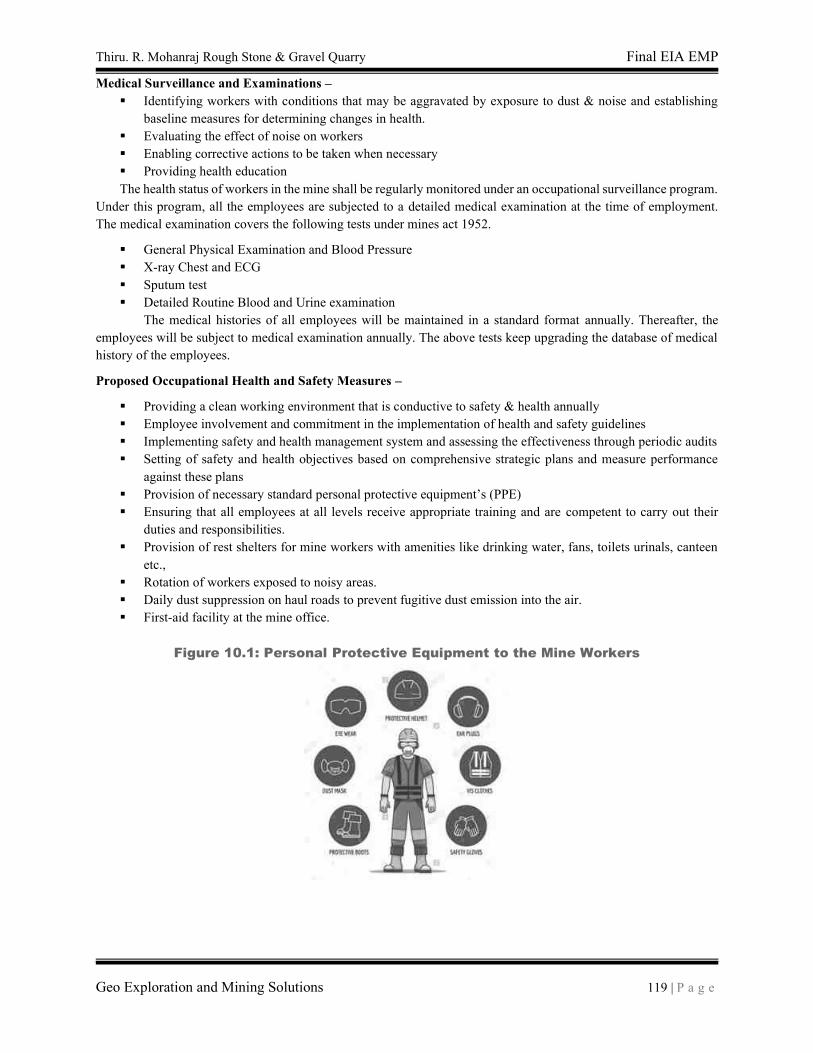
Thiru. R. Mohanraj Rough Stone & Gravel Quarry Final EIA EMP
Geo Exploration and Mining Solutions 119 | P a g e
Medical Surveillance and Examinations –
▪ Identifying workers with conditions that may be aggravated by exposure to dust & noise and establishing
baseline measures for determining changes in health.
▪ Evaluating the effect of noise on workers
▪ Enabling corrective actions to be taken when necessary
▪ Providing health education
The health status of workers in the mine shall be regularly monitored under an occupational surveillance program.
Under this program, all the employees are subjected to a detailed medical examination at the time of employment.
The medical examination covers the following tests under mines act 1952.
▪ General Physical Examination and Blood Pressure
▪ X-ray Chest and ECG
▪ Sputum test
▪ Detailed Routine Blood and Urine examination
The medical histories of all employees will be maintained in a standard format annually. Thereafter, the
employees will be subject to medical examination annually. The above tests keep upgrading the database of medical
history of the employees.
Proposed Occupational Health and Safety Measures –
▪ Providing a clean working environment that is conductive to safety & health annually
▪ Employee involvement and commitment in the implementation of health and safety guidelines
▪ Implementing safety and health management system and assessing the effectiveness through periodic audits
▪ Setting of safety and health objectives based on comprehensive strategic plans and measure performance
against these plans
▪ Provision of necessary standard personal protective equipment’s (PPE)
▪ Ensuring that all employees at all levels receive appropriate training and are competent to carry out their
duties and responsibilities.
▪ Provision of rest shelters for mine workers with amenities like drinking water, fans, toilets urinals, canteen
etc.,
▪ Rotation of workers exposed to noisy areas.
▪ Daily dust suppression on haul roads to prevent fugitive dust emission into the air.
▪ First-aid facility at the mine office.
Figure 10.1: Personal Protective Equipment to the Mine Workers
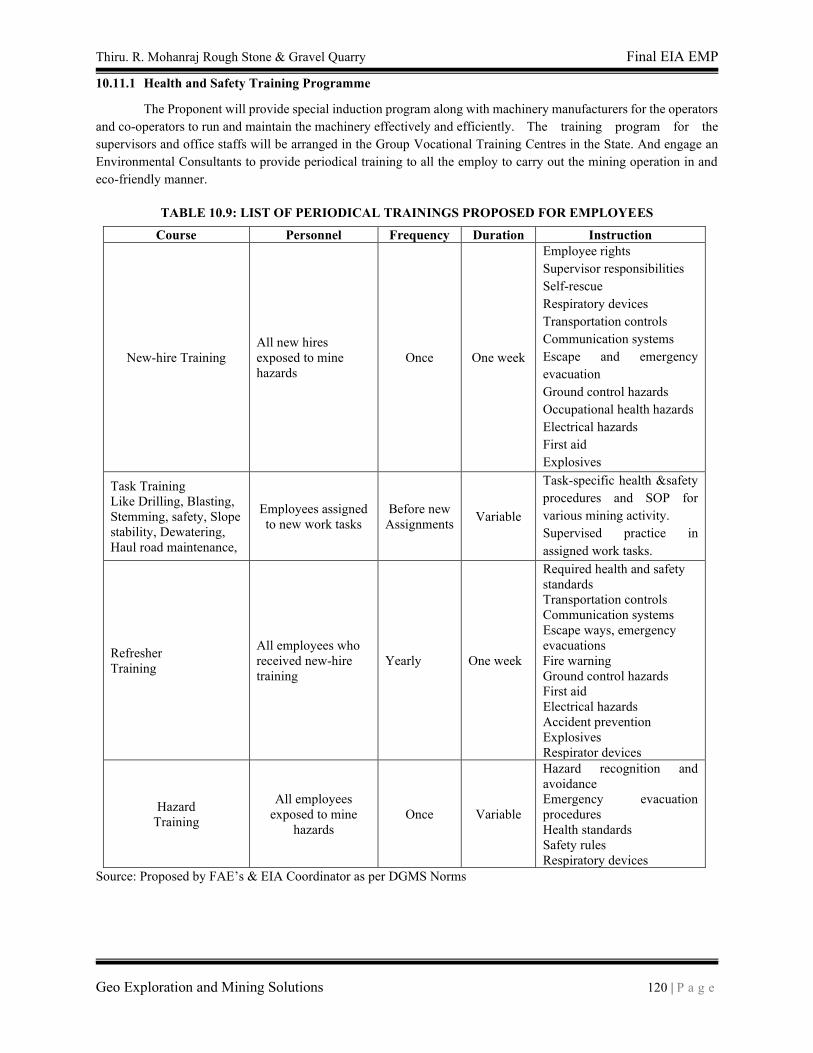
Thiru. R. Mohanraj Rough Stone & Gravel Quarry Final EIA EMP
Geo Exploration and Mining Solutions 120 | P a g e
10.11.1 Health and Safety Training Programme
The Proponent will provide special induction program along with machinery manufacturers for the operators
and co-operators to run and maintain the machinery effectively and efficiently. The training program for the
supervisors and office staffs will be arranged in the Group Vocational Training Centres in the State. And engage an
Environmental Consultants to provide periodical training to all the employ to carry out the mining operation in and
eco-friendly manner.
TABLE 10.9: LIST OF PERIODICAL TRAININGS PROPOSED FOR EMPLOYEES
Course Personnel Frequency Duration Instruction
New-hire Training
All new hires
exposed to mine
hazards
Once One week
Employee rights
Supervisor responsibilities
Self-rescue
Respiratory devices
Transportation controls
Communication systems
Escape and emergency
evacuation
Ground control hazards
Occupational health hazards
Electrical hazards
First aid
Explosives
Task Training
Like Drilling, Blasting,
Stemming, safety, Slope
stability, Dewatering,
Haul road maintenance,
Employees assigned
to new work tasks
Before new
Assignments Variable
Task-specific health &safety
procedures and SOP for
various mining activity.
Supervised practice in
assigned work tasks.
Refresher
Training
All employees who
received new-hire
training
Yearly One week
Required health and safety
standards
Transportation controls
Communication systems
Escape ways, emergency
evacuations
Fire warning
Ground control hazards
First aid
Electrical hazards
Accident prevention
Explosives
Respirator devices
Hazard
Training
All employees
exposed to mine
hazards
Once Variable
Hazard recognition and
avoidance
Emergency evacuation
procedures
Health standards
Safety rules
Respiratory devices
Source: Proposed by FAE’s & EIA Coordinator as per DGMS Norms
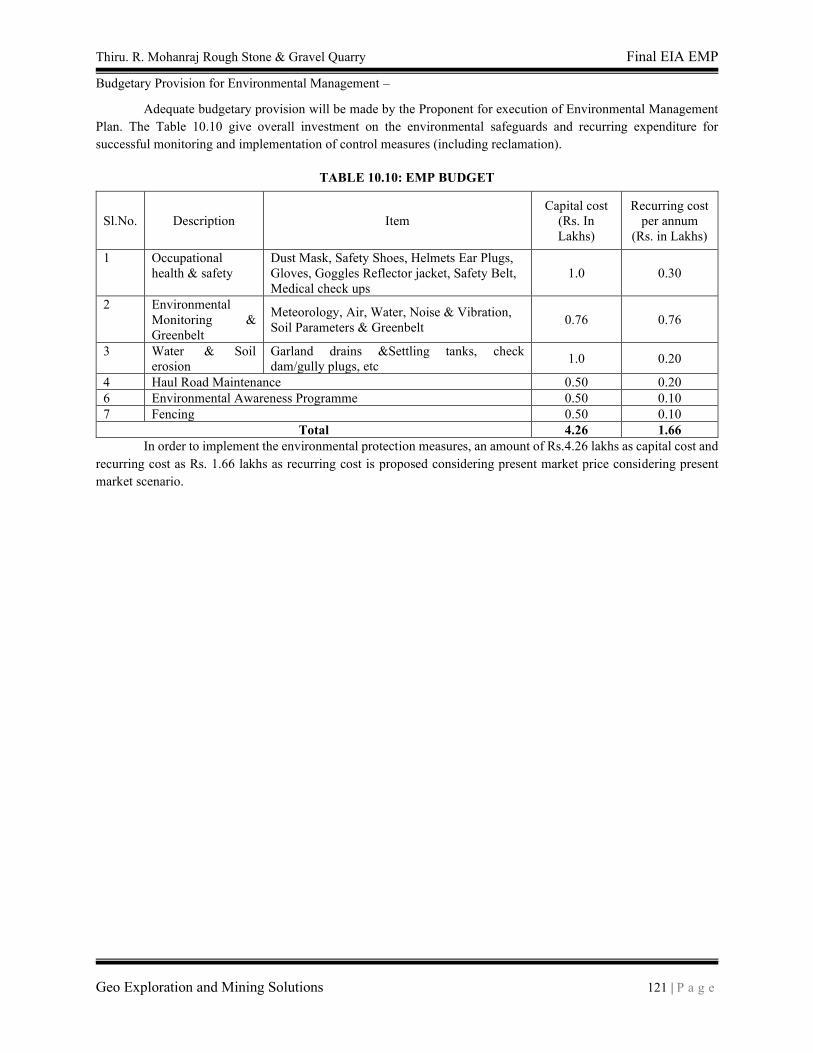
Thiru. R. Mohanraj Rough Stone & Gravel Quarry Final EIA EMP
Geo Exploration and Mining Solutions 121 | P a g e
Budgetary Provision for Environmental Management –
Adequate budgetary provision will be made by the Proponent for execution of Environmental Management
Plan. The Table 10.10 give overall investment on the environmental safeguards and recurring expenditure for
successful monitoring and implementation of control measures (including reclamation).
TABLE 10.10: EMP BUDGET
Sl.No. Description Item
Capital cost
(Rs. In
Lakhs)
Recurring cost
per annum
(Rs. in Lakhs)
1 Occupational
health & safety
Dust Mask, Safety Shoes, Helmets Ear Plugs,
Gloves, Goggles Reflector jacket, Safety Belt,
Medical check ups
1.0 0.30
2 Environmental
Monitoring &
Greenbelt
Meteorology, Air, Water, Noise & Vibration,
Soil Parameters & Greenbelt 0.76 0.76
3 Water & Soil
erosion
Garland drains &Settling tanks, check
dam/gully plugs, etc 1.0 0.20
4 Haul Road Maintenance 0.50 0.20
6 Environmental Awareness Programme 0.50 0.10
7 Fencing 0.50 0.10
Total 4.26 1.66
In order to implement the environmental protection measures, an amount of Rs.4.26 lakhs as capital cost and
recurring cost as Rs. 1.66 lakhs as recurring cost is proposed considering present market price considering present
market scenario.
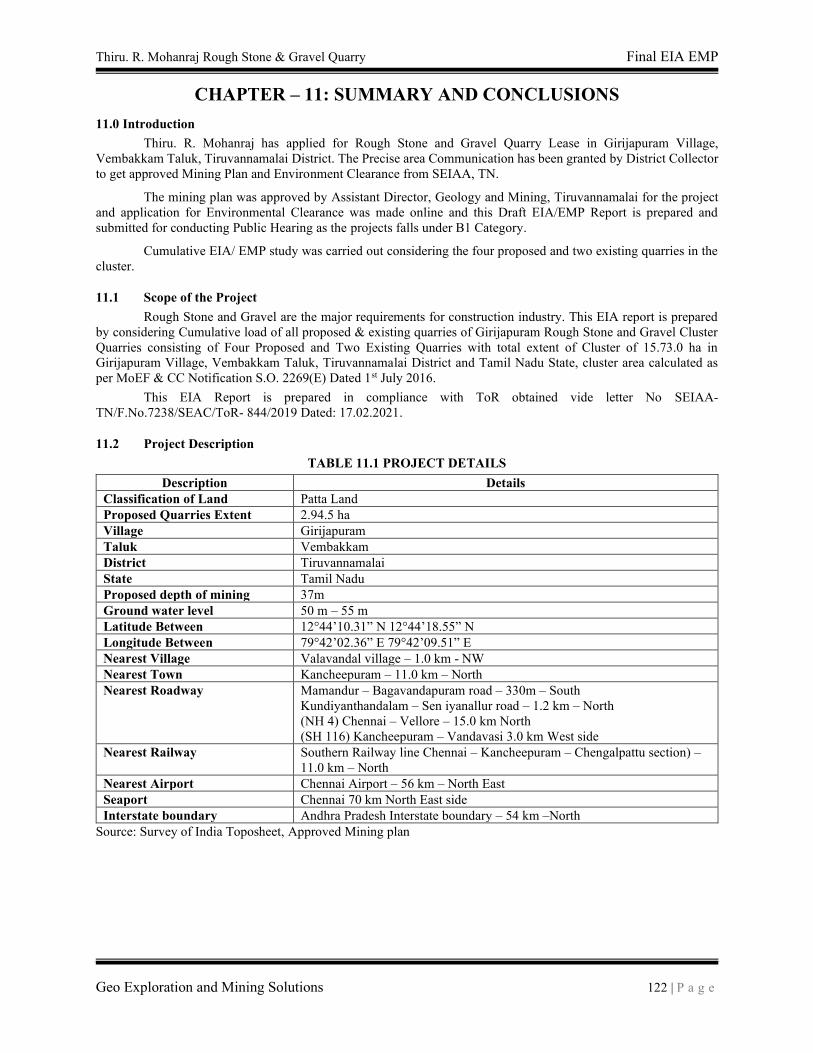
Thiru. R. Mohanraj Rough Stone & Gravel Quarry Final EIA EMP
Geo Exploration and Mining Solutions 122 | P a g e
CHAPTER – 11: SUMMARY AND CONCLUSIONS
11.0 Introduction
Thiru. R. Mohanraj has applied for Rough Stone and Gravel Quarry Lease in Girijapuram Village,
Vembakkam Taluk, Tiruvannamalai District. The Precise area Communication has been granted by District Collector
to get approved Mining Plan and Environment Clearance from SEIAA, TN.
The mining plan was approved by Assistant Director, Geology and Mining, Tiruvannamalai for the project
and application for Environmental Clearance was made online and this Draft EIA/EMP Report is prepared and
submitted for conducting Public Hearing as the projects falls under B1 Category.
Cumulative EIA/ EMP study was carried out considering the four proposed and two existing quarries in the
cluster.
11.1 Scope of the Project
Rough Stone and Gravel are the major requirements for construction industry. This EIA report is prepared
by considering Cumulative load of all proposed & existing quarries of Girijapuram Rough Stone and Gravel Cluster
Quarries consisting of Four Proposed and Two Existing Quarries with total extent of Cluster of 15.73.0 ha in
Girijapuram Village, Vembakkam Taluk, Tiruvannamalai District and Tamil Nadu State, cluster area calculated as
per MoEF & CC Notification S.O. 2269(E) Dated 1st July 2016.
This EIA Report is prepared in compliance with ToR obtained vide letter No SEIAA-
TN/F.No.7238/SEAC/ToR- 844/2019 Dated: 17.02.2021.
11.2 Project Description
TABLE 11.1 PROJECT DETAILS
Description Details
Classification of Land Patta Land
Proposed Quarries Extent 2.94.5 ha
Village Girijapuram
Taluk Vembakkam
District Tiruvannamalai
State Tamil Nadu
Proposed depth of mining 37m
Ground water level 50 m – 55 m
Latitude Between 12°44’10.31” N 12°44’18.55” N
Longitude Between 79°42’02.36” E 79°42’09.51” E
Nearest Village Valavandal village – 1.0 km - NW
Nearest Town Kancheepuram – 11.0 km – North
Nearest Roadway Mamandur – Bagavandapuram road – 330m – South
Kundiyanthandalam – Sen iyanallur road – 1.2 km – North
(NH 4) Chennai – Vellore – 15.0 km North
(SH 116) Kancheepuram – Vandavasi 3.0 km West side
Nearest Railway Southern Railway line Chennai – Kancheepuram – Chengalpattu section) –
11.0 km – North
Nearest Airport Chennai Airport – 56 km – North East
Seaport Chennai 70 km North East side
Interstate boundary Andhra Pradesh Interstate boundary – 54 km –North
Source: Survey of India Toposheet, Approved Mining plan
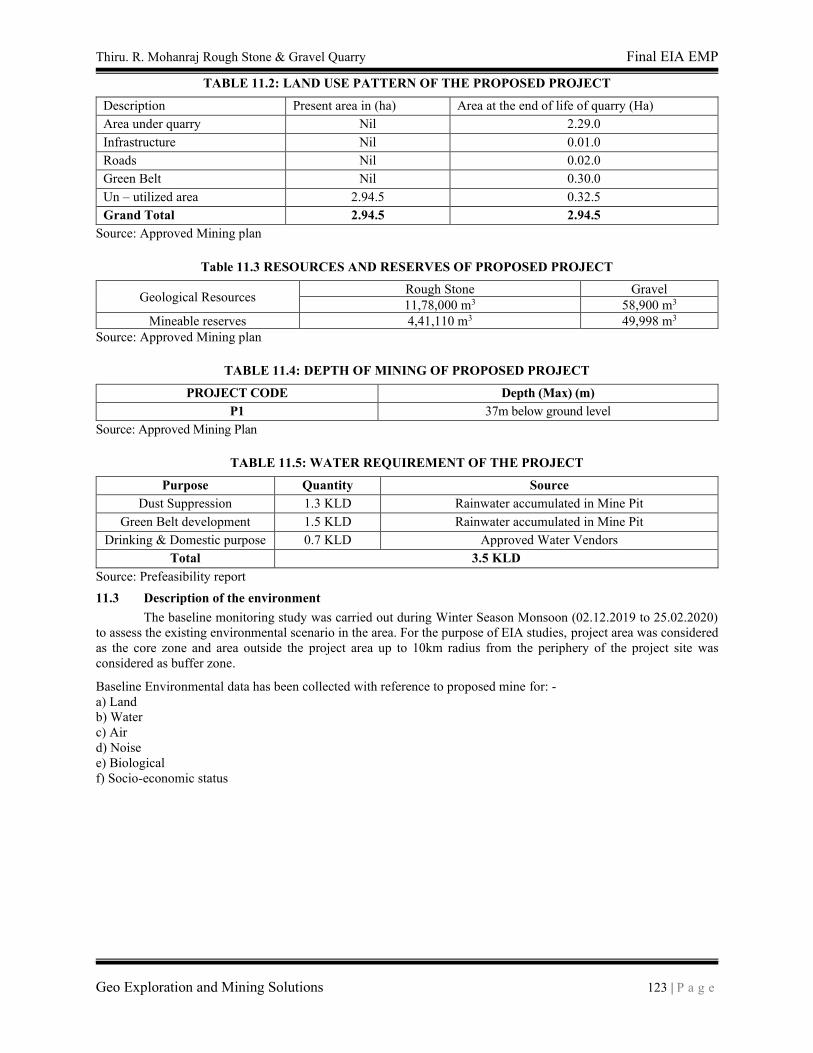
Thiru. R. Mohanraj Rough Stone & Gravel Quarry Final EIA EMP
Geo Exploration and Mining Solutions 123 | P a g e
TABLE 11.2: LAND USE PATTERN OF THE PROPOSED PROJECT
Description Present area in (ha) Area at the end of life of quarry (Ha)
Area under quarry Nil 2.29.0
Infrastructure Nil 0.01.0
Roads Nil 0.02.0
Green Belt Nil 0.30.0
Un – utilized area 2.94.5 0.32.5
Grand Total 2.94.5 2.94.5
Source: Approved Mining plan
Table 11.3 RESOURCES AND RESERVES OF PROPOSED PROJECT
Geological Resources Rough Stone Gravel
11,78,000 m3 58,900 m3
Mineable reserves 4,41,110 m3 49,998 m3
Source: Approved Mining plan
TABLE 11.4: DEPTH OF MINING OF PROPOSED PROJECT
PROJECT CODE Depth (Max) (m)
P1 37m below ground level
Source: Approved Mining Plan
TABLE 11.5: WATER REQUIREMENT OF THE PROJECT
Purpose Quantity Source
Dust Suppression 1.3 KLD Rainwater accumulated in Mine Pit
Green Belt development 1.5 KLD Rainwater accumulated in Mine Pit
Drinking & Domestic purpose 0.7 KLD Approved Water Vendors
Total 3.5 KLD
Source: Prefeasibility report
11.3 Description of the environment
The baseline monitoring study was carried out during Winter Season Monsoon (02.12.2019 to 25.02.2020)
to assess the existing environmental scenario in the area. For the purpose of EIA studies, project area was considered
as the core zone and area outside the project area up to 10km radius from the periphery of the project site was
considered as buffer zone.
Baseline Environmental data has been collected with reference to proposed mine for: -
a) Land
b) Water
c) Air
d) Noise
e) Biological
f) Socio-economic status
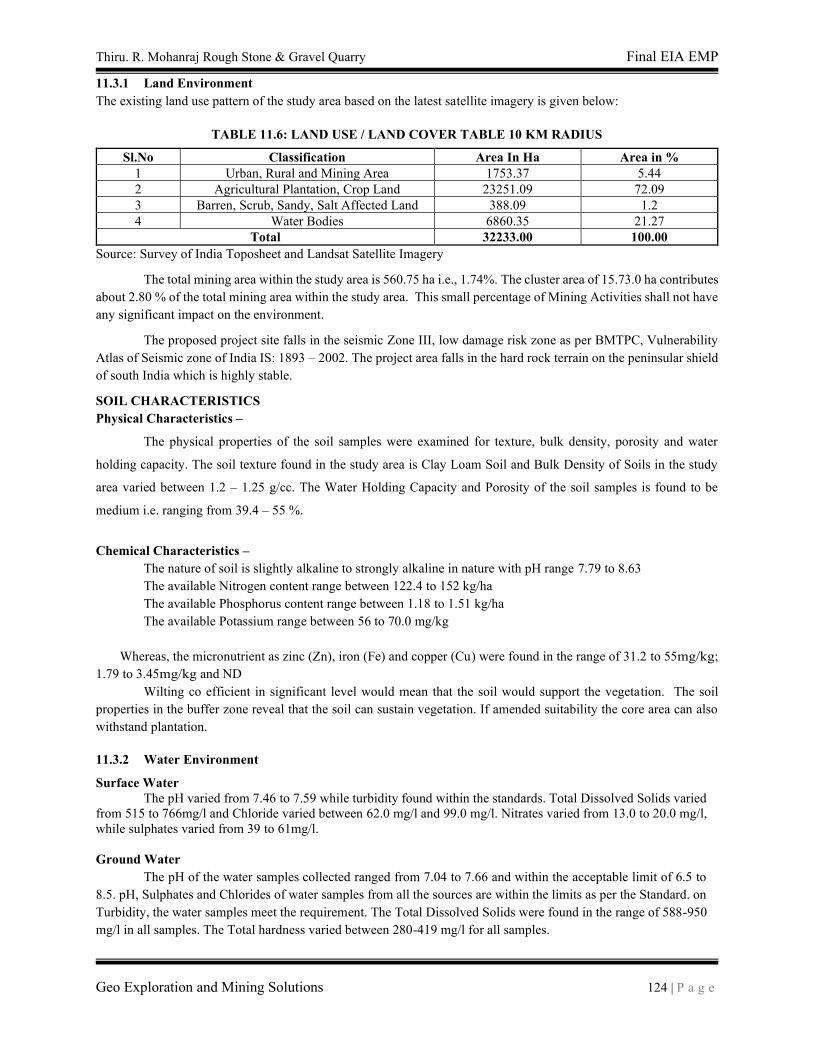
Thiru. R. Mohanraj Rough Stone & Gravel Quarry Final EIA EMP
Geo Exploration and Mining Solutions 124 | P a g e
11.3.1 Land Environment
The existing land use pattern of the study area based on the latest satellite imagery is given below:
TABLE 11.6: LAND USE / LAND COVER TABLE 10 KM RADIUS
Sl.No Classification Area In Ha Area in %
1 Urban, Rural and Mining Area 1753.37 5.44
2 Agricultural Plantation, Crop Land 23251.09 72.09
3 Barren, Scrub, Sandy, Salt Affected Land 388.09 1.2
4 Water Bodies 6860.35 21.27
Total 32233.00 100.00
Source: Survey of India Toposheet and Landsat Satellite Imagery
The total mining area within the study area is 560.75 ha i.e., 1.74%. The cluster area of 15.73.0 ha contributes
about 2.80 % of the total mining area within the study area. This small percentage of Mining Activities shall not have
any significant impact on the environment.
The proposed project site falls in the seismic Zone III, low damage risk zone as per BMTPC, Vulnerability
Atlas of Seismic zone of India IS: 1893 – 2002. The project area falls in the hard rock terrain on the peninsular shield
of south India which is highly stable.
SOIL CHARACTERISTICS
Physical Characteristics –
The physical properties of the soil samples were examined for texture, bulk density, porosity and water
holding capacity. The soil texture found in the study area is Clay Loam Soil and Bulk Density of Soils in the study
area varied between 1.2 – 1.25 g/cc. The Water Holding Capacity and Porosity of the soil samples is found to be
medium i.e. ranging from 39.4 – 55 %.
Chemical Characteristics –
The nature of soil is slightly alkaline to strongly alkaline in nature with pH range 7.79 to 8.63
The available Nitrogen content range between 122.4 to 152 kg/ha
The available Phosphorus content range between 1.18 to 1.51 kg/ha
The available Potassium range between 56 to 70.0 mg/kg
Whereas, the micronutrient as zinc (Zn), iron (Fe) and copper (Cu) were found in the range of 31.2 to 55mg/kg;
1.79 to 3.45mg/kg and ND
Wilting co efficient in significant level would mean that the soil would support the vegetation. The soil
properties in the buffer zone reveal that the soil can sustain vegetation. If amended suitability the core area can also
withstand plantation.
11.3.2 Water Environment
Surface Water
The pH varied from 7.46 to 7.59 while turbidity found within the standards. Total Dissolved Solids varied
from 515 to 766mg/l and Chloride varied between 62.0 mg/l and 99.0 mg/l. Nitrates varied from 13.0 to 20.0 mg/l,
while sulphates varied from 39 to 61mg/l.
Ground Water
The pH of the water samples collected ranged from 7.04 to 7.66 and within the acceptable limit of 6.5 to
8.5. pH, Sulphates and Chlorides of water samples from all the sources are within the limits as per the Standard. on
Turbidity, the water samples meet the requirement. The Total Dissolved Solids were found in the range of 588-950
mg/l in all samples. The Total hardness varied between 280-419 mg/l for all samples.
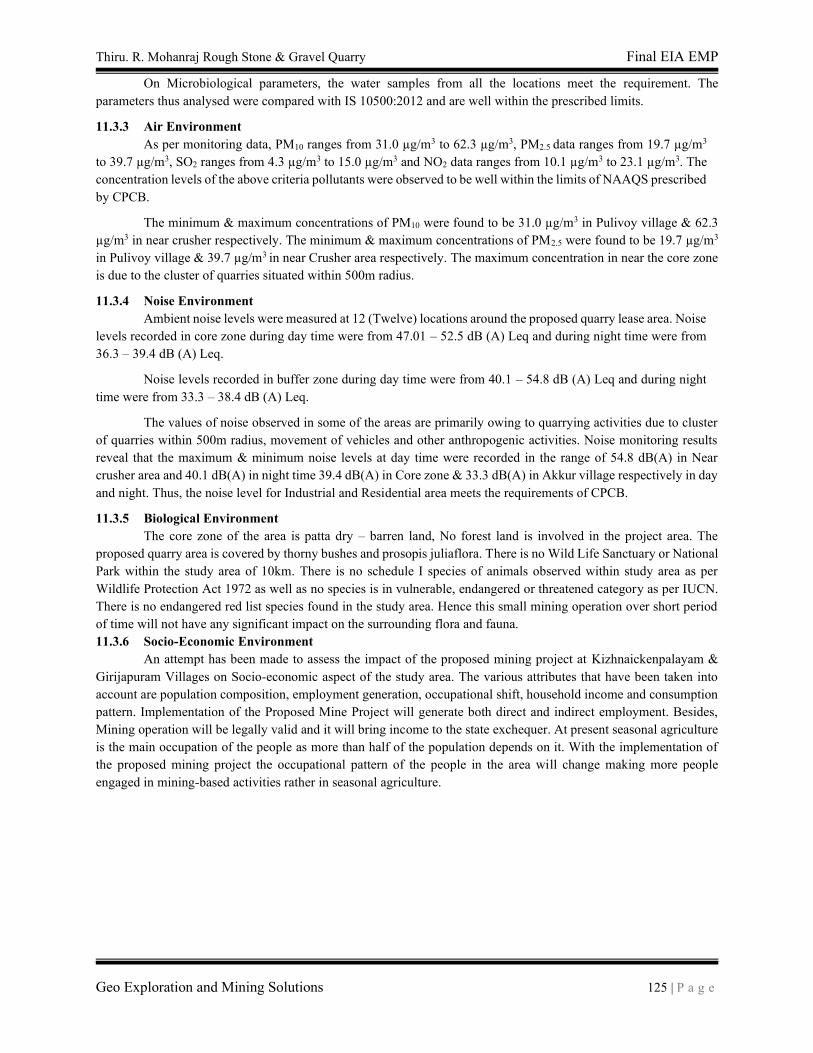
Thiru. R. Mohanraj Rough Stone & Gravel Quarry Final EIA EMP
Geo Exploration and Mining Solutions 125 | P a g e
On Microbiological parameters, the water samples from all the locations meet the requirement. The
parameters thus analysed were compared with IS 10500:2012 and are well within the prescribed limits.
11.3.3 Air Environment
As per monitoring data, PM10 ranges from 31.0 µg/m3 to 62.3 µg/m3, PM2.5 data ranges from 19.7 µg/m3
to 39.7 µg/m3, SO2 ranges from 4.3 µg/m3 to 15.0 µg/m3 and NO2 data ranges from 10.1 µg/m3 to 23.1 µg/m3. The
concentration levels of the above criteria pollutants were observed to be well within the limits of NAAQS prescribed
by CPCB.
The minimum & maximum concentrations of PM10 were found to be 31.0 µg/m3 in Pulivoy village & 62.3
µg/m3 in near crusher respectively. The minimum & maximum concentrations of PM2.5 were found to be 19.7 µg/m3
in Pulivoy village & 39.7 µg/m3 in near Crusher area respectively. The maximum concentration in near the core zone
is due to the cluster of quarries situated within 500m radius.
11.3.4 Noise Environment
Ambient noise levels were measured at 12 (Twelve) locations around the proposed quarry lease area. Noise
levels recorded in core zone during day time were from 47.01 – 52.5 dB (A) Leq and during night time were from
36.3 – 39.4 dB (A) Leq.
Noise levels recorded in buffer zone during day time were from 40.1 – 54.8 dB (A) Leq and during night
time were from 33.3 – 38.4 dB (A) Leq.
The values of noise observed in some of the areas are primarily owing to quarrying activities due to cluster
of quarries within 500m radius, movement of vehicles and other anthropogenic activities. Noise monitoring results
reveal that the maximum & minimum noise levels at day time were recorded in the range of 54.8 dB(A) in Near
crusher area and 40.1 dB(A) in night time 39.4 dB(A) in Core zone & 33.3 dB(A) in Akkur village respectively in day
and night. Thus, the noise level for Industrial and Residential area meets the requirements of CPCB.
11.3.5 Biological Environment
The core zone of the area is patta dry – barren land, No forest land is involved in the project area. The
proposed quarry area is covered by thorny bushes and prosopis juliaflora. There is no Wild Life Sanctuary or National
Park within the study area of 10km. There is no schedule I species of animals observed within study area as per
Wildlife Protection Act 1972 as well as no species is in vulnerable, endangered or threatened category as per IUCN.
There is no endangered red list species found in the study area. Hence this small mining operation over short period
of time will not have any significant impact on the surrounding flora and fauna.
11.3.6 Socio-Economic Environment
An attempt has been made to assess the impact of the proposed mining project at Kizhnaickenpalayam &
Girijapuram Villages on Socio-economic aspect of the study area. The various attributes that have been taken into
account are population composition, employment generation, occupational shift, household income and consumption
pattern. Implementation of the Proposed Mine Project will generate both direct and indirect employment. Besides,
Mining operation will be legally valid and it will bring income to the state exchequer. At present seasonal agriculture
is the main occupation of the people as more than half of the population depends on it. With the implementation of
the proposed mining project the occupational pattern of the people in the area will change making more people
engaged in mining-based activities rather in seasonal agriculture.
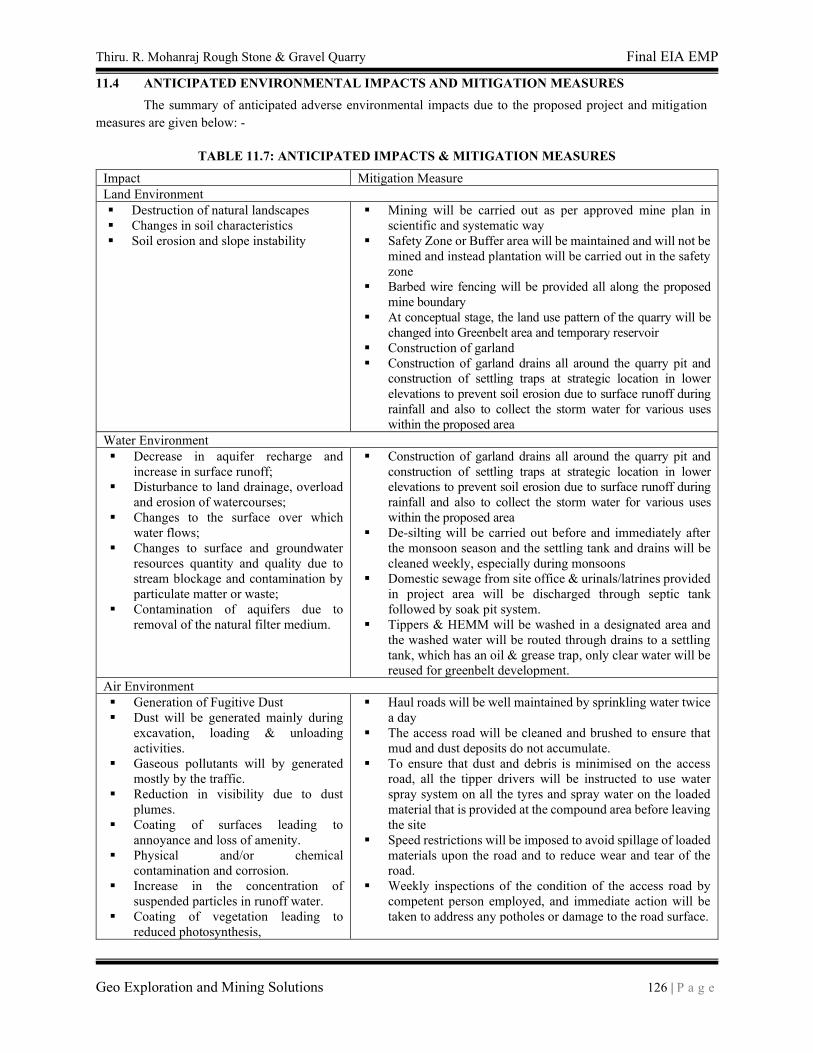
Thiru. R. Mohanraj Rough Stone & Gravel Quarry Final EIA EMP
Geo Exploration and Mining Solutions 126 | P a g e
11.4 ANTICIPATED ENVIRONMENTAL IMPACTS AND MITIGATION MEASURES
The summary of anticipated adverse environmental impacts due to the proposed project and mitigation
measures are given below: -
TABLE 11.7: ANTICIPATED IMPACTS & MITIGATION MEASURES
Impact Mitigation Measure
Land Environment
▪ Destruction of natural landscapes
▪ Changes in soil characteristics
▪ Soil erosion and slope instability
▪ Mining will be carried out as per approved mine plan in
scientific and systematic way
▪ Safety Zone or Buffer area will be maintained and will not be
mined and instead plantation will be carried out in the safety
zone
▪ Barbed wire fencing will be provided all along the proposed
mine boundary
▪ At conceptual stage, the land use pattern of the quarry will be
changed into Greenbelt area and temporary reservoir
▪ Construction of garland
▪ Construction of garland drains all around the quarry pit and
construction of settling traps at strategic location in lower
elevations to prevent soil erosion due to surface runoff during
rainfall and also to collect the storm water for various uses
within the proposed area
Water Environment
▪ Decrease in aquifer recharge and
increase in surface runoff;
▪ Disturbance to land drainage, overload
and erosion of watercourses;
▪ Changes to the surface over which
water flows;
▪ Changes to surface and groundwater
resources quantity and quality due to
stream blockage and contamination by
particulate matter or waste;
▪ Contamination of aquifers due to
removal of the natural filter medium.
▪ Construction of garland drains all around the quarry pit and
construction of settling traps at strategic location in lower
elevations to prevent soil erosion due to surface runoff during
rainfall and also to collect the storm water for various uses
within the proposed area
▪ De-silting will be carried out before and immediately after
the monsoon season and the settling tank and drains will be
cleaned weekly, especially during monsoons
▪ Domestic sewage from site office & urinals/latrines provided
in project area will be discharged through septic tank
followed by soak pit system.
▪ Tippers & HEMM will be washed in a designated area and
the washed water will be routed through drains to a settling
tank, which has an oil & grease trap, only clear water will be
reused for greenbelt development.
Air Environment
▪ Generation of Fugitive Dust
▪ Dust will be generated mainly during
excavation, loading & unloading
activities.
▪ Gaseous pollutants will by generated
mostly by the traffic.
▪ Reduction in visibility due to dust
plumes.
▪ Coating of surfaces leading to
annoyance and loss of amenity.
▪ Physical and/or chemical
contamination and corrosion.
▪ Increase in the concentration of
suspended particles in runoff water.
▪ Coating of vegetation leading to
reduced photosynthesis,
▪ Haul roads will be well maintained by sprinkling water twice
a day
▪ The access road will be cleaned and brushed to ensure that
mud and dust deposits do not accumulate.
▪ To ensure that dust and debris is minimised on the access
road, all the tipper drivers will be instructed to use water
spray system on all the tyres and spray water on the loaded
material that is provided at the compound area before leaving
the site
▪ Speed restrictions will be imposed to avoid spillage of loaded
materials upon the road and to reduce wear and tear of the
road.
▪ Weekly inspections of the condition of the access road by
competent person employed, and immediate action will be
taken to address any potholes or damage to the road surface.
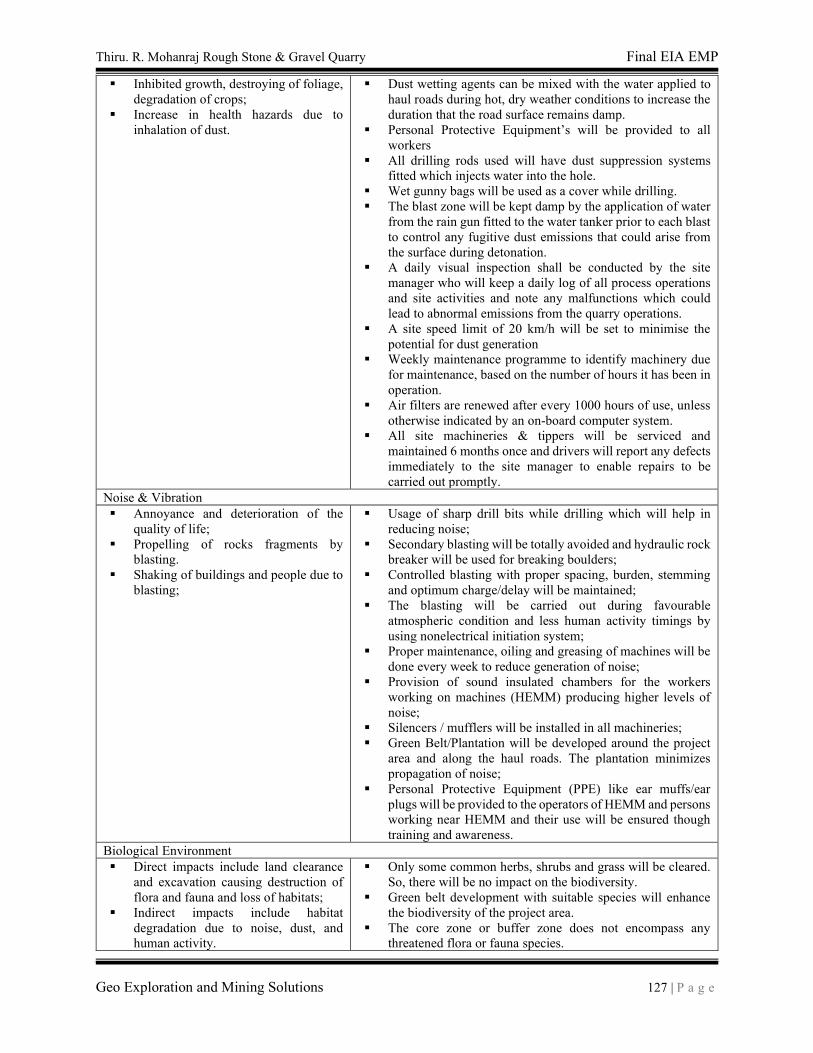
Thiru. R. Mohanraj Rough Stone & Gravel Quarry Final EIA EMP
Geo Exploration and Mining Solutions 127 | P a g e
▪ Inhibited growth, destroying of foliage,
degradation of crops;
▪ Increase in health hazards due to
inhalation of dust.
▪ Dust wetting agents can be mixed with the water applied to
haul roads during hot, dry weather conditions to increase the
duration that the road surface remains damp.
▪ Personal Protective Equipment’s will be provided to all workers
▪ All drilling rods used will have dust suppression systems
fitted which injects water into the hole.
▪ Wet gunny bags will be used as a cover while drilling.
▪ The blast zone will be kept damp by the application of water
from the rain gun fitted to the water tanker prior to each blast
to control any fugitive dust emissions that could arise from
the surface during detonation.
▪ A daily visual inspection shall be conducted by the site
manager who will keep a daily log of all process operations
and site activities and note any malfunctions which could
lead to abnormal emissions from the quarry operations.
▪ A site speed limit of 20 km/h will be set to minimise the
potential for dust generation
▪ Weekly maintenance programme to identify machinery due
for maintenance, based on the number of hours it has been in
operation.
▪ Air filters are renewed after every 1000 hours of use, unless
otherwise indicated by an on-board computer system.
▪ All site machineries & tippers will be serviced and
maintained 6 months once and drivers will report any defects
immediately to the site manager to enable repairs to be
carried out promptly.
Noise & Vibration
▪ Annoyance and deterioration of the
quality of life;
▪ Propelling of rocks fragments by
blasting.
▪ Shaking of buildings and people due to
blasting;
▪ Usage of sharp drill bits while drilling which will help in
reducing noise;
▪ Secondary blasting will be totally avoided and hydraulic rock
breaker will be used for breaking boulders;
▪ Controlled blasting with proper spacing, burden, stemming
and optimum charge/delay will be maintained;
▪ The blasting will be carried out during favourable
atmospheric condition and less human activity timings by
using nonelectrical initiation system;
▪ Proper maintenance, oiling and greasing of machines will be
done every week to reduce generation of noise;
▪ Provision of sound insulated chambers for the workers
working on machines (HEMM) producing higher levels of
noise;
▪ Silencers / mufflers will be installed in all machineries;
▪ Green Belt/Plantation will be developed around the project
area and along the haul roads. The plantation minimizes
propagation of noise;
▪ Personal Protective Equipment (PPE) like ear muffs/ear
plugs will be provided to the operators of HEMM and persons
working near HEMM and their use will be ensured though
training and awareness.
Biological Environment
▪ Direct impacts include land clearance
and excavation causing destruction of
flora and fauna and loss of habitats;
▪ Indirect impacts include habitat
degradation due to noise, dust, and
human activity.
▪ Only some common herbs, shrubs and grass will be cleared.
So, there will be no impact on the biodiversity.
▪ Green belt development with suitable species will enhance
the biodiversity of the project area.
▪ The core zone or buffer zone does not encompass any
threatened flora or fauna species.
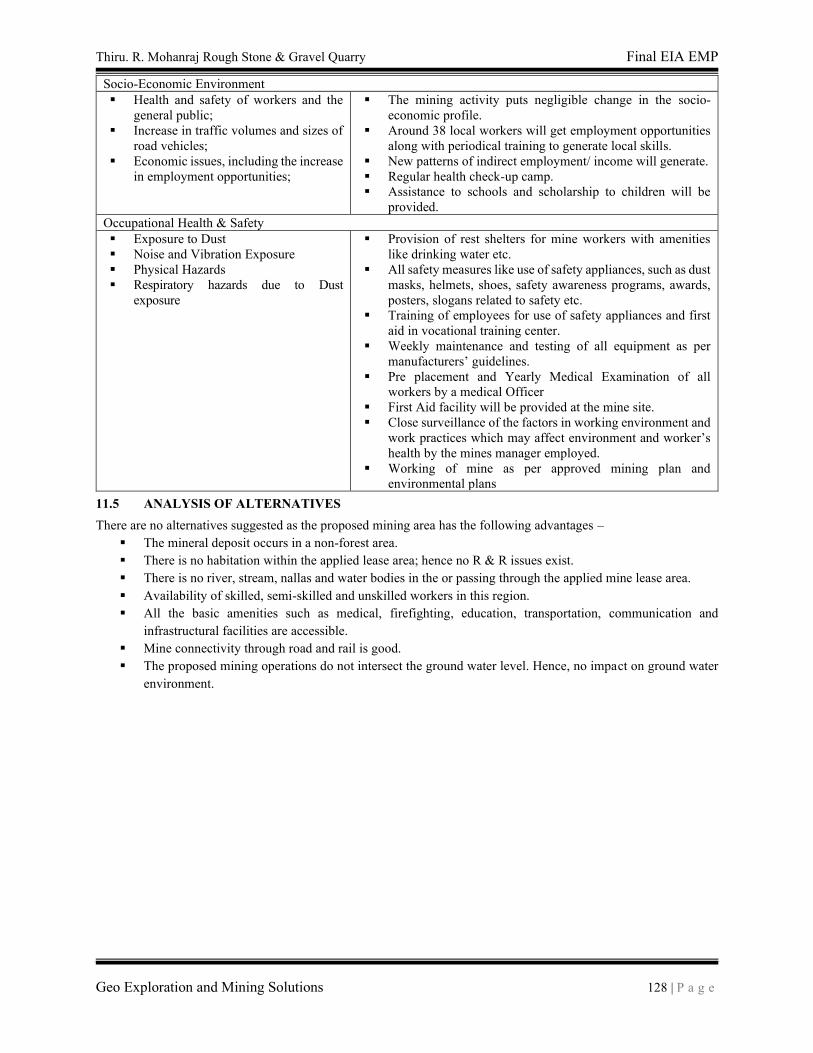
Thiru. R. Mohanraj Rough Stone & Gravel Quarry Final EIA EMP
Geo Exploration and Mining Solutions 128 | P a g e
Socio-Economic Environment
▪ Health and safety of workers and the
general public;
▪ Increase in traffic volumes and sizes of
road vehicles;
▪ Economic issues, including the increase
in employment opportunities;
▪ The mining activity puts negligible change in the socio-
economic profile.
▪ Around 38 local workers will get employment opportunities
along with periodical training to generate local skills.
▪ New patterns of indirect employment/ income will generate.
▪ Regular health check-up camp.
▪ Assistance to schools and scholarship to children will be
provided.
Occupational Health & Safety
▪ Exposure to Dust
▪ Noise and Vibration Exposure
▪ Physical Hazards
▪ Respiratory hazards due to Dust
exposure
▪ Provision of rest shelters for mine workers with amenities
like drinking water etc.
▪ All safety measures like use of safety appliances, such as dust
masks, helmets, shoes, safety awareness programs, awards,
posters, slogans related to safety etc.
▪ Training of employees for use of safety appliances and first
aid in vocational training center.
▪ Weekly maintenance and testing of all equipment as per
manufacturers’ guidelines. ▪ Pre placement and Yearly Medical Examination of all
workers by a medical Officer
▪ First Aid facility will be provided at the mine site.
▪ Close surveillance of the factors in working environment and
work practices which may affect environment and worker’s health by the mines manager employed.
▪ Working of mine as per approved mining plan and
environmental plans
11.5 ANALYSIS OF ALTERNATIVES
There are no alternatives suggested as the proposed mining area has the following advantages –
▪ The mineral deposit occurs in a non-forest area.
▪ There is no habitation within the applied lease area; hence no R & R issues exist.
▪ There is no river, stream, nallas and water bodies in the or passing through the applied mine lease area.
▪ Availability of skilled, semi-skilled and unskilled workers in this region.
▪ All the basic amenities such as medical, firefighting, education, transportation, communication and
infrastructural facilities are accessible.
▪ Mine connectivity through road and rail is good.
▪ The proposed mining operations do not intersect the ground water level. Hence, no impact on ground water
environment.
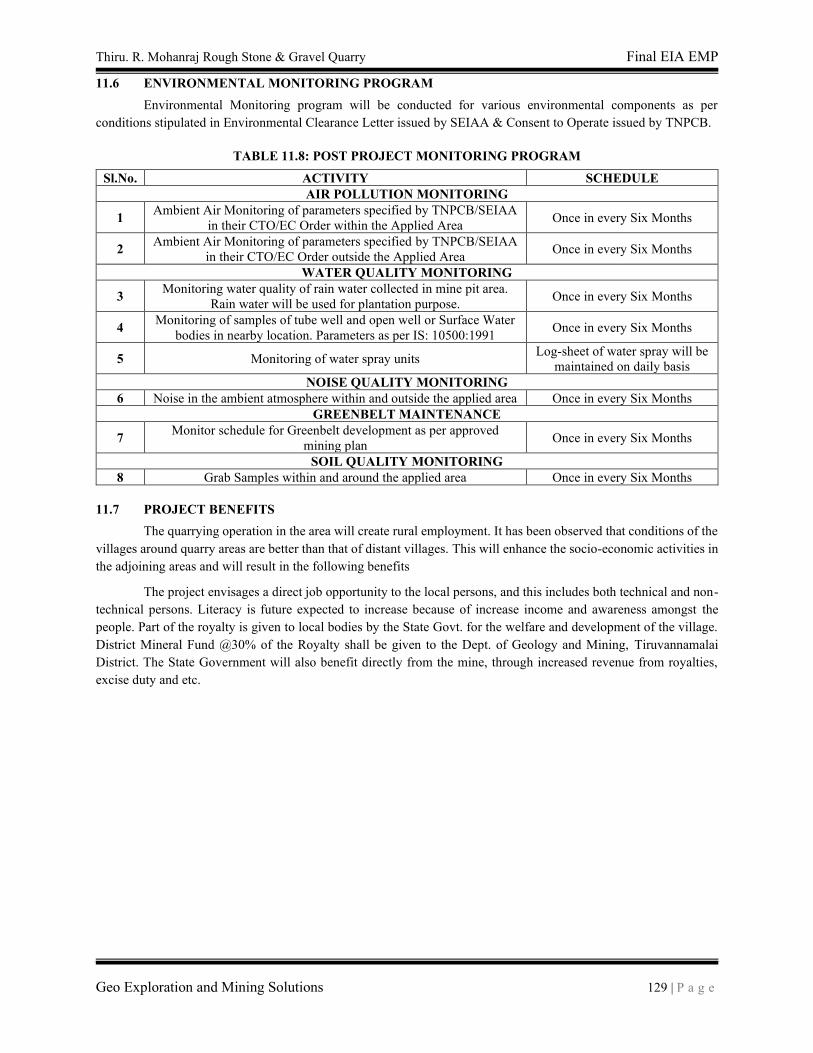
Thiru. R. Mohanraj Rough Stone & Gravel Quarry Final EIA EMP
Geo Exploration and Mining Solutions 129 | P a g e
11.6 ENVIRONMENTAL MONITORING PROGRAM
Environmental Monitoring program will be conducted for various environmental components as per
conditions stipulated in Environmental Clearance Letter issued by SEIAA & Consent to Operate issued by TNPCB.
TABLE 11.8: POST PROJECT MONITORING PROGRAM
Sl.No. ACTIVITY SCHEDULE
AIR POLLUTION MONITORING
1 Ambient Air Monitoring of parameters specified by TNPCB/SEIAA
in their CTO/EC Order within the Applied Area Once in every Six Months
2 Ambient Air Monitoring of parameters specified by TNPCB/SEIAA
in their CTO/EC Order outside the Applied Area Once in every Six Months
WATER QUALITY MONITORING
3 Monitoring water quality of rain water collected in mine pit area.
Rain water will be used for plantation purpose. Once in every Six Months
4 Monitoring of samples of tube well and open well or Surface Water
bodies in nearby location. Parameters as per IS: 10500:1991 Once in every Six Months
5 Monitoring of water spray units Log-sheet of water spray will be
maintained on daily basis
NOISE QUALITY MONITORING
6 Noise in the ambient atmosphere within and outside the applied area Once in every Six Months
GREENBELT MAINTENANCE
7 Monitor schedule for Greenbelt development as per approved
mining plan Once in every Six Months
SOIL QUALITY MONITORING
8 Grab Samples within and around the applied area Once in every Six Months
11.7 PROJECT BENEFITS
The quarrying operation in the area will create rural employment. It has been observed that conditions of the
villages around quarry areas are better than that of distant villages. This will enhance the socio-economic activities in
the adjoining areas and will result in the following benefits
The project envisages a direct job opportunity to the local persons, and this includes both technical and non-
technical persons. Literacy is future expected to increase because of increase income and awareness amongst the
people. Part of the royalty is given to local bodies by the State Govt. for the welfare and development of the village.
District Mineral Fund @30% of the Royalty shall be given to the Dept. of Geology and Mining, Tiruvannamalai
District. The State Government will also benefit directly from the mine, through increased revenue from royalties,
excise duty and etc.
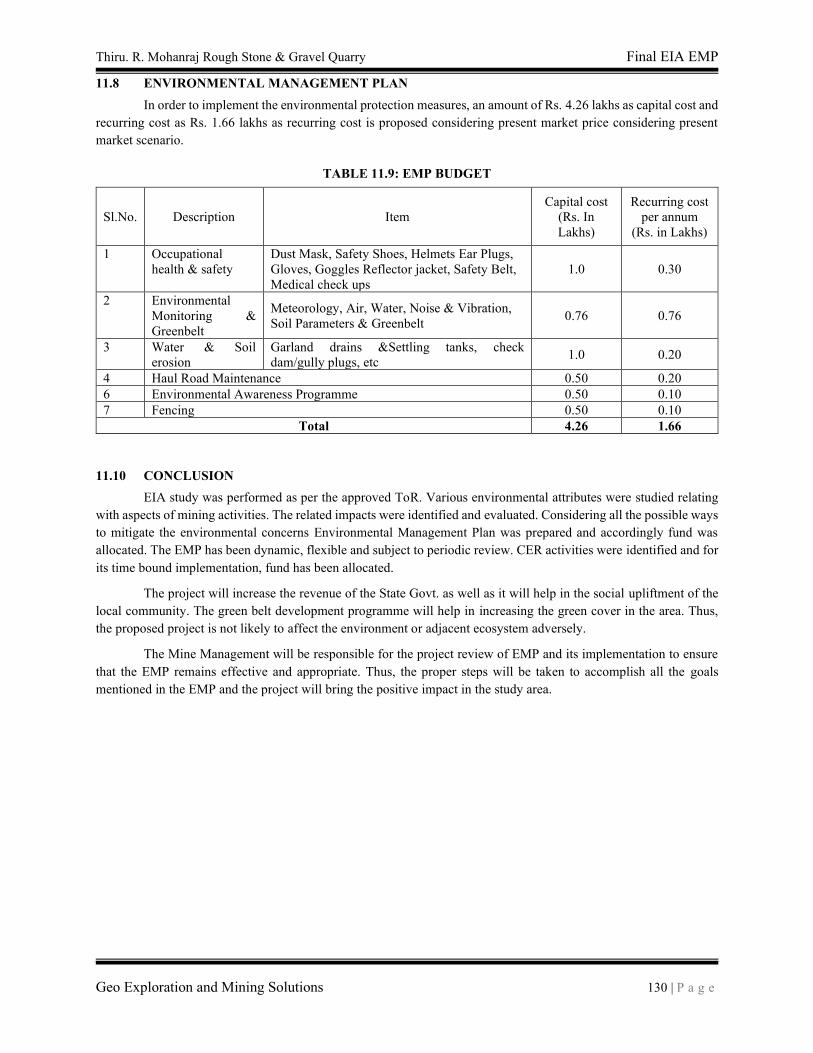
Thiru. R. Mohanraj Rough Stone & Gravel Quarry Final EIA EMP
Geo Exploration and Mining Solutions 130 | P a g e
11.8 ENVIRONMENTAL MANAGEMENT PLAN
In order to implement the environmental protection measures, an amount of Rs. 4.26 lakhs as capital cost and
recurring cost as Rs. 1.66 lakhs as recurring cost is proposed considering present market price considering present
market scenario.
TABLE 11.9: EMP BUDGET
Sl.No. Description Item
Capital cost
(Rs. In
Lakhs)
Recurring cost
per annum
(Rs. in Lakhs)
1 Occupational
health & safety
Dust Mask, Safety Shoes, Helmets Ear Plugs,
Gloves, Goggles Reflector jacket, Safety Belt,
Medical check ups
1.0 0.30
2 Environmental
Monitoring &
Greenbelt
Meteorology, Air, Water, Noise & Vibration,
Soil Parameters & Greenbelt 0.76 0.76
3 Water & Soil
erosion
Garland drains &Settling tanks, check
dam/gully plugs, etc 1.0 0.20
4 Haul Road Maintenance 0.50 0.20
6 Environmental Awareness Programme 0.50 0.10
7 Fencing 0.50 0.10
Total 4.26 1.66
11.10 CONCLUSION
EIA study was performed as per the approved ToR. Various environmental attributes were studied relating
with aspects of mining activities. The related impacts were identified and evaluated. Considering all the possible ways
to mitigate the environmental concerns Environmental Management Plan was prepared and accordingly fund was
allocated. The EMP has been dynamic, flexible and subject to periodic review. CER activities were identified and for
its time bound implementation, fund has been allocated.
The project will increase the revenue of the State Govt. as well as it will help in the social upliftment of the
local community. The green belt development programme will help in increasing the green cover in the area. Thus,
the proposed project is not likely to affect the environment or adjacent ecosystem adversely.
The Mine Management will be responsible for the project review of EMP and its implementation to ensure
that the EMP remains effective and appropriate. Thus, the proper steps will be taken to accomplish all the goals
mentioned in the EMP and the project will bring the positive impact in the study area.
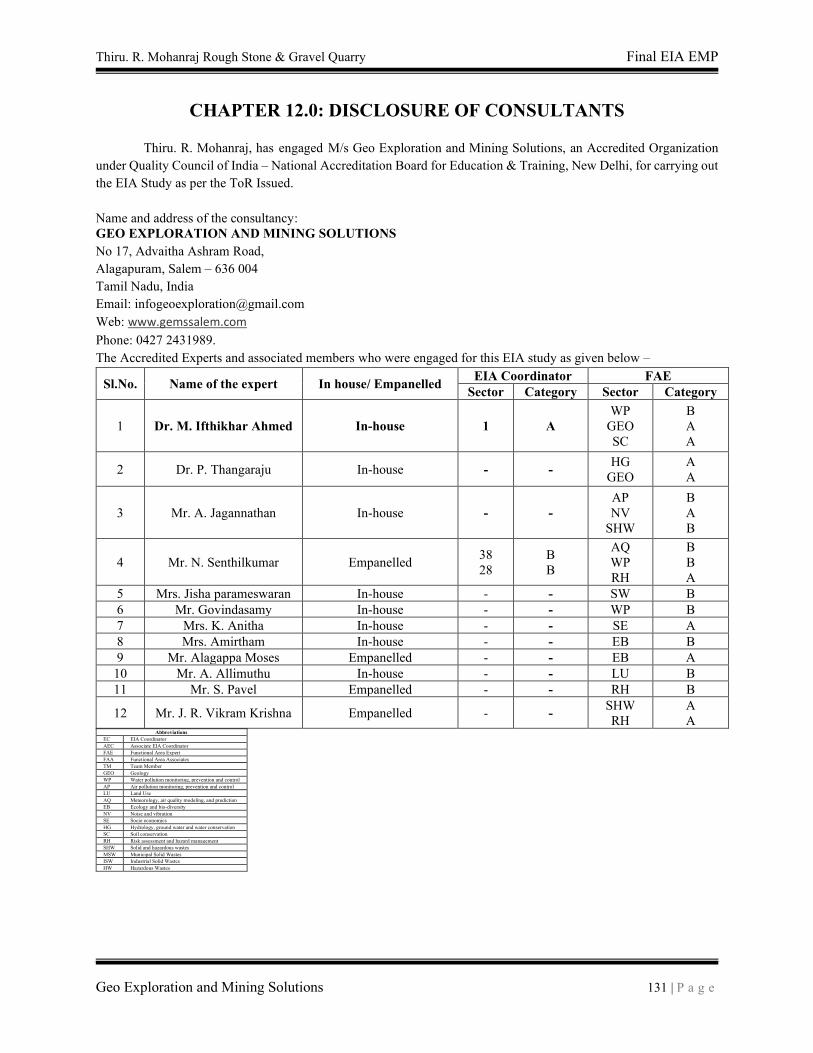
Thiru. R. Mohanraj Rough Stone & Gravel Quarry Final EIA EMP
Geo Exploration and Mining Solutions 131 | P a g e
CHAPTER 12.0: DISCLOSURE OF CONSULTANTS
Thiru. R. Mohanraj, has engaged M/s Geo Exploration and Mining Solutions, an Accredited Organization
under Quality Council of India – National Accreditation Board for Education & Training, New Delhi, for carrying out
the EIA Study as per the ToR Issued.
Name and address of the consultancy:
GEO EXPLORATION AND MINING SOLUTIONS
No 17, Advaitha Ashram Road,
Alagapuram, Salem – 636 004
Tamil Nadu, India
Email: [email protected]
Web: www.gemssalem.com
Phone: 0427 2431989. The Accredited Experts and associated members who were engaged for this EIA study as given below –
Sl.No. Name of the expert In house/ Empanelled EIA Coordinator FAE
Sector Category Sector Category
1 Dr. M. Ifthikhar Ahmed In-house 1 A
WP
GEO
SC
B
A
A
2 Dr. P. Thangaraju In-house - - HG
GEO
A
A
3 Mr. A. Jagannathan In-house - -
AP
NV
SHW
B
A
B
4 Mr. N. Senthilkumar Empanelled 38
28
B
B
AQ
WP
RH
B
B
A
5 Mrs. Jisha parameswaran In-house - - SW B
6 Mr. Govindasamy In-house - - WP B
7 Mrs. K. Anitha In-house - - SE A
8 Mrs. Amirtham In-house - - EB B
9 Mr. Alagappa Moses Empanelled - - EB A
10 Mr. A. Allimuthu In-house - - LU B
11 Mr. S. Pavel Empanelled - - RH B
12 Mr. J. R. Vikram Krishna Empanelled - - SHW
RH
A
A Abbreviations
EC EIA Coordinator
AEC Associate EIA Coordinator
FAE Functional Area Expert
FAA Functional Area Associates
TM Team Member
GEO Geology
WP Water pollution monitoring, prevention and control
AP Air pollution monitoring, prevention and control
LU Land Use
AQ Meteorology, air quality modeling, and prediction
EB Ecology and bio-diversity
NV Noise and vibration
SE Socio economics
HG Hydrology, ground water and water conservation
SC Soil conservation
RH Risk assessment and hazard management
SHW Solid and hazardous wastes
MSW Municipal Solid Wastes
ISW Industrial Solid Wastes
HW Hazardous Wastes
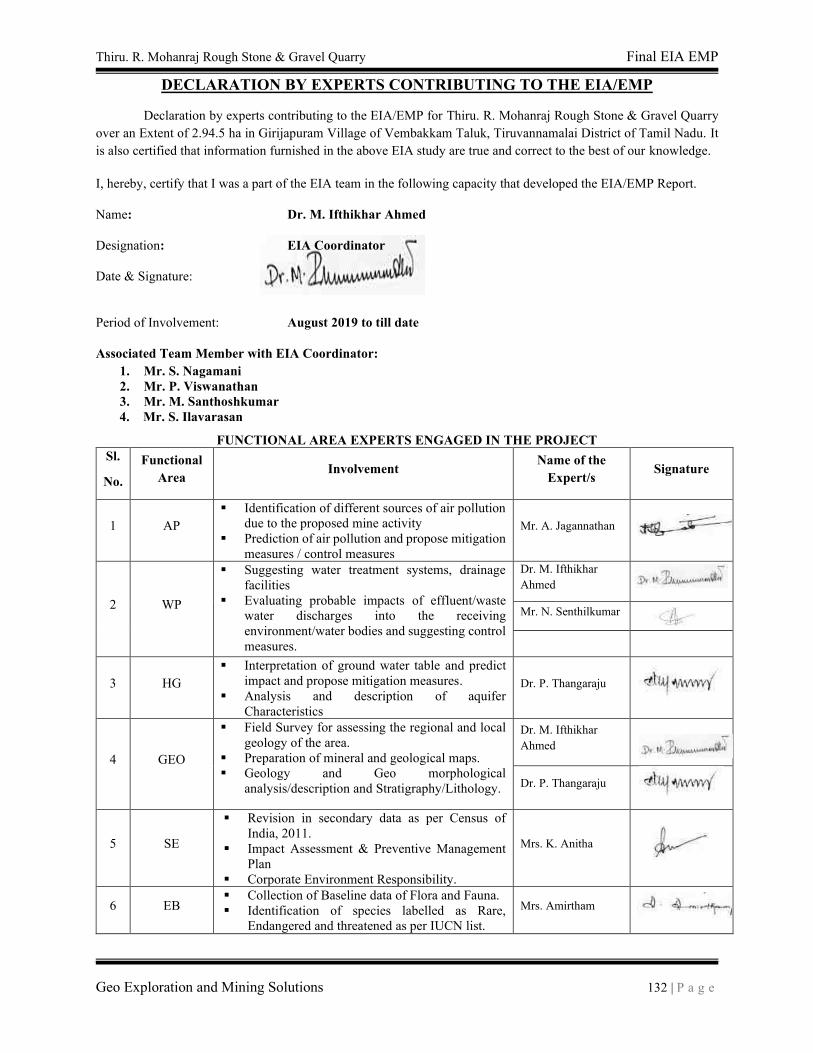
Thiru. R. Mohanraj Rough Stone & Gravel Quarry Final EIA EMP
Geo Exploration and Mining Solutions 132 | P a g e
DECLARATION BY EXPERTS CONTRIBUTING TO THE EIA/EMP
Declaration by experts contributing to the EIA/EMP for Thiru. R. Mohanraj Rough Stone & Gravel Quarry
over an Extent of 2.94.5 ha in Girijapuram Village of Vembakkam Taluk, Tiruvannamalai District of Tamil Nadu. It
is also certified that information furnished in the above EIA study are true and correct to the best of our knowledge.
I, hereby, certify that I was a part of the EIA team in the following capacity that developed the EIA/EMP Report.
Name: Dr. M. Ifthikhar Ahmed
Designation: EIA Coordinator
Date & Signature:
Period of Involvement: August 2019 to till date
Associated Team Member with EIA Coordinator:
1. Mr. S. Nagamani
2. Mr. P. Viswanathan
3. Mr. M. Santhoshkumar
4. Mr. S. Ilavarasan
FUNCTIONAL AREA EXPERTS ENGAGED IN THE PROJECT
Sl.
No.
Functional
Area Involvement
Name of the
Expert/s Signature
1 AP
▪ Identification of different sources of air pollution
due to the proposed mine activity
▪ Prediction of air pollution and propose mitigation
measures / control measures
Mr. A. Jagannathan
2 WP
▪ Suggesting water treatment systems, drainage
facilities
▪ Evaluating probable impacts of effluent/waste
water discharges into the receiving
environment/water bodies and suggesting control
measures.
Dr. M. Ifthikhar
Ahmed
Mr. N. Senthilkumar
3 HG
▪ Interpretation of ground water table and predict
impact and propose mitigation measures.
▪ Analysis and description of aquifer
Characteristics
Dr. P. Thangaraju
4 GEO
▪ Field Survey for assessing the regional and local
geology of the area.
▪ Preparation of mineral and geological maps.
▪ Geology and Geo morphological
analysis/description and Stratigraphy/Lithology.
Dr. M. Ifthikhar
Ahmed
Dr. P. Thangaraju
5 SE
▪ Revision in secondary data as per Census of
India, 2011.
▪ Impact Assessment & Preventive Management
Plan
▪ Corporate Environment Responsibility.
Mrs. K. Anitha
6 EB ▪ Collection of Baseline data of Flora and Fauna.
▪ Identification of species labelled as Rare,
Endangered and threatened as per IUCN list.
Mrs. Amirtham
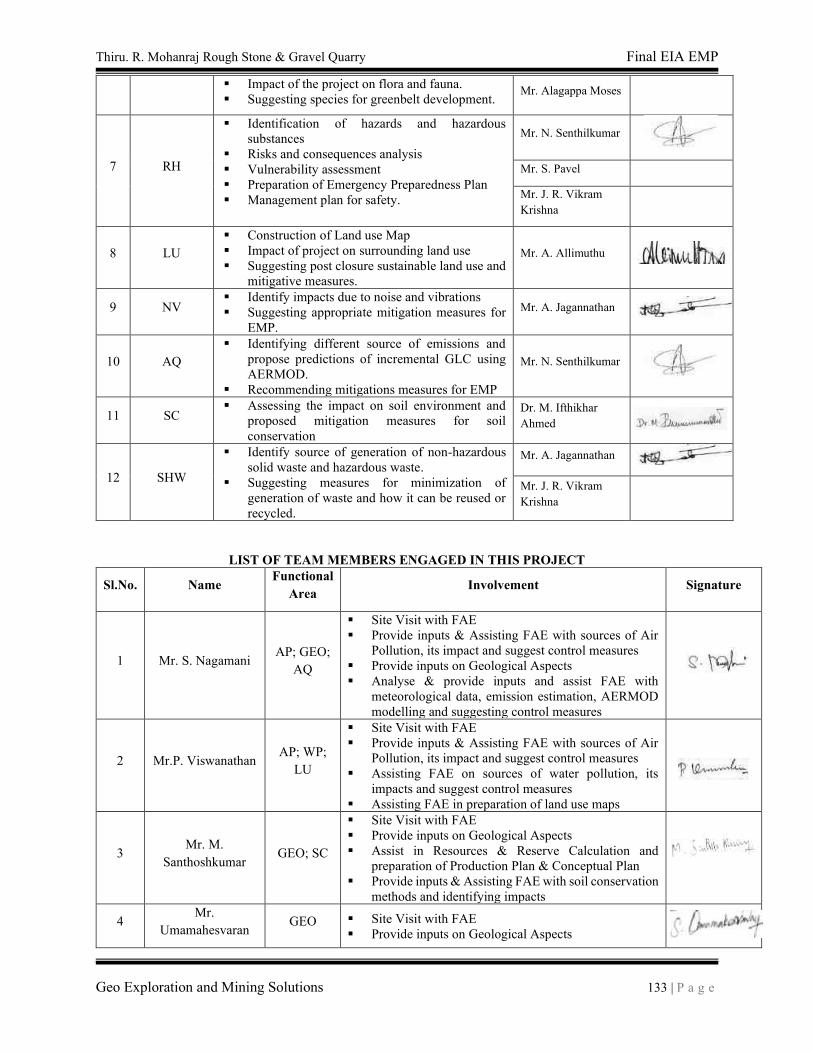
Thiru. R. Mohanraj Rough Stone & Gravel Quarry Final EIA EMP
Geo Exploration and Mining Solutions 133 | P a g e
▪ Impact of the project on flora and fauna.
▪ Suggesting species for greenbelt development. Mr. Alagappa Moses
7 RH
▪ Identification of hazards and hazardous
substances
▪ Risks and consequences analysis
▪ Vulnerability assessment
▪ Preparation of Emergency Preparedness Plan
▪ Management plan for safety.
Mr. N. Senthilkumar
Mr. S. Pavel
Mr. J. R. Vikram
Krishna
8 LU
▪ Construction of Land use Map
▪ Impact of project on surrounding land use
▪ Suggesting post closure sustainable land use and
mitigative measures.
Mr. A. Allimuthu
9 NV ▪ Identify impacts due to noise and vibrations
▪ Suggesting appropriate mitigation measures for
EMP.
Mr. A. Jagannathan
10 AQ
▪ Identifying different source of emissions and
propose predictions of incremental GLC using
AERMOD.
▪ Recommending mitigations measures for EMP
Mr. N. Senthilkumar
11 SC ▪ Assessing the impact on soil environment and
proposed mitigation measures for soil
conservation
Dr. M. Ifthikhar
Ahmed
12 SHW
▪ Identify source of generation of non-hazardous
solid waste and hazardous waste.
▪ Suggesting measures for minimization of
generation of waste and how it can be reused or
recycled.
Mr. A. Jagannathan
Mr. J. R. Vikram
Krishna
LIST OF TEAM MEMBERS ENGAGED IN THIS PROJECT
Sl.No. Name Functional
Area Involvement Signature
1 Mr. S. Nagamani AP; GEO;
AQ
▪ Site Visit with FAE
▪ Provide inputs & Assisting FAE with sources of Air
Pollution, its impact and suggest control measures
▪ Provide inputs on Geological Aspects
▪ Analyse & provide inputs and assist FAE with
meteorological data, emission estimation, AERMOD
modelling and suggesting control measures
2 Mr.P. Viswanathan AP; WP;
LU
▪ Site Visit with FAE
▪ Provide inputs & Assisting FAE with sources of Air
Pollution, its impact and suggest control measures
▪ Assisting FAE on sources of water pollution, its
impacts and suggest control measures
▪ Assisting FAE in preparation of land use maps
3 Mr. M.
Santhoshkumar GEO; SC
▪ Site Visit with FAE
▪ Provide inputs on Geological Aspects
▪ Assist in Resources & Reserve Calculation and
preparation of Production Plan & Conceptual Plan
▪ Provide inputs & Assisting FAE with soil conservation
methods and identifying impacts
4 Mr.
Umamahesvaran GEO ▪ Site Visit with FAE
▪ Provide inputs on Geological Aspects
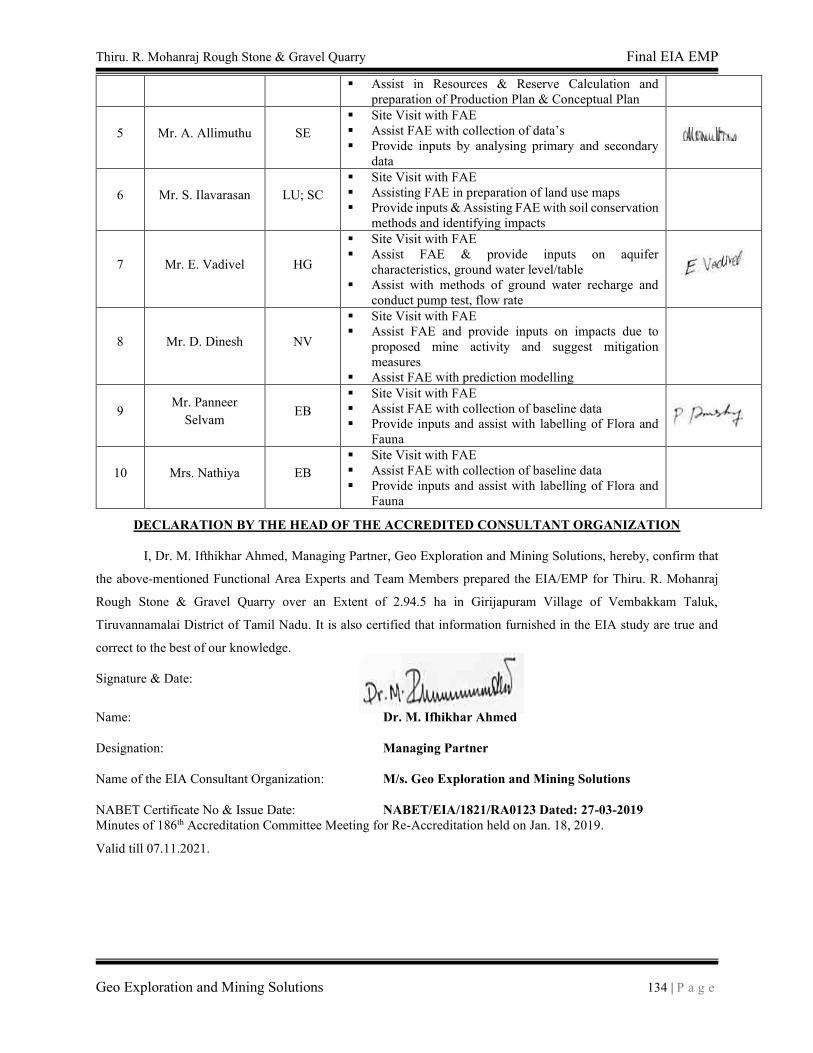
Thiru. R. Mohanraj Rough Stone & Gravel Quarry Final EIA EMP
Geo Exploration and Mining Solutions 134 | P a g e
▪ Assist in Resources & Reserve Calculation and
preparation of Production Plan & Conceptual Plan
5 Mr. A. Allimuthu SE
▪ Site Visit with FAE
▪ Assist FAE with collection of data’s
▪ Provide inputs by analysing primary and secondary
data
6 Mr. S. Ilavarasan LU; SC
▪ Site Visit with FAE
▪ Assisting FAE in preparation of land use maps
▪ Provide inputs & Assisting FAE with soil conservation
methods and identifying impacts
7 Mr. E. Vadivel HG
▪ Site Visit with FAE
▪ Assist FAE & provide inputs on aquifer
characteristics, ground water level/table
▪ Assist with methods of ground water recharge and
conduct pump test, flow rate
8 Mr. D. Dinesh NV
▪ Site Visit with FAE
▪ Assist FAE and provide inputs on impacts due to
proposed mine activity and suggest mitigation
measures
▪ Assist FAE with prediction modelling
9 Mr. Panneer
Selvam EB
▪ Site Visit with FAE
▪ Assist FAE with collection of baseline data
▪ Provide inputs and assist with labelling of Flora and
Fauna
10 Mrs. Nathiya EB
▪ Site Visit with FAE
▪ Assist FAE with collection of baseline data
▪ Provide inputs and assist with labelling of Flora and
Fauna
DECLARATION BY THE HEAD OF THE ACCREDITED CONSULTANT ORGANIZATION
I, Dr. M. Ifthikhar Ahmed, Managing Partner, Geo Exploration and Mining Solutions, hereby, confirm that
the above-mentioned Functional Area Experts and Team Members prepared the EIA/EMP for Thiru. R. Mohanraj
Rough Stone & Gravel Quarry over an Extent of 2.94.5 ha in Girijapuram Village of Vembakkam Taluk,
Tiruvannamalai District of Tamil Nadu. It is also certified that information furnished in the EIA study are true and
correct to the best of our knowledge.
Signature & Date:
Name: Dr. M. Ifhikhar Ahmed
Designation: Managing Partner
Name of the EIA Consultant Organization: M/s. Geo Exploration and Mining Solutions
NABET Certificate No & Issue Date: NABET/EIA/1821/RA0123 Dated: 27-03-2019
Minutes of 186th Accreditation Committee Meeting for Re-Accreditation held on Jan. 18, 2019.
Valid till 07.11.2021.
ANNEXURE
VOLUME – I
ROUGH STONE AND GRAVEL QUARRY
Extent – 2.94.5 ha
In S. F. Nos. 176/1A, 1B, 1C, 2A, 2B, 3A, 3B, 3C, 3D, 3E, 3F,3G &
176/4B
Girijapuram Village, Vembakkam Taluk, Tiruvannamalai
District
PROJECT PROPONENT
Thiru. R. Mohanraj,
S/o. Rajagopal,
No. 33, Pillaiyarkovil,
Puliyambedu, Ambattur Taluk
Thiruvallur District
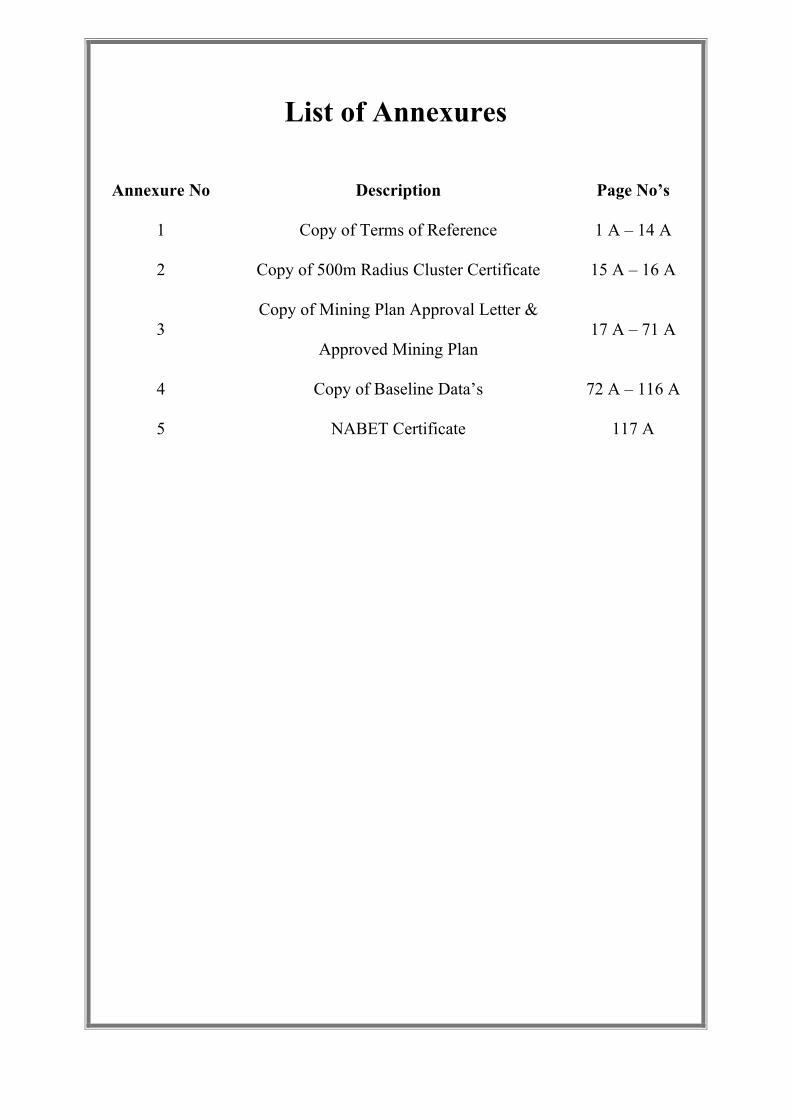
List of Annexures
Annexure No Description Page No’s
1 Copy of Terms of Reference 1 A – 14 A
2 Copy of 500m Radius Cluster Certificate 15 A – 16 A
3
Copy of Mining Plan Approval Letter &
Approved Mining Plan
17 A – 71 A
4 Copy of Baseline Data’s 72 A – 116 A
5 NABET Certificate 117 A
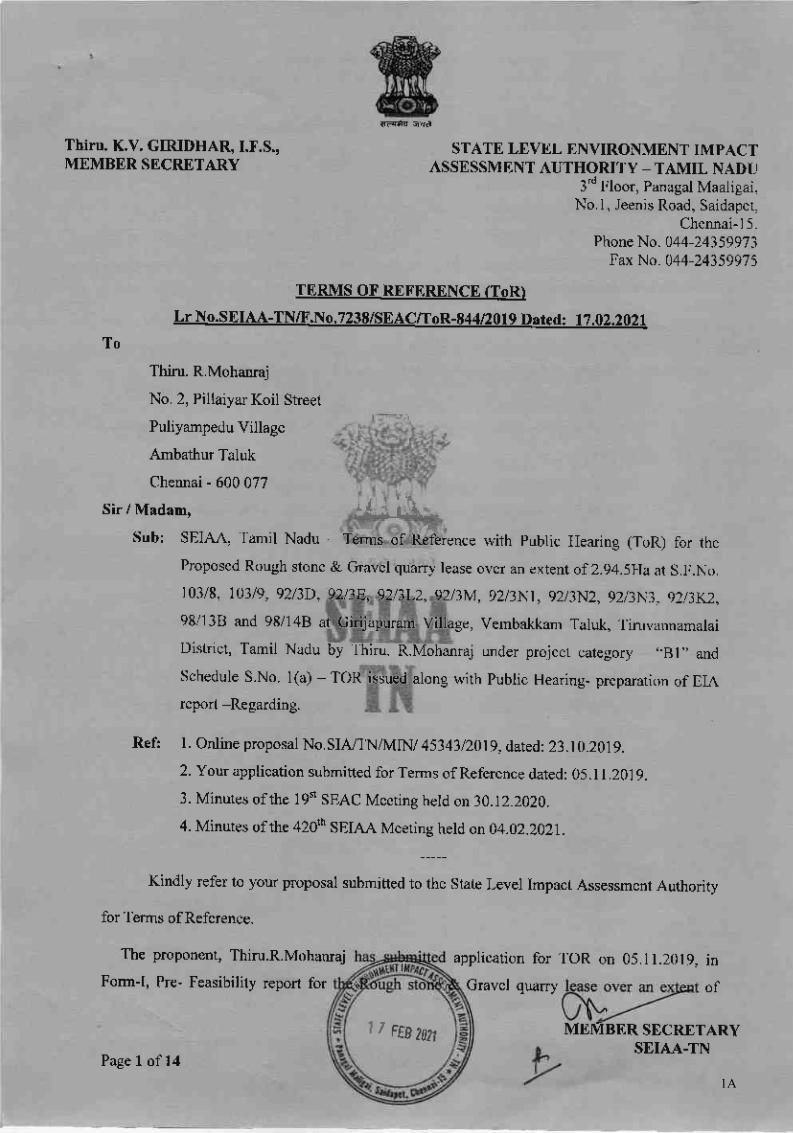
FFrtr ilq-e
Thiru. K.V. GIRIDHAR, I.F.S.,MEMBER SECRETARY
STATE LEVEL ENVIRONMENT IMPACTASSESSMENT AUTHORITY _ TAMIL NADU
3'd Floor, Panagal Maaligai,No.1, Jeenis Road, Saidapet,
Chennai-15.
Phone No. 044-24359973
Fax No. 044-24359975
TERMS OF. REFERENCE ffoR)
Lr No.SEIAA-TN/F.No. 7238/sEAC/ToR-844/20 I 9 Dated : I 7.02.202 1
To
Thiru. R.Mohanraj
No. 2, Pillaiyar Koil Street
Puliyampedu Village
Ambathur Taluk
Chennai - 600 077
Sir / Madam,
Sub: SEIAA, Tamil Nadu - Terms of Reference with Public Hearing (ToR) for the
Proposed Rough stone & Gravel quarry lease over an extent of 2.94.5Ha at S.F.No.
103/9, 10319, g2l3D, g2l3E, g2l3L2, g2l3M, g2l3Nl , g2l3N2, g2l3N3, g2l3K2,
98/l38 and 98/148 at Girijapuram Village, Vembakkam Taluk, Tiruvannamalai
District, Tamil Nadu by Thiru. R.Mohanraj under project category - ,,B1,,
and
Schedule S.No. 1(a) - TOR issued along with Public Hearing- preparation of EIA
report -Regarding.
Ref: L online proposal No.sIA/TNA4IN/ 4534312019, dated: 23.t0.2019.
2. Your application submitted for Terms of Reference dated: 05.11.2019.
3. Minutes of the 19't SEAC Meeting held on 30.12.2020.
4. Minutes of the 420th SEIAA Meeting held on 04.02.2021.
Kindly refer to your proposal submitted to the State Level Impact Assessment Authority
for Terms of Reference.
The
Form-I,
proponent, Thiru.R.Mohanraj application for TOR on 05.11.2019,
Pre- Feasibility report for
MEItrBER SECRETARY
in
of
1 7 FEB 2021
Page I of14
Gravel quarry
SEIAA.TN
l-dil&
1A
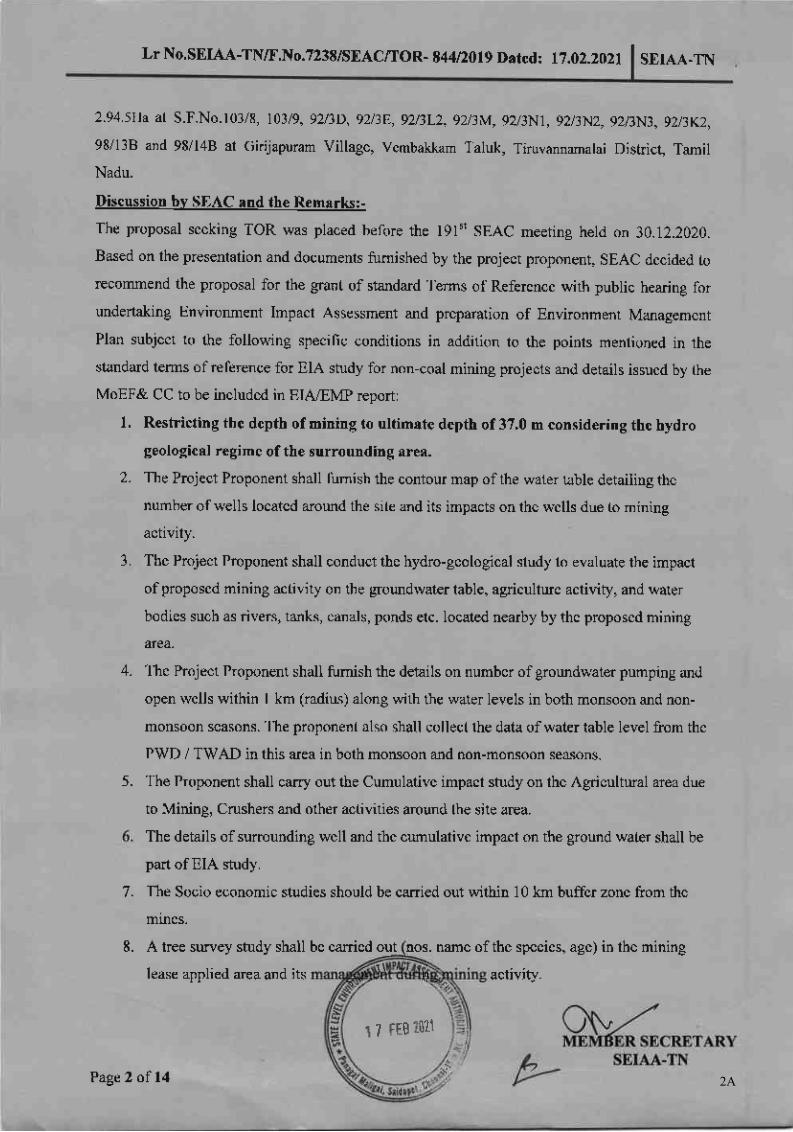
L r No. SEIAA-TN/r'.No. 7238ISEAC/TOR - 84 4 t20tg Dated : t7 .02.2021 SEIAA.TN
2.94.5Ha at S.F.No.l0318, 10319,9213D,9213E,9213L2, g2l3M, g2l3N1, g2l3N2, g2l3N3, g2/3K2,
98/l3B and 98/l4B at Girijapuram Village, Vembakkam Taluk, Tiruvannamalai District, Tamil
Nadu.
Discussion bv SEAC and the Remarks:-
The proposal seeking TOR was placed before the l9l't SEAC meeting held on 30.12.2020.
Based on the presentation and documents furnished by the project proponent, SEAC decided to
recommend the proposal for the grant of standard Terms of Reference with public hearing for
undertaking Environment Impact Assessment and preparation of Environment Management
Plan subject to the following specific conditions in addition to the points mentioned in the
standard terms of reference for EIA study for non-coal mining projects and details issued by the
MoEF& CC to be included in EIA/EMP report:
1. Restricting the depth of mining to ultimate depth of 37.0 m considering the hydro
geological regime of the surrounding area.
2. The Project Proponent shall furnish the contour map of the water table detailing the
number of wells located around the site and its impacts on the wells due to mining
activity.
3. The Project Proponent shall conduct the hydro-geological study to evaluate the impact
of proposed mining activity on the groundwater table, agriculture activity, and water
bodies such as rivers, tanks, canals, ponds etc. located nearby by the proposed mining
area.
The Project Proponent shall fumish the details on number of groundwater pumping and
open wells within I km (radius) along with the water levels in both monsoon and non-
monsoon seasons. The proponent also shall collect the data of water table level from the
PWD / TWAD in this area in both monsoon and non-monsoon seasons.
The Proponent shall carry out the Cumulative impact study on the Agricultural area due
to Mining, Crushers and other activities around the site area.
The details of surrounding well and the cumulative impact on the ground water shall be
part of EIA study.
The Socio economic studies should be carried out within l0 km buffer zone from the
mines.
7.
8. A tree survey study shall be carried out nos. name of the species, age) in the mining
lease applied area and its
4.
5.
Page2 of14
1 7 FEB 2021
activity.
2A
Lr No.SEIAA-TN/tr'.No.7238/SEAC/TOR - 84412019 17.02.2021 SEIAA-TN
9. CER activities should be carried out taking into consideration the requirement of the
local habitants available within the buffer zone as per Office Memorandum of MoEF&
CC dated 01.05.2018.
10. A Detailed mining closure plan for the proposed project shall be submitted.
1 1. A detail report on the safety and health aspects of the workers and for the surrounding
habitants during operation of mining for drilling and blasting shall be submitted.
l2.The recorlmendation for the issue Terms of Reference is subject to the outcome of the
Hon'ble NGT, Principal Bench, New Delhi in O.A No.l86 of 2016 (M.A.No.3 5012016)
and O.A. No.200/2016 and O.A.No.58012016 (M.A.No.1t92l20t6) and
O.A.No. 102 120 17 and O.A.N o.404 I 201 6 (M.A.No. 7 58 l20l 6, M.A.No. 92 0 I 20 | 6,
M.A.No.112212016, M.A.No.12l20I7 & M.A. No. 843/2017) and O.A.No.40512016 and
O.A.No.520 of 2016 (M.A.No.981 12016, M.A.No.98212016 & M.A.No.384l2}l7).
13. A detailed study of the litho logy of the mining lease area shall be furnished.
14. The proponent shall carryout fugitive emission survey due to this quarry operation and
furnish its mitigation measures in the EMp
15. The proponent shall provide fencing along the boundary of the mining lease area.
16. The proponent has to furnish the actual mining quantity carried year wise from the date of
commissioning of quarry.
Discussion bv SEIAA and the Remarks:-
The proposal was placed before the 420h Authority meeting held on O4.OZ.2O2| After
detailed discussion, the Authority noted as follows.
The Proponent Thiru. R. Mohanraj has filed a proposal for obtaining Terms of
Reference under cluster to carryout EIA study for Rough Stone and Gravel Quarry
over an Extent of 2.94.5 Ha at S.F.Nos. 103/8, 10319,9213D,92138,9213L2,92.]M,
92l3N1, 9213N2, 92l3N3, 9213K2, 98/l38 and 98/148 Girijapuram village,
Vembakkam Taluk, Tiruvannamalai District. The proponent has also submitted the
proposal through online proposal No. SIA/TN/MIN/4534312019 dated 23.10.2019.
As per the 191't SEAC minutes (Agenda No.191-35), the projecVactivity is covered
under category "B" of 1(a) Mining of minerals of the Schedule to the EIA
Notification. 2006.
3. In SEAC minutes, it has not been indicated whether the project is covered under
DNr--
l.
2.
MEMBER SECRETARYSEIAA.TN
Page 3 of 14
'Bl'or'B2' category
3A
L r No. sEIAA-TN/F.No. 7238ISEAC/TOR - I 4 4 l20tg Dated : t7 .02.2021 SEIAA.TN
As per Assistant Director, Department of Geology & mining letter R.c.No.
377lKanimarnsl2}l9 dated 10.09.2019; total extent of quarries located within 500m
radius is more than 5 Ha and hence this proposal will come under ,Bl, category
under cluster situation.
As per the EIA Notification,2006 as amended, All category ,A, and category B1
projects or activities shall undertake Public Consultation, except certain activity.
The SEAC in its 191't meeting has recommended the proposal for the grant of
standard Terms of Reference with public hearing for undertaking Environment
Impact Assessment and preparation of Environment Management Plan subject to the
certain specific conditions in addition to the points mentioned in the standard terms
of reference for EIA study and subject to.some special conditions and one such is.
and decided to grant Terms of Reference wi for undertaking Environment
Impact Assessment and preparation of Envi Management Plan for Rough Stone and
Gravel Quarry over an Extent of 2.94.5 Ha at S.F.Nos. 103/8, l}3lg, 9213D, g2l3E, gZl3L2,
9213M, 92l3N1, 9213N2, 92l3N3, Girijapuram village,
Vembakkam Taluk, Tiruvannamalai as recorlmended by
SEAC & normal condition in addition to the
1. "As per the recommendation of SEAC, the i depth of mining is restricted to 37m.
Hence the proponent shall furnish the co ofreYised mining plan with proportionate
mineable quantity for the aforesaid restricted depth of 37m while submitting the proposal
for Environmental Clearance.
2. As per the MoEF& CC office memorandum F.No.22-6512017-IA.III dated: 30.09.2020 and
20.10.2020 the proponent shall address the concerns raised during the public consultation
and all the activities proposed shall be part of the Environment Management Plan
A. STANDARD TERMS OF REFERENCE
1) Year-wise production details since 1994 should be given, clearly stating the highest
production achieved in any one year prior to 1994.It may also be categorically informed
whether there had been any increase in production after the EIA Notification 1994 came
into force, w.r.t. the highest prior to 1994.
4.
5.
6.
1 ? EB 1011
O\,/EMBER SECRETARY
SEIAA.TN
&Page 4 of 14 4A
2)
3)
Lr No. sEIAA-TN/T'.No. 7238/sEAC/TOR - 844 lz0t9 Dated : t7 .02.2021 SEIAA.TN
A copy of the document in support of the fact that the Proponent is the rightful lessee of
the mine should be given.
All documents including approved mine plan, EIA and Public Hearing should be
compatible with one another in terms of the mine lease area, production levels, waste
generation and its management, mining technology etc. and should be in the name of the
lessee.
All corner coordinates of the mine lease area, superimposed on a High Resolution
Imagery/ topo sheet, topographic sheet, geomorphology and geology of the area should be
provided. Such an Imagery of the proposed area should clearly show the land use and
other ecological features ofthe study area (core and buffer zone).
Information should be provided in Survey of India Topo sheet in 1:50,000 scale indicating
geological map of the area, geomorphology of land forms of the area, existing minerals
and mining history of the area, important water bodies, streams and rivers and soil
characteristics.
Details about the land proposed for mining activities should be given with information as
to whether mining conforms to the land use policy of the State; land diversion for mining
should have approval from State land use board or the concerned authority.
It should be clearly stated whether the proponent Company has a well laid down
Environment Policy approved by its Board of Directors? If so, it may be spelt out in the
EIA Report with description of the prescribed operating process/procedures to bring into
focus any infringement/deviation/ violation of the environmental or forest norms/
conditions? The hierarchical system or administrative,Order of the Company to deal with
the environmental issues and for ensuring compliance with the EC conditions may also be
given. The system of reporting of non-compfiances / violations of environmental norms to
the Board of Directors of the Company and./or shareholders or stakeholders at large, may
also be detailed in the EIA Report.
Issues relating to Mine Safety, including subsidence study in case of underground mining
and slope study in case of open cast mining, blasting study etc. should be detailed. The
proposed safeguard measures in each case should also be provided.
The study area will comprise of 10 km zone around the mine lease from lease periphery
and the data contained in the EIA such as waste generation etc. should be for the life ofthe mine / lease period.
MMEMBER SECRETARY
SEIAA.TN
4)
s)
6)
7)
8)
e)
Page 5 of 14
I 7 FEL 20?1
5A
10)
11)
t2)
Lr No. sEIAA-TN/F.No. 7238/SEAC/TOR- t4 4 Dltg Dated : t7 .02.2021 SEIAA.TN
Land use of the study area delineating forest area, agricultural land, grazingland, wildlife
sanctuary, national park, migratory routes of fauna, water bodies, human settlements and
other ecological features should be indicated. Land use plan of the mine lease area should
be prepared to encompass preoperational, operational and post operational phases and
submitted. Impact, if any, of change of land use should be given.
Details of the land for any Over Burden Dumps outside the mine lease, such as extent of
land area, distance from mine lease, its land use, R&R issues, if any, should be given.
Certificate from the Competent Authority in the State Forest Department should be
provided, confirming the involvement of forest land, if any, in the project area. In the
event of any contrary claim by the Project Proponent regarding the status of forests, the
site may be inspected by the State Forest Department along with the Regional Office of
the Ministry to ascertain the status of forests, based on which, the Certificate in this regard
as mentioned above be issued. In all such c.ases, it would be desirable for representative of
the State Forest Department to assist tne U;rpOrt,Appraisal Committees.
13) Status of forestry clearance for the
Project including deposition of Net
and virgin forestland involved in the
V) and Compensatory Afforestation
(CA) should be indicated. A copy of learance should also be furnished.
14) Implementation status of under the Scheduled Tribes and other
Traditional Forest Dwellers (Recognition of Forest Rights) Act, 2006 should be indicated.
15) The vegetation in the RF / PF areas in the study area, with necessary details, should be
given.
16) A study shall be got done to Mining Project on wildlife of the
on the wildlife in the surrounding
, detailed mitigative measures required,
17) Location of National Parks, Sanctuaries, Biosphere Reserues, Wildlife Corridors, Ramsar
site Tiger/ Elephant Reserves/(existing as well as proposed), if any, within l0 km of the
mine lease should be clearly indicated, supported by a location map duly authenticated by
Chief Wildlife Warden. Necessary clearance, as may be applicable to such projects due to
proximity of the ecologically sensitive areas as mentioned above, should be obtained from
the Standing Commiuee of Nati of Wildlife and copy fumished.
O\,r/MEMBER SECRETARY
SEIAA.TN1 7 FEB 2021
Page 6 of 14 6A
Lr No.SEIAA-TN/T'.No.7238ISEAC/TOR- 84412019 Dated : t7 .02.2021 SEIAA.TN
A detailed biological study of the study area [core zone and buffer zone (10 km radius of
the periphery of the mine lease)] shall be carried out. Details of flora and fauna,
endangered, endemic and RET Species duly authenticated, separately for core and buffer
zone should be furnished based on such primary field survey, clearly indicating the
Schedule of the fauna present. In case of any scheduled-I fauna found in the study area,
the necessary plan along with budgetary provisions for their conservation should be
prepared in consultation with State Forest and Wildlife Department and details furnished.
Necessary allocation of funds for implementing the same should be made as part of the
project cost.
Proximity to Areas declared as 'Critically Polluted' or the Project areas likely to come
under the 'Aravali Range', (attracting court restrictions for mining operations), should
also be indicated and where so required, clearance certihcations from the prescribed
Authorities, such as the SPCB or State Mining Department should be secured and
fumished to the effect that the proposed mining activities could be considered.
Similarly, for Coastal Projects, a CRZmap duly authenticated by one of the authorized
agencies demarcating LTL. HTL, CP.Z area,location of the mine lease with respect to
CRZ, coastal features such as martgroves, if arty, should be furnished. (Note: The Mining
Projects falling under CRZ would also need to obtain approval of the concerned Coastal
Zone Management Authority).
2l) R&R Plan/compensation details for the Project Affected People (pAp) should be
furnished. While preparing the R&R Pian,'the relevant StateArlational Rehabilitation &
Resettlement Policy should be kept in view. In respect of SCs /STs and other weaker
sections of the society in the study area, a need based sample survey, family-wise, should
be undertaken to assess their requirements, and action programmes prepared and
submitted accordingly, integrating the sectoral programmes of line departments of the
State Govemment. It may be clearly brought out whether the village(s) located in the
mine lease area will be shifted or not. The issues relating to shifting of village(s) including
their R&R and socio-economic aspects should be discussed in the Report.
22) One season (non-monsoon) [i.e. March-May (Summer Season); October-December (post
monsoon season) ; December-F er season)]primary baseline data on ambient
air quality as per CPCB Notifi r quality, noise level, soil and flora and
l8)
1e)
20)
PageT of14SEIAA.TN
sffi*-RETARYI 7 FEB
2021
7A
Lr No. sEIAA-TN/F.No. 7238ISEAC/TOR- 844 t20tg Dated : t7 .02.2021 SEIAA-TN
fauna shall be collected and the AAQ and other data so compiled presented date-wise in
the EIA and EMP Report. Site-specihc meteorological data should also be collected. The
location of the monitoring stations should be such as to represent whole of the study area
and justified keeping in view the pre-dominant downwind direction and location of
sensitive receptors. There should be at least one monitoring station within 500 m of the
mine lease in the pre-dominant downwind direction. The mineralogical composition of
PM10, particularly for free silica, should be given.
23) Air quality modeling should be carried out for prediction of impact of the project on the
air quality of the area. It should also take into account the impact of movement of
Vehicles for transportation of mineral. The details of the model used and input parameters
used for modeling should be provided. The air quality contours may be shown on a
location map clearly indicating the location of the site, location of sensitive receptors, ifany, and the habitation. The wind roses showing pre-dominant wind direction may also be
indicated on the map.
24) The water requirement for the Project, its availability and source should be furnished. A
detailed water balance should also be provided. Fresh water requirement for the Project
should be indicated.
25) Necessary clearance from the Competent Authority for drawl of requisite quantity of
27)
be given. Details of rainwater harvesting proposed in the Project, if any, should be
provided.
Impact of the Project on the water quality, both surface and groundwater, should be
assessed and necessary safeguard measures, ifany required, should be provided.
Based on actual monitored data, it may clearly be shown whether working will intersect
groundwater. Necessary data and documentation in this regard may be provided. In case
the working will intersect groundwater table, a detailed Hydro Geological Study should
be undertaken and Report fumished. The Report inter-alia, shall include details of the
aquifers present and impact of mining activities on these aquifers. Necessary permission
from Central Ground Water Authority for working below ground water and for pumping
of ground water should also be
28)
Page 8 of 14
copy furnished.
SEIAA.TN
26)
1 ...\
1 7 FEB ?O?1
\t.,F1,
8A
L r No. SEIAA-TN/T'.No.7238/SEAC/TOR - 84 4 12019 Dated : t7 .02.2021 SEIAA-TN
29) Details of any stream, seasonal or otherwise, passing through the lease area and
modification / diversion proposed, if any, and the impact of the same on the hydrology
should be brought out.
30) Information on site elevation, working depth, groundwater table etc. Should be provided
both in AMSL and bgl. A schematic diagram may also be provided for the same.
31) A time bound Progressive Greenbelt Development Plan shall be prepared in a tabular form
(indicating the linear and quantitative coverage, plant species and time frame) and
submitted, keeping in mind, the same will have to be executed up front on commencement
of the Project. Phase-wise plan of plantation and compensatory afforestation should be
charted clearly indicating the area to be covered under plantation and the species to be
planted. The details of plantation already done should be given. The plant species selected
for green belt should have greater ecological value and should be of good utility value to
the local population with emphasis on local and native species and the species which are
tolerant to pollution
32) Impact on local transport infrastructure due to the Project should be indicated. projected
increase in truck traffic as a result of the Project in the present road network (including
those outside the Project area) should be worked out, indicating whether it is capable ofhandling the incremental load. Arrangement for improving the infrastructure, ifcontemplated (including action to be taken by other agencies such as State Government)
should be covered. Project,lrop.onent shall conduct Impact of Transportation study as per
Indian Road Congress Guidelines.
33) Details of the onsite shelter and facilities to be provided to the mine workers should be
included in the EIA Report
34) Conceptual post mining land use and Reclamation and Restoration of mined out areas
(with plans and with adequate number of sections) should be given in the EIA report.
35) Occupational Health impacts of the Project should be anticipated and the proposed
preventive measures spelt out in detail. Details of pre-placement medical examination and
periodical medical examination schedules should be incorporated in the EMp. The project
specific occupational health mitigation measures with required facilities proposed in the
mining area may be detailed.
36) Public health implications of the
impact zone should be syste
should be detailed along wi
and the proposed remedial measures
Y sErAA-rN
d"^YPage 9 of 14
Project and related activities for the population in the
9A
Lr No. SEIAA-TN/F.No. 7238/SEAC/TOR - t4 4 t20tg Dated : t7 .02.2021 SEIAA.TN
37) Measures of socio economic significance and influence to the local community proposed
to be provided by the Project Proponent should be indicated. As far as possible,
quantitative dimensions may be given with time frames for implementation.
38) Detailed Environmental Management Plan (EMP) to mitigate the environmental impacts
which, should inter-alia include the impacts of change of land use, loss of agricultural and
grazing land, if any, occupational health impacts besides other impacts specific to the
proposed Project.
39) Public Hearing points raised and commitment of the Project Proponent on the same along
with time bound Action Plan with budgetary provisions to implement the same should be
provided and also incorporated in the final EIA/EMP Report of the Project.
40) Details of litigation pending against the project, if any, with direction /order passed by any
Court of Law against the Project should be given.
4l) The cost of the Project (capital cost and'iecurring cost) as well as the cost towards
implementation of EMP should be clearly spelt out.
42) A Disaster management Plan shall be
43) Benefits of the Project if the Project,
included in the EIA/EMP Report.
Should be spelt out. The benefits of
the Project shall clearly indicate environmental,,social, economic, employment potential,
etc.
44) Besides the above, the below me e also to be followed:-
a) Executive Summary of the
b) All documents to be properl ed with index and continuous page
numbering.
c) Where data are presented in the Report especially in Tables, the period in which the
data were collected and the sources should be indicated.
d) Project Proponent shall enclose all the analysis/testing reports of water, air, soil,
noise etc. using the MoEF&CCNABL accredited laboratories. All the original
analysis/testing reports should be available during appraisal of the Project.
e) Where the documents provided are in a language other than English, an English
translation should be provided.
0 The Questionnaire for environmental appraisal of mining projects as devised earlier
by the Ministry shall also be filled and submitted.
g) While preparing the EIA for the Proponents and instructions
Page 10 of14SEIAA.TN
1 ? Fr.s tttt
10A
Lr No. SEIAA-TN/I'.No.7238ISEAC/TOR- 844 12019 D ated : t7 .02.2021 SEIAA.TN
for the Consultants issued by MoEF&CC vide O.M. No. J-ll0l3l4l/2006-lA.II(I)
dated 4th August,2009, which are available on the website of this Ministry, should
be followed.
Changes, if any made in the basic scope and project parameters (as submitted in
Form-I and the PFR for securing the TOR) should be brought to the attention of
MoEF&CC with reasons for such changes and permission should be sought, as the
ToR may also have to be altered. Post Public Hearing changes in structure and
content of the draft EIA/EMP (other than modifications arising out of the P.H.
process) will entail conducting the PH again with the revised documentation.
As per the circular no. J-11011161812010-IA.II(I) dated 30.5.2012, certified report
of the status of compliance of the conditions stipulated in the Environment
Clearance for the existing operations of the project, should be obtained from the
Regional Office of Ministry of Environment, Forest and Climate Change, as may be
applicable.
The EIA report should also include (i) surface plan of the area indicating contours
of main topographic features, drainage and mining area, (ii) geological maps and
sections and (iii) sections o mine pi d extemal dumps, if any, clearly
nrepared incorporating the information on following points:
1. Project name and location (Village, District, State, Industrial Estate (if applicable).
2. Process description in brief, specifically indicating the gaseous emission, liquid effluent
and solid and hazardous wastes.
Measures for mitigating the impact on the environment and mode of discharge or disposal.
Capital cost of the project, estimated time of completion.
The proponent shall furnish the contour map of the water table detailing the number of
wells located around the site and impacts on the wells due to mining activity.
A detailed study of the lithology of the mining lease area shall be furnished.
Details of village map, "A" register and FMB sketch shall be fumished.
Detailed mining closure plan for the project approved by the Geology of Mining
department shall be shall be
h)
D
i)
J.
4.
5.
6.
7.
8.
Page 11 of14
i-;x.:
1 7 FEBIII
EIA report.
11A
Lr No.SEIAA-TNE.No.7238/SEAC/TOR- 944 t20tg Dated : t7 .02.2021 SEIAA.TN
9. Obtain a letter /certificate from the Assistant Director of Geology and Mining standing
that there is no other Minerals/resources like sand in the quarrying area within the
approved depth of mining and below depth of mining and the same shall be furnished in
the EIA report.
10. EIA report should strictly follow the Environmental Impact Assessment Guidance Manual
for Mining of Minerals published February 2OlO.
1 1. Detail plan on rehabilitation and reclamation carried out for the stabilization and
restoration of the mined areas.
12. The EIA study report shall include the surrounding mining activity, if any.
13. Modeling study for Air, Water and noise shall be carried out in this field and incremental
increase in the above study shall be substantiated with mitigation measures.
14. A study on the geological resourcepaV
16. Impact of soil erosion, soil physical t and biological property changes may be
assumed.
17. Site selected for the project - Natuie I (single/double crop), barren,
Gorrt./ private land, status of is acquisition, nearby (in 2-3 km.) water body, population,
with in l0km other industries, accessibility, (note - in case of
industrial estate this i
l8.Baseline environmental data - surface and ground water quality,
condition of the nearby populationcharacteristic, flora and fauna,
19. Identification of hazards in handling, ing and storage of hazardous material and
safety system provided to mitigate the risk.
20. Likely impact of the project on air, water, land, flora-fauna and nearby population
21. Emergency preparedness plan in case of natural or in plant emergencies
22. Issues raised during public hearing (if applicable) and response given
23. CER plan with proposed expenditure.
24. Occupational Health Measures
25. Post project monitoring plan
26.The project proponent shall carry out detailed hydro geological study through
intuitionsA.lABET Accredited agencies.
27. A detailed report on the
also submit the proposal
already undertaken is to be furnished and
ailable shall be carried out and reported.
soil
Page 12 of14SEIAA.TN
1 7 FEB 20?1
12A
Lr No. SEIAA-TN/f'.No. 7238ISEAC/TOR- 8 4 4 I 20 19 D ated : 17 .02.2021 SEIAA.TN
28. The proponent shall propose the suitable control measure to control the fugitive emissions
during the operations of the mines.
29. A specific study should include impact on flora & fauna, disturbance to migratory pattem
of animals.
30. Reserve funds should be earmarked for proper closure plan.
31. A detailed plan on plastic waste management shall be furnished. Further, the proponent
should strictly comply with, Tamil Nadu Govemment Order (Ms) No.84 Environment and
forests (EC.2) Department dated 25.06.2018 regarding ban on one time use and throw
away plastics irrespective of thickness with effect from 01.01.2019 under Environment
(Protection) Act, 1986. In this connection, the project proponent has to furnish the action
plan.
b.
A note confirming compliance
sections / pages of the EIA report
All documents may be properly
page numbering.
Where data are presented in the
were collected and the sources
d. While preparing the EIA report,
relevant
with index, page numbers and continuous
e.
the consultants issued by MoEF J-11013/41 12006-lL.ll (I) dated
4th August,2009, which are av of this Ministry should also be
followed.
The consultants involved in the preparation of EIA/EMP report after accreditation with
Quality Council of India (QCl)A{ational Accreditation Board of Education and Training
(NABET) would need to include a certificate in this regard in the EIA/EMP reports
prepared by them and data provided by other organization/Laboratories including their
status of approvals etc. In this regard circular no F. No.J -1101317712004-IA-II(I) dated
2nd December,2009, 18th March 2010,28ft May 2010,28th June 2010,3l't December
2010 & 30n September 2011 posted on the Ministry's website http://www.moef.nic.in/
may be referred.
VMEMBER SECRETARY
SEIAA.TNPage 13 of14
I T FEE 2O2I
13A
Lr No. SEIAA-TN/F.No. 7238/sEAC/TOR - B 4 4 tzltg Dated : t7 .02.2021 SEIAA-TN
After preparing the EIA (as per the generic structure prescribed in Appendix-Ill
of the EIA Notification, zo06)covering the above mentioned points, the
proponent will take further necessary action for obtaining environmental
clearance in accordance with the procedure prescribed under the EIA
Notification,2006.
The final EIA report shall be submitted to the SEIAA, Tamil Nadu for obtaining
Environmental Clearance.
TheToRsprescribedshallbevalidfor@fromthedateofissue, for submission of the EIA/EMp report as per oMNo.J-l 101314112006-14-
II(I)(part) dated 29th Augus t, 2017 .
WMEMBER SECRETARY
SEIAA-TNCopy to:
l. The Additional Chief Environment & Forests Department,
-9.Govt. of Tamil Nadu, Fort
2. The chairman, central pollution tontrol Board, parivesh Bhavan,
CBD Cum-O e111i I tOO32.
3. The Member Board,
76, Mount Salai, Guindy, Chennai_600 032.
4. The APCCF (C), Regional CC (SZ), 34, HEpC Building, ft& 2nd
Floor, Cathedral Garden Ro am, Chenn ai _34.
5. Monitoring cell, IA Division, Ministry of Environment, Forests & cc,Paryavaran Bhavan, CGO Complex, New Delhi I10003
6. The District Collector, Tiruvanamalai District.
7. Stock File.
/.s/E/.ql
!t 1 ? tEB 1$11
Page 14 of 14
14A
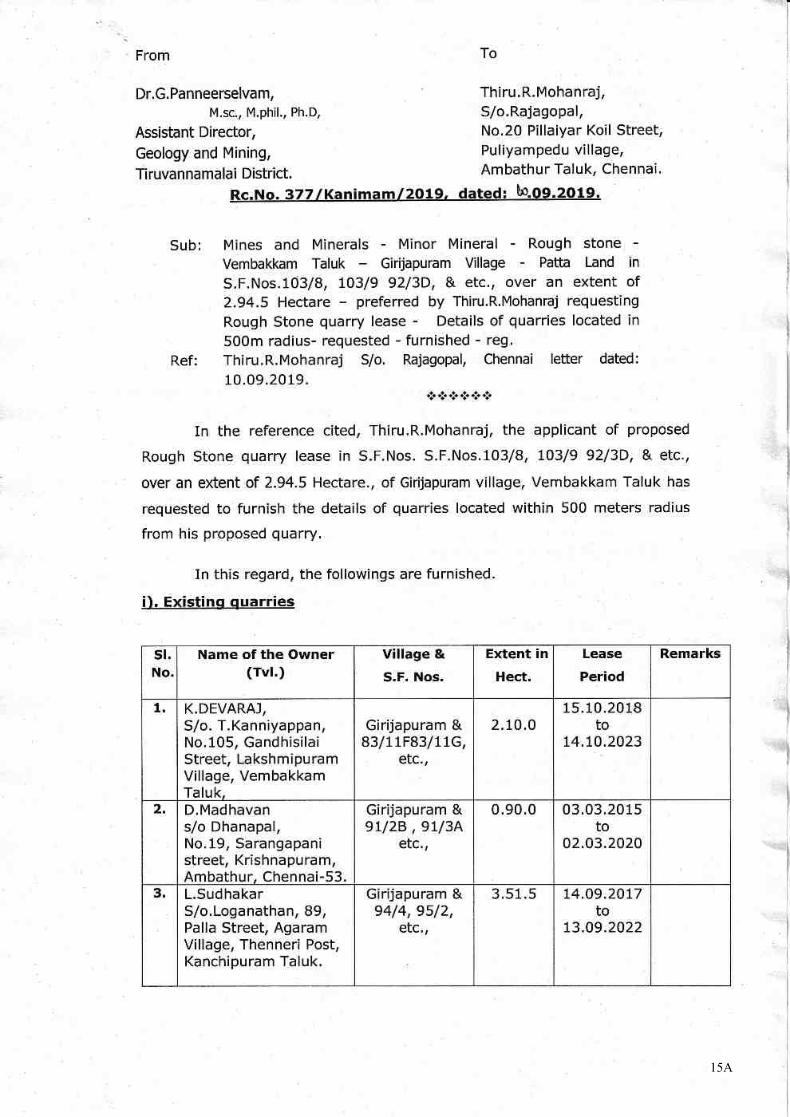
15A
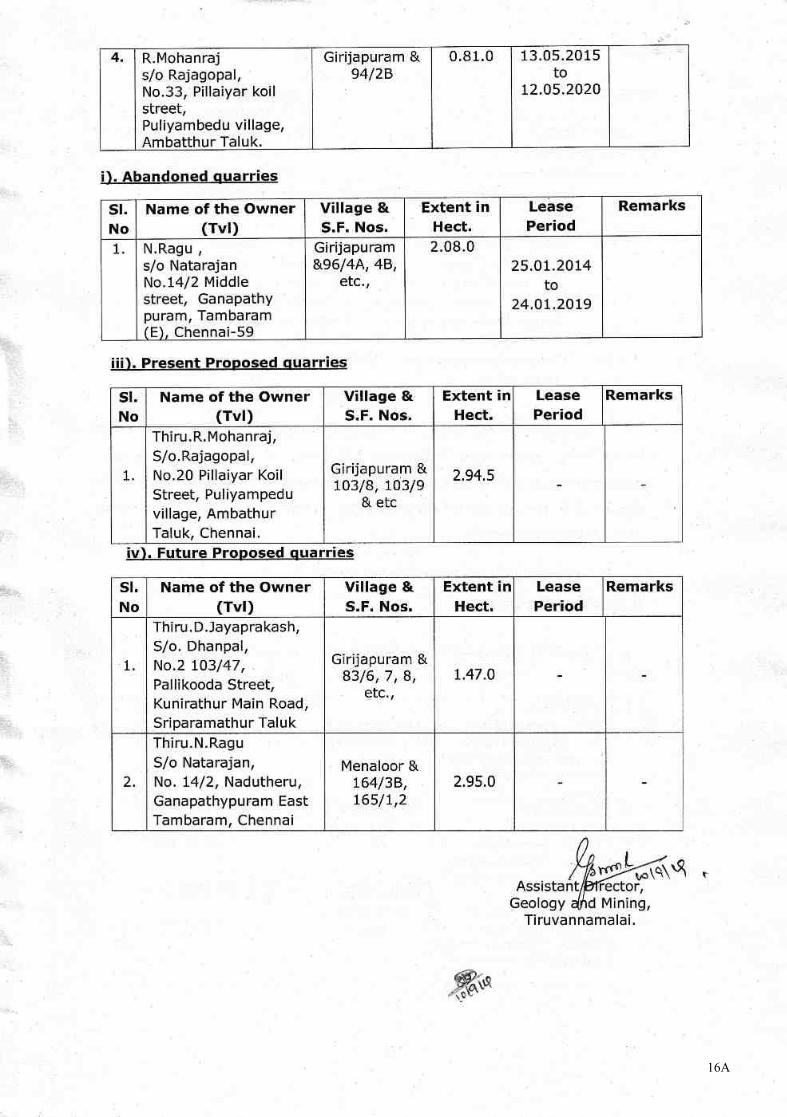
16A
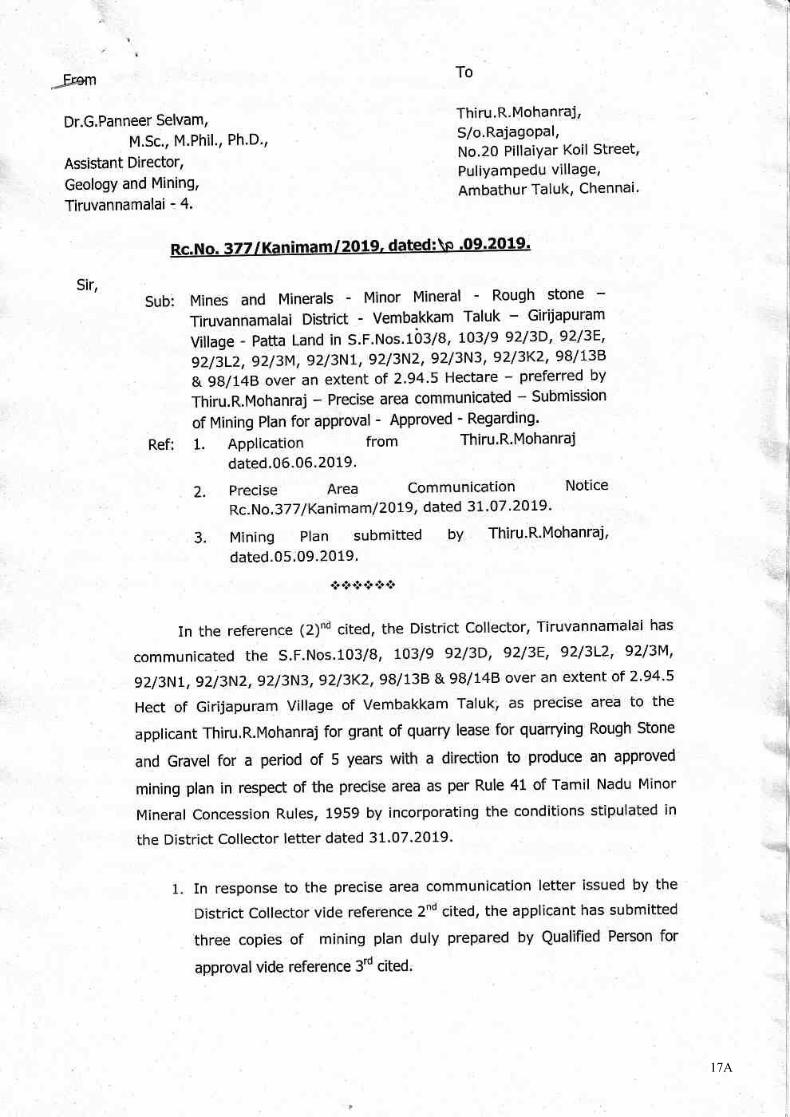
17A
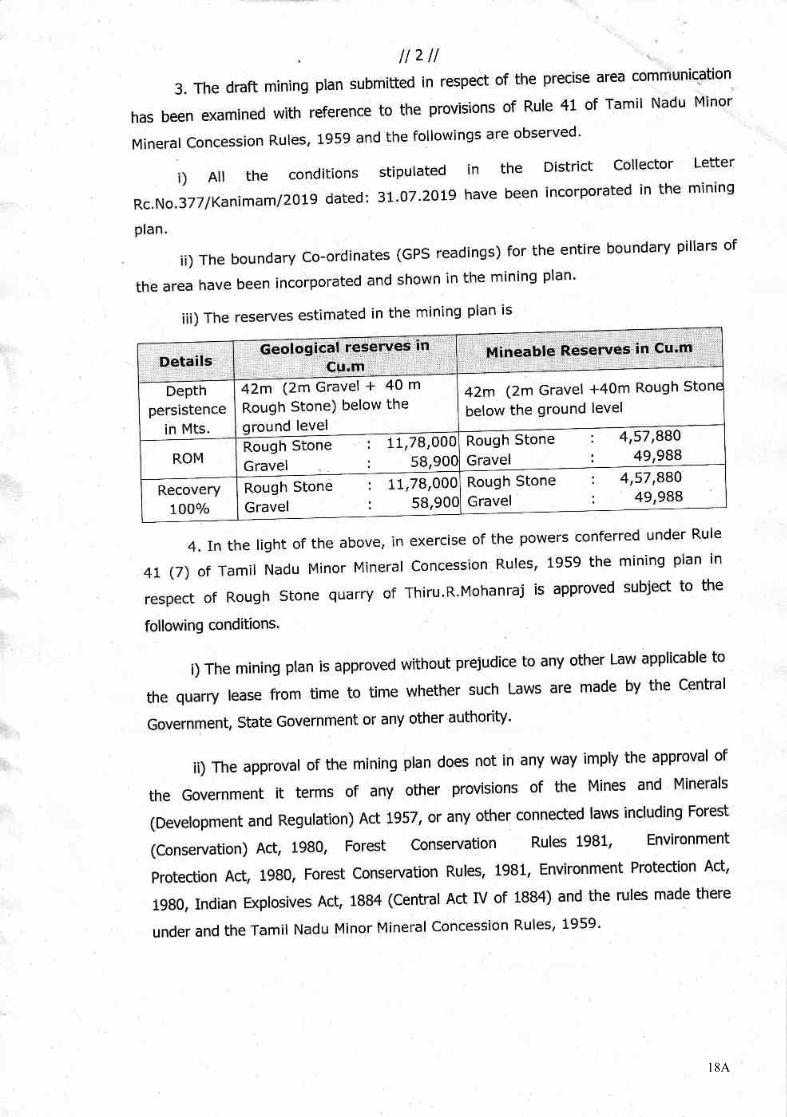
18A
19A
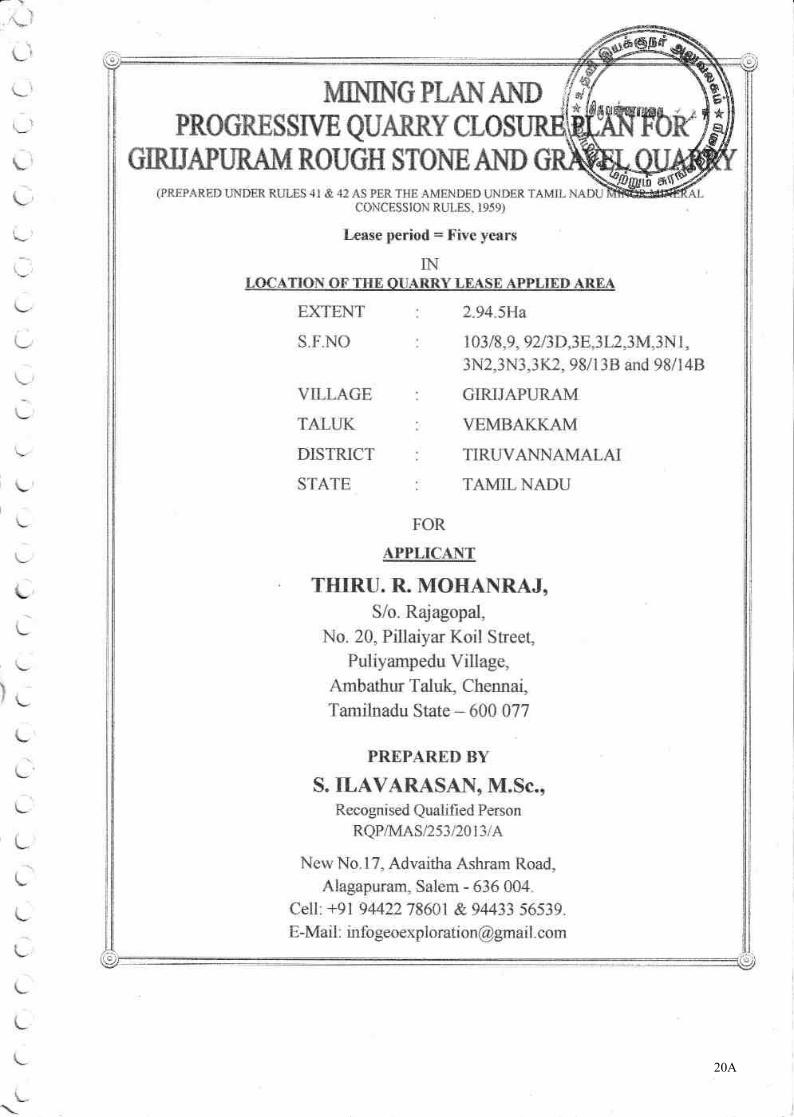
20A
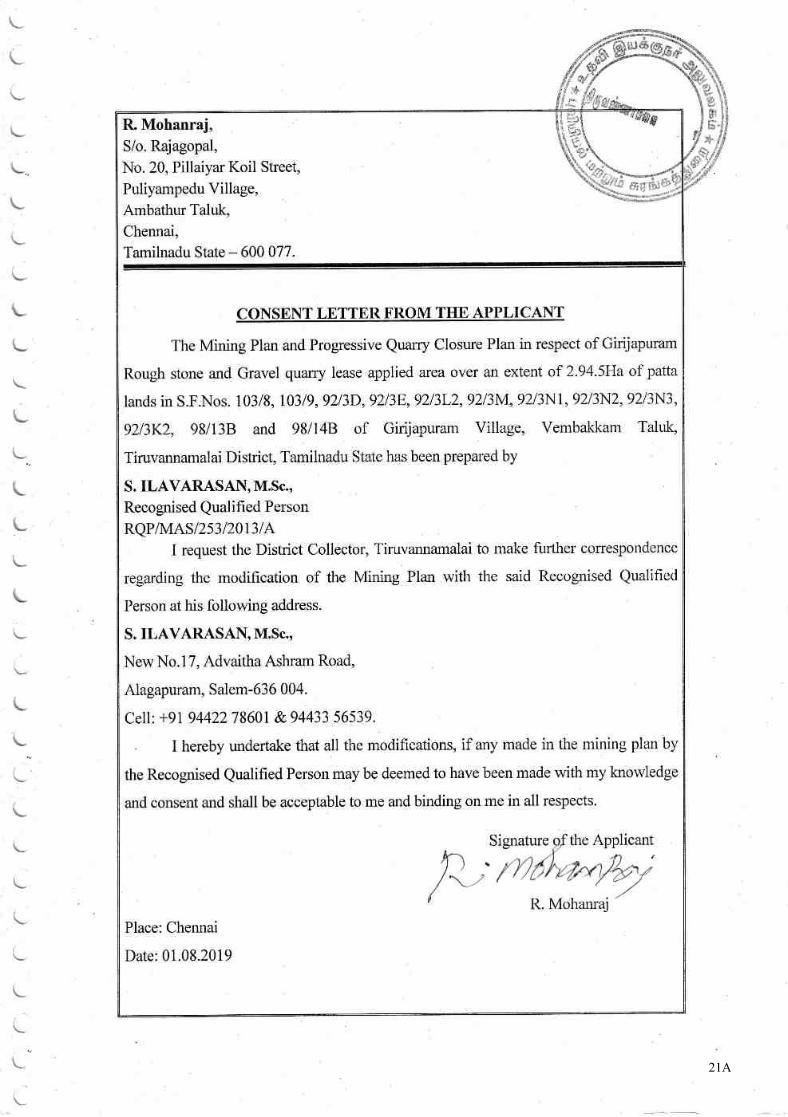
21A
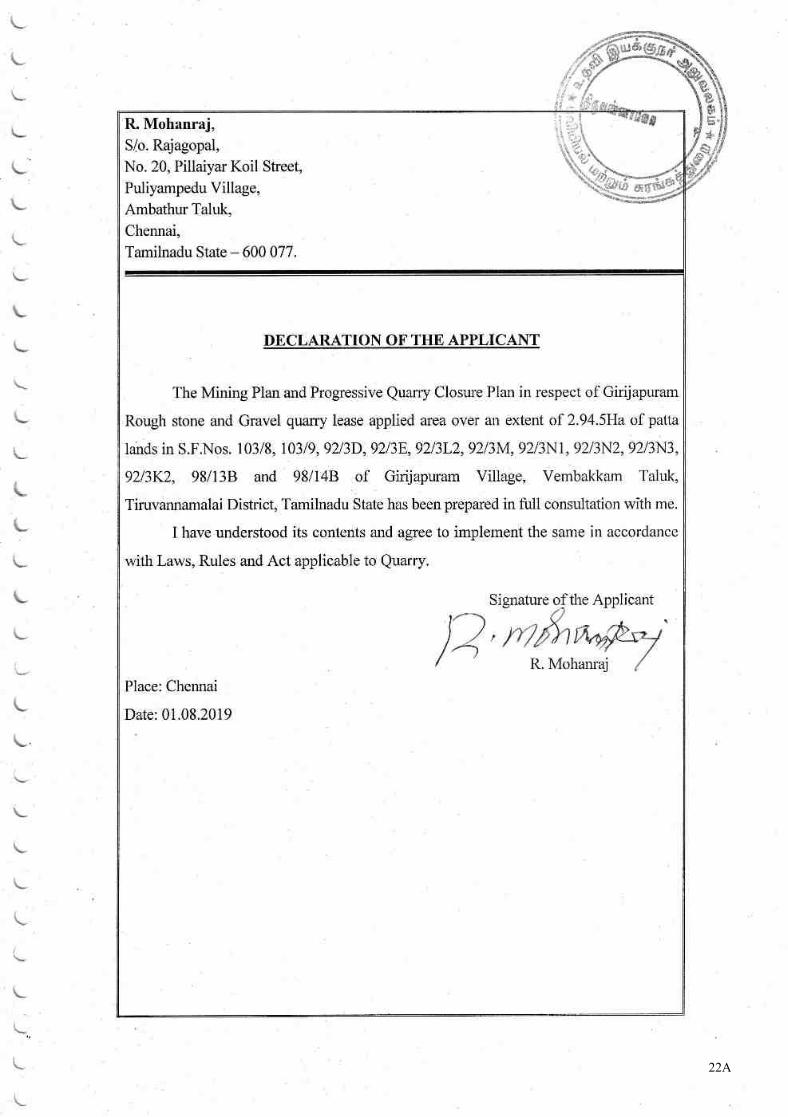
22A
23A
24A
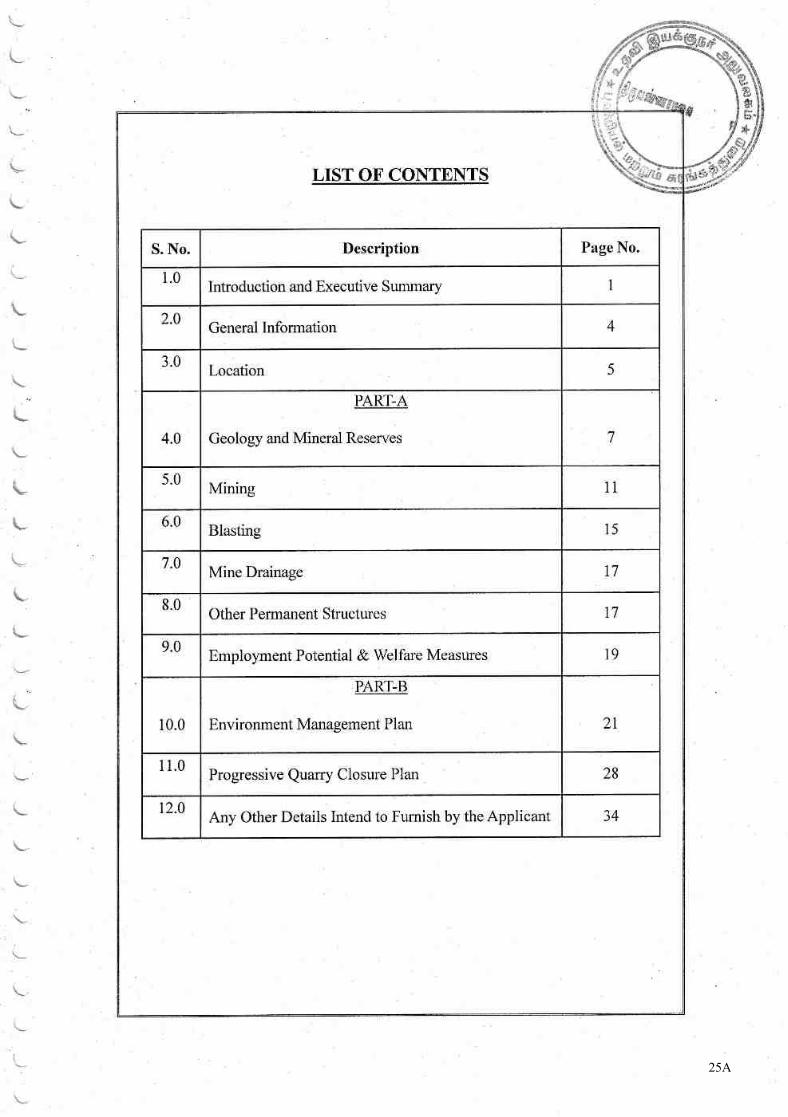
25A
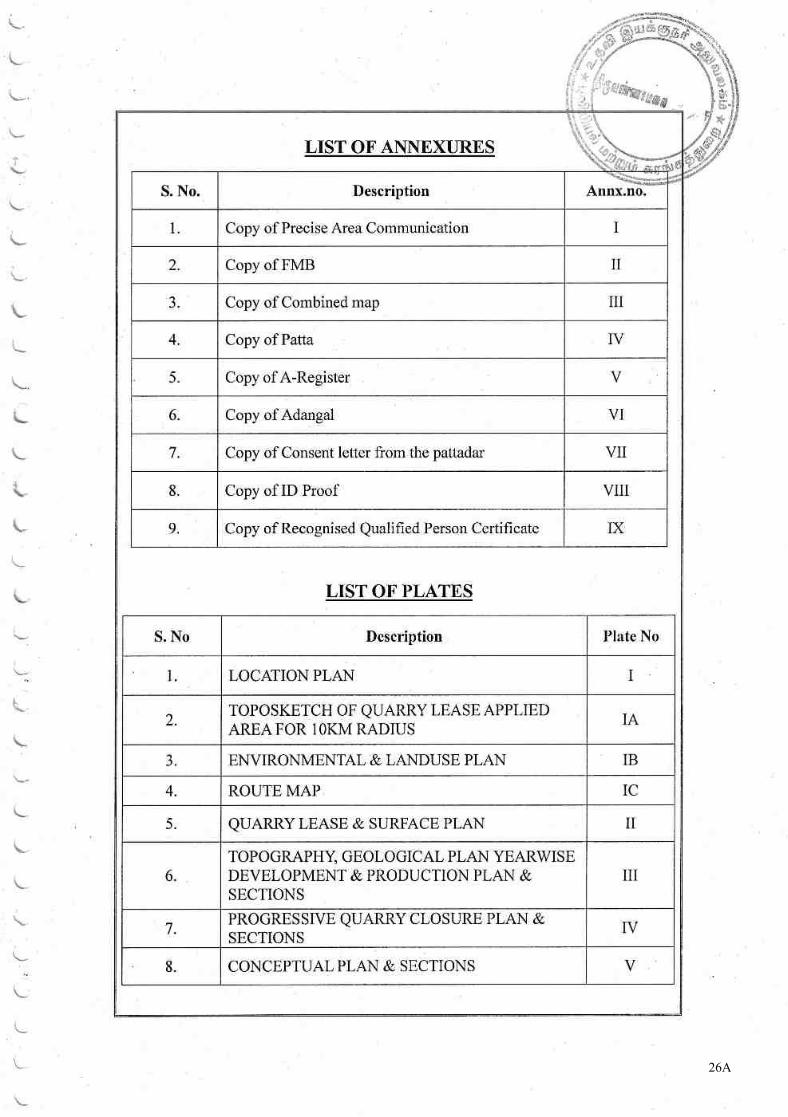
26A
27A
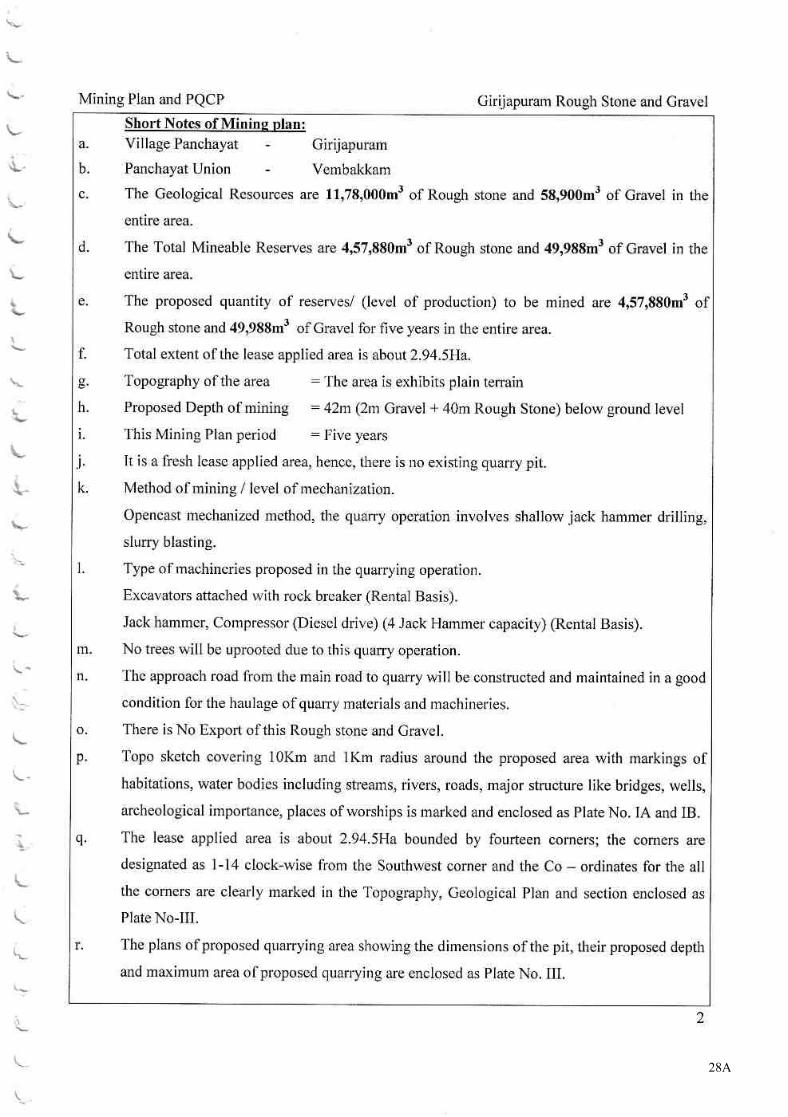
28A
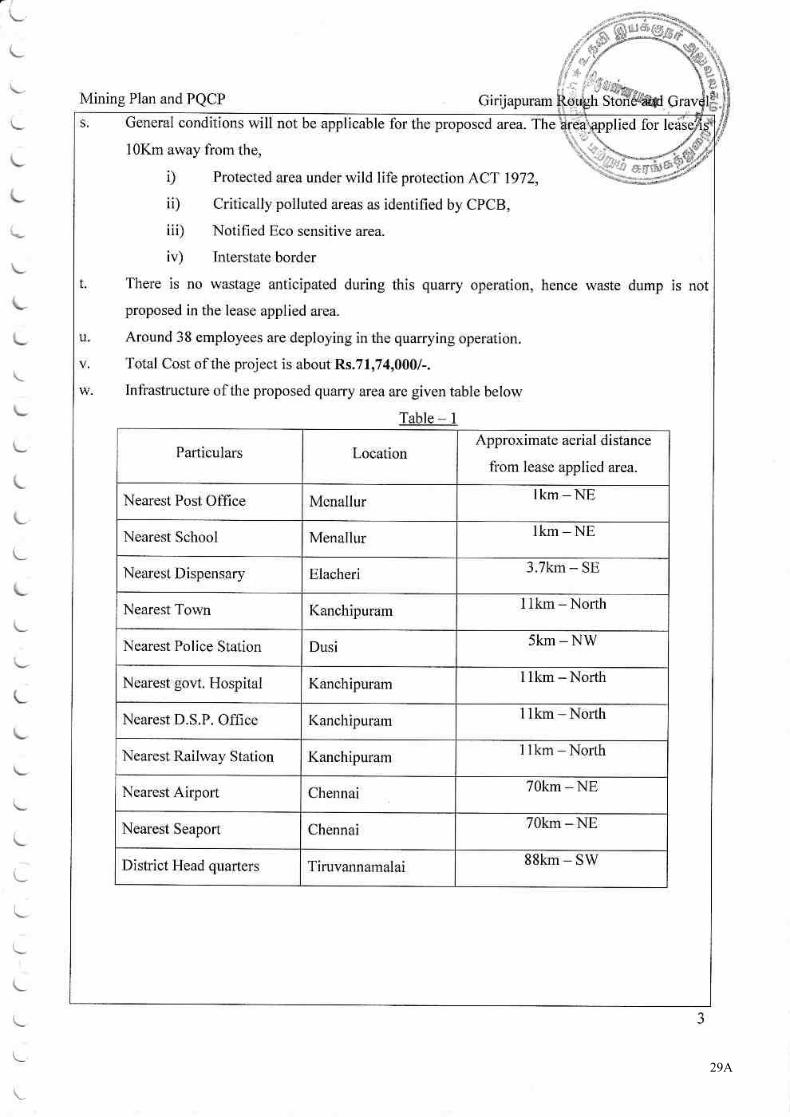
29A
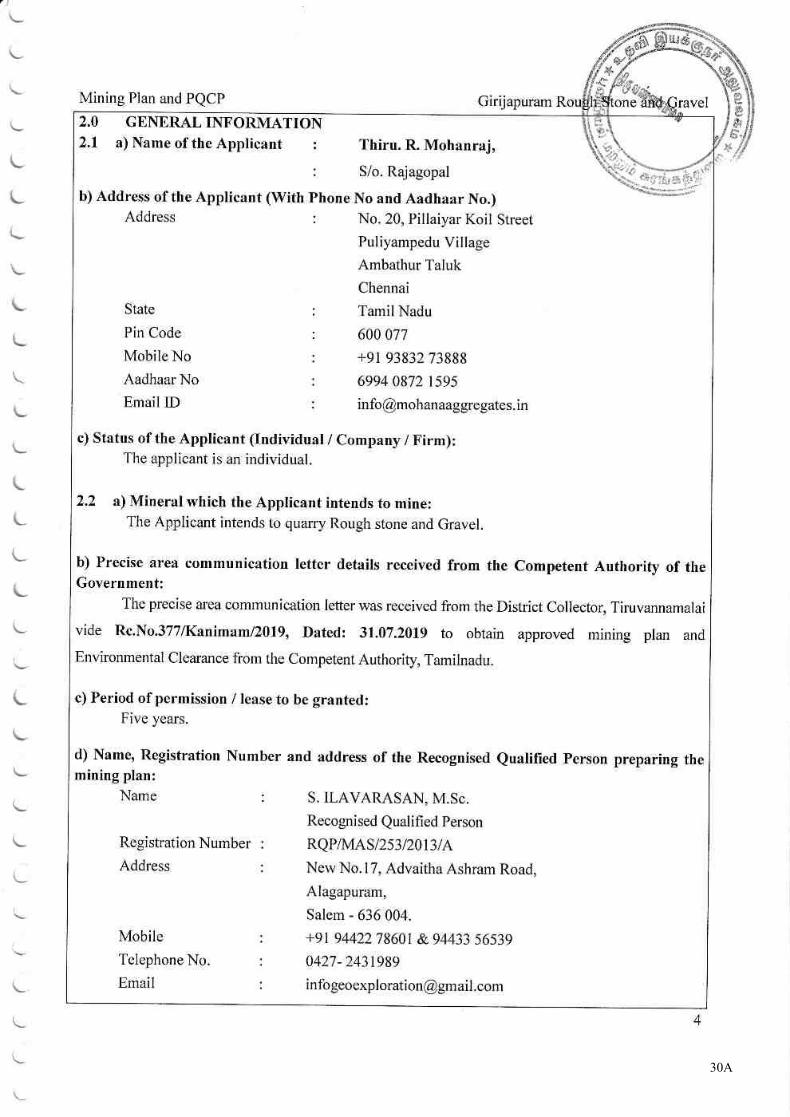
30A
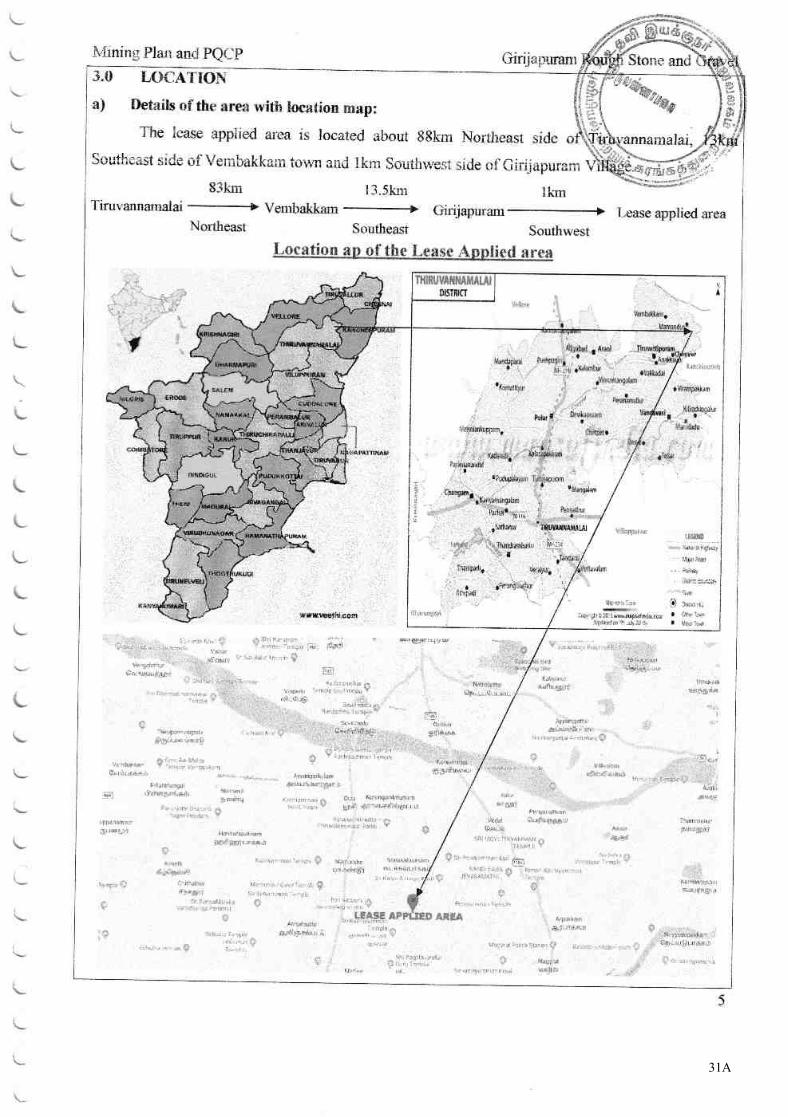
31A
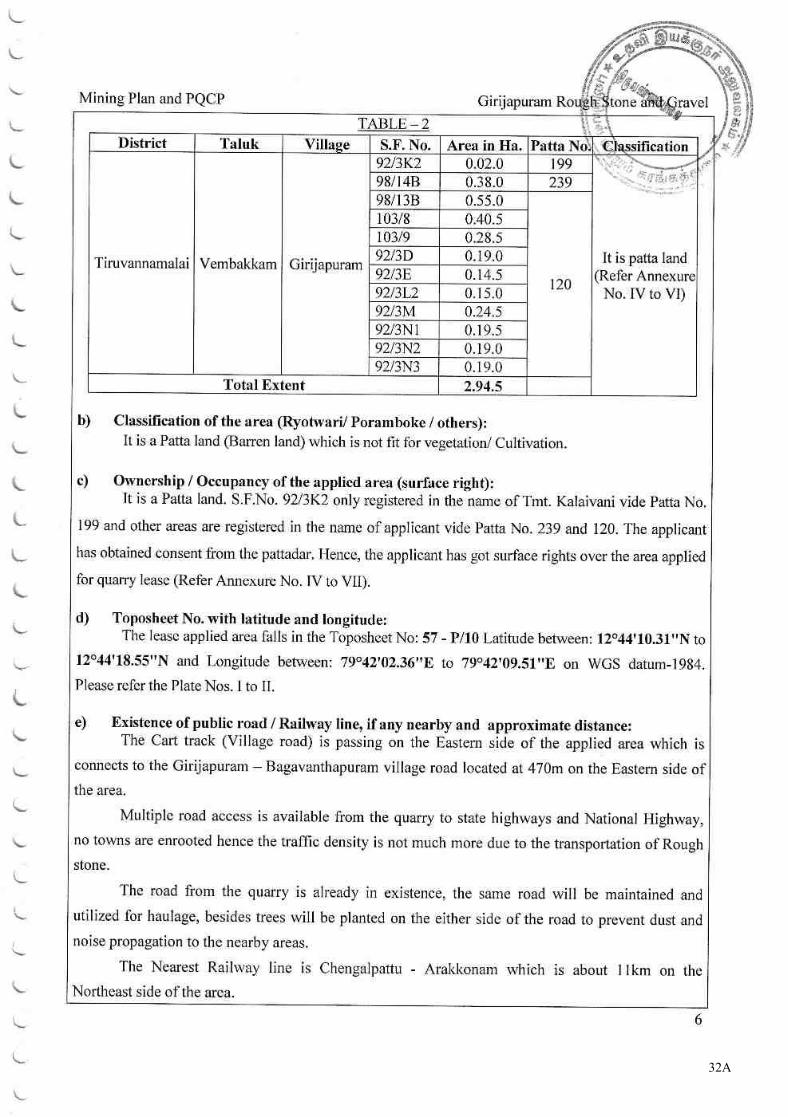
32A
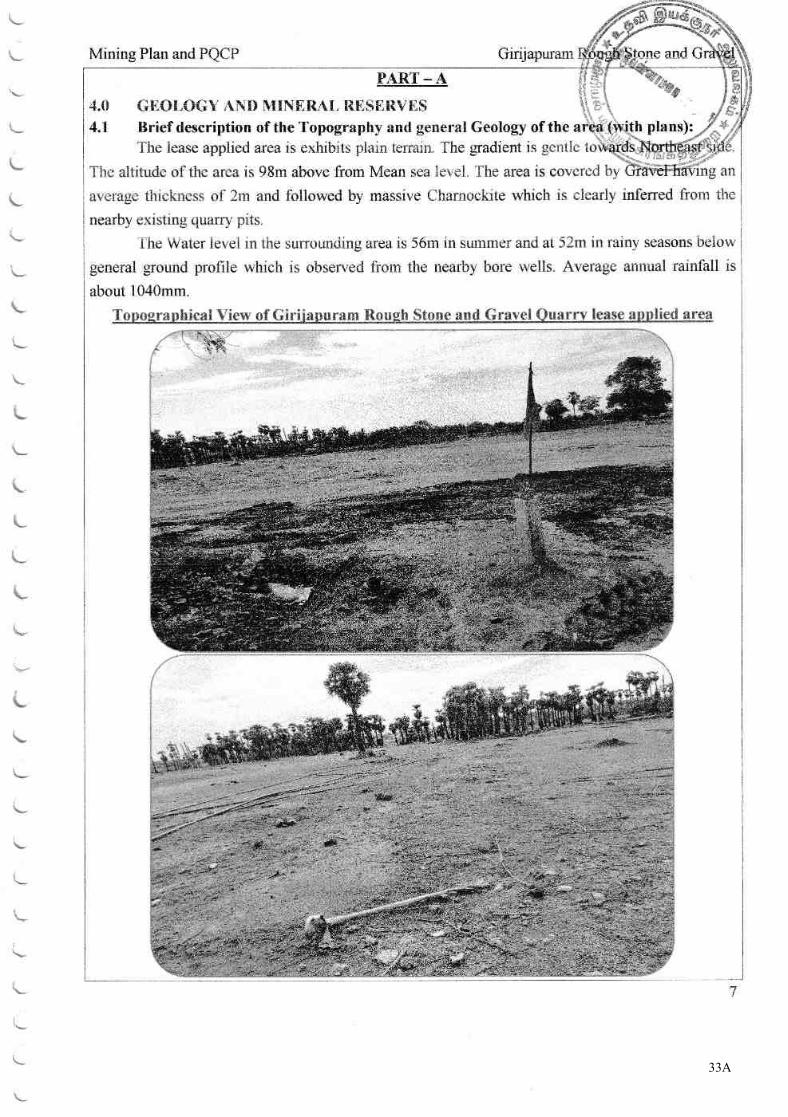
33A
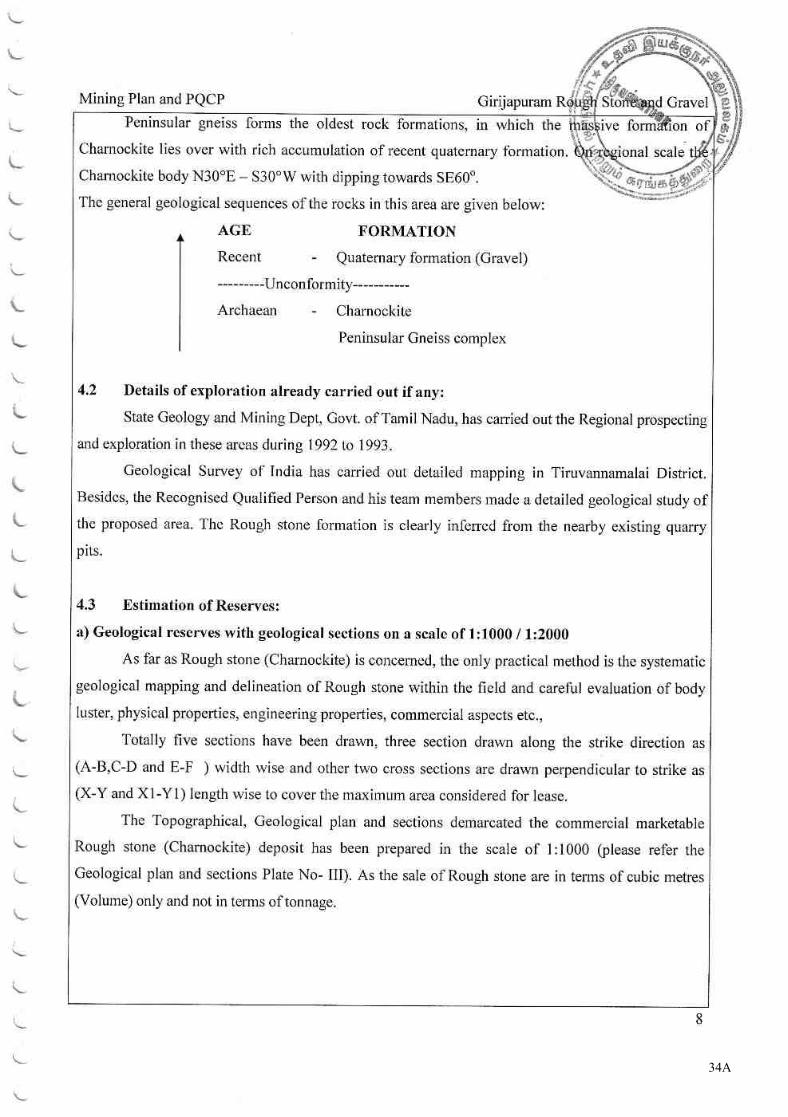
34A
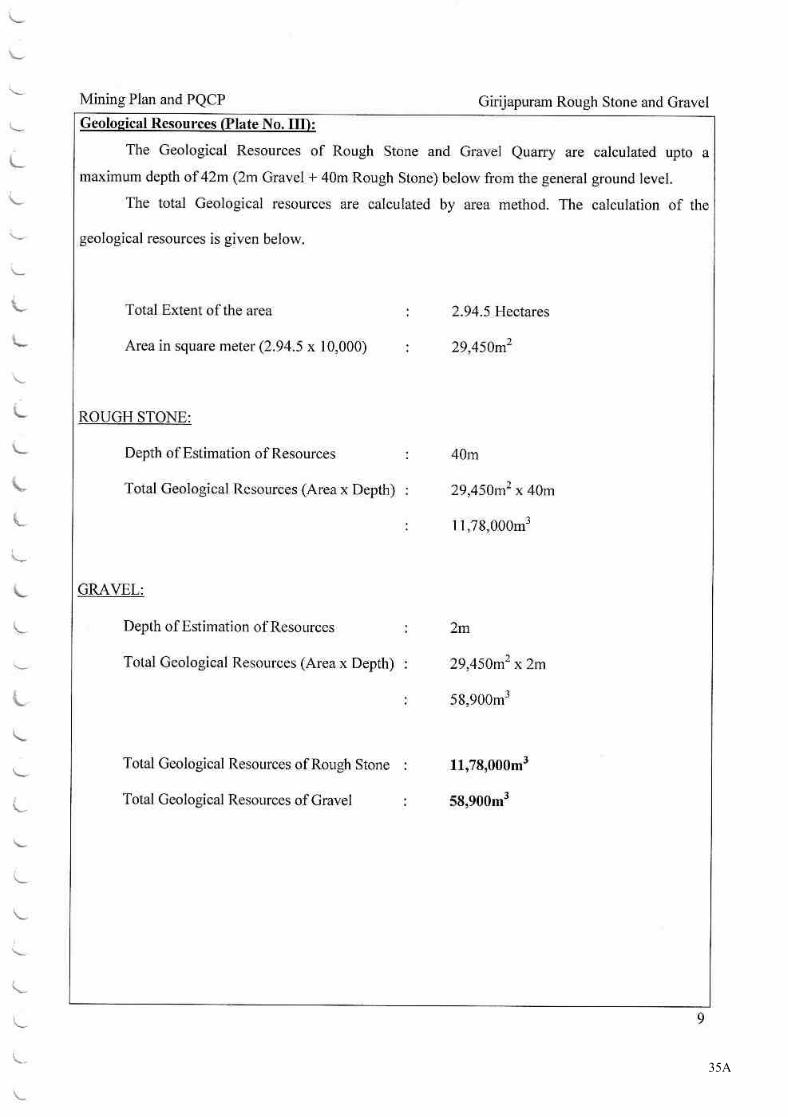
35A
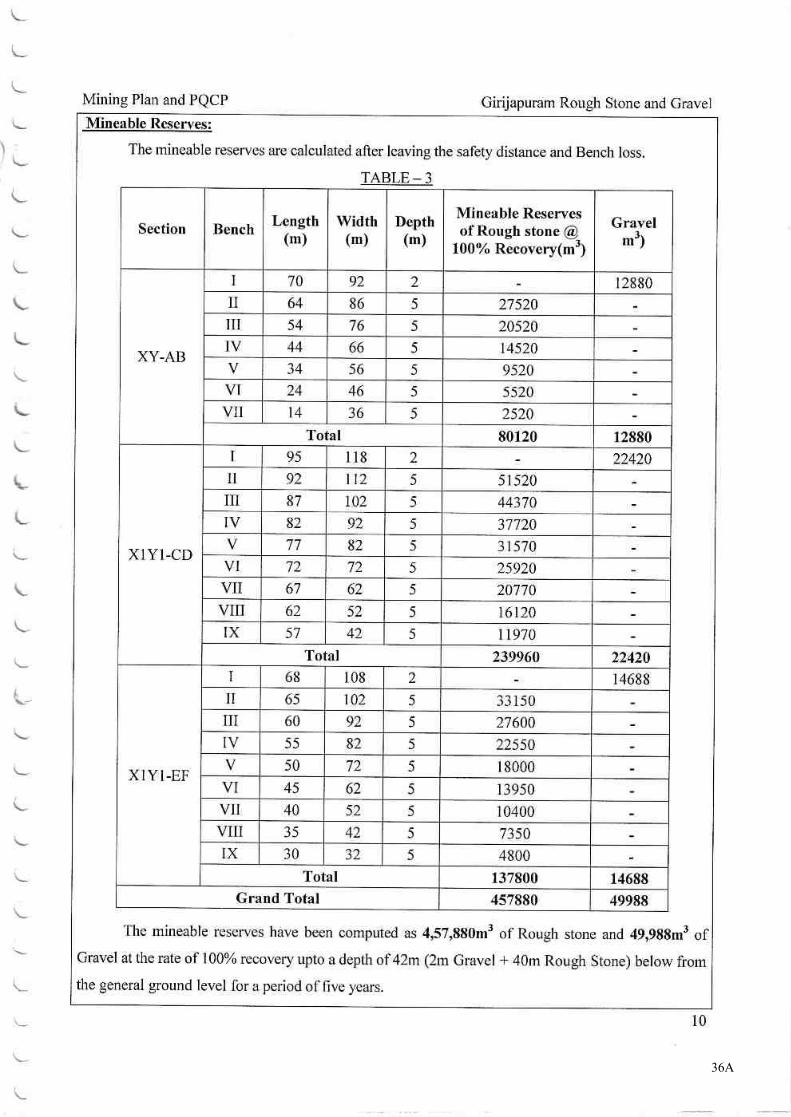
36A
37A
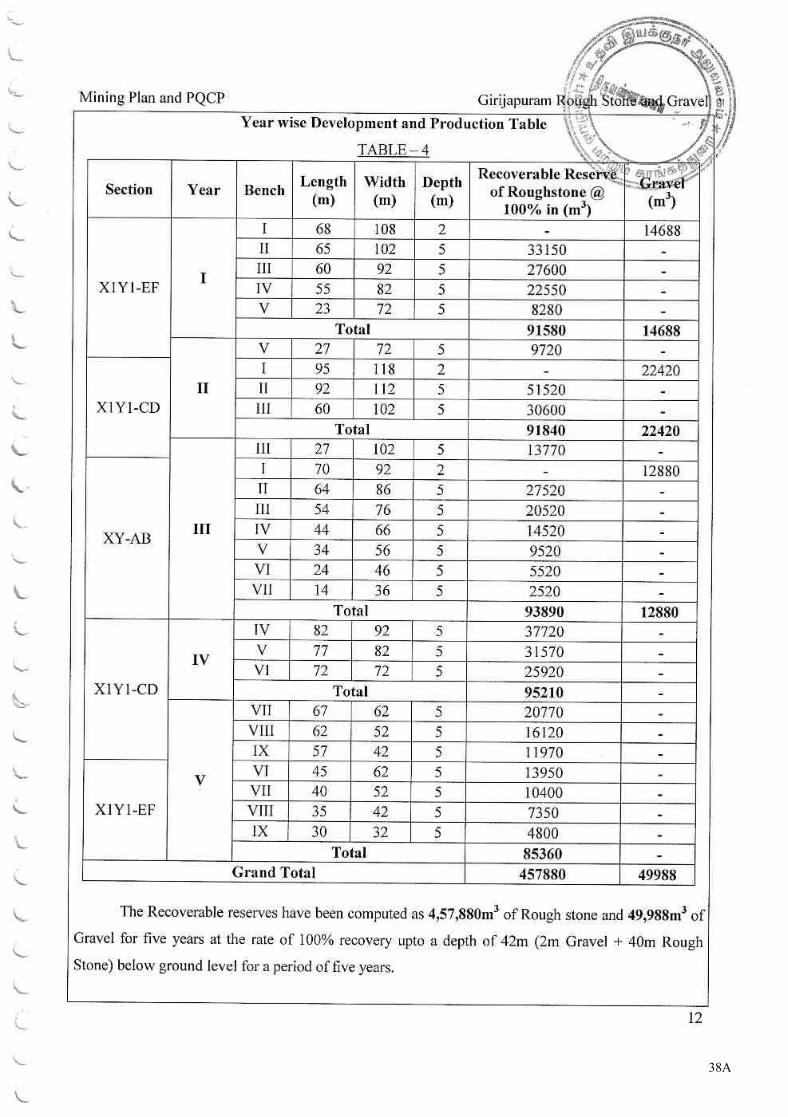
38A
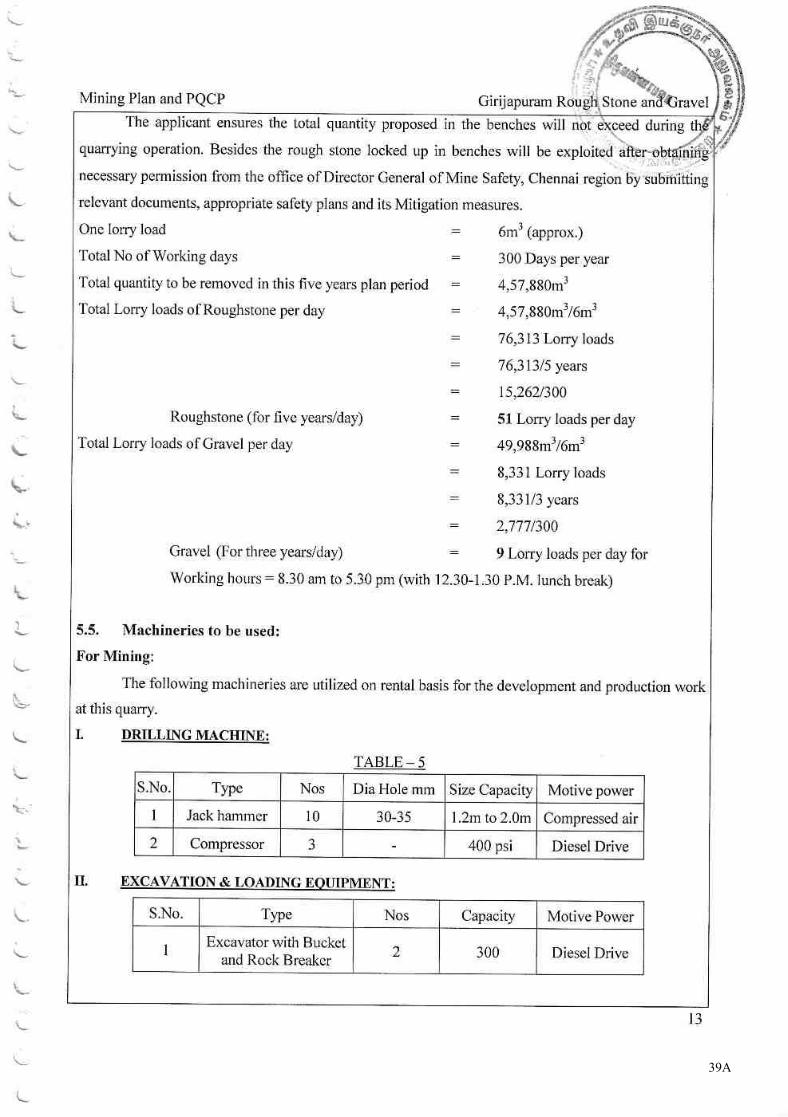
39A
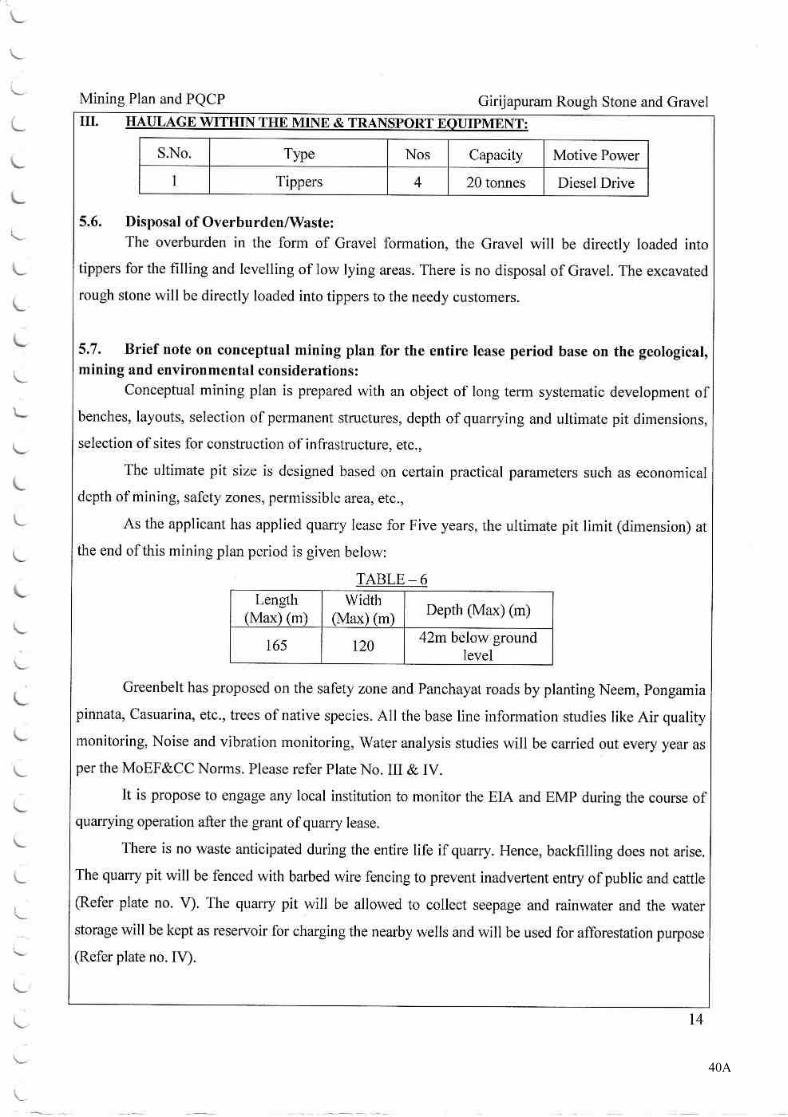
40A
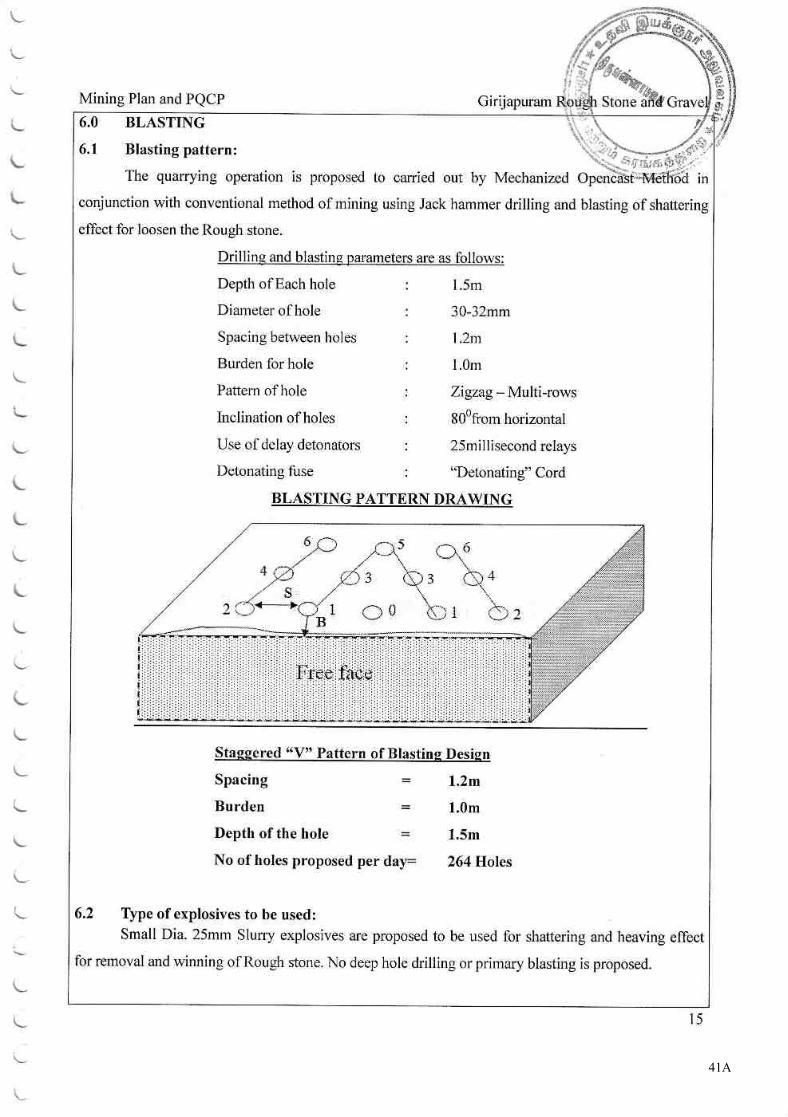
41A
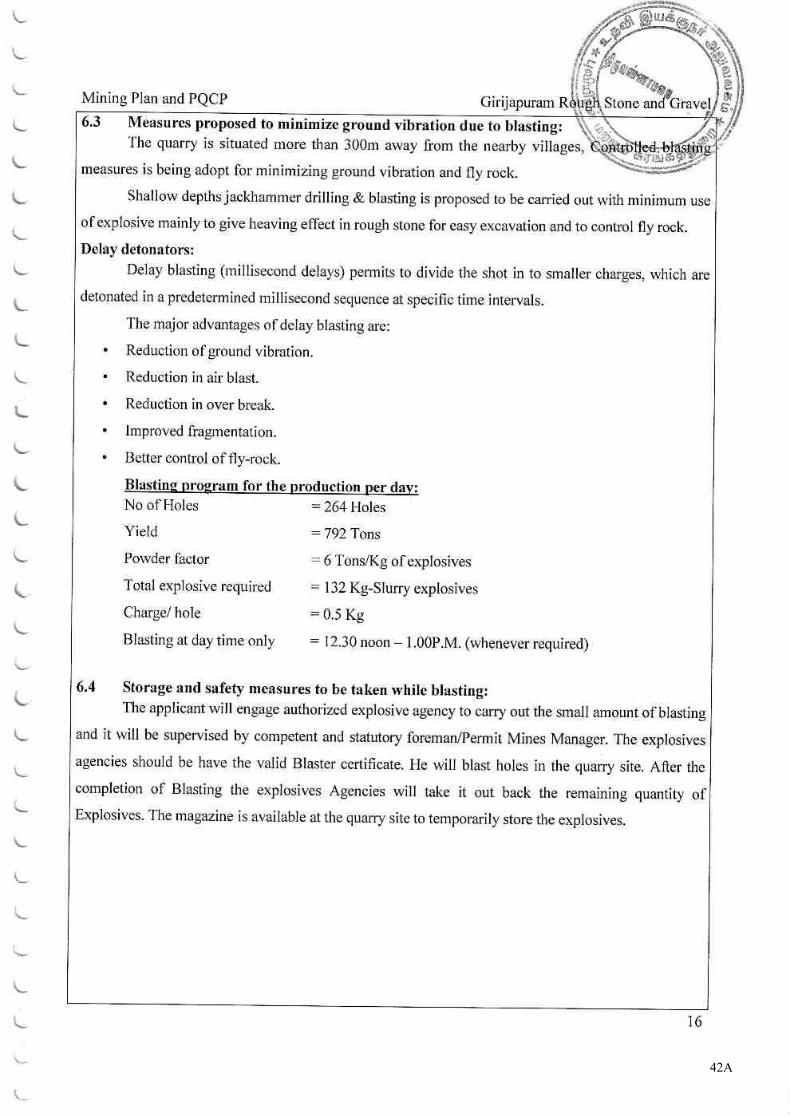
42A
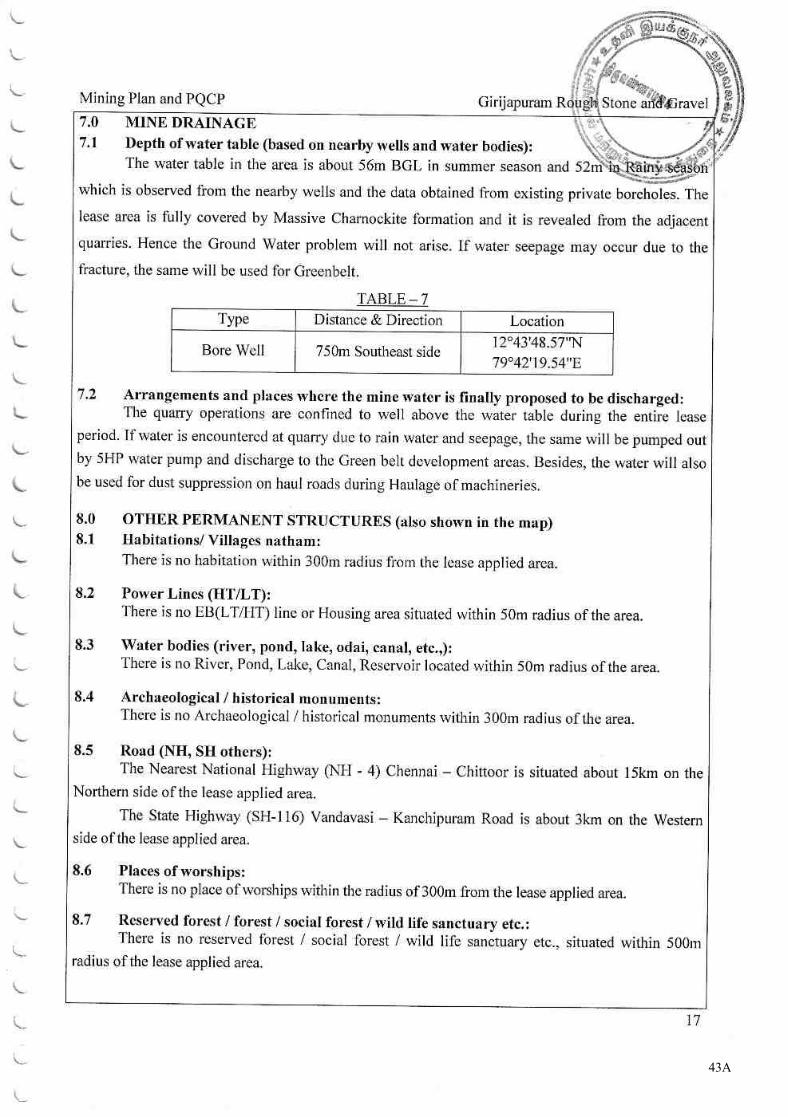
43A
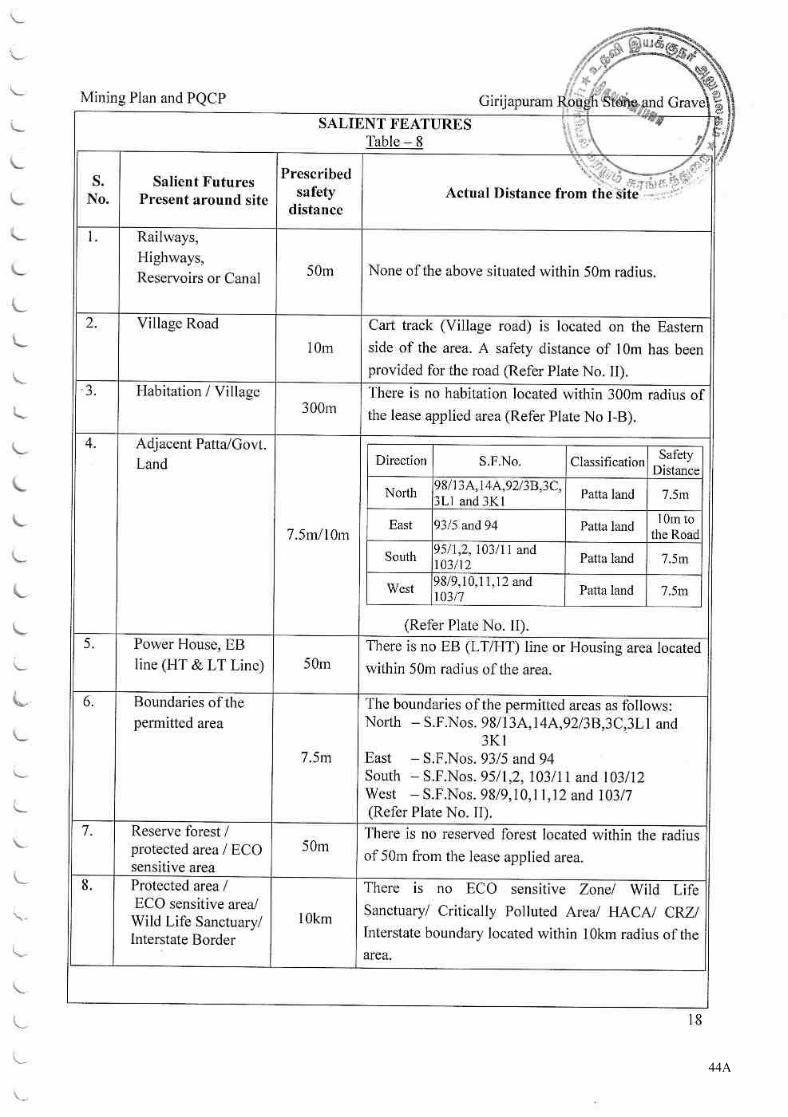
44A
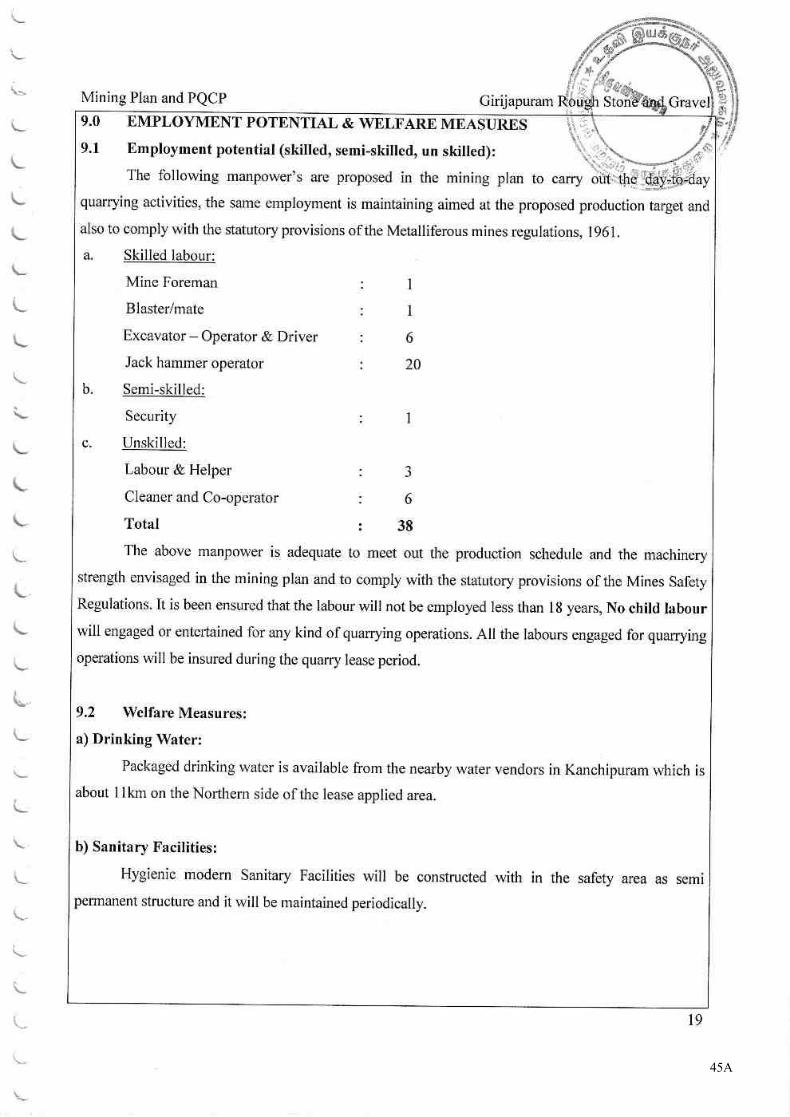
45A
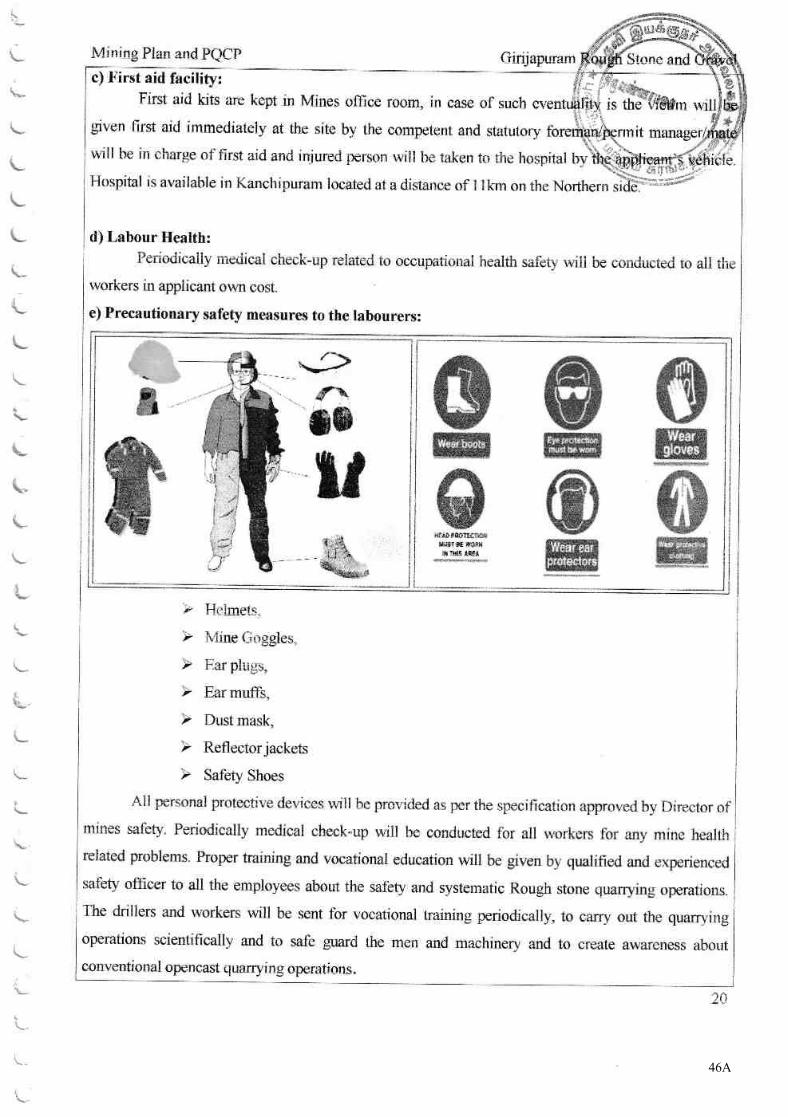
46A
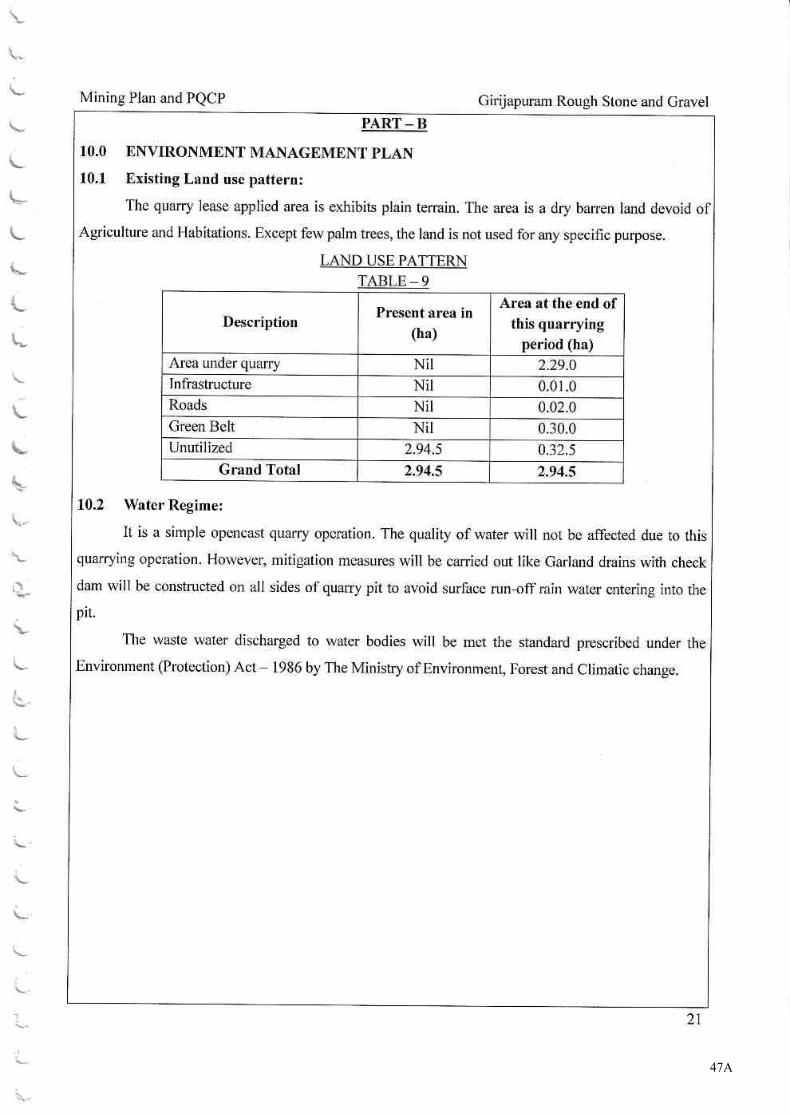
47A
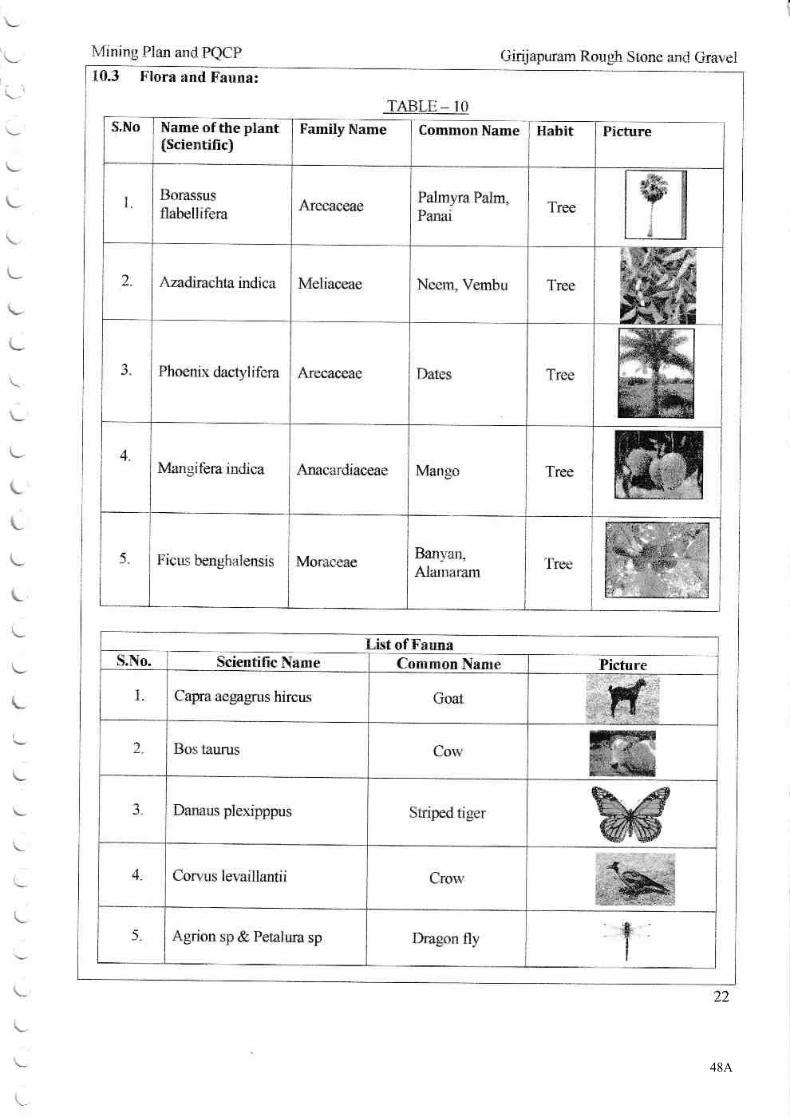
48A
49A
50A
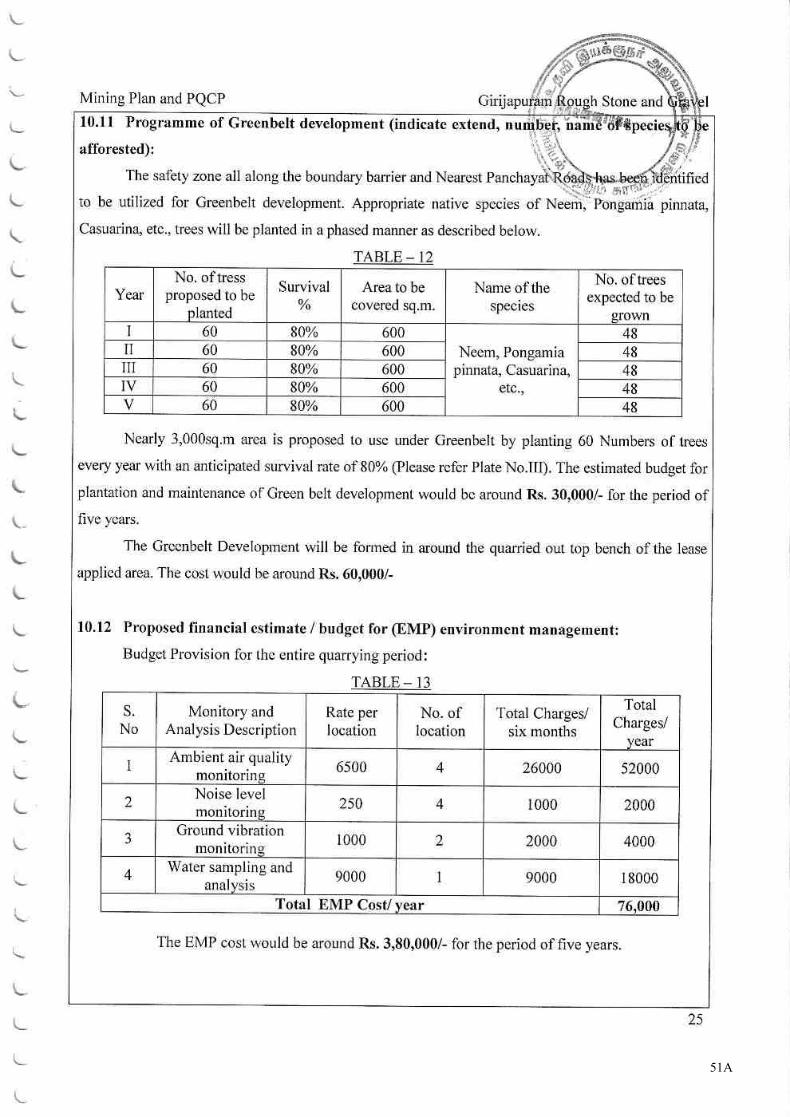
51A
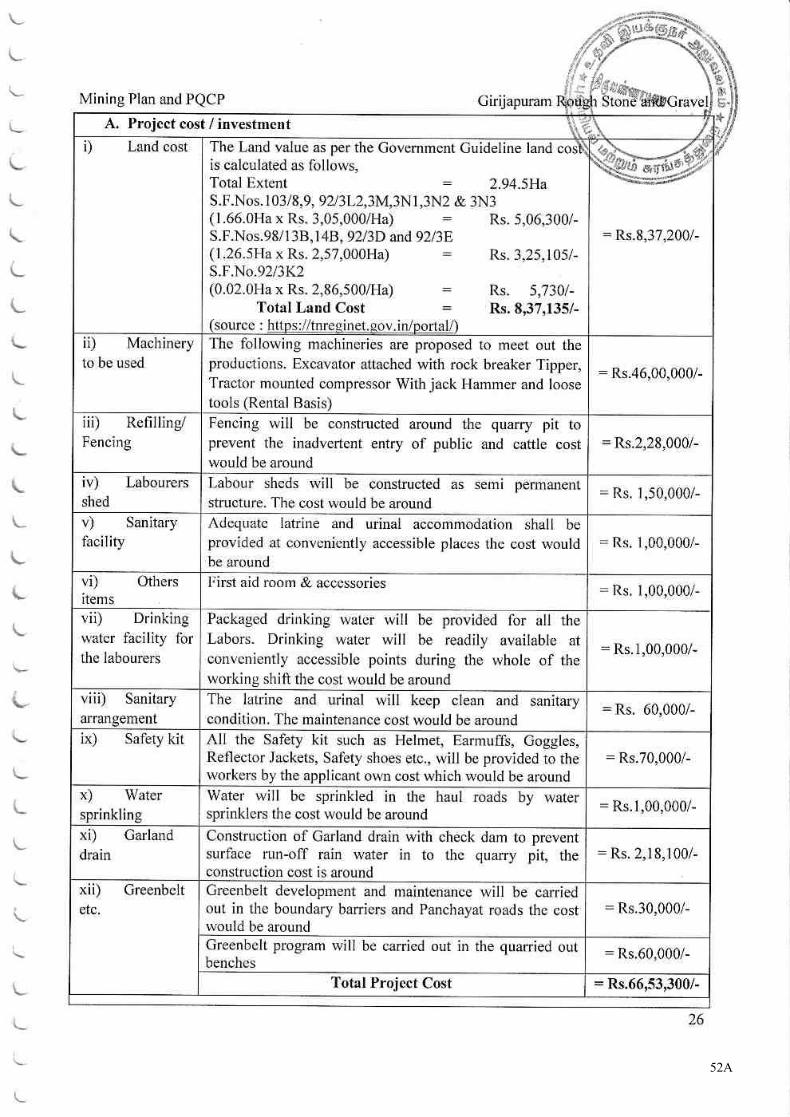
52A
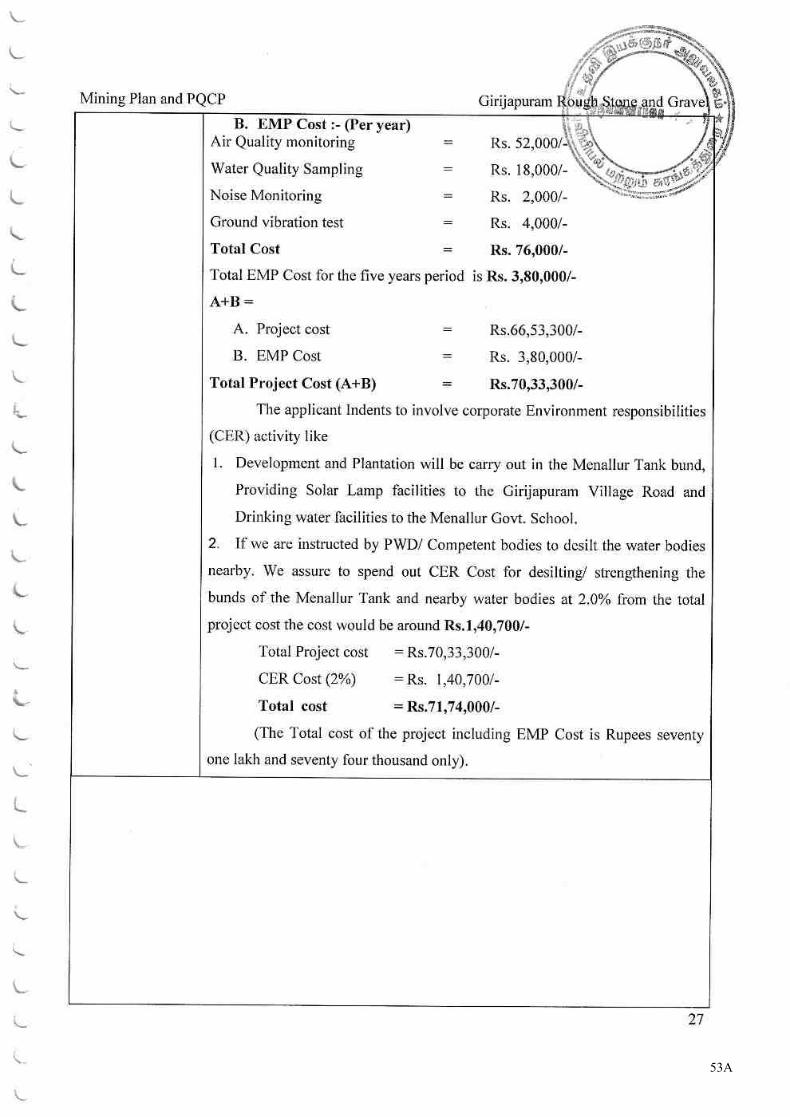
53A
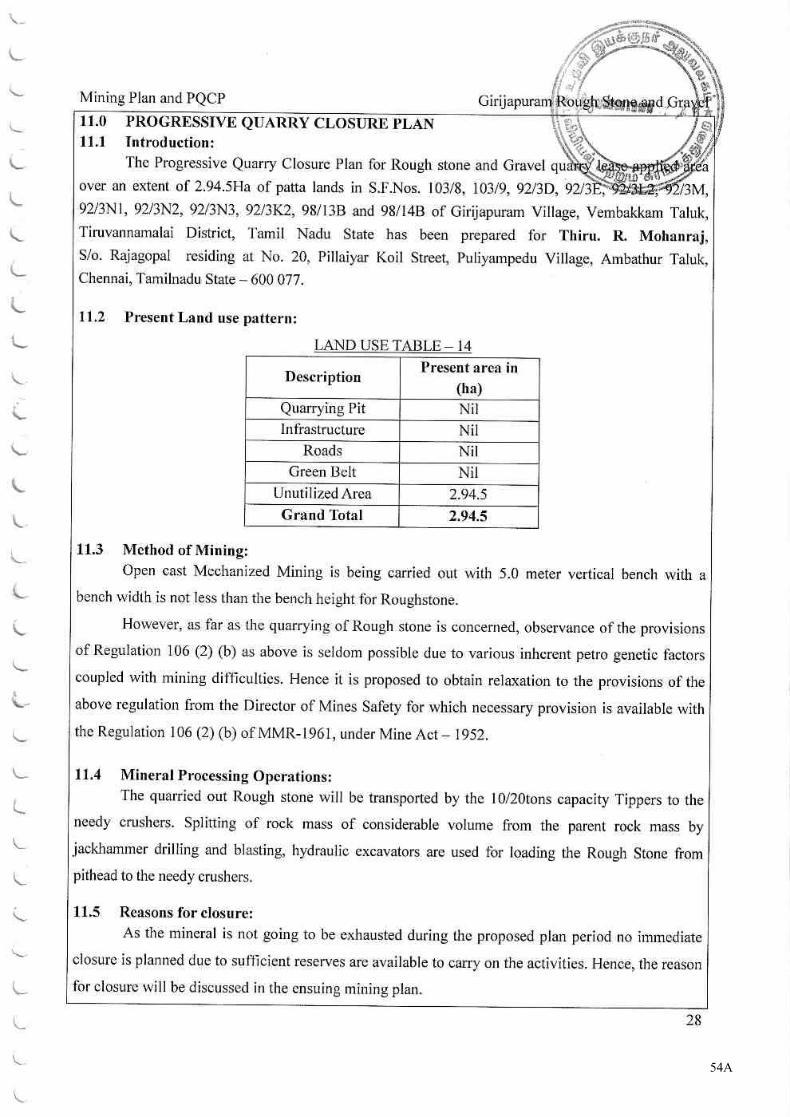
54A
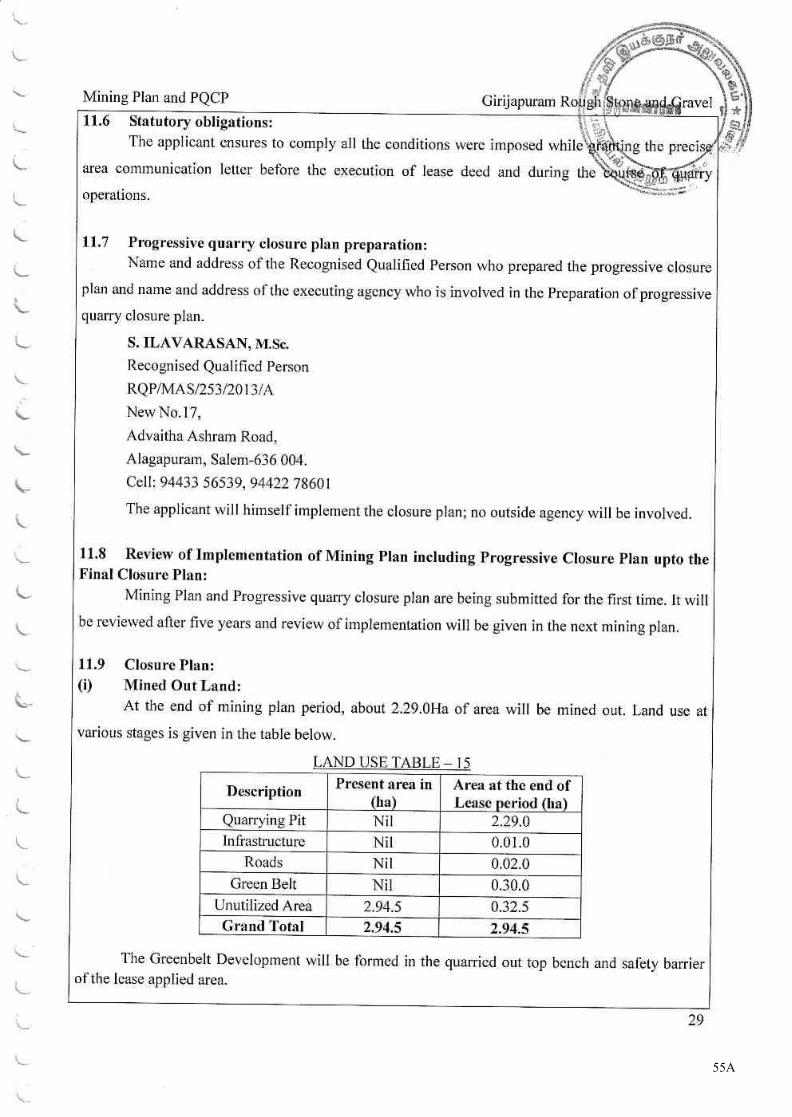
55A
56A
57A
58A
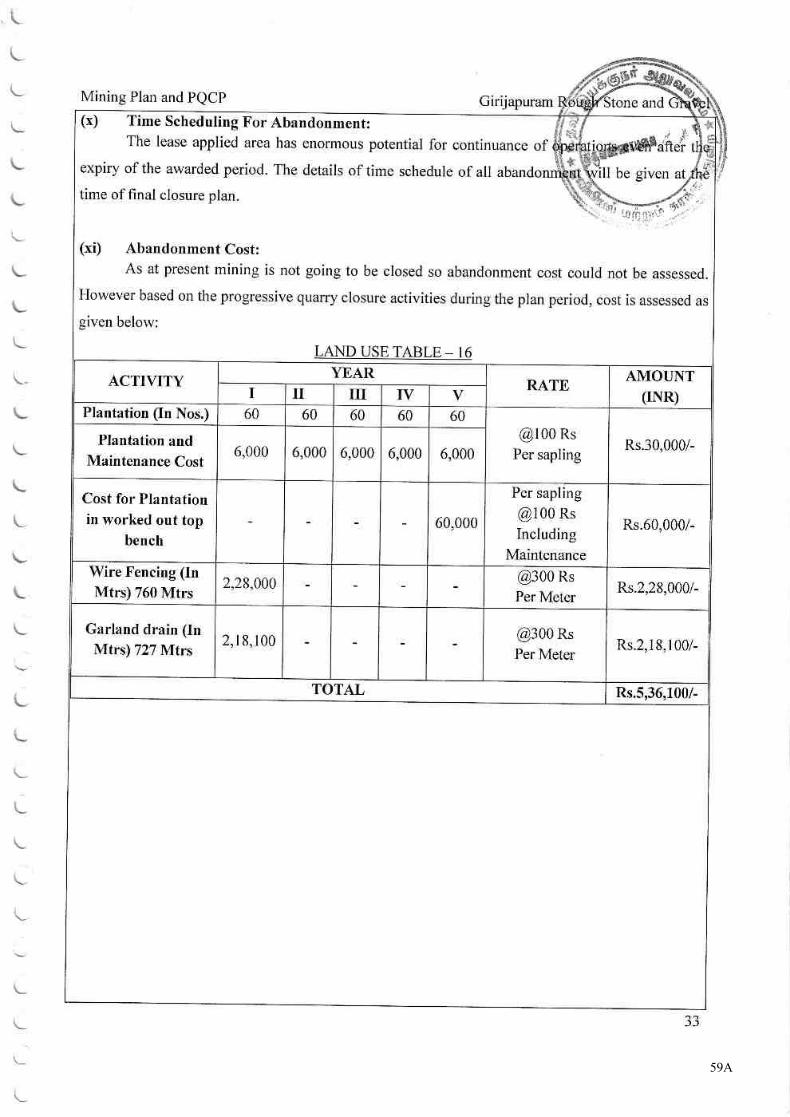
59A
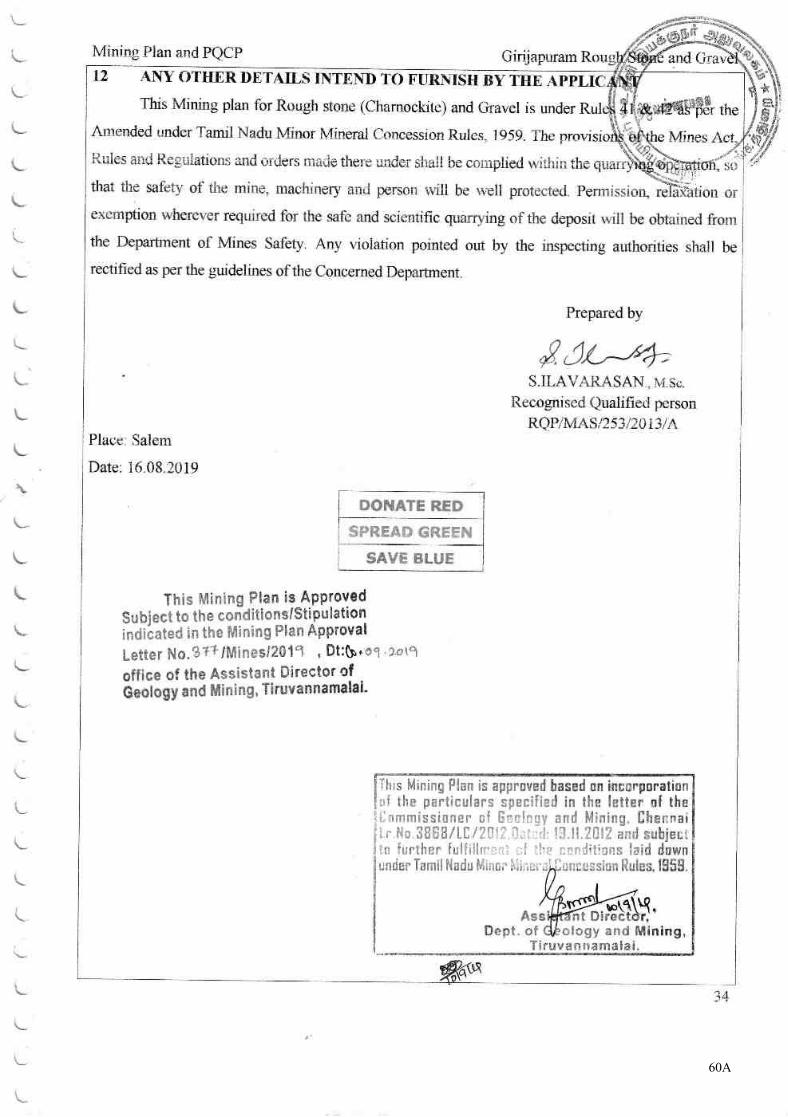
60A
61A
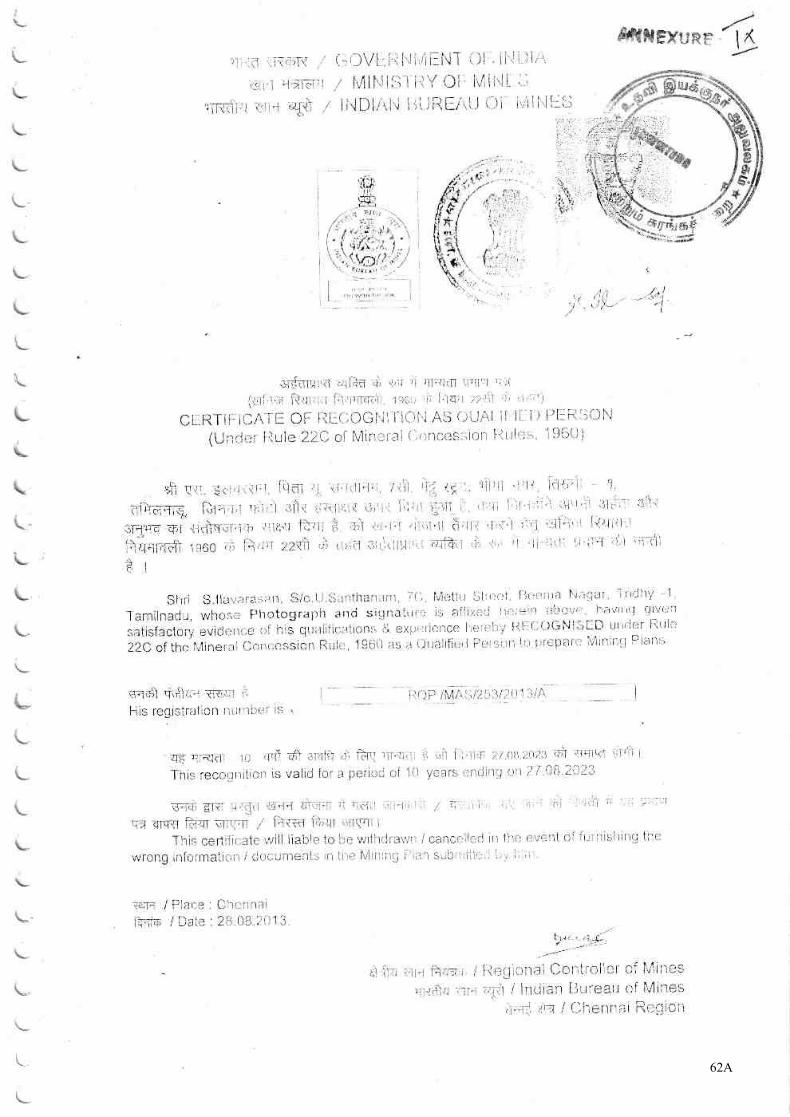
62A
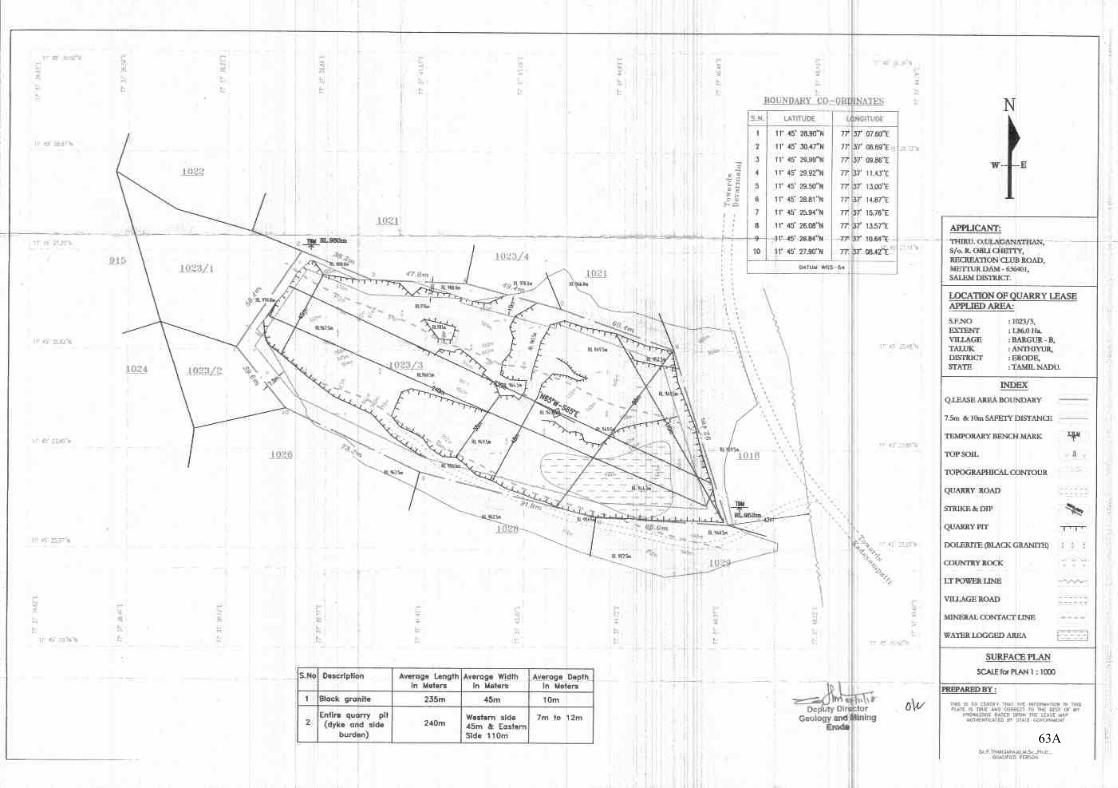
63A
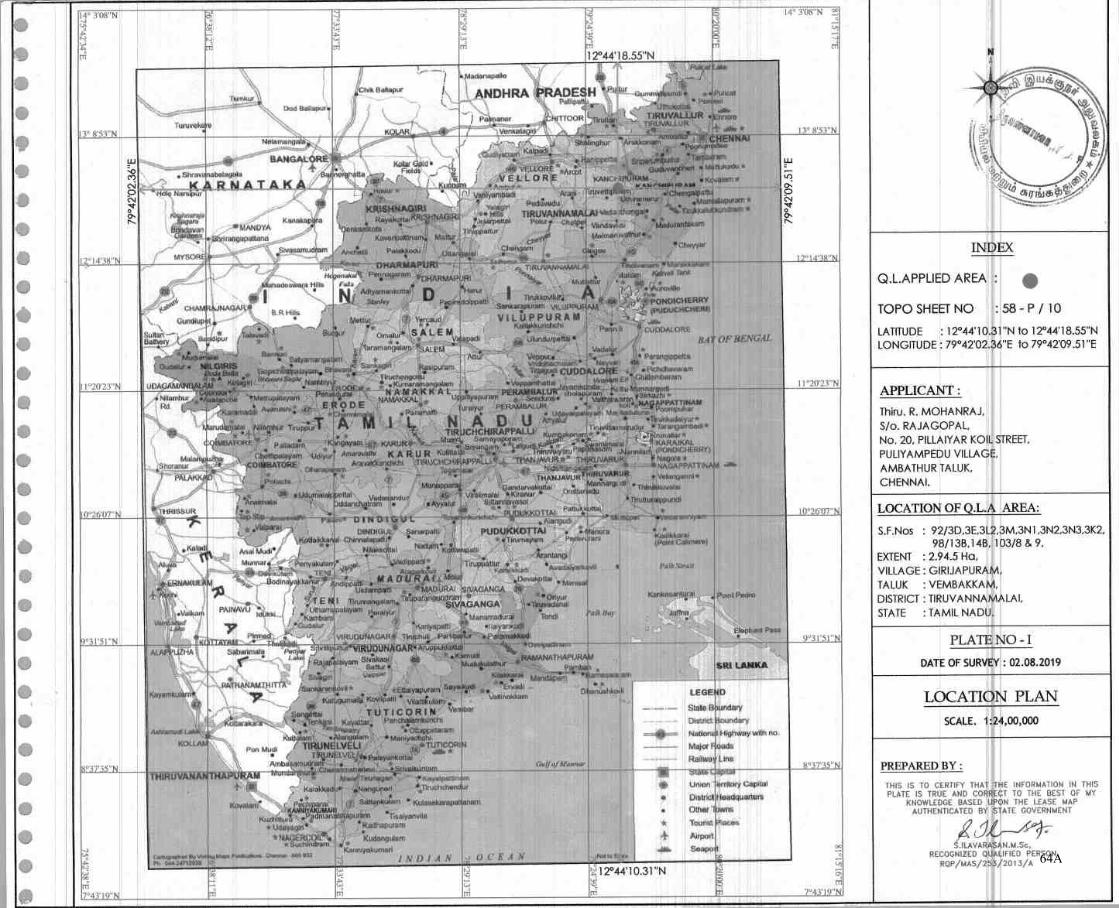
64A
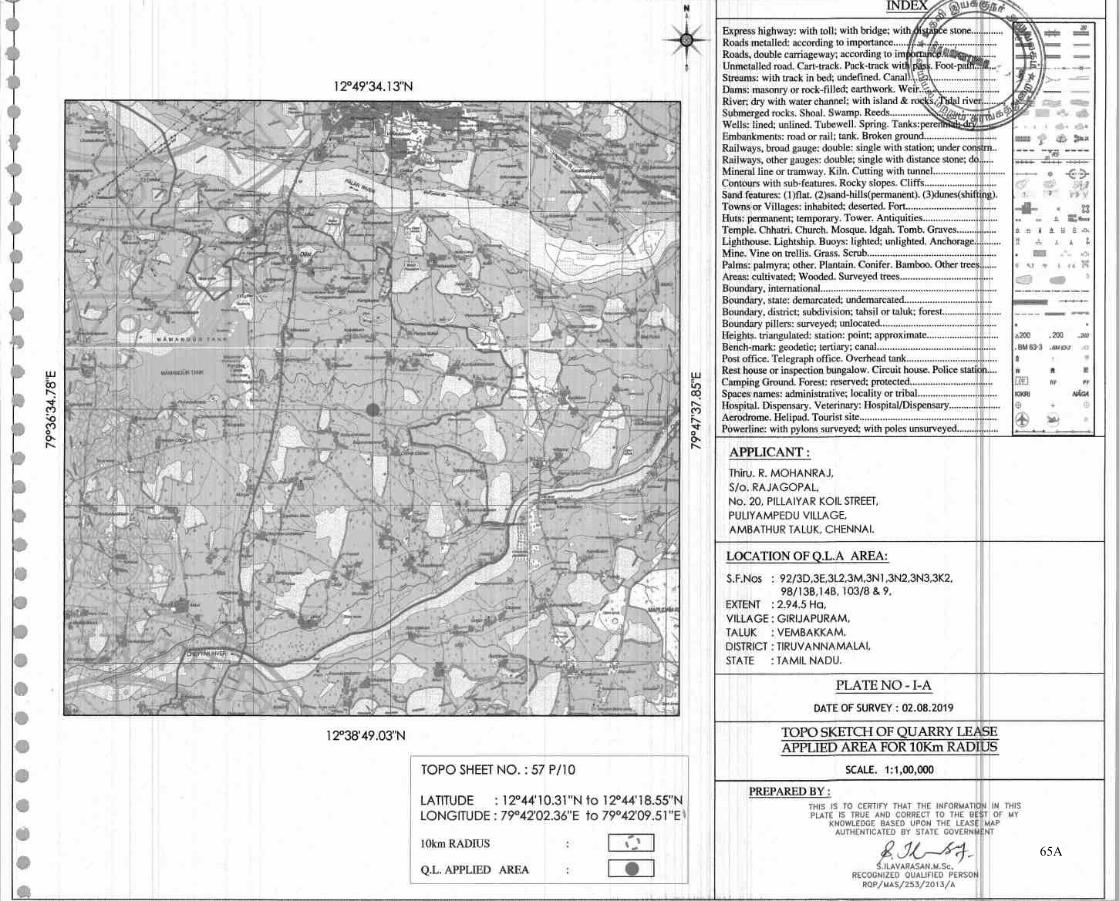
65A
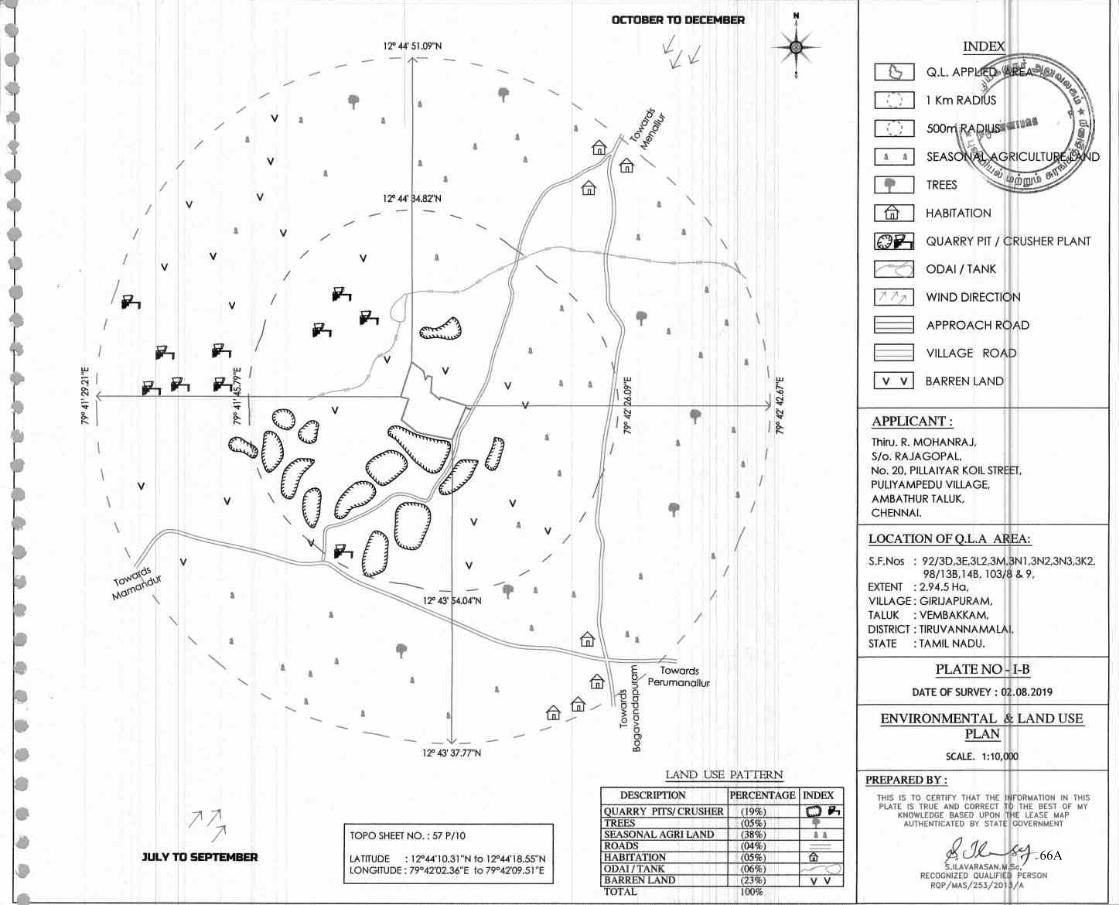
66A
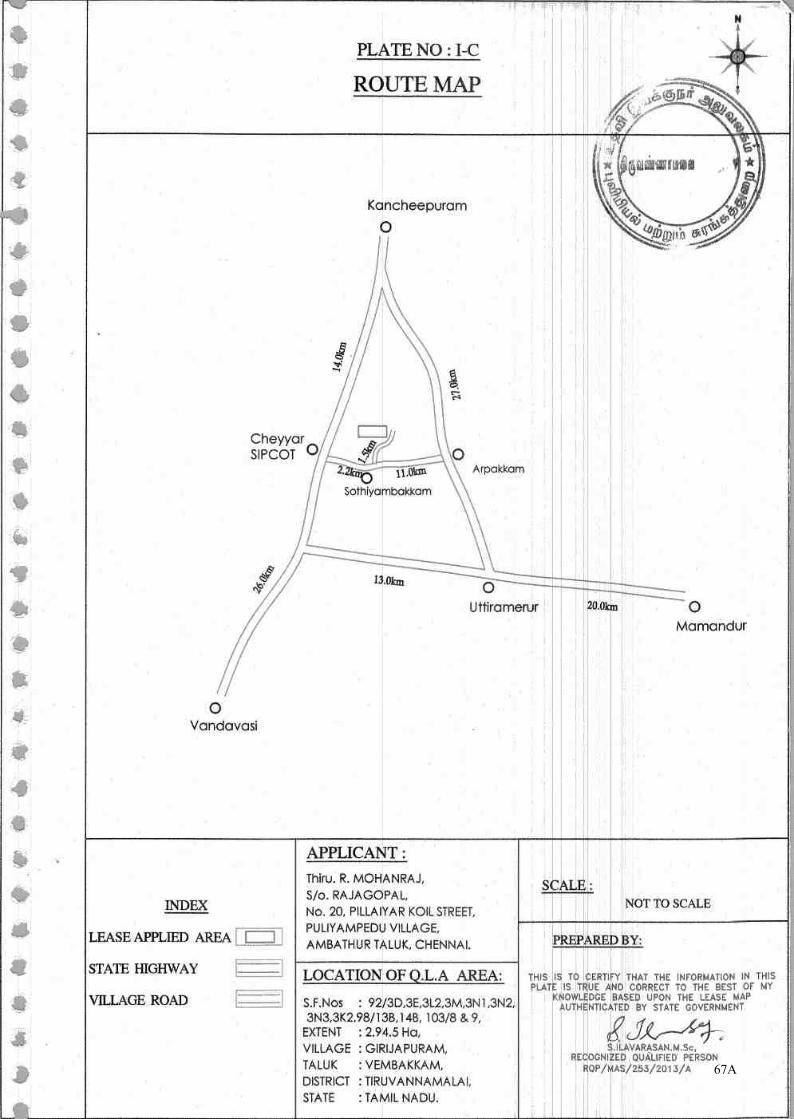
67A
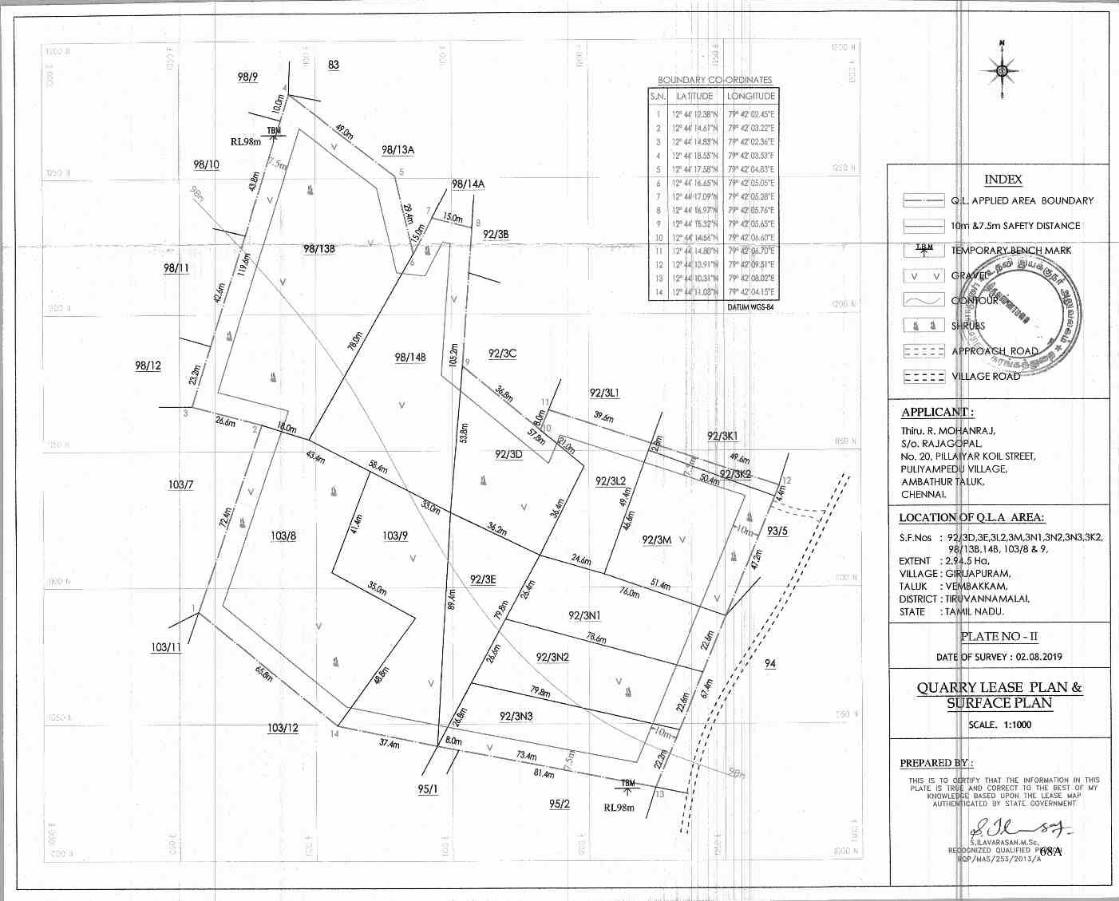
68A
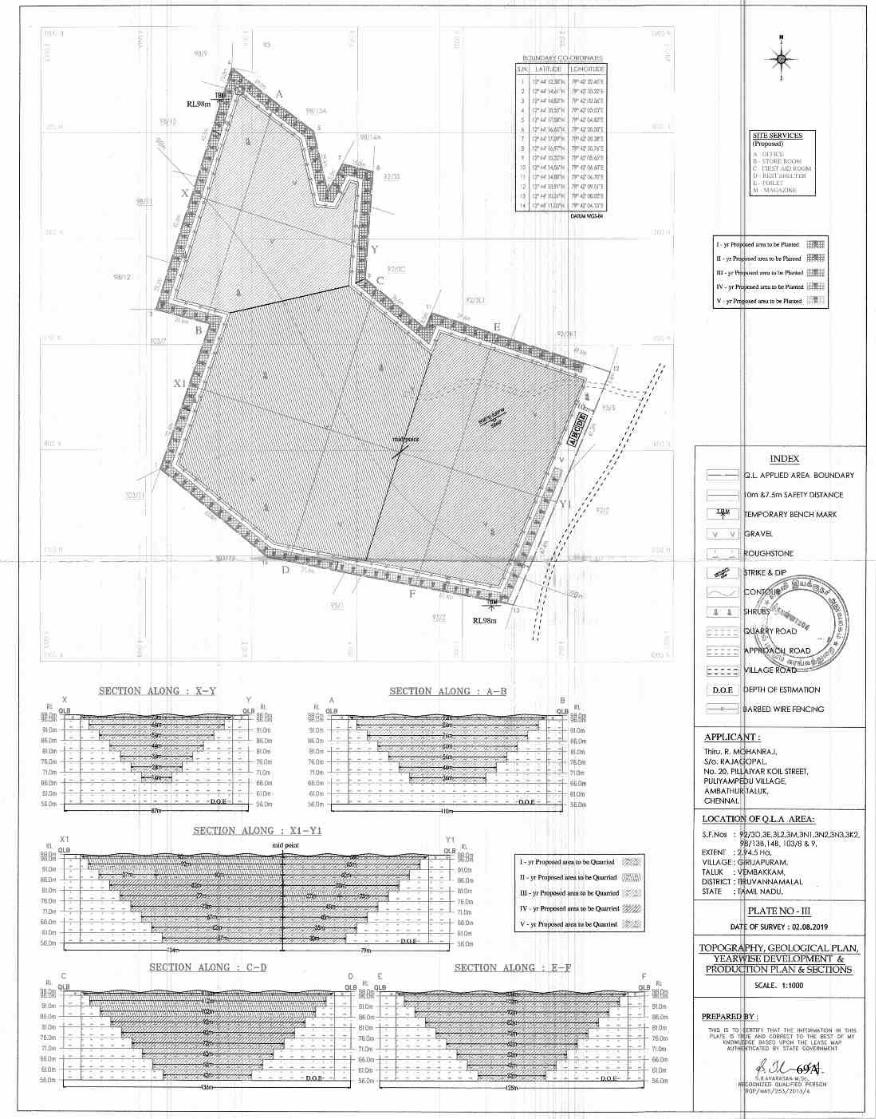
69A
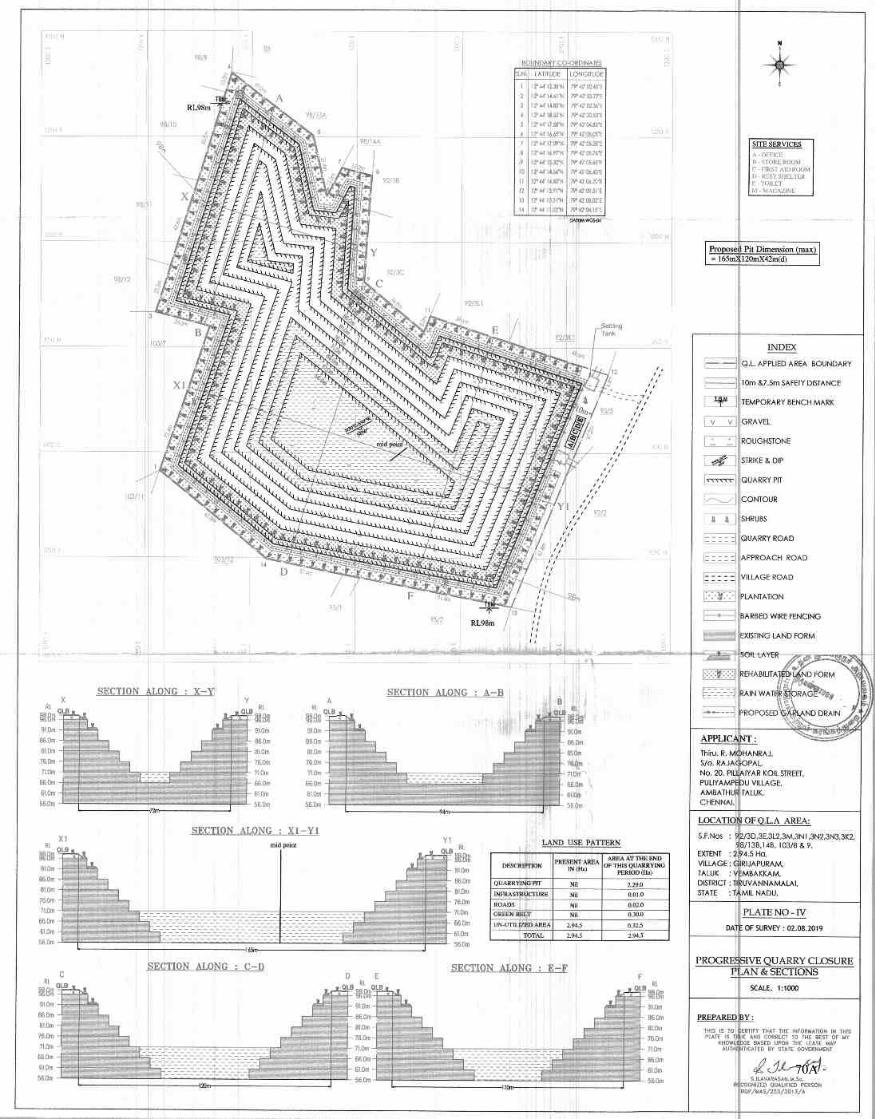
70A
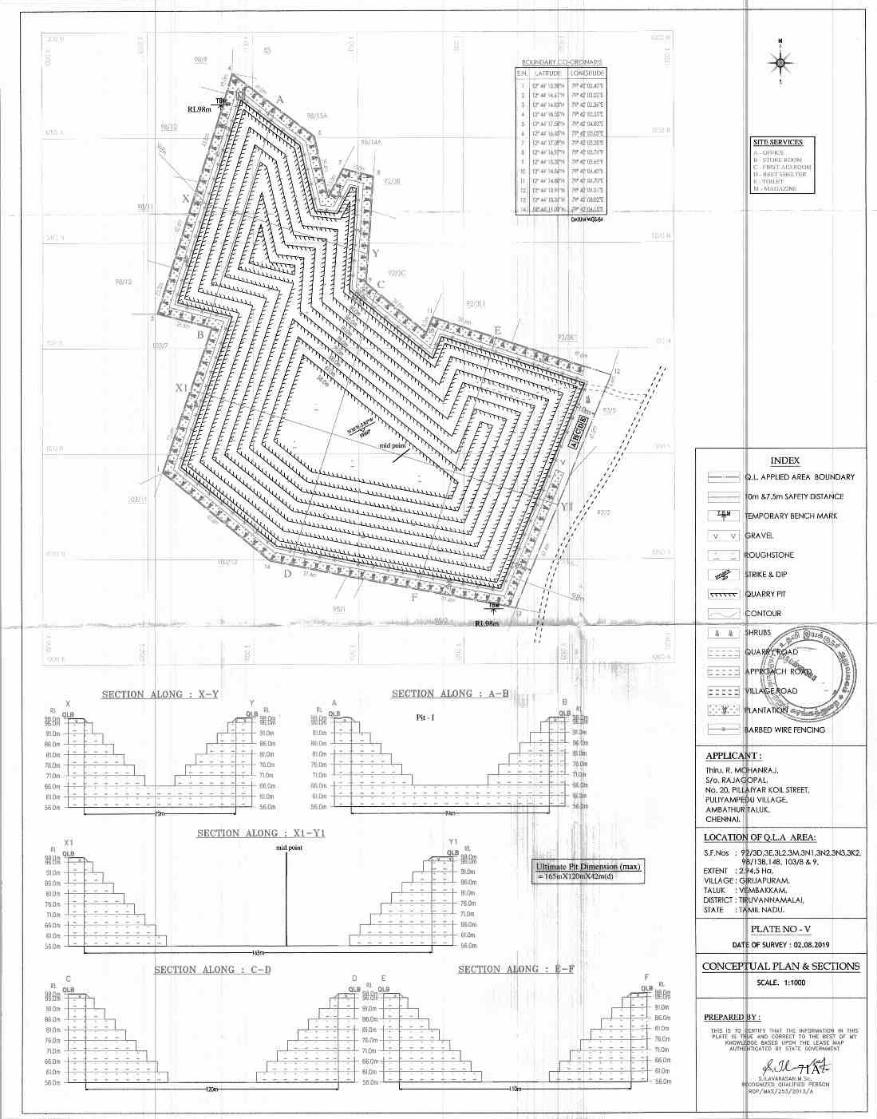
71A
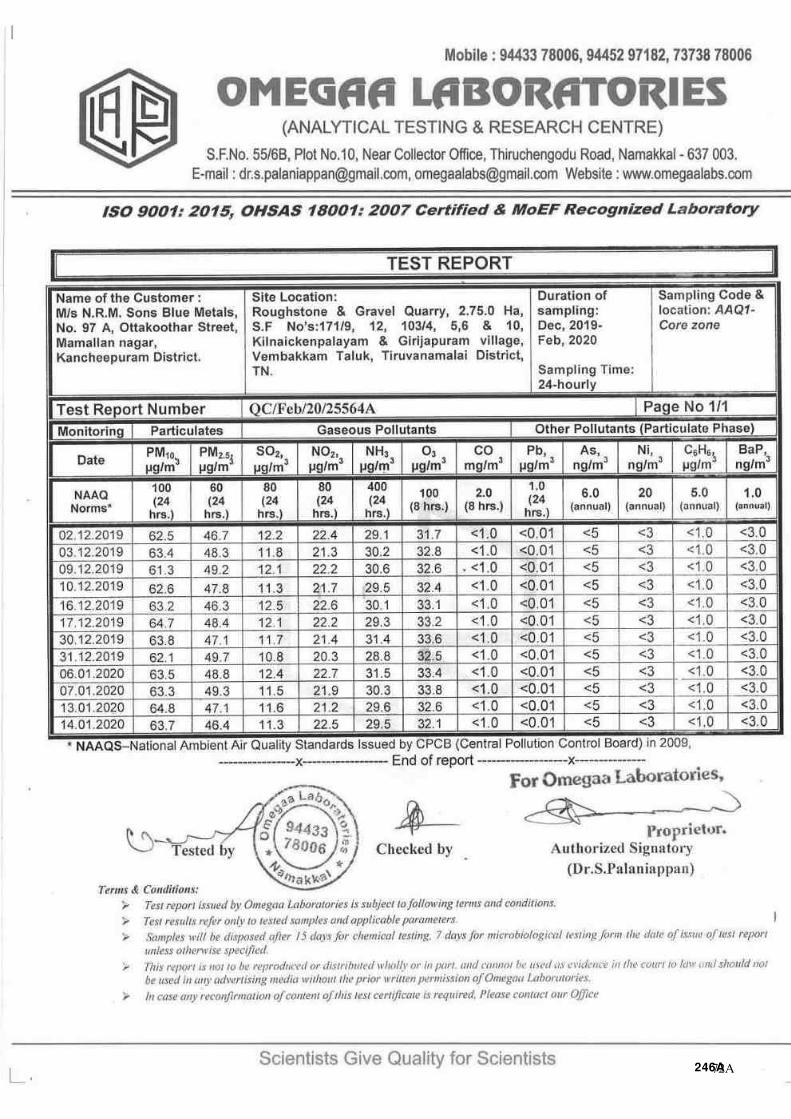
72A

73A
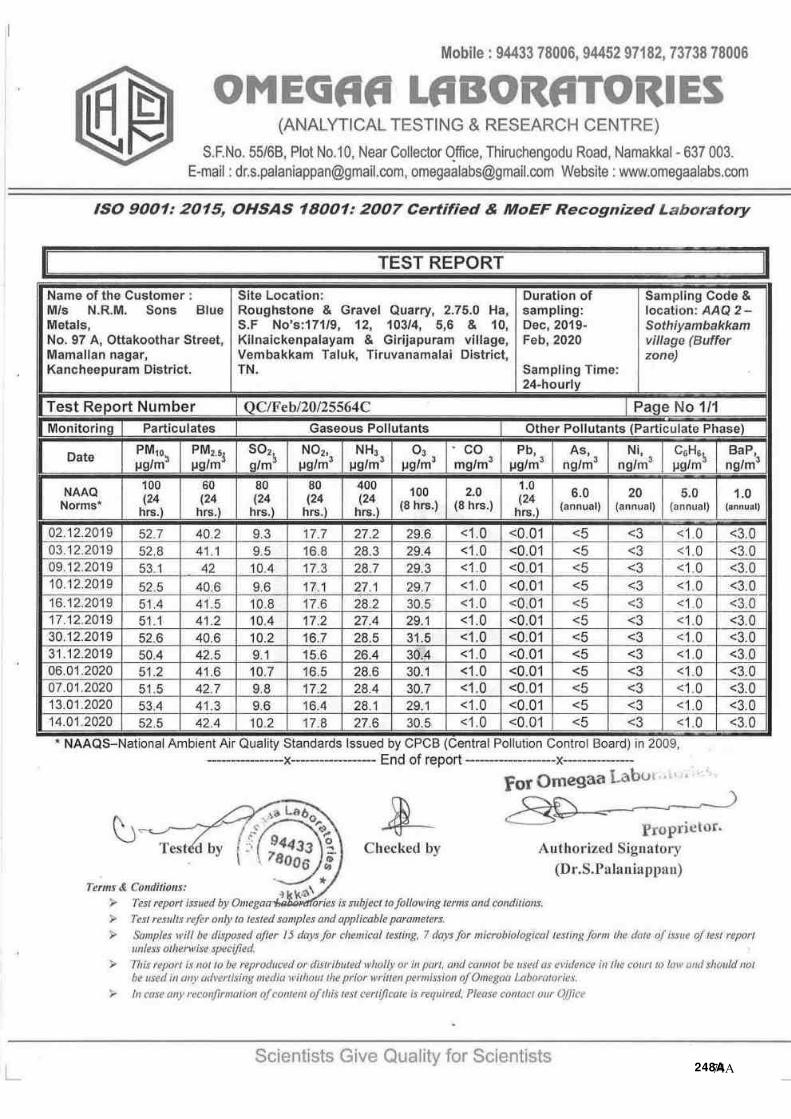
74A

75A
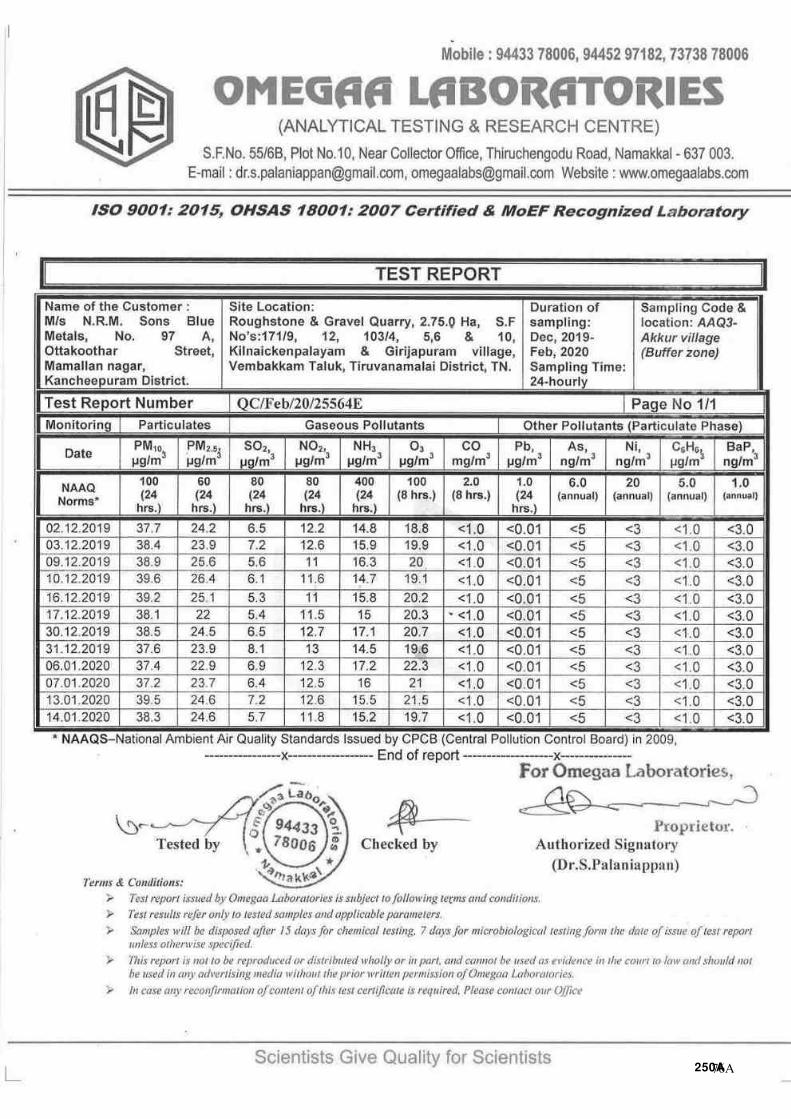
76A
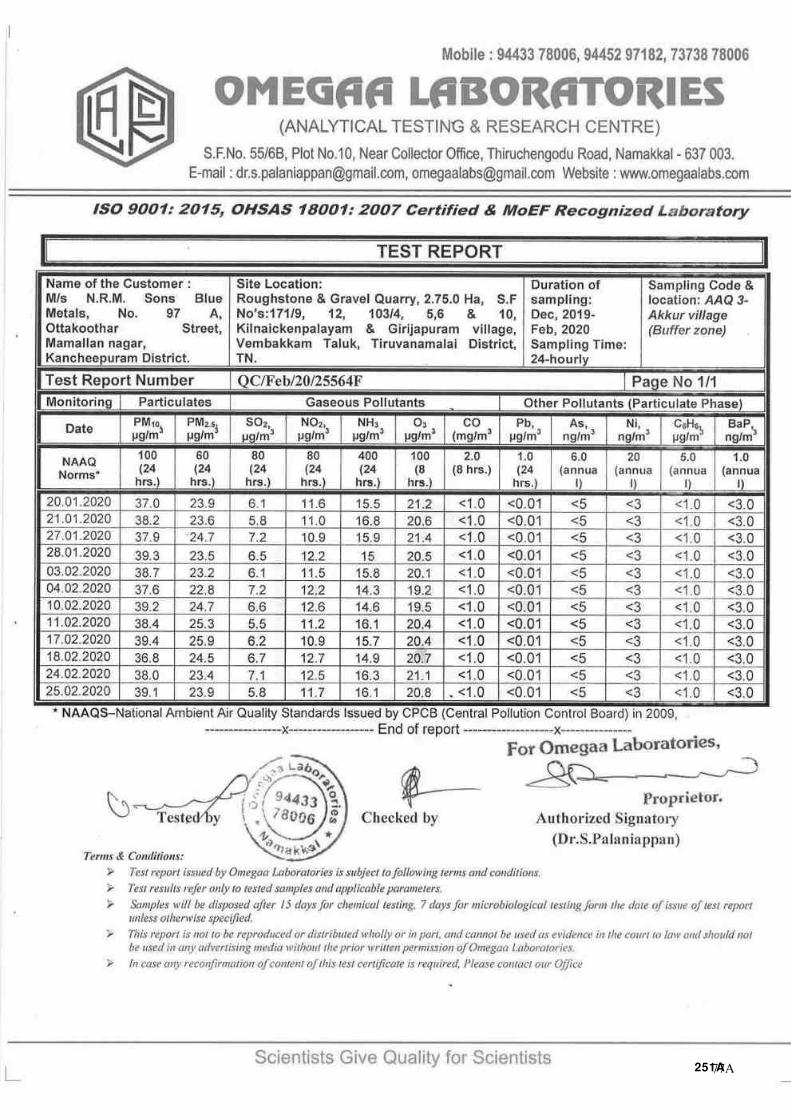
77A
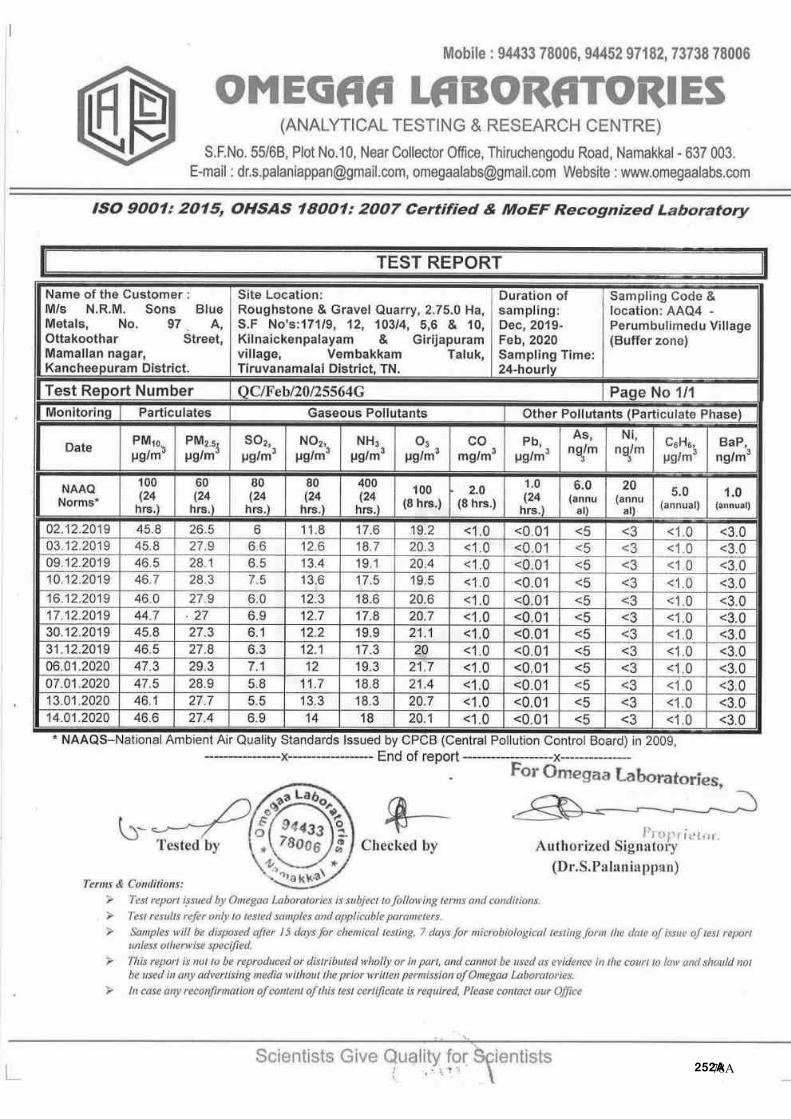
78A
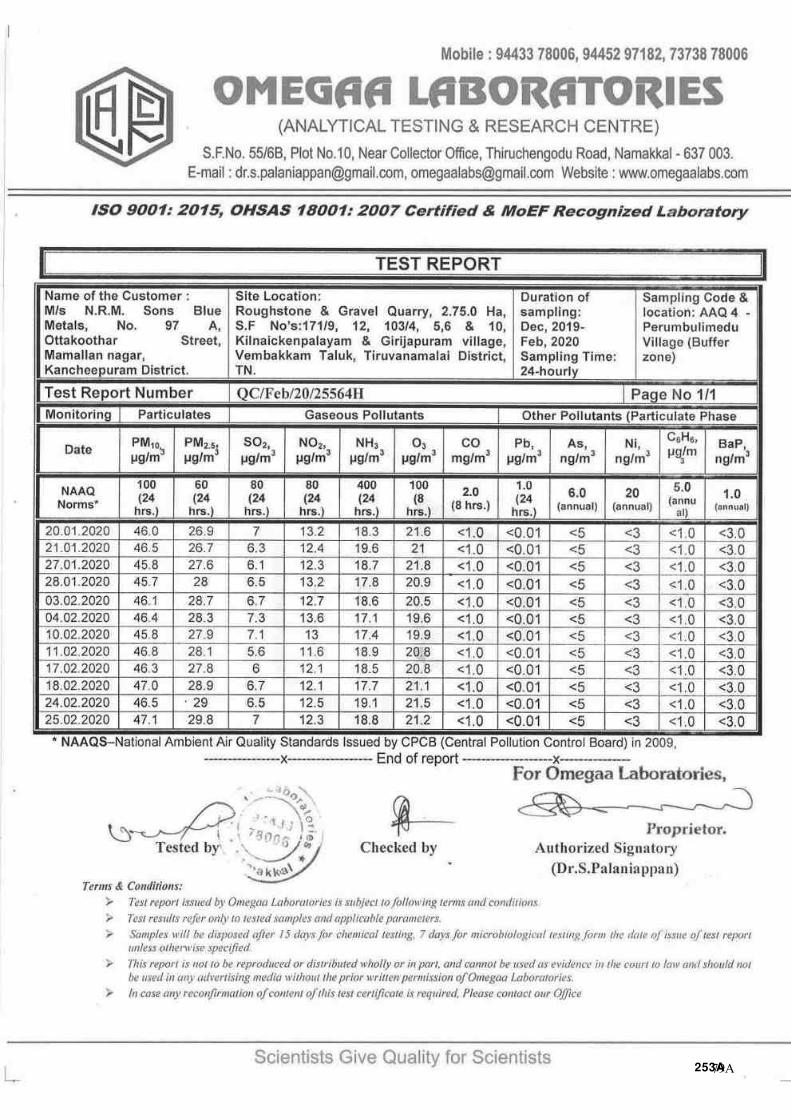
79A
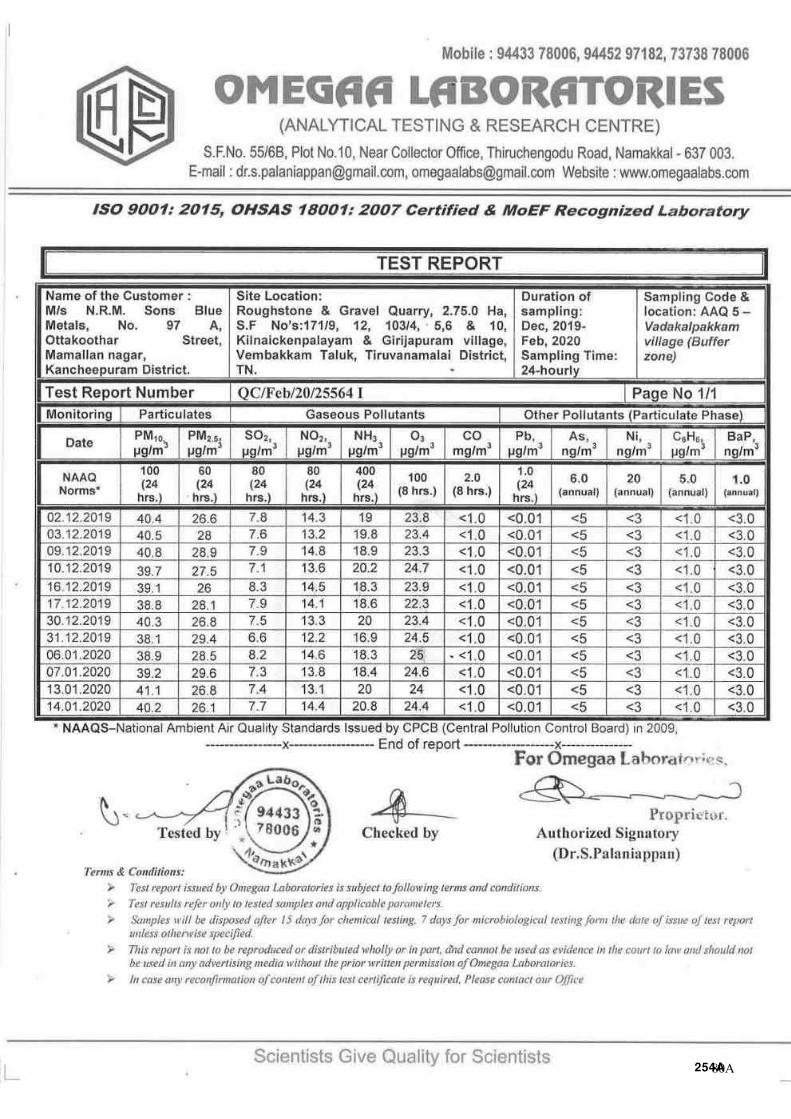
80A
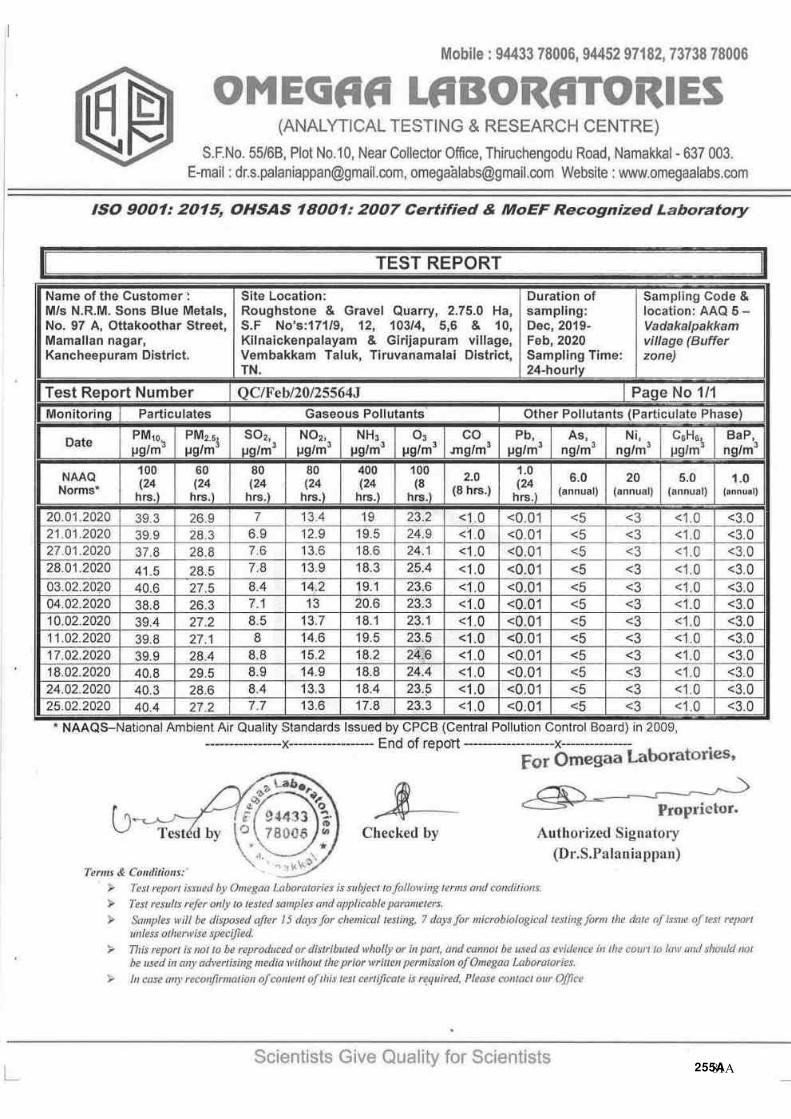
81A
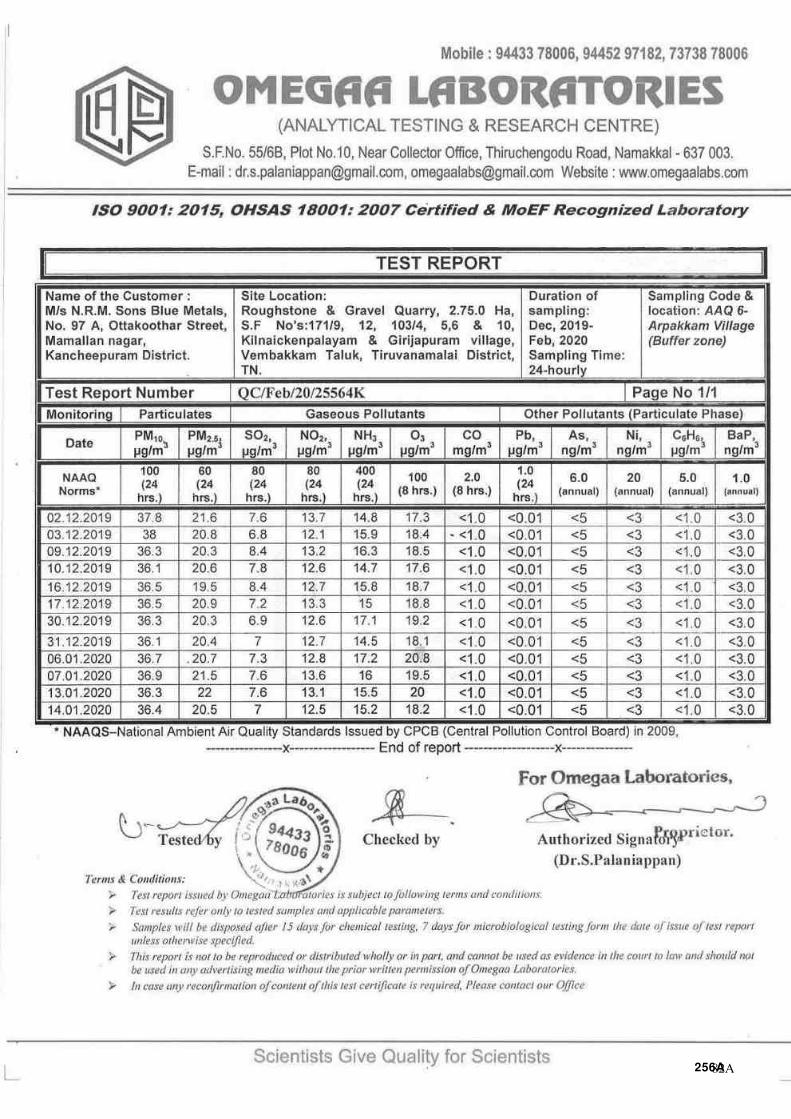
82A
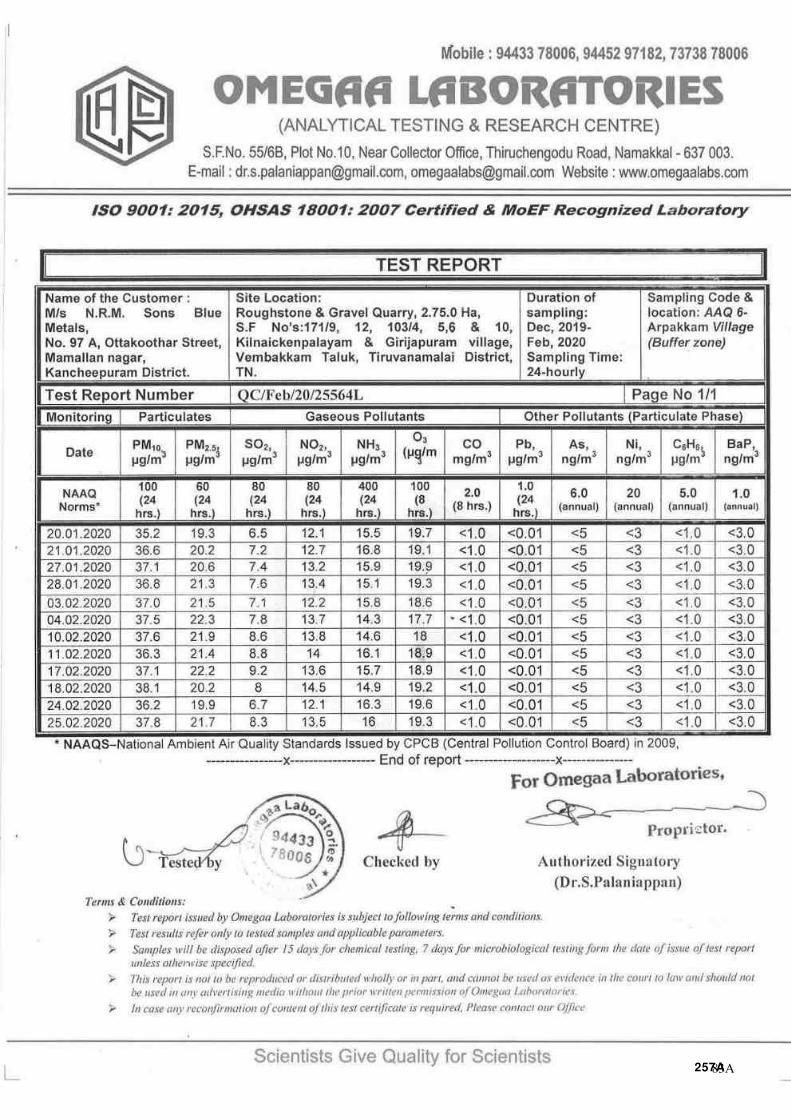
83A
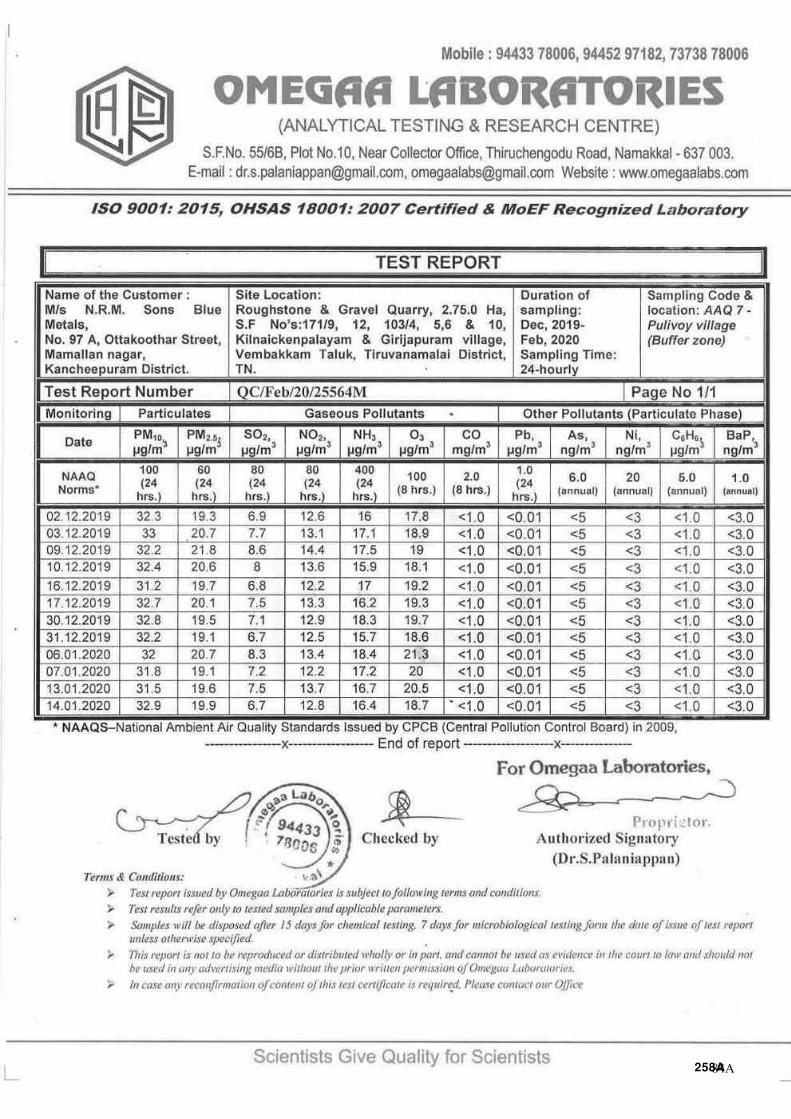
84A

85A
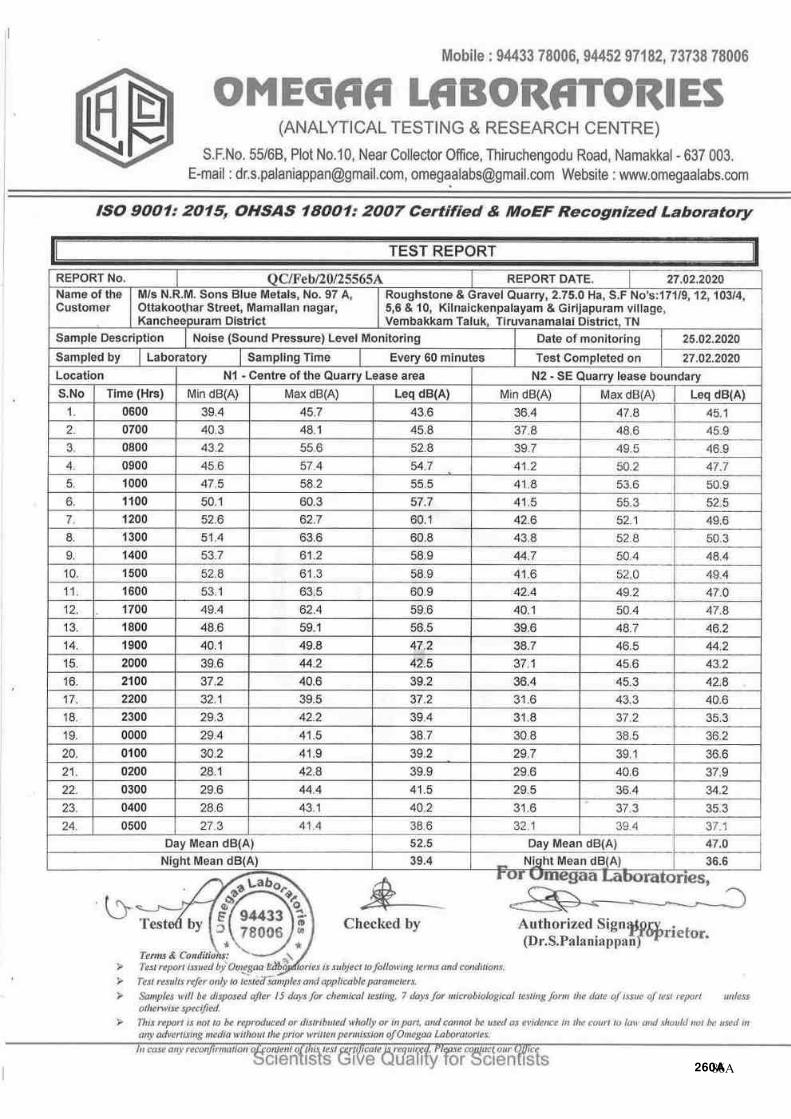
86A
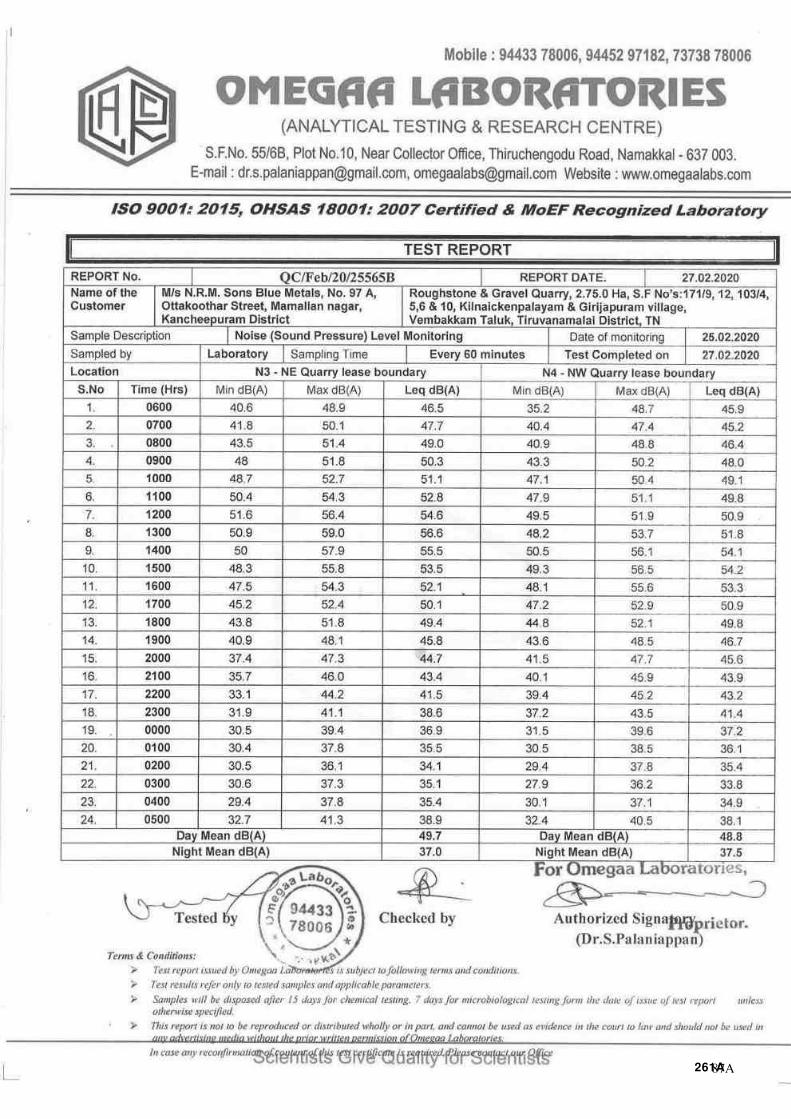
87A
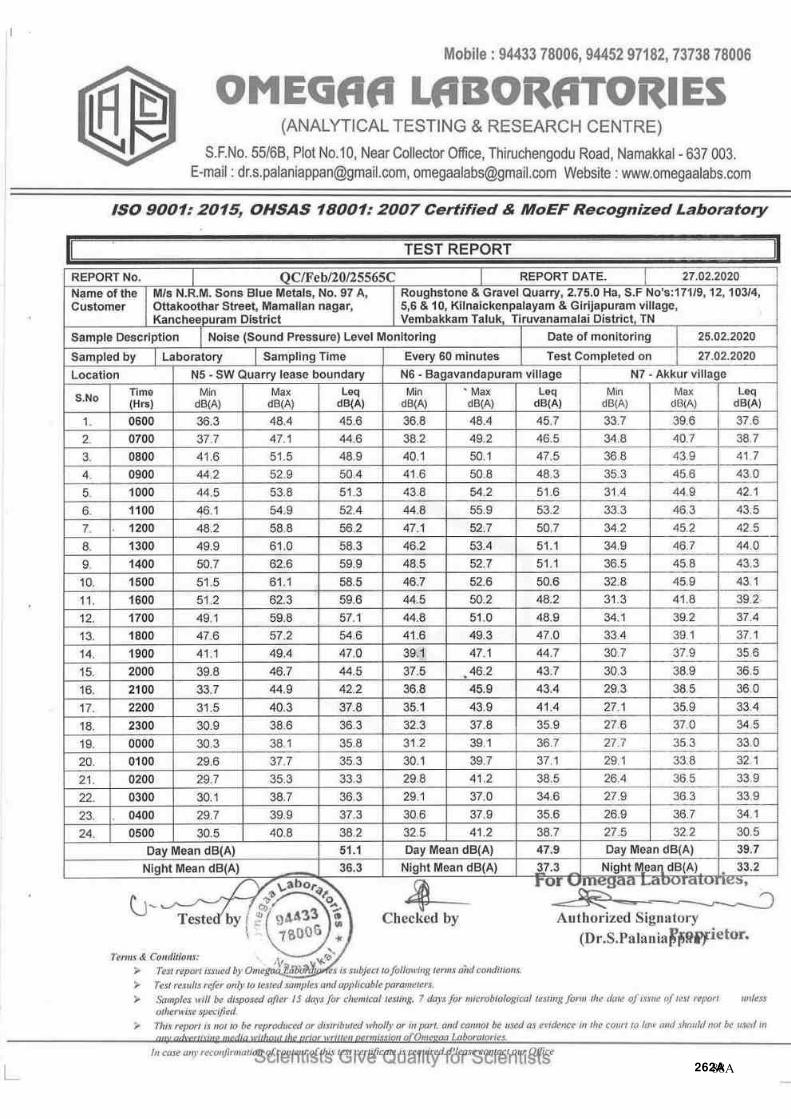
88A
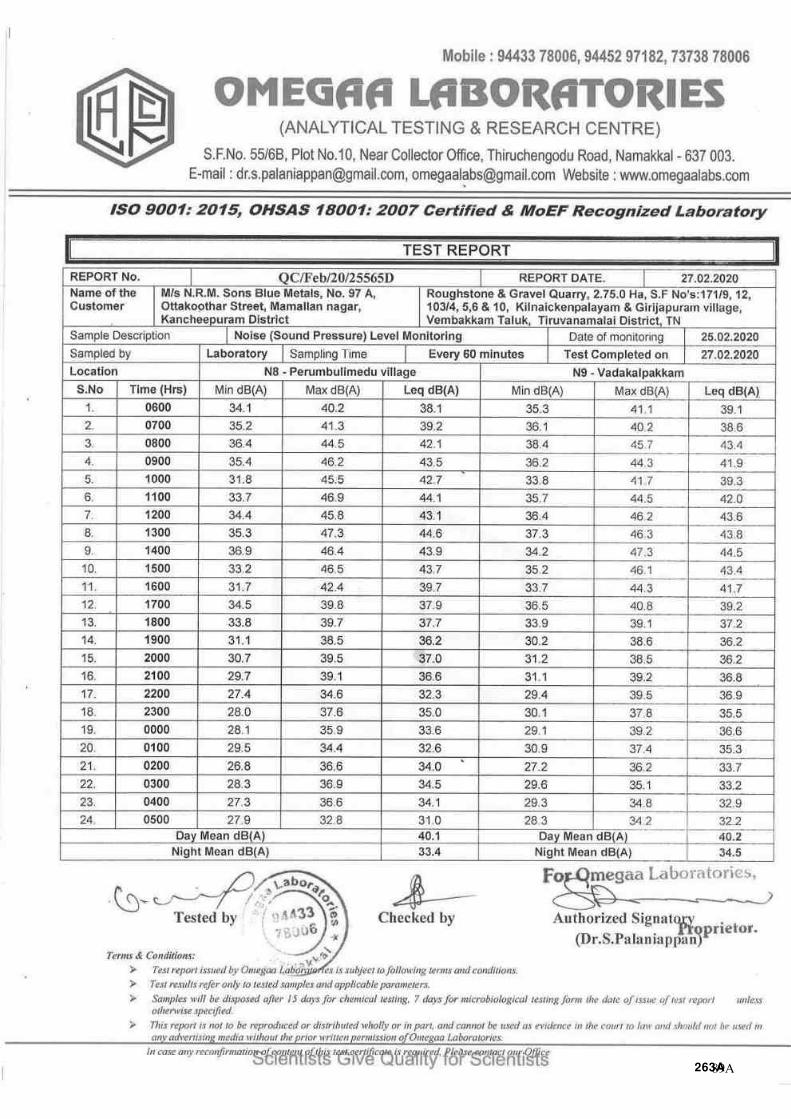
89A
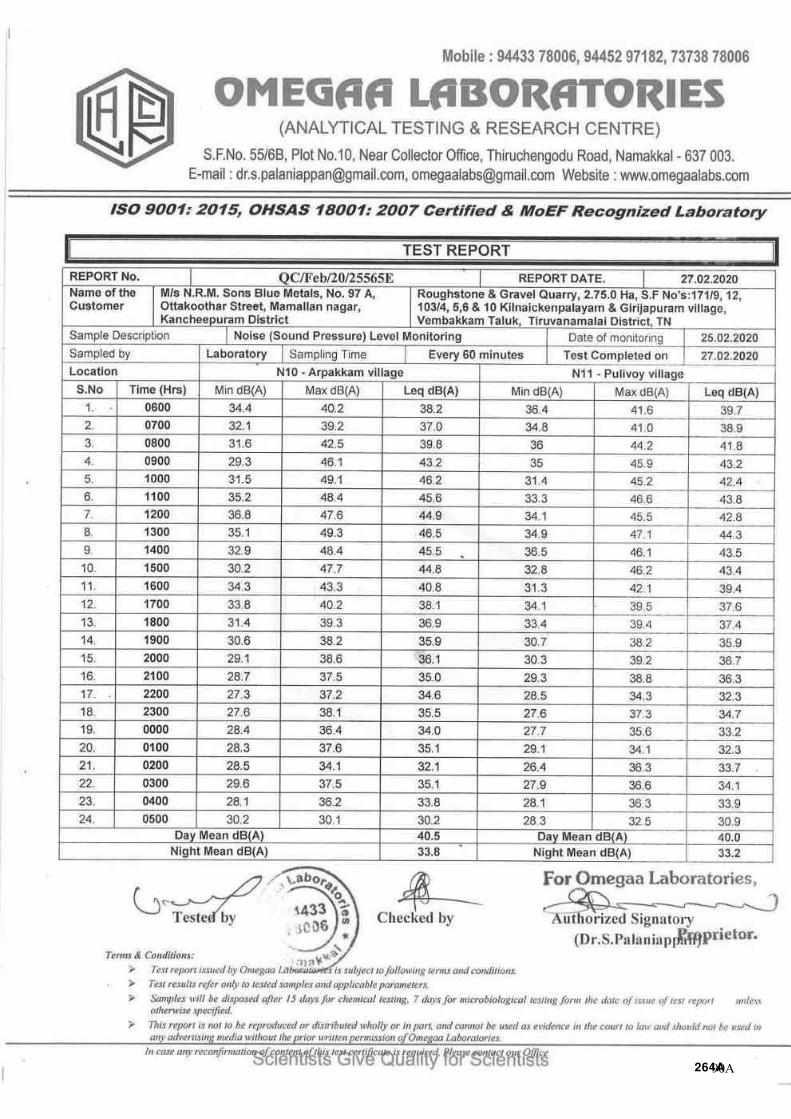
90A
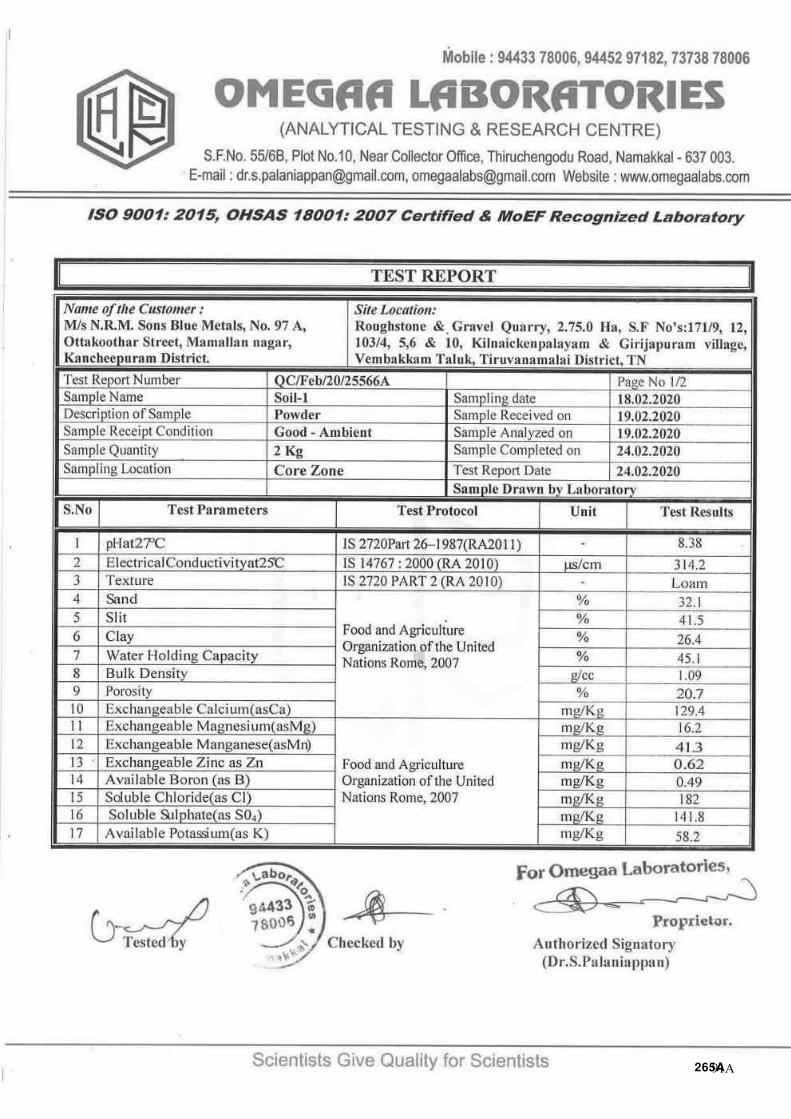
91A
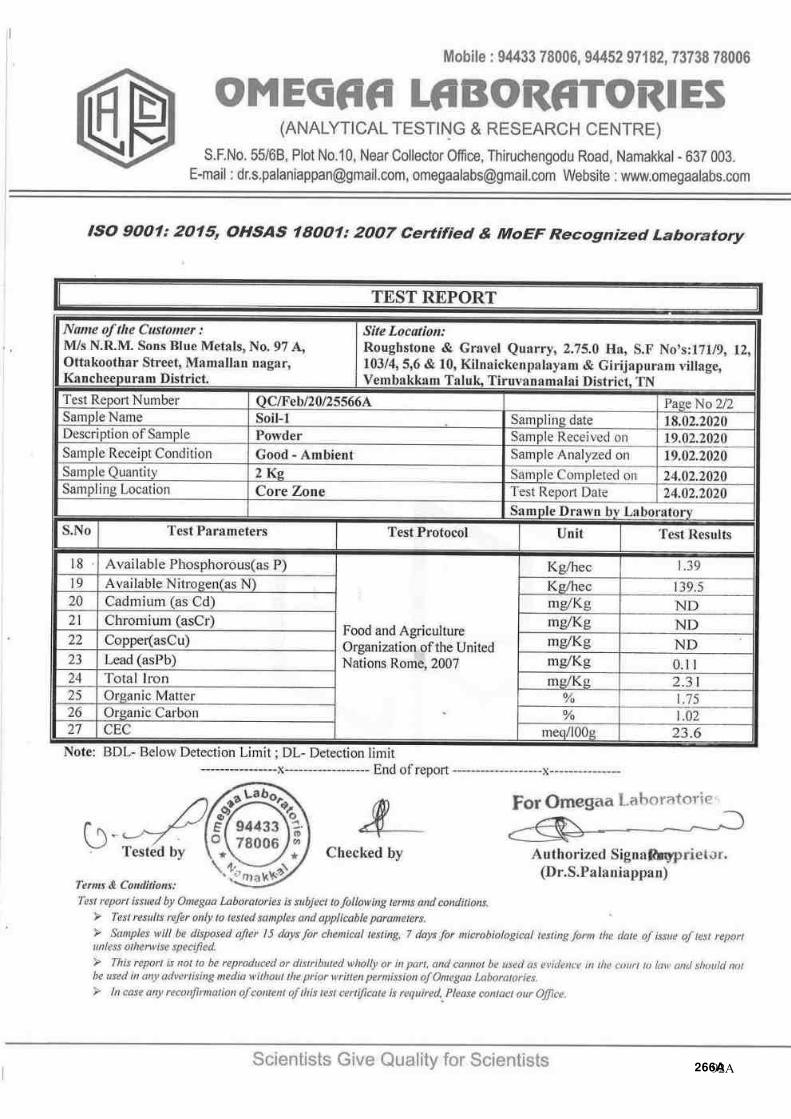
92A
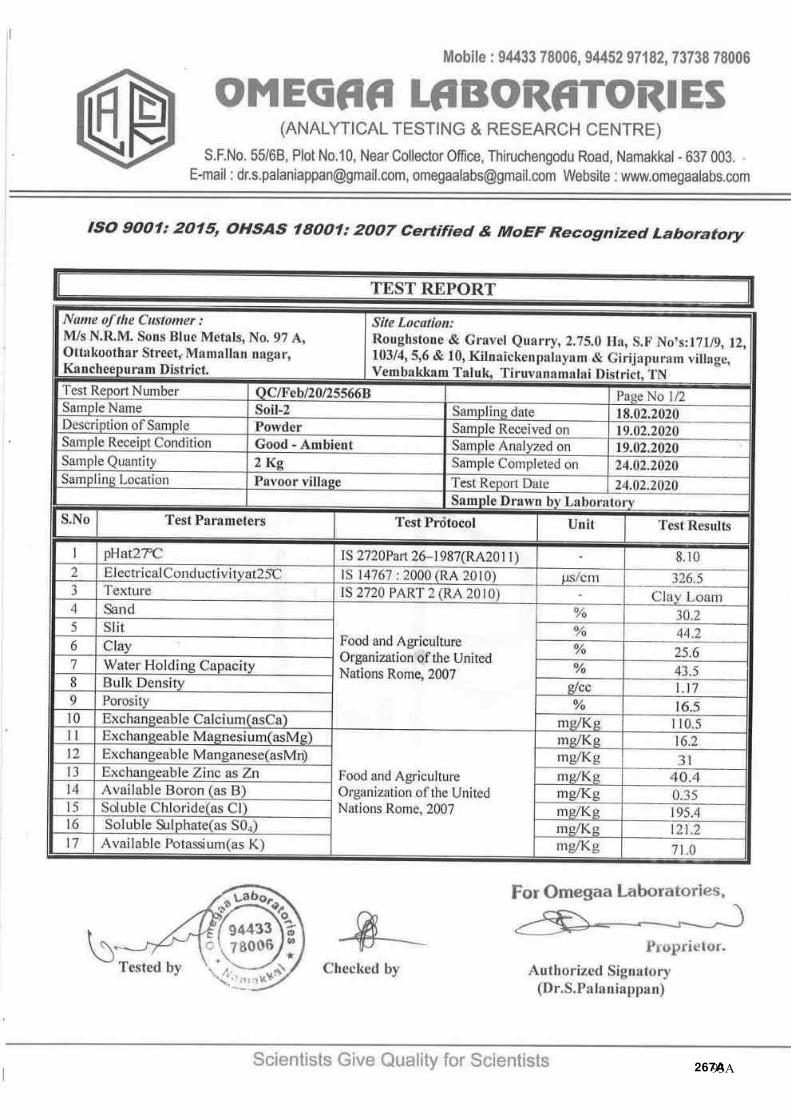
93A
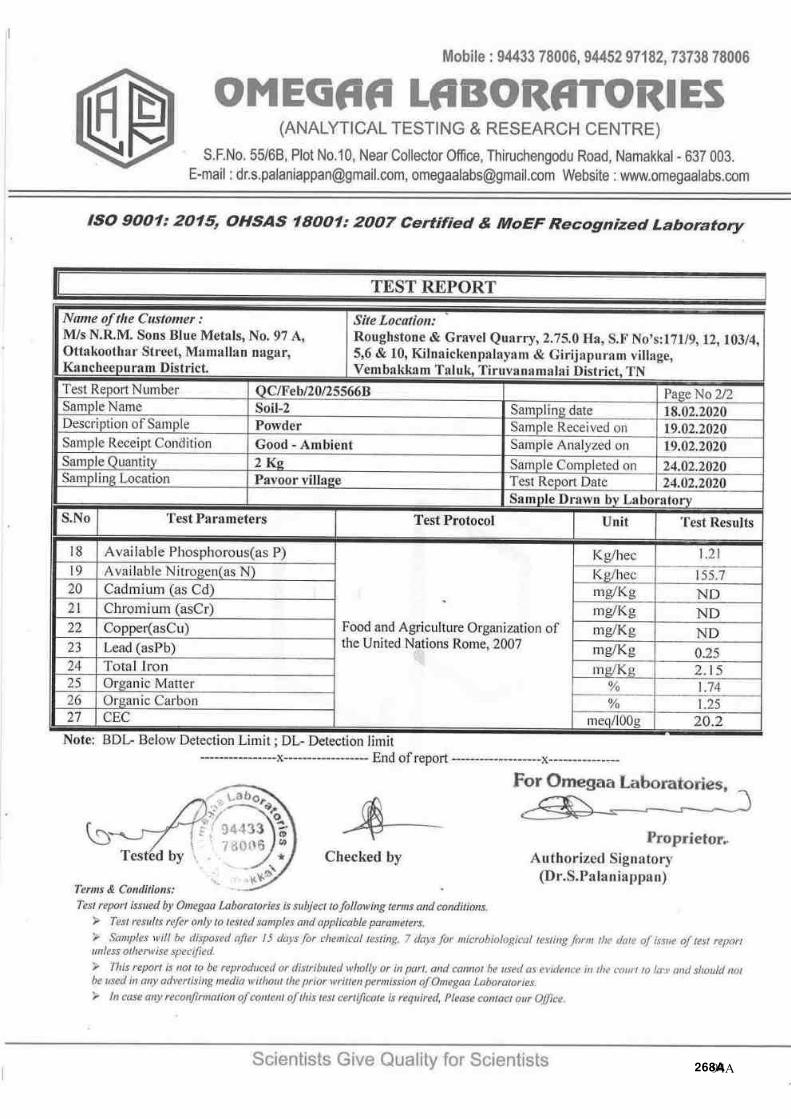
94A
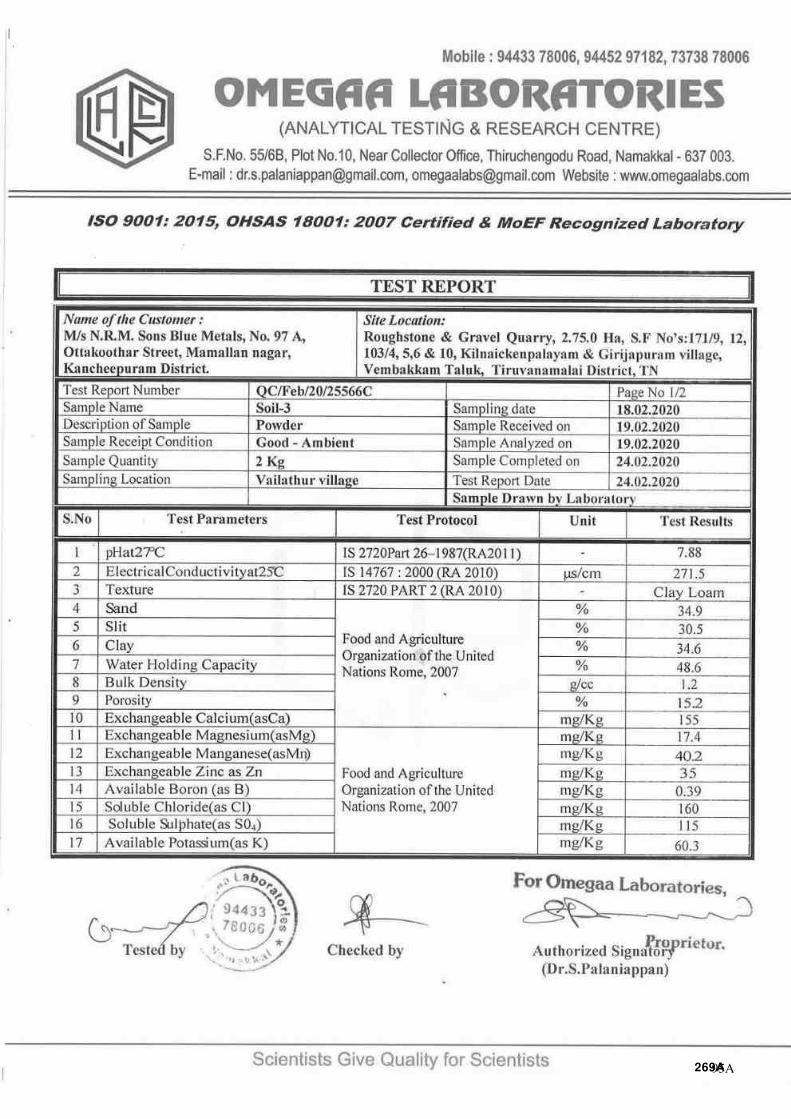
95A
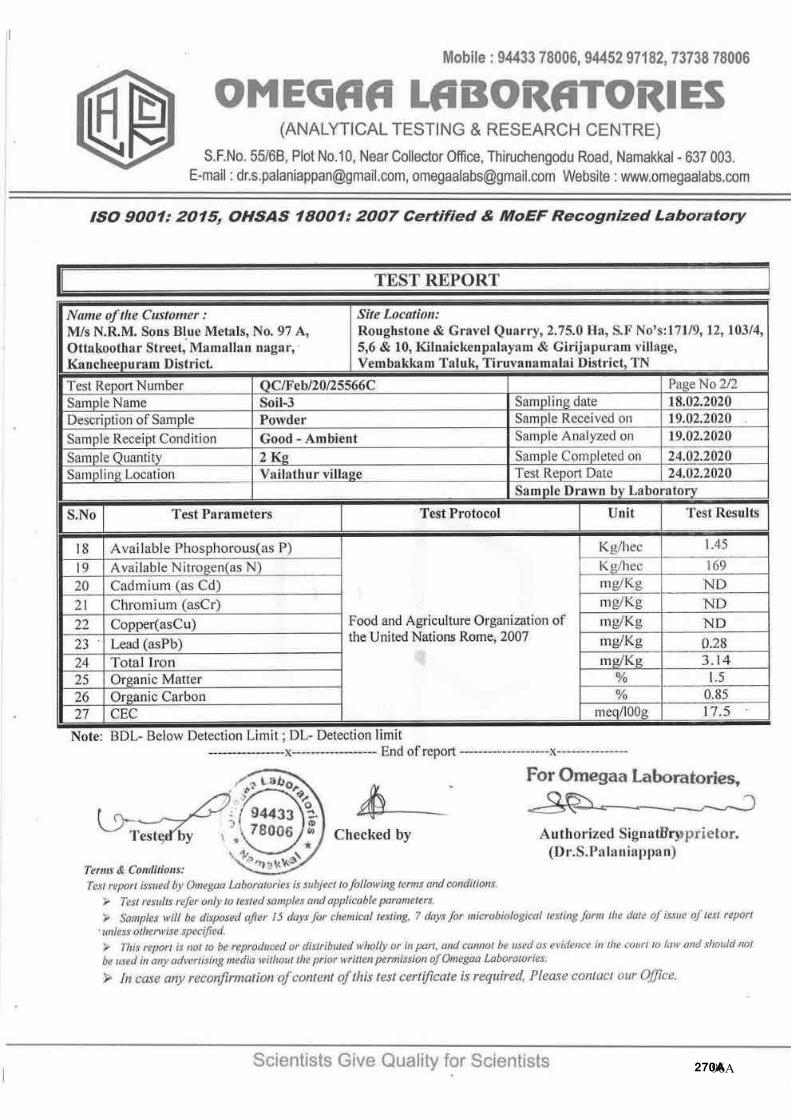
96A
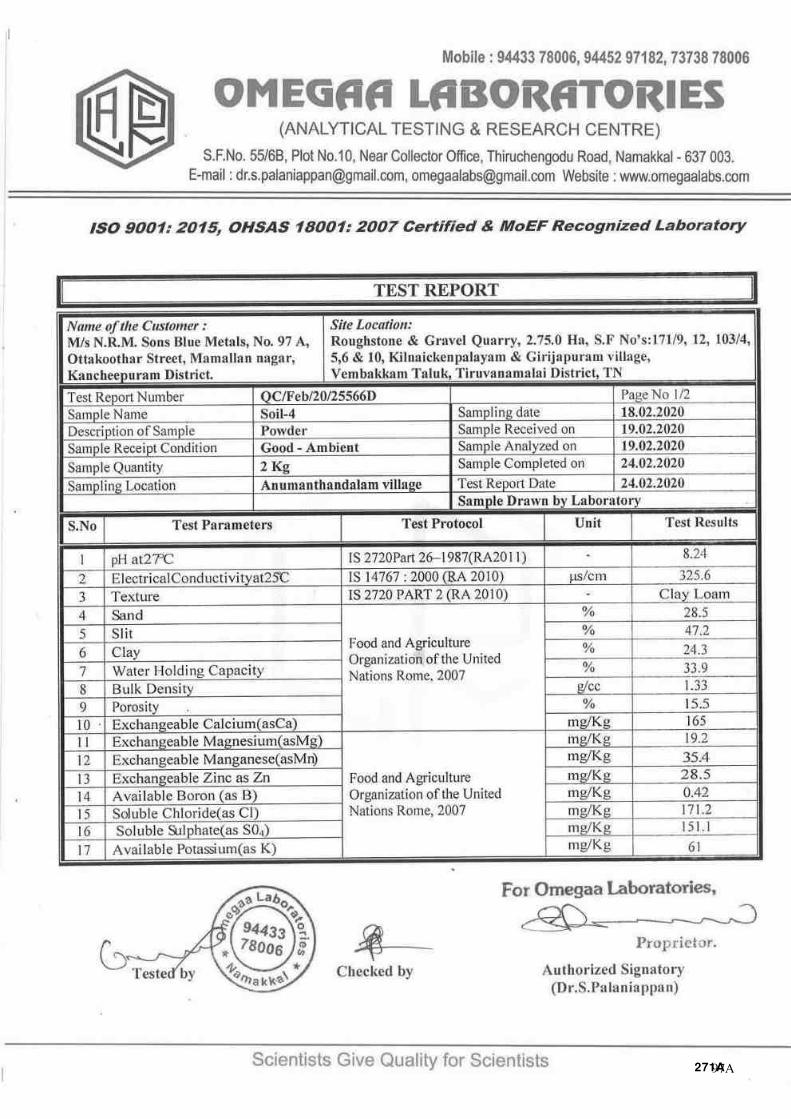
97A
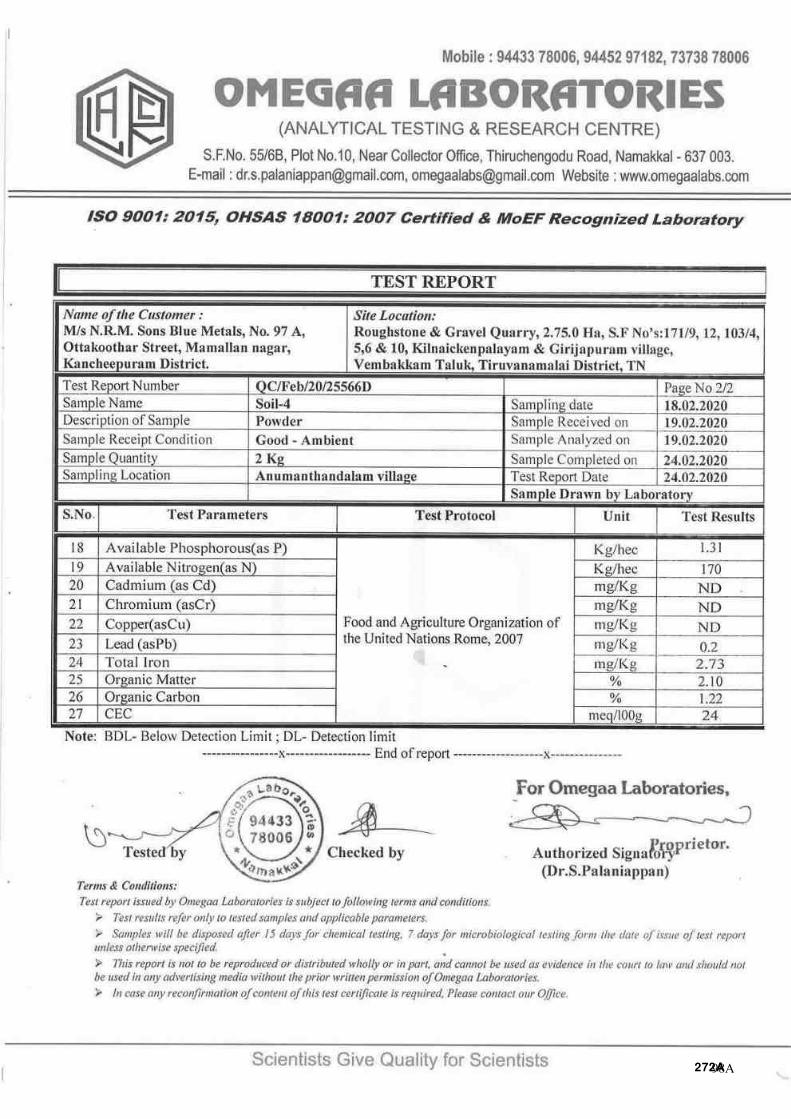
98A
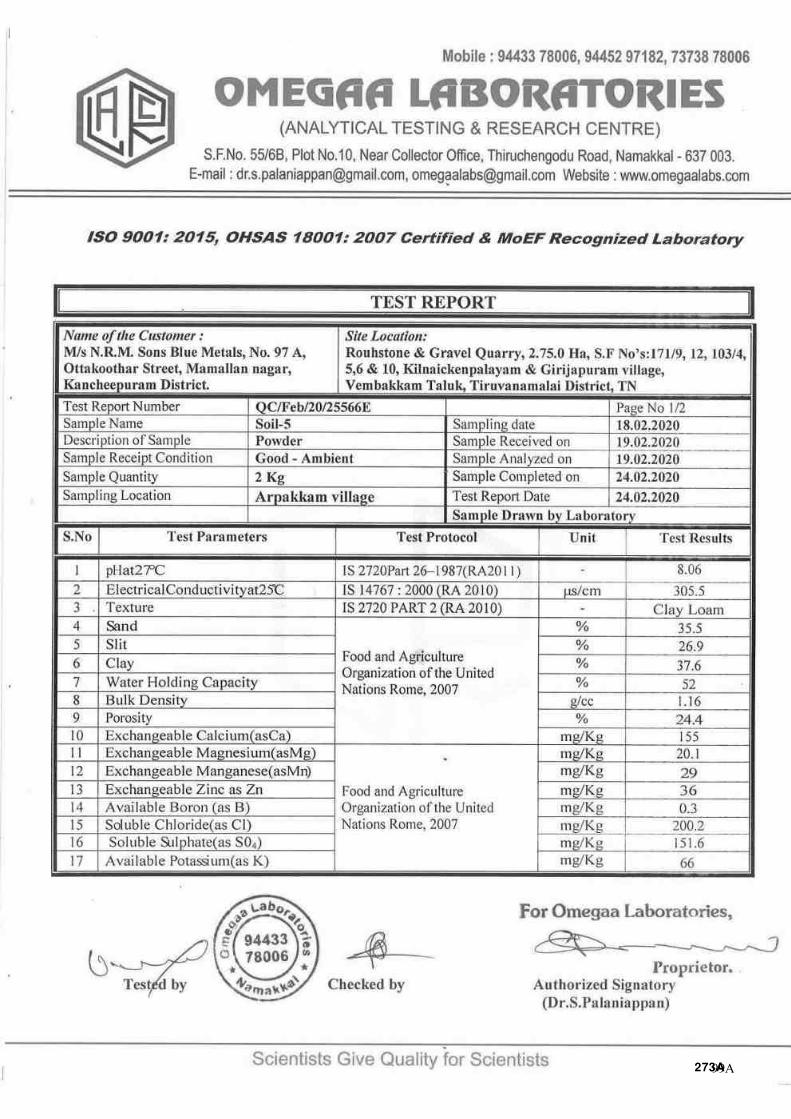
99A
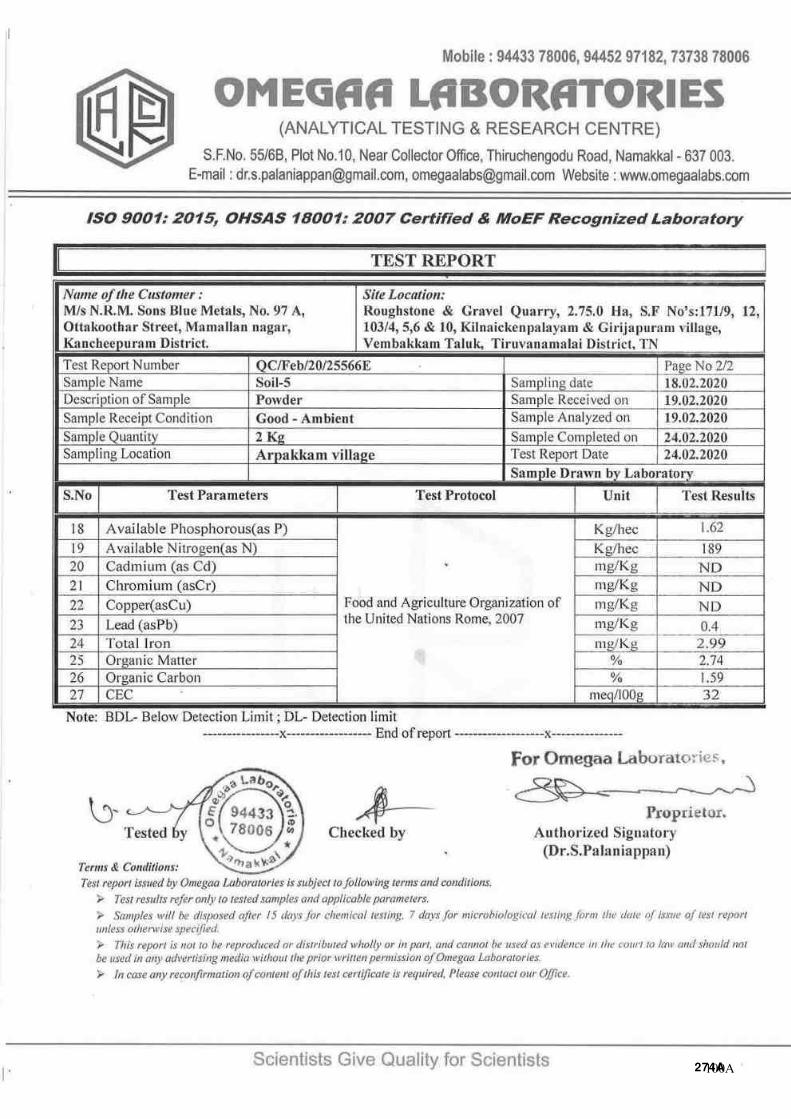
100A
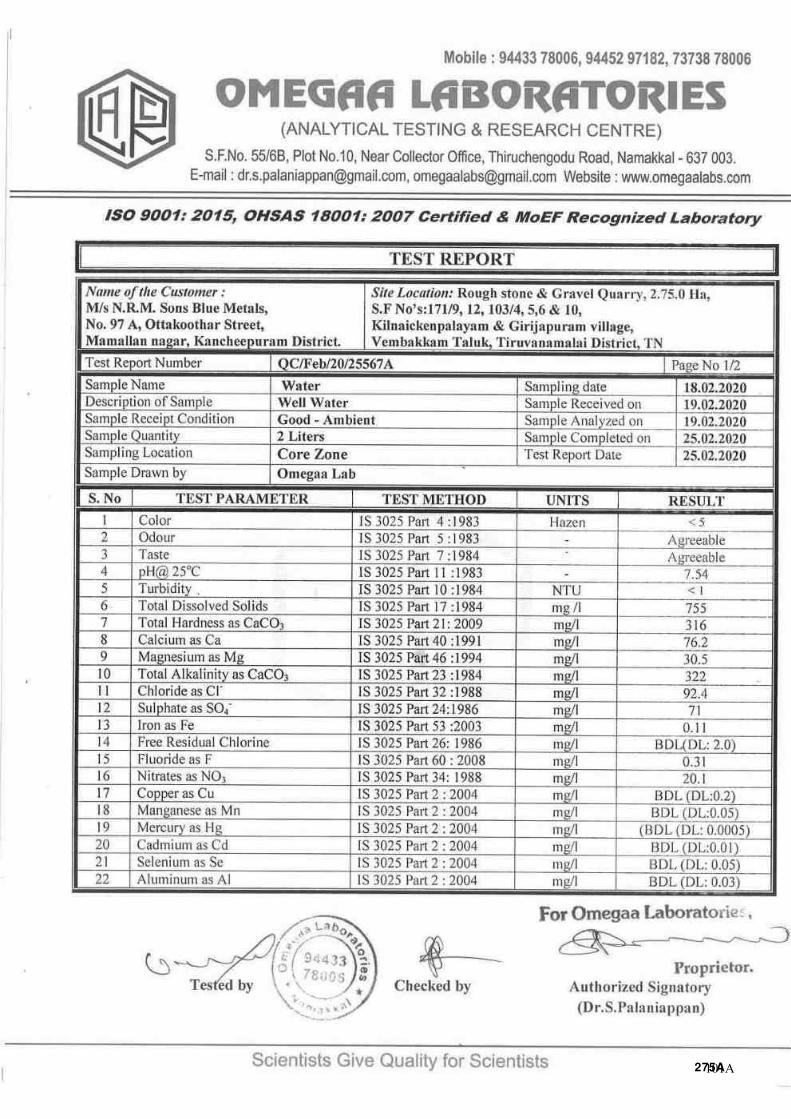
101A
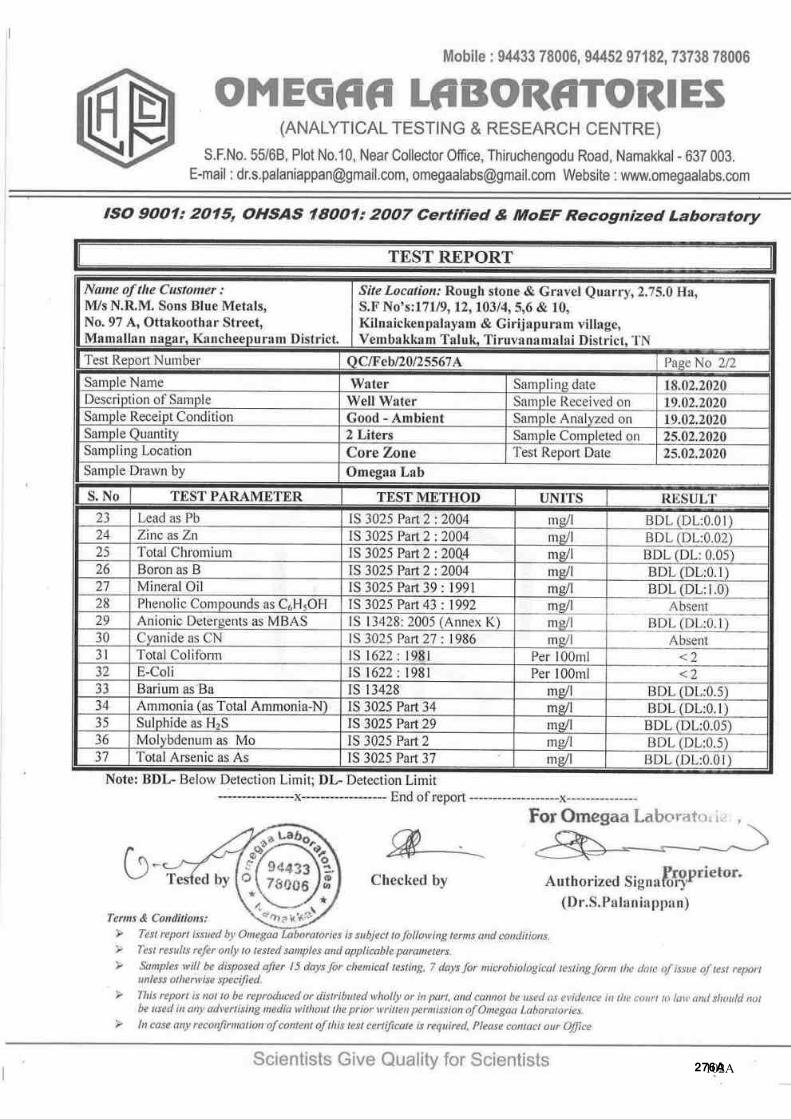
102A
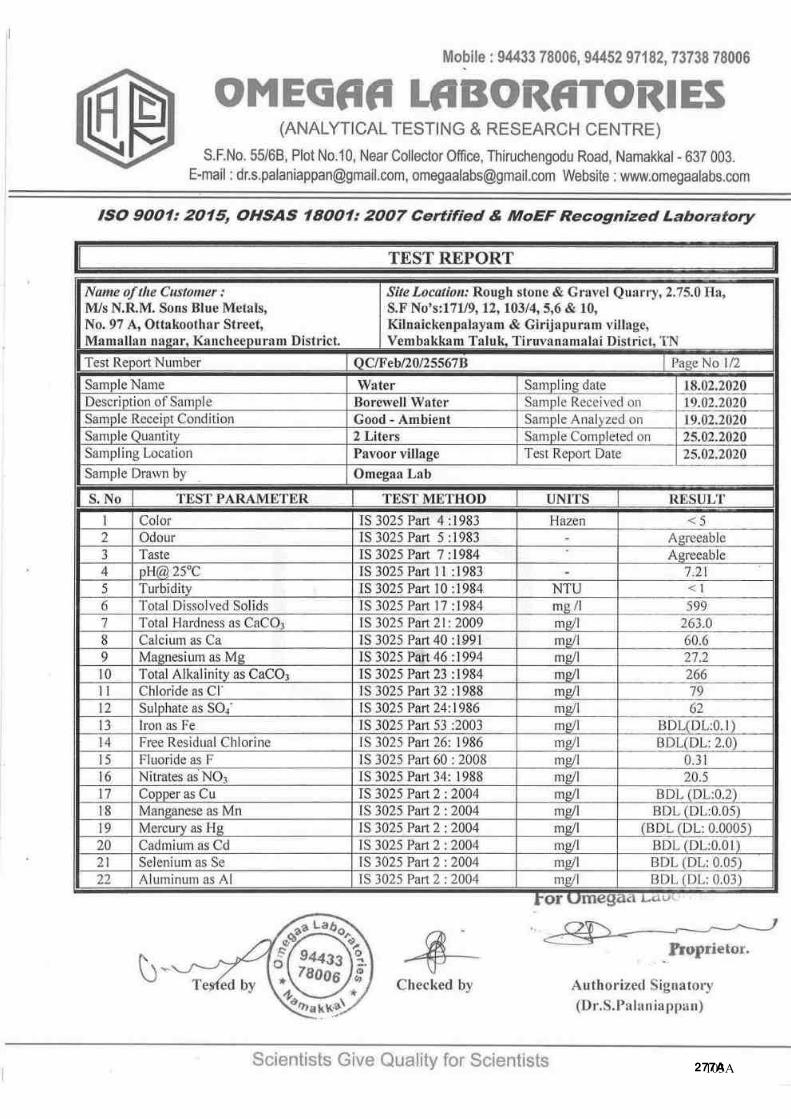
103A
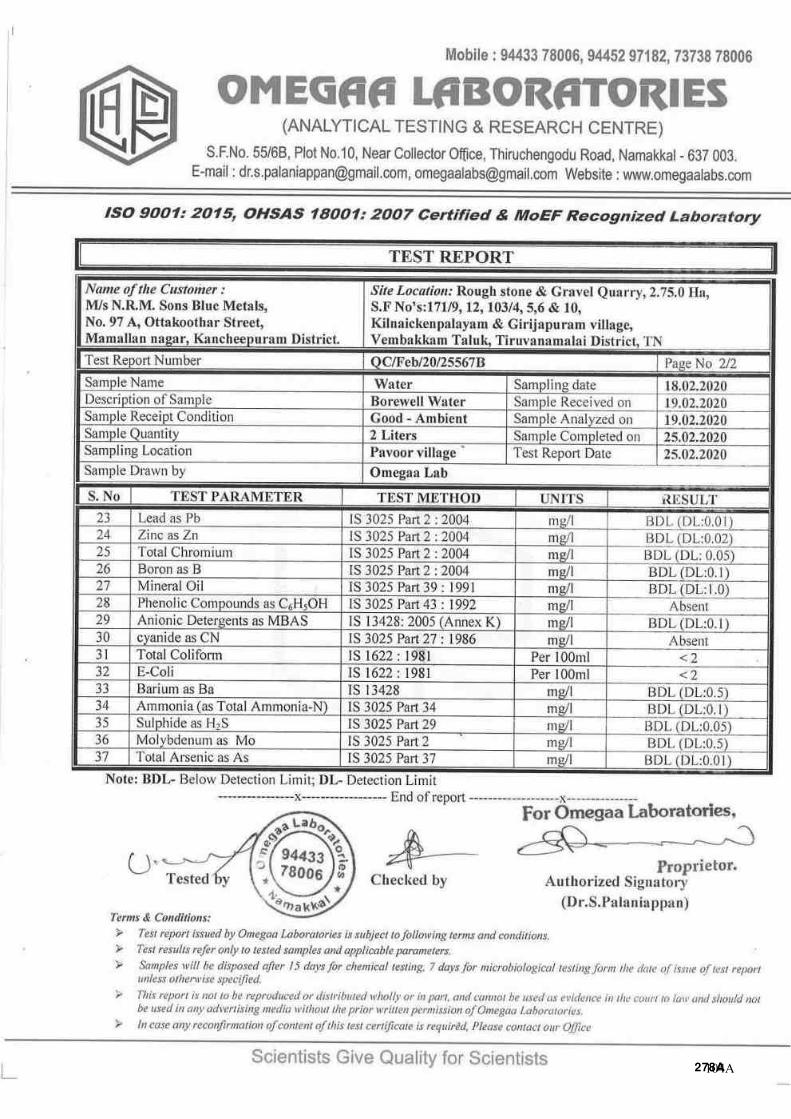
104A
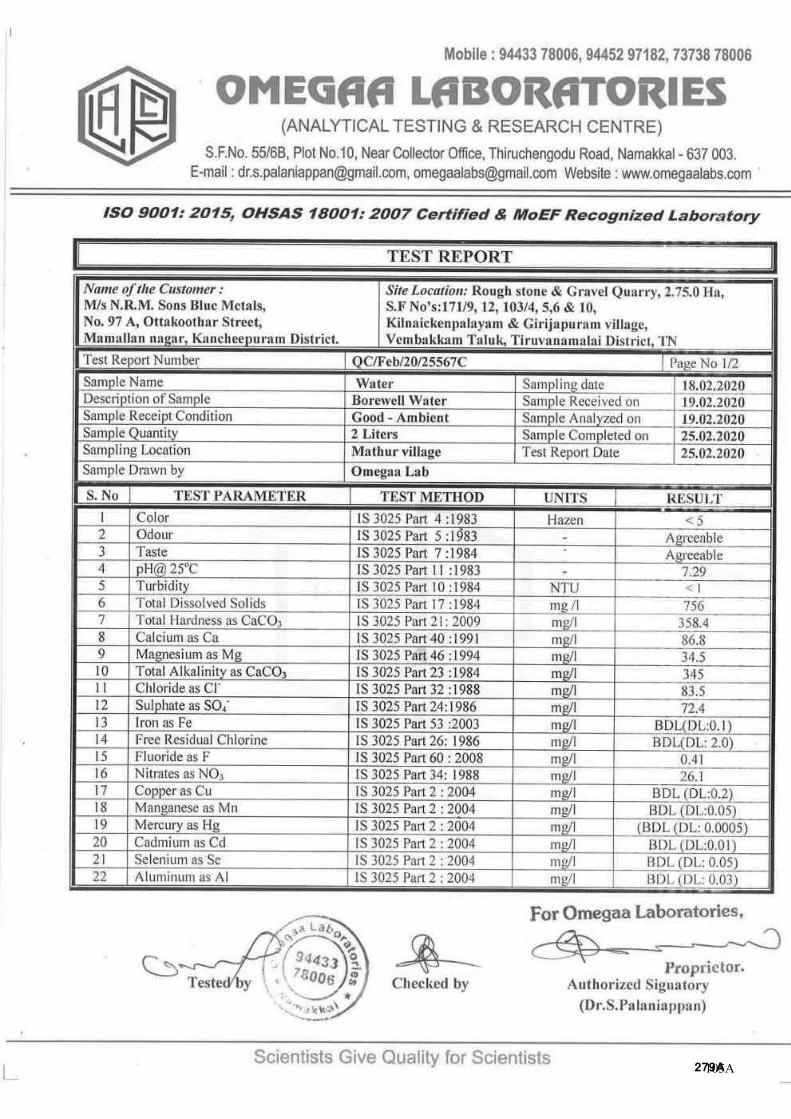
105A
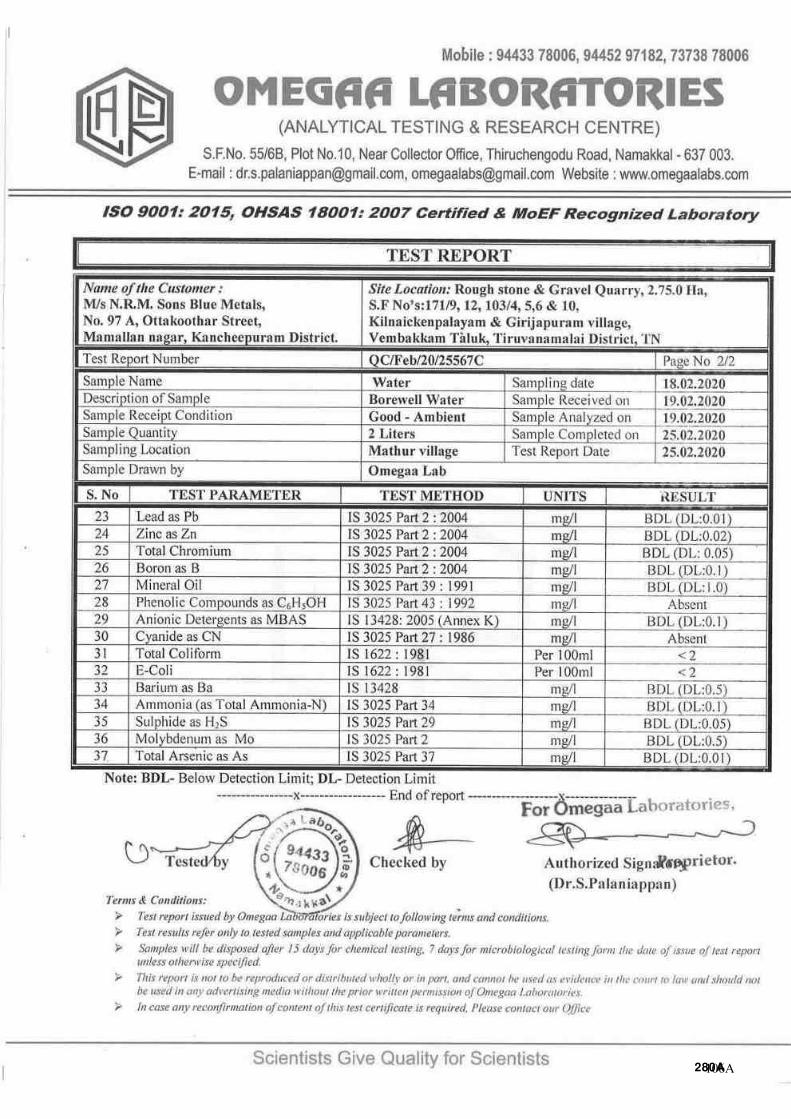
106A
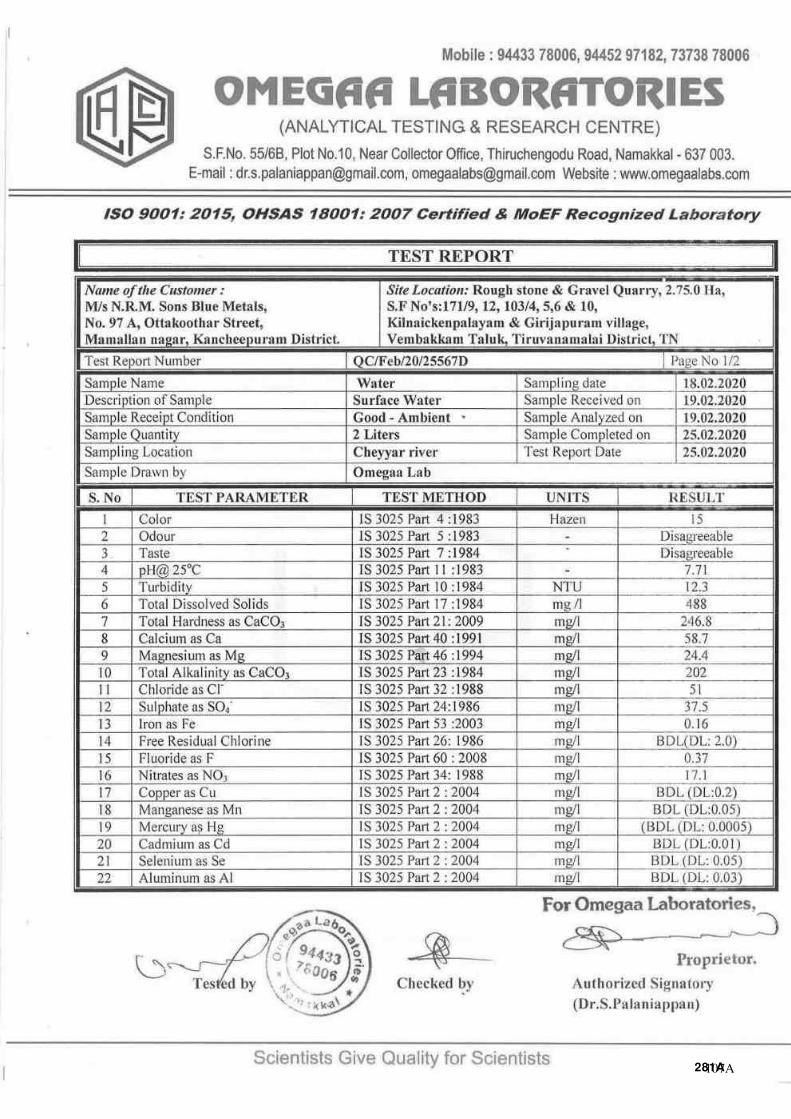
107A
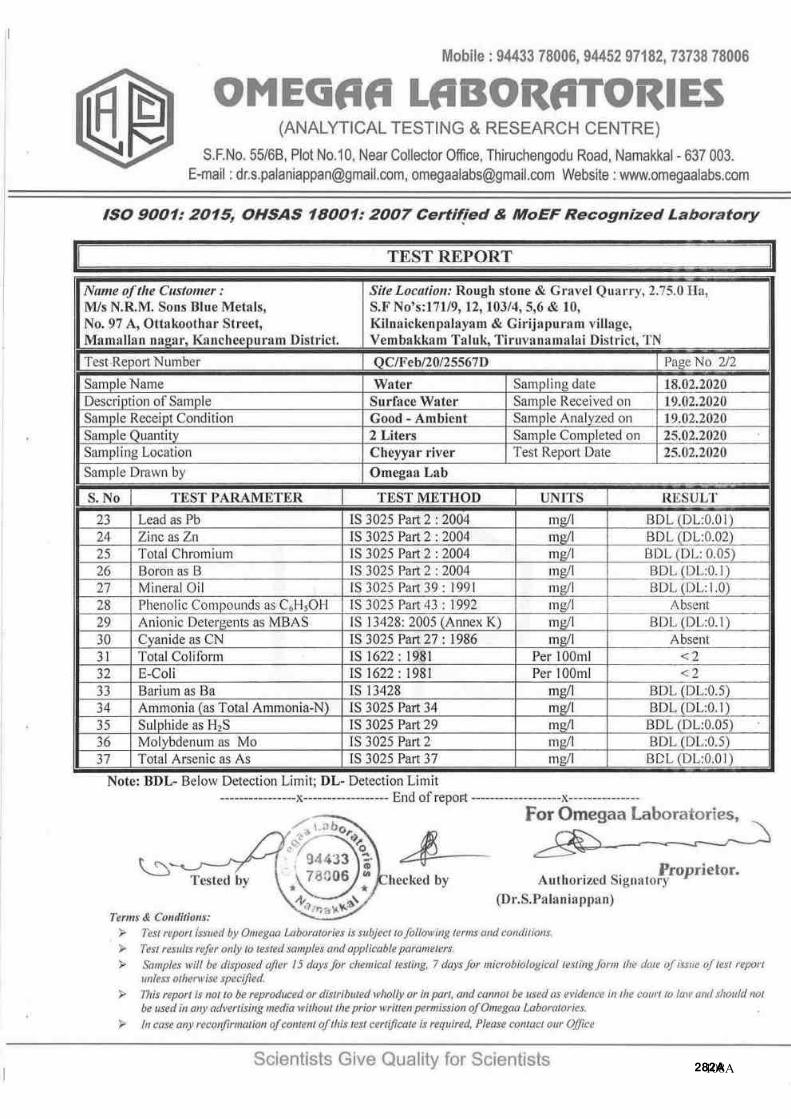
108A
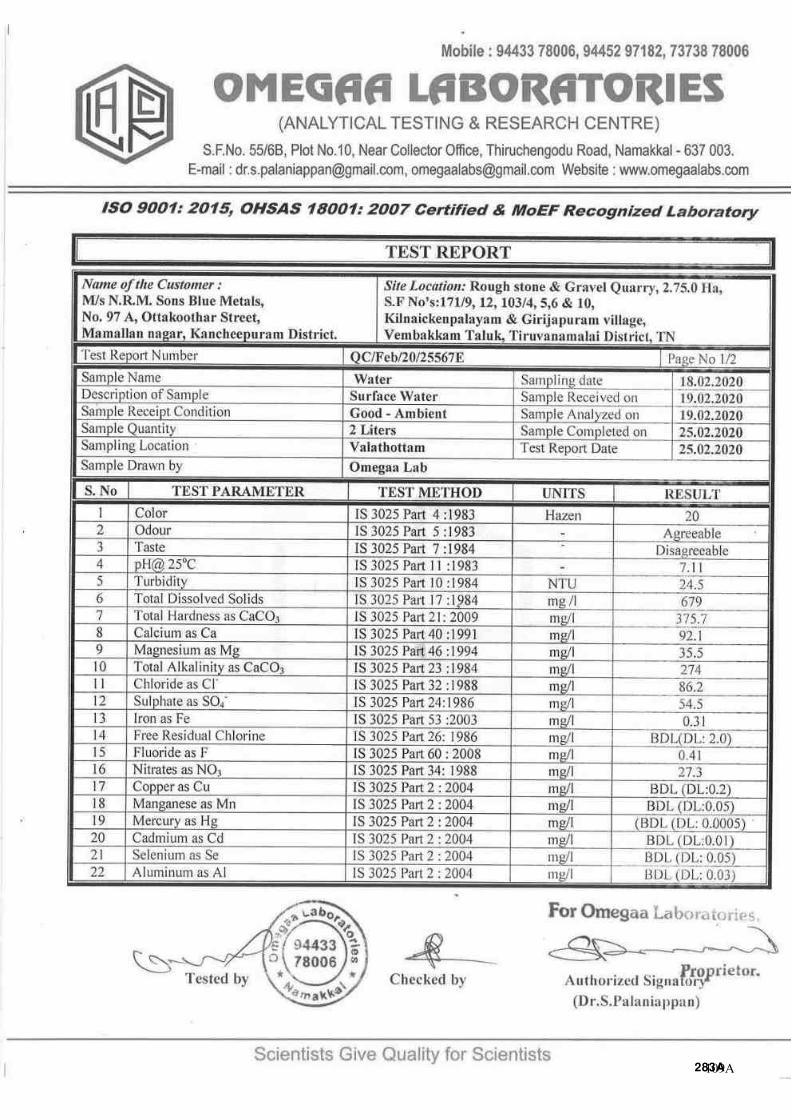
109A
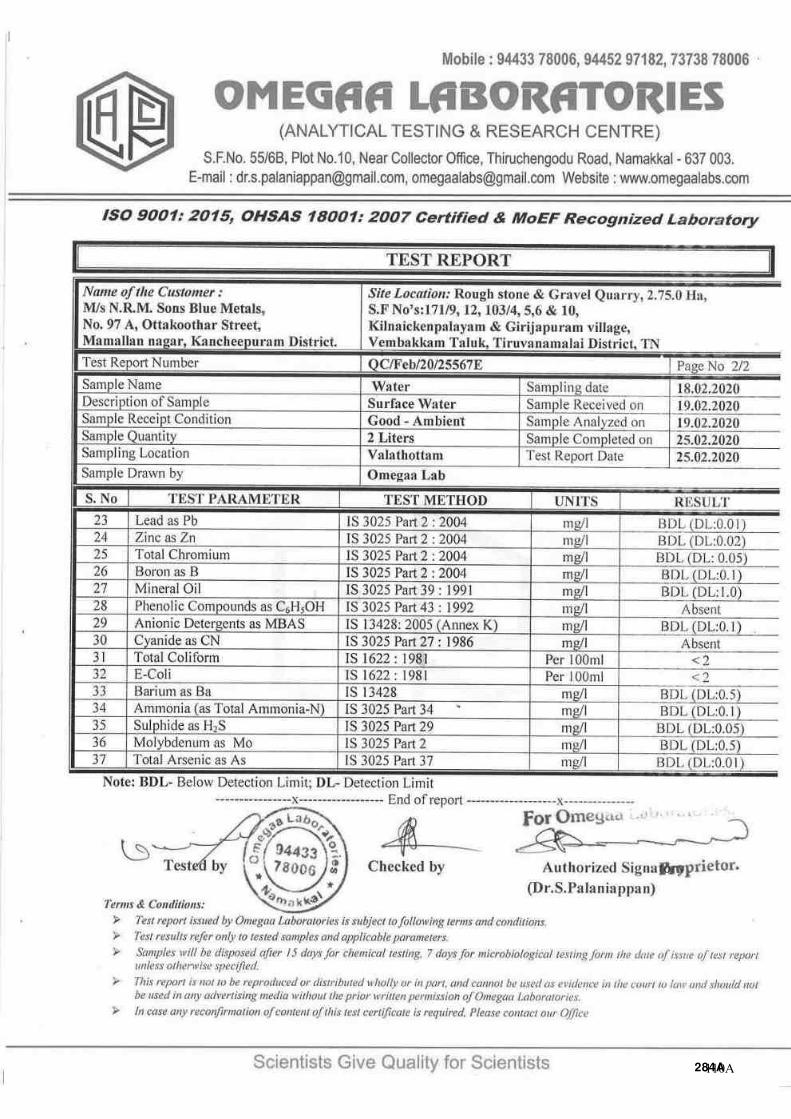
110A
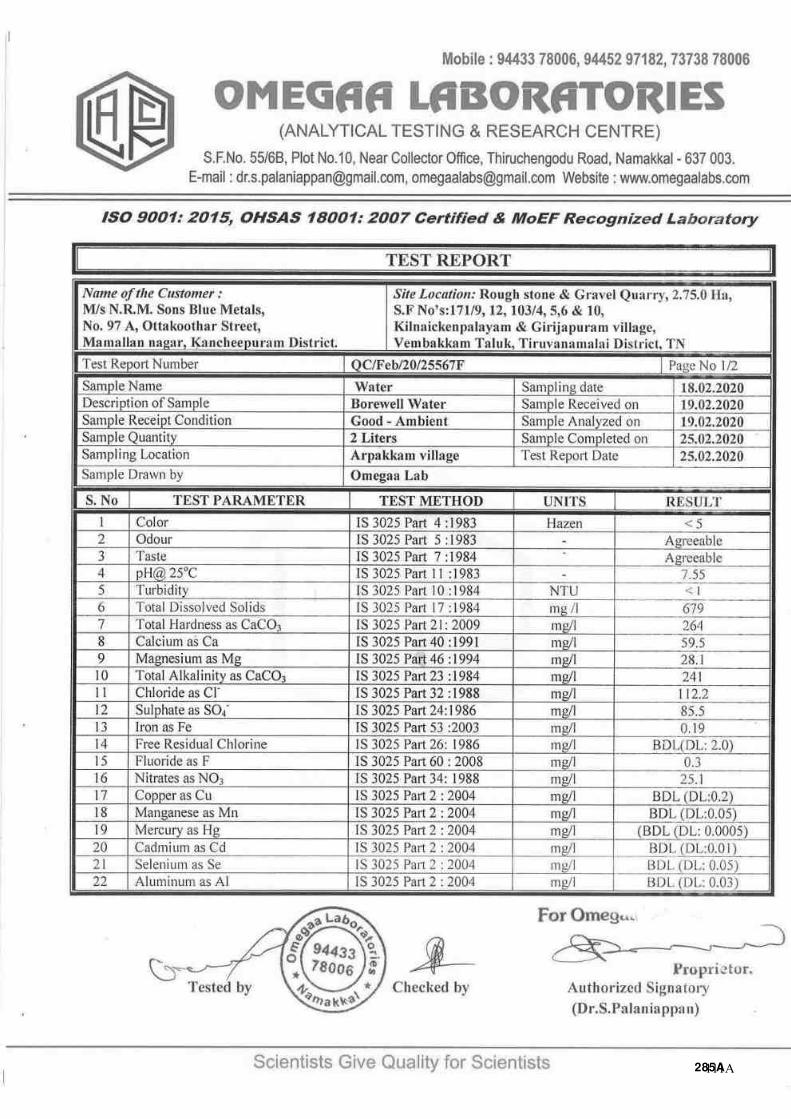
111A
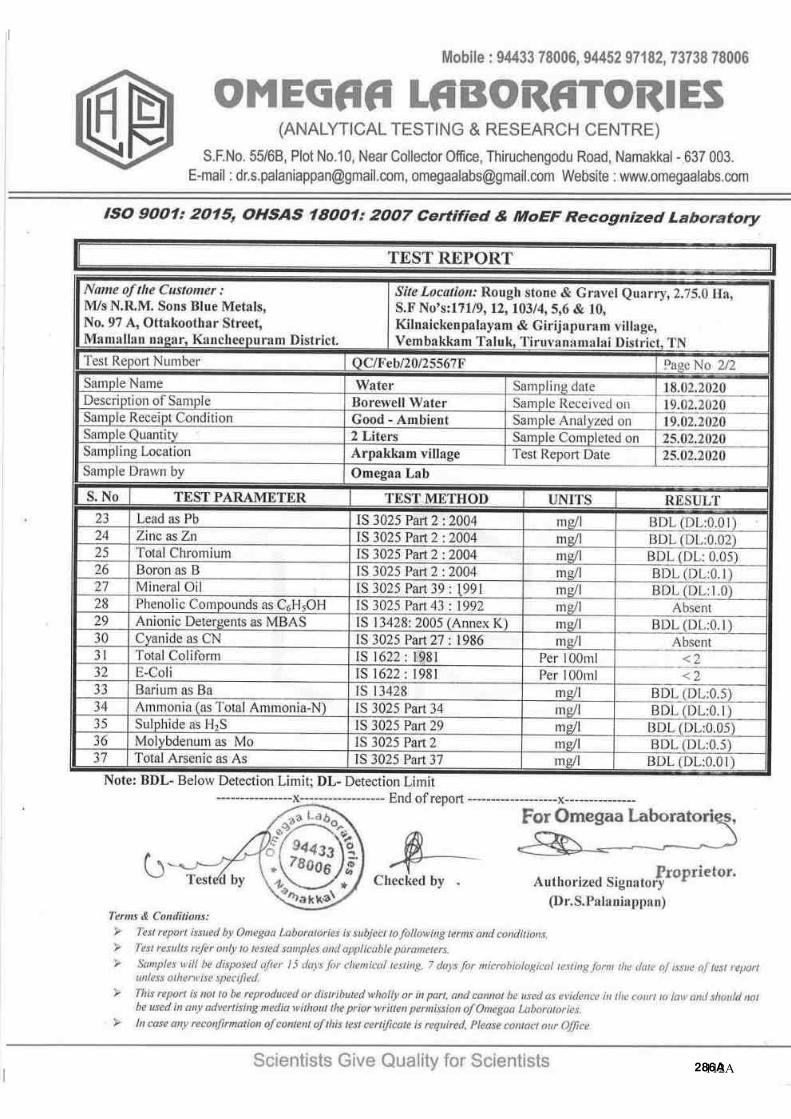
112A
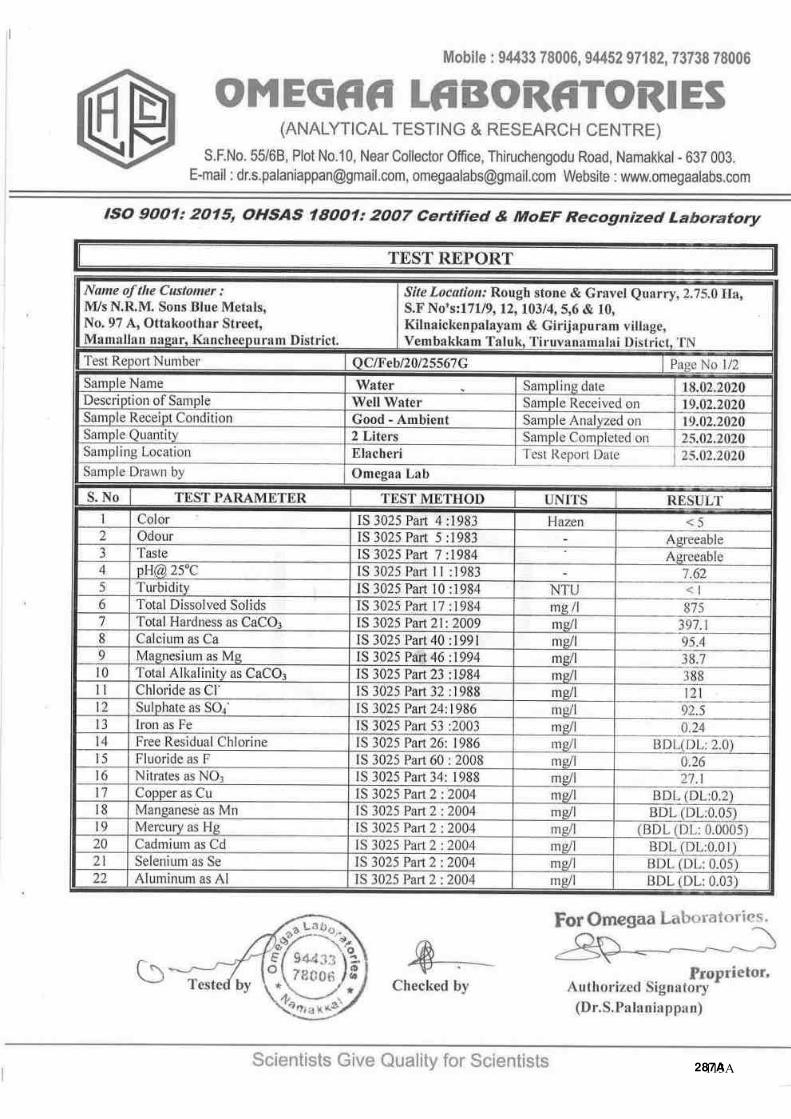
113A
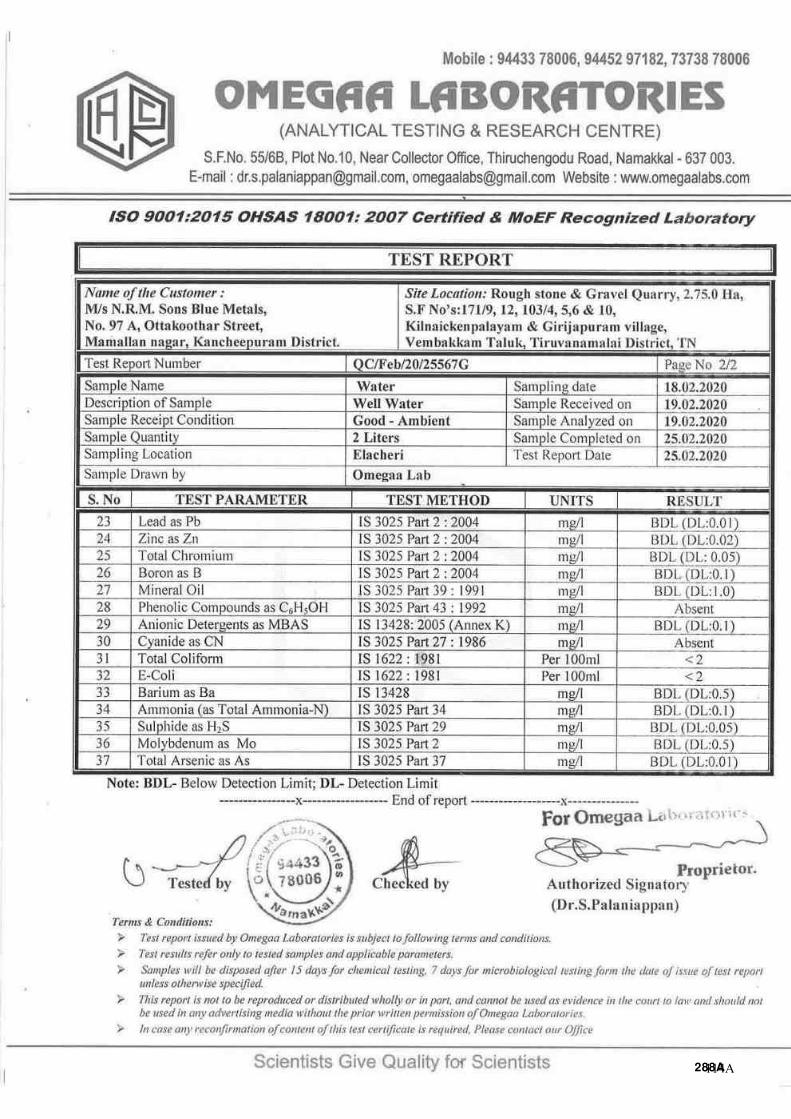
114A

115A
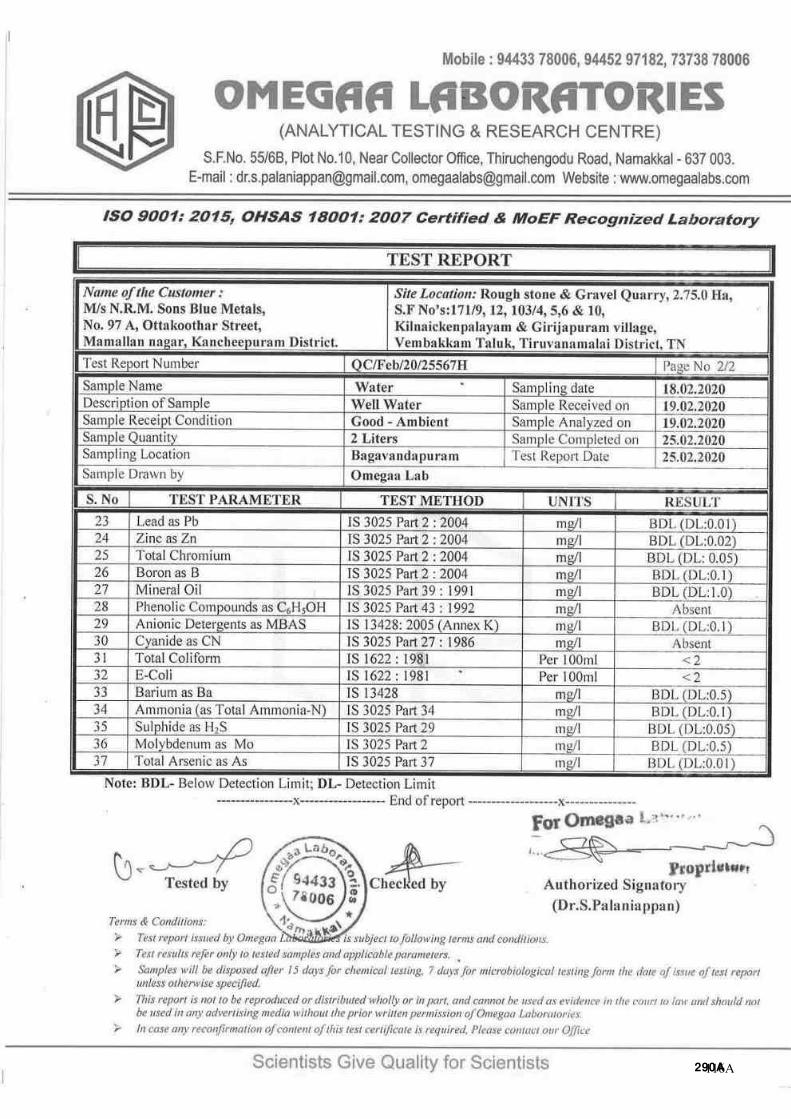
116A
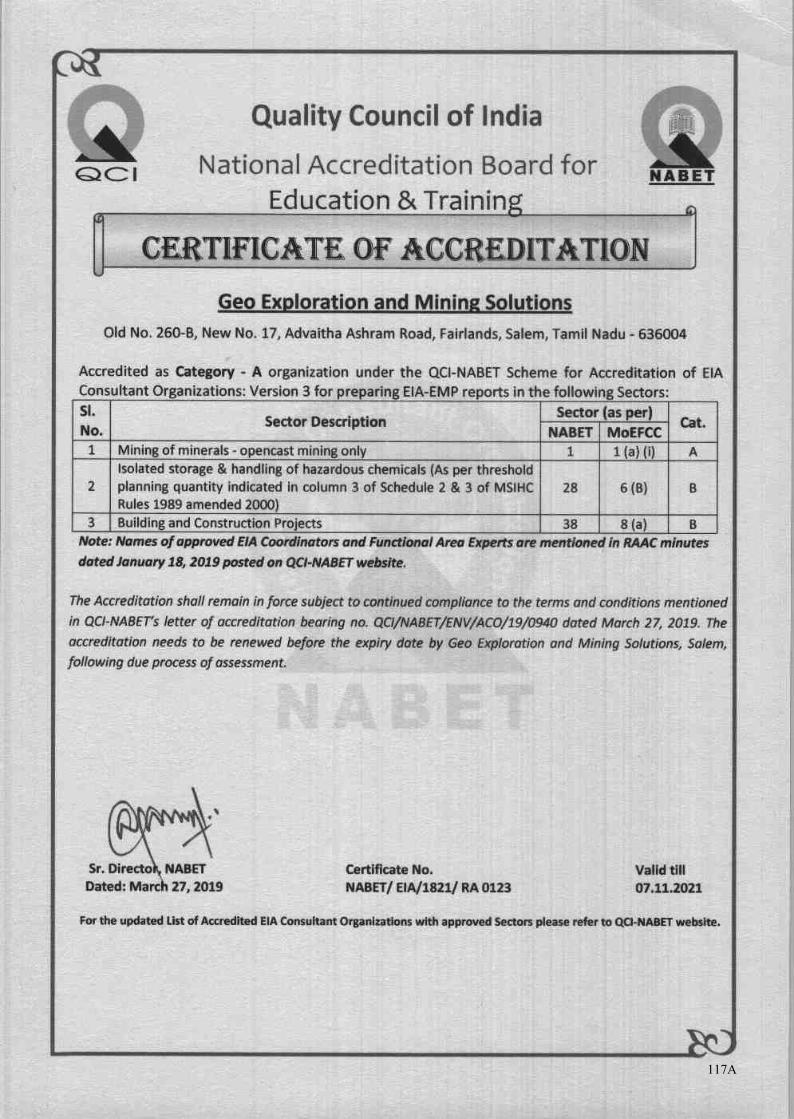
117A
Related Documents
![TAMIL NADU GOVERNMENT GAZETTEOct. 14, 2009] TAMIL NADU GOVERNMENT GAZETTE 1555 I, C. Nadhiya, daughter of Thiru V. Chinnaiya, born on 4th April 1991 (native district: Tiruchirappalli),](https://static.cupdf.com/doc/110x72/5f61f56d3590a2059f558a0b/tamil-nadu-government-oct-14-2009-tamil-nadu-government-gazette-1555-i-c-nadhiya.jpg)
![TAMIL NADU GOVERNMENT GAZETTEFeb. 12, 2014] TAMIL NADU GOVERNMENT GAZETTE 347 4963.I, K. Poulraj, son of Thiru Kulandaisamy, born on 7th April 1963 (native district: Madurai), residing](https://static.cupdf.com/doc/110x72/5f032ea57e708231d407f248/tamil-nadu-government-feb-12-2014-tamil-nadu-government-gazette-347-4963i-k.jpg)


![TAMIL NADU GOVERNMENT GAZETTE · Nov. 11, 2015] TAMIL NADU GOVERNMENT GAZETTE 3381 48976. I, A. Abinaya alias Harinijagdish, daughter of Thiru Ashok Jagadish, born on 28th July 1992](https://static.cupdf.com/doc/110x72/603b7ba84f43bd7a246e4f1d/tamil-nadu-government-nov-11-2015-tamil-nadu-government-gazette-3381-48976-i.jpg)