Third Quarter 2017 Earnings Presentation October 24, 2017

Welcome message from author
This document is posted to help you gain knowledge. Please leave a comment to let me know what you think about it! Share it to your friends and learn new things together.
Transcript

Third Quarter 2017 Earnings Presentation
October 24, 2017
1
This presentation contains “forward-looking statements” made pursuant to the safe harbor provisions of the Private Securities Litigation Reform Act of
1995. All statements other than statements of historical fact are forward-looking statements. You can identify these forward-looking statements
through the Company’s use of words such as “believes,” “anticipates,” “expects,” “may,” “will,” “assumes,” “should,” “predicts,” “could,” “would,”
“intends,” “targets,” “estimates,” “projects,” “plans,” “potential” and other similar words and expressions of the future or otherwise regarding the
outlook for the Company’s future business and financial performance and/or the performance of the banking and mortgage industry and economy in
general and the Company’s acquisition of the Clayton Banks and the benefits, cost, and financial impact thereof. Investors are cautioned that any
such forward-looking statements are not guarantees of future performance and involve known and unknown risks and uncertainties which may cause
the actual results, performance or achievements of the Company to be materially different from the future results, performance or achievements
expressed or implied by such forward-looking statements.
Forward-looking statements are based on the information known to, and current beliefs and expectations of, the Company’s management and are
subject to significant risks and uncertainties. Actual results may differ materially from those contemplated by such forward-looking statements. A
number of factors could cause actual results to differ materially from those contemplated by the forward-looking statements in this news release
including, without limitation, the risks and other factors set forth in the Company’s December 31, 2016 Form 10-K, filed with the SEC on March 31,
2017 under the captions “Cautionary note regarding forward-looking statements” and “Risk factors.” Many of these factors are beyond the Company’s
ability to control or predict. The Company believes the forward-looking statements contained herein are reasonable; however, undue reliance should
not be placed on any forward-looking statements, which are based on current expectations and speak only as of the date that they are made. The
Company does not assume any obligation to update any forward-looking statements as a result of new information, future developments or otherwise,
except as otherwise may be required by law.
Forward looking statements

2
Use of non-GAAP financial measures
This presentation contains certain financial measures that are not measures recognized under U.S. generally accepted accounting principles (GAAP)
and therefore are considered non-GAAP financial measures. These non‐GAAP financial measures include, without limitation, pro forma core net income,
pro forma core diluted earnings per share, core efficiency ratio (tax equivalent basis), banking segment core efficiency ratio (tax equivalent basis),
mortgage segment core efficiency ratio (tax equivalent basis), pro forma core return on average assets and equity, and pro forma core total revenue.
Each of these non-GAAP metrics excludes certain income and expense items that the Company’s management considers to be non‐core in nature. The
Company refers to these non‐GAAP measures as core measures. This Earnings Release also presents tangible assets, tangible common equity,
tangible book value per common share, tangible common equity to tangible assets, return on tangible common equity, pro forma return on average
tangible common equity and pro forma core return on average tangible common equity. Each of these non-GAAP metrics excludes the impact of
goodwill and other intangibles.
The Company’s management uses these non-GAAP financial measures in their analysis of the Company’s performance, financial condition and the
efficiency of its operations as management believes such measures facilitate period-to-period comparisons and provide meaningful indications of its
operating performance as they eliminate both gains and charges that management views as non-recurring or not indicative of operating performance.
Management believes that these non-GAAP financial measures provide a greater understanding of ongoing operations and enhance comparability of
results with prior periods as well as demonstrating the effects of significant non-core gains and charges in the current and prior periods. The Company’s
management also believes that investors find these non-GAAP financial measures useful as they assist investors in understanding our underlying
operating performance and in the analysis of ongoing operating trends. In addition, because intangible assets such as goodwill and other intangibles,
and the other items excluded each vary extensively from company to company, the Company believes that the presentation of this information allows
investors to more easily compare the Company’s results to the results of other companies. However, the non-GAAP financial measures discussed
herein should not be considered in isolation or as a substitute for the most directly comparable or other financial measures calculated in accordance with
GAAP. Moreover, the manner in which we calculate the non-GAAP financial measures discussed herein may differ from that of other companies
reporting measures with similar names. You should understand how such other banking organizations calculate their financial measures similar or with
names similar to the non-GAAP financial measures we have discussed herein when comparing such non-GAAP financial measures. A reconciliation of
these non-GAAP financial measures to the most directly comparable GAAP measures are provided on the appendix to this presentation.
3
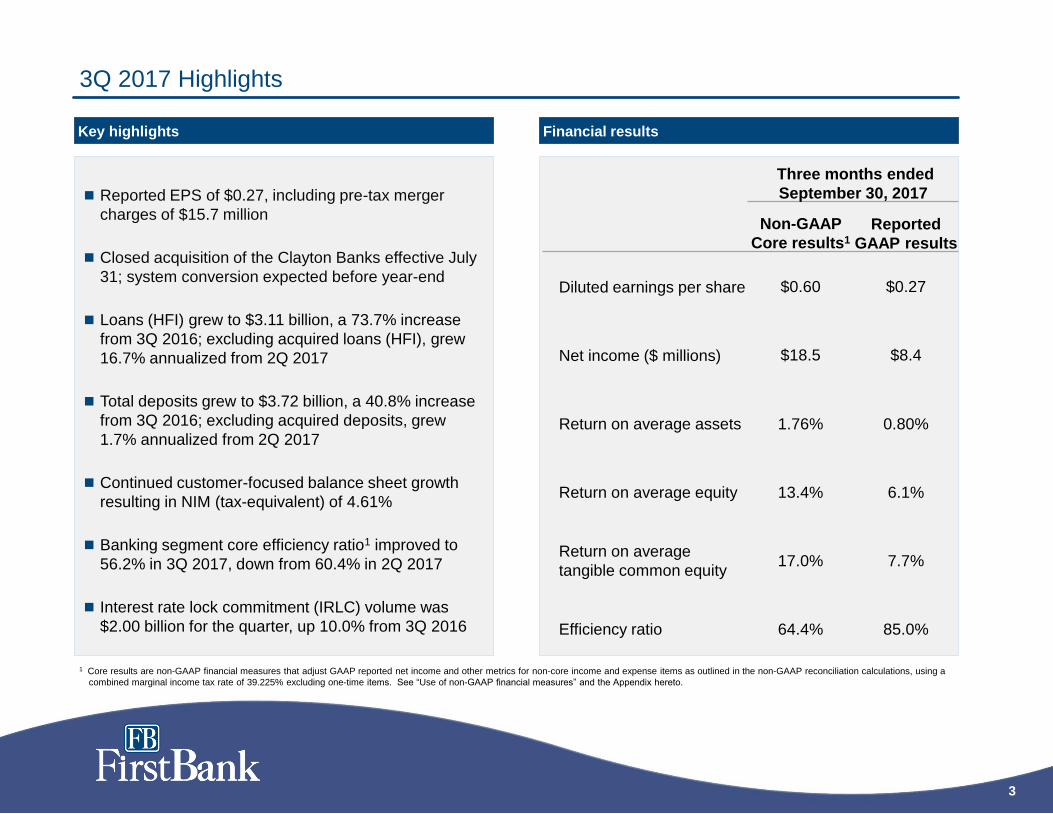
Three months ended
September 30, 2017
Non-GAAP
Core results1
Reported
GAAP results
Diluted earnings per share $0.60 $0.27
Net income ($ millions) $18.5 $8.4
Return on average assets 1.76% 0.80%
Return on average equity 13.4% 6.1%
Return on average
tangible common equity17.0% 7.7%
Efficiency ratio 64.4% 85.0%
3Q 2017 Highlights
Reported EPS of $0.27, including pre-tax merger
charges of $15.7 million
Closed acquisition of the Clayton Banks effective July
31; system conversion expected before year-end
Loans (HFI) grew to $3.11 billion, a 73.7% increase
from 3Q 2016; excluding acquired loans (HFI), grew
16.7% annualized from 2Q 2017
Total deposits grew to $3.72 billion, a 40.8% increase
from 3Q 2016; excluding acquired deposits, grew
1.7% annualized from 2Q 2017
Continued customer-focused balance sheet growth
resulting in NIM (tax-equivalent) of 4.61%
Banking segment core efficiency ratio1 improved to
56.2% in 3Q 2017, down from 60.4% in 2Q 2017
Interest rate lock commitment (IRLC) volume was
$2.00 billion for the quarter, up 10.0% from 3Q 2016
Key highlights Financial results
1 Core results are non-GAAP financial measures that adjust GAAP reported net income and other metrics for non-core income and expense items as outlined in the non-GAAP reconciliation calculations, using a
combined marginal income tax rate of 39.225% excluding one-time items. See “Use of non-GAAP financial measures” and the Appendix hereto.
4
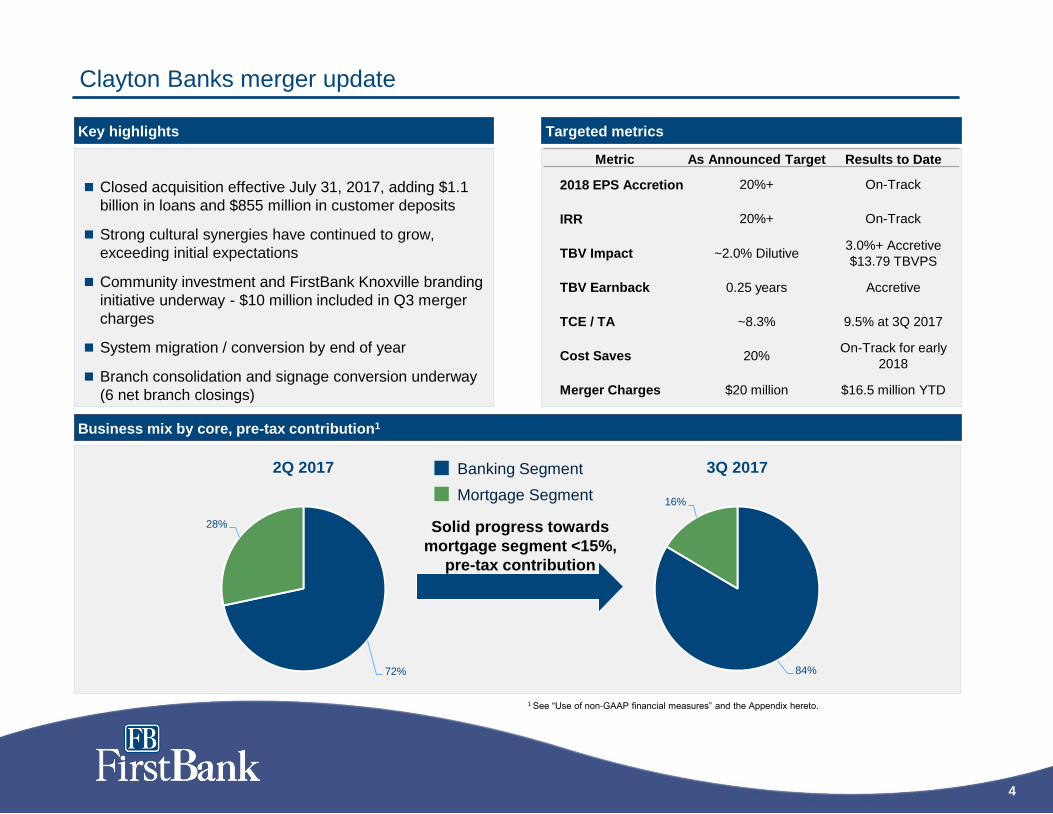
72%
28%
2Q 2017
84%
16%
3Q 2017
Clayton Banks merger update
Closed acquisition effective July 31, 2017, adding $1.1
billion in loans and $855 million in customer deposits
Strong cultural synergies have continued to grow,
exceeding initial expectations
Community investment and FirstBank Knoxville branding
initiative underway - $10 million included in Q3 merger
charges
System migration / conversion by end of year
Branch consolidation and signage conversion underway
(6 net branch closings)
Key highlights Targeted metrics
Metric As Announced Target Results to Date
2018 EPS Accretion 20%+ On-Track
IRR 20%+ On-Track
TBV Impact ~2.0% Dilutive3.0%+ Accretive
$13.79 TBVPS
TBV Earnback 0.25 years Accretive
TCE / TA ~8.3% 9.5% at 3Q 2017
Cost Saves 20%On-Track for early
2018
Merger Charges $20 million $16.5 million YTD
Business mix by core, pre-tax contribution1
Solid progress towards
mortgage segment <15%,
pre-tax contribution
Banking Segment
Mortgage Segment
1 See “Use of non-GAAP financial measures” and the Appendix hereto.

5
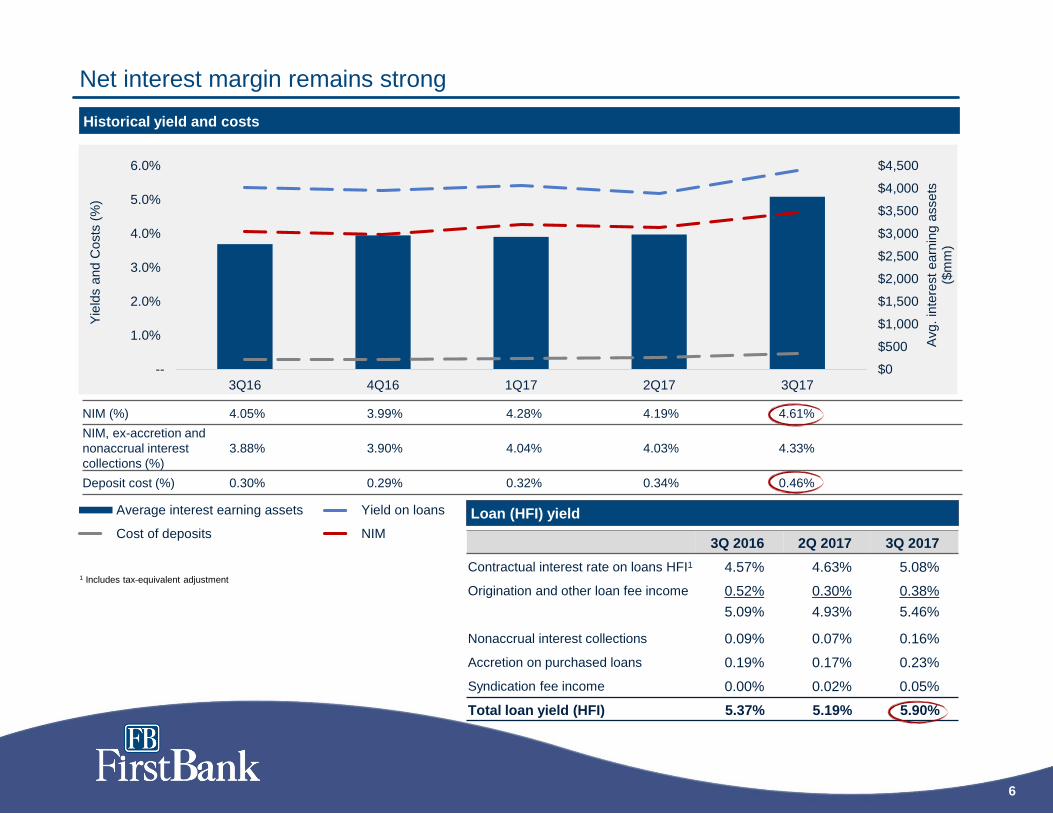
4.05% 3.99%
4.28% 4.19%
4.61%
3Q16 4Q16 1Q17 2Q17 3Q17
Consistently delivering balanced profitability and growth
Drivers of profitability
Core pro forma return on average assets1 ($mn)
Net interest margin
$44
$31 $31 $36 $38
3Q16 4Q16 1Q17 2Q17 3Q17
Noninterest income ($mm)
86% 88% 84% 88% 96%
68% 69% 70% 72% 84%
18% 19% 14% 16% 12%
3Q16 4Q16 1Q17 2Q17 3Q17
Loans excluding HFS Loans HFS
Loans / deposits
0.84%
0.99%
1.28%
1.54%1.62%
2013 2014 2015 2016 YTD17
1 Our pro forma net income includes a pro forma provision for federal income taxes using a combined effective income tax rate of 35.37%, 35.63%, 35.08% and 36.75%, for the years ended December 31, 2013,
2014, 2015 and 2016, respectively, and also include the exclusion of a one-time tax charge in 3Q 2016. The years ended December 31, 2013, 2014, 2015 and 2016 are annual percentages. 2 Includes $3.6 million of acquired excess land and facilities at September 30, 2017 and $13.6 million of GNMA rebooked loans – see page 11 of the Quarterly Financial Supplement.
NPA / assets (%)
0.68%0.58% 0.56% 0.58%
0.88%
3Q16 4Q16 1Q17 2Q17 3Q172
6
Net interest margin remains strong
Historical yield and costs
1 Includes tax-equivalent adjustment
NIM (%) 4.05% 3.99% 4.28% 4.19% 4.61%
NIM, ex-accretion and
nonaccrual interest
collections (%)
3.88% 3.90% 4.04% 4.03% 4.33%
Deposit cost (%) 0.30% 0.29% 0.32% 0.34% 0.46%
Loan (HFI) yield
3Q 2016 2Q 2017 3Q 2017
Contractual interest rate on loans HFI1 4.57% 4.63% 5.08%
Origination and other loan fee income 0.52% 0.30% 0.38%
5.09% 4.93% 5.46%
Nonaccrual interest collections 0.09% 0.07% 0.16%
Accretion on purchased loans 0.19% 0.17% 0.23%
Syndication fee income 0.00% 0.02% 0.05%
Total loan yield (HFI) 5.37% 5.19% 5.90%
Average interest earning assets Yield on loans
Cost of deposits NIM
$0
$500
$1,000
$1,500
$2,000
$2,500
$3,000
$3,500
$4,000
$4,500
--
1.0%
2.0%
3.0%
4.0%
5.0%
6.0%
3Q16 4Q16 1Q17 2Q17 3Q17
Avg.
inte
rest
earn
ing a
ssets
($
mm
)
Yie
lds a
nd C
osts
(%
)
7
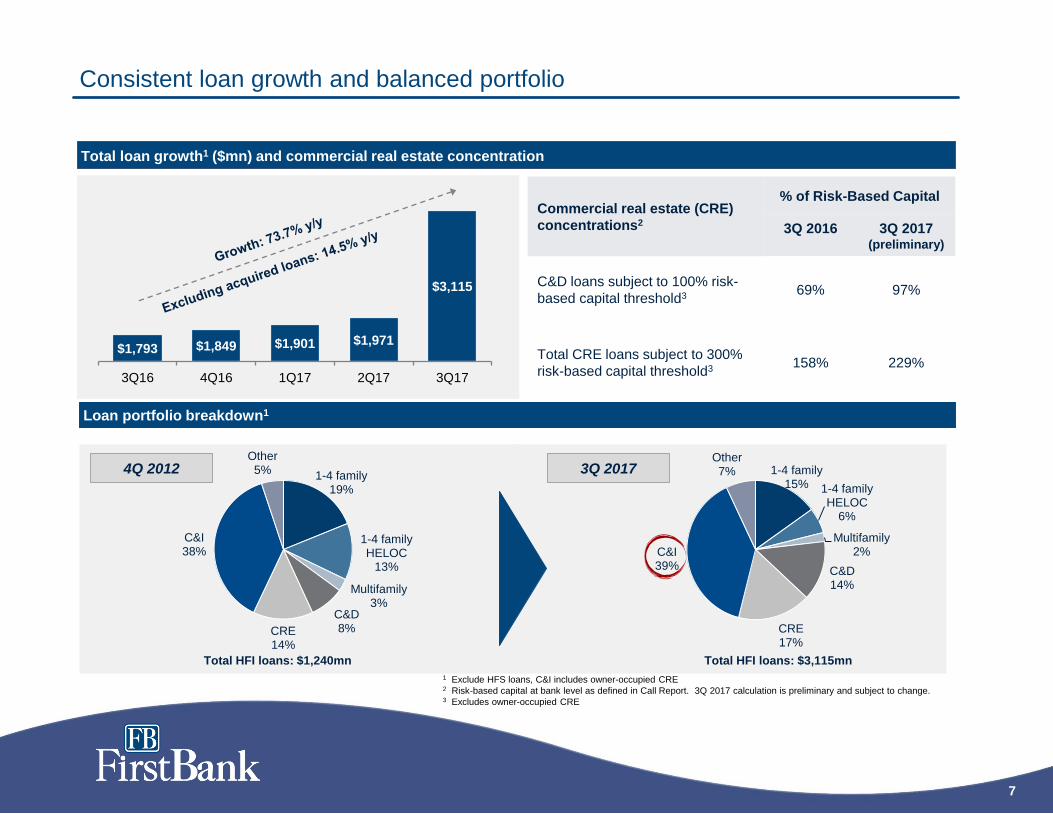
Total HFI loans: $1,240mn
1-4 family19%
1-4 family HELOC
13%
Multifamily3%
C&D8%CRE
14%
C&I38%
Other5% 1-4 family
15% 1-4 family HELOC
6%
Multifamily2%
C&D14%
CRE17%
C&I39%
Other7%
Consistent loan growth and balanced portfolio
Total loan growth1 ($mn) and commercial real estate concentration
Loan portfolio breakdown1
4Q 2012 3Q 2017
Total HFI loans: $3,115mn
1 Exclude HFS loans, C&I includes owner-occupied CRE2 Risk-based capital at bank level as defined in Call Report. 3Q 2017 calculation is preliminary and subject to change.3 Excludes owner-occupied CRE
$1,793 $1,849 $1,901 $1,971
$3,115
3Q16 4Q16 1Q17 2Q17 3Q17
Commercial real estate (CRE)
concentrations2
% of Risk-Based Capital
3Q 2016 3Q 2017(preliminary)
C&D loans subject to 100% risk-
based capital threshold3 69% 97%
Total CRE loans subject to 300%
risk-based capital threshold3 158% 229%
8
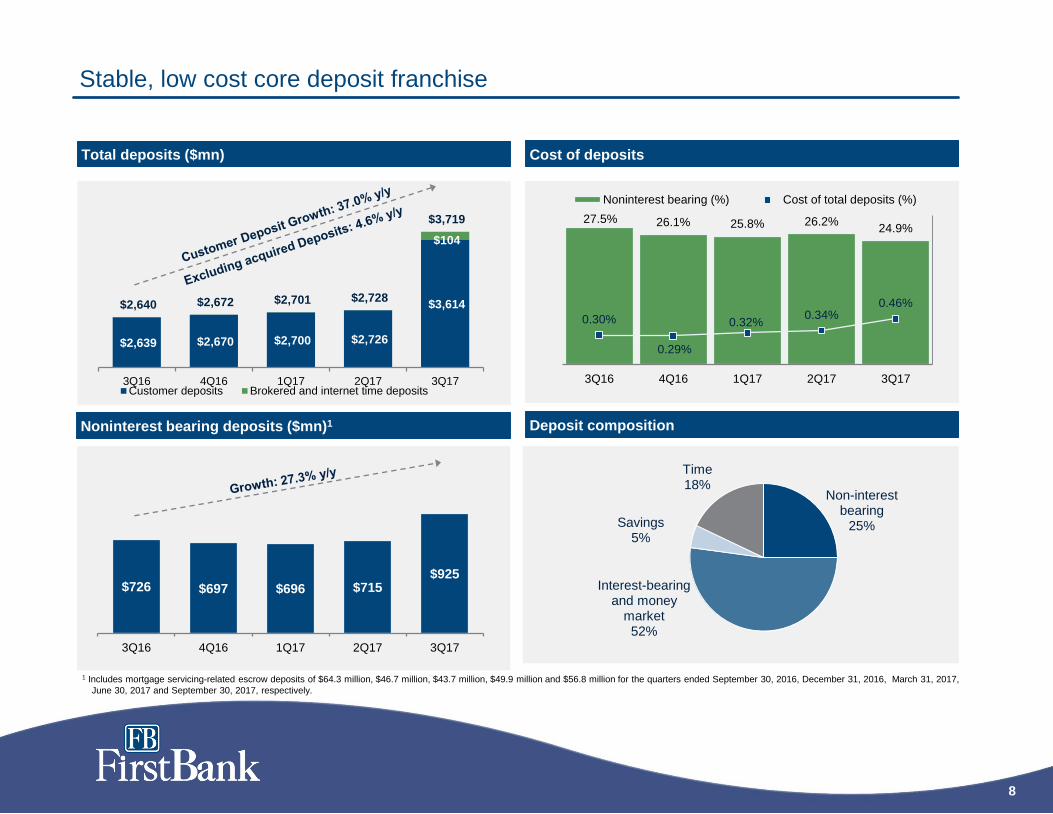
Stable, low cost core deposit franchise
27.5% 26.1% 25.8% 26.2%24.9%
0.30%
0.29%
0.32%0.34%
0.46%
0.0%
5.0%
10.0%
15.0%
20.0%
25.0%
30.0%
3Q16 4Q16 1Q17 2Q17 3Q17
Noninterest bearing (%) Cost of total deposits (%)
$726 $697 $696 $715$925
3Q16 4Q16 1Q17 2Q17 3Q17
$2,639 $2,670 $2,700 $2,726
$3,614
$104
$2,640 $2,672 $2,701 $2,728
$3,719
3Q16 4Q16 1Q17 2Q17 3Q17Customer deposits Brokered and internet time deposits
Total deposits ($mn)
1 Includes mortgage servicing-related escrow deposits of $64.3 million, $46.7 million, $43.7 million, $49.9 million and $56.8 million for the quarters ended September 30, 2016, December 31, 2016, March 31, 2017,
June 30, 2017 and September 30, 2017, respectively.
Noninterest bearing deposits ($mn)1 Deposit composition
Cost of deposits
Non-interest bearing
25%
Interest-bearing and money
market52%
Savings5%
Time18%
9
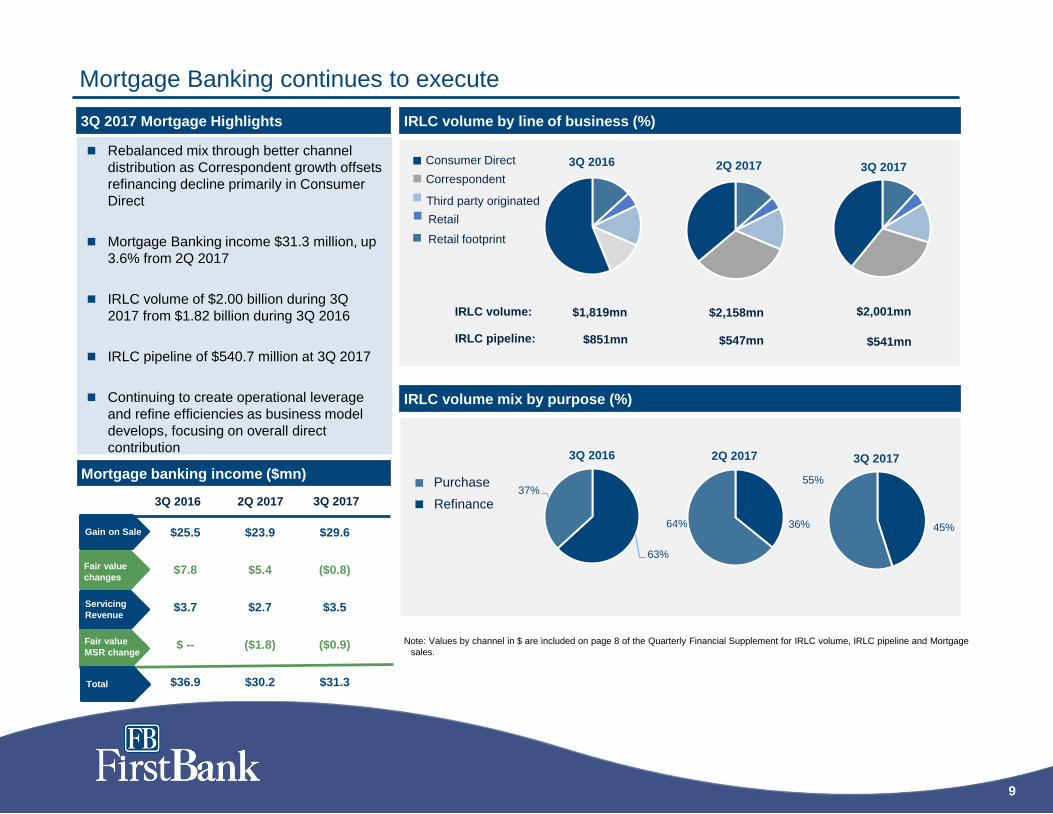
$25.5 $23.9 $29.6
$7.8 $5.4 ($0.8)
$3.7 $2.7 $3.5
$ -- ($1.8) ($0.9)
$36.9 $30.2 $31.3
Mortgage Banking continues to execute
Rebalanced mix through better channel
distribution as Correspondent growth offsets
refinancing decline primarily in Consumer
Direct
Mortgage Banking income $31.3 million, up
3.6% from 2Q 2017
IRLC volume of $2.00 billion during 3Q
2017 from $1.82 billion during 3Q 2016
IRLC pipeline of $540.7 million at 3Q 2017
Continuing to create operational leverage
and refine efficiencies as business model
develops, focusing on overall direct
contribution
3Q 2017 Mortgage Highlights
Note: Values by channel in $ are included on page 8 of the Quarterly Financial Supplement for IRLC volume, IRLC pipeline and Mortgage
sales.
Gain on Sale
IRLC volume mix by purpose (%)
IRLC volume by line of business (%)
Consumer Direct
Correspondent
Third party originated
Retail
Retail footprint
Refinance
Purchase
36%64%
2Q 2017
63%
37%
3Q 2016
45%
55%
3Q 2017
3Q 2016 2Q 2017 3Q 2017
3Q 2016 2Q 2017 3Q 2017
$1,819mn $2,158mn $2,001mnIRLC volume:
IRLC pipeline: $851mn $547mn $541mn
Fair value
changes
Fair value
MSR change
Mortgage banking income ($mn)
Total
Servicing
Revenue
10
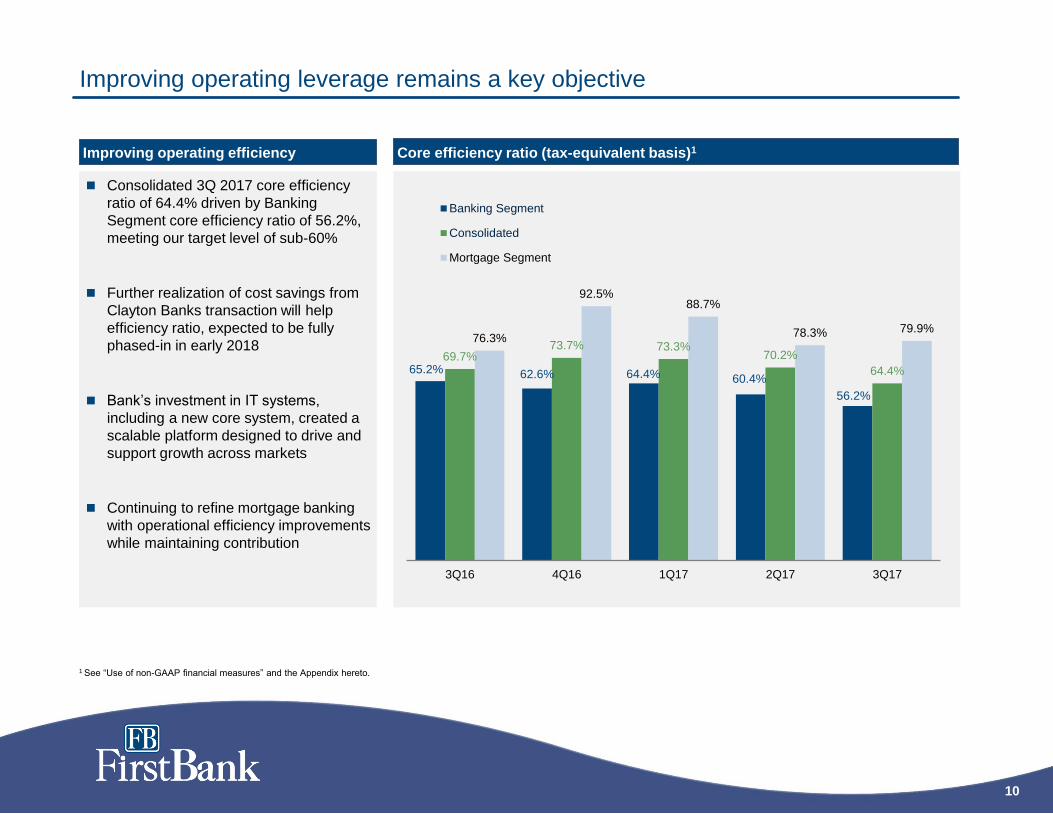
Improving operating leverage remains a key objective
Consolidated 3Q 2017 core efficiency
ratio of 64.4% driven by Banking
Segment core efficiency ratio of 56.2%,
meeting our target level of sub-60%
Further realization of cost savings from
Clayton Banks transaction will help
efficiency ratio, expected to be fully
phased-in in early 2018
Bank’s investment in IT systems,
including a new core system, created a
scalable platform designed to drive and
support growth across markets
Continuing to refine mortgage banking
with operational efficiency improvements
while maintaining contribution
65.2% 62.6% 64.4% 60.4%
56.2%
69.7% 73.7% 73.3%
70.2%
64.4%
76.3%
92.5% 88.7%
78.3% 79.9%
3Q16 4Q16 1Q17 2Q17 3Q17
Banking Segment
Consolidated
Mortgage Segment
Core efficiency ratio (tax-equivalent basis)1Improving operating efficiency
1 See “Use of non-GAAP financial measures” and the Appendix hereto.

11
Asset quality remains strong
0.12%0.17%
(0.31%)(0.25%)
(0.15%)
3Q16 4Q16 1Q17 2Q17 3Q17
1.30%1.18% 1.20% 1.18%
0.75%
3Q16 4Q16 1Q17 2Q17 3Q17
$40 $39 $38 $38
$60
$17 $16 $16 $16
$92
3Q16 4Q16 1Q17 2Q17 3Q17
Classified Purchased credit impaired
0.61% 0.57%0.49% 0.50%
0.29%
0.68%0.58% 0.56% 0.58%
0.88%
3Q16 4Q16 1Q17 2Q17 3Q17
NPLs / loans (HFI) NPAs / assets
Classified & PCI loans ($mn)
Net charge-offs / average loans
Nonperforming ratios
LLR / loans
1 Includes $3.6 million of acquired excess land and facilities at September 30, 2017 and $13.6 million of GNMA rebooked loans – see page 11 of the Quarterly Financial Supplement.
1
12
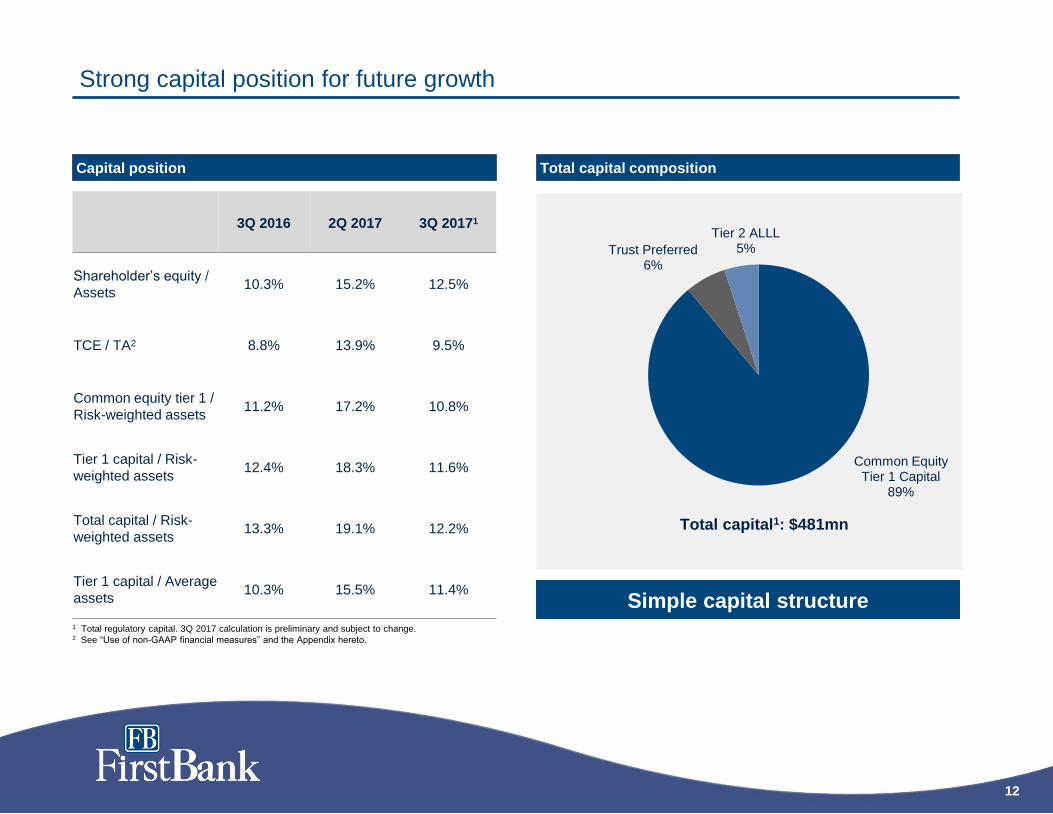
Common Equity Tier 1 Capital
89%
Trust Preferred6%
Tier 2 ALLL5%
Total capital1: $481mn
Strong capital position for future growth
1 Total regulatory capital. 3Q 2017 calculation is preliminary and subject to change.2 See “Use of non-GAAP financial measures” and the Appendix hereto.
Capital position Total capital composition
3Q 2016 2Q 2017 3Q 20171
Shareholder’s equity /
Assets10.3% 15.2% 12.5%
TCE / TA2 8.8% 13.9% 9.5%
Common equity tier 1 /
Risk-weighted assets11.2% 17.2% 10.8%
Tier 1 capital / Risk-
weighted assets12.4% 18.3% 11.6%
Total capital / Risk-
weighted assets13.3% 19.1% 12.2%
Tier 1 capital / Average
assets10.3% 15.5% 11.4%
Simple capital structure

13
Appendix
14
GAAP reconciliation and use of non-GAAP financial measures
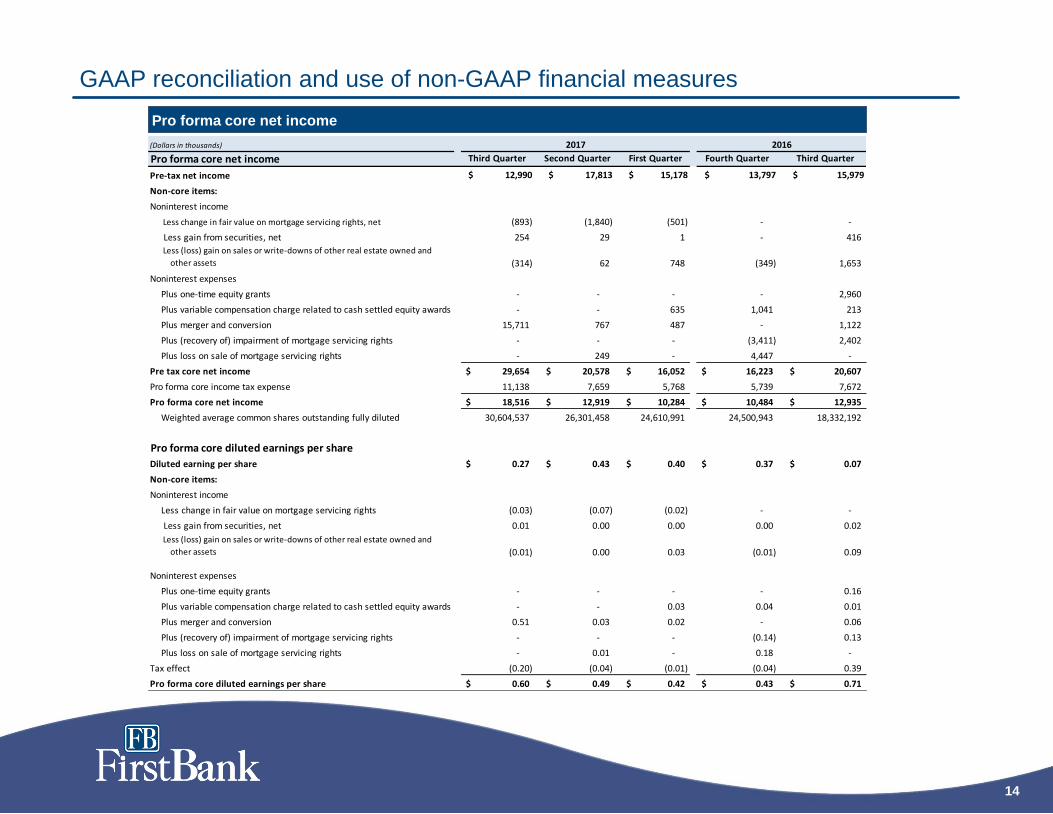
Pro forma core net income
(Dollars in thousands)
Pro forma core net income Third Quarter Second Quarter First Quarter Fourth Quarter Third Quarter
Pre-tax net income $ 12,990 $ 17,813 $ 15,178 $ 13,797 $ 15,979
Non-core items:
Noninterest income
Less change in fair value on mortgage servicing rights, net (893) (1,840) (501) - -
Less gain from securities, net 254 29 1 - 416
Less (loss) gain on sales or write-downs of other real estate owned and
other assets (314) 62 748 (349) 1,653
Noninterest expenses
Plus one-time equity grants - - - - 2,960
Plus variable compensation charge related to cash settled equity awards - - 635 1,041 213
Plus merger and conversion 15,711 767 487 - 1,122
Plus (recovery of) impairment of mortgage servicing rights - - - (3,411) 2,402
Plus loss on sale of mortgage servicing rights - 249 - 4,447 -
Pre tax core net income 29,654$ 20,578$ 16,052$ 16,223$ 20,607$
Pro forma core income tax expense 11,138 7,659 5,768 5,739 7,672
Pro forma core net income 18,516$ 12,919$ 10,284$ 10,484$ 12,935$
Weighted average common shares outstanding fully diluted 30,604,537 26,301,458 24,610,991 24,500,943 18,332,192
Pro forma core diluted earnings per share
Diluted earning per share 0.27$ 0.43$ 0.40$ 0.37$ 0.07$
Non-core items:
Noninterest income
Less change in fair value on mortgage servicing rights (0.03) (0.07) (0.02) - -
Less gain from securities, net 0.01 0.00 0.00 0.00 0.02
Less (loss) gain on sales or write-downs of other real estate owned and
other assets (0.01) 0.00 0.03 (0.01) 0.09
Noninterest expenses
Plus one-time equity grants - - - - 0.16
Plus variable compensation charge related to cash settled equity awards - - 0.03 0.04 0.01
Plus merger and conversion 0.51 0.03 0.02 - 0.06
Plus (recovery of) impairment of mortgage servicing rights - - - (0.14) 0.13
Plus loss on sale of mortgage servicing rights - 0.01 - 0.18 -
Tax effect (0.20) (0.04) (0.01) (0.04) 0.39
Pro forma core diluted earnings per share 0.60$ 0.49$ 0.42$ 0.43$ 0.71$
2017 2016
15
GAAP reconciliation and use of non-GAAP financial measures
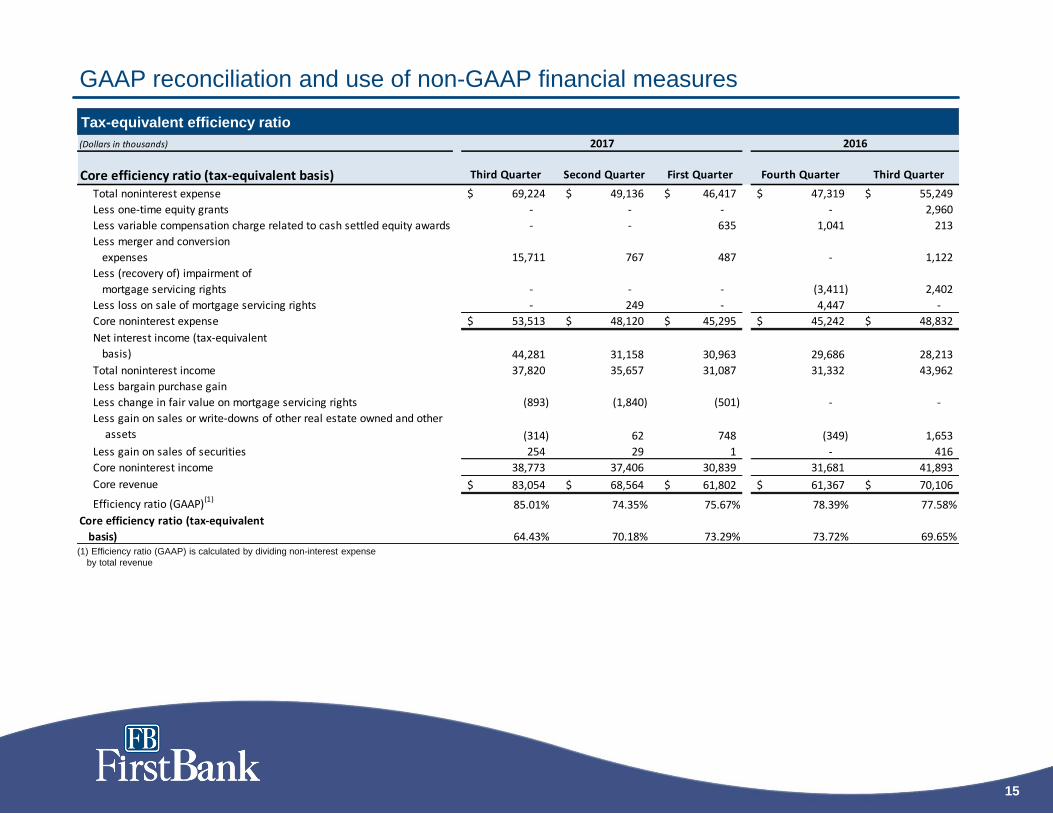
Tax-equivalent efficiency ratio
(1) Efficiency ratio (GAAP) is calculated by dividing non-interest expense
by total revenue
(Dollars in thousands)
Core efficiency ratio (tax-equivalent basis) Third Quarter Second Quarter First Quarter Fourth Quarter Third Quarter
Total noninterest expense 69,224$ 49,136$ 46,417$ 47,319$ 55,249$
Less one-time equity grants - - - - 2,960
Less variable compensation charge related to cash settled equity awards - - 635 1,041 213
Less merger and conversion
expenses 15,711 767 487 - 1,122
Less (recovery of) impairment of
mortgage servicing rights - - - (3,411) 2,402
Less loss on sale of mortgage servicing rights - 249 - 4,447 -
Core noninterest expense 53,513$ 48,120$ 45,295$ 45,242$ 48,832$
Net interest income (tax-equivalent
basis) 44,281 31,158 30,963 29,686 28,213
Total noninterest income 37,820 35,657 31,087 31,332 43,962
Less bargain purchase gain
Less change in fair value on mortgage servicing rights (893) (1,840) (501) - -
Less gain on sales or write-downs of other real estate owned and other
assets (314) 62 748 (349) 1,653
Less gain on sales of securities 254 29 1 - 416
Core noninterest income 38,773 37,406 30,839 31,681 41,893
Core revenue 83,054$ 68,564$ 61,802$ 61,367$ 70,106$
Efficiency ratio (GAAP)(1)85.01% 74.35% 75.67% 78.39% 77.58%
Core efficiency ratio (tax-equivalent
basis) 64.43% 70.18% 73.29% 73.72% 69.65%
2017 2016
16
GAAP reconciliation and use of non-GAAP financial measures
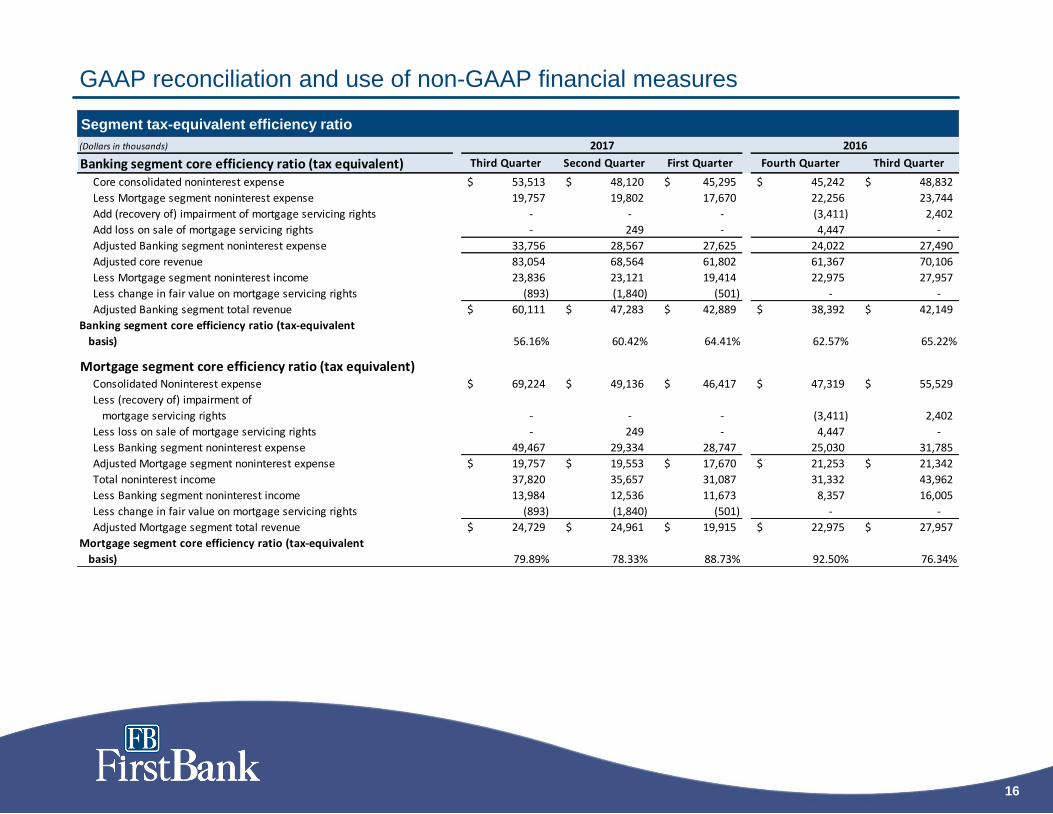
Segment tax-equivalent efficiency ratio
(Dollars in thousands)
Banking segment core efficiency ratio (tax equivalent) Third Quarter Second Quarter First Quarter Fourth Quarter Third Quarter
Core consolidated noninterest expense 53,513$ 48,120$ 45,295$ 45,242$ 48,832$
Less Mortgage segment noninterest expense 19,757 19,802 17,670 22,256 23,744
Add (recovery of) impairment of mortgage servicing rights - - - (3,411) 2,402
Add loss on sale of mortgage servicing rights - 249 - 4,447 -
Adjusted Banking segment noninterest expense 33,756 28,567 27,625 24,022 27,490
Adjusted core revenue 83,054 68,564 61,802 61,367 70,106
Less Mortgage segment noninterest income 23,836 23,121 19,414 22,975 27,957
Less change in fair value on mortgage servicing rights (893) (1,840) (501) - -
Adjusted Banking segment total revenue 60,111$ 47,283$ 42,889$ 38,392$ 42,149$
Banking segment core efficiency ratio (tax-equivalent
basis) 56.16% 60.42% 64.41% 62.57% 65.22%
Mortgage segment core efficiency ratio (tax equivalent)Consolidated Noninterest expense 69,224$ 49,136$ 46,417$ 47,319$ 55,529$
Less (recovery of) impairment of
mortgage servicing rights - - - (3,411) 2,402
Less loss on sale of mortgage servicing rights - 249 - 4,447 -
Less Banking segment noninterest expense 49,467 29,334 28,747 25,030 31,785
Adjusted Mortgage segment noninterest expense 19,757$ 19,553$ 17,670$ 21,253$ 21,342$
Total noninterest income 37,820 35,657 31,087 31,332 43,962
Less Banking segment noninterest income 13,984 12,536 11,673 8,357 16,005
Less change in fair value on mortgage servicing rights (893) (1,840) (501) - -
Adjusted Mortgage segment total revenue 24,729$ 24,961$ 19,915$ 22,975$ 27,957$
Mortgage segment core efficiency ratio (tax-equivalent
basis) 79.89% 78.33% 88.73% 92.50% 76.34%
2017 2016
17
GAAP reconciliation and use of non-GAAP financial measures
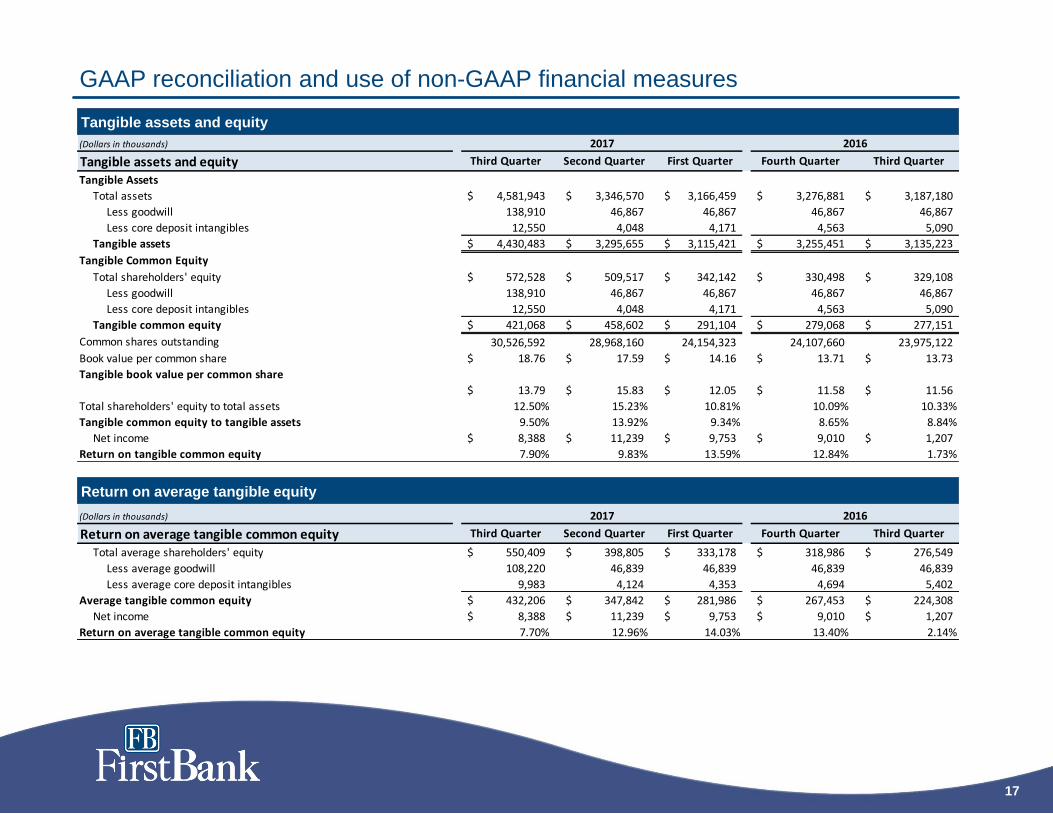
Tangible assets and equity
Return on average tangible equity
(Dollars in thousands)
Tangible assets and equity Third Quarter Second Quarter First Quarter Fourth Quarter Third Quarter
Tangible Assets
Total assets 4,581,943$ 3,346,570$ 3,166,459$ 3,276,881$ 3,187,180$
Less goodwill 138,910 46,867 46,867 46,867 46,867
Less core deposit intangibles 12,550 4,048 4,171 4,563 5,090
Tangible assets 4,430,483$ 3,295,655$ 3,115,421$ 3,255,451$ 3,135,223$
Tangible Common Equity
Total shareholders' equity 572,528$ 509,517$ 342,142$ 330,498$ 329,108$
Less goodwill 138,910 46,867 46,867 46,867 46,867
Less core deposit intangibles 12,550 4,048 4,171 4,563 5,090
Tangible common equity 421,068$ 458,602$ 291,104$ 279,068$ 277,151$
Common shares outstanding 30,526,592 28,968,160 24,154,323 24,107,660 23,975,122
Book value per common share 18.76$ 17.59$ 14.16$ 13.71$ 13.73$
Tangible book value per common share
13.79$ 15.83$ 12.05$ 11.58$ 11.56$
Total shareholders' equity to total assets 12.50% 15.23% 10.81% 10.09% 10.33%
Tangible common equity to tangible assets 9.50% 13.92% 9.34% 8.65% 8.84%
Net income 8,388$ 11,239$ 9,753$ 9,010$ 1,207$
Return on tangible common equity 7.90% 9.83% 13.59% 12.84% 1.73%
2017 2016
(Dollars in thousands)
Return on average tangible common equity Third Quarter Second Quarter First Quarter Fourth Quarter Third Quarter
Total average shareholders' equity 550,409$ 398,805$ 333,178$ 318,986$ 276,549$
Less average goodwill 108,220 46,839 46,839 46,839 46,839
Less average core deposit intangibles 9,983 4,124 4,353 4,694 5,402
Average tangible common equity 432,206$ 347,842$ 281,986$ 267,453$ 224,308$
Net income 8,388$ 11,239$ 9,753$ 9,010$ 1,207$
Return on average tangible common equity 7.70% 12.96% 14.03% 13.40% 2.14%
2017 2016
18
GAAP reconciliation and use of non-GAAP financial measures
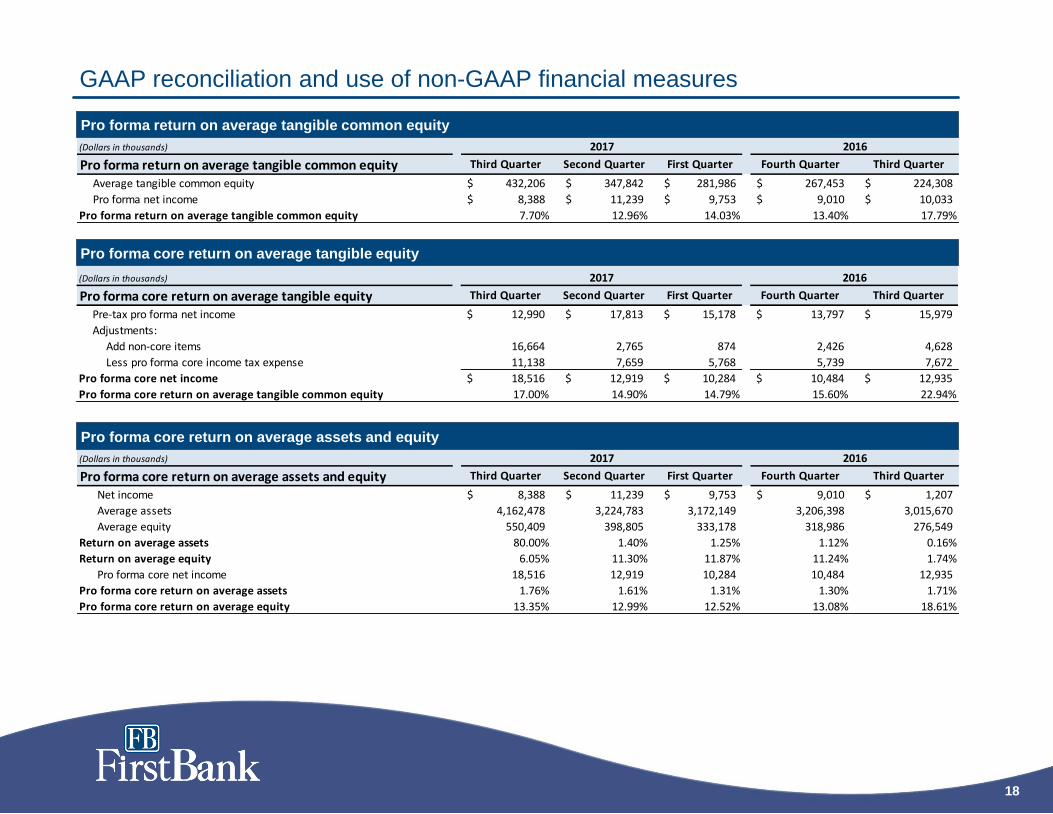
Pro forma return on average tangible common equity
Pro forma core return on average tangible equity
Pro forma core return on average assets and equity
(Dollars in thousands)
Pro forma return on average tangible common equity Third Quarter Second Quarter First Quarter Fourth Quarter Third Quarter
Average tangible common equity 432,206$ 347,842$ 281,986$ 267,453$ 224,308$
Pro forma net income 8,388$ 11,239$ 9,753$ 9,010$ 10,033$
Pro forma return on average tangible common equity 7.70% 12.96% 14.03% 13.40% 17.79%
2017 2016
(Dollars in thousands)
Pro forma core return on average tangible equity Third Quarter Second Quarter First Quarter Fourth Quarter Third Quarter
Pre-tax pro forma net income 12,990$ 17,813$ 15,178$ 13,797$ 15,979$
Adjustments:
Add non-core items 16,664 2,765 874 2,426 4,628
Less pro forma core income tax expense 11,138 7,659 5,768 5,739 7,672
Pro forma core net income 18,516$ 12,919$ 10,284$ 10,484$ 12,935$
Pro forma core return on average tangible common equity 17.00% 14.90% 14.79% 15.60% 22.94%
2017 2016
(Dollars in thousands)
Pro forma core return on average assets and equity Third Quarter Second Quarter First Quarter Fourth Quarter Third Quarter
Net income 8,388$ 11,239$ 9,753$ 9,010$ 1,207$
Average assets 4,162,478 3,224,783 3,172,149 3,206,398 3,015,670
Average equity 550,409 398,805 333,178 318,986 276,549
Return on average assets 80.00% 1.40% 1.25% 1.12% 0.16%
Return on average equity 6.05% 11.30% 11.87% 11.24% 1.74%
Pro forma core net income 18,516 12,919 10,284 10,484 12,935
Pro forma core return on average assets 1.76% 1.61% 1.31% 1.30% 1.71%
Pro forma core return on average equity 13.35% 12.99% 12.52% 13.08% 18.61%
2017 2016
19
GAAP reconciliation and use of non-GAAP financial measures
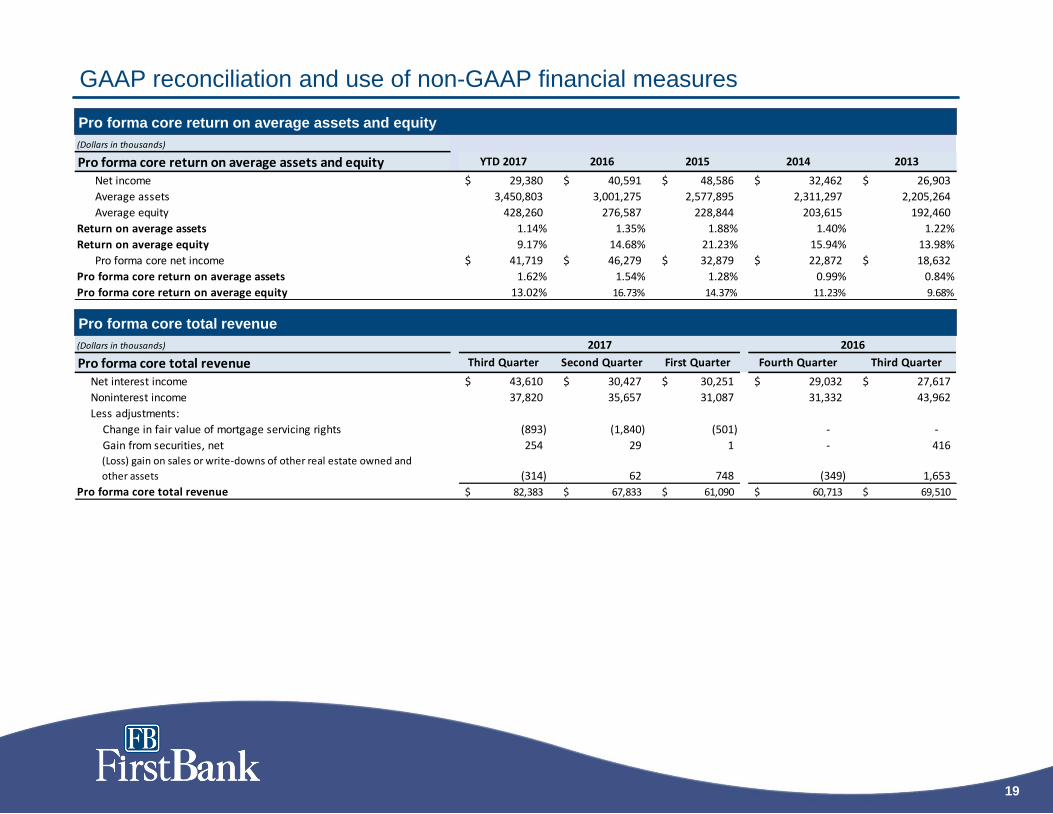
Pro forma core return on average assets and equity
Pro forma core total revenue
(Dollars in thousands)
Pro forma core total revenue Third Quarter Second Quarter First Quarter Fourth Quarter Third Quarter
Net interest income 43,610$ 30,427$ 30,251$ 29,032$ 27,617$
Noninterest income 37,820 35,657 31,087 31,332 43,962
Less adjustments:
Change in fair value of mortgage servicing rights (893) (1,840) (501) - -
Gain from securities, net 254 29 1 - 416 (Loss) gain on sales or write-downs of other real estate owned and
other assets (314) 62 748 (349) 1,653
Pro forma core total revenue 82,383$ 67,833$ 61,090$ 60,713$ 69,510$
2017 2016
(Dollars in thousands)
Pro forma core return on average assets and equity YTD 2017 2016 2015 2014 2013
Net income 29,380$ 40,591$ 48,586$ 32,462$ 26,903$
Average assets 3,450,803 3,001,275 2,577,895 2,311,297 2,205,264
Average equity 428,260 276,587 228,844 203,615 192,460
Return on average assets 1.14% 1.35% 1.88% 1.40% 1.22%
Return on average equity 9.17% 14.68% 21.23% 15.94% 13.98%
Pro forma core net income 41,719$ 46,279$ 32,879$ 22,872$ 18,632$
Pro forma core return on average assets 1.62% 1.54% 1.28% 0.99% 0.84%
Pro forma core return on average equity 13.02% 16.73% 14.37% 11.23% 9.68%
20
GAAP reconciliation and use of non-GAAP financial measures
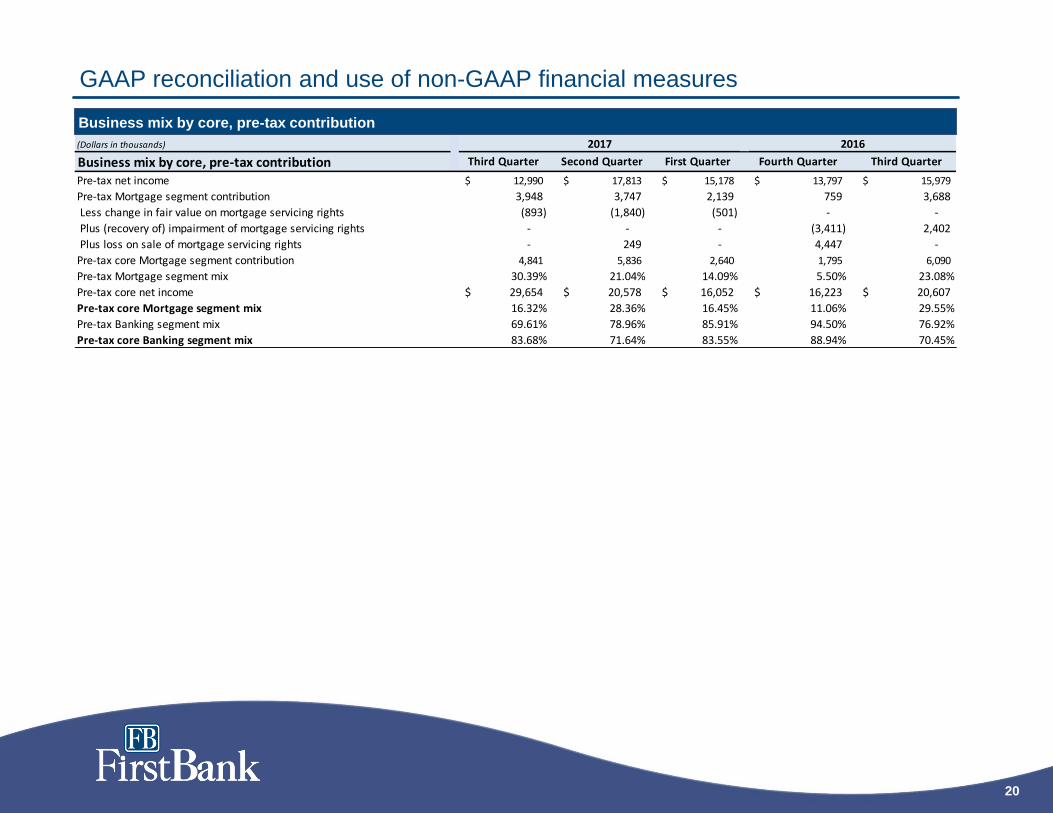
Business mix by core, pre-tax contribution
(Dollars in thousands)
Business mix by core, pre-tax contribution Third Quarter Second Quarter First Quarter Fourth Quarter Third Quarter
Pre-tax net income 12,990$ 17,813$ 15,178$ 13,797$ 15,979$
Pre-tax Mortgage segment contribution 3,948 3,747 2,139 759 3,688
Less change in fair value on mortgage servicing rights (893) (1,840) (501) - -
Plus (recovery of) impairment of mortgage servicing rights - - - (3,411) 2,402
Plus loss on sale of mortgage servicing rights - 249 - 4,447 -
Pre-tax core Mortgage segment contribution 4,841 5,836 2,640 1,795 6,090
Pre-tax Mortgage segment mix 30.39% 21.04% 14.09% 5.50% 23.08%
Pre-tax core net income 29,654$ 20,578$ 16,052$ 16,223$ 20,607$
Pre-tax core Mortgage segment mix 16.32% 28.36% 16.45% 11.06% 29.55%
Pre-tax Banking segment mix 69.61% 78.96% 85.91% 94.50% 76.92%
Pre-tax core Banking segment mix 83.68% 71.64% 83.55% 88.94% 70.45%
2017 2016
Related Documents