Partnership. Performance. THIRD QUARTER 2014 Los Angeles Office Market Report www.avisonyoung.com

Welcome message from author
This document is posted to help you gain knowledge. Please leave a comment to let me know what you think about it! Share it to your friends and learn new things together.
Transcript
Partnership. Performance.
THIRD QUARTER 2014
Los Angeles Office Market Report
www.avisonyoung.com
New Jersey
Market Snapshot
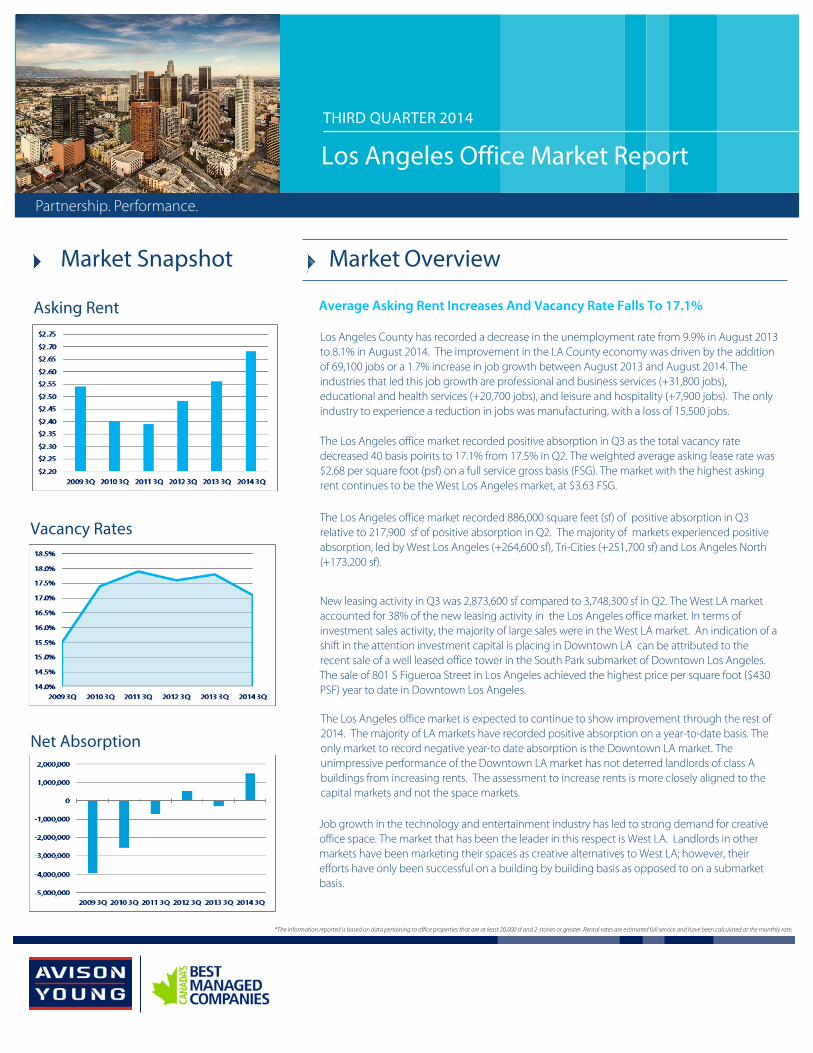
Average Asking Rent Increases And Vacancy Rate Falls To 17.1%
Los Angeles County has recorded a decrease in the unemployment rate from 9.9% in August 2013 to 8.1% in August 2014. The improvement in the LA County economy was driven by the addition of 69,100 jobs or a 1.7% increase in job growth between August 2013 and August 2014. The industries that led this job growth are professional and business services (+31,800 jobs), educational and health services (+20,700 jobs), and leisure and hospitality (+7,900 jobs). The only industry to experience a reduction in jobs was manufacturing, with a loss of 15,500 jobs.
The Los Angeles office market recorded positive absorption in Q3 as the total vacancy rate decreased 40 basis points to 17.1% from 17.5% in Q2. The weighted average asking lease rate was $2.68 per square foot (psf) on a full service gross basis (FSG). The market with the highest asking rent continues to be the West Los Angeles market, at $3.63 FSG.
The Los Angeles office market recorded 886,000 square feet (sf) of positive absorption in Q3 relative to 217,900 sf of positive absorption in Q2. The majority of markets experienced positive absorption, led by West Los Angeles (+264,600 sf), Tri-Cities (+251,700 sf) and Los Angeles North (+173,200 sf).
New leasing activity in Q3 was 2,873,600 sf compared to 3,748,300 sf in Q2. The West LA market accounted for 38% of the new leasing activity in the Los Angeles office market. In terms of investment sales activity, the majority of large sales were in the West LA market. An indication of a shift in the attention investment capital is placing in Downtown LA can be attributed to the recent sale of a well leased office tower in the South Park submarket of Downtown Los Angeles. The sale of 801 S Figueroa Street in Los Angeles achieved the highest price per square foot ($430 PSF) year to date in Downtown Los Angeles.
The Los Angeles office market is expected to continue to show improvement through the rest of 2014. The majority of LA markets have recorded positive absorption on a year-to-date basis. The only market to record negative year-to date absorption is the Downtown LA market. The unimpressive performance of the Downtown LA market has not deterred landlords of class A buildings from increasing rents. The assessment to increase rents is more closely aligned to the capital markets and not the space markets.
Asking Rent
Vacancy RatesI
Net Absorption
Partnership. Performance.
THIRD QUARTER 2014
Market Overview
Los Angeles Office Market Report
Job growth in the technology and entertainment industry has led to strong demand for creative office space. The market that has been the leader in this respect is West LA. Landlords in other markets have been marketing their spaces as creative alternatives to West LA; however, their efforts have only been successful on a building by building basis as opposed to on a submarket basis.
*The information reported is based on data pertaining to office properties that are at least 20,000 sf and 2-stories or greater. Rental rates are estimated full service and have been calculated at the monthly rate.
Third Quarter 2014 | Los Angeles Office Market Report
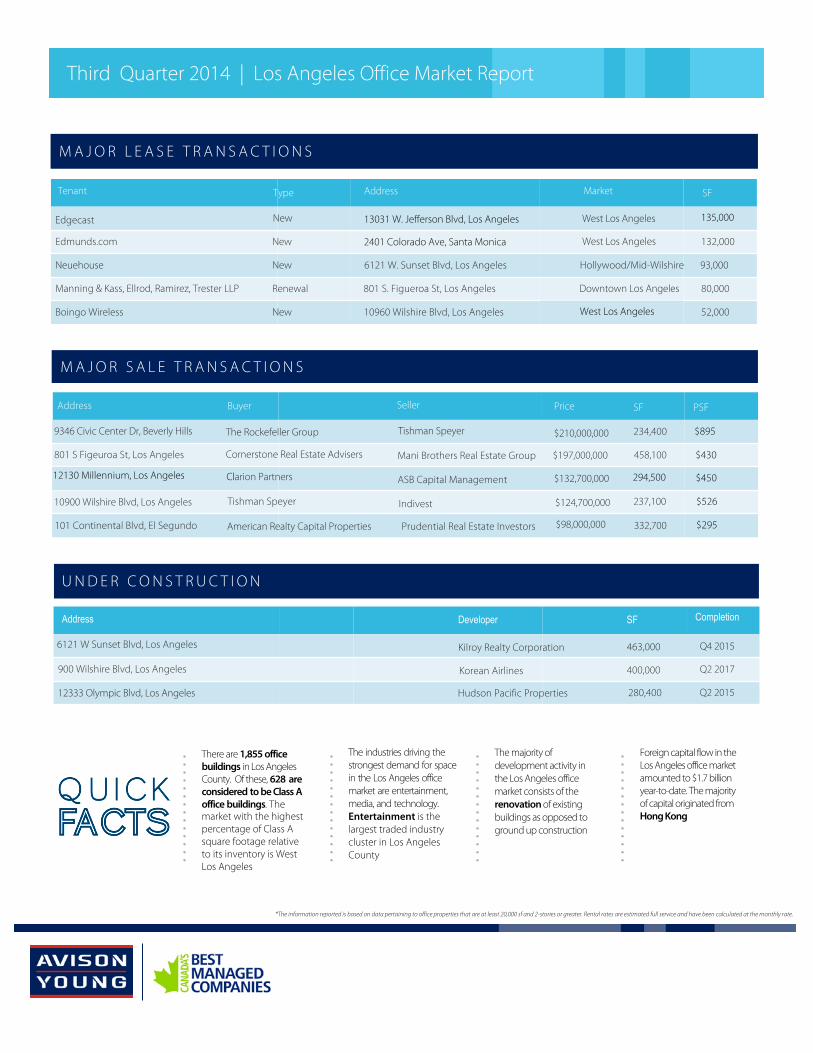
M A J O R L E A S E T R A N S A C T I O N S
SF Buyer
The Rockefeller Group
Seller Price
Tishman Speyer 234,400
801 S Figeuroa St, Los Angeles Mani Brothers Real Estate Group $197,000,000
ASB Capital Management
10900 Wilshire Blvd, Los Angeles Tishman Speyer
101 Continental Blvd, El Segundo American Realty Capital Properties Prudential Real Estate Investors
M A J O R S A L E T R A N S A C T I O N S
SF Completion
Q2 2015280,400
900 Wilshire Blvd, Los Angeles
Hudson Pacific Properties
400,000
12333 Olympic Blvd, Los Angeles
Developer
Kilroy Realty Corporation
U N D E R C O N S T R U C T I O N
The industries driving the strongest demand for space in the Los Angeles office market are entertainment, media, and technology. Entertainment is the largest traded industry cluster in Los Angeles County
There are 1,855 office buildings in Los Angeles County. Of these, 628 are considered to be Class A office buildings. The market with the highest percentage of Class A square footage relative to its inventory is West Los Angeles
Foreign capital flow in the Los Angeles office market amounted to $1.7 billion year-to-date. The majority of capital originated from Hong Kong
The majority of development activity in the Los Angeles office market consists of the renovation of existing buildings as opposed to ground up construction
Type SF
New
Market
West Los Angeles
Edmunds.com New West Los Angeles 132,000
Neuehouse New 6121 W. Sunset Blvd, Los Angeles Hollywood/Mid-Wilshire 93,000
Manning & Kass, Ellrod, Ramirez, Trester LLP Renewal 801 S. Figueroa St, Los Angeles Downtown Los Angeles 80,000
Boingo Wireless New 10960 Wilshire Blvd, Los Angeles 52,000
Tenant
Edgecast
Address
13031 W. Jefferson Blvd, Los Angeles
2401 Colorado Ave, Santa Monica
135,000
$210,000,000
Address
9346 Civic Center Dr, Beverly Hills
Indivest
458,100
$98,000,000
$132,700,000
$124,700,000
332,700
237,100
Cornerstone Real Estate Advisers
Address
6121 W Sunset Blvd, Los Angeles
Q2 2017Korean Airlines
Q4 2015463,000
12130 Millennium, Los Angeles 294,500
West Los Angeles
PSF
$895
$430
$450
$526
$295
Clarion Partners
*The information reported is based on data pertaining to office properties that are at least 20,000 sf and 2-stories or greater. Rental rates are estimated full service and have been calculated at the monthly rate.
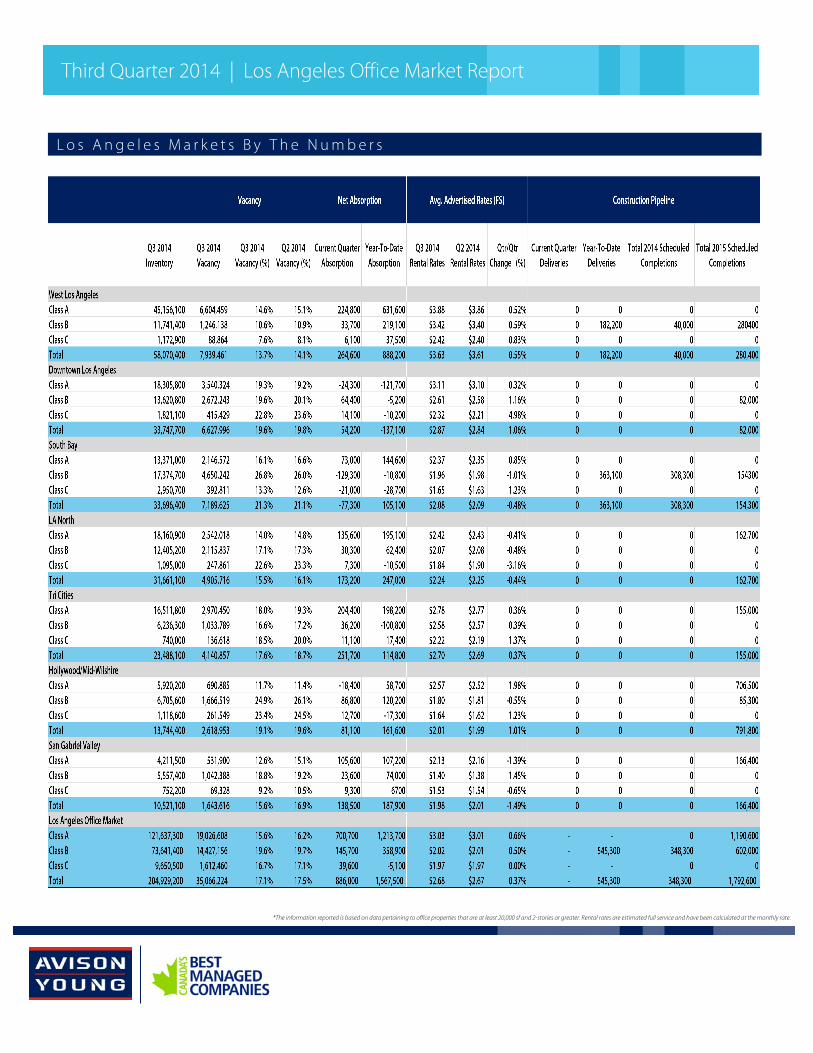
L o s A n g e l e s M a r k e t s B y T h e N u m b e r s
Third Quarter 2014 | Los Angeles Office Market Report
*The information reported is based on data pertaining to office properties that are at least 20,000 sf and 2-stories or greater. Rental rates are estimated full service and have been calculated at the monthly rate.
Third Quarter 2014 | Los Angeles Office Market Report
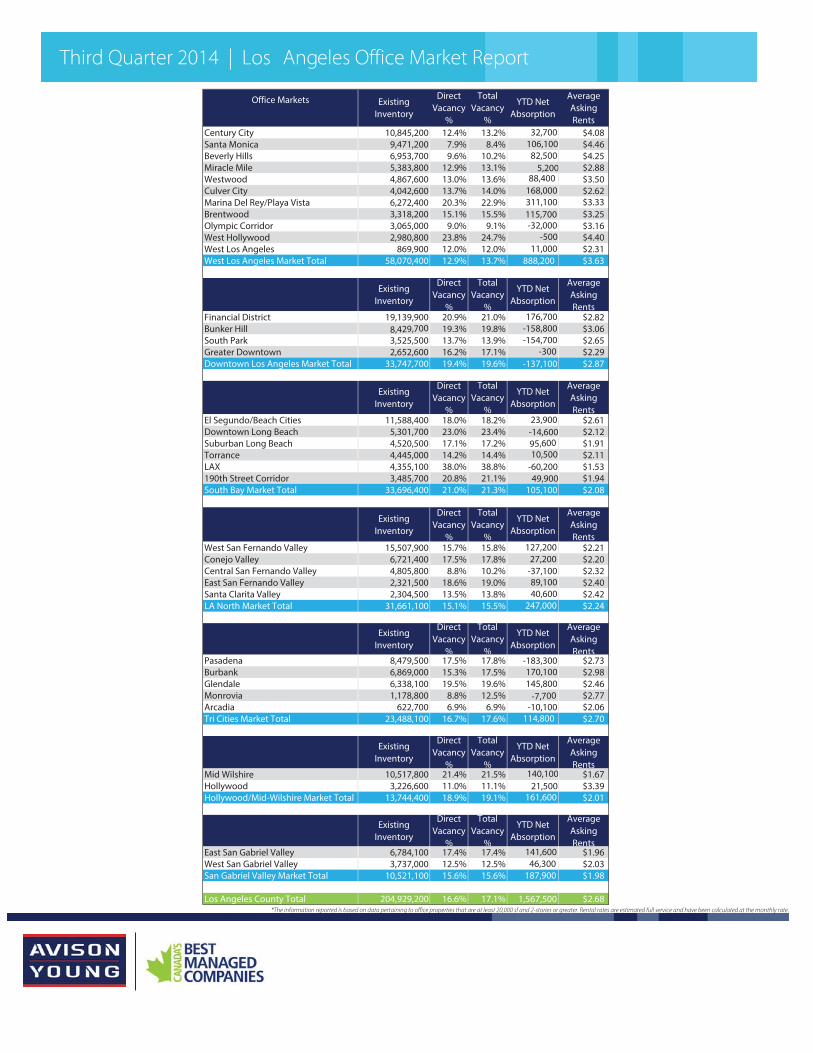
Office Markets
Century City 10,845,200 12.4% 13.2% 32,700 $4.08Santa Monica 9,471,200 7.9% 8.4% 106,100 $4.46Beverly Hills 6,953,700 9.6% 10.2% 82,500 $4.25Miracle Mile 5,383,800 12.9% 13.1% 5,200 $2.88Westwood 4,867,600 13.0% 13.6% 88,400 $3.50Culver City 4,042,600 13.7% 14.0% 168,000 $2.62Marina Del Rey/Playa Vista 6,272,400 20.3% 22.9% 311,100 $3.33Brentwood 3,318,200 15.1% 15.5% 115,700 $3.25Olympic Corridor 3,065,000 9.0% 9.1% -32,000 $3.16West Hollywood 2,980,800 23.8% 24.7% -500 $4.40West Los Angeles 869,900 12.0% 12.0% 11,000 $2.31West Los Angeles Market Total 58,070,400 12.9% 13.7% 888,200 $3.63
Existing Inventory
Direct Vacancy
%
Total Vacancy
%
YTD Net Absorption
Average Asking Rents
Financial District 19,139,900 20.9% 21.0% 176,700 $2.82Bunker Hill 8,429,700 19.3% 19.8% -158,800 $3.06South Park 3,525,500 13.7% 13.9% -154,700 $2.65Greater Downtown 2,652,600 16.2% 17.1% -300 $2.29Downtown Los Angeles Market Total 33,747,700 19.4% 19.6% -137,100 $2.87
Existing Inventory
Direct Vacancy
%
Total Vacancy
%
YTD Net Absorption
Average Asking Rents
El Segundo/Beach Cities 11,588,400 18.0% 18.2% 23,900 $2.61Downtown Long Beach 5,301,700 23.0% 23.4% -14,600 $2.12Suburban Long Beach 4,520,500 17.1% 17.2% 95,600 $1.91Torrance 4,445,000 14.2% 14.4% 10,500 $2.11LAX 4,355,100 38.0% 38.8% -60,200 $1.53190th Street Corridor 3,485,700 20.8% 21.1% 49,900 $1.94South Bay Market Total 33,696,400 21.0% 21.3% 105,100 $2.08
Existing Inventory
Direct Vacancy
%
Total Vacancy
%
YTD Net Absorption
Average Asking Rents
West San Fernando Valley 15,507,900 15.7% 15.8% 127,200 $2.21Conejo Valley 6,721,400 17.5% 17.8% 27,200 $2.20Central San Fernando Valley 4,805,800 8.8% 10.2% -37,100 $2.32East San Fernando Valley 2,321,500 18.6% 19.0% 89,100 $2.40Santa Clarita Valley 2,304,500 13.5% 13.8% 40,600 $2.42LA North Market Total 31,661,100 15.1% 15.5% 247,000 $2.24
Existing Inventory
Direct Vacancy
%
Total Vacancy
%
YTD Net Absorption
Average Asking Rents
Pasadena 8,479,500 17.5% 17.8% -183,300 $2.73Burbank 6,869,000 15.3% 17.5% 170,100 $2.98Glendale 6,338,100 19.5% 19.6% 145,800 $2.46Monrovia 1,178,800 8.8% 12.5% -7,700 $2.77Arcadia 622,700 6.9% 6.9% -10,100 $2.06Tri Cities Market Total 23,488,100 16.7% 17.6% 114,800 $2.70
Existing Inventory
Direct Vacancy
%
Total Vacancy
%
YTD Net Absorption
Average Asking Rents
Mid Wilshire 10,517,800 21.4% 21.5% 140,100 $1.67Hollywood 3,226,600 11.0% 11.1% 21,500 $3.39Hollywood/Mid-Wilshire Market Total 13,744,400 18.9% 19.1% 161,600 $2.01
Existing Inventory
Direct Vacancy
%
Total Vacancy
%
YTD Net Absorption
Average Asking Rents
East San Gabriel Valley 6,784,100 17.4% 17.4% 141,600 $1.96West San Gabriel Valley 3,737,000 12.5% 12.5% 46,300 $2.03San Gabriel Valley Market Total 10,521,100 15.6% 15.6% 187,900 $1.98
Los Angeles County Total 204,929,200 16.6% 17.1% 1,567,500 $2.68
Direct Vacancy
%
Existing Inventory
Total Vacancy
%
YTD Net Absorption
Average Asking Rents
*The information reported is based on data pertaining to office properties that are at least 20,000 sf and 2-stories or greater. Rental rates are estimated full service and have been calculated at the monthly rate.
213.935.7435
Avison Young, a real estate company committed to you.
Avison Young is the real estate partner businesses trust for intelligent, integrated solutions.
We deliver results that are aligned with your strategic business objectives, support real estate initiatives that add value, and build competitive advantage for your organization.
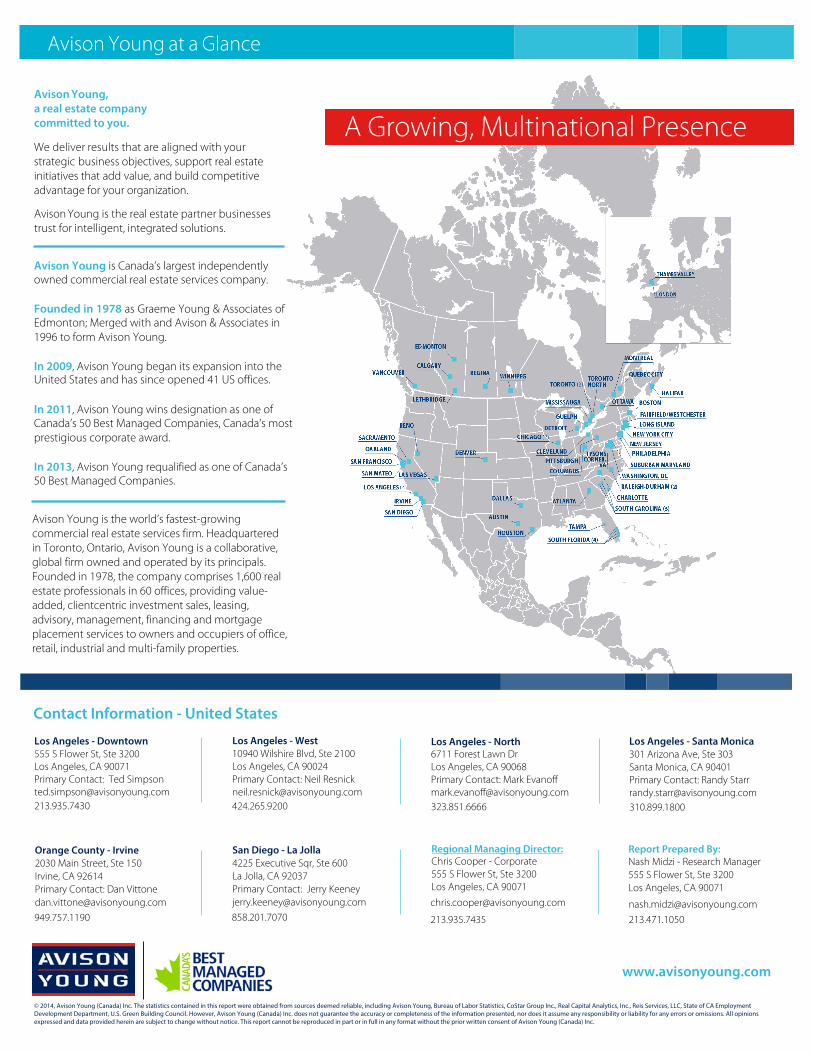
Avison Young is the world’s fastest-growing commercial real estate services firm. Headquartered in Toronto, Ontario, Avison Young is a collaborative, global firm owned and operated by its principals. Founded in 1978, the company comprises 1,600 real estate professionals in 60 offices, providing value-added, clientcentric investment sales, leasing, advisory, management, financing and mortgage placement services to owners and occupiers of office, retail, industrial and multi-family properties.
Avison Young at a Glance
Contact Information - United States
213.935.7430 323.851.6666
www.avisonyoung.com
310.899.1800424.265.9200
Avison Young is Canada’s largest independently owned commercial real estate services company.
Founded in 1978 as Graeme Young & Associates of Edmonton; Merged with and Avison & Associates in 1996 to form Avison Young.
In 2009, Avison Young began its expansion into the United States and has since opened 41 US offices.
In 2011, Avison Young wins designation as one of Canada’s 50 Best Managed Companies, Canada’s most prestigious corporate award.
In 2013, Avison Young requalified as one of Canada’s 50 Best Managed Companies.
Los Angeles - Downtown 555 S Flower St, Ste 3200Los Angeles, CA 90071 Primary Contact: Ted [email protected]
Los Angeles - North6711 Forest Lawn DrLos Angeles, CA 90068 Primary Contact: Mark Evanoff [email protected]
Los Angeles - West10940 Wilshire Blvd, Ste 2100Los Angeles, CA 90024Primary Contact: Neil Resnick [email protected]
Los Angeles - Santa Monica 301 Arizona Ave, Ste 303 Santa Monica, CA 90401 Primary Contact: Randy [email protected]
San Diego - La Jolla4225 Executive Sqr, Ste 600 La Jolla, CA 92037Primary Contact: Jerry [email protected]
858.201.7070
Orange County - Irvine 2030 Main Street, Ste 150 Irvine, CA 92614Primary Contact: Dan [email protected]
949.757.1190
© 2014, Avison Young (Canada) Inc. The statistics contained in this report were obtained from sources deemed reliable, including Avison Young, Bureau of Labor Statistics, CoStar Group Inc., Real Capital Analytics, Inc., Reis Services, LLC, State of CA EmploymentDevelopment Department, U.S. Green Building Council. However, Avison Young (Canada) Inc. does not guarantee the accuracy or completeness of the information presented, nor does it assume any responsibility or liability for any errors or omissions. All opinionsexpressed and data provided herein are subject to change without notice. This report cannot be reproduced in part or in full in any format without the prior written consent of Avison Young (Canada) Inc.
A Growing, Multinational Presence
Report Prepared By:Nash Midzi - Research Manager 555 S Flower St, Ste 3200Los Angeles, CA 90071
Regional Managing Director: Chris Cooper - Corporate 555 S Flower St, Ste 3200 Los Angeles, CA 90071
Related Documents


