I I u , MSp Qu n n n n n n n n n n n n n Ntn b rt rf r In f r t n c n cn c n D rt n tf C trc n c& c n s n U n v rst B n C n Dr t n tf A t tn s n U n v rst B n C n z - @ t sn . .cn ASA In t s r s f t r v b N CIR13 n v ntr tr f t n tr srs t v nsts n f r s c c c t rs. s c t rs nc st f b f v rsn t trts tc t n sc n st tc t n n s t rctn. rs t s n b f v rsn t trts nc n f v bn r c ss f rs f nnss t x rnc cnsc nt sn s s x trvrs n r bns s n nr t cs s f v t n bs - 2 n r s st . c ss f c t ns f n sc st r bs n r’s t - nsn f . r s t s tr c ss s f t b rr n n r t s . t bst f r k n t s s t f rst r s rc t n k t sc t cc t n f n s c c n ss f sr’s f . Or st s s ncr n rs t s t t x stnc f sc k n f n k s nn f . s t rs t s rct b r s n t r st tstcs n nt t n s c c s cts f sr’s f sn r ntt ns t t . Kw f A n ss ;Bv rs n t ; D tc t n;sc t D t c t n; sc Dt ctn ; Qt r ctn m m IR 2 Sub f In s t s k ( I ) Cr r sn nA t r s rk s s rt b N t r c nc n t n f C n( G rnt N . 615 320 11 6 1 672 311) n s n U n v rs t I n t t v c ntf c R s rc r r( G rnt N . 2 016 10801 6 6) . IODUIO Incr s n v b t f tc n n rtnt r n trnsf r tn f rs v r t s t c . D t t s cn s f Inf r tn R trv s bn s bct f ncr sn tt nt n s t t n nc f f t srs [ 1 ] n s rs t n r s rc s v bn cnct n n n k n b t sr’s t . N CIR f Inst s k ( I ) s t x trc t k n f r f s. [ 2 ] v r rs rc rs v bn st f csn n sc t. In t s r s f t t rn b t sr s’ nt n t n st ts . I n r r t c v t s n rs tn n v nsts n f r s c c c t rs. s t cs nc st f b f v rs n t trts tc tn sc n sc st tc t n n s t r ctn . In rv s rs rcs n s c c st ts n t ns t tr t r s rv s n s f - rrt s r s t c n ct nt t r t rs rcs . r s t tr f t t s c c n rst n n t f - r. t tc trn f t c r t t t n tr s f - srv sss sbs n t rstss r r b. . AKGOUD AD EAEDWOK rt n s f - srv s n s f - rrt c tvt s n bv rs r s t n z rsn ’s n . Rc nt t t ncr s n v b t n f f r bt f rb v c s n s ns rs n s rc f t s r n c k s t ssb t c c t nf r tn n rv r t n r c crt n tc s n s c c t . A t tc tr f t nt r r c f sr nt r ct n n trf r s s s bs . Us n f t t n rs tn n rct t sc - bn n f ttrns v bn r rs rc sb c t rc nt . v r f r r s r cs n nt t s n f r v b. It s rt nt nn t t n b n c tns r v n rc nt rs t nt t c f ts c t n tr n s f f r nt s ts f t n t nt t n rs tn rsn ’s n n t n s n c rnsv bs n nt rt f rc r . 20 Proceedings of the 13th NTCIR Conference on Evaluation of Information Access Technologies, December 5-8, 2017 Tokyo Japan

Welcome message from author
This document is posted to help you gain knowledge. Please leave a comment to let me know what you think about it! Share it to your friends and learn new things together.
Transcript
THIR2 at the NTCIR-13 Lifelog-2 Task:
Bridging Technology and Psychology through the Lifelog
Personality, Mood and Sleep Quality
Pouneh Soleimaninejadian†, Yewen Wang‡, Haoyue Tong†, Zehui Feng†, Min Zhang†*, Yiqun Liu†, Shaoping Ma† †Tsinghua National Laboratory for Information Science and Technology, Department of Computer Science & Technology,
Tsinghua University, Beijing, China ‡Department of Automation, Tsinghua University, Beijing, China
ABSTRACT
In this paper, we use lifelog data provided by NTCIR13 and voluntarily gathered lifelog data on other users to give insights in four psychological categories. These categories include study of big five personality traits, mood detection, music mood and style detection and sleep quality prediction. The results on big five personality traits, including five binary classifiers of openness to experience, conscientiousness, extraversion, agreeableness and neuroticism, is a five digit in base-2 numeral system. The classifications of mood and music style are based on Thayer’s two-dimensional model of mood. For sleep quality, we use three classes of high quality, borderline and poor quality sleep. To the best of our knowledge, this is the first research to link the physical data collected in lifelog and psychological analysis of user’s life. Our study shows encouraging results that existence of such kind of link is meaningful. We show the results predicted by our models and other statistics on mental health and psychological aspects of user’s life using our mental health insight tool.
Keywords
Lifelog Analysis; Big Five Personality; Mood Detection; Music Style Detection; Music Mood Detection; Sleep Quality Prediction
Team Name THIR2
Subtasks Lifelog Insight Task (LIT)
* Corresponding Author
This work is supported by Natural Science Foundation of China (Grant No. 61532011, 61672311) and Tsinghua University Initiative Scientific Research Program (Grant No. 20161080166)
1. INTRODUCTION Increase in availability of technology played an important role in transformation of diaries over the last decade. Due to these changes, lifelog Information Retrieval has been subject of increasing attention as a tool to enhance daily life of the users [1] and as a result, many researches have been conducted on mining knowledge about user’s health. NTCIR Lifelog Insight Task (LIT) aims to extract knowledge from lifelogs. [2] However, researchers have been mostly focusing on physical health. In this paper, we use lifelog data to learn about users’ mental and emotional states. In order to achieve this understanding, we give insights in four psychological categories. These topics include study of big five personality traits, mood detection, music mood and music style detection, and sleep quality prediction. In previous researches on psychological states and emotions, data gathered through surveys and self-reports were widely used to conduct mental health related researches. Here, we use digitally gathered lifelog data to psychologically understand and model the life-logger. The automatic gathering of data compared to the data gained through self-surveys is less biased and the results is more reliable.
2. BACKGROUND AND RELATED WORK Traditionally, self-surveys and self-reported activities and behaviors were used to analyze a person’s mind. Recently with the increase in availability and affordability of wearable devices and sensors, a new source of data is emerging which makes it possible to collect information and provide real time and more accurate analytics on psychological health. Automatically gathered lifelog data, do not require much of user interaction and therefore is less biased.
Using lifelog data to understand and predict the physical well-being and life patterns have been a popular research subject recently. However, fewer researches on mental health using lifelog are available. It also worth mentioning that, many mobile phone applications were developed in recent years to gauge mental health, each of these application gather and use different sets of data and they do not aim to understand a person’s mind and emotions in a comprehensive way based on integrated lifelog record.
20
Proceedings of the 13th NTCIR Conference on Evaluation of Information Access Technologies, December 5-8, 2017 Tokyo Japan
However, using information available about user activities in social media were used in multiple researches to provide user profiling and modeling. Research conducted by Michal Kosinski, David Stillwell, and Thore Graepel shows that digital records of user can be leveraged to predict private traits and attributes. [3] Another research was conducted on users’ mood and emotion classification using their posting in social media and some daily activity information. [4]
Personality measurement is a psychology subject that always draws considerable attention from the public. Various personality models are proposed, and the Big Five Personality model [5], also known as Five Factor Model (FFM), has been most widely used.
Big Five Personality consists five dimensions as follows:
Openness to Experience describes a person's degree of curiosity and creativity.
Conscientiousness measures people's self-discipline and the tendency to be organized and reliable when carrying out tasks [6]
Extraversion is an indicator that would be large if a person tends to be enthusiastic and action-oriented.
Agreeableness evaluates how well a person is getting along with others.
Neuroticism describes people's tendency to suffer from negative emotions.
A significant amount of past research has constructed several instruments to measure Big Five Personality [7] [8] [9] [10] [11]. Efforts are paid to make those instruments more time-saving or to achieve higher accuracies [12] [8] [13] [14]. In our work, we apply NEO-FFI test [15] to verity our estimation results, because this is the most suitable instrument after considering a tradeoff between time and accuracy. In recent years, the rapid development of pervasive lifelogging devices enables people to gather mass lifelog data, and this makes it possible and convenient to evaluate a person's Big Five personality using lifelog data. Since this source of data is objective and is available in real-time, the new method would be able to achieve timely results with high accuracy, and the problems of traditional method no longer exist.
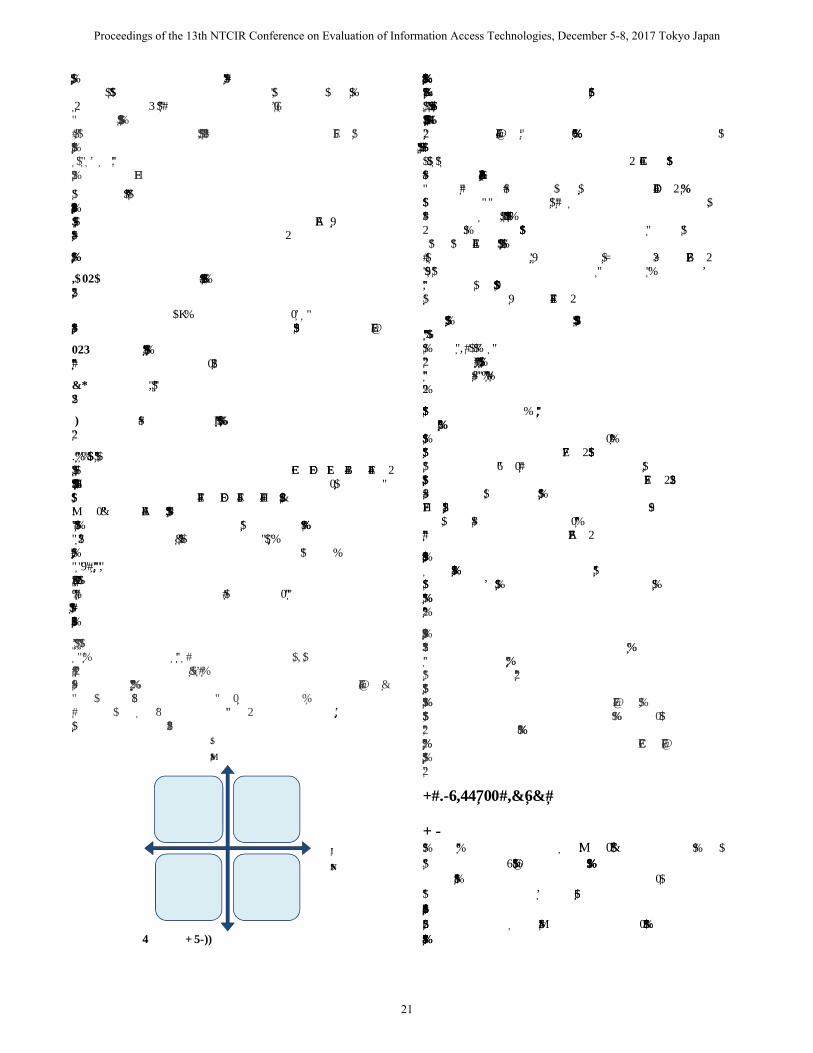
Since eighties, understanding of mood including its determinants and its influence on cognition and behavior have received considerable attention. In summary, mood can be defined as a background feeling that can influence thoughts and actions. [16] In this paper, we use Thayer’s two-dimensional model of mood in labeling user and music’s mood state. This Model uses valence and arousal dimensions to describe mood.
Figure 1. Thayer’s 2D mood model
In related researches, different factors have been discovered which effect a person’s mood. Including exercise, weather and pollution, duration and quality of sleep, working hours, blood pressure and heart rate, Extraversion and Neuroticism aspects of personality of the individual. [16] One study examines the effects of six weather parameters such as temperature, wind power, sunlight, precipitation, air pressure, and photoperiod on mood. [17] Furthermore, a research by avydov D. M., Stewart R., Ritchie K., and Chaudieu I. studies between blood pressure and depression [18]. A handful of researches studied the relation between mood and various biometrics and proved that human’s biometrics are indicators of mood. A group of researchers studied mood and its relation with heart rate [19] , other group investigated if mood disorders could be discovered using galvanic skin response (GSR) [20]. Some studies work on mood prediction using the amount of physical activity during the day like what Thayer and his research group did considering daily walking [21].
Music information retrieval is another popular research direction. Many automatic classification methods, which use audio or lyrics information, have been proposed for music mood and style detection. Combination of music information retrieval and mood detection brings us to the idea of music classification based on lifelog data.
Literatures in regard of music mood detection involves audio mood classification and emotional detection of the text. Mandel and his fellow researchers made audio-based mood classification with support vector machine [22]. Other researches made predictions on text-based emotion using supervised machine learning with the SNoW learning architecture [23]. Neumayer R. and Rauber discovered the complementarity of audio and lyrics [24]. Based on rich previous achievement, this work was improved by proposing a multi-modal classification system combining the two modalities [25].
However, as far as we know, there is no previous work about using body metrics information for music detection purpose and in this research, instead of using audio or lyrics information, we use lifelog data of the listeners to do automatic music mood and music style classification.
Sleep habits and quality of sleep are regarded as key in mental and physical healthcare. Researches show that insufficient and low quality sleep can negatively affect physical and mental health and chronic conditions can lead to health complications. Psychological researches also show that activities during the day and sleep efficiency are highly interrelated. [26] However, most of previous researches used data gathered from self-reported physical activities. We study the effect of users’ physical activities and conditions on sleep efficiency. [27] [26] We also consider the timing of activities and conditions and their distance to sleeping time.
3. STUDY OF FIVE PERSONALITY TRAITS
3.1 Research Design After collecting lifelog data and NEO-FFI test results from our
participants, we extract 6 features from lifelog data for each user.
These features, which are selected based on well-grounded
psychological theories, include gender, moody index, optimism
index, heart rate stability, room tidiness index, and room
decorative index. Then, we binerize the NEO-FFI test results for
each of the big five personality traits in order to use it as labels to
Arousal
(Energy)
Valence
(+ Stress)
Angry
Anxoius
Nervious
Excited
Happy
Pleased
Sad
Depressed
Bored
Relaxed
Peaceful
Calm
21
Proceedings of the 13th NTCIR Conference on Evaluation of Information Access Technologies, December 5-8, 2017 Tokyo Japan
conduct supervised learning and validate our model’s
performance on the test set. The feature description is given in
table 1. In this research, we tried multiple machine learning
models, however, the logistic regression model is the one with
best performance.
Table 1. Feature declaration
Feature Value Range Description
Gender 1 or -1 1 for female, -1 for male
Moody index Decimal
[0,1] Moodier the person is,
higher value this feature has
Optimistic index
Decimal [0,1]
More optimistic the person is, higher value this feature
has
Heart rate stability
Decimal [0,1]
More stable the person is, lower value this feature has
Room tidiness index
Decimal [0,1]
Neater the room is, higher value this feature has
Room decorative
index
Decimal [0,1]
More decorative the room is, higher value this feature
has
Detailed description about the data is given in section 3.2, and the results is presented and analyzed in section 3.3.
3.2 Data Description Our participants are 40 students from a large public university, including 34 females and 6 males. All of them are asked to provide four types of data: NEO-FFI test result, record of heart rate, mood and images of life scenes. Both heart rate and mood records is provided each 3 hours between 8am to 23pm, and panoramic images of office and bedroom are asked to be taken for each day. Each type of mood record is a choice between 8 of the mood types consistent with Thayer's 2D model shown in fig.1.
The features are extracted and normalized into specific range mentioned in table 1 as follows:
1. Heart rate stability is the variance of heart rate records.
2. Optimistic index is the sum of all the abscissas of moods. Here, according to Thayer's 2D mood model, we define the coordinates of the eight types of mood as shown in table 2.
Table 2. Coordinates of 8 types of mood
Mood abscissa ordinate
Pleased 2 1
Excited 1 2
Relaxed 2 -1
Calm 1 -2
Nervous -2 1
Angry -1 2
Sad -2 -1
3. Moody index is the variance of ordinates of mood records.
4. Room tidiness index is obtained through image processing operations using Microsoft Cognitive Toolkit's computer vision
API and Google's Cloud vision API. We use images tags and confidential levels. Then, we classify tags into 3 types, the first type describes if the room in the image is tidy or not; the second type describes decorations shown within the image; the last type including all the remaining tags. Finally, we calculate room tidiness index by accumulating confidential levels of tags categorized in first type.
5. Decorative index is obtained following the same method as optimistic index. We sum up confidential levels of second type tags to get this feature.
6. NEO-FFI test result is originally a score between 0 to 5, we binarize these scores using 3 as threshold.
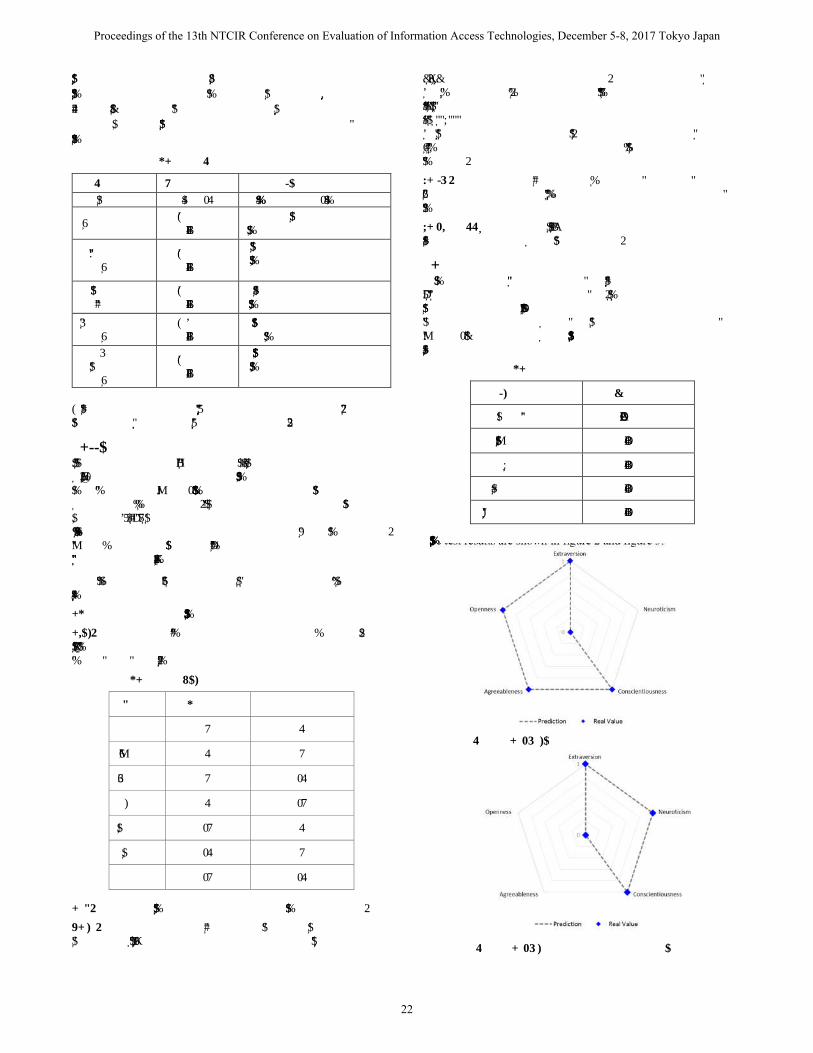
3.3 Results We first separate the sample into two subsets, training set includes 38 samples and test set includes two. Then, for each dimension, logistic regression model is trained with a 20% cross validation. At last, we test our models using two test samples, and compare them to NEO-FFI test results using a radar graph. The training accuracy is provided in table 3:
Table 3. Training accuracy
Dimension Accuracy
Neuroticism 97.50%
Extraversion 100%
Openness 100%
Agreeableness 100%
Conscientiousness 100%
The test results are shown in figure 2 and figure 3:
Figure 2. Evaluation result of test sample 1
Figure 3. Evaluation result of test sample 2
22
Proceedings of the 13th NTCIR Conference on Evaluation of Information Access Technologies, December 5-8, 2017 Tokyo Japan
Our work discovers a new and promising way of personality detection other than traditional questionnaires and surveys. Which compared to traditional ways, is less time consuming, more objective, and can achieve real-time with high accuracy. We apply a novel and operable personality measurement method based on lifelog data. In which, a logistic model is trained to get a binary estimation result, and NEO-FFI test [15] is applied as a validation. Here, we use objective lifelog data, which makes it possible to do personality analysis in large scale. However, our method still has some limitations. Future works should focus on conducting experiments with sample that has larger size and broader types. Deeper studies can also be directed at improving the machine-learning model used.
4. MOOD DETECTION
4.1 Research Design After gathering lifelog data on our participants, we fetch data on our selected features for each date. In table 4, you can see our list of extracted features per instance:
Table 4. Extracted Features
Feature Name Count Data Type Description
U1,U3 to U7 6 Binary Shows if the record belong
to specific user
Before Weekend
1 Binary Shows if the record belong
to a day before weekend
Minutes at Home/ Work/ Commuting
3 Whole Number Counts daily number of
minutes user has spent at home/work/commuting
Total Calories 1 Whole Number Calorie consumed during
24h
Total Steps 1 Whole Number Steps walked during 24h
Average HR 1 Whole Number Average Heart Rate during
24h
Wakeup Time 1 Whole Number
1-24 Wake up time 1-24
Sleep Duration 1 Whole Number Sleep Duration in minutes
Sleep Quality 1 Decimal
[0,1] Average Heart Rate hourly
Average User Arousal History
1 Decimal
[0,1]
Average Arousal Reported up to last day
* Feature used for arousal prediction
Last Day Arousal
1 Binary Last day’s Arousal
*Feature used for arousal prediction
Average User Valence History
1 Decimal
[0,1]
Average valence reported up to last day
* Feature used for valence prediction
Last Day Valence
1 Binary Last day’s valence
*Feature used for valence prediction
Then we decompose our mood labels in to two binary labels indicating arousal (energy) and valence (stress).
Table 5. Mood Decomposition
Mood Valence Arousal
Happy 1 1
Peaceful (Content)
1 0
Depressed 0 0
Anxious 0 1
We split each user’s data set to training and test sets of 90% and 10% randomly. Finally, we train two logistic regression models on training set and use the test set to evaluate our result.
4.2 Data Description
We use lifelog data released by NTCIR and our extended data set on five other active life loggers. NTCIR dataset is consist of the data on two life loggers, Although user one and user two respectively recorded 59 and 31 days of data, the data set only contains 31 records of mood only on user one. Furthermore, 6 days of data on this user is not applicable in our study due to lack of information on sleep quality. In table 6, you can see the size of the whole data set:
Table 6. Data Availability
User Total Days
Instances with complete feature set
Data Source
U1 59 25 NTCIR
U3 59 32 Volunteer Lifeloger
U4 42 22 Volunteer Lifeloger
U5 49 26 Volunteer Lifeloger
U6 45 45 Volunteer Lifeloger
U7 225 106 Volunteer Lifeloger
6 Users 479 256 Both
In our extended dataset, life-loggers are asked to use sleep cycle app to gather data on their sleep including sleeping time, duration and quality score. They are also required to run life cycle app on their phones to record their semantic location information. Biometrics and data on their physical activity is collected using sport bands and mobile health applications. Records on daily mood labels also are provided by lifelogers manually after they wake up in the morning. The labels are consistent with Thayer two-dimensional model of mood. Participants choose one of the four mood states of Anxious, Happy, Depressed, or Peaceful (Content) corresponding to their energy level and negative stress.
4.3 Results We train our models using logistic regression and accuracy of our training and test results is shown in table 7 and 8 for each dimension of mood.
23
Proceedings of the 13th NTCIR Conference on Evaluation of Information Access Technologies, December 5-8, 2017 Tokyo Japan
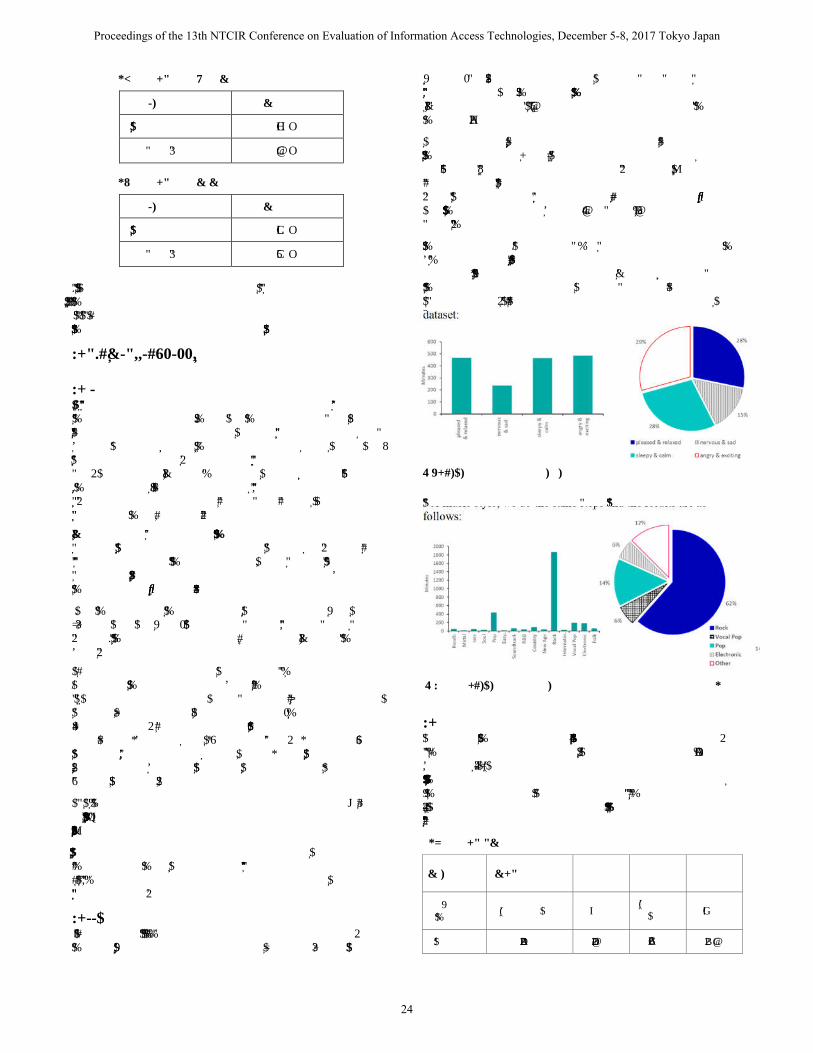
Table 7. Mood-Valence Prediction Accuracy
Dimension Accuracy
Training Accuracy 74%
Test Results 76%
Table 8. Mood-Arousal Prediction Accuracy
Dimension Accuracy
Training Accuracy 79%
Test Results 73%
Although the preliminary results are promising, the data set and features are limited, the models are simple, and results can improve. Some feature which could add accuracy to the model are blood pressure, GSR and data gathered from online sources on weather.
5. MUSIC AND MOOD STYLE DETECTION
5.1 Research Design Our experiment on music mood and style detection is conducted using two sources of data. Our first source is lifelog data on user’s biometrics and physical activities during listening to music and the second source is online information on each song in our user’s music listening history. This includes music length, mood and style tags. Here, we use NTCIR lifelog data on user one, and we extract seven features on user’s biometrics and physical activity while listening to music. We also obtain data about songs user were listening to from available music websites.
In NTCIR dataset one music track, which normally lasts for a few minutes, is only recorded as a tag in the starting minute. We obtain the music length to repeat the tag for every minute the song track lasts, using our online source. We also obtain tags on music mood and styles from Allmusic website to label our data.
Our lifelog related features include calories, galvanic skin response (GSR), heartrate, skin-temperature, steps, activity type, and time stamp. All these information are available in NTCIR dataset for each minute.
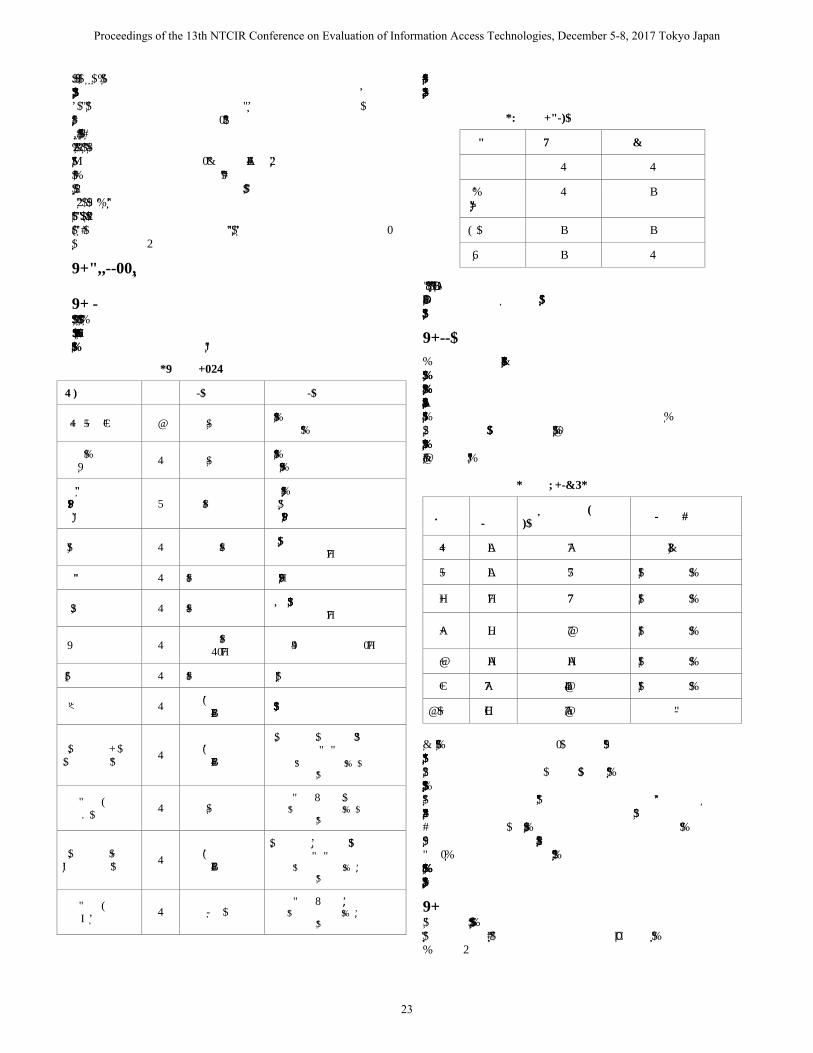
For Music mood labeling, we consider eight types of mood and summarize them in four groups as classification labels. The moods put together in one group share the same abscissa (valence) or ordinate (arousal) values using Thayer’s two-dimensional model of mood (Figure1). The labels include pleased & relaxed, nervous & sad, bored & calm, and angry & excited. Pleased & relaxed represent positive valence while nervous & sad represent negative valence. Bored and calm represent negative arousal while angry & excited represent positive arousal.
For music style, we consider the following categories: Randb, Metal, Jazz, Soul, Pop, Easy Listening, Soundtrack, R&B, Country, New Age, Rock, International, Vocal Pop, Electronic and Folk.
Finally, we conduct a supervised learning to train our models using labels fetched from online sources to detect music mood and style based on biometrics and physical activities of the person while listening to the music.
5.2 Data Description We extract body metrics features from the life log data. These features include calories, galvanic skin response (GSR), heart rate
and skin-temperature. Besides, we consider time stamp, steps and activity type in our feature set. According to the lifelog of user one in NTCIR data set, the user listened to 763 songs in total for a period of 45 days.
Then we use our online source available on music labels and other related information. Using song name, artist name and album name, we extract the song’s length, mood and style tags. Every song on this website is associated with several tags about music mood and style. According to the online music database available in Allmusic, our records for user one include 167 types of music mood and 60 types of music style in total.
Afterwards, we categorize tags of music mood into four classifications as mentioned above (pleased & relaxed, nervous & sad, sleepy & calm, angry & exciting). In case, one song has tags of more than one category, we consider the mood label with more support in tags. Following chart shows label distribution in our dataset:
Figure 4. Sample music minute and share for each mood share
For music style, we do the same steps and the results are as follows:
Figure 5. Sample music minutes and share for each style label
5.3 Results The results of our experiments are presented in Table 9 and 10. We adopt the method of ensemble learning. The accuracy of 85% is achieved using AdaBoost.M1 algorithm (use Decision Tree as weak classifier). We tried other ensemble learning algorithms and weak classifiers, and our results shows that the combination of AdaBoost.M1 and Decision Tree performed better than others in both music mood and music style detection.
Table 9. Music Mood Classification Accuracy using Bagging
Algorithm AdaBoost.M1 Bagging Bagging Bagging
Weak classifier
Decision Tree SVM Decision
Tree KNN
Accuracy 0.85 0.68 0.75 0.67
24
Proceedings of the 13th NTCIR Conference on Evaluation of Information Access Technologies, December 5-8, 2017 Tokyo Japan
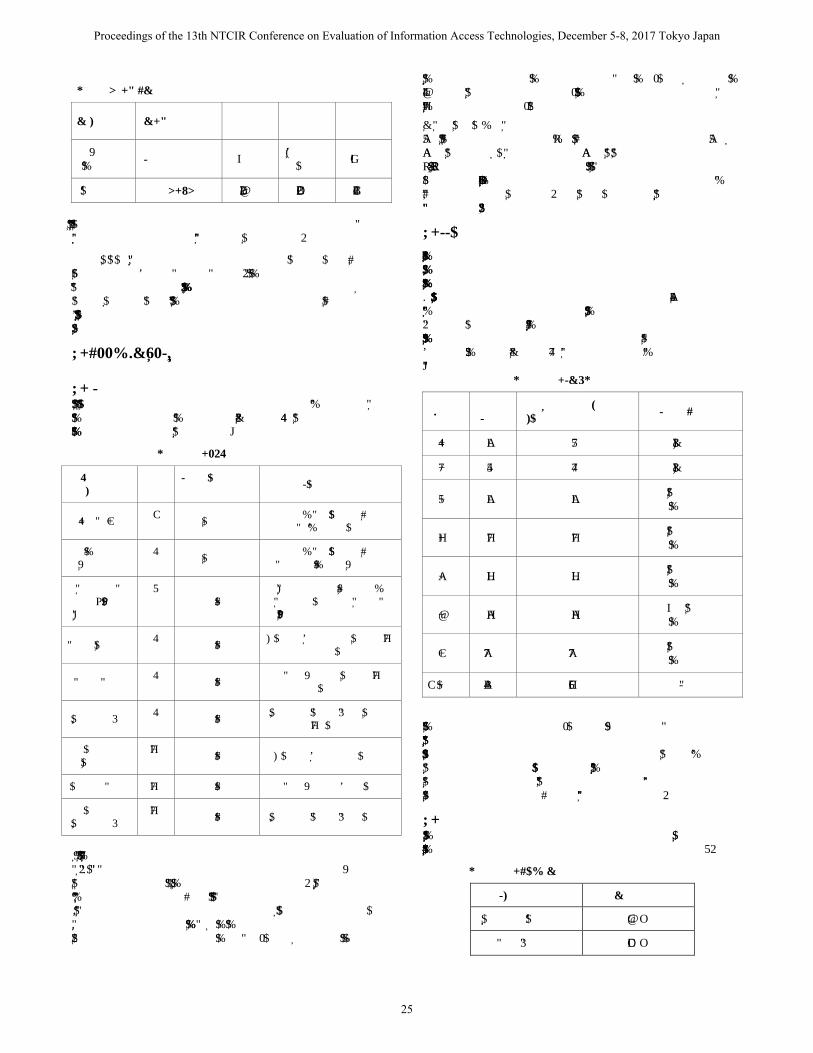
Table 10. Music Style Classification Accuracy using Bagging
Algorithm AdaBoost.M1 Bagging Bagging Bagging
Weak classifier
Decision Tree SVM Decision
Tree KNN
Accuracy 0.80 0.69 0.78 0.71
According to the accuracy obtained on test dataset, our new method on music mood and style detection is promising.
However, there are some limitations; First, our available experimental music data is limited. What is more, especially for music style, our data is unbalanced for different categories. Finally, there are many other important features, which could be considered, such as the environment (temperature, pressure, humidity, and so on) around the user.
6. SLEEP QUALITY PREDICTION
6.1 Research Design After gathering lifelog data on our participants, we fetch data on our selected features for each date. In table 11, you can see our list of extracted features per instance:
Table 11. Extracted Features
Feature Name
Count Data Type and Range
Description
U1 to U7 7
Binary Shows if the record belong
to specific user
Before Weekend
1 Binary
Shows if the record belong to a day before weekend
Minutes at Home/ Work/ Commuting
3 Whole Number
Counts daily number of minutes user has spent at home/work/commuting
Total Calories 1
Whole Number Calorie consumed during 24
hours
Total Steps 1
Whole Number Steps walked during 24
hours
Average HR 1
Whole Number Average Heart Rate during
24 hours
Hourly Calories
24 Whole Number Calorie consumed hourly
Hourly Steps 24 Whole Number Steps walked each hour
Hourly Average HR
24 Whole Number Average Heart Rate hourly
Then we make a shift in hourly features to make them consistent with sleeping time. As our dataset is limited, we also make summarization on features to avoid overfitting. Considering the fact that activities and biometrics, which are closer to sleep time, will have higher impact on sleep quality and as a result are more sensitive, we use different time windows for feature summarization. We applied four two-hour windows for hourly
information at ending hours of the day, two four-hour windows for 9th to 16th hours and one eight-hour window for hourly data in the beginning of each 24-hour cycle.
In addition, we considered sleep score of less than 35 percent to be indicator of “Poor” sleep, while between 35 and 55 percent and more than 55 percent respectively show “Borderline” and “Good” sleep. After data preparation, we split each user’s data set to training and test sets of 90% and 10% of the available dataset randomly. We train our model on training set and use the test set to evaluate our result.
6.2 Data Description
We use lifelog data released by NTCIR and our extended data set on five other active life loggers. NTCIR dataset is consist of the data on two life loggers, Although user one and user two respectively recorded 59 and 31 days of data, the data set only contains 32 and 23 records of sleep quality. From which 2 days of data on user 2 is not applicable in our study due to lack of information on other biometrics and physical features. In table 12, you can see the size of the whole data set:
Table 12. Data Availability
User Total Days
Instances with complete feature set
Data Source
U1 59 32 NTCIR
U2 31 21 NTCIR
U3 59 59 Volunteer Lifeloger
U4 42 42 Volunteer Lifeloger
U5 49 49 Volunteer Lifeloger
U6 45 45 Volunteer Lifeloger
U7 225 225 Volunteer Lifeloger
7 Users 510 473 Both
For our extended dataset, life-loggers were asked to use sleep cycle app to gather data on their sleep including sleeping time, duration and quality score. They were also asked to run life cycle app on their phones to record their semantic location information. Biometrics and data on their physical activity was collected through sport bands and mobile health applications.
6.3 Results We trained our model using classification by linear regression and accuracy of our training and test results is shown in table 13.
Table 13. Sleep Quality Prediction Accuracy
Dimension Accuracy
Training Accuracy 76%
Test Results 78%
25
Proceedings of the 13th NTCIR Conference on Evaluation of Information Access Technologies, December 5-8, 2017 Tokyo Japan
Although the preliminary results are acceptable, a more populated, diverse participant pool, and a more comprehensive feature set could help in improving the results. Using more complicated machine learning and deep learning models is possible with a bigger dataset, which is possible by using more participants and records per user.
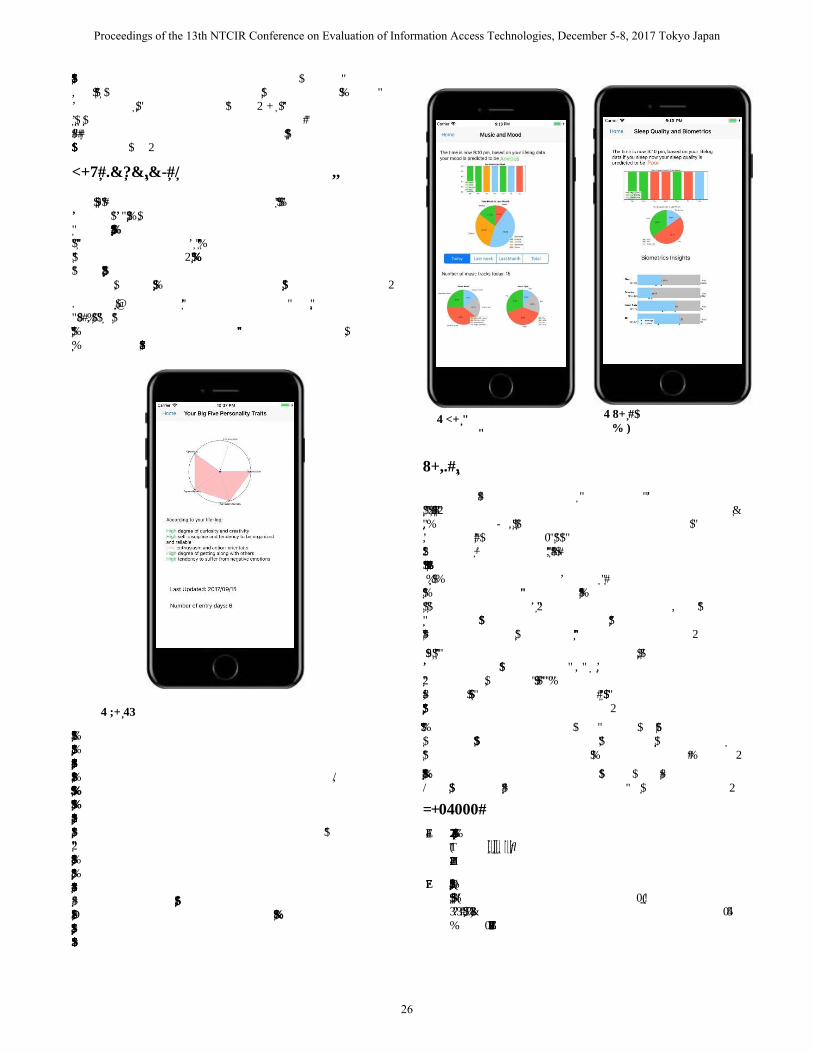
7. VISUALIZATION AND INSIGHT TOOL
We are working on a prototype mobile application for users to access their psychological health information. The provided insights are shown in four categories including big five personality traits, mood detection, music mood and style classification and sleep quality prediction. This application will use different type of charts and phrases to give insights on user’s psychological aspects. We also provide visual representation of historical data and trends.
As shown in Figure 6 psychological insight tool gives insights on the users’ big five personality traits and some descriptions according to lifelog data; this data automatically updates every day when new lifelog records are available.
Figure 7 depicts Music and Mood section of the tool. This part provides statistical insights on user’s mood for last seven days and gives prediction on user’s mood next day based on biometrics and physical activities recorded in his/her lifelog. We also visualize the share of each category of mood and styles from music tracks the user listened to in different periods (Today, Last Week, Last Month and Total). The categories shown here will be determined using the biometrics and physical activities during which the user listens to the music. On sleep quality the tool give predictions based on user’s lifelog, statistical insights on last seven days and last month of user’s sleep quality is also available. For biometrics chosen to be shown on the dashboard minimum, maximum, average and current data is visualized on a simple chart. (Figure 8) In further phases of development, insights can be provided on comparison with other users (or user demographic groups).
8. CONCLUSION
To sum up, we brought up new methods to psychologically understand the life logger and track one’s mental health. In evaluation of Big Five Personality measurement, our method achieved objective real-time measurement results with high accuracy. Using physical activities and biometrics, we are able predict the life logger’s mood with an acceptable accuracy. With help of online sources of music mood and style labeling, we successfully trained models that can use body metrics of the music listener to determine music mood and style. We give predicted insights on poor or good quality sleep according to daily activities and biometric data considering time distance to sleeping.
This work has important implications to improving traditional psychological researches with massive data and advanced technology. However, this work merely touches the tip of the iceberg; deeper research needs to be conducted in order to get achievements that are more convincing.
Although the size of our datasets are limited, our experiments show promising preliminary results which proves that understanding and modeling the user psychologically through lifelog data is feasible.
In the future, it will be interesting to record more on bigger sample sizes in order to gain deeper insight about these promising ideas.
9. REFERENCES
[1] A. F. S. A. R. D. Cathal Gurrin, "Lifelogging: Personal Big Data," Foundations and Trends in Information Retrieval, 2014.
[2] Cathal Gurrin, Hideo Joho, Frank Hopfgartner, Liting Zhou, Frank Hopfgartner, Liting Zhou, Duc-Tien Dang Nguyen, Rashimi Gupta, Rami Albatal, "Overview of NTCIR-13 Lifelog-2 Task," Tokyo, 2017.
Figure 6. Insight on Big Five Personality Traits
Figure 7. Insight on Music and Mood
Figure 8. Insights on Sleep Quality and Biometrics
26
Proceedings of the 13th NTCIR Conference on Evaluation of Information Access Technologies, December 5-8, 2017 Tokyo Japan
[3] Michal Kosinskia, David Stillwella and Thore Graepelb, "Private traits and attributes are predictable from digital records of human behavior," in National academy of science of United States of America, 2013.
[4] Mahnaz Roshanaei, Richard Han, Shivakant Mishra, Personalized Activity-Based Mood Prediction in Social Media, Cham: Springer International Publishing, 2017.
[5] Goldberg L R, "An alternative" description of personality": the big-five factor structure," Journal of personality and social psychology, no. 59(6), p. 1216, 1990.
[6] Barrick M R, Mount M K, "The Big Five personality dimensions and job performance: a meta‐analysis," Personnel psychology, no. 44(1), pp. 1-26, 1991.
[7] Yewen Wang, Min Zhang, Pouneh Soleimaninejadian, Haoyue Tong, Zehui Feng, "Big Five Personality Measurement Based on Lifelog," in LTA '17 Proceedings of the 2nd Workshop on Lifelogging Tools and Applications, Mountain View, 2017.
[8] Costa P T, McCrae R R., "The NEO personality inventory," 1985.
[9] Fruyt F D, McCrae R R, Szirmak Z, Nagy J, "The five-factor personality inventory as a measure of the five-factor model: Belgian, American, and Hungarian comparisons with the NEO-PI-R," Assessment, no. 11(3), pp. 207-215, 2004.
[10] Goldberg L R, "The development of markers for the Big-Five factor structure," Psychological assessment, no. 4(1), p. 26, 1992.
[11] Goldberg L R, "International Personality Item Pool: A scientific collaboratory for the development of advanced measures of personality and other individual differences," p. 2002, 8 1999.
[12] Benet-Martinez V, John O P., "Los Cinco Grandes across cultures and ethnic groups: Multitrait-multimethod analyses of the Big Five in Spanish and English," Journal of personality and social psychology, no. 75(3), p. 729, 1998.
[13] Gosling S D, Rentfrow P J, Swann W B, "A very brief measure of the Big-Five personality domains," Journal of Research in personality, no. 37(6), pp. 504-528, 2003.
[14] Rothmann S, Coetzer E P, "The Big Five personality dimensions and job performance," SA Journal of Industrial Psychology, no. 29(1), pp. 68-74, 2003.
[15] McCrae R R, Costa P T, "A contemplated revision of the NEO Five-Factor Inventory," Personality and individual differences, no. 36(3), pp. 587-596, 2004.
[16] J. M. L. Poon, "Mood: A review of its Antecedence and Consequences," International Journal Organization Theory and Behavior, 2001.
[17] Jaap J. A. Denissen, Ligaya Butalid, Lars Penke, Marcel A. G. van Aken, "The Effects of Weather on Daily Mood: A Multilevel Approach," Emotion, 2008.
[18] Davydov D. M., Stewart R., Ritchie K., Chaudieu I., "Depressed mood and blood pressure: The moderating effect of situation-specific arousal levels.," 2012. [Online]. Available: https://doi.org/10.1016/j.ijpsycho..
[19] Johnston D.W., Anastasiades P., "The relationship between heart rate and mood in real life.," J Psychosom Res., 1990.
[20] Vahey R., Becerra R., "Galvanic Skin Response in Mood Disorders: A Critical Review.," International Journal of Psychology and Psychological Therapy, 2015.
[21] Thayer R. E., Biakanja L., O’Hanian P., Sorrell K. A.T., Balasanian A., Clemens A. S., Fasi J. O., "Amount of Daily Walking Predicts Energy, Mood, Personality, and Health.," in Posterpresented at the American Psychological Association, Washington DC, 2005.
[22] Mandel M.I., Poliner G.E., Ellis D.P.W., "Support vector machine active learning for music retrieval.," Multimedia Systems, 2006.
[23] Alm C. O., Roth D., Sproat R., "Emotions from text: machine learning for text-based emotion prediction.," in the conference on Human Language Technology and Empirical Methods in Natural Language Processing, 2005.
[24] Neumayer R., Rauber A., "Integration of text and audio features for genre classification in music information retrieval," in the 29th European Conference on Information Retrieval, Rome, Italy., 2007.
[25] Laurier C., Grivolla J., Herrera P., "Multimodal music mood classification using audio and lyrics.," in International Conference on Machine Learning and Applications, 2008.
[26] Christin Langa, Serge Brand, Anne KarinaFeldmeth, EdithHolsboer-Trachsler, UwePühse, MarkusGerber, "Increased self-reported and objectively assessed physical activity predict sleep quality among adolescents," Physiology & Behavior, vol. 120, pp. 46-53, 15 August 2013.
[27] Paul D.Loprinzia, Bradley J.Cardinal, "Association between objectively-measured physical activity and sleep," Mental Health and Physical Activity, vol. 4, no. 2, pp. 65-69, December 2011.
[28] Costa P T, McCrae R R, "Revised NEO Personality Inventory (NEO-PI-R) and NEO Five Factor Model (NEO-FFI) professional manual".Psychological Assessment Resources.
[29] Ilies R., Dimotakis N., Watson D, "Mood, blood pressure, and heart rate at work: An experience-sampling study," Journal of Occupational Health Psychology, 2010.
[30] Dodge M., Kitchin R., "Outlines of a world coming into existence: pervasive computing and the ethics of forgetting," Sage Journal, 2007.
27
Proceedings of the 13th NTCIR Conference on Evaluation of Information Access Technologies, December 5-8, 2017 Tokyo Japan
Related Documents