materials Article Thioglycolic Acid FTIR Spectra on Ag 2 S Quantum Dots Interfaces Tamara Kondratenko 1, * ,† , Oleg Ovchinnikov 1,† , Irina Grevtseva 1,† , Mikhail Smirnov 1,2,† , Oksana Erina 3,† , Vladimir Khokhlov 3,† and Boris Darinsky 3,† and Elena Tatianina 4 1 Department of Optics and Spectroscopy, Voronezh State University, 394018 Voronezh, Russia; [email protected] (O.O.); [email protected] (I.G.); [email protected] (M.S.) 2 Federal State Budget Educational Institution of Higher Education “Voronezh State University of Engineering Technologies”, 3394036 Voronezh, Russia 3 Department of Analytical Chemistry, Voronezh State University, 394018 Voronezh, Russia; [email protected] (O.E.); [email protected] (V.K.); [email protected] (B.D.) 4 Department of Physics, Voronezh State Technical University, 394006 Voronezh, Russia; [email protected] * Correspondence: [email protected]; Tel.: +7-(473)-220-87-80 † These authors contributed equally to this work. Received: 25 November 2019; Accepted: 9 February 2020; Published: 18 February 2020 Abstract: The mechanism features of colloidal quantum dots (QDs) passivation with thioglycolic acid molecules (TGA) for cases of different luminescent properties is considered using FTIR. This problem is considered based on FTIR spectra analysis for various ionic forms of TGA. Experimental TGA molecules FTIR spectra is interpreted, basing on the data on modeling of TGA vibrational modes, realized in the framework of density functional method (DFT /B3LYP/6-31+G(d)) taking into account the vibrations anharmonicity of every functional group. This approach provides a significant improvement in the agreement between the experimental and calculated data. FTIR spectra of Ag 2 S/TGA QDs with exciton and recombination luminescence are differ from each other and B “freeB” TGA molecules. The ν(S - H) TGA peak (2559 cm -1 ) disappears in FTIR spectra of Ag 2 S/TGA QD samples. This fact indicates the interactions between TGA thiol group and dangling bonds of Ag 2 S nanocrystals. Ag 2 S QDs passivation with TGA molecules leads to emergence ν as (COO - ) (1584 cm -1 ) and ν s (COO - ) (1387 cm -1 ) peaks. It indicates TGA adsorption in ionic form. For Ag 2 S/TGA QDs with exciton luminescence we observed (a) significant low-frequency shift of ν s (COO - ) peak from 1388 cm -1 to 1359 cm -1 and high-frequency shift of ν as (COO - ) peak from 1567 cm -1 to 1581 cm -1 ; (b) change in the ratio of intensities of ν as (COO - ) and ν s (COO - ) vibrations. This feature is caused by the change in the symmetry of TGA molecules due to passivation of Ag 2 S quantum dots.For Ag 2 S/TGA QDs with recombination luminescence, the insignificant high-frequency shift of 7–10 cm -1 for ν as (COO - ) at 1567 cm -1 and low-frequency shift of 3–5 cm -1 for ν s (COO - ) at 1388 cm -1 , probably caused by the interaction of thiol with Ag 2 S surface is observed. Using FTIR spectra, it was found that IR luminescence photodegradation is also accompanied by changes in the thioglycolic acid molecules, which capped Ag 2 S QDs. In the case of Ag 2 S QDs with exciton luminescence, the degradation process is non-reversible. It is accompanied by TGA photodegradation with the formation of α-thiol-substituted acyl radical (S-CH 2 -CO • ) TGA. Keywords: thioglycolic acid (TGA); Ag 2 S quantum dots; FTIR spectra; luminescence; photodegradation; dimer; ionic form Materials 2020, 13, 909; doi:10.3390/ma13040909 www.mdpi.com/journal/materials

Welcome message from author
This document is posted to help you gain knowledge. Please leave a comment to let me know what you think about it! Share it to your friends and learn new things together.
Transcript
materials
Article
Thioglycolic Acid FTIR Spectra on Ag2S QuantumDots Interfaces
Tamara Kondratenko 1,*,†, Oleg Ovchinnikov 1,†, Irina Grevtseva 1,†, Mikhail Smirnov 1,2,†,Oksana Erina 3,†, Vladimir Khokhlov 3,† and Boris Darinsky 3,† and Elena Tatianina 4
1 Department of Optics and Spectroscopy, Voronezh State University, 394018 Voronezh, Russia;[email protected] (O.O.); [email protected] (I.G.); [email protected] (M.S.)
2 Federal State Budget Educational Institution of Higher Education “Voronezh State University ofEngineering Technologies”, 3394036 Voronezh, Russia
3 Department of Analytical Chemistry, Voronezh State University, 394018 Voronezh, Russia;[email protected] (O.E.); [email protected] (V.K.); [email protected] (B.D.)
4 Department of Physics, Voronezh State Technical University, 394006 Voronezh, Russia;[email protected]
* Correspondence: [email protected]; Tel.: +7-(473)-220-87-80† These authors contributed equally to this work.
Received: 25 November 2019; Accepted: 9 February 2020; Published: 18 February 2020�����������������
Abstract: The mechanism features of colloidal quantum dots (QDs) passivation with thioglycolicacid molecules (TGA) for cases of different luminescent properties is considered using FTIR. Thisproblem is considered based on FTIR spectra analysis for various ionic forms of TGA. ExperimentalTGA molecules FTIR spectra is interpreted, basing on the data on modeling of TGA vibrationalmodes, realized in the framework of density functional method (DFT /B3LYP/6-31+G(d)) takinginto account the vibrations anharmonicity of every functional group. This approach provides asignificant improvement in the agreement between the experimental and calculated data. FTIRspectra of Ag2S/TGA QDs with exciton and recombination luminescence are differ from each otherand B “freeB” TGA molecules. The ν(S− H) TGA peak (2559 cm−1) disappears in FTIR spectraof Ag2S/TGA QD samples. This fact indicates the interactions between TGA thiol group anddangling bonds of Ag2S nanocrystals. Ag2S QDs passivation with TGA molecules leads to emergenceνas(COO−) (1584 cm−1) and νs(COO−) (1387 cm−1) peaks. It indicates TGA adsorption in ionicform. For Ag2S/TGA QDs with exciton luminescence we observed (a) significant low-frequencyshift of νs(COO−) peak from 1388 cm−1 to 1359 cm−1 and high-frequency shift of νas(COO−) peakfrom 1567 cm−1 to 1581 cm−1; (b) change in the ratio of intensities of νas(COO−) and νs(COO−)vibrations. This feature is caused by the change in the symmetry of TGA molecules due to passivationof Ag2S quantum dots.For Ag2S/TGA QDs with recombination luminescence, the insignificanthigh-frequency shift of 7–10 cm−1 for νas (COO−) at 1567 cm−1 and low-frequency shift of 3–5 cm−1
for νs (COO−) at 1388 cm−1, probably caused by the interaction of thiol with Ag2S surface is observed.Using FTIR spectra, it was found that IR luminescence photodegradation is also accompanied bychanges in the thioglycolic acid molecules, which capped Ag2S QDs. In the case of Ag2S QDswith exciton luminescence, the degradation process is non-reversible. It is accompanied by TGAphotodegradation with the formation of α-thiol-substituted acyl radical (S-CH2-CO•) TGA.
Keywords: thioglycolic acid (TGA); Ag2S quantum dots; FTIR spectra; luminescence;photodegradation; dimer; ionic form
Materials 2020, 13, 909; doi:10.3390/ma13040909 www.mdpi.com/journal/materials
Materials 2020, 13, 909 2 of 15
1. Introduction
The problem of obtaining functional nanomaterials based on semiconductor colloidal quantumdots (QDs) with specific luminescent properties is relevant, primarily for creating luminescent sensorsfor biology, medicine, chemistry, geology, etc. [1–9]. The coating of nanocrystal interfaces with size ofseveral nanometers with various ligands prevents their agglomeration. The molecule functional groupsare selected with aim of the removing or minimizing the concentration of QDs surface dangling bondsdue to interaction with them.This provide optimal luminescent properties of colloidal quantum dots.
Thioglycolic acid (TGA) is actively and successfully used as passivator in the synthesis ofcolloidal quantum dots and core/shell systems [4–17]. Many important problems of nanophotonicsare closely related to the interaction mechanism of QDs with organic matrix, which ensure thenanostructures formation with special composition and stoichiometry. In particular, the choice ofpassivator molecules determines the QDs luminescent properties [18,19]. For optimization of theinterface passivation conditions it is necessary to know interaction mechanism of TGA moleculesand QDs interfaces. TGA bifunctionality is a specific feature of these molecules, acting as QDspassivators [4,20–22]. These molecules can interact with dangling bonds QD through both the thioland carbonyl groups [6–8,13,21–23]. It should be taking into account that TGA in a solution is capableto self-association, as well as the formation of other polynuclear complex forms (sodium salt, anionand dianion, etc.) [7,15,24–26].
To date, the most frequent studies of QDs interaction mechanisms with organic molecules arebased on UV-Vis absorption and luminescence spectra [27–29].These data are used for interactiontype proposing. It can be covalent binding or electrostatic absorption of stabilizer molecules.In the meantime, FTIR spectroscopy data have been found to significantly refine and specifythe intermolecular interactions mechanisms, allowing us to find stabilizer groups that are activein the interaction and propose an intermolecular interactions model in the nanocrystal-stabilizersystem [4,12–17,30]. Such models are not universal, they depend on QDs material and used stabilize.Therefore, they require refinement in each specific case [9,13].
The most informative method to investigation the interaction type and passivator moleculesstructure is Fourier-transform infrared (FTIR) spectroscopy. Using this method requires unambiguousunderstanding TGA FTIR spectra in the initial solution, using for passivating QDs. The interpretationof TGA molecules FTIR spectra is ambiguous [3,5,6,10,12,14,21–25,25,26,30–37]. This providesto ambiguity in FTIR spectra interpretation of TGA molecules and passivation mechanisms ofsemiconductor colloidal quantum dots, as well as plasmon nanoparticles.
This work is devoted to the analysis of passivation mechanisms of Ag2S quantum dots withTGA molecules with various luminescent properties. The solution to this problem is based on FTIRspectra interpretation for various ionic forms of TGA molecules, based on the results of modeling theFTIR vibration modes of various ionic forms and TGA dimers, obtained in the framework of densityfunctional method (DFT/B3LYP/6-31+G(d)) using the Gaussian-03 software package.
2. Methods of Investigation
The studied samples were colloidal solutions of Ag2S QDs, passivated with TGA and aqueousTGA solutions with different pH. Colloidal Ag2S/TGA QDs were prepared by the aqueous synthesistechnique [18,19]. All reagents (Na2S, AgNO3, TGA, NaOH) purchased from Sigma-Aldrich wereof high purity. In the first approach, Na2S aqueous solution was used as the sulfur source. TGAmolecules, in this case, were mainly used for the interface passivation. In the synthesis, we used anAg+/TGA precursor solution (200 mL) obtained by mixing AgNO3 (2.6 mmol) and TGA (2.6 mmol)with subsequent raising of pH to 10 by addition of a 1M NaOH solution. After that, with constantstirring, 50 mL of a Na2S aqueous solution were added using a peristaltic pump. The solution inthe reactor changed color from light yellow to dark brown. Thus, Ag2S QDs with a concentration of2 × 10−5 mol QDs/L were formed in water. The synthesis was carried out at a temperature of 30 ◦C.[AgNO3]:[TGA]:[Na2S] molar ratio, in this case, was 1:1.1:0.33.
Materials 2020, 13, 909 3 of 15
In the second approach to the synthesis of Ag2S QDs, a TGA aqueous solution was used as the onlysulfur source. TGA molecules also acted as the passivating agent. In this synthesis, Ag2S QD sampleswere obtained in the same way as described above, but without using Na2S. [AgNO3]:[TGA]:[Na2S]molar ratio, in this case, was 1:0.9:0.
These approaches to the synthesis make it possible to obtain ensembles of colloidal quantum dotsthat are fundamentally different in their physical properties. The structural and spectral properties ofsuch samples are considered in detail in works [18,19]. Ag2S QDs in solution was 2× 10⁻⁵ mol QDs/L.With the ratio of ion concentrations [AgNO3]:[TGA]:[Na2S] ranging from 1:0.9:0 to 1:1.1:0.33, Ag2Sparticles are formed with sizes 2.0 nm and 2.5 nm, respectively. In this work, we consider the relationof luminescent properties with passivation mechanism of QDs interface with TGA molecules.
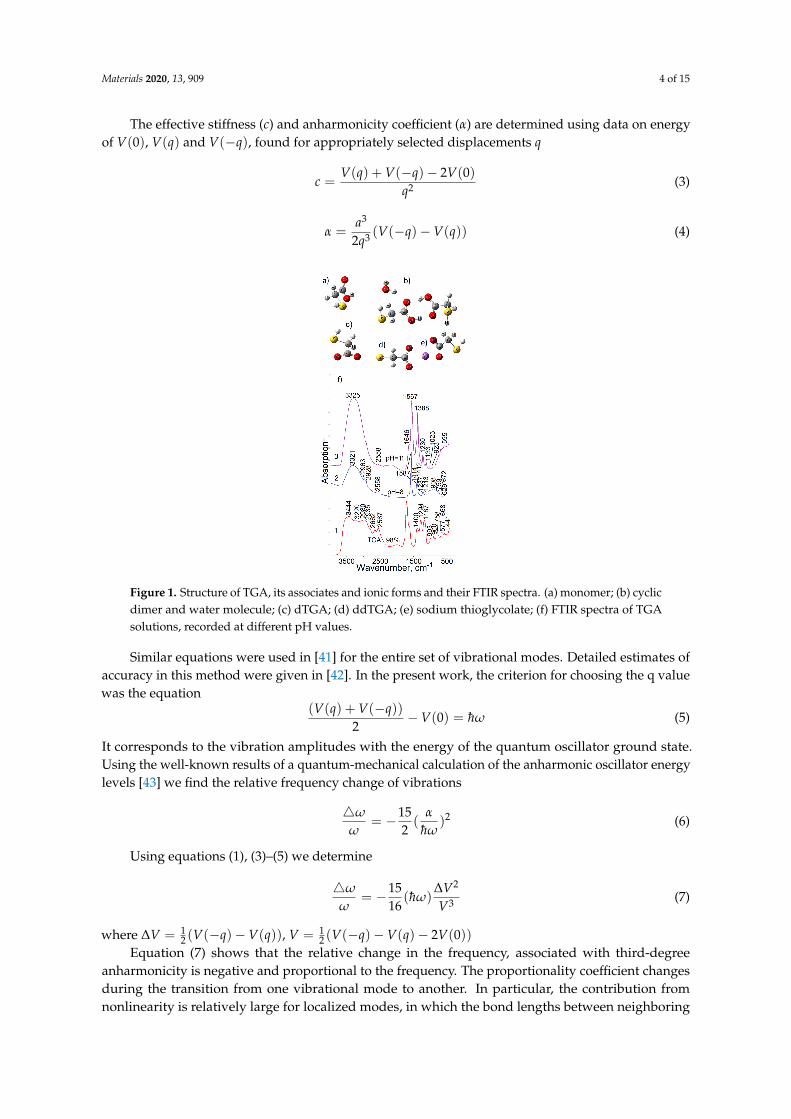
Solutions with various pH values were obtained by dropwise introducing 1 M NaOH solutioninto pure TGA solution reaching the required value. pH value was controlled by a pH-150M pH meter(Russia). 0.15 mL of obtained solution was applied on the windows using measuring pipette. pHvalues were picked out with aim to obtain various TGA ionic forms (deprotonated (dTGA), doubledeprotonated (ddTGA)). Their structures are presented in Figure 1. We used known values pK1 = 3.48,pK2 = 10.11 [38]. At 8 acid molecules present in solution in ionic form (dTGA). For pH > 11 there isdouble deprotonated form (ddTGA).
Analysis of various TGA ionic forms was carried out using FTIR spectra. They were recordedon Tensor 37 FTIR spectrometers with a beam splitter from KBr, DTLS detector (Bruker Optik GmbH)under strictly constant conditions in the region of 400–4000 cm−1. The spectrometer control, recordingand adaptation of spectra were performed using OPUS 7.0 software.
0.15 mL of obtained solution was applied to the cell window using measuring pipette. The solutionitself is one of the most significant peaks in the infrared region. The window surface was uniformlywetted and dried in air stream, heated to 40–50 ◦C. TGA with high purity, obtained from Sigma-Aldrichcompany were used in this investigation. In preliminary studies dried TGA solution was preparedon windows of KCl and CaF2. The authors took into account that in the conduction of the samplespreparation with this method TGA sodium salt is formed.
Computer modeling of FTIR vibrational modes was performed for various TGA moleculeconfigurations (monomer (Figure 1a); cyclic dimer and water molecule (Figure 1b); dTGA (Figure 1c);ddTGA (Figure 1d); sodium thioglycolate (Figure 1e)). Estimations were done by the density functionalmethod, DFT/B3LYP/6- 31+G(d) using GAUSSIAN-09 software package [39]. In the case of variousionic forms complexes of TGA and water molecules the molecular geometry was regulated inaccordance with the minimum potential energy of all stereoisomers, calculated previously.
The approach to calculate TGA FTIR spectra within this basis framework supposes the use ofa harmonic approximation. The obtained results should be predictive. Therefore, the method wasdeveloped for taking into account the effect of anharmonicity on the vibrational frequencies value,using the technique, based on the calculation of the system energy characteristics as a function ofatoms coordinates, allowing to present the field of forces acting between the atoms [40].
Calculating the energy of this configuration in the framework of GAUSSIAN-09 software packageallows us to find the dependence of the system potential energy on the parameter q for each mode.Further, this dependence is approximated by the equation
V(q) = V(0) +c2
q2 − α(qa)3 (1)
where V(q) is the potential energy of atomic displacements of the chosen mode, presented as thegeneralized coordinate function q of this mode, c is the effective stiffness of the chosen mode, α isthe third-order anhormonicity coefficient, a is the characteristic displacements value, determinedby equation
α = (h̄ω
c)
12 (2)
Materials 2020, 13, 909 4 of 15
The effective stiffness (c) and anharmonicity coefficient (α) are determined using data on energyof V(0), V(q) and V(−q), found for appropriately selected displacements q
c =V(q) + V(−q)− 2V(0)
q2 (3)
α =a3
2q3 (V(−q)−V(q)) (4)
Figure 1. Structure of TGA, its associates and ionic forms and their FTIR spectra. (a) monomer; (b) cyclicdimer and water molecule; (c) dTGA; (d) ddTGA; (e) sodium thioglycolate; (f) FTIR spectra of TGAsolutions, recorded at different pH values.
Similar equations were used in [41] for the entire set of vibrational modes. Detailed estimates ofaccuracy in this method were given in [42]. In the present work, the criterion for choosing the q valuewas the equation
(V(q) + V(−q))2
−V(0) = h̄ω (5)
It corresponds to the vibration amplitudes with the energy of the quantum oscillator ground state.Using the well-known results of a quantum-mechanical calculation of the anharmonic oscillator energylevels [43] we find the relative frequency change of vibrations
4ω
ω= −15
2(
α
h̄ω)2 (6)
Using equations (1), (3)–(5) we determine
4ω
ω= −15
16(h̄ω)
∆V2
V3 (7)
where ∆V = 12 (V(−q)−V(q)), V = 1
2 (V(−q)−V(q)− 2V(0))Equation (7) shows that the relative change in the frequency, associated with third-degree
anharmonicity is negative and proportional to the frequency. The proportionality coefficient changesduring the transition from one vibrational mode to another. In particular, the contribution fromnonlinearity is relatively large for localized modes, in which the bond lengths between neighboring
Materials 2020, 13, 909 5 of 15
atoms vary noticeably, compared to the deformation modes, for which the distances betweenneighboring atoms very little. Although that only one nonlinearity coefficient is taken into account in(6), this approach leads to a significant improvement in the agreement between the experimental andcalculated modes in the region of stretching vibrations of CO and OH bonds.
Optical absorption spectra were obtained by a USB2000+ spectrometer (OceanOptics, USA) witha USB-DT radiation source (Ocean optics).
Investigations of luminescence spectra of colloidal QDs were realized, using an automatedspectral complex, based on a diffractive monochromator MDR-23 (LOMO). A highly stable low-noisephotodiode PDF10C/M (ThorlabsInc., USA) with a built-in amplifier was used as photodetector in thenear-IR region. For luminescence excitation, we used an NDV7375 laser diode (Nichia, Japan) with405 nm emission and PM-G80 (CST, China) laser module with 532 nm emission and 100 mW opticalpower. Presented results were obtained at room temperature.
3. Results and Discussion
3.1. FTIR Spectra of TGA Water Solutions
First of all, FTIR spectra of various ionic forms of TGA were analyzed. Figure 1f shows FTIRspectra of TGA aqueous solutions under conditions of different pH values. Table 1 summarizes thedata on TGA vibrational modes, obtained from FTIR spectra and calculation results. They are necessaryfor the characteristic modes analysis.
The spectra of all studied samples include the noticeable bands set, whose position, intensity andfull width at half maximum experience significant changes during increasing in pH value.
The largest changes were obtained in the region of both bound stretching modes (3000–3500 cm−1)and stretching and bending vibrations of carboxyl functional groups (1700–1100 cm−1).
FTIR spectrum of 98% TGA solution (pH = 2) has a complex band at 2500–3600 cm−1 (Figure 1f,curve 1, Table 1). In the high-frequency spectrum region, a broad band with peak at 3445 cm−1
and feature in the region of 3220 cm−1 was found. These bands belong to –OH groups vibration,involved in H-bonds. At the same time, the peak at 3220 cm−1 belongs to –OH groups vibrationin COOH fragment, participating in the formation of TGA dimers. Another broad band with peakat 3445 cm−1 can be attributed to –OH groups of water molecules, located near TGA moleculesand promoting the formation of H-bond bridges, including dimerization process, which are lessbonded with TGA molecules [7,12,25,26,34]. This hypothesis is supported by the disappearance ofthe first band (3220 cm−1) with increase in pH value, as well as a decrease in frequency value from3445 cm−1 to 3325 cm−1 with decrease in TGA dimers fraction. In addition to these two peaks thereis a band with peak at 2980 cm−1 in FTIR spectra of concentrated TGA solutions. This peak alsobelongs to the stretching vibrations of OH-bonded groups in TGA molecule. Apparently, TGA dimersformation affects these vibrations symmetry and their group character. This hypothesis is confirmedby the calculation results. For the case of TGA dimers, the appearance of two modes belonging tothe stretching vibrations of OH-bonded groups (3086 cm−1 and 2987 cm−1, see Table 1) is observed.The addition of water molecules near TGA leads to the appearance of a peak at 3490–3500 cm−1
(Table 1).It should be noted that the band at 3440–3450 cm−1 shifts to the low-frequency region
(3315–3325 cm−1) with increasing in pH value, significantly changing TGA molecules structure,breaking cyclic dimers formation, forming TGA sodium and anion molecules forms. This fact alsoconfirms our conclusion that the peak at 3445 cm−1 belongs to –OH groups vibrations in watermolecules, located near TGA molecules and promoting the H-bond bridges formation, includingdimerization process. TGA molecules deprotonation and dimer destruction follow to changingthe interaction character with –OH groups in water molecules. According to spectrum, H-bondstrength increases. It is manifested in the hypsochromic shift of the band from 3440–3450 cm−1 to3315–3325 cm−1.
Materials 2020, 13, 909 6 of 15
The band with peak at 2935 cm−1 and feature near 2882 cm−1, appeared as single low-intensityband in the condition of higher pH value is attributed to the asymmetric and symmetric stretchingvibrations of CH2 groups, respectively [15,24–26,34]. When pH value increases, the changes in theposition of these vibration modes do not exceed 6–10 cm−1. This fact indirectly confirms the structuralTGA molecule transformations and effect of –OH solvent groups.
The next most intense peak at 2567 cm−1 is related to the SH stretch of TGA molecules. It isin agreement with calculation results. This peak position some shifts with increasing in pH value.According to the calculation data, this band position is also sensitive to TGA dimers formation(shift from 2576 cm−1 to 2559 cm−1) (Table 1). The dimers destruction and TGA molecule deprotonation,as well as an increase in the concentration of OH-ions in solution explain the behavior of this band.This hypothesis is supported by a significant decrease in this band intensity with increasing in pHvalue that corresponds to increasing in fraction of double-deprotonated molecules.
The peak at 2662 cm−1 is another distinctive band in this FTIR spectrum region. This peakis observed for 98% TGA solution. Apparently, the presence of TGA dimers is also confirmedby the presence of this distinctive band at 2662 cm−1, which is characteristic of carboxylic acidsdimmers [25,26,31–33]. However, this band is not due to the SH stretch with another symmetry in adimer, which are differ from TGA monomer, since the increase in pH value this peak. It is importantthat this band does not exist in the calculated spectra, for which the anharmonic effect was not laiddown at the base determination stage. The complex anharmonic nature of this peak was confirmedin [25]. In this work, this band is related to a complex vibration, caused by overtones and combinationsof 1294 and 1400 cm−1 bands due to the interacting C-O stretching and in-plane COH bendingvibrations. The attribution of this band to the SH stretches is also questionably. It disappears withincrease in pH solution value. And in these conditions, the SH bending vibrations in the low-frequencyregion (950–1030 cm−1) (Figure 1f). Note that the calculations in the framework of models consideringFermi coupling between the OH stretch and nearly resonant combination bands for carboxylic aciddimer show the band at 2600–2700 cm−1, characteristic of hydrogen bonds in cyclic dimer, foundingits strong Fermi resonance interactions, involving the OH and CO vibrations [34].
A more intricate picture is observed in the low-frequency spectrum region. A narrow intense bandwith peak at 1714 cm−1 and feature at 1700 cm−1, as well as a feature near 1640 cm−1 are observedat 1750–1650 cm−1. The peak at 1714 cm−1 is related to the asymmetric C=O stretch. The feature at1700 cm−1 is corresponded to the symmetric C=O stretch. This band structure confirms the presenceof TGA molecules with dimer form in 98% solution. This band disappear with increasing in pH value.The complex band structure is explained by the breach in interaction of carbonyl groups vibrationsin structures with hydrogen bond [44]. The presence of this doublet in the region of the C=O stretchwas reported in [25]. It was attributed to characteristic of cyclic dimers (Figure 1b). A cyclic dimeris a structure, including two acid molecules that interact with each other due to hydrogen bonds.Atoms that form the cycle lie almost in the same plane. And the hydrogen bonds are almost linear.The calculation indicates the complex nature of discussed spectrum, which includes, in addition to theC=O stretch, the COH bending vibrations.
The low-frequency feature of discussed band at 1640 cm−1 is due to the bending vibrations of–OH bounded groups of H2O molecules in TGA solution. In the case of increasing in pH value, thisband appears as a high-frequency feature near peak in the region of 1565–1587 cm−1, belonging to theasymmetric stretching vibrations of carboxylate anion νas(COO−). It should be noted that the bandparameters of bending vibrations of –OH bounded groups and its presence significantly affects theband position of asymmetric stretching vibrations of carboxylate anion νas(COO−). The calculatedvalue of the bending vibrations of –OH bounded groups of H2O molecules in TGA solution at1550–1620 cm−1 essentially depends on the environment (TGA molecules, NaOH buffer solution).The observed inequality with experiment is also caused by the significant anharmonicity of –OH groupvibrations, whose influence to the calculation is not fully taken into account.
Materials 2020, 13, 909 7 of 15
When pH value increases to 8, both with decrease in intensity of symmetric stretch bands, TGAdimers characteristic (1700 cm−1) the new intense band appear at 1587 cm−1 and shoulder at 1380 cm−1,corresponding to asymmetric and symmetric stretching vibrations of carboxylate anion (COO−). FTIRspectrum calculations of deprotonated TGA molecule in the presence of buffer solution (NaOH) showmodes with value, closed to these bands. They are 1580 cm−1 and 1376 cm−1. A subsequent increasein pH value leads to leveled of the dimer band at 1700 cm−1 and increase in intensity of stretch bandsof carboxylate anion (Figure 1f).
In the region of 1380–1170 cm−1 the bands with peak at 1400 cm−1 and 1294 cm−1 disappear.They correspond to complex compound δ(COH). At the same time, lower frequency bands at1230–1240 cm−1, related to the CH2 wagging vibrations, which are cleaner from overlapping appear.A similar picture is observed in the region of the CH2 twisting vibrations, overlapping with the C-Ostretching vibrations at 1186 cm−1. An increase in solution pH value leads to the appearance of the“pure” CH2 twisting vibration at 1127–1169 cm−1.
In the region below 1100 cm−1, several complex composite vibrations are observed. In the mainlythere are bending vibrations of CH2 and OCO− groups in this region [15,24–26,34]. The band at900 cm−1, observed for a 98% TGA solution corresponds to the presence of large dimers fraction.At the same time, when pH value of solution increases, this peak cannot be interpreted unambiguouslydue to sameness of calculated γ(OH) and ρ(CH2) modes, characteristic of dimers and anionic acidforms. In the region of 959–1025 cm−1, the SH bending vibrations appear in the experimental FTIRspectra.The corresponding modes in the calculation spectra are 932–974 cm−1. It should be noted thatwhen pH value increases, the intensity of discussed bands decreases significantly. This fact indicatesthe molecule deprotonation according to the second stage and TGA dianion formation (Figure 1). In thecalculation spectra for a double-deprotonated molecule this band is absent, as well as other bands,corresponding to the vibrations of thiol group, which were observed in the cases of dimer (838, 808,783, 746 cm−1). In the experimental FTIR spectrum, the SH bands appear at pH 3–8. They are absentwhen it increases to 10. The observed regularities in the region of bending vibrations correlates withthe data, obtained for stretching vibrations and confirms the formation of the certain TGA dianionsfaction with increasing in solution pH value to 8. Band series include the bending vibrations of OCO−
groups (668, 577 cm−1). The band at 668 cm−1 corresponds to the stretching vibration. SH vibrationsare observed at 758 cm−1.
Thus, the analysis of TGA molecules FTIR spectra, taking into account calculation results showsthe following important regularities:
- for 98% TGA solution TGA FTIR spectra show bands, corresponded to dimer with maximumfraction. Dimers are formed due to H-bonds. It provides the presence in FTIR spectrum of the OHbonded stretch, including in COH acid fragment (3220 and 2980 cm−1) and water (3445 cm−1), band at2662 cm−1, which characterize cyclic dimer, in-plane COH (1400 cm−1), the CO bending vibrations(1714 cm−1) and feature at 1700 cm−1, which also characterizes the cyclic dimer, the COH bending(1400) and C-O stretching vibrations (1187 cm−1 and 1294 cm−1), conjugated with the CH2 bendingvibrations, out-of-plane OH bending vibration (900 cm−1);
Materials 2020, 13, 909 8 of 15
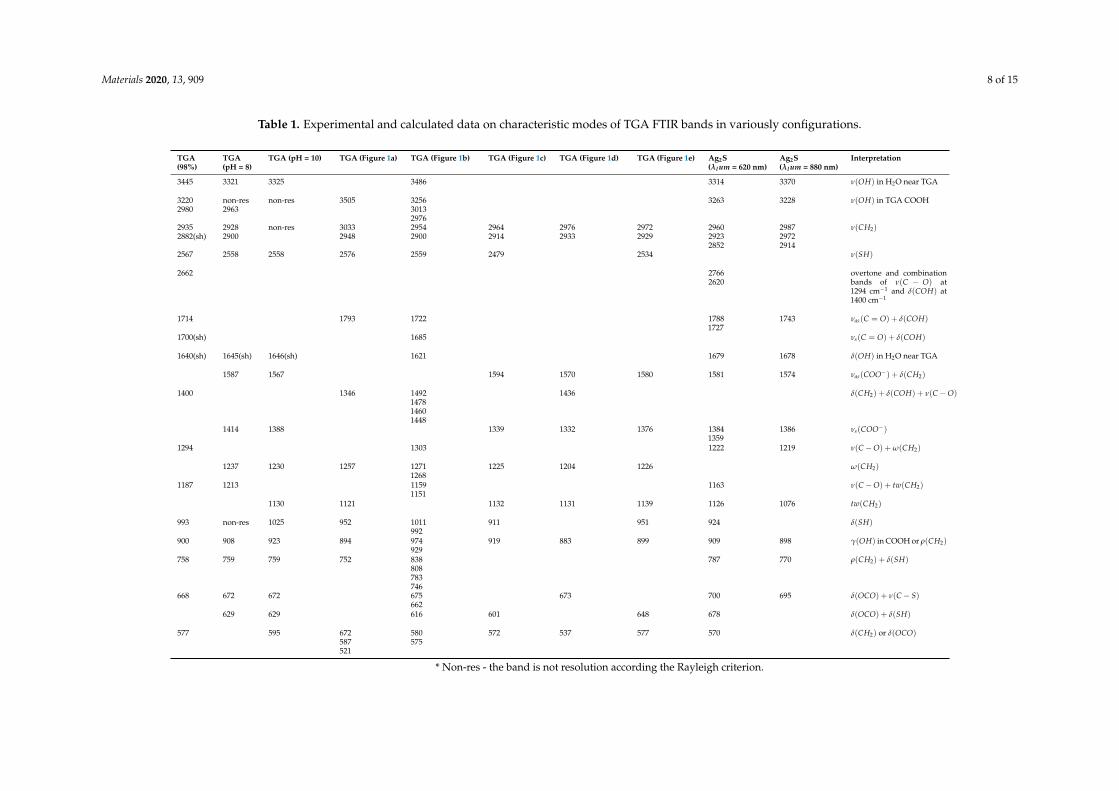
Table 1. Experimental and calculated data on characteristic modes of TGA FTIR bands in variously configurations.
TGA(98%)
TGA(pH = 8)
TGA (pH = 10) TGA (Figure 1a) TGA (Figure 1b) TGA (Figure 1c) TGA (Figure 1d) TGA (Figure 1e) Ag2S(λl um = 620 nm)
Ag2S(λl um = 880 nm)
Interpretation
3445 3321 3325 3486 3314 3370 ν(OH) in H2O near TGA
32202980
non-res2963
non-res 3505 325630132976
3263 3228 ν(OH) in TGA COOH
29352882(sh)
29282900
non-res 30332948
29542900
29642914
29762933
29722929
296029232852
298729722914
ν(CH2)
2567 2558 2558 2576 2559 2479 2534 ν(SH)
2662 27662620
overtone and combinationbands of ν(C − O) at1294 cm−1 and δ(COH) at1400 cm−1
1714 1793 1722 17881727
1743 νas(C = O) + δ(COH)
1700(sh) 1685 νs(C = O) + δ(COH)
1640(sh) 1645(sh) 1646(sh) 1621 1679 1678 δ(OH) in H2O near TGA
1587 1567 1594 1570 1580 1581 1574 νas(COO−) + δ(CH2)
1400 1346 1492147814601448
1436 δ(CH2) + δ(COH) + ν(C−O)
1414 1388 1339 1332 1376 13841359
1386 νs(COO−)
1294 1303 1222 1219 ν(C−O) + ω(CH2)
1237 1230 1257 12711268
1225 1204 1226 ω(CH2)
1187 1213 11591151
1163 ν(C−O) + tw(CH2)
1130 1121 1132 1131 1139 1126 1076 tw(CH2)
993 non-res 1025 952 1011992
911 951 924 δ(SH)
900 908 923 894 974929
919 883 899 909 898 γ(OH) in COOH or ρ(CH2)
758 759 759 752 838808783746
787 770 ρ(CH2) + δ(SH)
668 672 672 675662
673 700 695 δ(OCO) + ν(C− S)
629 629 616 601 648 678 δ(OCO) + δ(SH)
577 595 672587521
580575
572 537 577 570 δ(CH2) or δ(OCO)
* Non-res - the band is not resolution according the Rayleigh criterion.
Materials 2020, 13, 909 9 of 15
- An increase in pH value leads to a significant transformation of FTIR spectrum (Figure 1f).In the high-frequency region there is a shift of peaks, corresponded to the OH stretch in water tolow-frequency region from 3445 cm−1 to 3325 cm−1 with increase in pH value. It is weaker observed forthe OH stretch, including in COH TGA fragment (2980 cm−1 to 2963 cm−1). At the same time, the bandat 3220 cm−1, also related to the vibrations of OH groups, including in COH TGA fragment decreases inintensity and disappears at pH = 8. Also bands, corresponded to δ(CH2) + δ(COH) + ν(C−O), ν(C−O) + tw(CH2), ν(C−O) + ω(CH2) vibrations with peak at 1400 cm−1, 1187 cm−1, and 1294 cm−1,characteristic only for dimers and their specific symmetry disappear. According to calculation thesemodes are characteristic only for dimers and their corresponding symmetry. In addition, there is adecrease in the intensity of composed overtone band (2662 cm−1) with an increase in pH value at2600–2700 cm−1. At the same tine, new intense peaks that relate to the asymmetric and symmetricstretching vibrations of COO− in carboxylate anion (1587 and 1414 cm−1) appear. This behavior ofFTIR spectra is caused by TGA molecule deprotonation with increasing pH value;
- In the band of the SH stretch (2568–2558 cm−1) we observes gradual decrease in intensity withincrease in pH value to 5. Only a low-intensity band of SH stretch is observed at pH = 8 (Figure 1f).Also in the spectrum, a decrease in intensity of bands, corresponding to the SH bending vibrations(959–1025, 758, 629 cm−1) is observed up to their complete disappearance. This behavior is due to theincrease in the fraction of double-deprotonated TGA molecules.
3.2. FTIR Spectra TGA Molecules, Passivating Ag2S QDs
Using the obtained data on FTIR spectra of various ionic forms, FTIR spectra of TGA moleculesadsorbed on QDs surface were interpreted. For Ag2S/TGA QDs synthesized at pH = 10 underdifferent conditions and at different [AgNO3]:[TGA]:[Na2S] ratios of ion concentrations ranging from1:0.9:0 to 1:1.1:0.33, FTIR spectra differ from each other and from the spectrum of the reference sample(pure TGA at pH = 10). The values of the wave numbers corresponding to the peaks of the characteristicfrequencies in the FTIR spectra of TGA molecules are given in Figures 1f and 2d.
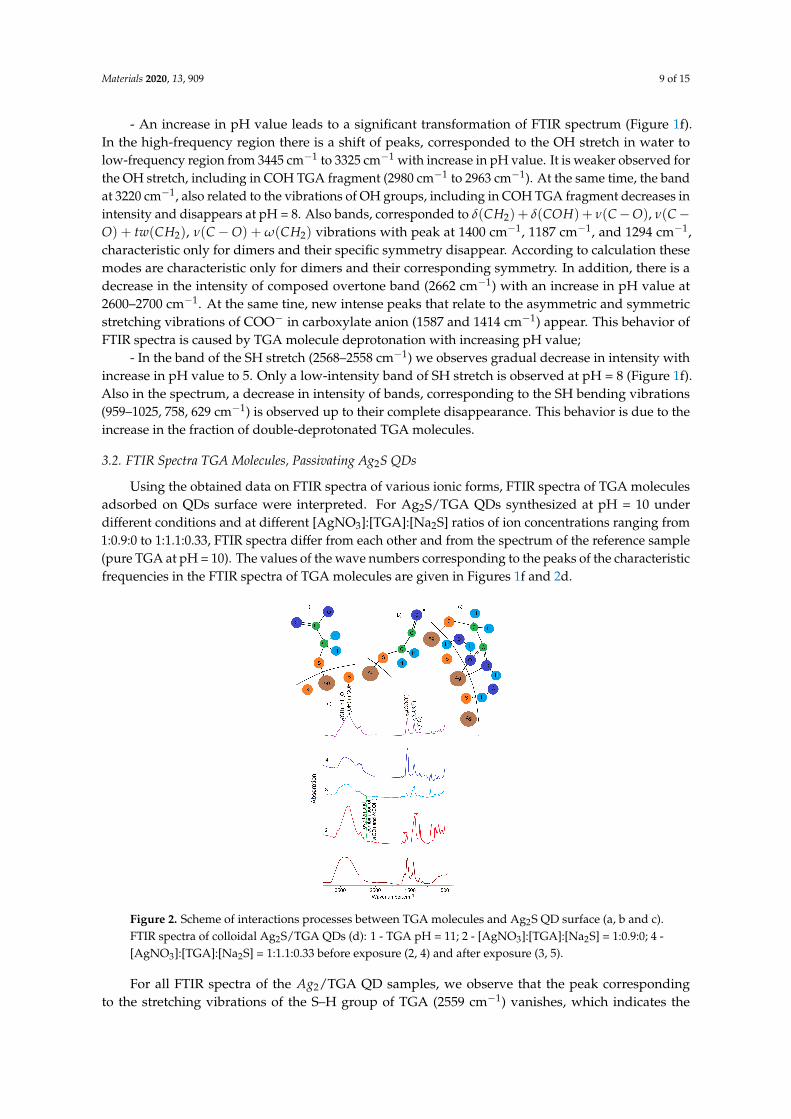
Figure 2. Scheme of interactions processes between TGA molecules and Ag2S QD surface (a, b and c).FTIR spectra of colloidal Ag2S/TGA QDs (d): 1 - TGA pH = 11; 2 - [AgNO3]:[TGA]:[Na2S] = 1:0.9:0; 4 -[AgNO3]:[TGA]:[Na2S] = 1:1.1:0.33 before exposure (2, 4) and after exposure (3, 5).
For all FTIR spectra of the Ag2/TGA QD samples, we observe that the peak correspondingto the stretching vibrations of the S–H group of TGA (2559 cm−1) vanishes, which indicates the
Materials 2020, 13, 909 10 of 15
appearance of interactions between the thiol terminal group of TGA and dangling bonds at the 2 QDinterfaces [13,15,45–49].
Passivation of Ag2S QDs by TGA molecules gives rise to peaks of asymmetric and symmetricstretching vibrations of the carboxylic group (COO−) (1584 cm−1 and 1387 cm−1, respectively), whichindicates adsorption of TGA molecules on the Ag2S interfaces in the ionic form with a free carboxylicterminal group COO− [13,15,45–49]. With increasing the concentration of [S2−] ions from Na2Sduring formation of Ag2S/TGA QDs (Figure 2d), a slight high-frequency shift of 7–10 cm−1 wasobserved for the peak of asymmetric stretching vibrations νas(COO−) = 1567 cm−1 together with alow-frequency shift by 3–5 cm−1 for symmetric stretching vibrations νs(COO−) = 1388 cm−1, probablycaused by the interaction of thiol with the Ag2S QD surface. The intensity ratio for the peaks ofasymmetric and symmetric stretching vibrations of the carboxylic group COO− in the two casesunder consideration (Figure 2d) corresponds to the situation when the carboxylic end groups are notattached to the surface of the Ag2S QD interface [13,15,45–49]. For the sample (Figure 2d) synthesizedat the precursor ratio [AgNO3]:[TGA]:[Na2S] starting from 1:0.9:0, a significant low-frequency shift ofthe peak of symmetric stretching vibrations νs(COO−) from 1388 cm−1 to 1359 cm−1 was observedtogether with a high-frequency shift of the peak of asymmetric stretching vibrations νas(COO−) from1567 cm−1 to 1579 cm−1. Such spectral shifts indicate that the COO− functional groups participate inthe intermolecular interactions with, e.g., Ag2S QD interfaces. In addition, a change in the intensityratio for asymmetric and symmetric stretching vibrations COO− was noted (Figure 2d). This feature isdue to the change in the symmetry of vibrations of TGA molecules upon their adsorption by carboxylicgroups on a solid substrate and is characteristic of the formation of carboxylate complexes withdangling bonds of Ag2S QDs [49].
Adsorption of TGA molecules on Ag2S QD interfaces is accompanied by the appearance of peaksat 1788 cm−1 and 1724 cm−1 (Figure 2d) with their intensity being lower than that for νas(s)(COO−).For the samples having the maximum concentration of [S2−] at crystallization, these peaks disappear,and only the peak at 1743 cm−1 remains. These peaks are associated with vibrations νas(C=O) ofthe COOH–group [46,49]. The occurrence of such vibrations is also a sign of the interaction of TGAmolecules with Ag2S QDs, in which deprotonation of the thiol group is accompanied by protonationof the carboxylic group and appearance of H-bond with the Ag2S QD interface. Proton transfer of thiskind is characteristic of TGA molecules, mainly in the acidic environment [49]. In our case, the decisiverole is likely to belong to the charge of the QD interface. In addition to the mentioned peaks, weakpeaks at 2766 cm−1, 2620 cm−1 were observed, which are due to the compound vibration arisingfrom the interaction of the stretching vibrations C-O (1294 cm−1) and in-plane δ(C-O-H) (1400 cm−1).The occurrence of these peaks is uncharacteristic of TGA at pH = 10 and seems to be caused by thespecifity of adsorption on Ag2S QDs. The complex nature of this peak was confirmed in [25,32].
For symmetric and asymmetric CH2 stretching vibrations in the region of 2980–2850 cm−1),as well as for all types of CH2 bending vibrations (1220–1230 cm−1, 1125–1133 cm−1,910–750 cm−1 [13,15,45–49]), variations within 5–15 cm−1 were detected. This feature is also a sign ofthe interaction between TGA and the Ag2S QD surface. However, CH-groups are not directly involvedin the adsorption.
In each of the analyzed FTIR spectra of Ag2S/TGA QD samples, changes were noted for thestretching and bending vibrations of OH-bonded groups. It was found that with an increase in [S2−]ions concentration when using Na2S, a high-frequency feature arises in the range of 3350–3500 cm−1
(Figure 2d). This feature is related to OH-groups of water molecules located near TGA molecules andAg2S/TGA QDs [15,25,32,45,46]. These OH-groups provide the H-bond bridges formation, in the caseof dimerization and especially Ag2S QD interfaces passivation with TGA molecules. These moleculesare less bonding with TGA molecules [15]. This hypothesis is also confirmed by a high-frequency shiftfor 30–45 cm−1 of the OH bending vibrations peak (1646 cm−1) under Ag2S QD interfaces passivationwith TGA molecules. Similar shift indicates the occurrence of H-bonds between Ag2S QD interface,COOH functional groups, and H2O molecules.
Materials 2020, 13, 909 11 of 15
Thus, the data obtained from FTIR spectra indicate two predominantly realized forms of TGAmolecules adsorption on the Ag2S QD interfaces (Figure 2a,c). In the case of Ag2S/TGA QDs synthesisin the absent of Na2S, predominantly adsorption by two functional groups (thiol and carboxylic) wasnoted (Figure 2c). When Na2S is used as an additional sulfur source during Ag2S QDs crystallization,TGA adsorption is predominantly carried out by the thiol group (Figure 2a). It is accompanied bymolecule deprotonation.
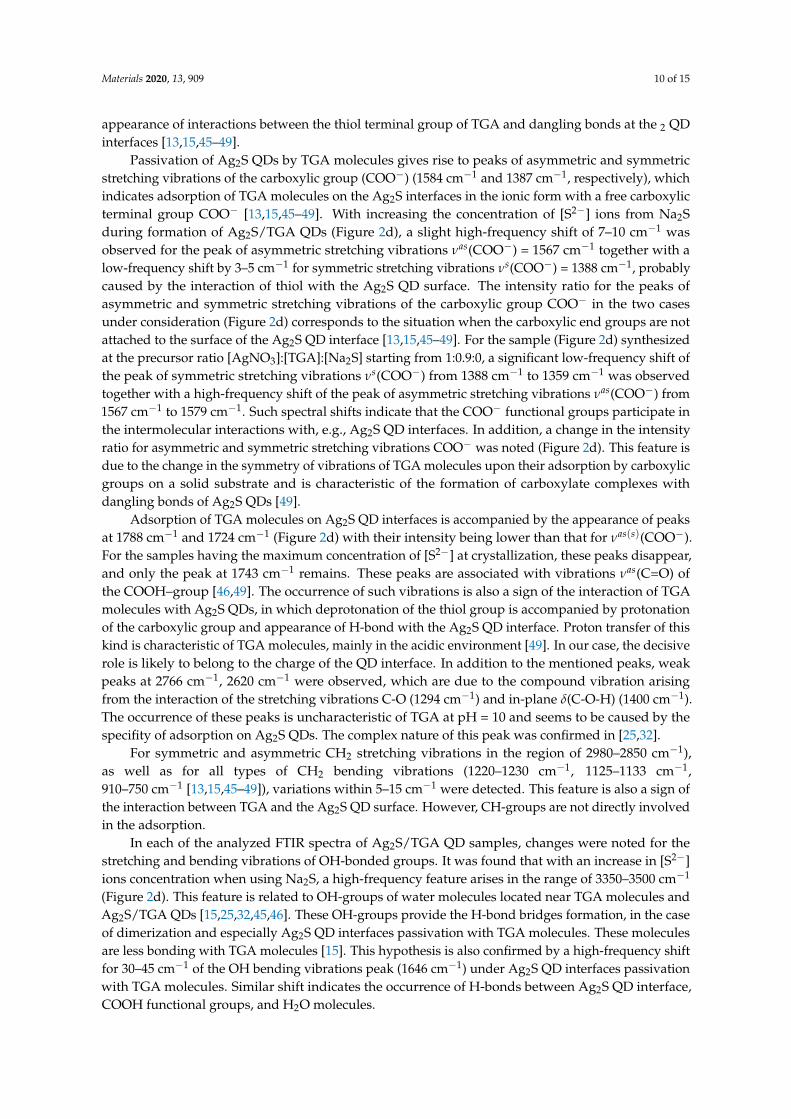
Depending on the interaction mechanism of TGA molecules with QD interface, the latter havedifferent luminescent properties. The luminescence spectrum of QDs Ag2S/TGA synthesized withoutNa2S, which are characterized by the adsorption of TGA molecules by two functional groups showsa narrow peak at 620 nm with a half width of 50 nm under excitation with a wavelength of 532 nm(Figure 3b). A slight Stokes shift (0.1 eV) and small half-width of the band indicate exciton luminescencefor this sample. In this case, there are no recombination luminescence bands for this sample.
Figure 3. UV-Vis absorption (1, 2), photoluminescence spectra (1’, 2’) and luminescencephotodegradation (1”, 2”) of colloidal Ag2S/TGA QDs, prepared in various synthesis condition.
For colloidal Ag2S/TGA QDs solutions obtained using Na2S, when the adsorption of TGAmolecules is carried out mainly by the thiol group, wider luminescence band with peak at 880 nm wasobserved (Figure 3a). It are distinguished by a significant Stokes shift of luminescence peak relative tothe position of ground state exciton absorption. This feature indicates the recombination nature of theobserved luminescence.
An important found property of Ag2S/TGA QDs luminescence is a decrease in its intensity withincreasing in exposure time by exiting radiation. Long exposure of the samples leads to a decreasein the luminescence intensity over the entire spectrum (Figure 3c). The characteristic decay timesof Ag2S QDs IR luminescence intensity under the exposure with a wavelength, corresponded to theexciton absorption region at an incident power of about 100 mW, are 200–300 s. Ag2S/TGA QDs withexciton luminescence with peak near 620 nm turned out to be the least susceptible to luminescencephotodegradation. For other QDs with recombination IR luminescence in the range of 880–1000 nm,the decrease in luminescence intensity exceeded 50% under the same exposure conditions.
The photostimulated decrease in the luminescence intensity of Ag2S QDs turned out to bereversible mainly for samples with IR luminescence in the range of 880–1000 nm (Figure 3c, dottedline). The luminescence intensity is restored almost to its initial value in the dark within 22–24 h.The activation energy of the luminescence intensity restoring process was about 0.9–1.0 eV. At the sametime the luminescence quenching was irreversible. Its intensity did not recover when the samples were
Materials 2020, 13, 909 12 of 15
kept in the dark at room temperature. In this case, there are two processes leading to degradation ofAg2S/TGA QD luminescence intensity. The first is photolysis of Ag2Snanocrystals, described in detailin [18].
The second is process associated with a structural change in the QD interface under the actionof exciting radiation since QDs luminescence properties are very sensitive to the interface structure,which is determined by synthesis methods. The restructuring/destruction reactions of surface ligandsusually modify the physicochemical states of QDs surface atoms and dramatically change various QDsproperties, including the photostability of QD surface atoms, resistance to the oxidative dissolutionprocess, and tendency to coagulation/deposition. The effect of exciting radiation on thiol-coated QDscan lead to its photodestruction. In particular, the photodissociation of the C–OH-bond for TGA withthe formation of α-thiol-substituted acyl radical (S-CH2-CO·) is known [50]. A similar photochemicalreaction is supported by our FTIR spectra of Ag2S/TGA QD samples subjected to photo-exposure(Figure 2d). FTIR spectrum of QDs with exciton luminescence is significant changed. A changein the high-frequency form of the OH-banding mode is observed in the region of 3600–3500 cm−1.After exposure, a peak arises from the edge from this band near 3600 cm−1 due to vibrations of freeor weakly bound OH-groups. A change in the intensities ratio of asymmetric (1574–1579 cm−1) andsymmetric (1383–1388 cm−1) stretching vibrations of COO−-groups was observed. Probably it iscaused by a change in the nature of the interaction with Ag2S QDs surface. A significant decrease inintensity is also observed in the band of stretching CO vibrations at 1222 cm−1, which indicates thedestruction of this bond. Exposure to exciting radiation in this case leads to photodestruction of thethiol coating.
4. Conclusions
In this work the new data were obtained. It provides the situation understanding, related to theambiguity of interpretation of TGA FTIR spectra on the whole. These data show that TGA moleculeFTIR spectrum has a complex structure, strongly dependent on the concentration and pH value ofsolution. Based on experimental and calculation data, it is shown that the main manifestations of TGAmolecules dimerization in FTIR spectra due to the formation of hydrogen bonds between them arebands behavior, belonging to the OH stretch as in COOH fragment, participating in the TGA dimerformation (3320 cm−1 and 2980 cm−1) and water molecules, located near TGA molecules and providingthe formation of H-bond bridges, but which are less bounded with TGA molecules (3440 cm−1). In theregion of these groups bending vibrations, the dimerization is confirmed by appearance of peak at1714 cm−1 and feature at 1700 cm−1, characterizing the cyclic dimer and vibrations with peak at900 cm−1. The band with peak at 1400 cm−1, associated with COH bending vibration and overlappingwith the CH2 bending vibration, as well as complex vibration, including the CH2 wagging and twistingvibrations and C-O stretch at 1187 cm−1 and 1294 cm−1 are characteristic only for dimers and theirspecific symmetry. When pH value increases, the intensity of these bands decreases significantlyup to their full leveling, which indicates dTGA and ddTGA. In addition, bands, corresponding tothe stretching vibrations of carboxylate anion (1587 and 1414, 1412 cm−1) appear. The SH stretch at2558 cm−1 disappears. The intensities of the bending vibrations decrease at 1025, 759 cm−1. And bandat 629 cm−1 is completely leveled with the formation of carboxylate dianion. A mutual analysis of theexperimental data and theoretical calculations results showed that the band in the region of 1640 cm−1,which is manifested as a high-frequency feature of νasCOO− carboxylate anion peak (1565–1587 cm−1)under increasing in pH value belongs to δ(OH) in H2O.
Based on the obtained data for TGA various forms an unambiguous interpretation of TGA FTIRspectra under the conditions of passivation of silver sulfide quantum dots with fundamentally differentluminescent properties was performed. The main mechanisms of molecular adsorption on QDs surfacewere determined. For samples synthesized without the use of Na2S, with exciton luminescence inthe region of 620 nm and half-width less than 50 nm, adsorption of TGA molecules by two functionalgroups is characteristic. For colloidal QDs Ag2S/TGA solutions obtained using Na2S as a sulfur source
Materials 2020, 13, 909 13 of 15
with luminescence in the region of 880 nm of recombination nature, the adsorption of TGA moleculesis carried out mainly by the thiol group. It was found that IR luminescence photodegradation is alsoaccompanied by changes in the thioglycolic acid molecules, which capped Ag2S QDs. In the case ofAg2S QDs with exciton luminescence, the degradation process is non-reversible. It is accompanied byTGA photodegradation with the formation of α-thiol-substituted acyl radical (S-CH2-CO•) TGA.
Author Contributions: Investigation, I.G., M.S., O.E., V.K. and E.T.; Methodology, B.D.; Writing – original draft,T.K.; Writing – review & editing, O.O. All authors have read and agreed to the published version of the manuscript.
Funding: This study was supported by the Russian Science Foundation under project no. 19-12-00266.
Acknowledgments: Results of TEM investigations with the Libra 120 TEM were obtained on the equipment ofthe Center of collective usage of scientific equipment of Voronezh State University. High-resolution TEM imageswere obtained on the equipment of the Center of collective usage of Moscow Institute of Physics and Technology.
Conflicts of Interest: The authors declare no conflict of interest.
Abbreviations
The following abbreviations are used in this manuscript:
MDPI Multidisciplinary Digital Publishing InstituteDOAJ Directory of open access journalsTGA Thioglycolic acidQDs Quantum dotsFTIR spectra Fourier-transform infrared spectra
References
1. Bera, D.; Qian, L.; Tseng, T.K.; Holloway, P.H. Quantum Dots and Their Multimodal Applications: A Review.Materials 2010, 3, 2260–2345. [CrossRef]
2. Hong, G.; Antaris, A.L.; Dai, H. Near-infrared fluorophores for biomedical imaging. Nat. Biomed. Eng. 2017,1. [CrossRef]
3. Ali, I.M.; Ibrahim, I.M.; Ahmed, E.F.; Abbas, Q.A. Structural and Characteristics of Manganese DopedZinc Sulfide Nanoparticles and Its Antibacterial Effect against Gram-Positive and Gram-Negative Bacteria.Open J. Biophys. 2016, 6, 1–9. [CrossRef]
4. Song, R.; Liu, Y.; He, L. Synthesis and characterization of mercaptoacetic acid-modified ZnO nanoparticles.Solid State Sci. 2008, 10, 1563–1567. [CrossRef]
5. Ha, S.Y.; Choo, M.S.; woo Kim, G.; Lee, E.S.; Kim, I.G.; Yoo, D.S.; Cho, S.J. Study on the Physical Properties ofCdS Quantum Dots Synthesized by Ligand Exchange in a Cd2+-mercaptopropionic Acid Aqueous Solutionat Room Temperature. J. Korean Phys. Soc. 2011, 58, 1274–1278. [CrossRef]
6. Cao, Q.; Che, R. Synthesis of near-infrared fluorescent, elongated ring-like Ag2Se colloidal nanoassemblies.RSC Adv. 2014, 4, 16641. [CrossRef]
7. Kaur, G.; Tripathi, S. Size tuning of MAA capped CdSe and CdSe/CdS quantum dots and their stability indifferent pH environments. Mater. Chem. Phys. 2014, 143, 514–523. [CrossRef]
8. Jiang, P.; Zhu, C.N.; Zhang, Z.L.; Tian, Z.Q.; Pang, D.W. Water-soluble Ag2S quantum dots for near-infraredfluorescence imaging in vivo. Biomaterials 2012, 33, 5130–5135. [CrossRef] [PubMed]
9. Kumar, P.; Kukkar, D.; Deep, A.; Sharma, S.; Bharadwaj, L.M. Synthesis Of Mercaptopropionic Acid StabilizedCdS Quantum Dots for Bioimaging In Breast Cancer. Adv. Mater. Lett. 2012, 3, 471–475. 2012.icnano.296.[CrossRef]
10. Ibrahim, I.M.; Ali, I.M.; Dheeb, B.I.; Abas, Q.A.; Ramizy, A.; Eisa, M.; Aljameel, A. Antifungal activity ofwide band gap Thioglycolic acid capped ZnS:Mn semiconductor nanoparticles against some pathogenicfungi. Mater. Sci. Eng. C 2017, 73, 665–669. [CrossRef]
11. Wu, S.M.; Sun, X.J.; Wang, L.L.; Fei, M.Y.; Yan, Z.Y. Singlet oxygen-generating from fluorescence probesbased on denatured bovine serum albumin-conjugated CdTe quantum dots and photosensitizer Chlorin e6.J. Nanoparticle Res. 2014, 16. [CrossRef]
Materials 2020, 13, 909 14 of 15
12. Koneswaran, M.; Narayanaswamy, R. RETRACTED: Mercaptoacetic acid capped CdS quantum dots asfluorescence single shot probe for mercury(II). Sens. Actuators B Chem. 2009, 139, 91–96. j.snb.2008.09.011.[CrossRef]
13. Hocaoglu, I.; Çizmeciyan, M.N.; Erdem, R.; Ozen, C.; Kurt, A.; Sennaroglu, A.; Acar, H.Y. Development ofhighly luminescent and cytocompatible near-IR-emitting aqueous Ag2S quantum dots. J. Mater. Chem. 2012,22, 14674. [CrossRef]
14. Atif, M.; Farooq, A.; Abd El-sadek, M.S.; El-Sheshtawy, H.; Yahia, I. Study of the interaction betweenmercaptoacetic acid (MAA) capped CdS quantum dots with denatured bovine serum albumin (dBSA).Chalcogenide Lett. 2015, 12, 91–97.
15. Wageh, S.; Higazy, A.A.; Al-Ghamdi, A.A.; Hassouna, A.S. Effect of Environment on the Preparation of CdSeQuantum Dots Capped with Mercaptoacetic Acid. J. Nanosci. Nanotechnol. 2014, 14, 6442–6451. [CrossRef]
16. Zhang, H.; Zhou, Z.; Yang, B.; Gao, M. The Influence of Carboxyl Groups on the Photoluminescence ofMercaptocarboxylic Acid-Stabilized CdTe Nanoparticles. J. Phys. Chem. B 2003, 107, 8–13. [CrossRef]
17. Karimipour, M.; Keshavarz, A.; Molaei, M. Stabilizing NIR emission of Ag 2 S quantum dots in water usingSnS 2 Shell. J. Lumin. 2018, 195, 339–343. [CrossRef]
18. Ovchinnikov, O.; Grevtseva, I.; Smirnov, M.; Kondratenko, T. Reverse photodegradation of infraredluminescence of colloidal Ag2S quantum dots. J. Lumin. 2019, 207, 626–632. [CrossRef]
19. Kondratenko, T.; Zvyagin, A.; Smirnov, M.; Grevtseva, I.; Perepelitsa, A.; Ovchinnikov, O. Luminescenceand nonlinear optical properties of colloidal Ag2S quantum dots. J. Lumin. 2019, 208, 193–200. [CrossRef]
20. Jadhav, S.A. Self-assembled monolayers (SAMs) of carboxylic acids: An overview. Cent. Eur. J. Chem. 2011,9, 369–378. [CrossRef]
21. Chen, X.; Cheng, X.; Gooding, J.J. Multifunctional modified silver nanoparticles as ion and pH sensors inaqueous solution. Analyst 2012, 137, 2338. [CrossRef]
22. Yang, H.C.; Dermody, D.L.; Xu, C.; Ricco, A.J.; Crooks, R.M. Molecular Interactions between Organized,Surface-Confined Monolayers and Vapor-Phase Probe Molecules. 8. Reactions between Acid-TerminatedSelf-Assembled Monolayers and Vapor-Phase Bases. Langmuir 1996, 12, 726–735. [CrossRef]
23. Sainsbury, T.; Ikuno, T.; Okawa, D.; Pacilé, D.; Fréchet, J.M.J.; Zettl, A. Self-Assembly of Gold Nanoparticlesat the Surface of Amine- and Thiol-Functionalized Boron Nitride Nanotubes. J. Phys. Chem. C 2007, 111,12992–12999. [CrossRef]
24. Di, L.; Jing-Hong, L. 3-Mercaptopropionic Acid Capped Gold Nanoclusters: Quantized Capacitance inAqueous Media. Chin. J. Chem. 2010, 21, 392–395. [CrossRef]
25. Ihs, A.; Liedberg, B. Chemisorption of -cysteine and 3-mercaptopropionic acid on gold and copper surfaces:An infrared reflection-absorption study. J. Colloid Interface Sci. 1991, 144, 282–292. 9797(91)90259-b. [CrossRef]
26. Castro, J.L.; López-Ramírez, M.R.; Arenas, J.F.; Otero, J.C. Surface-enhanced Raman scattering of3-mercaptopropionic acid adsorbed on a colloidal silver surface. J. Raman Spectrosc. 2004, 35, 997–1000.[CrossRef]
27. Shen, Y.; Liu, S.; Wang, J.; Li, D.; Wang, X.; He, Y. A sensitive assay of chelerythrine using a fluorescencequenching approach with glutathione capped CdTe/CdS quantum dots as a probe. Anal. Methods 2013,5, 5309. [CrossRef]
28. Martynenko, I.V.; Orlova, A.O.; Maslov, V.G.; Baranov, A.V.; Fedorov, A.V.; Artemyev, M. Energy transfer incomplexes of water-soluble quantum dots and chlorin e6 molecules in different environments. Beilstein J.Nanotechnol. 2013, 4, 895–902. [CrossRef] [PubMed]
29. Ng, S.M.; Koneswaran, M.; Narayanaswamy, R. A review on fluorescent inorganic nanoparticles for opticalsensing applications. RSC Adv. 2016, 6, 21624–21661. [CrossRef]
30. C.-K. Chung, M.L. Self-Assembled Monolayers of Mercaptoacetic Acid on Ag Powder: Characterization byFT-IR Diffuse Reflection Spectroscopy. Bull. Korean Chem. Soc. 2004, 25. [CrossRef]
31. Bertie, J.E.; Michaelian, K.H. The Raman spectra of gaseous formic acid -h2and -d2. J. Chem. Phys. 1982,76, 886–894. [CrossRef]
32. Chen, S.; Kimura, K. Synthesis and Characterization of Carboxylate-Modified Gold Nanoparticle PowdersDispersible in Water. Langmuir 1999, 15, 1075–1082. [CrossRef]
33. Max, J.J.; Chapados, C. Infrared Spectroscopy of Aqueous Carboxylic Acids: Comparison between DifferentAcids and Their Salts. J. Phys. Chem. A 2004, 108, 3324–3337. [CrossRef]
Materials 2020, 13, 909 15 of 15
34. Florio, G.M.; Zwier, T.S.; Myshakin, E.M.; Jordan, K.D.; Sibert, E.L. Theoretical modeling of the OH stretchinfrared spectrum of carboxylic acid dimers based on first-principles anharmonic couplings. J. Chem. Phys.2003, 118, 1735–1746. [CrossRef]
35. Ahmed, A.B.; Bhaduri, I. Chemical Modification, Characterization and Evaluation of Mucoadhesive Potentialityof Assam Bora Rice Starch. Int. J. Pharm. Pharm. Sci. 2017, 9, 132. [CrossRef]
36. Smith, E.L.; Alves, C.A.; Anderegg, J.W.; Porter, M.D.; Siperko, L.M. Deposition of metal overlayersat end-group-functionalized thiolate monolayers adsorbed at gold. 1. Surface and interfacial chemicalcharacterization of deposited copper overlayers at carboxylic acid-terminated structures. Langmuir 1992,8, 2707–2714. [CrossRef]
37. Arnold, R.; Azzam, W.; Terfort, A.; Wöll, C. Preparation, Modification, and Crystallinity of Aliphatic andAromatic Carboxylic Acid Terminated Self-Assembled Monolayers. Langmuir 2002, 18, 3980–3992. [CrossRef]
38. Sun, J.; Stanbury, D.M. Kinetics and mechanism of oxidation of thioglycolic acid by hexachloroiridate(iv).J. Chem. Soc. Dalton Trans. 2002, 5, 785. [CrossRef]
39. Burneau, A.; Genin, F.; Quils, F. Ab initio study of the vibrational properties of acetic acid monomers anddimers. Phys. Chem. Chem. Phys. 2000, 2, 5020–5029. [CrossRef]
40. Miani, A.; Cané, E.; Palmieri, P.; Trombetti, A.; Handy, N.C. Experimental and theoretical anharmonicity forbenzene using density functional theory. J. Chem. Phys. 2000, 112, 248–259. [CrossRef]
41. Schneider, W.; Thiel, W. Anharmonic force fields from analytic second derivatives: Method and applicationto methyl bromide. Chem. Phys. Lett. 1989, 157, 367–373. [CrossRef]
42. Thiel, W.; Yamaguchi, Y.; Schaefer, H.F. The anharmonic force fields of silyl fluoride and silyl chloride. J. Mol.Spectrosc. 1988, 132, 193–206. [CrossRef]
43. Flügge, S. Practical Quantum Mechanics; Springer: Berlin, Germany, 1971.44. Mirone, P.; Chiorboli, P. Infrared and Raman spectra and vibrational assignment of maleic anhydride.
Spectrochim. Acta 1962, 18, 1425–1432. [CrossRef]45. Banizi, Z.T.; Seifi, M. Optical properties of hydrothermally synthesized TGA-capped CdS nanoparticles:
Controlling crystalline size and phase. Mater. Res. Express 2017, 4, 105007. [CrossRef]46. Silva, F.O.; Carvalho, M.S.; Mendonça, R.; Macedo, W.A.; Balzuweit, K.; Reiss, P.; Schiavon, M.A. Effect of
surface ligands on the optical properties of aqueous soluble CdTe quantum dots. Nanoscale Res. Lett. 2012,7, 536. [CrossRef] [PubMed]
47. Zhang, Y.; Xia, J.; Li, C.; Zhou, G.; Yang, W.; Wang, D.; Zheng, H.; Du, Y.; Li, X.; Li, Q. Near-infrared-emittingcolloidal Ag2S quantum dots excited by an 808 nm diode laser. J. Mater. Sci. 2017, 52, 9424–9429. [CrossRef]
48. Gui, R.; Sun, J.; Liu, D.; Wang, Y.; Jin, H. A facile cation exchange-based aqueous synthesis of highly stableand biocompatible Ag2S quantum dots emitting in the second near-infrared biological window. DaltonTrans. 2014, 43, 16690–16697. [CrossRef] [PubMed]
49. Miao, Y.; Yang, P.; Zhao, J.; Du, Y.; He, H.; Liu, Y. Photodegradation of Mercaptopropionic Acid- andThioglycollic Acid-Capped CdTe Quantum Dots in Buffer Solutions. J. Nanosci. Nanotechnol. 2015, 15,4462–4469. [CrossRef]
50. Attar, A.R.; Blumling, D.E.; Knappenberger, K.L. Photodissociation of thioglycolic acid studied byfemtosecond time-resolved transient absorption spectroscopy. J. Chem. Phys. 2011, 134, 024514. [CrossRef]
c© 2020 by the authors. Licensee MDPI, Basel, Switzerland. This article is an open accessarticle distributed under the terms and conditions of the Creative Commons Attribution(CC BY) license (http://creativecommons.org/licenses/by/4.0/).
Related Documents


