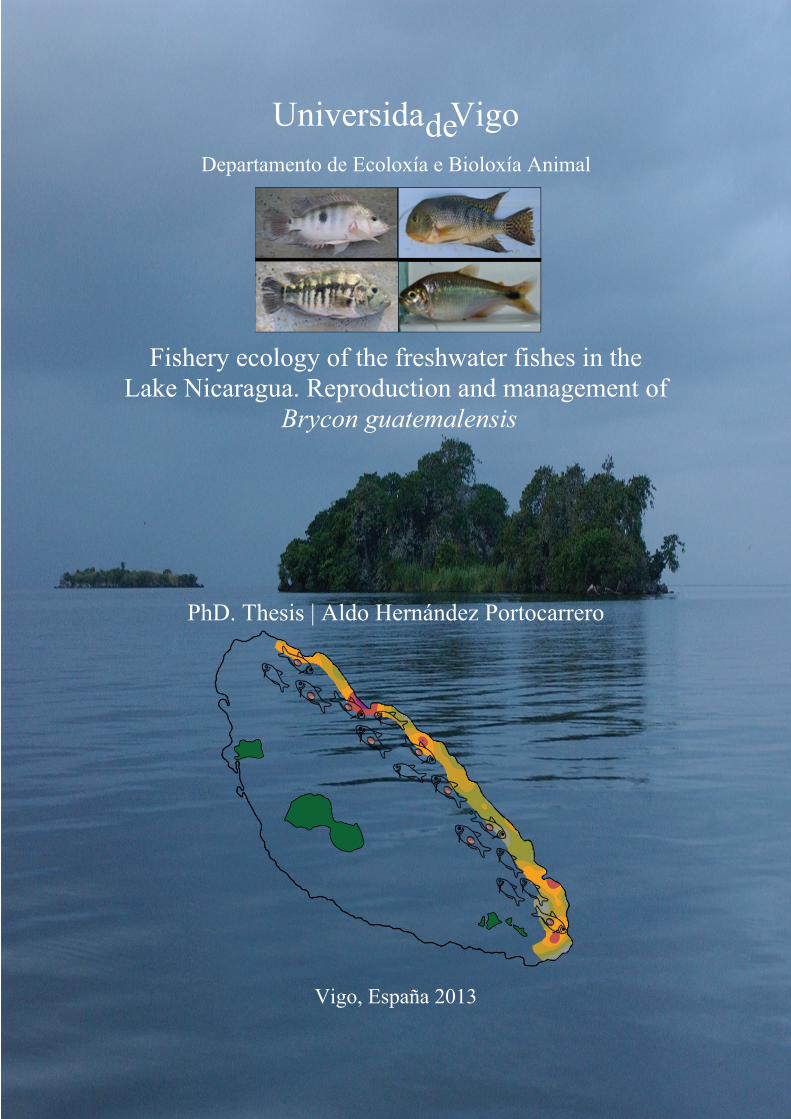
Universida Vigo Departamento de Ecoloxía e Bioloxía Animal Fishery ecology of the freshwater fishes in the Lake Nicaragua. Reproduction and management of Brycon guatemalensis PhD. Thesis | Aldo Hernández Portocarrero Vigo, España 2013 de

Welcome message from author
This document is posted to help you gain knowledge. Please leave a comment to let me know what you think about it! Share it to your friends and learn new things together.
Transcript
Universida Vigo
Departamento de Ecoloxía e Bioloxía Animal
Fishery ecology of the freshwater fishes in the Lake Nicaragua. Reproduction and management of
Brycon guatemalensis
PhD. Thesis | Aldo Hernández Portocarrero
Vigo, España 2013
de

Universida Vigo
Departamento de Ecoloxía e Bioloxía Animal
Memoria de Tesis Doctoral para optar al grado de Doctor por la Universidad de Vigo
Fishery ecology of the freshwater fishes in the Lake Nicaragua. Reproduction and management of
Brycon guatemalensis
Presentada por:
Aldo Hernández Portocarrero
Vigo, España 2013
de

Dr. Juan Francisco Saborido Rey, Científico titular del Instituto de Investigaciones
Marinas (Consejo Superior de Investigaciones Científicas).
Director de tesis,
Dr. Bernardino González Castro, Profesor Titular en la Universidad de Vigo.
Tutor,
Autorizan a la presentación de la memoria adjunta, titulada “Fishery ecology of the
freshwater fishes in the Lake Nicaragua. Reproduction and management of
Brycon guatemalensis”, realizada por Aldo Hernández Portocarrero para optar al
grado de Doctor por la Universidad de Vigo.
Y para que así conste, se expide el presente certificado en Vigo, a 22 Abril de 2013.
Fdo. Juan Francisco Saborido Rey
Fdo. Bernardino González Castro

AGRADECIMIENTOS
La necesidad de conocer el estado de los recursos pesqueros del Lago de Nicaragua y sobre
esta base impulsar el desarrollo del sector pesquero y las comunidades pesqueras asentadas a
su alrededor, permitió que se concretara la ejecución de un estudio sobre los recursos
pesqueros en la zona oriental del lago, como parte del proyecto financiado por la Agencia
Española de Cooperación Internacional (AECI): “Apoyo a la actividad pesquera de las
comunidades pesqueras del Lago Nicaragua (Cuenca del Río Mayales, Departamento de
Chontales y Río San Juan)” AECI/ADPESCA. A todos los que hicieron posible la ejecución
de este proyecto dirijo mi agradecimiento por impulsar el ordenamiento del sector pequero y
el desarrollo de las comunidades pesqueras del lago; por apoyar las investigaciones de los
recursos pesqueros en el lago, que además dieron origen a esta tesis doctoral; y por promover
un mejor manejo de sus recursos basado en los resultados preliminares de las investigaciones
realizadas, los que fueron plasmados en el documento “Abundancia relativa de los peces en la
costa oriental del Lago de Nicaragua”.
Mi agradecimiento a todas aquellas personas que participaron de manera indirecta en el
estudio desarrollado en el Lago de Nicaragua de Febrero 2005 a Enero 2006, quienes con su
valioso aporte dieron un gran impulso para que cada una de las etapas del estudio se fueran
cerrando satisfactoriamente. El sentimiento de haber colaborado en su ejecución y/o sido parte
del estudio, espero los motive a leer los capítulos que componen esta tesis doctoral, pues
seguramente les resultarán de gran interés.
Dentro del personal del proyecto mencionado, agradezco a Isolina Sánchez Andrade, Co-
Directora Española, quien se comprometió de lleno con la ejecución de este estudio,
impulsando la participación de un equipo de científicos que permitiera lograr los objetivos del
mismo a un nivel muy satisfactorio, y de manera especial le agradezco haber magnificado el
alcance del estudio apoyando de manera decidida mi solicitud a una beca doctoral tomando
como referencia el estudio realizado y la información disponible.
A Idalia González Romero, Co-Directora nacional del proyecto, por parte del Instituto
Nicaragüense de la Pesca y Acuicultura (INPESCA), quien de manera diligente y con una
gran disponibilidad logró la consecución de las campañas de investigación realizadas mes a
mes durante el ciclo anual programado.
A Yuri Espinoza Director de la Dirección de Fomento y Promoción quién confió en mi
capacidad para coordinar las investigaciones y me apoyó en momentos de mucha tensión.
Agradezco a todos y cada unos de los miembros que conformaron el equipo de trabajo que
participó de manera directa en las campañas de investigación, con quienes además de
intercambiar conocimiento técnico y científico, compartí la sensación de ser afortunados al
navegar por zonas recónditas del Lago de Nicaragua con una belleza única.
Participantes en el estudio:
Como investigadores del Centro de Investigaciones Pesqueras y Acuícolas (CIPA): Luis
Velásquez Chavaría, Ronaldo Gutiérrez García y Renaldy Barnuty Navarro;
Como ayudante de investigación y estudiante de la carrera de Ingeniería en Acuicultura de la
Universidad Centroamericana UCA: Juan Bosco Mendoza Vallejos.
Como ayudante de investigación y técnico en redes: Luis Reyes González
Como pescadores experimentados del lago, los señores Francisco R. Huerta Avalos
(Motorista) y Francisco R. Huerta Flores (Auxiliar de investigación).
Expreso mi gratitud al Dr. Fran Saborido-Rey, quién además de asesorar como científico del
Instituto de Investigaciones Marinas del Consejo Superior de Investigaciones científicas (IIM-
CSIC) el estudio del lago y a través de horas de discusión de los resultados preliminares del
estudio mismo, despertó mi interés por iniciar esta tesis doctoral. Agradezco su gran
disponibilidad al apoyarme en la obtención de una beca de investigación pre-doctoral y por
haber logrado posteriormente mi integración en un proyecto que me permitió conseguir el
tiempo necesario para concluir mis estudios doctorales.
Esta tesis doctoral fue posible desarrollarla gracias al apoyo de la Agencia Española de
Cooperación Internacional para el Desarrollo a través de una beca de investigaciones pre-
doctorales MAEC-AECID de dos años y gracias al apoyo del Grupo de Ecología Pesquera del
IIM-CSIC durante un periodo similar.
Dentro del grupo de pesquerías del IIM quiero agradecer al personal técnico del laboratorio
Loli, Mariña, Sonia, Iván y Rosa, quienes me apoyaron enormemente en el procesamiento de
la mayoría de mis muestras, permitiendo así que yo avanzara en el análisis de las mismas y en
el análisis de los datos. Las discusiones y los aportes recibidos por los miembros del grupo de
pesquerías (técnicos, doctorados y doctorandos) fueron enriquecedores e invaluables. Fue
satisfactorio y gratificante trabajar con científicos y técnicos tan preparados y con gran
experiencia, mi más sincero agradecimiento a todos y cada uno.
Dedico esta tesis: “A la memoria de mis padres”.

INTITUCIONES/ORGANISMOS QUE APOYARON EL ESTUDIO
ADPESCA/INPESCA Instituto Nicaragüense de la Pesca y Acuicultura
AECID Agencia Española de Cooperación Internacional
IIM-CSIC Instituto de Investigaciones Marinas
Consejo Superior de Investigaciones Científicas

13
CONTENTS
AGRADECIMIENTOS ........................................................................................................... 7
Summary ................................................................................................................................. 23
CHAPTER 1: General Introduction .................................................................................... 27
1.1. Lakes as source of natural resources ............................................................................ 27
1.2. The Lake Nicaragua ecosystem and environmental condition ..................................... 29
1.3. Fish ecology in the Lake Nicaragua ............................................................................. 33
1.3.1. Origin and ecology of fish species ........................................................................ 33
1.3.2. Species diversity ................................................................................................... 36
1.4. The fishery in the lake .................................................................................................. 38
1.4.1. Catches and trends ................................................................................................ 38
1.4.2. Fish stock biomass ................................................................................................ 41
1.4.3. Fishery management ............................................................................................. 42
1.5. Thesis objectives .......................................................................................................... 44
CHAPTER 2: Material and Methods ................................................................................... 45
2.1. The study site ................................................................................................................ 45
2.2. Sampling surveys .......................................................................................................... 46
2.2.1. Fishing gear characteristic .................................................................................... 47
2.2.2. Fishing operation .................................................................................................. 48
2.2.3. Biologic and environmental data recorded ........................................................... 49
2.2.4. Catches-per-Unit-Effort (CPUE) .......................................................................... 51
2.2.5. Length distribution ................................................................................................ 53
2.3. Biological analysis ........................................................................................................ 53
2.3.1. Ovarian histology .................................................................................................. 53
2.3.2. Oocyte development ............................................................................................. 54
2.3.3. Reproductive cycle ............................................................................................... 56
2.3.4. Spawning fraction (Sf) .......................................................................................... 56
2.3.5. Somatic indices ..................................................................................................... 58
2.3.6. Maturity ................................................................................................................ 58
2.3.7. Fecundity .............................................................................................................. 62
2.4. Gillnet selectivity .......................................................................................................... 64
2.4.1. Female abundance by size and reproductive phase .............................................. 66
14
2.4.2. The effect of gillnet on ontogenic maturation and eggs production ..................... 66
CHAPTER 3: Population Ecology. Abundance and Distribution Patterns. .................... 69
3.1. Introduction .................................................................................................................. 69
3.2. Results .......................................................................................................................... 72
3.2.1. Environmental data ............................................................................................... 72
3.2.2. Survey indexes: Catches and effort ...................................................................... 75
3.2.3. Abundance index variability of target species ...................................................... 78
3.2.3.1. CPUE and water turbidity ............................................................................. 78
3.2.3.2. Spatio-temporal variability ........................................................................... 80
3.2.4. Length-frequency distribution ............................................................................ 101
3.3. Discussion ................................................................................................................... 119
CHAPTER 4: Reproductive Strategy of Brycon guatemalensis. ...................................... 129
4.1. Introduction ................................................................................................................ 129
4.2. Results ........................................................................................................................ 131
4.2.1. Oogenesis ............................................................................................................ 131
Perinucleolar stage (PG) .......................................................................................... 131
Cortical alveoli stage ................................................................................................ 132
Vitellogenesis ........................................................................................................... 132
Final vitellogenesis .................................................................................................. 133
Follicle maturation ................................................................................................... 133
The follicle and oocyte envelopes ............................................................................ 135
Surrounding mucus .................................................................................................. 136
Postovulatory follicle ............................................................................................... 137
Atretic oocytes ......................................................................................................... 138
4.2.2. Reproductive cycle ............................................................................................. 138
Temporal dynamic ................................................................................................... 139
Gonadosomatic index ............................................................................................... 141
Condition factor ....................................................................................................... 142
GSI and K relationship ............................................................................................. 145
Spawning fraction .................................................................................................... 147
4.2.3. Maturity ogive ..................................................................................................... 149
Macroscopic observations ........................................................................................ 150
Microscopic observations ........................................................................................ 151
15
4.2.4. Fecundity ............................................................................................................ 154
Oocyte growth dynamic and recruitment ................................................................. 154
Potential annual fecundity (Fp) ................................................................................ 161
Oocyte density (NG) estimation .............................................................................. 163
4.3. Discussion ................................................................................................................... 164
CHAPTER 5: Reproduction in Fisheries Management ................................................... 177
5.1. Introduction ................................................................................................................ 177
5.2. Results ........................................................................................................................ 180
5.2.1. Gillnet selectivity ................................................................................................ 180
5.2.1.1. Selectivity and maturation .......................................................................... 185
5.2.2. Selectivity and reproduction on female B. guatemalensis .................................. 187
5.2.3.2. Reproductive phases ................................................................................... 189
5.2.3.3. Size at reproductive phases ......................................................................... 192
5.2.3.4. Potential egg production (EP) ..................................................................... 193
5.3. Discussion ................................................................................................................... 195
CHAPTER 6: Concluding Remarks ................................................................................... 207
CHAPTER 7: Conclusions .................................................................................................. 218
References ............................................................................................................................. 223
Appendix I: RESUMEN ...................................................................................................... 243

17
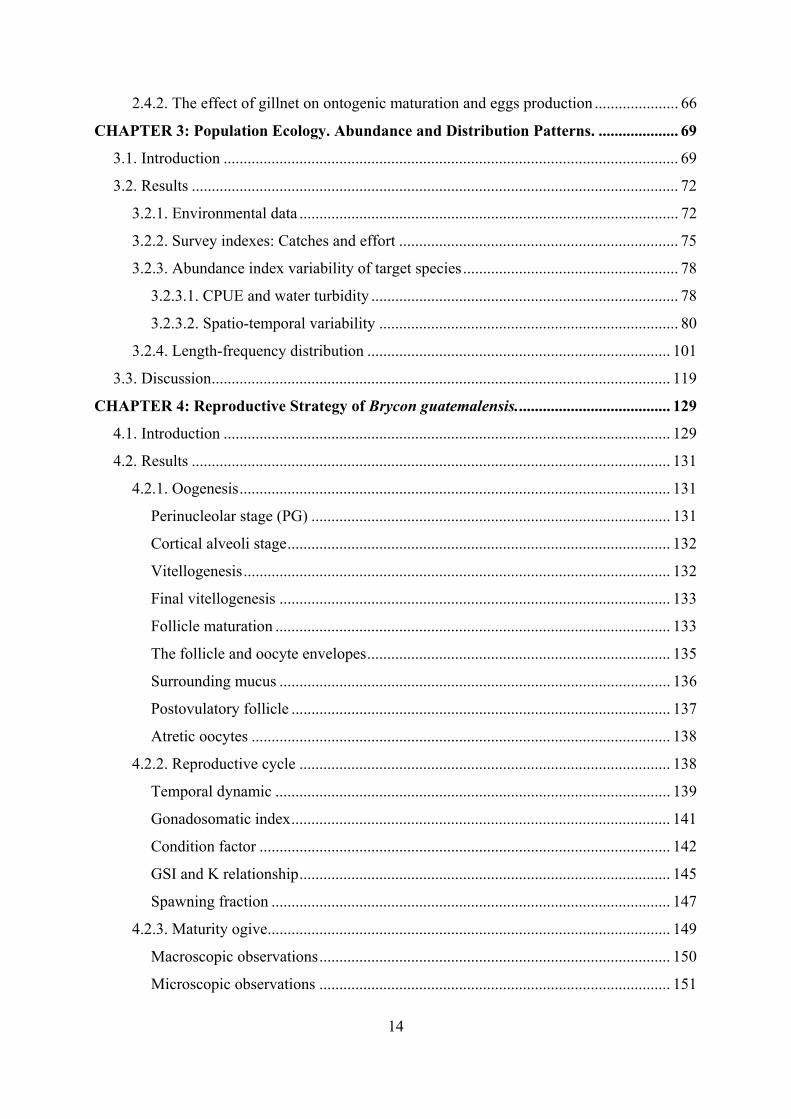
GENERAL INDEX
FIGURE INDEX
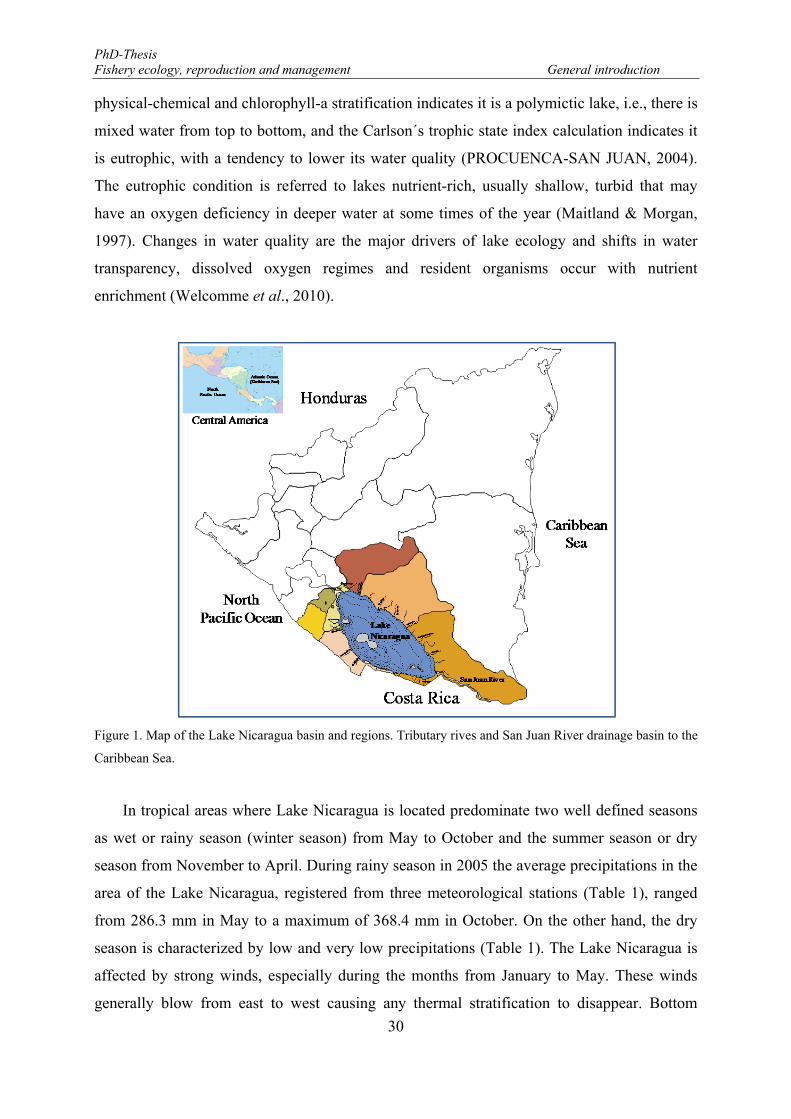
Figure 1. Map of the Lake Nicaragua basin and regions. Tributary rives and San Juan River drainage basin to the Caribbean Sea. ............................................................................................................................................... 30
Figure 2. Satellite image of the Sea Surface Temperature (SST) in the Gulf of Papagayo, Nicaragua region where is observed also the temperature of the Lake Nicaragua: February 1999. ..................................................... 33
Figure 3. Distribution of the Middle American ichthyofauna by major fish provinces. The circle (SJ) in SAN JUAN province correspond to the fish species associated to the Lake Nicaragua (Bussing, 1976). ............. 35
Figure 4. Data series of fish landings from the Lake Nicaragua: Gray: Reported landings; Dashed red line: Estimated (unreported) landings. Source: ADPESCA (2006) and INPESCA (2011). .................................. 39
Figure 5. Fish landings by species category. Robalo: Centropomus sp; Tilapia: Oreochromis sp; Mojarra: Amphilophus citrinellus, A. labiatus, A. longimanus, Astatheros rostratus, Hypsophrys nicaraguensis; Gaspar: Atractosteus tropicus; Machaca: Brycon guatemalensis; Roncador: Pomadasys croco. ................. 40
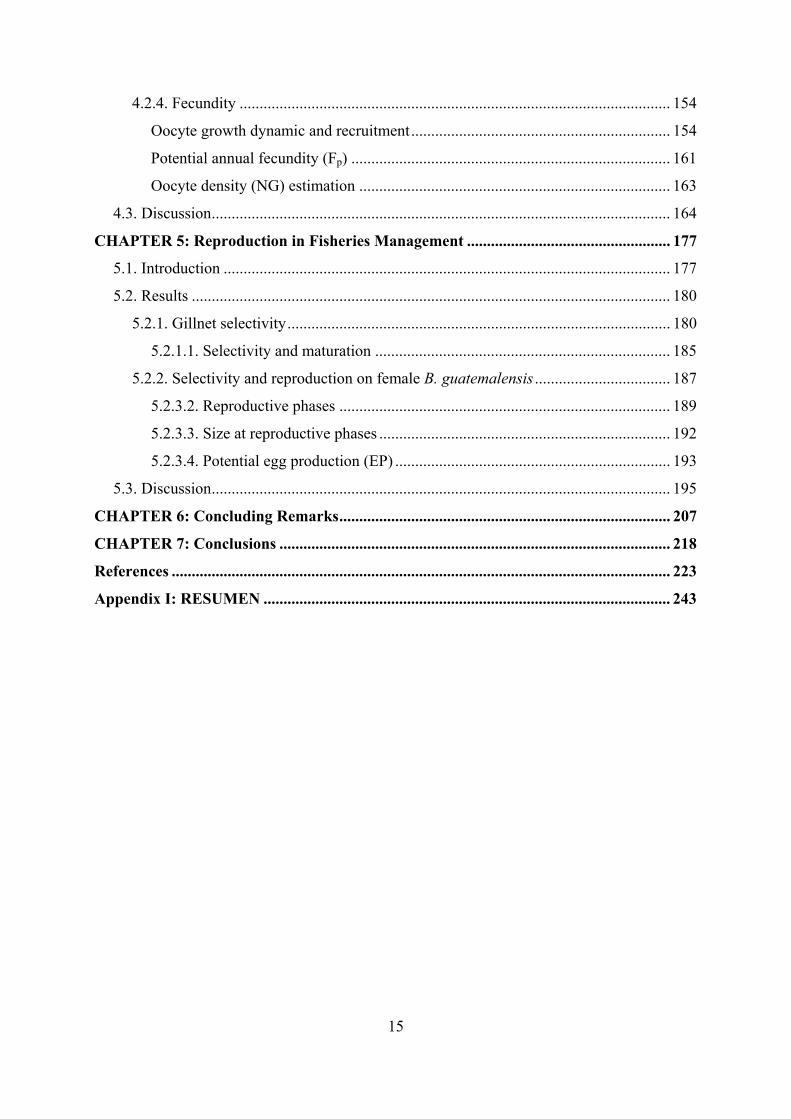
Figure 6. Geographical locations of the Lake Nicaragua in the Nicaraguan territory. ........................................... 45 Figure 7. Geographical locations of the monthly fishery research campaign () in the eastern shore of the
Nicaraguan Lake. February 2005 to January 2006. Dashed lines: Depth profiles in meters. ........................ 46 Figure 8. Schematic representation of a wedged fish in gillnets as indicated by Karlsen & Bjarnason (1986) ..... 49 Figure 9. Oocytes image of Brycon guatemalensis surrounding by mucus before separation through a washing
process method. ............................................................................................................................................. 63 Figure 10. Oocytes counting image of Brycon guatemalensis for fecundity estimation, using a computer-aided
image analysis system QWin software (Leica Imaging Systems). ................................................................ 63 Figure 11. Bottom soil type identified in the eastern part of the Lake Nicaragua. February 2005 - January 2006.73 Figure 12. Monthly precipitation registered in the Lake Nicaragua during the study period, February 2005-
January 2006. Data source: Instituto Nicaraguense de Estudios Territoriales- INETER 2006. ..................... 74 Figure 13. Water turbidity recorded in the eastern part of the Lake Nicaragua. February 2005 - January 2006. .. 74 Figure 14. Surface temperature of the waters recorded in the eastern part the Lake Nicaragua. February 2005 -
January 2006. ................................................................................................................................................. 74 Figure 15. Catch frequency distribution of the most important species, ordered by abundance (see Table 14 ),
along the east part of the Lake Nicaragua during the fishery survey from February 2005 to January 2006.. 76 Figure 16. Catch and effort pattern during the fishery-independent survey. Bg: Brycon guatemalensis; Ac:
Amphilophus citrinellus; Hn: Hypsophrys nicaraguensis; Pm: Parachromis managuensis: Dashed lines: Maximum catches. Lake of Nicaragua, 2005-2006. ...................................................................................... 77
Figure 17. Scatterplot where is correlated the catch rates (number per hour per m2) of four species and turbidity water level (secchi disk measurement) of the lake. (A) Amphilophus citrinellus; (B) Hypsophrys nicaraguensis; (C) Parachromis managuensis; and (D) Brycon guatemalensis. .......................................... 79
Figure 18. The CPUE by water turbidity classes (secchi disk measurement). (A) Amphilophus citrinellus; (B) Hypsophrys nicaraguensis; (C) Parachromis managuensis; and (D) Brycon guatemalensis. Mean (midpoint); Mean ± SE (box); Mean ± SD (whisker) .................................................................................... 80
Figure 19. Distribution and abundance index [Ln(CPUEs No ind/h m2+1)] of Amphilophus citrinellus in the eastern part of the Lake Nicaragua. ............................................................................................................... 82
Figure 20. Catch per unit of fishing effort [Ln(CPUEs No ind/h m2+1)] of Amphilophus citrinellus in the eastern part of the Lake Nicaragua for the whole year and by seasons. * denotes significant differences. Vertical bars denote 0.95 confidence intervals. ........................................................................................................... 83
Figure 21. Monthly catch per unit of fishing effort [Ln(CPUEs No ind/h m2+1)] of Amphilophus citrinellus during a fishery-independent survey in the Lake Nicaragua. Mean ± CI: Vertical bars denote 0.95 confidence intervals. ...................................................................................................................................... 84
Figure 22. Spatial variations of catch per unit of fishing effort [Ln(CPUEs No ind/h m2+1)] of Amphilophus citrinellus between macro-zones and by depth. Mean ± CI: Vertical bars denote 0.95 confidence intervals. Blue and red * denotes significant differences among depth strata within macro-zones. Black * denotes significant differences among macro-zones within depth stratum. ................................................................ 84
Figure 23. Spatio-temporal variation of catch per unit of fishing effort [Ln(CPUEs No ind/h m2+1)] of Amphilophus citrinellus, by depth, macro-zones and season in the Lake Nicaragua. Mean ± CI: Vertical bars denote 0.95 confidence intervals. ........................................................................................................... 85
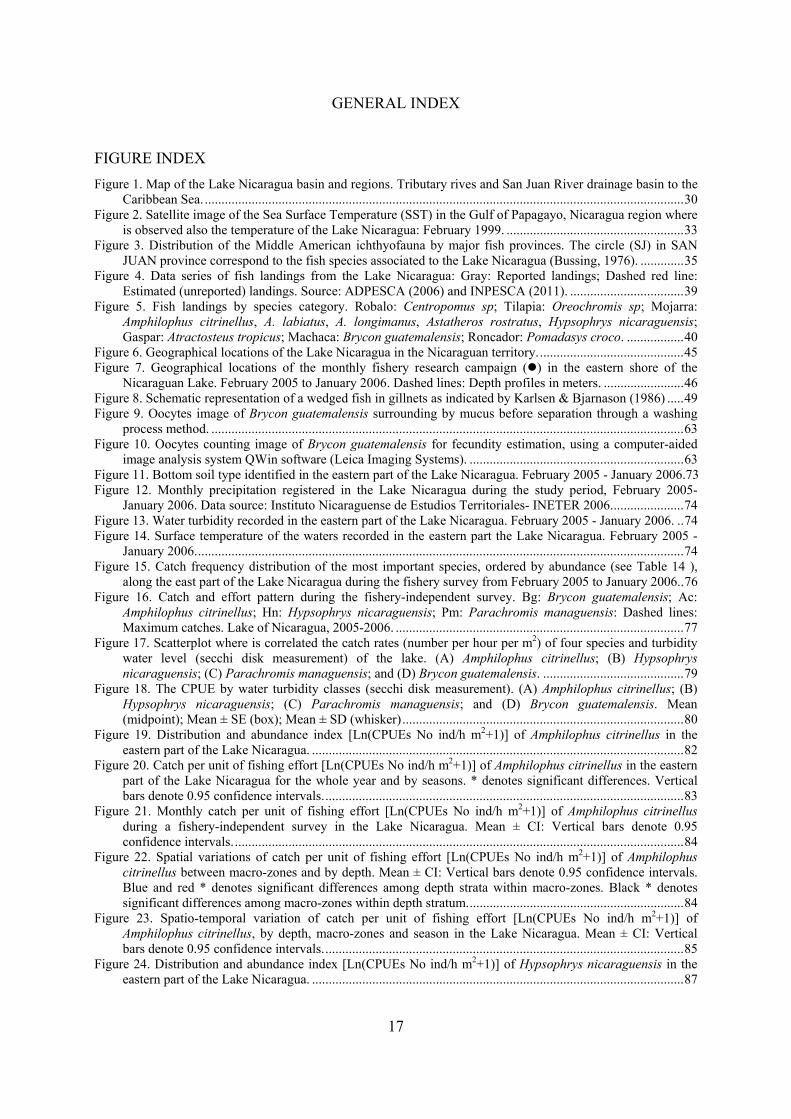
Figure 24. Distribution and abundance index [Ln(CPUEs No ind/h m2+1)] of Hypsophrys nicaraguensis in the eastern part of the Lake Nicaragua. ............................................................................................................... 87
18
Figure 25. Catch per unit of fishing effort [Ln(CPUEs No ind/h m2+1)] of Hypsophrys nicaraguensis in the eastern part of the Lake Nicaragua for the whole year and by seasons. * denotes significant differences. Vertical bars denote 0.95 confidence intervals. ............................................................................................. 87
Figure 26. Monthly catch per unit of fishing effort [Ln(CPUEs No ind/h m2+1)] of Hypsophrys nicaraguensis during a fishery-independent survey in the Lake Nicaragua. Mean ± CI: Vertical bars denote 0.95 confidence intervals. ...................................................................................................................................... 89
Figure 27. Spatial variations of catch per unit of fishing effort [Ln(CPUEs No ind/h m2+1)] of Hypsophrys nicaraguensis between macro-zones and depth. Mean ± CI: Vertical bars denote 0.95 confidence intervals. Blue, green and red * denotes significant differences among depth strata within macro-zones. Black * denotes significant differences among macro-zones within depth stratum. ................................................... 89
Figure 28. Spatial variations of catch per unit of fishing effort [Ln(CPUEs No ind/h m2+1)] of Hypsoprhys nicaraguensis, between season and depth. Mean ± CI: Vertical bars denote 0.95 confidence intervals. Blue and red * denotes significant differences among depth strata within macro-zones. Black * denotes significant differences among macro-zones within depth stratum. ................................................................ 90
Figure 29. Spatio-temporal variation of catch per unit of fishing effort [Ln(CPUEs No ind/h m2+1)] of Hypsophrys nicaraguensis, by depth, macro-zones and season in the Lake Nicaragua. Mean ± CI: Vertical bars denote 0.95 confidence intervals. ........................................................................................................... 90
Figure 30. Distribution and abundance index [Ln(CPUEs No ind/h m2+1)] of Parachromis managuensis in the eastern part of the Lake Nicaragua. ............................................................................................................... 92
Figure 31. Catch per unit of fishing effort [Ln(CPUEs No ind/h m2+1)] of Parachromis managuensis in the eastern part of the Lake Nicaragua for the whole year and by seasons. * denotes significant differences. Mean ± CI: Vertical bars denote 0.95 confidence intervals. .......................................................................... 92
Figure 32. Monthly catch per unit of fishing effort [Ln(CPUEs No ind/h m2+1)] of Parachromis managuensis during a fishery-independent survey in the Lake Nicaragua. Mean ± CI: Vertical bars denote 0.95 confidence intervals. ...................................................................................................................................... 94
Figure 33. Spatial variations of catch per unit of fishing effort [Ln(CPUEs No ind/h m2+1)] of Parachromis managuensis between macro-zones and depth. Mean ± CI: Vertical bars denote 0.95 confidence intervals. Blue and red * denotes significant differences among depth strata within macro-zones. Black * denotes significant differences among macro-zones within depth stratum. ................................................................ 94
Figure 34. Spatial variations of catch per unit of fishing effort [Ln(CPUEs No ind/h m2+1)] of Parachromis managuensis, between season and depth. Mean ± CI: Vertical bars denote 0.95 confidence intervals. Blue and red * denotes significant differences among depth strata within seasons. .............................................. 95
Figure 35. Spatio-temporal variation of catch per unit of fishing effort [Ln(CPUEs No ind/h m2+1)] of Parachromis managuensis, by depth, macro-zones and season in the Lake Nicaragua. Mean ± CI: Vertical bars denote 0.95 confidence intervals. ........................................................................................................... 95
Figure 36. Distribution and abundance index [Ln(CPUEs No ind/h m2+1)] of Brycon guatemalensis in the eastern part of the Lake Nicaragua. ............................................................................................................... 97
Figure 37. Catch per unit of fishing effort [Ln(CPUEs No ind/h m2+1)] of Brycon guatemalensis in the eastern part of the Lake Nicaragua for the whole year and by seasons. Mean ± CI: Vertical bars denote 0.95 confidence intervals. ...................................................................................................................................... 98
Figure 38. Monthly catch per unit of fishing effort [Ln(CPUEs No ind/h m2+1)] of Brycon guatemalensis during a fishery-independent survey in the Lake Nicaragua. Mean ± CI: Vertical bars denote 0.95 confidence intervals. ........................................................................................................................................................ 99
Figure 39. Spatial variations of catch per unit of fishing effort [Ln(CPUEs No ind/h m2+1)] of Brycon guatemalensis between macro-zones and depth. Mean ± CI: Vertical bars denote 0.95 confidence intervals. Blue and red * denotes significant differences among depth strata within macro-zones. Black * denotes significant differences among macro-zones within depth stratum. ................................................................ 99
Figure 40. Spatial variations of catch per unit of fishing effort [Ln(CPUEs No ind/h m2+1)] of Brycon guatemalensis, between season and depth. Mean ± CI: Vertical bars denote 0.95 confidence intervals. Blue and red * denotes significant differences among depth strata within seasons. Black * denotes significant differences among seasons within depth stratum. ........................................................................................ 100
Figure 41. Spatio-temporal variation of catch per unit of fishing effort [Ln(CPUEs No ind/h m2+1)] of Brycon guatemalensis, by depth, macro–zones and season in the Lake Nicaragua. Mean ± CI: Vertical bars denote 0.95 confidence intervals. ............................................................................................................................ 100
Figure 42. Length frequency distributions (number) of Amphilophus citrinellus. F: females and M: males. ...... 101 Figure 43. Monthly mean length distributions pattern of Amphilophus citrinellus during the fishery-independent
survey in the Lake Nicaragua. Vertical bars denote 0.95 confidence intervals. .......................................... 102 Figure 44. Spatial variations of the mean length of Amphilophus citrinellus between macro-zones and depth.
Vertical bars denote 0.95 confidence intervals. Blue, green and red * denotes significant differences among
19
depth strata within macro-zones. Black * denotes significant differences among macro-zones within depth stratum. ........................................................................................................................................................ 104
Figure 45. Mean length distributions of Amphilophus citrinellus in the eastern part of the Lake Nicaragua. ..... 104 Figure 46. Relationship between total length of Amphilophus citrinellus and secchi depth. ............................... 105 Figure 47. Length frequency distributions (number) of Hypsophrys nicaraguensis. F: females and M: males.
Note the different Y-axis scale between graphs. ......................................................................................... 106 Figure 48. Monthly mean length distributions pattern of Hypsophrys nicaraguensis during the fishery-
independent survey in the Lake Nicaragua. Vertical bars denote 0.95 confidence intervals. ...................... 106 Figure 49. Spatial variations of the mean length of Hypsophrys nicaraguensis between macro-zones and depth.
Vertical bars denote 0.95 confidence intervals. Green * denotes significant differences among depth strata within macro-zones. Black * denotes significant differences among macro-zones within depth stratum. .. 109
Figure 50. Mean length distributions of Hypsophrys nicaraguensis in the eastern part of the Lake Nicaragua. . 109 Figure 51. Relationship between total length of Hypsophrys nicaraguensis and secchi depth. ........................... 110 Figure 52. Length frequency distributions (number) of Parachromis managuensis. F: females and M: males. . 111 Figure 53. Monthly mean length distributions pattern of Parachromis managuensis during the fishery-
independent survey in the Lake Nicaragua. Vertical bars denote 0.95 confidence intervals. ...................... 111 Figure 54. Spatial variations of the mean length of Parachromis managuensis between macro-zones and depth.
Vertical bars denote 0.95 confidence intervals. ........................................................................................... 113 Figure 55. Mean length distributions of Parachromis managuensis in the eastern part of the Lake Nicaragua. . 113 Figure 56. Relationship between total length of Parachromis managuensis and secchi depth. ........................... 114 Figure 57. Length frequency distributions (number) of Brycon guatemalensis. F: females and M: males. ......... 115 Figure 58. Monthly mean length distributions pattern of Brycon guatemalensis during the fishery-independent
survey in the Lake Nicaragua. Vertical bars denote 0.95 confidence intervals. .......................................... 115 Figure 59. Spatial variations of the mean length of Brycon guatemalensis between macro-zones and depth.
Vertical bars denote 0.95 confidence intervals. Blue, green and red * denotes significant differences among depth strata within macro-zones. Black * denotes significant differences among macro-zones within depth stratum. ........................................................................................................................................................ 117
Figure 60. Mean length distributions of Brycon guatemalensis in the eastern part of the Lake Nicaragua. ........ 118 Figure 61. Relationship between total length of Brycon guatemalensis and secchi depth. .................................. 118 Figure 62. Histological section of the ovary showing A: Oocytes in Primary Growth stages (PG) or
previtellogenic: c: cytoplasm; n: nucleus; nu: nucleolus; l: lumen; pr: perinuclear ring. B: Oocytes in Cortical Alveoli stages (CA). PG: Primary Growth oocytes; ca: cortical alveoli; n: nucleus; nu: nucleolus. C: oocytes in Vitellogenesis stage. ch: chorion; n: nucleus; VIT1: initial or early vitellogenesis; VIT2: advanced or late vitellogenesis or advanced vitellogenesis; ca: cortical alveoli; y: yolk. D: oocytes in maturation stages. ch: chorion; gvm: germinal vesicle migration or migratory nucleus; VIT2: late vitellogenic oocytes or advanced vitellogenesis; y: yolk. ............................................................................ 134
Figure 63. Oocytes development stages in the ovaries of Brycon guatemalensis. Mean (midpoint); Mean ± SE (Box); Mean ± SD (Whisker). ..................................................................................................................... 135
Figure 64. Histological section of the ovary showing the follicle envelops. A and B: ca: cortical alveoli; g: granulosa layer; i: zona radiata internal; jc: jelly coat; ou: zona radiate external; t: theca layer; zr: zona radiata or chorion; y: yolk. .......................................................................................................................... 136
Figure 65. Oocytes surrounded by mucus. ........................................................................................................... 137 Figure 66. Histological sections of fish ovary tissues showing postovulatory follicle (pof) structures. .............. 137 Figure 67. Histological sections showing oocytes in early (A) and late (B) atresia stages. ch: chorion; at: atretic
oocyte; VIT2: final vitellogenic oocyte. ...................................................................................................... 138 Figure 68. Frequency of incidence of reproductive phases for mature females of Brycon guatemalensis (N=320;
Bars). Reproductive phases: Developing-D (yellow); Spawning Capable-SC (red); Actively Spawning-AS (light orange); Regressing-Rgs (blue sky); Regenerating-Rgn (blue). Mean monthly variation Gonadosomatic index (GSI: N=240) (solid black line) and standard deviation (whiskers). Upper panel shows annual precipitation in millimetres (mm). ........................................................................................ 140
Figure 69. Gonado-somatic indexes (GSI) variation in Brycon guatemalensis in relation with the dry and rainy periods of the year. Mean (midpoint); Mean ± SE (box); Mean ± SD (whisker). ....................................... 141
Figure 70. Relationship between GSI and length, considering the reproductive phases: Developing (D), Spawning capable (SC), Actively spawning (AS) and Regenerating (Rgn) phases. ................................... 142
Figure 71. Mean monthly variation of condition factor (K) in Brycon guatemalensis. Mean (mid point); Mean ±SE; Mean ±SD. * Month with significant differences. .............................................................................. 143
Figure 72. Seasonal variation in the condition factors (K) of Brycon guatemalensis. Mean (midpoint); Mean ± SE (box); Mean ± SD (whisker). ................................................................................................................. 144
Figure 73. Relationship between K and length, considering the reproductive phases: Developing (D), Spawning capable (SC), Actively spawning (AS) and Regenerating (Rgn) phases. .................................................... 144
20
Figure 74. Relationship between both condition factor (K) and gonado-somatic (GSI) indexes in Brycon guatemalensis. N =304; r2=0.085; p < 0.001; y = -7.623 + 31.493*x. ........................................................ 145
Figure 75. Monthly pattern of the gonadosomatic indexes (GSI) and condition factor (K) in females of Brycon guatemalensis. ............................................................................................................................................. 146
Figure 76. Monthly spawning fraction of Brycon guatemalensis ........................................................................ 147 Figure 77. Monthly spawning fraction (Sf) of Brycon guatemalensis by length classes. < 33 cm (open circle and
dashed line); 33 to 43 cm (solid black circle and solid line) and > 43 cm (open triangle and dotted line). . 148 Figure 78. Mean variability of the spawning fraction in relation with the female length classes. Mean (midpoint);
Mean ± SE (box); Mean ± SD (whisker). .................................................................................................... 149 Figure 79. Relationship between the Gonadosomatic index (GSI) and the Spawning fraction of Brycon
guatemalensis: r2 = 0.8491; p = 0.0011; y = 0.054 + 0.082*x. .................................................................... 149 Figure 80. Macroscopic observation of immature and mature gonad stages of Brycon guatemalensis. Open circle
the data set; Mean (midpoint); Mean ± SE (box); Mean ± SD (whisker). ................................................... 150 Figure 81. Macroscopic maturity ogives estimated for Brycon guatemalensis. Arrows indicate L50 = 34.9 cm; red
circle represent the females proportion. ....................................................................................................... 151 Figure 82. Microscopic observation of immature and mature gonad stages of Brycon guatemalensis. Open circle
the data set; Mean (midpoint); Mean ± SE (box); Mean ± SD (whisker). ................................................... 152 Figure 83. Maturity ogive estimated for Brycon guatemalensis. Arrows indicate L50 = 27.3 cm; blue colour
square represent the females proportion. ..................................................................................................... 152 Figure 84. Two maturity ogives estimated for Brycon guatemalensis. Macroscopic ogives (dashed line) and
female proportion (solid red circle); Microscopic ogives (solid line) and female proportion (solid blue square). Arrows indicate L50 Macroscopic=34.9 cm; L50 Microscopic= 27.3 cm. .................................................... 153
Figure 85. Oocyte-size frequency distribution in mature ovaries in advanced vitellogenic stages of Brycon guatemalensis. A) Main panel: The whole oocytes size-range distribution, and B) Inlet panel: The vitellogenic oocytes size-range distribution (N = counting oocytes 32,908). .............................................. 154
Figure 86. Oocyte-sizes frequency distribution along the spawning season (July to November) observed in mature ovaries (advanced vitellogenic stages -VIT2) of Brycon guatemalensis. A) whole oocyte distribution pattern and B) pattern of larger oocytes. .................................................................................. 155
Figure 87. Frequency distribution of oocytes diameter in twelve ripened ovaries examined during the spawning season. Each draw represents the ripened ovary from one female of Brycon guatemalensis, which follows a sequential order of collecting days from July 2005 to January of 2006. ..................................................... 156
Figure 88. Monthly variability of the mean oocytes diameter larger than 1000 µm. Mean (mid point); Mean ±SE (box); Mean ±SD (whisker). ........................................................................................................................ 156
Figure 89. The monthly pattern of the oocyte diameter (µm), considering the 10 % of largest oocytes in Brycon guatemalensis. A: ANOVA.-Mean (mid point); Mean ±SE (box); Mean ±SD (whisker); B: Regression. . 157
Figure 90. Oocyte diameter progression of three oocyte cohorts identified in ovaries in advanced vitellogenesis stages of Brycon guatemalensis along the spawning season. The number of females is ordered by the mean size of the leading cohort. ............................................................................................................................ 158
Figure 91. Relationship between the mean oocytes diameter of the leading oocytes cohorts with female body length of Brycon guatemalensis. .................................................................................................................. 158
Figure 92. VIT2-GVM ratio and female length relationship based upon 47 ovaries. .......................................... 160 Figure 93. Monthly variation of the number of developing oocytes (NDO: solid line) and the relative number of
developing oocytes (RNDO: dashed line). Whiskers denote 0.95 confidence intervals. ............................. 160 Figure 94. The potential annual fecundity as: (A) function of the total body length (The power equation y=
0.0626x3.3094); (B) function of gutted weight (Linear equation y= -619.59 + 15.306 x) of Brycon guatemalensis captured along the east coast of the Lake of Nicaragua from July to November (N= 48). .. 161
Figure 95. The potential annual fecundity as function of the oocytes diameter of Brycon guatemalensis captured along the east coast of the Lake of Nicaragua from July to November (N=48). Linear equation y= -14112 + 12.828 x ....................................................................................................................................................... 162
Figure 96. Monthly variation of the potential annual fecundity (Fp: solid line) and relative potential annual fecundity (Fp relative: dashed line) of Brycon guatemalensis during the spawning season. Mean (midpoint); Mean ±SE (whisker). ................................................................................................................................... 162
Figure 97. Relationship and fitted curve between oocyte diameter (μm) and oocyte density (number of oocytes per gram of ovary weight) of Brycon guatemalensis. .................................................................................. 163
Figure 98. Monthly patterns of captures, showing the male and female capture in numbers, by species and mesh size of the nets. ............................................................................................................................................ 183
Figure 99. The relative selectivity curves of four mesh sizes tested: 75, 100, 125, and 150 mm stretch mesh, the total selectivity curve (thick dashed lines), O-mac (macroscopic ogives) and O-histology (microscopic ogives) for each species. .............................................................................................................................. 184
21
Figure 100. Length-frequency distribution of estimated abundance of males and females of A. citrinellus, H. nicaraguensis, P. managuensis and B. guatemalensis. ................................................................................ 184
Figure 101. Maturity ogives of A. citrinellus, H. nicaraguensis P. managuensis and B. guatemalensis. ............ 185 Figure 102. Pattern of the observed and the estimated length parameters with the mesh size of the net. OM-
Observed female mean length; OMo- Observed female modal length; EM- Estimated female mean length; OL- Optimum length; n: is the total catch; A: Estimated abundance. ......................................................... 188
Figure 103. The relative selectivity curves for individual nets (mesh sizes tested: 75, 100, 125, and 150 mm stretch mesh) and the length frequency distribution pattern of B. guatemalensis. ....................................... 189
Figure 104. Relative frequencies of the reproductive phases of: Immature (I); Developing (D); Spawning capable (SC); Actively spawning (AS) and Regenerating (R) by mesh size of the net. ........................................... 190
Figure 105. Mean-length variation of the reproductive phases of B. guatemalensis in whole mesh size tested. Mean (midpoint); Mean SE (box); Mean SD (whisker). Reproductive phases: Developing (D); Spawning capable (SC); Actively spawning (AS); and Regeneration (R). .................................................. 190
Figure 106. Seasonal variation of the female mean catches by mesh size net of B. guatemalensis. Mean ± CI: Vertical bars denote 0.95 confidence intervals. ........................................................................................... 191
Figure 107. The presence-absence of females of B. guatemalensis proxy to spawn (SC) and actively spawning (AS) by mesh size nets (75, 100 and 125+150 mm). SC-rainy and AS-rainy: during rainy period; SC-dry and AS-dry: during dry period. .................................................................................................................... 191
Figure 108. Mean length and standard deviation of each reproductive phase of B. guatemalensis by mesh-size of the net. D: Developing; SC: Spawning capable; As: Actively spawning; R: Regenerating. Red dashed lines: Optimum length (OL). ................................................................................................................................. 193
Figure 109. Average individual egg production (fecundity) of females of B. guatemalensis by each net mesh-size. Mean (midpoint); Mean±SE (box); Mean±SD (whisker). ................................................................... 194
TABLE INDEX
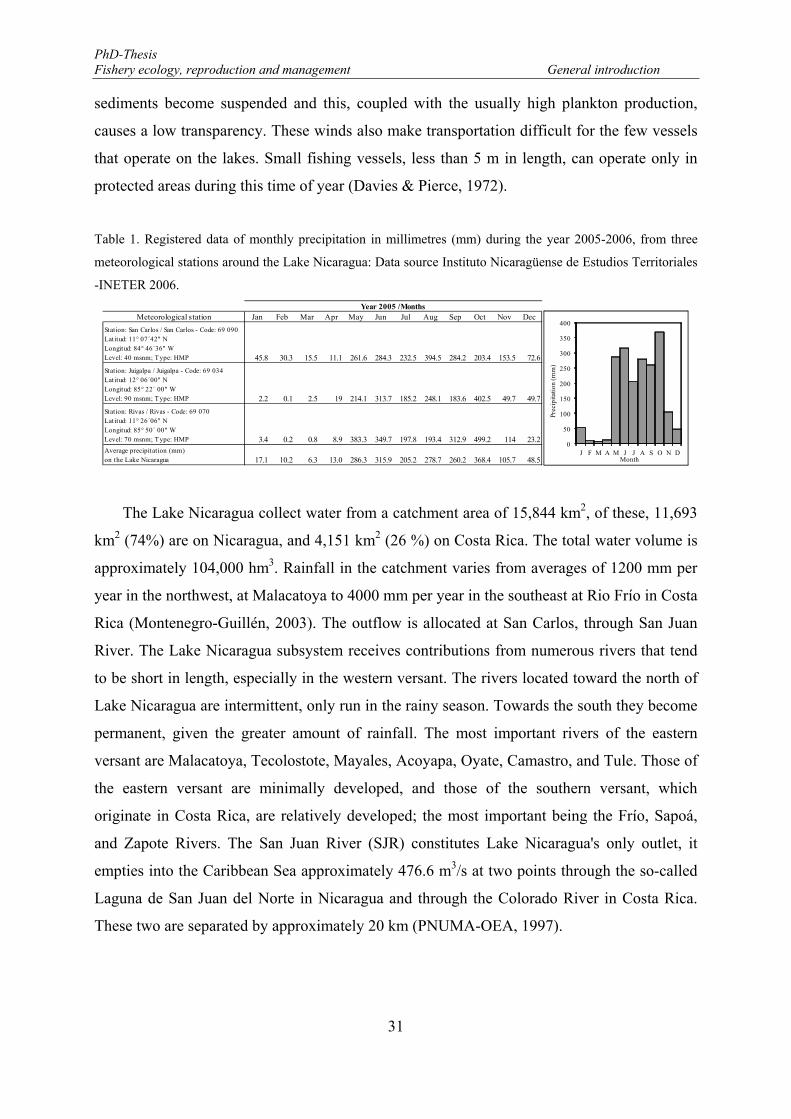
Table 1. Registered data of monthly precipitation in millimetres (mm) during the year 2005-2006, from three meteorological stations around the Lake Nicaragua: Data source Instituto Nicaragüense de Estudios Territoriales -INETER 2006. ......................................................................................................................... 31
Table 2. The following is a list of teleost fish species reported in the Lake Nicaragua (Regan, 1906-08; Miller's, 1966; Bussing, 1976). .................................................................................................................................... 37
Table 3. List of fish species from the Lake Nicaragua under protection for the local regulations in 2008. (*): In September month is only permitted the sport fishing (catch-and-release) in the San Juan River (RSJ). Taken (translated for this study) from Normas Jurídicas de Nicaragua (2008). ....................................................... 38
Table 4. Biomass per species and zone of the Lake Nicaragua. The Central zone refers to the waters below 2 m deep, i.e., a surface area of about 2,957 km2; the Coastal zone refers to the waters above 2 m deep (Orellana, 1986). ............................................................................................................................................ 42
Table 5. Gillnet specifications: Characteristic and material of construction of the passive fishing gear used during the fishery-independent survey carried out in the Lake Nicaragua. ............................................................... 47
Table 6. Stages of fish sexual maturity used in present study (for field work) for macroscopic observations of fish gonads, (modified from the maturity scale of Holden & Raitt, 1974). ................................................... 49
Table 7. Ovaries of Brycon guatemalensis collected from February 2005 to January 2006 by fish size range. The samples were taken in the eastern part of the Lake Nicaragua. ..................................................................... 50
Table 8. Haematoxylin-Eosin staining standard protocol used in ovaries of Brycon guatemalensis. .................... 54 Table 9. Terminology applied for reproductive classification of female fishes (Brown-Peterson et al., 2011). .... 57 Table 10. Number of female Brycon guatemalensis by length class and maturity stage, based on macroscopic and
microscopic observations. ............................................................................................................................. 60 Table 11. Proportion of female B. guatemalensis macroscopically analyzed, by month and maturity stage. (*)
Months considered to be the spawning season and included to stage maturity macroscopically. ................. 61 Table 12. Number of specimens (male or female) of H. nicaraguensis, A. citrinellus and P. managuensis by
length class and maturity stage (based on macroscopic observations) analyzed for length-at-maturity estimation. ..................................................................................................................................................... 61
Table 13. Species and specimens (male and female) considered in the gillnet selectivity analysis. Mesh size tested 75, 100, 125 and 150 mm stretch mesh. .............................................................................................. 66
Table 14. Total catch in number and biomass, and catch per unit of fishing effort in gram per hour (g/h) by species captured during the fishery-independent survey carried out in the eastern part of the Lake Nicaragua February 2005-January 2006. * Most important commercial species for the local fishermen. February 2005-January 2006. ................................................................................................................................................. 76
22
Table 15. Monthly catches (kg and number), fishing effort (hours) registered and CPUE (g/h) estimated of four selected species captured during the surveys in the Lake Nicaragua 2005-2006. ......................................... 78
Table 16. Determination coefficient and significant level of the linear regression, and ANOVA between water turbidity and the relative abundance [Ln(CPUEs No ind/h m2+1)] of four species. ...................................... 80
Table 17. Results of the GLMs for Amphilophus citrinellus CPUEs (log-transformed) as function of season, macro-zones and depth. ................................................................................................................................. 83
Table 18. Results of the GLMs for Hypsophrys nicaraguensis CPUEs (log-transformed) as function of season, macro-zones and depth. ................................................................................................................................. 88
Table 19. Results of the GLMs for Parachromis managuensis CPUEs (log-transformed) as function of season, macro-zones and depth. ................................................................................................................................. 93
Table 20. Results of the GLMs for Brycon guatemalensis CPUEs (log-transformed) as function of season, macro-zones and depth. ................................................................................................................................. 98
Table 21. Results of the GLMs for Amphilophus citrinellus. Total length (cm) as function of season, macro-zones and depth. .......................................................................................................................................... 103
Table 22. Results of the GLMs for Hypsophrys nicaraguensis. Total length (cm) as function of season, macro-zones and depth. .......................................................................................................................................... 108
Table 23. Results of the GLMs for Parachromis managuensis. Total length (cm) as function of season, macro-zones and depth. .......................................................................................................................................... 112
Table 24. Results of the GLMs for Brycon guatemalensis. Total length (cm) as function of season, macro-zones and depth. .................................................................................................................................................... 116
Table 25. Oocytes diameter of the different oocyte developmental stages (histological determined) in ovaries of Brycon guatemalensis. ................................................................................................................................. 133
Table 26. Female reproductive phases as used in this study for Brycon guatemalensis. ..................................... 139 Table 27. Statistical parameters of the relationship between gonadosomatic index (GSI) and length (cm) for
females of Brycon guatemalensis: Number on specimens in the analysis (N); coefficient of determination (r2), statistical significant test (p-value) and the linear regression equation. ............................................... 142
Table 28. Statistical parameters of the relationship between condition factor (K) and length (cm) for females of Brycon guatemalensis: Number on specimens in the analysis (N); coefficient of determination (r2), statistical significant test (p-value) and the linear regression equation. ....................................................... 144
Table 29. Results of the GLM (ANCOVA) to analyse the effect of the reproductive phases in the relationship between condition factor (K) and gonado-somatic (GSI) index of B. guatemalensis. ................................. 145
Table 30. Monthly data of the somatic variables, gonado-somatic indexes (GSI) and condition factor (K), for Brycon guatemalensis (February 2005-January 2006). ............................................................................... 146
Table 31. Total number of females of Brycon guatemalensis analysed during the month of the spawning season. D: Developing; SC: Spawning capable; AS: Actively spawning; Rgn: Regenerating phases. .................... 148
Table 32. Statistical parameter results from the regression analysis between spawning fraction (Sf) and month, and three fish length classes. ....................................................................................................................... 148
Table 33. Values attained for the logistic regression curve, based on macroscopic observation of the ovaries .. 150 Table 34. Values attained for the logistic regression curve, based on histological observation of the ovaries .... 152 Table 35. Results of the GLM performed to evaluate the differences between macroscopic and microscopic
methods for the L50 estimation of Brycon guatemalensis. ........................................................................... 153 Table 36. Number of oocytes in advanced or late vitellogenic (VIT2) and germinal vesicle migratory (GVM)
stages in ovaries of Brycon guatemalensis. ................................................................................................. 159 Table 37. Statistical parameters from the relationship between oocyte diameter (OD) and oocyte density (OG)
for Brycon guatemalensis. ........................................................................................................................... 163 Table 38. Observed parameter of the captured specimens (male and females) and the estimated parameters from
the gillnet selectivity analysis, by mesh size net tested in the Lake Nicaragua. .......................................... 181 Table 39. Average sex ratio (male: female) for each species captured in the Lake Nicaragua and mesh size net.182 Table 40. Length-at-50% maturity (L50) and optimum length (OL) estimated by net mesh size of four species
captured in the Lake Nicaragua. * estimated in males; ** estimated in females. ........................................ 185 Table 41. Proportion of immature fish captured within each mesh size net of each species, based on macroscopic
and microscopic maturity ogives. ................................................................................................................ 186 Table 42. Length parameters of the females caught and retained in each mesh size of the net. .......................... 188 Table 43. Estimated parameters from the gillnet selectivity analysis of four mesh size of the net tested. ........... 188 Table 44. Estimated potential eggs production (EP) of the spawning females caught by mesh-size of the net. .. 194
23
Summary
The freshwater bodies are very dynamic systems, and have been the first aquatic
ecosystems susceptible to receive the direct impact of human activities, becoming very
vulnerable ecosystems. The Lake Nicaragua has been recognised as a continental water body
with an important source of fish living resources for the fishery sector. In addition, its
dimension is very attractive for the development of aquaculture activities. However, the
exploitation level of fishing resources in the lake has lead to an overexploitation of some
species already included in UICN red list, while others are in risk of being overexploited if
management measures are not taken. Studies on species diversity in the lake defined two
demersal fish habitats: the “shallow benthic” habitat, which has a higher index of species
diversity and the “deep benthic” habitat with lower diversity index.
The landings data series do not allow ascertaining the catches composition. Hence, any
evaluation of the fish exploitation pattern in the Lake Nicaragua derived from landings record
is imprecise. Besides, the large gap on knowledge of many other important biological
parameters of the fish species - the dynamic of reproductive behaviour of the population, the
reproductive cycle, spawning ground, egg production and the maternal features affecting
reproductive output and fitness- prevents the implementation of management actions directed
towards the conservation of the lake stock reproductive potential, such as regulations on
closing season and/or areas, and minimum landing sizes. This study, besides providing
information about actual state of distribution and abundance of Amphilophus citrinellus,
Hypsophrys nicaraguensis, Parachromis managuensis, and Brycon guatemalensis, provides
information of the reproductive strategy of B. guatemalensis and proposes some management
alternatives based on its biological features.
The present study was conducted along the eastern part of the Lake Nicaragua and
showed that even all the species studied were widely distributed in this area, species
abundance varied geographically (zones: northwest, central and southeast) and vertically
(depth: from shallow to deeper areas). The patterns of abundance of cichlid (A. citrinellus, H.
nicaraguensis and P. managuensis) are affected by spatial (zones) and environmental factors
as the vertical profiles (depth), whereas in B. guatemalensis was also affected by seasons of
the year, i.e., dry and rainy season. Cichlids were more abundant in shallow waters and in the
24
southeast zone, whereas B. guatemalensis larger abundances were found in the southeast and
northwest side. Similarly, the size distribution pattern was influenced by both latitude and
vertical profiles. Overall, larger fishes are found in the southeast and to a lesser extent in the
central zone of the lake, whereas in the northwest are smaller. Furthermore, larger fish are
found in relative deeper waters.
The reproductive studies on B. guatemalensis using histological procedures showed that
the oocytes final maturation ended with the migration of the germinal vesicle to the animal
pole, without oocyte hydration, and oocytes being surrounded by mucus indicative of eggs
adhesiveness. The species presented a protracted spawning season that lasted 8 months. Both
small and large females started the spawning activity in July, but spawning asynchrony
occurred between female sizes as spawning season progressed.
Based on histological procedures, the female length at 50% maturity of B. guatemalensis
was estimated in 27.3 cm, which largely differed from the ones previously reported based on
the gonad macroscopic observations. The present study indicated that B. guatemalensis has
determinate fecundity and presented group-synchronous ovarian organization. The potential
annual fecundity of the species showed that this allometrically increased with female size, and
that larger females produced larger eggs. Nonetheless, egg size decreased as spawning season
progressed.
Gillnet selectivity studies were performed on four species (A. citrinellus, H.
nicaraguensis, P. managuensis, and B. guatemalensis) and selectivity was quite different
among species, partly reflecting growth patterns. The absence of larger and smaller fishes was
notorious in the catches. The absence of larger fish likely indicated the expected maximum
size of each species within the lake ecosystem, while the minimum size captured may be
attributed to the fish shape and/or different behaviour of the life stages of each species. The
most vulnerable fraction of the population of cichlids was males, and females in the case of B.
guatemalensis, particularly during reproductive periods. The sex ratio of each species
obtained in the present study very likely is similar to those in the catches in a routine fishing
operations performed by the fishers in the lake.
25
The establishment of a minimum landing size (MLS) is one of the most common
management measures, particularly in data limited stocks exploited by the small-scale
fisheries, and often this measure is reinforced with regulations on fishing gears mesh size.
Generally, legal mesh size is determined combining gear selectivity and length-at-50%
maturity of the target species. The main objective of this management rule is the protection of
the immature or juvenile components of the stock, a measure often considered enough to
ensure the sustainability of the fishery. However, reproductive studies have evinced that
larger mature females are more productive than smaller mature ones, thus, the catches of
larger fish could also lead to a significant reduction of stock productivity. In this study, we
analyzed the impact of gillnet selectivity on B. guatemalensis in relation to ontogenic
maturation, reproductive phase, and reproductive potential. Results showed that juveniles and
recruit spawners are the most vulnerable to the 75 mm mesh-size, whereas the majority of the
spawning stock biomass (SSB), and particularly those with higher reproductive potential, are
highly vulnerable to the 100 mm mesh size, due to the interaction between the female length-
mesh relationship and the seasonal behaviour pattern of those females. Based on these results,
a MLS of 30 cm is proposed as management measures to protect the immature or juvenile
components of the stock, and to increase egg production of the SSB and reduce the fishing
mortality of young females we recommended the use of 100 mm mesh size of net for fishing
operation in the Lake Nicaragua.

27
CHAPTER 1: General Introduction
1.1. Lakes as source of natural resources
The freshwater bodies are very dynamic systems, and since ancient history have been the
first aquatic ecosystems susceptible to receive the direct impact of human activities, becoming
very vulnerable ecosystems. Their uses are very diverse, from drinking water, transport,
irrigation, energy production, as a vehicle to eliminate waste material, recreation, aquaculture,
to the exploitation of the wild living resources inhabiting these ecosystems. Wrong agriculture
practices in the surrounding areas, including deforestation, industry and domestic waste
disposal are the most important human activities inducing drastic changes in many freshwater
environments. Water pollution by industrial and domestic sewage, eutrophication, silting,
acidification and heated waters are some of the consequences of those activities. These
activities commonly reduce the abundance and diversity of plants and animals. Hence, local
communities traditionally exploiting living resources, mainly fishes, as mayor source of food,
are often affected. The magnitude of this impact depends on the level of contamination of
rivers, wetland and open waters. Surprisingly, freshwater habitats will respond positively to
sensible management procedures aimed at restoration, although for exploited peat-lands
recovery may be extremely slow (Maitland & Morgan, 1997). Buffer zones surrounding the
main water bodies declared, protected areas under different categories (e.g. nature reserves,
biosphere reserves), management plans and monitoring programs are some of the mechanism
for the protection and management of the fresh water environment and their living resources.
Freshwater habitats have traditionally been divided into two major types as wetlands
(including peatlands) and open water. They are very variables in character, ranging from
running (rivers) to standing waters (lakes), through alkaline marshlands to acid peat bogs,
mountain trickles to major rivers and small puddles to deep lakes (Maitland & Morgan, 1997).
Lakes are closed systems consisting of a defined body of water and ecologically stable
relative to rivers (Welcomme et al., 2010). Standing water or lakes have been classified
according to the type of origin, physical (especially thermal), chemical and biological
characteristics, being these characteristic extremely variable.
PhD-Thesis Fishery ecology, reproduction and management General introduction
28
Lakes have ecological, economic and social importance. Ecologically, lakes moderate
temperatures influencing the climate of the surrounding areas. As water reservoirs help to
regulate stream flows, recharge ground water aquifers and moderate droughts. Lakes provide
habitat to aquatic and semiaquatic plants and animals, which in turn provide food for many
terrestrial animals. In catchment basin where precipitation is greater than evaporation, lakes
have an outlet from which water eventually flow to the sea. In lakes of tropical areas light
levels and temperature do not vary much, and depth is one of the most important parameter
influencing the ecosystem, because on it depend the proportion of the lake´s volume that
receives solar radiation (Maitland & Morgan, 1997). In relation to light penetration the lakes
water column is divided in photic or euphotic and aphotic zone or region (Brönmark &
Hansson, 2005), being the first the most important since it is exposed to sufficient sunlight for
photosynthesis to occur and most living life occur too. The transparency of the water depends
on the depth of the photic zone, which may be altered by the amount of sediment entering in
the system. Ecological changes in water bodies due to introduction of exotic freshwater fish
species have been observed in lakes, particularly damaging, causing the extinction of native
fish species mainly through predation among other mechanism (Cowx, 1998; 1999).
Inland fisheries production has increased from 9.8 million tonnes in 2006 to 11.5 million
tonnes in 2011 (FAO, 2012), this last representing 12.7 % of total fishery production of the
world. However, consistently it is pointed out the constraints of poor quality statistics and
information available for inland water fisheries. In spite of the reported increasing production
it is known that the degree of fisheries resource utilization differs greatly from lake to lake
and according to two main types of fisheries: demersal/inshore and pelagic/offshore.
Currently, the demersal/inshore resources are heavily exploited or overexploited and this fact
contribute to the overall perception that inland fisheries are not sustainable because catches
are allegedly falling, species are disappearing and many other symptoms of chronic
overfishing are reported (Welcomme et al., 2010). Inland fisheries has a great impact in local
economic since it provide income to hundreds of millions household. This fisheries have
diversified in proper fisheries for commercial purposes and recreational for tourist
development. These fisheries are generally characterized by small-scale/household-based
activities and have immense importance as sources of food and employment within
undeveloped rural communities.
PhD-Thesis Fishery ecology, reproduction and management General introduction
29
The Lake Nicaragua or Cocibolca is a vast freshwater of tectonic origin (Hayes, 1899)
and an important biological diversity. It is the largest lake in Central America with a total
surface of 8 000 km2 at 31.40 meters above sea level (mean altitude), the 9th largest in the
Americas and the 19th largest lake in the world. The Lake Nicaragua is slightly smaller than
Lake Titicaca located between Bolivia and Peru. The lake is oval shaped which the length of
major axis is 160 km, maximum width of 70 km, maximum depth is approximately 45 meters
with an average of approximately 13 m (Montenegro-Guillén, 2003).
The Lake Nicaragua has been recognised as a continental water body with an important
source of fish living resources for the fishery sector (Davies & Pierce, 1972), but its
dimension become very attractive for aquaculture development also, since a tilapia cultivation
project was installed in Lake Nicaragua around year 2000 (NICANOR, 2000) and some
attempt have been made to develop similar project in another areas of the lake. However, it
contrasts with the fact that some species are over-exploited and some others are in risk, if
management measures are not taken (Thorson, 1982; Adams et al., 2006).
1.2. The Lake Nicaragua ecosystem and environmental condition
The central mountain chain permits the definition of an eastern region with a tropical rain
forest with rainfall between 4,000 and 6,000 mm per year; a western zone or tropical
savannah region located in the drainage area of Lake Nicaragua, with rainfall ranging from
700 to 2,500 mm but with a very marked dry season; and an intermediate region with rainfall
of more than 2,500 mm and without a marked dry season (PENUMA-OEA, 1997). The
waters of the Lake Nicaragua-San Juan River drainage basin, flow through at least eight
distinct terrestrial ecosystems (Figure 1): 1. dry tropical forest to the east, north, and west of
Lake Nicaragua; 2. cloud forest in the high areas of the Central Volcanic Cordillera of Costa
Rica; 3. moist tropical forest to the south and southwest of Lake Nicaragua and in the eastern
foothills; 4. very moist tropical forest in the San Juan Valley and on the coastal plains; 5.
gallery forest along river banks; 6. wetlands to the south of Lake Nicaragua and at the
confluences of the Colorado and Tortuguero rivers with the San Juan; 7. second-growth
forest, meadows, and agricultural land in extensive areas of the basin; and 8. coastal forest
and mangrove swamps on the Caribbean coast (Montenegro-Guillén, 2003). The absence of
PhD-Thesis Fishery ecology, reproduction and management General introduction
30
physical-chemical and chlorophyll-a stratification indicates it is a polymictic lake, i.e., there is
mixed water from top to bottom, and the Carlson´s trophic state index calculation indicates it
is eutrophic, with a tendency to lower its water quality (PROCUENCA-SAN JUAN, 2004).
The eutrophic condition is referred to lakes nutrient-rich, usually shallow, turbid that may
have an oxygen deficiency in deeper water at some times of the year (Maitland & Morgan,
1997). Changes in water quality are the major drivers of lake ecology and shifts in water
transparency, dissolved oxygen regimes and resident organisms occur with nutrient
enrichment (Welcomme et al., 2010).
Figure 1. Map of the Lake Nicaragua basin and regions. Tributary rives and San Juan River drainage basin to the
Caribbean Sea.
In tropical areas where Lake Nicaragua is located predominate two well defined seasons
as wet or rainy season (winter season) from May to October and the summer season or dry
season from November to April. During rainy season in 2005 the average precipitations in the
area of the Lake Nicaragua, registered from three meteorological stations (Table 1), ranged
from 286.3 mm in May to a maximum of 368.4 mm in October. On the other hand, the dry
season is characterized by low and very low precipitations (Table 1). The Lake Nicaragua is
affected by strong winds, especially during the months from January to May. These winds
generally blow from east to west causing any thermal stratification to disappear. Bottom
PhD-Thesis Fishery ecology, reproduction and management General introduction
31
sediments become suspended and this, coupled with the usually high plankton production,
causes a low transparency. These winds also make transportation difficult for the few vessels
that operate on the lakes. Small fishing vessels, less than 5 m in length, can operate only in
protected areas during this time of year (Davies & Pierce, 1972).
Table 1. Registered data of monthly precipitation in millimetres (mm) during the year 2005-2006, from three
meteorological stations around the Lake Nicaragua: Data source Instituto Nicaragüense de Estudios Territoriales
-INETER 2006.
The Lake Nicaragua collect water from a catchment area of 15,844 km2, of these, 11,693
km2 (74%) are on Nicaragua, and 4,151 km2 (26 %) on Costa Rica. The total water volume is
approximately 104,000 hm3. Rainfall in the catchment varies from averages of 1200 mm per
year in the northwest, at Malacatoya to 4000 mm per year in the southeast at Rio Frío in Costa
Rica (Montenegro-Guillén, 2003). The outflow is allocated at San Carlos, through San Juan
River. The Lake Nicaragua subsystem receives contributions from numerous rivers that tend
to be short in length, especially in the western versant. The rivers located toward the north of
Lake Nicaragua are intermittent, only run in the rainy season. Towards the south they become
permanent, given the greater amount of rainfall. The most important rivers of the eastern
versant are Malacatoya, Tecolostote, Mayales, Acoyapa, Oyate, Camastro, and Tule. Those of
the eastern versant are minimally developed, and those of the southern versant, which
originate in Costa Rica, are relatively developed; the most important being the Frío, Sapoá,
and Zapote Rivers. The San Juan River (SJR) constitutes Lake Nicaragua's only outlet, it
empties into the Caribbean Sea approximately 476.6 m3/s at two points through the so-called
Laguna de San Juan del Norte in Nicaragua and through the Colorado River in Costa Rica.
These two are separated by approximately 20 km (PNUMA-OEA, 1997).
Meteorological station Jan Feb Mar Apr May Jun Jul Aug Sep Oct Nov Dec
Station: San Carlos / San Carlos - Code: 69 090Latitud: 11° 07´42" NLongitud: 84° 46´36" WLevel: 40 msnm; Type: HMP 45.8 30.3 15.5 11.1 261.6 284.3 232.5 394.5 284.2 203.4 153.5 72.6
Station: Juigalpa / Juigalpa - Code: 69 034Latitud: 12° 06´00" NLongitud: 85° 22´ 00" WLevel: 90 msnm; Type: HMP 2.2 0.1 2.5 19 214.1 313.7 185.2 248.1 183.6 402.5 49.7 49.7
Station: Rivas / Rivas - Code: 69 070Latitud: 11° 26´06" NLongitud: 85° 50´ 00" WLevel: 70 msnm; Type: HMP 3.4 0.2 0.8 8.9 383.3 349.7 197.8 193.4 312.9 499.2 114 23.2Average precipitation (mm)on the Lake Nicaragua 17.1 10.2 6.3 13.0 286.3 315.9 205.2 278.7 260.2 368.4 105.7 48.5
Year 2005 /Months
0
50
100
150
200
250
300
350
400
J F M A M J J A S O N D
Prec
ipita
tion
(mm
)
Month
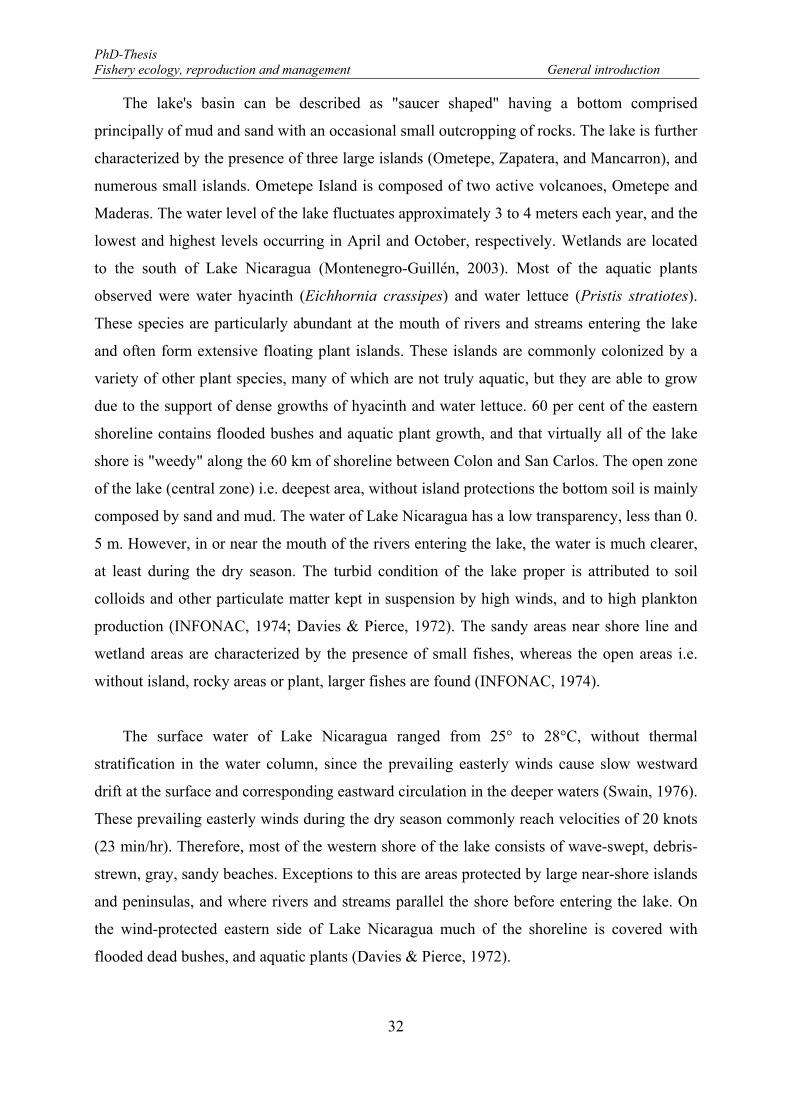
PhD-Thesis Fishery ecology, reproduction and management General introduction
32
The lake's basin can be described as "saucer shaped" having a bottom comprised
principally of mud and sand with an occasional small outcropping of rocks. The lake is further
characterized by the presence of three large islands (Ometepe, Zapatera, and Mancarron), and
numerous small islands. Ometepe Island is composed of two active volcanoes, Ometepe and
Maderas. The water level of the lake fluctuates approximately 3 to 4 meters each year, and the
lowest and highest levels occurring in April and October, respectively. Wetlands are located
to the south of Lake Nicaragua (Montenegro-Guillén, 2003). Most of the aquatic plants
observed were water hyacinth (Eichhornia crassipes) and water lettuce (Pristis stratiotes).
These species are particularly abundant at the mouth of rivers and streams entering the lake
and often form extensive floating plant islands. These islands are commonly colonized by a
variety of other plant species, many of which are not truly aquatic, but they are able to grow
due to the support of dense growths of hyacinth and water lettuce. 60 per cent of the eastern
shoreline contains flooded bushes and aquatic plant growth, and that virtually all of the lake
shore is "weedy" along the 60 km of shoreline between Colon and San Carlos. The open zone
of the lake (central zone) i.e. deepest area, without island protections the bottom soil is mainly
composed by sand and mud. The water of Lake Nicaragua has a low transparency, less than 0.
5 m. However, in or near the mouth of the rivers entering the lake, the water is much clearer,
at least during the dry season. The turbid condition of the lake proper is attributed to soil
colloids and other particulate matter kept in suspension by high winds, and to high plankton
production (INFONAC, 1974; Davies & Pierce, 1972). The sandy areas near shore line and
wetland areas are characterized by the presence of small fishes, whereas the open areas i.e.
without island, rocky areas or plant, larger fishes are found (INFONAC, 1974).
The surface water of Lake Nicaragua ranged from 25° to 28°C, without thermal
stratification in the water column, since the prevailing easterly winds cause slow westward
drift at the surface and corresponding eastward circulation in the deeper waters (Swain, 1976).
These prevailing easterly winds during the dry season commonly reach velocities of 20 knots
(23 min/hr). Therefore, most of the western shore of the lake consists of wave-swept, debris-
strewn, gray, sandy beaches. Exceptions to this are areas protected by large near-shore islands
and peninsulas, and where rivers and streams parallel the shore before entering the lake. On
the wind-protected eastern side of Lake Nicaragua much of the shoreline is covered with
flooded dead bushes, and aquatic plants (Davies & Pierce, 1972).
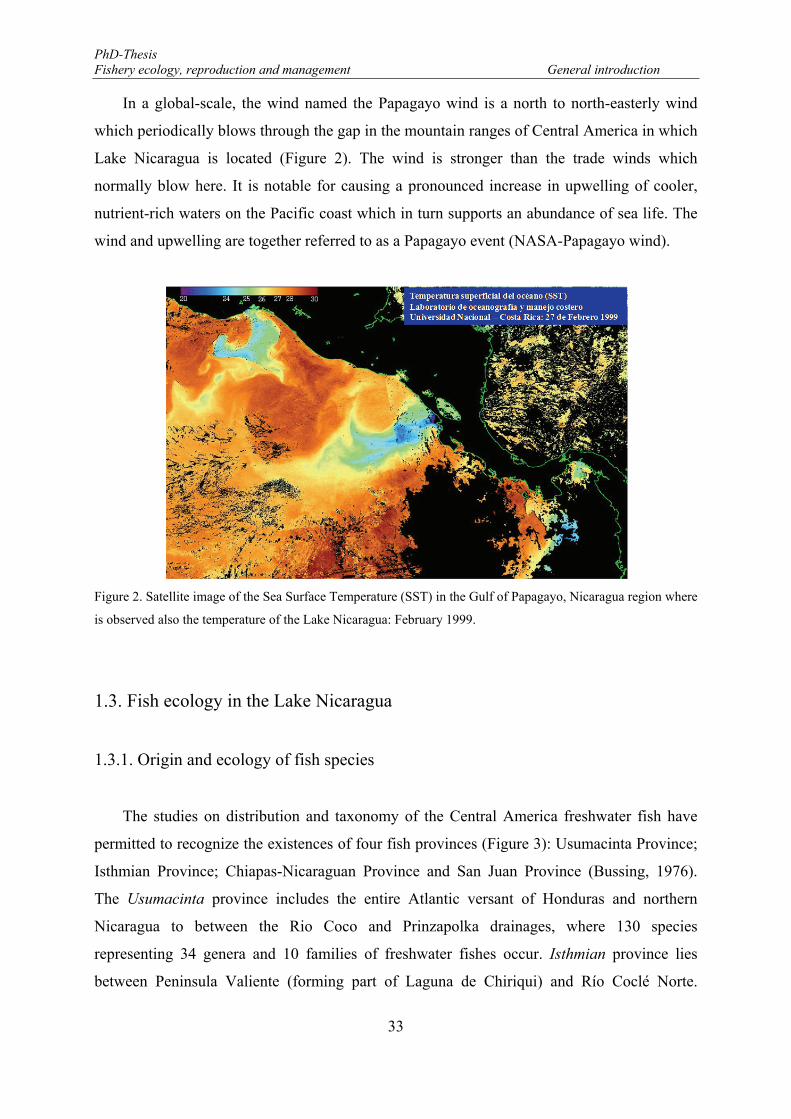
PhD-Thesis Fishery ecology, reproduction and management General introduction
33
In a global-scale, the wind named the Papagayo wind is a north to north-easterly wind
which periodically blows through the gap in the mountain ranges of Central America in which
Lake Nicaragua is located (Figure 2). The wind is stronger than the trade winds which
normally blow here. It is notable for causing a pronounced increase in upwelling of cooler,
nutrient-rich waters on the Pacific coast which in turn supports an abundance of sea life. The
wind and upwelling are together referred to as a Papagayo event (NASA-Papagayo wind).
Figure 2. Satellite image of the Sea Surface Temperature (SST) in the Gulf of Papagayo, Nicaragua region where
is observed also the temperature of the Lake Nicaragua: February 1999.
1.3. Fish ecology in the Lake Nicaragua
1.3.1. Origin and ecology of fish species
The studies on distribution and taxonomy of the Central America freshwater fish have
permitted to recognize the existences of four fish provinces (Figure 3): Usumacinta Province;
Isthmian Province; Chiapas-Nicaraguan Province and San Juan Province (Bussing, 1976).
The Usumacinta province includes the entire Atlantic versant of Honduras and northern
Nicaragua to between the Rio Coco and Prinzapolka drainages, where 130 species
representing 34 genera and 10 families of freshwater fishes occur. Isthmian province lies
between Peninsula Valiente (forming part of Laguna de Chiriqui) and Río Coclé Norte.
PhD-Thesis Fishery ecology, reproduction and management General introduction
34
Unlike the Atlantic slope boundary of the Isthmian Province, which represents a biological
filter-barrier created by a merging of discrete faunas over a rather monotonous physical
environment, the isthmian assemblage reaches an exceptionally sharp terminus on the Pacific
slope at Punta Mala (Punta Judas), Costa Rica. Just north of this point several coastal ranges
extend to the sea creating an impressive physical barrier that eliminates the coastal swamp
environment as a dispersal route for freshwater species. 97 species representing 51 genera and
12 families of freshwater fishes occur in the Isthmian Province. The Chiapas-Nicaraguan
Province extends from north of the Punta Mala promontory to mid Pacific Costa Rica; this
narrow Pacific coastal plain receives much less rainfall than southern Costa Rica or the
Atlantic lowlands. Depauperate as it is, endemism is marked and several species are
autochthonous. Forty-five species representing 18 genera and 9 families of freshwater fishes
occur in the region. It must be pointed out however, that at least 14 of the 45 known species
are primarily Atlantic forms that have gained access to the Pacific slope through several
dispersal routes in the southern part of the province. Finally, the San Juan province includes
the Atlantic slope drainage basin from the Rio Prinzapolka, Nicaragua to the Golfo de los
Mosquitos in western Panama (Figure 3). The Nicaraguan freshwater fishes were assigned to
this province. 54 species representing 25 genera and families of freshwater fishes occur in the
San Juan Province. Species of marine affinity (most of which are presumably euryhaline), are
recorded in freshwaters in the province, number at least 84 species. The greatest diversity is
found in the San Juan drainage itself where 46 freshwater species occur. Thirty-two of these
species are found in the Lakes Nicaragua proper (Table 2). Nine species of marine affinity are
reported to enter in the lake (Table 2). Additionally fourteen non-lake species typical from
San Juan River have been collected in affluent to the lake or tributaries of the Rio San Juan.
Some of these, especially those found in lakes affluent, probably occur from time to time in
the lake.
Fish reproduction and breeding areas of more studied species are diverse e.g. for cichlids,
the most representative family in the lake, rocky areas conform suitable environments for both
reproduction and breeding (McKaye, 1977; Olfield, McCrary & McKaye, 2006), whereas
sand depressions are suitable habitats for spawning on cichlids like Hypsophrys (Conkel,
1993). For other migratory species as B guatemalensis, which exhibit potamodromous
migration, recruitment have been identified along the San Juan River drainage
(PROCUENCA-SAN JUAN, 2004), whereas spawning areas are mentioned to occur
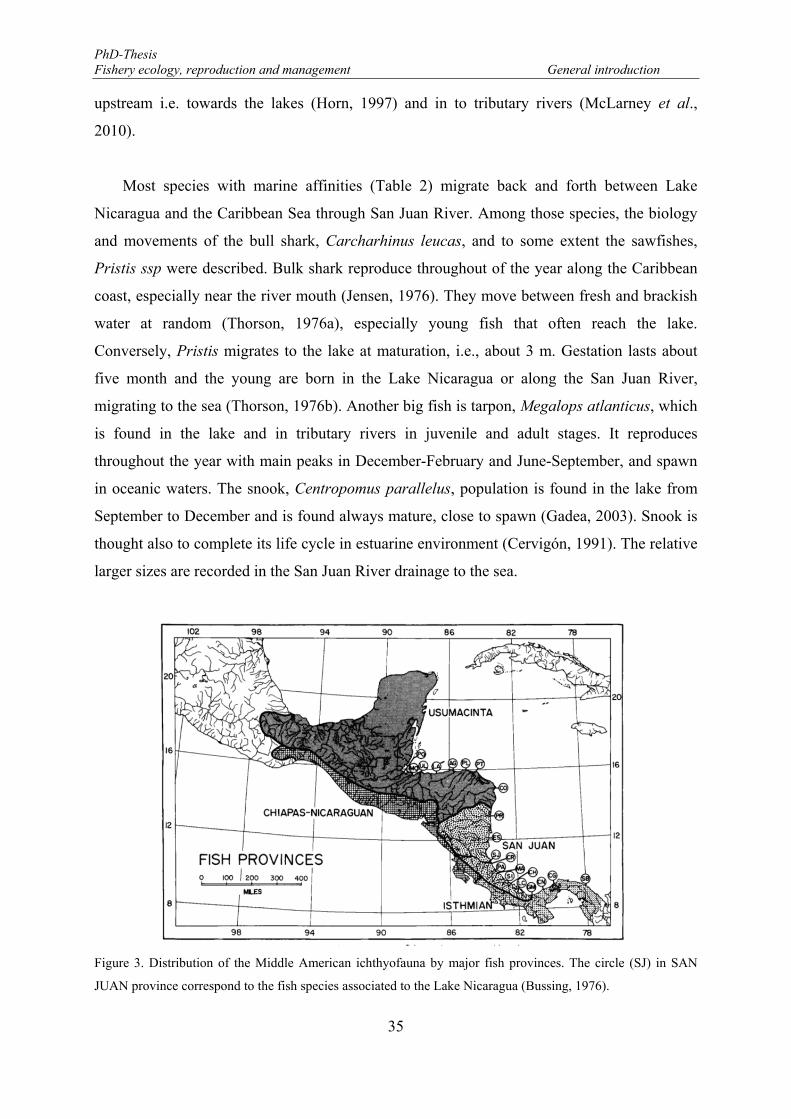
PhD-Thesis Fishery ecology, reproduction and management General introduction
35
upstream i.e. towards the lakes (Horn, 1997) and in to tributary rivers (McLarney et al.,
2010).
Most species with marine affinities (Table 2) migrate back and forth between Lake
Nicaragua and the Caribbean Sea through San Juan River. Among those species, the biology
and movements of the bull shark, Carcharhinus leucas, and to some extent the sawfishes,
Pristis ssp were described. Bulk shark reproduce throughout of the year along the Caribbean
coast, especially near the river mouth (Jensen, 1976). They move between fresh and brackish
water at random (Thorson, 1976a), especially young fish that often reach the lake.
Conversely, Pristis migrates to the lake at maturation, i.e., about 3 m. Gestation lasts about
five month and the young are born in the Lake Nicaragua or along the San Juan River,
migrating to the sea (Thorson, 1976b). Another big fish is tarpon, Megalops atlanticus, which
is found in the lake and in tributary rivers in juvenile and adult stages. It reproduces
throughout the year with main peaks in December-February and June-September, and spawn
in oceanic waters. The snook, Centropomus parallelus, population is found in the lake from
September to December and is found always mature, close to spawn (Gadea, 2003). Snook is
thought also to complete its life cycle in estuarine environment (Cervigón, 1991). The relative
larger sizes are recorded in the San Juan River drainage to the sea.
Figure 3. Distribution of the Middle American ichthyofauna by major fish provinces. The circle (SJ) in SAN
JUAN province correspond to the fish species associated to the Lake Nicaragua (Bussing, 1976).
PhD-Thesis Fishery ecology, reproduction and management General introduction
36
1.3.2. Species diversity
Based on the application of Shannon-Weiner diversity index and the specie evenness
ratio, two demersal fish habitats were defined in the central area of Lake Nicaragua: the
shallow benthic and the deep benthic, which extended from 3.66 to 9.14 meters and 12.8 to
16.46 meters, respectively (Koenig, Beatty & Martínez, 1976). But also a transition zone
between the two distinct habitats and even a possible third discrete habitat were identified (op.
cit). The “shallow benthic” habitat, which has a higher index of species diversity, is
dominated by Dorosoma chavesi. In decreasing order of biomass are Cichlasoma longimanus,
Cichlasoma citrinellum, Lepisosteus tropicus, Cichlasoma centrarchus, Bramocharax
bransfordi, Neetroplus nematopus and Brycon guatemalensis. In the transition zone,
Cichlasoma nicaraguense and Roeboides guatemalensis, at 10.98 m, are present at greatest
proportions, and the “deep benthic” habitat is dominated by Rhamdia spp. The same study
also indicates that shoreline, midwater and rocky zones of the lake probably represent distinct
habitats from that of the open water.
Some of the listed species (Table 2) are actually included in IUCN red list (International
Union for Conservation of Nature), because have been overexploited in the lake, such is the
case of large-tooth sawfish Pristis pectinatus and Pristis perotteti which are in the category of
“critically endangered -CR”, and Bull shark Carcharhinus leucas included in the category of
“near threatened -NT” (Adams et al., 2006). The principal threat to all sawfishes and bull
shark was the fisheries, both targeted and by-catch. Some of the conservation actions imposed
was a temporary moratorium on targeted fishing for sawfishes in Lake Nicaragua in the early
1980s (Thorson, 1982), after the population collapsed following intensive fishing in the
1970s. The aim was to allow the population to recover, but no such recovery has occurred
(McDavitt, 2002). In the last decade another fish species has showed some sign of over-
exploitation as Gaspar, Atractosteus tropicus, therefore in 1998 was enacted a management
measure in which it was established a “closed season” for this species. However, Hernández-
Portocarrero & Saborido-Rey (2007) indicated the low abundance of Gaspar and
recommended two year as temporary moratorium for its fishery. Recently, in 2008 were
included in the national regulations the “closed seasons” for four new fish species (Table 3)
because those have being considered necessary to be protected (Normas Jurídicas de
Nicaragua, 2008).
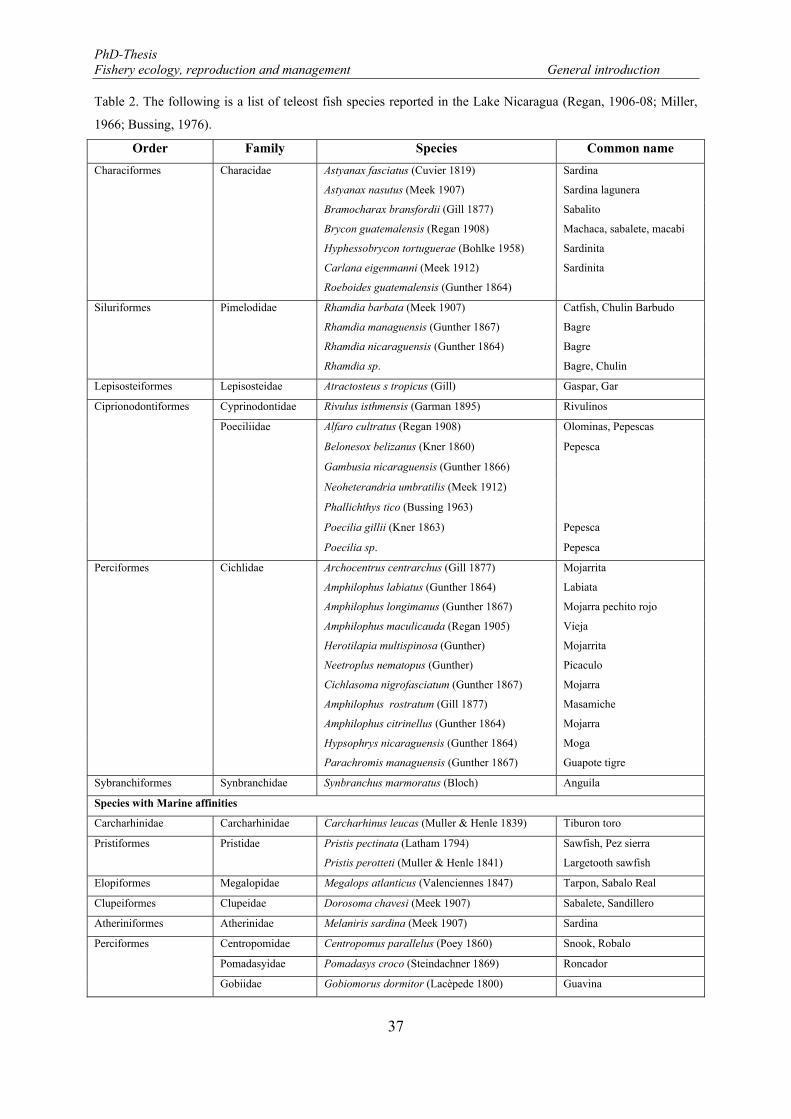
PhD-Thesis Fishery ecology, reproduction and management General introduction
37
Table 2. The following is a list of teleost fish species reported in the Lake Nicaragua (Regan, 1906-08; Miller,
1966; Bussing, 1976).
Order Family Species Common name
Characiformes Characidae Astyanax fasciatus (Cuvier 1819) Sardina
Astyanax nasutus (Meek 1907) Sardina lagunera
Bramocharax bransfordii (Gill 1877) Sabalito
Brycon guatemalensis (Regan 1908) Machaca, sabalete, macabi
Hyphessobrycon tortuguerae (Bohlke 1958) Sardinita
Carlana eigenmanni (Meek 1912) Sardinita
Roeboides guatemalensis (Gunther 1864)
Siluriformes Pimelodidae Rhamdia barbata (Meek 1907) Catfish, Chulin Barbudo
Rhamdia managuensis (Gunther 1867) Bagre
Rhamdia nicaraguensis (Gunther 1864) Bagre
Rhamdia sp. Bagre, Chulin
Lepisosteiformes Lepisosteidae Atractosteus s tropicus (Gill) Gaspar, Gar
Ciprionodontiformes Cyprinodontidae Rivulus isthmensis (Garman 1895) Rivulinos
Poeciliidae Alfaro cultratus (Regan 1908) Olominas, Pepescas
Belonesox belizanus (Kner 1860) Pepesca
Gambusia nicaraguensis (Gunther 1866)
Neoheterandria umbratilis (Meek 1912)
Phallichthys tico (Bussing 1963)
Poecilia gillii (Kner 1863) Pepesca
Poecilia sp. Pepesca
Perciformes Cichlidae Archocentrus centrarchus (Gill 1877) Mojarrita
Amphilophus labiatus (Gunther 1864) Labiata
Amphilophus longimanus (Gunther 1867) Mojarra pechito rojo
Amphilophus maculicauda (Regan 1905) Vieja
Herotilapia multispinosa (Gunther) Mojarrita
Neetroplus nematopus (Gunther) Picaculo
Cichlasoma nigrofasciatum (Gunther 1867) Mojarra
Amphilophus rostratum (Gill 1877) Masamiche
Amphilophus citrinellus (Gunther 1864) Mojarra
Hypsophrys nicaraguensis (Gunther 1864) Moga
Parachromis managuensis (Gunther 1867) Guapote tigre
Sybranchiformes Synbranchidae Synbranchus marmoratus (Bloch) Anguila
Species with Marine affinities
Carcharhinidae Carcharhinidae Carcharhinus leucas (Muller & Henle 1839) Tiburon toro
Pristiformes Pristidae Pristis pectinata (Latham 1794) Sawfish, Pez sierra
Pristis perotteti (Muller & Henle 1841) Largetooth sawfish
Elopiformes Megalopidae Megalops atlanticus (Valenciennes 1847) Tarpon, Sabalo Real
Clupeiformes Clupeidae Dorosoma chavesi (Meek 1907) Sabalete, Sandillero
Atheriniformes Atherinidae Melaniris sardina (Meek 1907) Sardina
Perciformes Centropomidae Centropomus parallelus (Poey 1860) Snook, Robalo
Pomadasyidae Pomadasys croco (Steindachner 1869) Roncador
Gobiidae Gobiomorus dormitor (Lacèpede 1800) Guavina
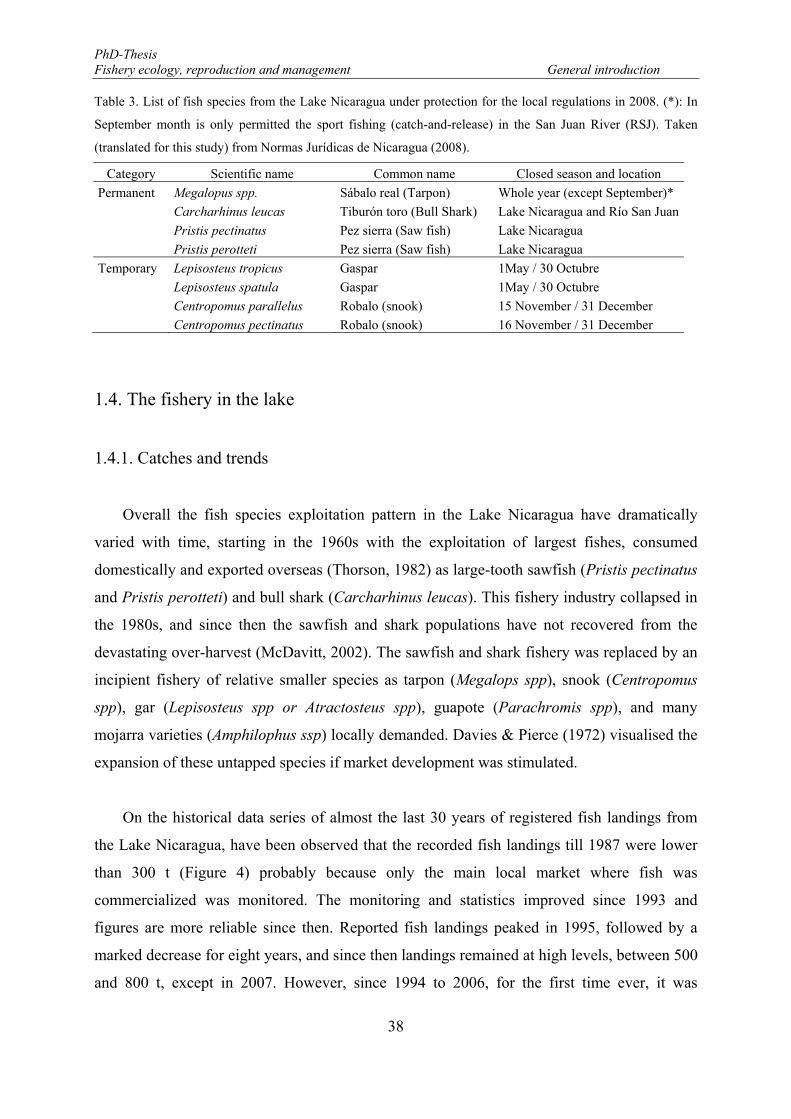
PhD-Thesis Fishery ecology, reproduction and management General introduction
38
Table 3. List of fish species from the Lake Nicaragua under protection for the local regulations in 2008. (*): In
September month is only permitted the sport fishing (catch-and-release) in the San Juan River (RSJ). Taken
(translated for this study) from Normas Jurídicas de Nicaragua (2008).
Category Scientific name Common name Closed season and location
Permanent Megalopus spp. Sábalo real (Tarpon) Whole year (except September)*
Carcharhinus leucas Tiburón toro (Bull Shark) Lake Nicaragua and Río San Juan
Pristis pectinatus Pez sierra (Saw fish) Lake Nicaragua
Pristis perotteti Pez sierra (Saw fish) Lake Nicaragua
Temporary Lepisosteus tropicus Gaspar 1May / 30 Octubre
Lepisosteus spatula Gaspar 1May / 30 Octubre
Centropomus parallelus Robalo (snook) 15 November / 31 December
Centropomus pectinatus Robalo (snook) 16 November / 31 December
1.4. The fishery in the lake
1.4.1. Catches and trends
Overall the fish species exploitation pattern in the Lake Nicaragua have dramatically
varied with time, starting in the 1960s with the exploitation of largest fishes, consumed
domestically and exported overseas (Thorson, 1982) as large-tooth sawfish (Pristis pectinatus
and Pristis perotteti) and bull shark (Carcharhinus leucas). This fishery industry collapsed in
the 1980s, and since then the sawfish and shark populations have not recovered from the
devastating over-harvest (McDavitt, 2002). The sawfish and shark fishery was replaced by an
incipient fishery of relative smaller species as tarpon (Megalops spp), snook (Centropomus
spp), gar (Lepisosteus spp or Atractosteus spp), guapote (Parachromis spp), and many
mojarra varieties (Amphilophus ssp) locally demanded. Davies & Pierce (1972) visualised the
expansion of these untapped species if market development was stimulated.
On the historical data series of almost the last 30 years of registered fish landings from
the Lake Nicaragua, have been observed that the recorded fish landings till 1987 were lower
than 300 t (Figure 4) probably because only the main local market where fish was
commercialized was monitored. The monitoring and statistics improved since 1993 and
figures are more reliable since then. Reported fish landings peaked in 1995, followed by a
marked decrease for eight years, and since then landings remained at high levels, between 500
and 800 t, except in 2007. However, since 1994 to 2006, for the first time ever, it was
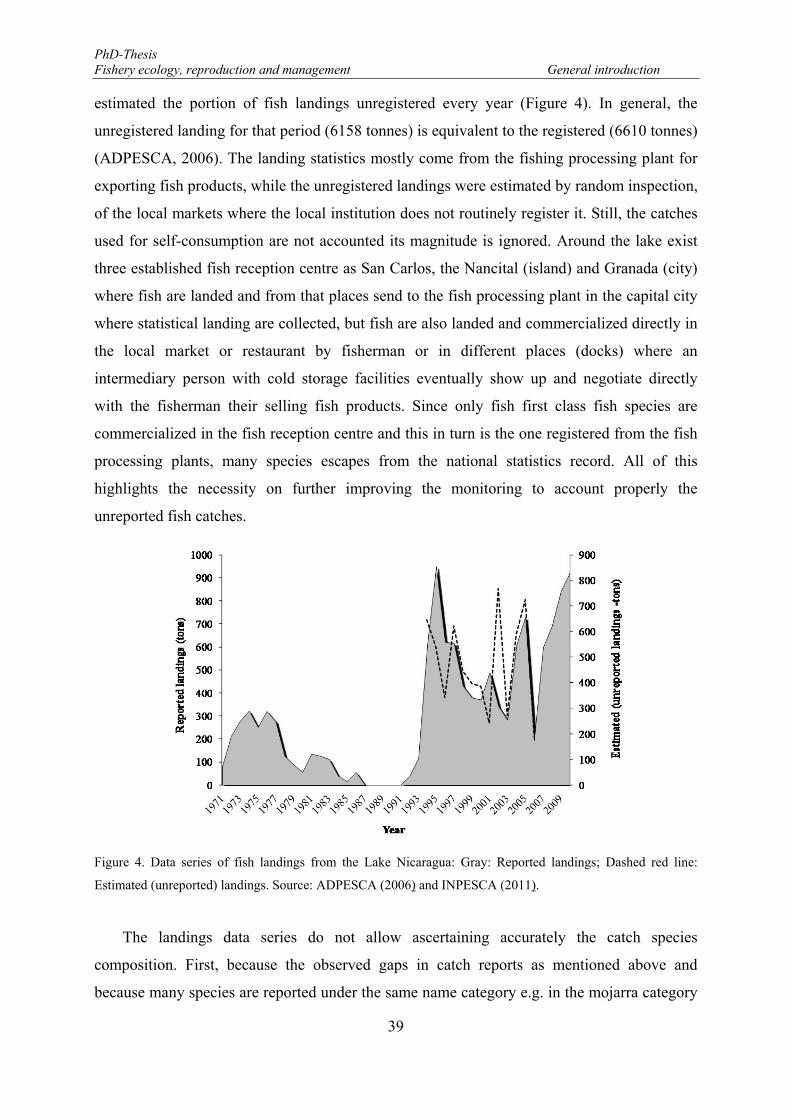
PhD-Thesis Fishery ecology, reproduction and management General introduction
39
estimated the portion of fish landings unregistered every year (Figure 4). In general, the
unregistered landing for that period (6158 tonnes) is equivalent to the registered (6610 tonnes)
(ADPESCA, 2006). The landing statistics mostly come from the fishing processing plant for
exporting fish products, while the unregistered landings were estimated by random inspection,
of the local markets where the local institution does not routinely register it. Still, the catches
used for self-consumption are not accounted its magnitude is ignored. Around the lake exist
three established fish reception centre as San Carlos, the Nancital (island) and Granada (city)
where fish are landed and from that places send to the fish processing plant in the capital city
where statistical landing are collected, but fish are also landed and commercialized directly in
the local market or restaurant by fisherman or in different places (docks) where an
intermediary person with cold storage facilities eventually show up and negotiate directly
with the fisherman their selling fish products. Since only fish first class fish species are
commercialized in the fish reception centre and this in turn is the one registered from the fish
processing plants, many species escapes from the national statistics record. All of this
highlights the necessity on further improving the monitoring to account properly the
unreported fish catches.
Figure 4. Data series of fish landings from the Lake Nicaragua: Gray: Reported landings; Dashed red line:
Estimated (unreported) landings. Source: ADPESCA (2006) and INPESCA (2011).
The landings data series do not allow ascertaining accurately the catch species
composition. First, because the observed gaps in catch reports as mentioned above and
because many species are reported under the same name category e.g. in the mojarra category
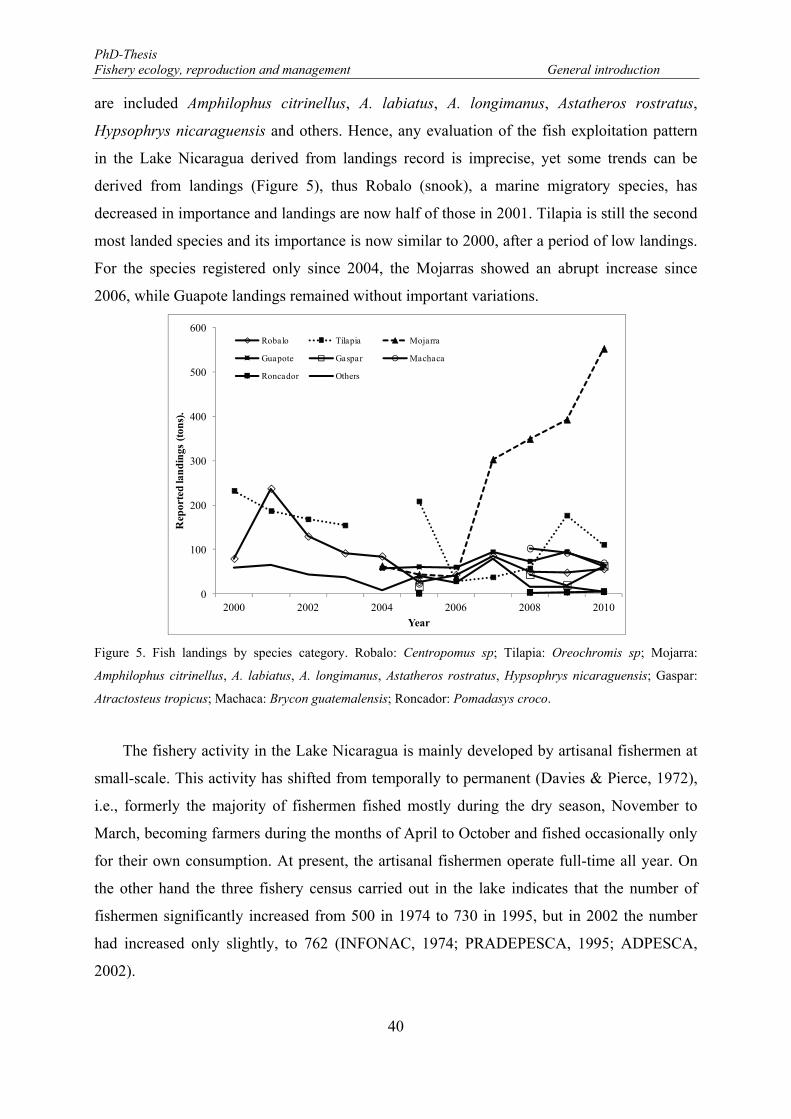
PhD-Thesis Fishery ecology, reproduction and management General introduction
40
are included Amphilophus citrinellus, A. labiatus, A. longimanus, Astatheros rostratus,
Hypsophrys nicaraguensis and others. Hence, any evaluation of the fish exploitation pattern
in the Lake Nicaragua derived from landings record is imprecise, yet some trends can be
derived from landings (Figure 5), thus Robalo (snook), a marine migratory species, has
decreased in importance and landings are now half of those in 2001. Tilapia is still the second
most landed species and its importance is now similar to 2000, after a period of low landings.
For the species registered only since 2004, the Mojarras showed an abrupt increase since
2006, while Guapote landings remained without important variations.
Figure 5. Fish landings by species category. Robalo: Centropomus sp; Tilapia: Oreochromis sp; Mojarra:
Amphilophus citrinellus, A. labiatus, A. longimanus, Astatheros rostratus, Hypsophrys nicaraguensis; Gaspar:
Atractosteus tropicus; Machaca: Brycon guatemalensis; Roncador: Pomadasys croco.
The fishery activity in the Lake Nicaragua is mainly developed by artisanal fishermen at
small-scale. This activity has shifted from temporally to permanent (Davies & Pierce, 1972),
i.e., formerly the majority of fishermen fished mostly during the dry season, November to
March, becoming farmers during the months of April to October and fished occasionally only
for their own consumption. At present, the artisanal fishermen operate full-time all year. On
the other hand the three fishery census carried out in the lake indicates that the number of
fishermen significantly increased from 500 in 1974 to 730 in 1995, but in 2002 the number
had increased only slightly, to 762 (INFONAC, 1974; PRADEPESCA, 1995; ADPESCA,
2002).
0
100
200
300
400
500
600
2000 2002 2004 2006 2008 2010
Rep
orte
d la
nd
ings
(to
ns)
.
Year
Robalo Tilapia Mojarra
Guapote Gaspar Machaca
Roncador Others
PhD-Thesis Fishery ecology, reproduction and management General introduction
41
The artisanal fishery in the Lake Nicaragua is characterized by the use of gillnets under
different modalities: a. set gillnet (passive): this consists of a single netting wall kept more or
less vertical by a floatline and a weighted groundline (FAO, 2013), and the net is set for
several hours on the bottom of the lake and kept stationary by anchors on both ends. This
gillnet type is considered a “passive gears” since fish have to swim into the net to get caught;
b. bag seine (active): consist of a net operated by two fishermen which is placed offshore and
hauled to inshore, the gillnet type is considered an “active gears” since the fishes are corralled
in it; c. Pimponeo (active): the gillnet is set by two small boats and the fishes are induced to
swim in to it hitting the water with a pole producing noise (Agareso, 2010). In some areas of
the lake, this operation can be performed also by one fisherman only. Another fishing gear
used in the lake fishery is hook and line (handline).
1.4.2. Fish stock biomass
During the 70s and 80s decades were carried out the major fisheries-independent surveys
in the coastal and central zone of the Lake Nicaragua where different potentialities and
biomass based on gillnet and trawl net surveys were reported (INFONAC, 1974), as the
fishery production from the artisanal fisheries in the lake that were reported equivalent to 680
tons per year. Based on these studies the distribution and abundance of species, excluding
shallower waters, were mapped estimating a biomass of 50,000 tons and maximum
sustainable yield of 8,000 metric tons (Ketúnin et al., 1983). This estimation increased to
49,000 metric tons when the biomass calculations from gillnet surveys in the coastal areas
from the 1982-1983 studies were included (Orellana, 1986; Table 4). Beyond the referred
biomass of the lake stocks, there has not been made any attempt to assess the state of the
stocks either under exploitation or not.
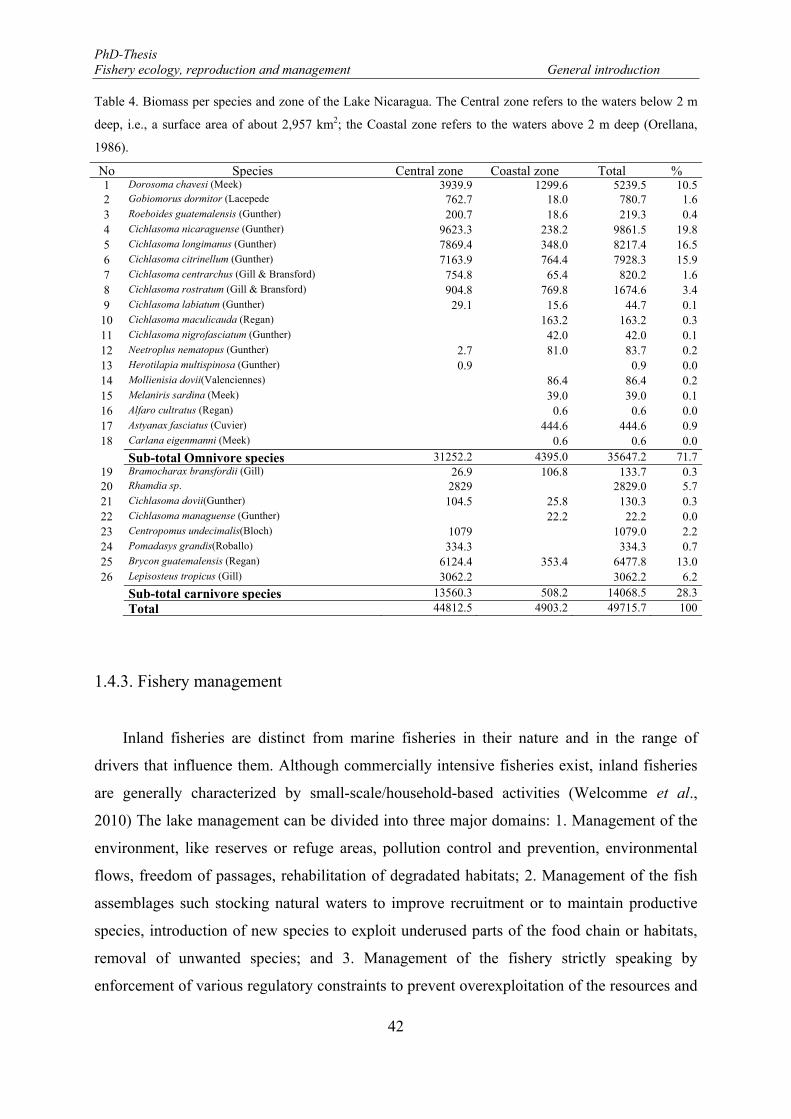
PhD-Thesis Fishery ecology, reproduction and management General introduction
42
Table 4. Biomass per species and zone of the Lake Nicaragua. The Central zone refers to the waters below 2 m
deep, i.e., a surface area of about 2,957 km2; the Coastal zone refers to the waters above 2 m deep (Orellana,
1986).
No Species Central zone Coastal zone Total %1 Dorosoma chavesi (Meek) 3939.9 1299.6 5239.5 10.52 Gobiomorus dormitor (Lacepede 762.7 18.0 780.7 1.63 Roeboides guatemalensis (Gunther) 200.7 18.6 219.3 0.44 Cichlasoma nicaraguense (Gunther) 9623.3 238.2 9861.5 19.85 Cichlasoma longimanus (Gunther) 7869.4 348.0 8217.4 16.56 Cichlasoma citrinellum (Gunther) 7163.9 764.4 7928.3 15.97 Cichlasoma centrarchus (Gill & Bransford) 754.8 65.4 820.2 1.68 Cichlasoma rostratum (Gill & Bransford) 904.8 769.8 1674.6 3.49 Cichlasoma labiatum (Gunther) 29.1 15.6 44.7 0.1
10 Cichlasoma maculicauda (Regan) 163.2 163.2 0.311 Cichlasoma nigrofasciatum (Gunther) 42.0 42.0 0.112 Neetroplus nematopus (Gunther) 2.7 81.0 83.7 0.213 Herotilapia multispinosa (Gunther) 0.9 0.9 0.014 Mollienisia dovii(Valenciennes) 86.4 86.4 0.215 Melaniris sardina (Meek) 39.0 39.0 0.116 Alfaro cultratus (Regan) 0.6 0.6 0.017 Astyanax fasciatus (Cuvier) 444.6 444.6 0.918 Carlana eigenmanni (Meek) 0.6 0.6 0.0
Sub-total Omnivore species 31252.2 4395.0 35647.2 71.719 Bramocharax bransfordii (Gill) 26.9 106.8 133.7 0.320 Rhamdia sp. 2829 2829.0 5.721 Cichlasoma dovii(Gunther) 104.5 25.8 130.3 0.322 Cichlasoma managuense (Gunther) 22.2 22.2 0.023 Centropomus undecimalis(Bloch) 1079 1079.0 2.224 Pomadasys grandis(Roballo) 334.3 334.3 0.725 Brycon guatemalensis (Regan) 6124.4 353.4 6477.8 13.026 Lepisosteus tropicus (Gill) 3062.2 3062.2 6.2
Sub-total carnivore species 13560.3 508.2 14068.5 28.3
Total 44812.5 4903.2 49715.7 100
1.4.3. Fishery management
Inland fisheries are distinct from marine fisheries in their nature and in the range of
drivers that influence them. Although commercially intensive fisheries exist, inland fisheries
are generally characterized by small-scale/household-based activities (Welcomme et al.,
2010) The lake management can be divided into three major domains: 1. Management of the
environment, like reserves or refuge areas, pollution control and prevention, environmental
flows, freedom of passages, rehabilitation of degradated habitats; 2. Management of the fish
assemblages such stocking natural waters to improve recruitment or to maintain productive
species, introduction of new species to exploit underused parts of the food chain or habitats,
removal of unwanted species; and 3. Management of the fishery strictly speaking by
enforcement of various regulatory constraints to prevent overexploitation of the resources and
PhD-Thesis Fishery ecology, reproduction and management General introduction
43
maintain a suitable stock structure e.g. closed season and areas, type gear and landing size of
the fish (Cowx, 1994; 1998; Welcomme et al., 2010). Fisheries management in the Lake
Nicaragua face the same complexity as in many others inland waters, mainly due to the multi-
specific nature of the exploitation. Many species, with different size and shapes are caught
with the same net types, and virtually all species experience a fishing mortality well as target
species or as inevitable by-catches (Sparre & Venema, 1998). At present there is not stock
assessment for any of the exploited stocks in the Lake Nicaragua. Management measures,
such as net mesh size, gillnet length, closed seasons and the limitation of fishery operation
near to the river mouth have responded exclusively to the immediate necessity of reducing the
catches of some key target species, though other species are more abundant in the catches.
This management considers catches of less or non commercial species as by-catch, without
being the case. As a consequence, these regulations, in the line of protecting some targeted
species, expose other species to the risk of being over-fished. On the other hand, target
species changes according to the artisanal fisherman interest, i.e., “what it is considered a
target species for some fishermen group is not for others”, increasing the complexity of
fisheries management.
The enforcements regulatory measures in the Lake Nicaragua are in the line of: i) the
recovery of overexploited fish species as Bull shark, Sawfish and Tarpon (Thorson, 1982;
McDavitt, 2002; Adams et al., 2006); ii) the prevention of overexploitation of Gar (freshwater
species), Snook and Roncador, which are both species of marine affinity (Camacho & Gadea,
2005); and iii) the sustainability of the commercially exploited fisheries resources, at present
days, such as cichlids assemblage (Mojarras, Guapotes), characids (Machaca), gobies
(Guavina) and Bagres (Gadea, 2003; Hernández-Portocarrero & Saborido-Rey, 2007). The
regulations adopted for the lake fisheries range from the prohibition of trawl nets and long
lines in lake basins, and gillnets near to the river mouth or inside the river properly. However,
the biological references point for fisheries resources management have not been set yet in the
lake, since most of those regulatory measures are based only on evaluation of catches
distribution and abundances of the commercially important species, on gillnet selectivity
analysis and on macroscopic determination of two biological parameter as length-at–maturity
and gonad maturity stages (Davies & Pierce, 1972; INFONAC, 1974; Martínez, 1976;
Ketúnin et al., 1983; Orellana, 1986; Gadea, 2003, Hernández-Portocarrero & Saborido-Rey,
2007).
PhD-Thesis Fishery ecology, reproduction and management General introduction
44
At present there is a large gap on knowledge of many other important biological
parameters of the fish species as the dynamic of reproductive behaviour of the population at
intra-specific and inter-specific level, the reproductive cycle, spawning ground, egg
production and the maternal features affecting reproductive output and fitness. This lack of
information prevents the implementation of management actions directed towards the
conservation of stock reproductive potential (Saborido-Rey & Trippel, 2013), such as
regulations on closing season and/or areas, and minimum and maximum landing sizes. Those
biological parameters should be of fundamental importance for the evaluation of the spawning
stock and for better management of the species in the lake. In this study, besides providing
information about actual state of distribution and abundance of Amphilophus citrinellus,
Hypsophrys nicaraguensis, Parachromis managuensis, and Brycon guatemalensis, is
provided information of the reproductive strategy of this last species and proposed some
management alternatives based on its biological features.
1.5. Thesis objectives
The knowledge of the ecology of fish communities and their stocks is necessary for
management purposes, but also this knowledge must be reliable, timely, cost effective and
adequate for its purpose, and based upon appropriate, sound and defensible data (Hickley &
Aprahamian, 2000). The aim of the present work is to develop an appropriate fishery
management tool in the Lake Nicaragua based on biological and ecological knowledge of the
exploited species. To achieve this in this study it is analysed: a) the distribution and relative
abundance of the main species at spatio-temporal scale in function of environmental factors
based in monthly fishery-independent surveys (Chapter 3); b) the reproductive strategy-
related issues applying histological procedures, focusing on the reproductive biology and the
stock reproductive potential using Brycon guatemalensis as study case (Chapter 4); and c) the
impact of the fishing gears on the stock reproductive potential (SRP), determining the most
sensitive and relevant part of the population in terms of productivity to delineate the
management of the fish stocks in the Lake Nicaragua (Chapter 5).
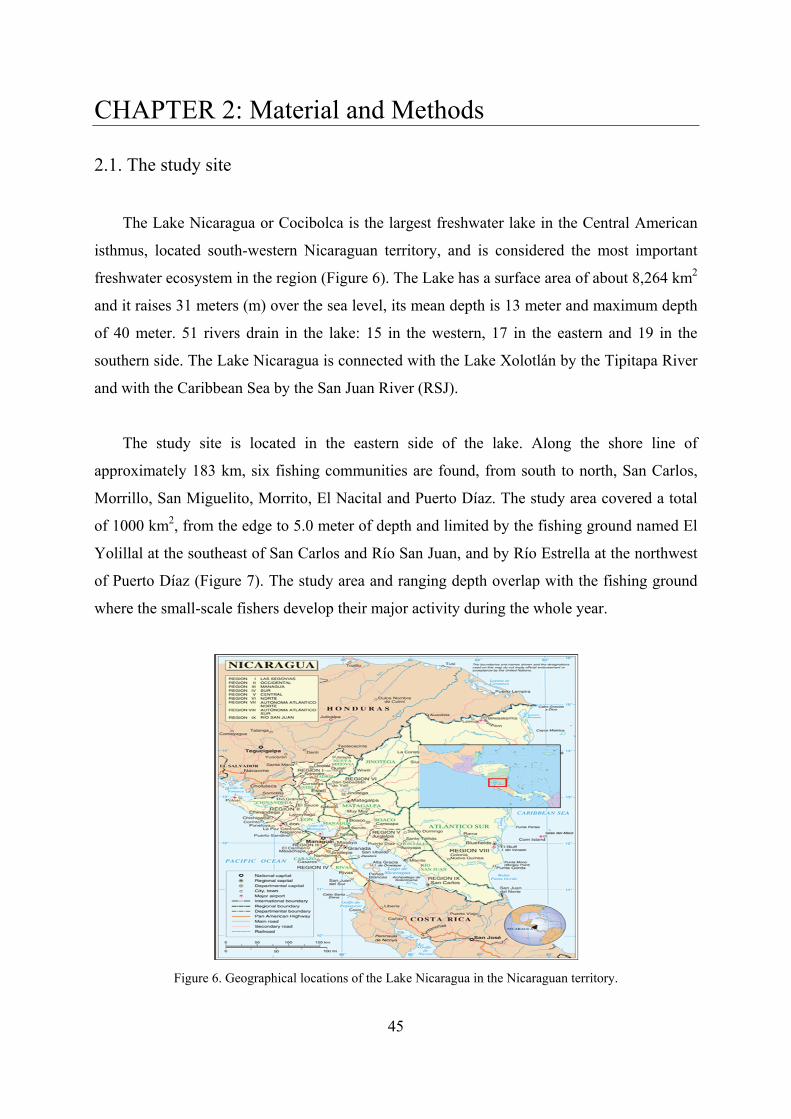
45
CHAPTER 2: Material and Methods
2.1. The study site
The Lake Nicaragua or Cocibolca is the largest freshwater lake in the Central American
isthmus, located south-western Nicaraguan territory, and is considered the most important
freshwater ecosystem in the region (Figure 6). The Lake has a surface area of about 8,264 km2
and it raises 31 meters (m) over the sea level, its mean depth is 13 meter and maximum depth
of 40 meter. 51 rivers drain in the lake: 15 in the western, 17 in the eastern and 19 in the
southern side. The Lake Nicaragua is connected with the Lake Xolotlán by the Tipitapa River
and with the Caribbean Sea by the San Juan River (RSJ).
The study site is located in the eastern side of the lake. Along the shore line of
approximately 183 km, six fishing communities are found, from south to north, San Carlos,
Morrillo, San Miguelito, Morrito, El Nacital and Puerto Díaz. The study area covered a total
of 1000 km2, from the edge to 5.0 meter of depth and limited by the fishing ground named El
Yolillal at the southeast of San Carlos and Río San Juan, and by Río Estrella at the northwest
of Puerto Díaz (Figure 7). The study area and ranging depth overlap with the fishing ground
where the small-scale fishers develop their major activity during the whole year.
Figure 6. Geographical locations of the Lake Nicaragua in the Nicaraguan territory.
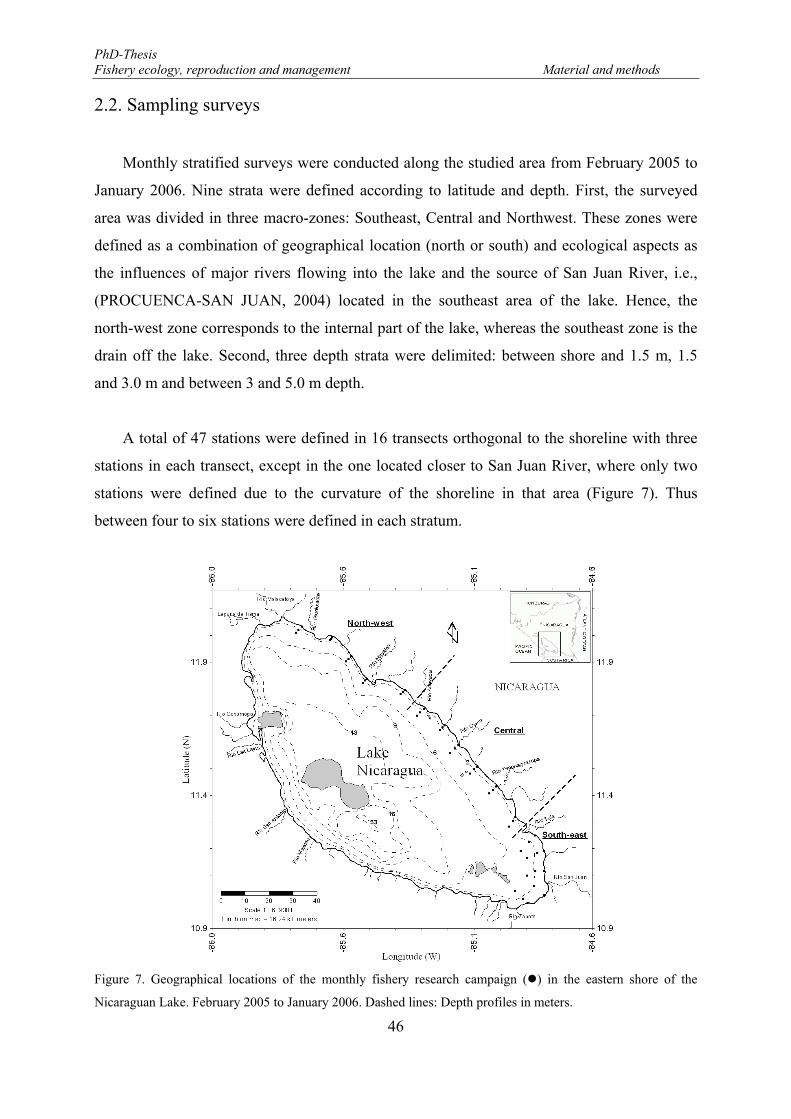
PhD-Thesis Fishery ecology, reproduction and management Material and methods
46
2.2. Sampling surveys
Monthly stratified surveys were conducted along the studied area from February 2005 to
January 2006. Nine strata were defined according to latitude and depth. First, the surveyed
area was divided in three macro-zones: Southeast, Central and Northwest. These zones were
defined as a combination of geographical location (north or south) and ecological aspects as
the influences of major rivers flowing into the lake and the source of San Juan River, i.e.,
(PROCUENCA-SAN JUAN, 2004) located in the southeast area of the lake. Hence, the
north-west zone corresponds to the internal part of the lake, whereas the southeast zone is the
drain off the lake. Second, three depth strata were delimited: between shore and 1.5 m, 1.5
and 3.0 m and between 3 and 5.0 m depth.
A total of 47 stations were defined in 16 transects orthogonal to the shoreline with three
stations in each transect, except in the one located closer to San Juan River, where only two
stations were defined due to the curvature of the shoreline in that area (Figure 7). Thus
between four to six stations were defined in each stratum.
Figure 7. Geographical locations of the monthly fishery research campaign () in the eastern shore of the
Nicaraguan Lake. February 2005 to January 2006. Dashed lines: Depth profiles in meters.
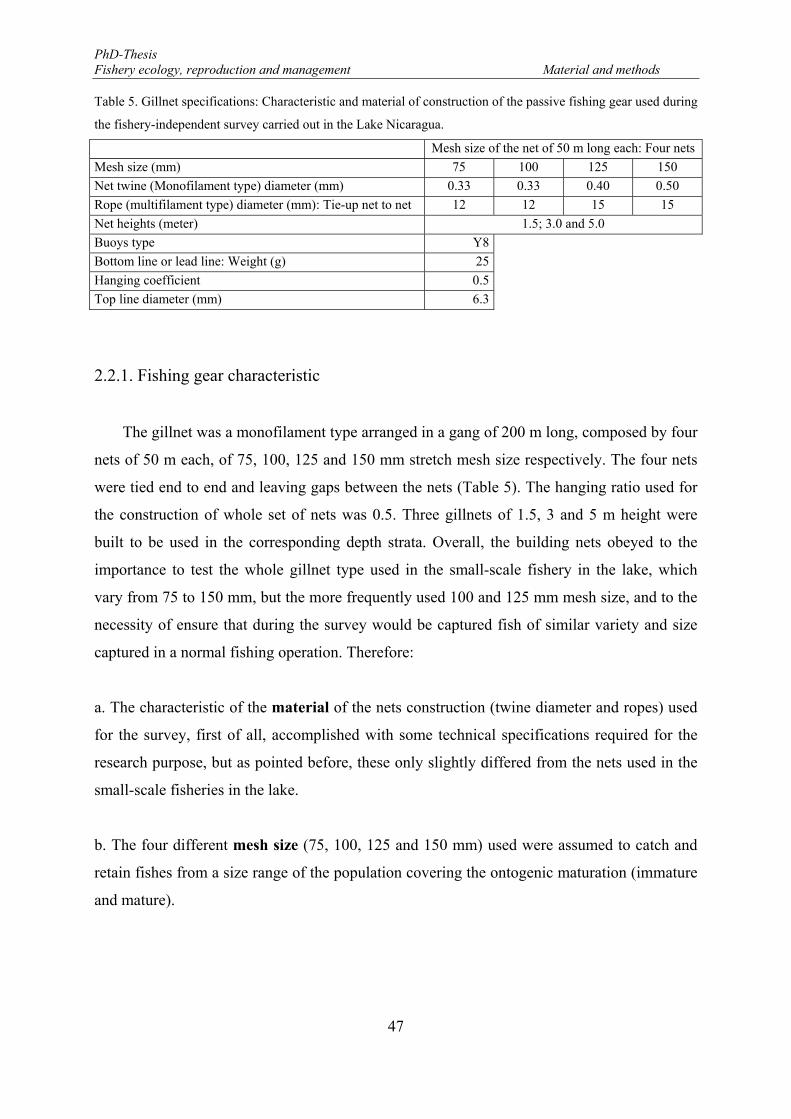
PhD-Thesis Fishery ecology, reproduction and management Material and methods
47
Table 5. Gillnet specifications: Characteristic and material of construction of the passive fishing gear used during
the fishery-independent survey carried out in the Lake Nicaragua.
Mesh size of the net of 50 m long each: Four nets
Mesh size (mm) 75 100 125 150
Net twine (Monofilament type) diameter (mm) 0.33 0.33 0.40 0.50
Rope (multifilament type) diameter (mm): Tie-up net to net 12 12 15 15
Net heights (meter) 1.5; 3.0 and 5.0
Buoys type Y8
Bottom line or lead line: Weight (g) 25
Hanging coefficient 0.5
Top line diameter (mm) 6.3
2.2.1. Fishing gear characteristic
The gillnet was a monofilament type arranged in a gang of 200 m long, composed by four
nets of 50 m each, of 75, 100, 125 and 150 mm stretch mesh size respectively. The four nets
were tied end to end and leaving gaps between the nets (Table 5). The hanging ratio used for
the construction of whole set of nets was 0.5. Three gillnets of 1.5, 3 and 5 m height were
built to be used in the corresponding depth strata. Overall, the building nets obeyed to the
importance to test the whole gillnet type used in the small-scale fishery in the lake, which
vary from 75 to 150 mm, but the more frequently used 100 and 125 mm mesh size, and to the
necessity of ensure that during the survey would be captured fish of similar variety and size
captured in a normal fishing operation. Therefore:
a. The characteristic of the material of the nets construction (twine diameter and ropes) used
for the survey, first of all, accomplished with some technical specifications required for the
research purpose, but as pointed before, these only slightly differed from the nets used in the
small-scale fisheries in the lake.
b. The four different mesh size (75, 100, 125 and 150 mm) used were assumed to catch and
retain fishes from a size range of the population covering the ontogenic maturation (immature
and mature).
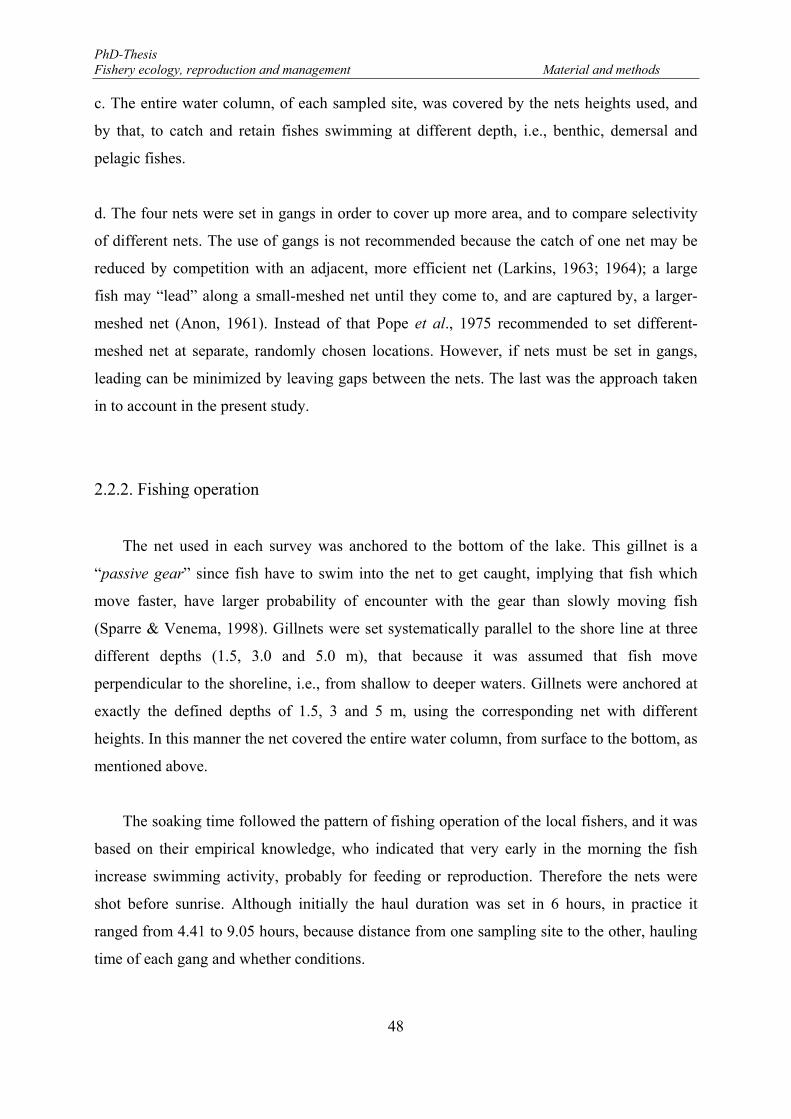
PhD-Thesis Fishery ecology, reproduction and management Material and methods
48
c. The entire water column, of each sampled site, was covered by the nets heights used, and
by that, to catch and retain fishes swimming at different depth, i.e., benthic, demersal and
pelagic fishes.
d. The four nets were set in gangs in order to cover up more area, and to compare selectivity
of different nets. The use of gangs is not recommended because the catch of one net may be
reduced by competition with an adjacent, more efficient net (Larkins, 1963; 1964); a large
fish may “lead” along a small-meshed net until they come to, and are captured by, a larger-
meshed net (Anon, 1961). Instead of that Pope et al., 1975 recommended to set different-
meshed net at separate, randomly chosen locations. However, if nets must be set in gangs,
leading can be minimized by leaving gaps between the nets. The last was the approach taken
in to account in the present study.
2.2.2. Fishing operation
The net used in each survey was anchored to the bottom of the lake. This gillnet is a
“passive gear” since fish have to swim into the net to get caught, implying that fish which
move faster, have larger probability of encounter with the gear than slowly moving fish
(Sparre & Venema, 1998). Gillnets were set systematically parallel to the shore line at three
different depths (1.5, 3.0 and 5.0 m), that because it was assumed that fish move
perpendicular to the shoreline, i.e., from shallow to deeper waters. Gillnets were anchored at
exactly the defined depths of 1.5, 3 and 5 m, using the corresponding net with different
heights. In this manner the net covered the entire water column, from surface to the bottom, as
mentioned above.
The soaking time followed the pattern of fishing operation of the local fishers, and it was
based on their empirical knowledge, who indicated that very early in the morning the fish
increase swimming activity, probably for feeding or reproduction. Therefore the nets were
shot before sunrise. Although initially the haul duration was set in 6 hours, in practice it
ranged from 4.41 to 9.05 hours, because distance from one sampling site to the other, hauling
time of each gang and whether conditions.
PhD-Thesis Fishery ecology, reproduction and management Material and methods
49
2.2.3. Biologic and environmental data recorded
After hauling the nets, the fish caught were carefully removed. Catch was recorded in
numbers by species. The place within the net where the fish was retained was also recorded,
as well the way in which the fish was stuck. The wedged or gilled, fish (Figure 8), which are
the one held tightly by a mesh around the body-girth retained as far as the dorsal fin (Baranov,
1914; Karlsen & Bjarnason, 1986) were separated by mesh sizes of the net. Particularly for
these girth retained fishes, besides collect routine bio-morph-metric information, was
measured their body height between the operculum and first dorsal fins.
Figure 8. Schematic representation of a wedged fish in gillnets as indicated by Karlsen & Bjarnason (1986)
Table 6. Stages of fish sexual maturity used in present study (for field work) for macroscopic observations of
fish gonads, (modified from the maturity scale of Holden & Raitt, 1974).
Stage State Description
III (Included
stages: I, II
and III)
Immature Ovary and testis about 1/3rds to 2/3rds length of body cavity. Ovaries pinkish,
translucent to yellow colour with granular appearance. Testis whitish to creamy.
Eggs not visible to naked eye.
IV Ripe Ovary and testis from 2/3rds to full length of body cavity. Ovary orange-pink in
colour with conspicuous superficial blood vessels. Large transparent, ripe eggs
visible. Testis whitish-creamy, soft.
V Spent Ovary and testis shrunken to about 1/2 length of body cavity. Walls loose. Ovary
may contain remnants of disintegrating opaque and ripe eggs, darkened or
translucent. Testis bloodshot and flabby.
Wedged fish Girthretained
Mesh size
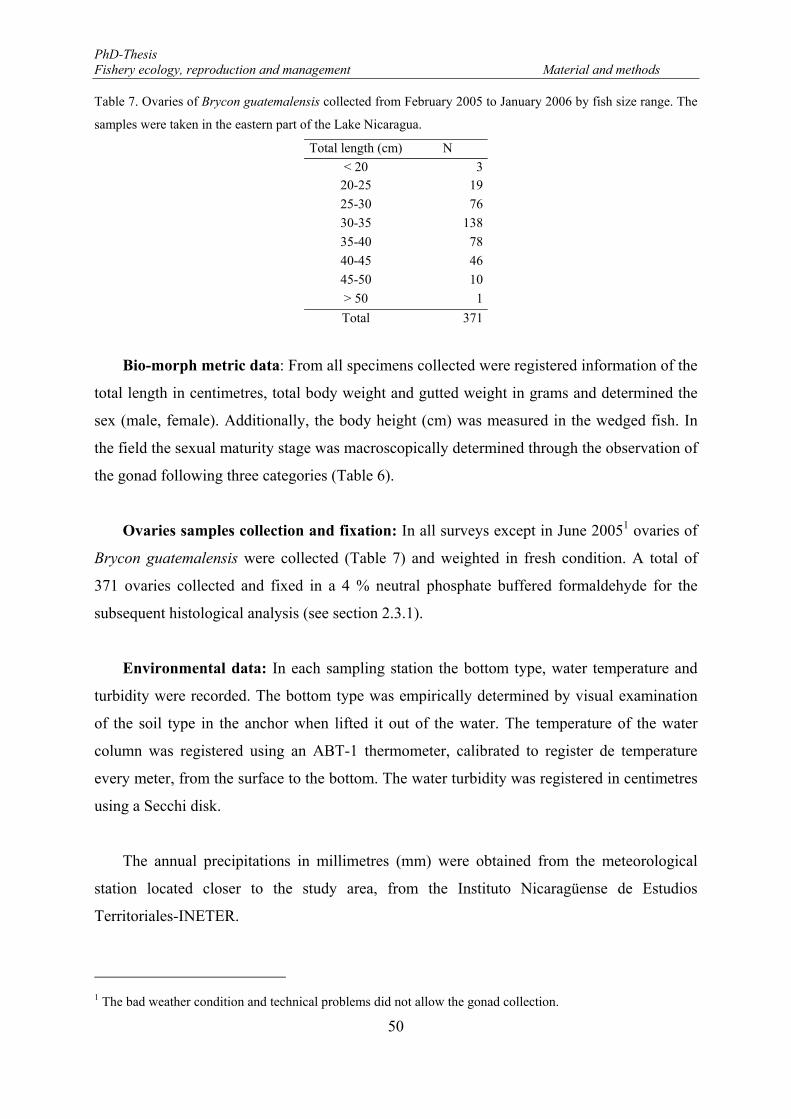
PhD-Thesis Fishery ecology, reproduction and management Material and methods
50
Table 7. Ovaries of Brycon guatemalensis collected from February 2005 to January 2006 by fish size range. The
samples were taken in the eastern part of the Lake Nicaragua.
Total length (cm) N
< 20 320-25 19
25-30 76
30-35 138
35-40 78
40-45 46
45-50 10
> 50 1
Total 371
Bio-morph metric data: From all specimens collected were registered information of the
total length in centimetres, total body weight and gutted weight in grams and determined the
sex (male, female). Additionally, the body height (cm) was measured in the wedged fish. In
the field the sexual maturity stage was macroscopically determined through the observation of
the gonad following three categories (Table 6).
Ovaries samples collection and fixation: In all surveys except in June 20051 ovaries of
Brycon guatemalensis were collected (Table 7) and weighted in fresh condition. A total of
371 ovaries collected and fixed in a 4 % neutral phosphate buffered formaldehyde for the
subsequent histological analysis (see section 2.3.1).
Environmental data: In each sampling station the bottom type, water temperature and
turbidity were recorded. The bottom type was empirically determined by visual examination
of the soil type in the anchor when lifted it out of the water. The temperature of the water
column was registered using an ABT-1 thermometer, calibrated to register de temperature
every meter, from the surface to the bottom. The water turbidity was registered in centimetres
using a Secchi disk.
The annual precipitations in millimetres (mm) were obtained from the meteorological
station located closer to the study area, from the Instituto Nicaragüense de Estudios
Territoriales-INETER.
1 The bad weather condition and technical problems did not allow the gonad collection.
PhD-Thesis Fishery ecology, reproduction and management Material and methods
51
2.2.4. Catches-per-Unit-Effort (CPUE)
The CPUE analyses were based on the premise that CPUE estimated from fishery-
independent survey is assumed to be proportional to true abundance, considering that survey
is carried out under a strict random sampling framework (Harley, Myers & Dunn, 2001).
Thus, the CPUE estimated is analysed in the context that spatiotemporal scales and
environmental factors induce changes in the fish abundance.
The catches were obtained from the fishery-independent surveys described above. They
were registered as total weight (kg) and numbers by species and sampling station (n = 561).
Catch in each haul was estimated as the sum of the individual weight registered, as described
in the previous section. In some analysis in this study catch is expressed in biomass, while
sometimes we used catch in numbers, i.e., abundance.
The catch-per-unit-of-effort (CPUE) or catch rate assumes that, at small spatial scales,
catch is proportional to the product of fishing effort and abundance:
C = qEN (1)
where E is the fishing effort expended, N the abundance, and q is the catchability, a
constant. This leads to the fundamental relationship between catch rate and abundance.
C / E = q N (2)
Catchability, q, is usually considered as constant, but may change spatially and
temporally due to where and when fishing occur (Hilborn & Walters, 1992). Catchability is
thus defined as the relationship between the catch rates (CPUE) and the true population size,
or abundance. So the unit of catchability is fish caught per fish available per effort unit and
per time unit. Catchability is also called gear efficiency (Hilborn & Walters, 1992) or
sometimes fishing power, and is strongly related to gear selectivity (defined below) because it
is species and size dependent.
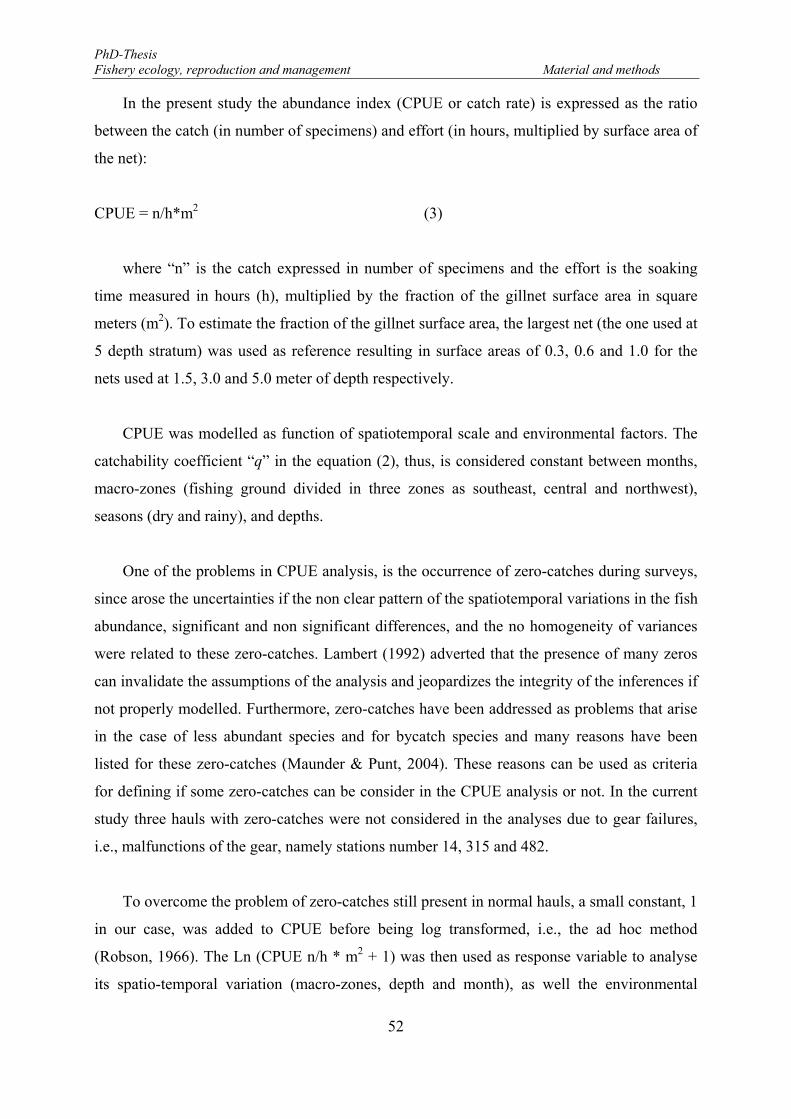
PhD-Thesis Fishery ecology, reproduction and management Material and methods
52
In the present study the abundance index (CPUE or catch rate) is expressed as the ratio
between the catch (in number of specimens) and effort (in hours, multiplied by surface area of
the net):
CPUE = n/h*m2 (3)
where “n” is the catch expressed in number of specimens and the effort is the soaking
time measured in hours (h), multiplied by the fraction of the gillnet surface area in square
meters (m2). To estimate the fraction of the gillnet surface area, the largest net (the one used at
5 depth stratum) was used as reference resulting in surface areas of 0.3, 0.6 and 1.0 for the
nets used at 1.5, 3.0 and 5.0 meter of depth respectively.
CPUE was modelled as function of spatiotemporal scale and environmental factors. The
catchability coefficient “q” in the equation (2), thus, is considered constant between months,
macro-zones (fishing ground divided in three zones as southeast, central and northwest),
seasons (dry and rainy), and depths.
One of the problems in CPUE analysis, is the occurrence of zero-catches during surveys,
since arose the uncertainties if the non clear pattern of the spatiotemporal variations in the fish
abundance, significant and non significant differences, and the no homogeneity of variances
were related to these zero-catches. Lambert (1992) adverted that the presence of many zeros
can invalidate the assumptions of the analysis and jeopardizes the integrity of the inferences if
not properly modelled. Furthermore, zero-catches have been addressed as problems that arise
in the case of less abundant species and for bycatch species and many reasons have been
listed for these zero-catches (Maunder & Punt, 2004). These reasons can be used as criteria
for defining if some zero-catches can be consider in the CPUE analysis or not. In the current
study three hauls with zero-catches were not considered in the analyses due to gear failures,
i.e., malfunctions of the gear, namely stations number 14, 315 and 482.
To overcome the problem of zero-catches still present in normal hauls, a small constant, 1
in our case, was added to CPUE before being log transformed, i.e., the ad hoc method
(Robson, 1966). The Ln (CPUE n/h * m2 + 1) was then used as response variable to analyse
its spatio-temporal variation (macro-zones, depth and month), as well the environmental
PhD-Thesis Fishery ecology, reproduction and management Material and methods
53
effects (season and turbidity) through General Linear Model (GLM) by mean of least square
methods, using statistical software 6.0. This simple method was considered sufficient given
the relative low frequency of zero catches events recorded during the whole survey, the 14.3
% off the total hauls (n=561). This ratio was smaller than 1/3 suggested being the threshold
below which the ad hoc method should be applied from the practical viewpoint (Shono,
2008).
An overall analysis of the CPUE was made for whole catch in the 12 surveys conducted,
with indication of catch rate by species. However, the detailed spatio-temporal analyses of
CPUE, as index of abundance, was conducted only in the four main target species of the lake,
A. citrinellus (Mojarra), H. nicaraguensis (Moga), P. managuensis (Guapote tigre) and B.
guatemalensis (Machaca).
2.2.5. Length distribution
Length frequency distribution of the four target species was analysed and modelled using
General Linear Model (GLM) and least square methods to investigate spatial (macro-zones
and depth) and temporal (season) variations and their interactions. Previously, size frequency
was compared by month and sexes using ANOVA. A linear regression (GLM) was done to
assess the potential influence of water turbidity on individual length of the catch. For all
performed analysis statistical software 6.0 were used.
2.3. Biological analysis
2.3.1. Ovarian histology
Histological studies were conducted on 371 ovaries collected from Brycon
guatemalensis. After fixation a central portion of each ovary was extracted, dehydrated,
embedded in paraffin, two slides sectioned at 3 μm and stained with Harris haematoxylin
followed by eosin-phloxine b counterstain (Table 8). With this staining procedure
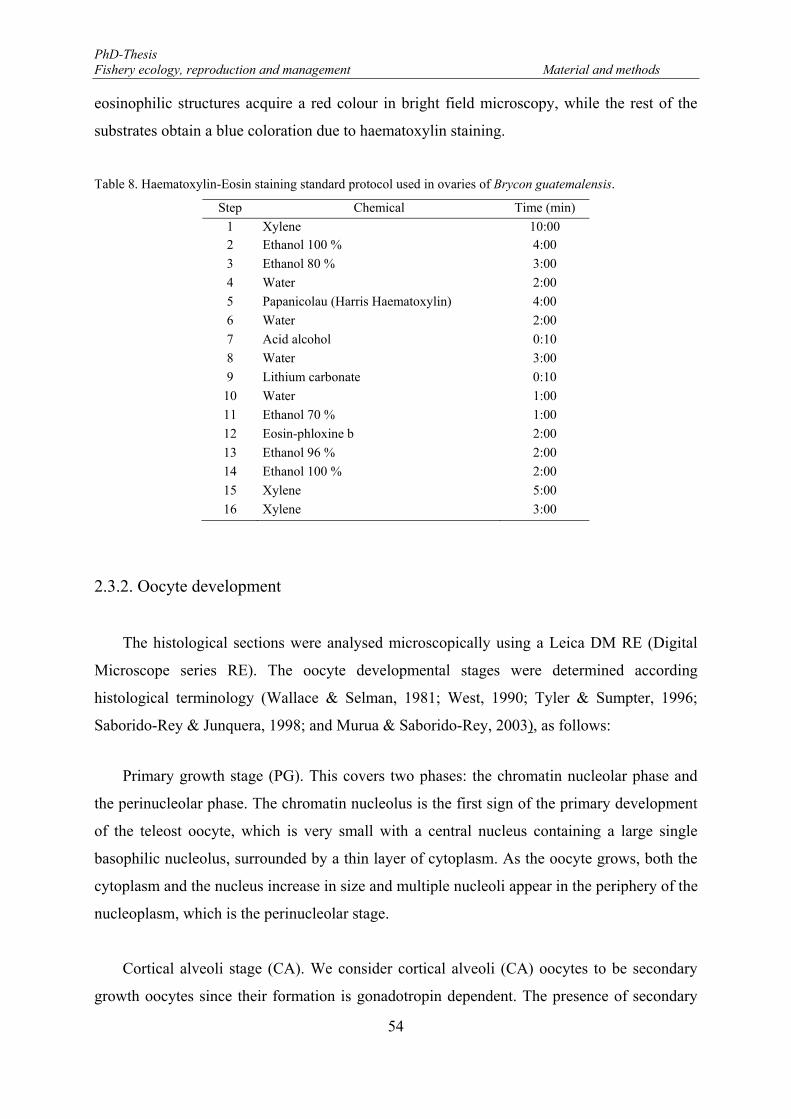
PhD-Thesis Fishery ecology, reproduction and management Material and methods
54
eosinophilic structures acquire a red colour in bright field microscopy, while the rest of the
substrates obtain a blue coloration due to haematoxylin staining.
Table 8. Haematoxylin-Eosin staining standard protocol used in ovaries of Brycon guatemalensis.
Step Chemical Time (min)
1 Xylene 10:00 2 Ethanol 100 % 4:00
3 Ethanol 80 % 3:00
4 Water 2:00
5 Papanicolau (Harris Haematoxylin) 4:00
6 Water 2:00
7 Acid alcohol 0:10
8 Water 3:00
9 Lithium carbonate 0:10
10 Water 1:00
11 Ethanol 70 % 1:00
12 Eosin-phloxine b 2:00
13 Ethanol 96 % 2:00
14 Ethanol 100 % 2:00
15 Xylene 5:00
16 Xylene 3:00
2.3.2. Oocyte development
The histological sections were analysed microscopically using a Leica DM RE (Digital
Microscope series RE). The oocyte developmental stages were determined according
histological terminology (Wallace & Selman, 1981; West, 1990; Tyler & Sumpter, 1996;
Saborido-Rey & Junquera, 1998; and Murua & Saborido-Rey, 2003), as follows:
Primary growth stage (PG). This covers two phases: the chromatin nucleolar phase and
the perinucleolar phase. The chromatin nucleolus is the first sign of the primary development
of the teleost oocyte, which is very small with a central nucleus containing a large single
basophilic nucleolus, surrounded by a thin layer of cytoplasm. As the oocyte grows, both the
cytoplasm and the nucleus increase in size and multiple nucleoli appear in the periphery of the
nucleoplasm, which is the perinucleolar stage.
Cortical alveoli stage (CA). We consider cortical alveoli (CA) oocytes to be secondary
growth oocytes since their formation is gonadotropin dependent. The presence of secondary
PhD-Thesis Fishery ecology, reproduction and management Material and methods
55
growth oocytes unavoidable means the fish has matured. The cortical alveoli in the periphery
of the cytoplasm indicate the onset of ripening. With conventional haematoxylin–eosin
staining, the alveoli appear as empty spheres. This stage is completed when yolk starts to
accumulate.
Vitellogenesis. The vitellogenesis starts when yolk globules begin to be formed. In the
present study vitellogenic oocytes were sub-divided in two stages: initial or early
vitellogenesis (VIT1) and late or advanced vitellogenesis (VIT2). VIT1 is characterized by the
appearance of yolk vesicles or spheres in the perinuclear cytoplasm lying between the cortical
alveoli. As vitellogenesis progress the yolk spheres increase in size and lipid are displaced to
the cytoplasm periphery. Oocytes in VIT2 have grown and yolk droplets are large and more
visible. The yolk granules are distributed now more homogenously in the cytoplasm
becoming the predominant structures and the lipids are completely displaced to the periphery
of the cytoplasm. Although the nucleus remains in the centre of the oocyte, often it is not seen
because the size of the oocyte has increased notably.
Germinal vesicle migrations (GVM) or migratory nucleus. It is the first visible event
associated with final oocyte maturation (OM). The nucleus is eccentric located and often
close to periphery.
Each oocyte developmental stage was characterized, in addition to its morphology, by
their oocyte diameter range that was measured in histological sections from 66 ovaries.
Oocyte diameter was computed as the mean of two lengths approximately orthogonal
measured in the longest and shortest axis of the oocyte. Measurements were taken using the
software Leica QWin Pro V 3.5.1.
Apart of these developmental stages, two other important ovarian structures, connected to
oocyte development, were identified:
Atretic oocytes (AO). Atresia is a process in which ovarian follicles degenerate and are
subsequently re-absorbed. It can occur in oocytes at any developmental stage. The observed
characteristics of atresia are the oocytes walls break, the cytoplasmic disorganization leading
to the occurrence unrecognizable structures in the cytoplasm.
PhD-Thesis Fishery ecology, reproduction and management Material and methods
56
Postovulatory follicle (POF). It consists of the follicular layers (the granulosa and the
theca) that remain in the ovary of fish after the release of the ovum during spawning. It
therefore indicates that the fish have spawned at least once.
2.3.3. Reproductive cycle
Ovaries were classified in reproductive phases following the terminology proposed by the
Brown-Peterson et al. (2011). For simplification, in this study we have used the Actively
spawning subphase as a reproductive phase. Thus, six phases were considered: Immature (I),
Developing (D), Spawning capable (SC), Actively spawning (AS), Regressing (Rgs) and
Regenerating (Rgn) based on the presence of the different oocytes development stages (PG,
CA, VIT1, VIT2, GVM), the atretic oocytes and postovulatory follicles (Table 9).
For the analysis of the reproductive cycle of Brycon guatemalensis only the 320 mature
females sampled were considered, i.e., those in Developing, Spawning capable, Actively
spawning, Regressing and Regenerating. The immature females, those with oocytes in
primary growth (PG) stages, considered “reproductively inactive females”, since are not
capable for spawning in the current breeding season or in the near future (Hunter et al., 1992),
were excluded.
2.3.4. Spawning fraction (Sf)
The Sf defined as the fraction of mature female spawning per day (Alheit, 1985) is
assessed from the prevalence of spawning stages or phases determined from a random sample
of gonads (Hunter & Golberg, 1980).
Thus the spawning fraction (Sf) was calculated as:
(4)
Sf =SC + AS
D + SC + AS + Rgn
PhD-Thesis Fishery ecology, reproduction and management Material and methods
57
Sf was estimated in each survey as a whole and by female length categories, i.e., smaller
(females below 33 cm), middle (females between 33 and 43 cm) and larger (females above 43
cm). Regression analysis was performed to investigate trends in Spawning fraction along the
year for all females and by length class. ANOVA, using statistical software 6.0, was used to
analyse differences between female length classes.
Table 9. Terminology applied for reproductive classification of female fishes (Brown-Peterson et al., 2011).
Phase Histological features
Immature: Never spawned Only oogonia and primary growth (PG) oocytes present. No atresia
or muscle bundles. Thin ovarian wall and little space between
oocytes.
Developing: Ovaries beginning to
develop, but not ready to spawn.
Primary growth (PG), cortical alveolar (CA), primary/initial/early
vitellogenic (VIT1) and secondary/late vitellogenic (VIT2) oocytes
present. No evidence of postovulatory follicles (POFs). Some atresia
can be present.
Early developing subphase: PG and CA oocytes only.
Spawning Capable: Fish are
developmentally and physiologically
able to spawn in this cycle.
Vitellogenic, early and late, oocytes present or POFs present in batch
spawners. Atresia of vitellogenic and/or hydrated oocytes may be
present. Early stages of oocytes maturation (OM) can be present.
Actively spawning subphase: Oocytes undergoing late germinal
vesicle migration (GVM), germinal migration breakdown (GVBD),
hydration, or ovulation.
Regressing: Cessation of spawning Atresia (any stage) and POFs present. Some CA and/or vitellogenic
(VIT1, VIT2) oocytes present.
Regenerating: Sexually mature,
reproductively inactive.
Only oogonia and PG growth oocytes present and some residual
cortical alveolar follicles can be present. Muscle bundles, enlarged
blood vessels, thick ovarian wall and/or gamma/delta atresia or old,
degenerating POFs may be present.
PhD-Thesis Fishery ecology, reproduction and management Material and methods
58
2.3.5. Somatic indices
The Gonado-somatic index (GSI) and Condition factor (K) of B. guatemalensis were
estimated on 240 and 305 specimens, respectively. The Gonadosomatic index (GSI) was
estimated as:
∗ 100 (5)
where GW is the gonad weight and Wg the gutted body weight.
The condition factor (K) was estimated as:
∗ 100 (6)
where W is the total body weight; L the total length and the coefficient b was fixed as
3.428, which is the value from the length-weight relationship of B. guatemalensis.
Differences in GSI and K between reproductive phases were analysed using ANOVA and
Tukey HSD test. The relationship of both indexes within reproductive phases, together and
separately, was analysed using regression analysis. For all performed analysis statistical
software 6.0 were used.
2.3.6. Maturity
The female maturity ogives of Brycon guatemalensis was determined using: a. the gonad
maturity macroscopic observation taking as reference the classification in Table 6 , and b. the
maturity stage obtained from histological studies taking as reference the oocytes development
stages described in section 2.3.2, in which the oocytes in primary growth (PG) stages in the
ovaries is the main characteristic of immature specimens. The macroscopic maturity stage
was determined in 1526 ovaries (Table 10), between April to December during which more
than 10 % of females were spawning capable, and hence defining the spawning season (Table
PhD-Thesis Fishery ecology, reproduction and management Material and methods
59
11). This criterion was adopted to minimise the errors on staging macroscopically ovaries in
developing and regenerating or recovery stages, which are difficult to stage and often
confused and misclassified with immature fish (Wallace & Selman, 1981, Wyllie E., 1987).
The assumption behind the criteria adopted in this study, is that while closer the females are
to the spawning season, the gonads are more visually developed and, thus, is easier to
macroscopically differentiate the ovaries of immature from mature females.
Histological (microscopic) maturity was determined in 371 females collected during the
whole study period (from February 2005 to January 2006) (Table 10). Out of this, 51 ovaries,
those who contain oocytes in primary growth stages, were immature fishes (size-
independent), whereas those ovaries with oocytes in cortical alveoli (CA), initial
vitellogenesis (VIT1), advanced vitellogensis (VIT2) and the one with germinal vesicle
migratory (GVM), including the ovaries in regenerating (Rgn) phases, were pooled in the
mature category (N=320).
Maturity ogives of A. citrinellus H. nicaraguensis and P. managuensis were estimated
from the macroscopic maturity stage only (Hernández-Portocarrero & Saborido-Rey, 2007) in
the same way as for B. guatemalensis. However, female maturity ogives of A. citrinellus and
H. nicaraguensis did not fit properly to a logistic function due to a complete overlap in sizes
between immature and mature fish. For these species male maturity ogive was used instead.
The number of male and females by size class and maturity stage for each species is shown in
Table 12.
In all cases the maturity was analysed as function of body length, thus a logistic equation
was fitted to the maturity-at-length data. The applied logistic equation was:
Pe
e
a bL
a bL
1 (7)
and the logarithm transformation:
bLaP
P
ˆ1
ˆln (8)
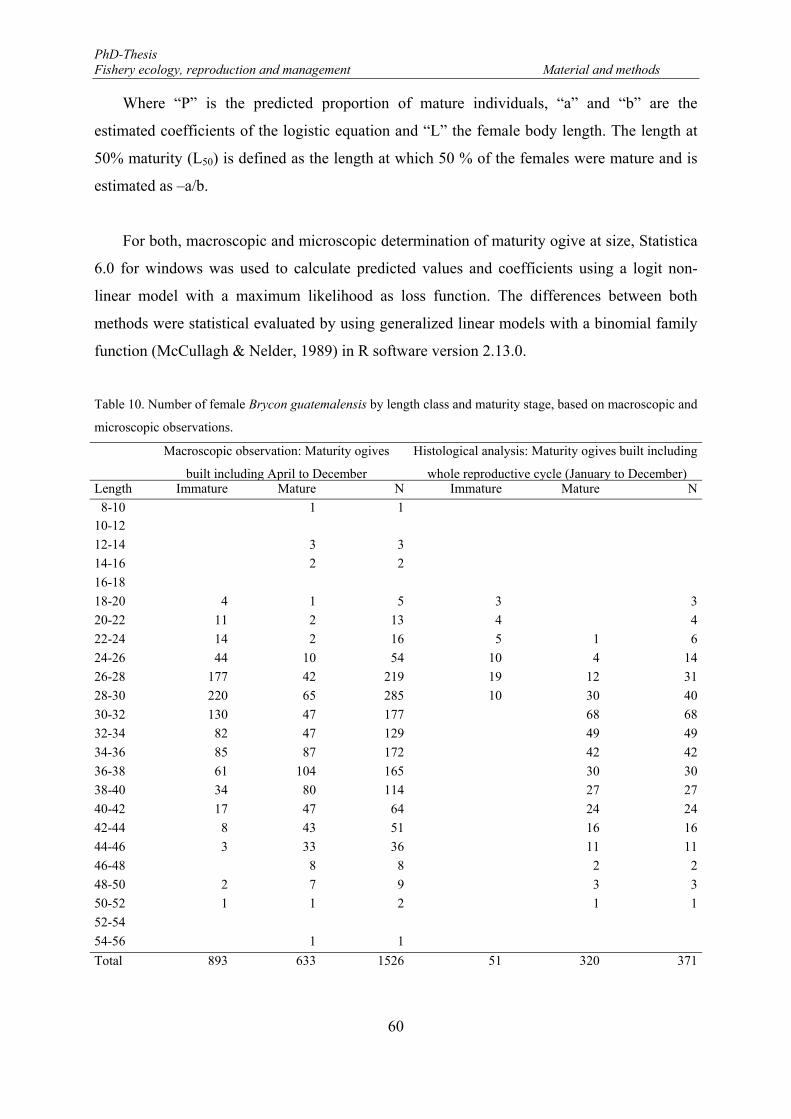
PhD-Thesis Fishery ecology, reproduction and management Material and methods
60
Where “P” is the predicted proportion of mature individuals, “a” and “b” are the
estimated coefficients of the logistic equation and “L” the female body length. The length at
50% maturity (L50) is defined as the length at which 50 % of the females were mature and is
estimated as –a/b.
For both, macroscopic and microscopic determination of maturity ogive at size, Statistica
6.0 for windows was used to calculate predicted values and coefficients using a logit non-
linear model with a maximum likelihood as loss function. The differences between both
methods were statistical evaluated by using generalized linear models with a binomial family
function (McCullagh & Nelder, 1989) in R software version 2.13.0.
Table 10. Number of female Brycon guatemalensis by length class and maturity stage, based on macroscopic and
microscopic observations.
Macroscopic observation: Maturity ogives
built including April to December
Histological analysis: Maturity ogives built including
whole reproductive cycle (January to December)Length Immature Mature N Immature Mature N
8-10 1 110-12
12-14 3 3
14-16 2 2
16-18
18-20 4 1 5 3 3
20-22 11 2 13 4 4
22-24 14 2 16 5 1 6
24-26 44 10 54 10 4 14
26-28 177 42 219 19 12 31
28-30 220 65 285 10 30 40
30-32 130 47 177 68 68
32-34 82 47 129 49 49
34-36 85 87 172 42 42
36-38 61 104 165 30 30
38-40 34 80 114 27 27
40-42 17 47 64 24 24
42-44 8 43 51 16 16
44-46 3 33 36 11 11
46-48 8 8 2 2
48-50 2 7 9 3 3
50-52 1 1 2 1 1
52-54
54-56 1 1
Total 893 633 1526 51 320 371
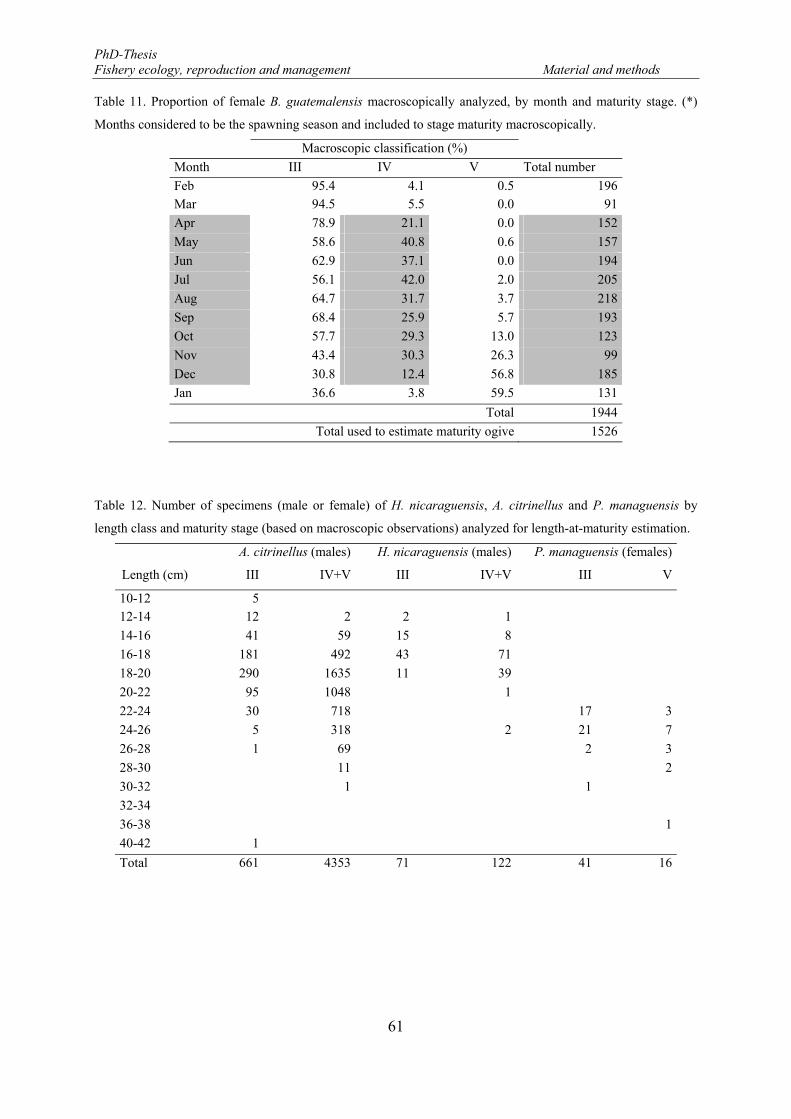
PhD-Thesis Fishery ecology, reproduction and management Material and methods
61
Table 11. Proportion of female B. guatemalensis macroscopically analyzed, by month and maturity stage. (*)
Months considered to be the spawning season and included to stage maturity macroscopically.
Macroscopic classification (%)
Month III IV V Total number
Feb 95.4 4.1 0.5 196 Mar 94.5 5.5 0.0 91
Apr 78.9 21.1 0.0 152
May 58.6 40.8 0.6 157
Jun 62.9 37.1 0.0 194
Jul 56.1 42.0 2.0 205
Aug 64.7 31.7 3.7 218
Sep 68.4 25.9 5.7 193
Oct 57.7 29.3 13.0 123
Nov 43.4 30.3 26.3 99
Dec 30.8 12.4 56.8 185
Jan 36.6 3.8 59.5 131
Total 1944
Total used to estimate maturity ogive 1526
Table 12. Number of specimens (male or female) of H. nicaraguensis, A. citrinellus and P. managuensis by
length class and maturity stage (based on macroscopic observations) analyzed for length-at-maturity estimation.
A. citrinellus (males) H. nicaraguensis (males) P. managuensis (females)
Length (cm) III IV+V III IV+V III V
10-12 5 12-14 12 2 2 1
14-16 41 59 15 8
16-18 181 492 43 71
18-20 290 1635 11 39
20-22 95 1048 1
22-24 30 718 17 3
24-26 5 318 2 21 7
26-28 1 69 2 3
28-30 11 2
30-32 1 1
32-34
36-38 1
40-42 1
Total 661 4353 71 122 41 16
PhD-Thesis Fishery ecology, reproduction and management Material and methods
62
2.3.7. Fecundity
Fecundity was estimated using the gravimetric method aided with image analysis. The
gravimetric method currently the most common method used, is based on the relationship
between ovary weight and the oocyte density in the ovary and can be used to estimate batch
fecundity, total fecundity and potential annual fecundity (Hunter & Golberg, 1980; Hunter,
Macewicz & Kimbrell, 1989). The ovary was weighed at filed with a precision of 0.1 g and in
the laboratory subsamples between 500 and 100 mg (average 824.6 milligrams) were taken
from the central section of the ovary. Oocytes were then separated from connective tissue
using a washing process (modified from Lowerre-Barbieri & Barbieri, 1993) and by size with
sieves battery. This methodology presented some difficulties for oocytes separation, because
these were surrounded in a mucus type (Figure 9). Nevertheless, it allowed the oocytes
separation. After this, each separated portion was stored in eppendorfs with 3.6% buffered
formaldehyde. Before they were counting and to improve safety conditions due to the toxicity
of formaldehyde, oocytes were washed with water.
To establish the mesh size of the sieves it was considered the oocyte measurements taken
as described in section 2.3.2. The mean diameter of each oocyte stage was calculated, and
thus, it was defined the appropriate sieve for the oocytes size separation. Based on these
oocytes measurements, it was selected sieve of 800, 300 and 150 µm as the appropriate sieves
for separating three different groups of oocytes: i) VIT2 and GVM, ii) VIT1 and iii) CA
stages, while primary growth (PG) stages, smaller than 150 µm were discarded.
The number and diameter of oocytes (Figure 10) contained in the ovary sub-sample were
estimated by mean of a computer-aided image analysis system following Domínguez-Petit
(2007) and Alonso-Fernández (2011) methodology using a QWin software (Leica Image
Systems) on a PC (AMD Athlon XP 3000 +) connected to a video camera (Leica DFC490)
attached to a motorized stereo macroscope (Leica Z6 APOA).
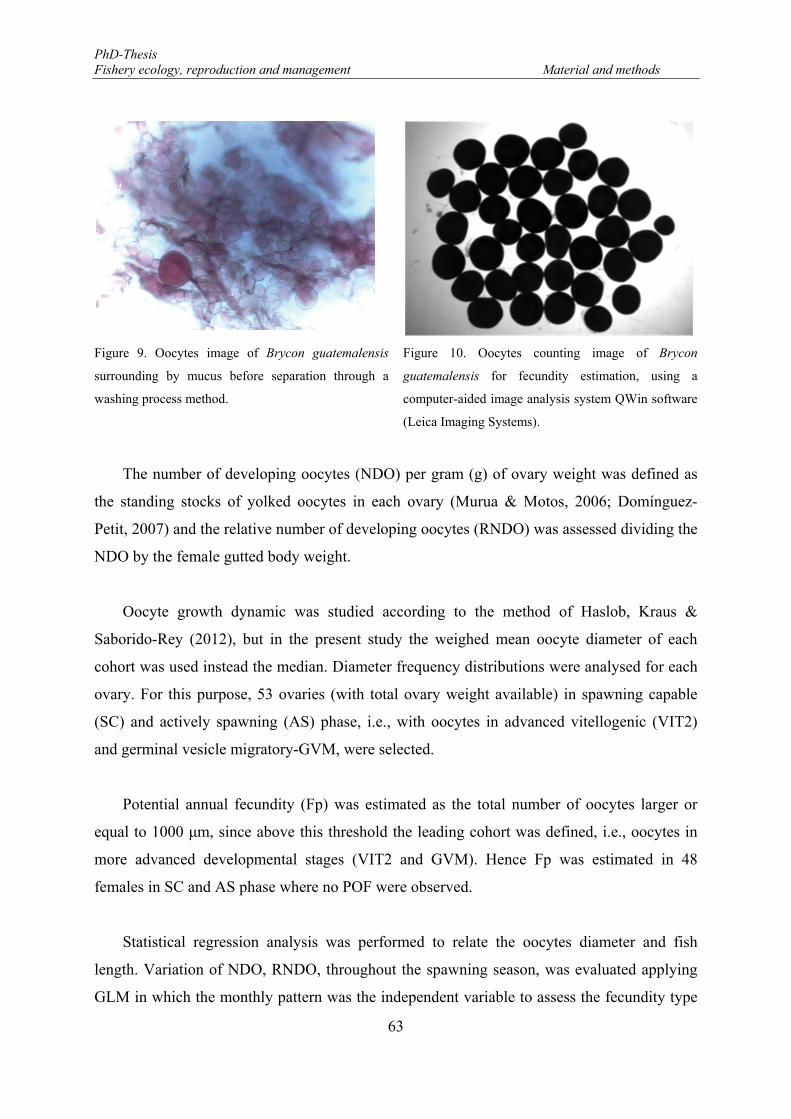
PhD-Thesis Fishery ecology, reproduction and management Material and methods
63
Figure 9. Oocytes image of Brycon guatemalensis
surrounding by mucus before separation through a
washing process method.
Figure 10. Oocytes counting image of Brycon
guatemalensis for fecundity estimation, using a
computer-aided image analysis system QWin software
(Leica Imaging Systems).
The number of developing oocytes (NDO) per gram (g) of ovary weight was defined as
the standing stocks of yolked oocytes in each ovary (Murua & Motos, 2006; Domínguez-
Petit, 2007) and the relative number of developing oocytes (RNDO) was assessed dividing the
NDO by the female gutted body weight.
Oocyte growth dynamic was studied according to the method of Haslob, Kraus &
Saborido-Rey (2012), but in the present study the weighed mean oocyte diameter of each
cohort was used instead the median. Diameter frequency distributions were analysed for each
ovary. For this purpose, 53 ovaries (with total ovary weight available) in spawning capable
(SC) and actively spawning (AS) phase, i.e., with oocytes in advanced vitellogenic (VIT2)
and germinal vesicle migratory-GVM, were selected.
Potential annual fecundity (Fp) was estimated as the total number of oocytes larger or
equal to 1000 μm, since above this threshold the leading cohort was defined, i.e., oocytes in
more advanced developmental stages (VIT2 and GVM). Hence Fp was estimated in 48
females in SC and AS phase where no POF were observed.
Statistical regression analysis was performed to relate the oocytes diameter and fish
length. Variation of NDO, RNDO, throughout the spawning season, was evaluated applying
GLM in which the monthly pattern was the independent variable to assess the fecundity type
PhD-Thesis Fishery ecology, reproduction and management Material and methods
64
of the specie. Power and linear regression were used to study the relationship between Fp and
maternal features (length and weight) and oocytes diameter, respectively. For all performed
analysis statistical software 6.0 were used.
Finally, the relation between the number of oocytes in GVM and in VIT2 was estimated
in 47 females close to be spawn and containing both oocytes stages in their ovaries.
The Auto-diametric method developed by Thorsen & Kjesbu (2001) is used to estimates
potential fecundity based on oocyte density – diameter relationships. It consist in the
estimation of the number of oocytes using an image analysis system, by which is determined
the average diameter of vitellogenic (yolk containing) oocytes in a sample, and then, the mean
diameter is converted into oocyte density using a precise calibration curve. To establish the
calibration curve pre-spawning ovaries are weighted and oocytes in an ovary sub-sampled
counted and measured. The mean oocyte diameter, as independent variable, and the oocyte
density, the dependent variable, are fitted to a power regression line. The application of the
auto-diametric method for the potential fecundity estimation requires high and significant
determination coefficient.
2.4. Gillnet selectivity
Gillnet selectivity studies were performed on four species (Table 13), but with special
emphasis on the relation between selectivity and reproductive performance of Brycon
guatemalensis females.
The selectivity parameters for each mesh size of the net tested 75, 100, 125 and 150 mm
stretch mesh, during the fishery-independent survey, were estimated using the indirect method
proposed by Holt (1963), who compared the catches C1 and C2 in two gill nets with different
mesh sizes m1 and m2, assuming that: a) the selectivity curve for both mesh sizes are normal
and have the same variance σ2 or standard deviation; b) both selectivity curves have the same
length and height; and c) the optimum length or modes of the selectivity curves are
proportional to the mesh size. Then relationship between the natural logarithms of the number
PhD-Thesis Fishery ecology, reproduction and management Material and methods
65
of fish catches and fish length was fitted to a linear regression (Hamley, 1975; Sparre &
Venema, 1998):
ln (Cm/Cm+1)= a + bL (9)
where C is the catch of each of the four nets, m, L is the mid-point of the length class and
a and b are the intercept and the slope of the linear regression, respectively.
The selection factor (SF), the optimum length for being caught OLm each net m, and the
standard deviation are estimated from the next equations:
(10)
∗ (11)
(12)
where a and b are the parameters defined in Eq. 9, and Mm is the mesh size (in mm) for
each net m.
The selection curves for each net, m, are then estimated as:
exp ) (13)
From these and the catches, C, an abundance index for each mesh size net m and female
size l, Aml, is estimated:
/ (14)
From the estimated abundance values an estimated female mean length was calculated for
each net.
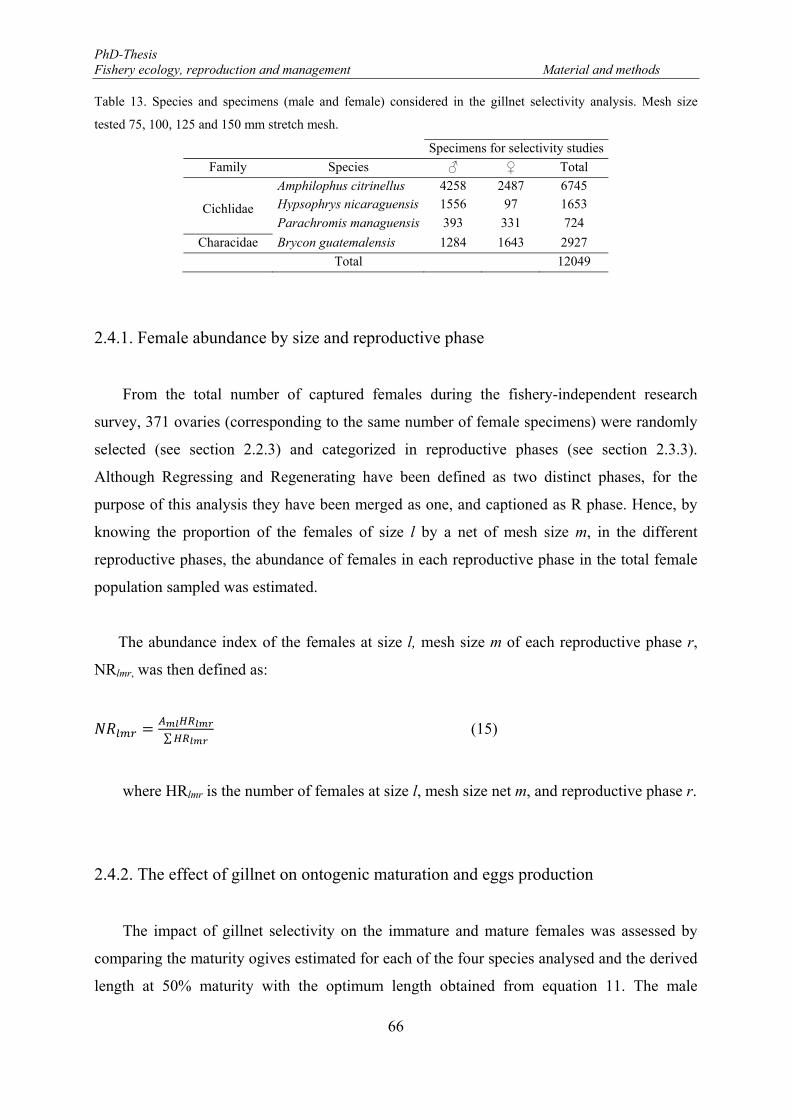
PhD-Thesis Fishery ecology, reproduction and management Material and methods
66
Table 13. Species and specimens (male and female) considered in the gillnet selectivity analysis. Mesh size
tested 75, 100, 125 and 150 mm stretch mesh.
Specimens for selectivity studies
Family Species ♂ ♀ Total
Cichlidae
Amphilophus citrinellus 4258 2487 6745 Hypsophrys nicaraguensis 1556 97 1653
Parachromis managuensis 393 331 724
Characidae Brycon guatemalensis 1284 1643 2927
Total 12049
2.4.1. Female abundance by size and reproductive phase
From the total number of captured females during the fishery-independent research
survey, 371 ovaries (corresponding to the same number of female specimens) were randomly
selected (see section 2.2.3) and categorized in reproductive phases (see section 2.3.3).
Although Regressing and Regenerating have been defined as two distinct phases, for the
purpose of this analysis they have been merged as one, and captioned as R phase. Hence, by
knowing the proportion of the females of size l by a net of mesh size m, in the different
reproductive phases, the abundance of females in each reproductive phase in the total female
population sampled was estimated.
The abundance index of the females at size l, mesh size m of each reproductive phase r,
NRlmr, was then defined as:
∑ (15)
where HRlmr is the number of females at size l, mesh size net m, and reproductive phase r.
2.4.2. The effect of gillnet on ontogenic maturation and eggs production
The impact of gillnet selectivity on the immature and mature females was assessed by
comparing the maturity ogives estimated for each of the four species analysed and the derived
length at 50% maturity with the optimum length obtained from equation 11. The male
PhD-Thesis Fishery ecology, reproduction and management Material and methods
67
macroscopic maturity ogives of H. nicaraguensis, A. citrinellus, and females of P.
managuensis and B. guatemalensis were previously estimated (Hernández-Portocarrero &
Saborido-Rey, 2007). Additionally, in B. guatemalensis a microscopic ogive was estimated
based on histological procedures (see section 2.3.6). Selectivity of each net was also estimated
by the categorized reproductive phases (see section 2.3.3), and the results compared by
environmental season, i.e., dry and rainy season.
The impact of gillnet selectivity on potential egg production was assessed estimating the
number of eggs that potentially had produced the fish caught in each net, i.e., at different
mesh sizes, by using the values of the power equation obtained from the relationship of the
potential annual fecundity (Fp) and the length of Brycon guatemalensis:
∑ ∗ 0.0626 . (16)
Where EPm is the potential eggs production at mesh size net; HRlmr is the number of
females at size l and mesh size net m.

69
CHAPTER 3: Population Ecology. Abundance and Distribution Patterns.
3.1. Introduction
Catch and effort information derived from commercial fisheries is a traditional manner
on knowing the efficiency and performance of a fishery, and it typically reported as Catch per
Unit Effort (CPUE), i.e., the amount of catch that is taken per unit of fishing gear (effort),
expresses in a variety of units (FAO, 2013). CPUE can be used as a measure of the economic
efficiency of a type of gear, but normally it is used as an index of abundance, i.e., a
proportional change in CPUE is hoped to represent the same proportional change in
abundance. Fishery CPUE is relative easy to obtain and often provide an good temporal
coverage ,but it generally is poor when considering spatial coverage, as fishery always focus
its activities where target fish show highest densities. However, it is known that there are
many factors (including economics, geographical distributions) which may affect CPUE but
do not represent changes in abundance. Additionally, catching methodologies are largely
variable among fishers. All of it forces the standardization of CPUE data to remove the effect
of factors that bias CPUE as an index of abundance. CPUE standardizes catch data based on
the amount of the effort (total time or area sampled) exerted, for example, bag seine CPUE is
reported as number of individuals captured per area sampled, whereas shrimp trawl, gill net,
and oyster dredge are reported as number of individuals captured per hour sampled
(Gonzalez, 2011).
CPUE data are the primary source of abundance information for many of the world’s
most valuable and vulnerable commercially and recreationally fished species (Maunder &
Punt, 2004). Thus, indices of relative abundance estimated from catch-per-unit-of-effort
(CPUE) data are one of the most commonly used data types in stock assessment (Maunder &
Hoyle, 2006). However, CPUE information from commercial fisheries should be used
cautiously, because it may not be an accurate index of abundance (National Research Council
2000). Harley et al. (2001) compiled and analyzed a large number of CPUE and survey
abundance indices from International Council for the Exploration of the Sea (ICES) stock
assessment reports, and found that commercial CPUE was hyperstable because there were
nonlinearity between CPUE and abundance, since commercial fishing is not a random activity
PhD-Thesis Fishery ecology, reproduction and management Abundance and Distribution Patterns
70
but an operation with clear targets. Besides that, Battaile & Quinn (2004) has indicated that
the variation in fishing power (differences in vessel and gear types) create variation in CPUE
unrelated to abundance; and Bishop, Venables & Wang (2004) mentioned that the
improvement of fishing technology, accumulation of knowledge related to fish distribution
and fishing operation will increase fishing power and create hyperstable CPUE.
Fishery independent survey with a standard vessel using standard fishing gear can avoid
some of the biases inherent in fishery CPUE data. It seems to overcome many of the problems
faced when information comes from commercial fisheries, since the resulting CPUE indices is
assumed to be proportional to true abundance, considering that survey are carried out under a
strict random sampling framework (Harley et al., 2001). They are often preferred over
fishery-dependent data for monitoring the status of harvested populations because (Rotherham
et al., 2006): (i) sampling is randomized rather than being concentrated where populations are
(or are thought to be) most abundant; (ii) potentially, they provide more representative data on
the entire size range of populations, rather than just retained components; (iii) there is no
reliance on fishers reporting their catches and effort accurately; (iv) methodologies remain
consistent over time; and (v) data can be collected on species not usually retained in
commercial and recreational fisheries. Nevertheless, such surveys can be costly and require
careful design, particularly if a stratified sampling design is adopted to improve precision.
Hence, assumed that fishery-independent survey is proportional to true abundance, the
variations on the abundance reflect fish vulnerability to fishing gear, fishing strategy, fish
biology, including behaviour and response of individuals to environmental factors (Arreguín-
Sánchez, 1996).
The behaviour pattern of the fish is a key factor included directly or indirectly in many of
the dynamics of stock studies, but even before arriving to this, was the empirical observation
and knowledge of the behaviour of the fish which allowed the fishing gear design and its
modifications, improvement of fishing strategies and others. Furthermore, vulnerability is
related to the probability of encounter of the fishing gear and the fish, thus, if fish is available,
then vulnerability will depend of fishing gear efficiency, which implicitly assume identical
behaviour of all fishes in the populations which is a merely ideal behaviour (Arreguín-
Sánchez, 1996). Marine, estuarine and freshwater fish exhibit different behaviour and many
authors have made reference to this matters, and particularly to freshwater fish, Matthews
PhD-Thesis Fishery ecology, reproduction and management Abundance and Distribution Patterns
71
(1998), has indicated that these fishes exhibit home range or homing affinities, daily or
seasonal movement pattern or longer-distance migrations, which are considered to be truly
“autecological, i.e., the interactions of an individual organism or a single species with the
living and nonliving factors of its environment”, with little apparent influence from other fish
species and more related with searching for optimal environmental conditions.
The influence of spatiotemporal scale and environmental factors on the biology, life
cycle, reproductive cycle, migration pattern and behaviour has been reported in the characidae
family (Kramer, 1978a; Honji et al., 2009; Andrade & Braga, 2005; Lowe-McConnel, 1987).
Particularly, the migratory habits upstream of Brycon guatemalensis for spawning or perhaps
feeding has been described when studying the importance of the species for seeds dispersal in
the Rio Puerto Viejo in Costa Rica (Horn, 1997). Cichlid movements have been described in
relation with foraging and spawning activity (Conkel, 1993) even they do not undergo major
reproductive migration (Lowe-McConnell, 1999). Some of these activities are conducted in
flooded areas during the rainy season implying movements onto the floodplain out of the
lagoon (Fernandes, Machado & Penha, 2010; Lourenço et al., 2012).
Most cichlids are stenotopic (Eccles, 1986), i.e., able to adapt only to a narrow range of
environmental conditions, that because these fish are visually oriented fish and often
associated with transparent water (Lowe-McConnell, 1999; Rodriguez & Lewis, 1997). The
low visibility has being adverted in haplochromine cichlids in which the decrease of water
clarity seems to affect foraging, social interactions, and to hamper mate recognition or even
frustrate breeding (Fryer & Iles, 1972; Seehausen & Van Alphen, 1998). The behavioural
response to water transparency may affect the fish catchability, since moderate levels of
turbidity apparently decrease the likelihood that fish will perceive the net material (Kirkland,
1965) and reduce the reactive distances, altering foraging behaviour, and decreasing
association with substrates (Noggle 1978; Gradall & Swenson 1982; Barrett, Grossman &
Rosenfeld, 1992).
In the present work it is analyzed the pattern of variability of the relative abundance index
(CPUE), expressed as Ln(CPUE No ind/h m2+1), i.e., number of specimens captured per hour
and surface area of the net, of three species belonging to the cichlidae family as Amphilophus
citrinellus, Hypsophrys nicaraguensis, Parachromis managuensis and one species of the
PhD-Thesis Fishery ecology, reproduction and management Abundance and Distribution Patterns
72
characidae family Brycon guatemalensis. The CPUE pattern variability is assumed to be
proportional to true abundance, since comes from a fishery-independent survey carried out
under the sampling framework specified in the methodology section. The abundance index is
examined as function of the temporal scale as the month of year, the spatial scales as the
macro-zones (northwest, central and southeast zone) and depth strata (1, 3 and 5 m) and as
function of the environmental factors as rainfall related seasons and water turbidity. In line
with the objective of this thesis, special interest is placed on how is modulated the relative
abundance index (CPUE) and the size distribution of Brycon guatemalensis by the
spatiotemporal and environmental changes. Therefore, the discussion of this chapter is mainly
focused on this species which in turn is considered as study case in the whole thesis.
3.2. Results
3.2.1. Environmental data
The bottom soil of the study area was composed mainly by soft material as sand, mud or
a mixture of both, but some hard bottoms (rocks) were also identified. The sandy areas were
localized most near the shoreline and in the central zone, while mixture of sand and mud were
observed in both extremes of the area, i.e., southern and northern zones (Figure 11). In the
southeast zone wider muddy areas were found near de shoreline. Sandy areas were associated
with river mouths probably because of the effect of rapid currents generated by the rivers
flows do not allow the deposition of clay particles in the bottom.
During the period of the study (February 2005-January 2006) rainfalls occurred in every
month (Figure 12). The wet season according to Köppen climate classification (average
precipitation above 60 mm) extended from May to November. However, average
precipitation in November was slightly above 100 mm, considerably below the average
between May and October, whose values ranged from 205 to 368.4 mm, the maximum
reached in October which is normally the rainiest month of year (Figure 12). This period is
considered as the regular winter period. The dry period months, occurring therefore from
November to April, are characterized by the precipitation lower than 100 mm, especially from
February to April, the driest months during the studied period.
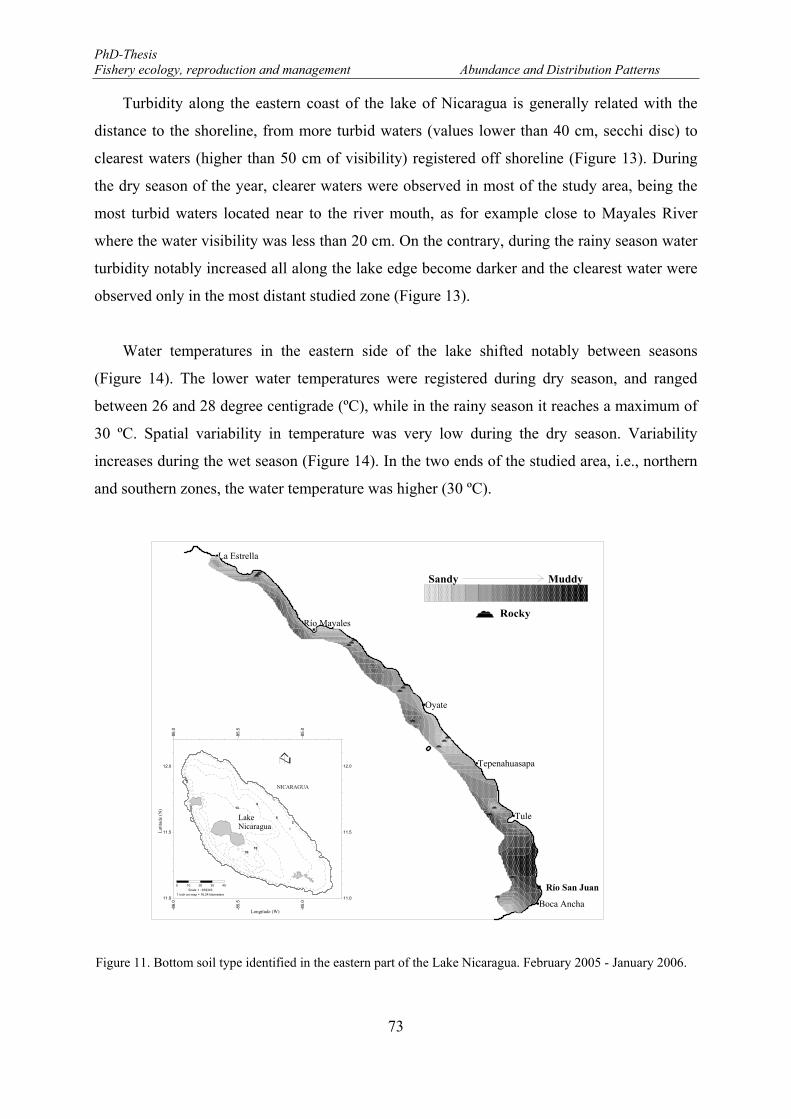
PhD-Thesis Fishery ecology, reproduction and management Abundance and Distribution Patterns
73
Turbidity along the eastern coast of the lake of Nicaragua is generally related with the
distance to the shoreline, from more turbid waters (values lower than 40 cm, secchi disc) to
clearest waters (higher than 50 cm of visibility) registered off shoreline (Figure 13). During
the dry season of the year, clearer waters were observed in most of the study area, being the
most turbid waters located near to the river mouth, as for example close to Mayales River
where the water visibility was less than 20 cm. On the contrary, during the rainy season water
turbidity notably increased all along the lake edge become darker and the clearest water were
observed only in the most distant studied zone (Figure 13).
Water temperatures in the eastern side of the lake shifted notably between seasons
(Figure 14). The lower water temperatures were registered during dry season, and ranged
between 26 and 28 degree centigrade (ºC), while in the rainy season it reaches a maximum of
30 ºC. Spatial variability in temperature was very low during the dry season. Variability
increases during the wet season (Figure 14). In the two ends of the studied area, i.e., northern
and southern zones, the water temperature was higher (30 ºC).
Figure 11. Bottom soil type identified in the eastern part of the Lake Nicaragua. February 2005 - January 2006.
Sandy Muddy
Rocky
-86.
0 -8
6.0
-85.
5 -8
5.5
-85.
0 -8
5.0
11.0 11.0
11.5 11.5
12.0 12.0
2LakeNicaragua
3316
139
6
NICARAGUA
Latit
ude
(N)
Longitude (W)
0 10 20 30 40Scale 1 : 639343
1 inch on map = 16.24 kilometers
Río Mayales
Boca Ancha
Tule
Tepenahuasapa
Oyate
La Estrella
Río San Juan
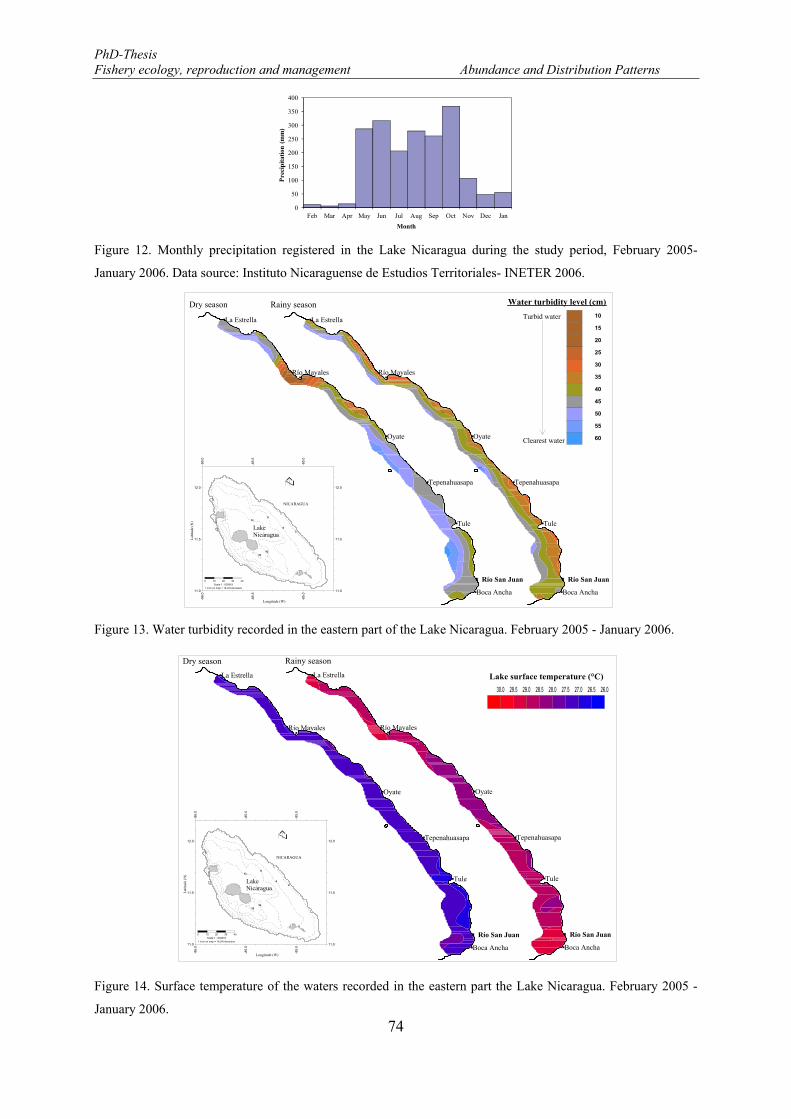
PhD-Thesis Fishery ecology, reproduction and management Abundance and Distribution Patterns
74
Figure 12. Monthly precipitation registered in the Lake Nicaragua during the study period, February 2005-
January 2006. Data source: Instituto Nicaraguense de Estudios Territoriales- INETER 2006.
Figure 13. Water turbidity recorded in the eastern part of the Lake Nicaragua. February 2005 - January 2006.
Figure 14. Surface temperature of the waters recorded in the eastern part the Lake Nicaragua. February 2005 -
January 2006.
0
50
100
150
200
250
300
350
400
Feb Mar Apr May Jun Jul Aug Sep Oct Nov Dec Jan
Pre
cip
itat
ion
(m
m)
Month
Dry season Rainy season
26.026.527.027.528.028.529.029.530.0
Lake surface temperature (°C)
-86.
0 -8
6.0
-85.
5 -8
5.5
-85.
0 -8
5.0
11.0 11.0
11.5 11.5
12.0 12.0
2LakeNicaragua
3316
139
6
NICARAGUA
Latit
ude
(N)
Longitude (W)
0 10 20 30 40Scale 1 : 639343
1 inch on map = 16.24 kilometers
Río Mayales
Boca Ancha
Tule
Tepenahuasapa
Oyate
La Estrella
Río San Juan
Río Mayales
Boca Ancha
Tule
Tepenahuasapa
Oyate
La Estrella
Río San Juan
Water turbidity level (cm)Dry season Rainy season
Río Mayales
Boca Ancha
Tule
Tepenahuasapa
Oyate
La Estrella
Río San Juan
Río Mayales
Boca Ancha
Tule
Tepenahuasapa
Oyate
La Estrella
Río San Juan
-86.
0 -8
6.0
-85.
5 -8
5.5
-85.
0 -8
5.0
11.0 11.0
11.5 11.5
12.0 12.0
2LakeNicaragua
3316
139
6
NICARAGUA
Latit
ude
(N)
Longitude (W)
0 10 20 30 40Scale 1 : 639343
1 inch on map = 16.24 kilometers
10
15
20
25
30
35
40
45
50
55
60
Turbid water
Clearest water
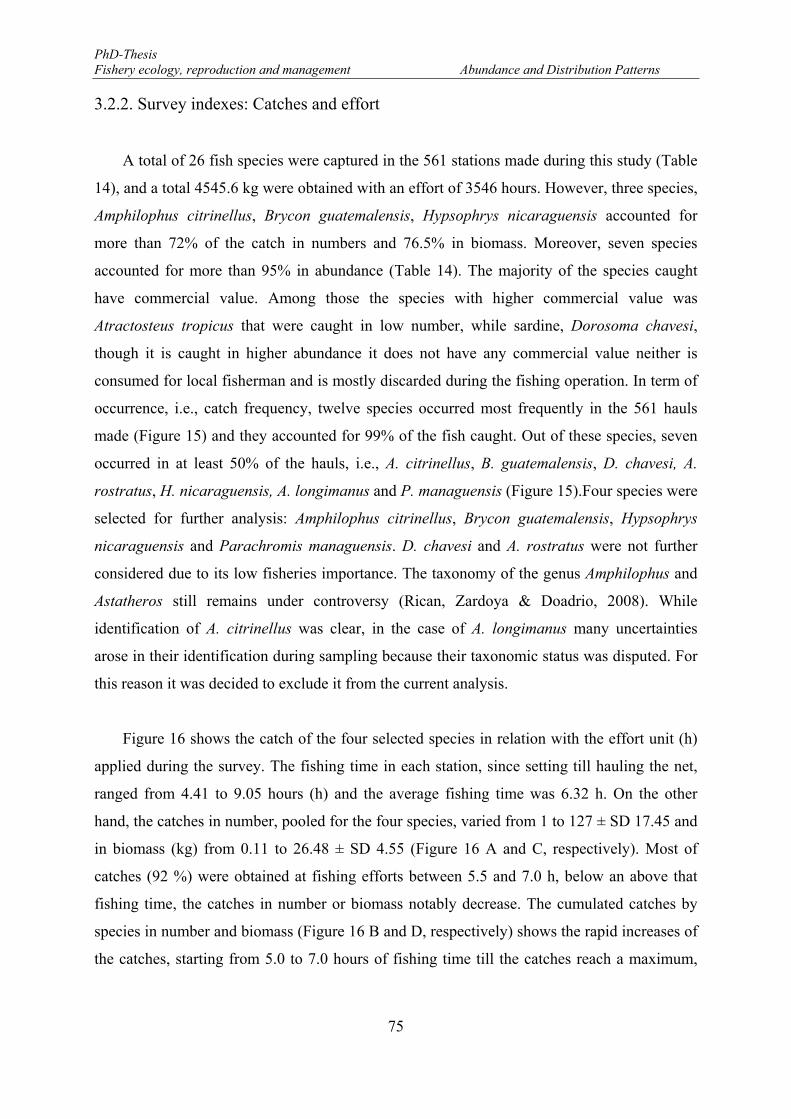
PhD-Thesis Fishery ecology, reproduction and management Abundance and Distribution Patterns
75
3.2.2. Survey indexes: Catches and effort
A total of 26 fish species were captured in the 561 stations made during this study (Table
14), and a total 4545.6 kg were obtained with an effort of 3546 hours. However, three species,
Amphilophus citrinellus, Brycon guatemalensis, Hypsophrys nicaraguensis accounted for
more than 72% of the catch in numbers and 76.5% in biomass. Moreover, seven species
accounted for more than 95% in abundance (Table 14). The majority of the species caught
have commercial value. Among those the species with higher commercial value was
Atractosteus tropicus that were caught in low number, while sardine, Dorosoma chavesi,
though it is caught in higher abundance it does not have any commercial value neither is
consumed for local fisherman and is mostly discarded during the fishing operation. In term of
occurrence, i.e., catch frequency, twelve species occurred most frequently in the 561 hauls
made (Figure 15) and they accounted for 99% of the fish caught. Out of these species, seven
occurred in at least 50% of the hauls, i.e., A. citrinellus, B. guatemalensis, D. chavesi, A.
rostratus, H. nicaraguensis, A. longimanus and P. managuensis (Figure 15).Four species were
selected for further analysis: Amphilophus citrinellus, Brycon guatemalensis, Hypsophrys
nicaraguensis and Parachromis managuensis. D. chavesi and A. rostratus were not further
considered due to its low fisheries importance. The taxonomy of the genus Amphilophus and
Astatheros still remains under controversy (Rican, Zardoya & Doadrio, 2008). While
identification of A. citrinellus was clear, in the case of A. longimanus many uncertainties
arose in their identification during sampling because their taxonomic status was disputed. For
this reason it was decided to exclude it from the current analysis.
Figure 16 shows the catch of the four selected species in relation with the effort unit (h)
applied during the survey. The fishing time in each station, since setting till hauling the net,
ranged from 4.41 to 9.05 hours (h) and the average fishing time was 6.32 h. On the other
hand, the catches in number, pooled for the four species, varied from 1 to 127 ± SD 17.45 and
in biomass (kg) from 0.11 to 26.48 ± SD 4.55 (Figure 16 A and C, respectively). Most of
catches (92 %) were obtained at fishing efforts between 5.5 and 7.0 h, below an above that
fishing time, the catches in number or biomass notably decrease. The cumulated catches by
species in number and biomass (Figure 16 B and D, respectively) shows the rapid increases of
the catches, starting from 5.0 to 7.0 hours of fishing time till the catches reach a maximum,
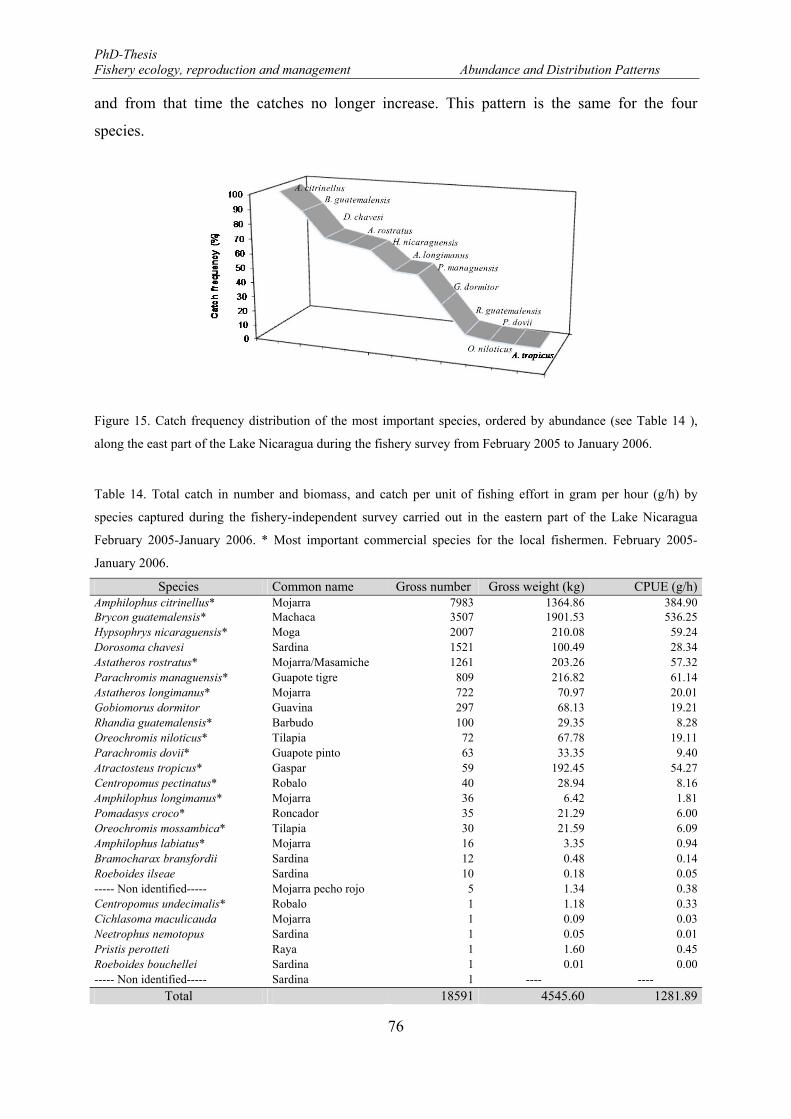
PhD-Thesis Fishery ecology, reproduction and management Abundance and Distribution Patterns
76
and from that time the catches no longer increase. This pattern is the same for the four
species.
Figure 15. Catch frequency distribution of the most important species, ordered by abundance (see Table 14 ),
along the east part of the Lake Nicaragua during the fishery survey from February 2005 to January 2006.
Table 14. Total catch in number and biomass, and catch per unit of fishing effort in gram per hour (g/h) by
species captured during the fishery-independent survey carried out in the eastern part of the Lake Nicaragua
February 2005-January 2006. * Most important commercial species for the local fishermen. February 2005-
January 2006.
Species Common name Gross number Gross weight (kg) CPUE (g/h)Amphilophus citrinellus* Mojarra 7983 1364.86 384.90Brycon guatemalensis* Machaca 3507 1901.53 536.25Hypsophrys nicaraguensis* Moga 2007 210.08 59.24Dorosoma chavesi Sardina 1521 100.49 28.34Astatheros rostratus* Mojarra/Masamiche 1261 203.26 57.32Parachromis managuensis* Guapote tigre 809 216.82 61.14Astatheros longimanus* Mojarra 722 70.97 20.01Gobiomorus dormitor Guavina 297 68.13 19.21Rhandia guatemalensis* Barbudo 100 29.35 8.28Oreochromis niloticus* Tilapia 72 67.78 19.11Parachromis dovii* Guapote pinto 63 33.35 9.40Atractosteus tropicus* Gaspar 59 192.45 54.27Centropomus pectinatus* Robalo 40 28.94 8.16Amphilophus longimanus* Mojarra 36 6.42 1.81Pomadasys croco* Roncador 35 21.29 6.00Oreochromis mossambica* Tilapia 30 21.59 6.09Amphilophus labiatus* Mojarra 16 3.35 0.94Bramocharax bransfordii Sardina 12 0.48 0.14Roeboides ilseae Sardina 10 0.18 0.05----- Non identified----- Mojarra pecho rojo 5 1.34 0.38Centropomus undecimalis* Robalo 1 1.18 0.33Cichlasoma maculicauda Mojarra 1 0.09 0.03Neetrophus nemotopus Sardina 1 0.05 0.01Pristis perotteti Raya 1 1.60 0.45Roeboides bouchellei Sardina 1 0.01 0.00----- Non identified----- Sardina 1 ---- ----
Total 18591 4545.60 1281.89
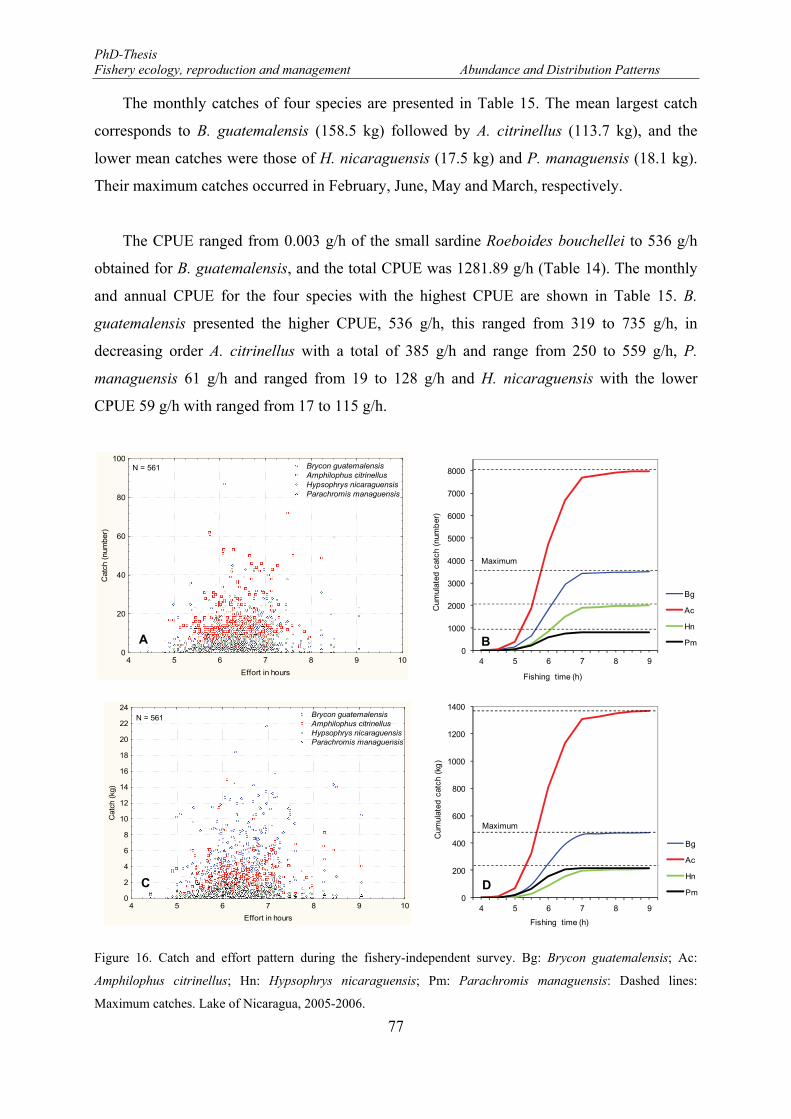
PhD-Thesis Fishery ecology, reproduction and management Abundance and Distribution Patterns
77
The monthly catches of four species are presented in Table 15. The mean largest catch
corresponds to B. guatemalensis (158.5 kg) followed by A. citrinellus (113.7 kg), and the
lower mean catches were those of H. nicaraguensis (17.5 kg) and P. managuensis (18.1 kg).
Their maximum catches occurred in February, June, May and March, respectively.
The CPUE ranged from 0.003 g/h of the small sardine Roeboides bouchellei to 536 g/h
obtained for B. guatemalensis, and the total CPUE was 1281.89 g/h (Table 14). The monthly
and annual CPUE for the four species with the highest CPUE are shown in Table 15. B.
guatemalensis presented the higher CPUE, 536 g/h, this ranged from 319 to 735 g/h, in
decreasing order A. citrinellus with a total of 385 g/h and range from 250 to 559 g/h, P.
managuensis 61 g/h and ranged from 19 to 128 g/h and H. nicaraguensis with the lower
CPUE 59 g/h with ranged from 17 to 115 g/h.
Figure 16. Catch and effort pattern during the fishery-independent survey. Bg: Brycon guatemalensis; Ac:
Amphilophus citrinellus; Hn: Hypsophrys nicaraguensis; Pm: Parachromis managuensis: Dashed lines:
Maximum catches. Lake of Nicaragua, 2005-2006.
0
1000
2000
3000
4000
5000
6000
7000
8000
4 5 6 7 8 9
Cum
ulat
ed c
atch
(nu
mb
er)
Fishing time (h)
Bg
Ac
Hn
PmB
Maximum
0
200
400
600
800
1000
1200
1400
4 5 6 7 8 9
Cum
ulat
ed c
atch
(kg
)
Fishing time (h)
Bg
Ac
Hn
PmD
Maximum
4 5 6 7 8 9 10
Effort in hours
0
2
4
6
8
10
12
14
16
18
20
22
24
Cat
ch (
kg)
Brycon guatemalensis Amphilophus citrinellus Hypsophrys nicaraguensis Parachromis managuensis
N = 561
4 5 6 7 8 9 10
Effort in hours
0
20
40
60
80
100
Cat
ch (
num
ber)
Brycon guatemalensis Amphilophus citrinellus Hypsophrys nicaraguensis Parachromis managuensis
N = 561
A
C
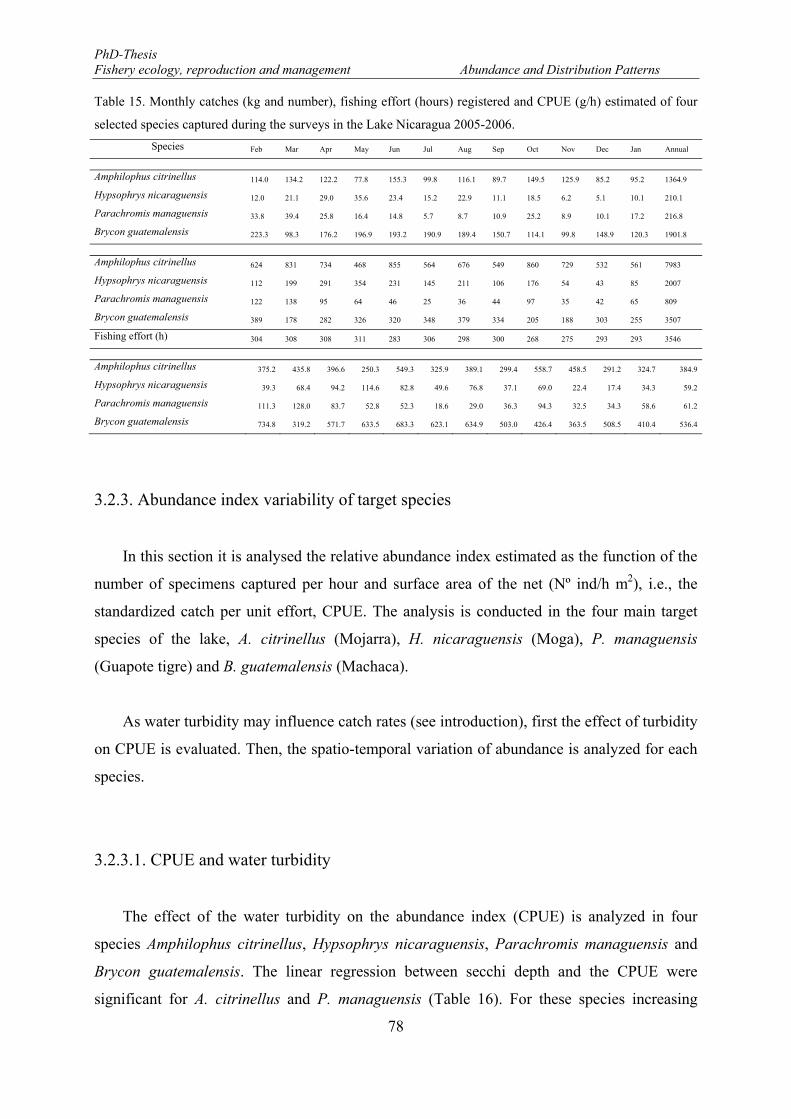
PhD-Thesis Fishery ecology, reproduction and management Abundance and Distribution Patterns
78
Table 15. Monthly catches (kg and number), fishing effort (hours) registered and CPUE (g/h) estimated of four
selected species captured during the surveys in the Lake Nicaragua 2005-2006.
Species Feb Mar Apr May Jun Jul Aug Sep Oct Nov Dec Jan Annual
Amphilophus citrinellus 114.0 134.2 122.2 77.8 155.3 99.8 116.1 89.7 149.5 125.9 85.2 95.2 1364.9
Hypsophrys nicaraguensis 12.0 21.1 29.0 35.6 23.4 15.2 22.9 11.1 18.5 6.2 5.1 10.1 210.1
Parachromis managuensis 33.8 39.4 25.8 16.4 14.8 5.7 8.7 10.9 25.2 8.9 10.1 17.2 216.8
Brycon guatemalensis 223.3 98.3 176.2 196.9 193.2 190.9 189.4 150.7 114.1 99.8 148.9 120.3 1901.8
Amphilophus citrinellus 624 831 734 468 855 564 676 549 860 729 532 561 7983
Hypsophrys nicaraguensis 112 199 291 354 231 145 211 106 176 54 43 85 2007
Parachromis managuensis 122 138 95 64 46 25 36 44 97 35 42 65 809
Brycon guatemalensis 389 178 282 326 320 348 379 334 205 188 303 255 3507
Fishing effort (h) 304 308 308 311 283 306 298 300 268 275 293 293 3546
Amphilophus citrinellus 375.2 435.8 396.6 250.3 549.3 325.9 389.1 299.4 558.7 458.5 291.2 324.7 384.9
Hypsophrys nicaraguensis 39.3 68.4 94.2 114.6 82.8 49.6 76.8 37.1 69.0 22.4 17.4 34.3 59.2
Parachromis managuensis 111.3 128.0 83.7 52.8 52.3 18.6 29.0 36.3 94.3 32.5 34.3 58.6 61.2
Brycon guatemalensis 734.8 319.2 571.7 633.5 683.3 623.1 634.9 503.0 426.4 363.5 508.5 410.4 536.4
3.2.3. Abundance index variability of target species
In this section it is analysed the relative abundance index estimated as the function of the
number of specimens captured per hour and surface area of the net (Nº ind/h m2), i.e., the
standardized catch per unit effort, CPUE. The analysis is conducted in the four main target
species of the lake, A. citrinellus (Mojarra), H. nicaraguensis (Moga), P. managuensis
(Guapote tigre) and B. guatemalensis (Machaca).
As water turbidity may influence catch rates (see introduction), first the effect of turbidity
on CPUE is evaluated. Then, the spatio-temporal variation of abundance is analyzed for each
species.
3.2.3.1. CPUE and water turbidity
The effect of the water turbidity on the abundance index (CPUE) is analyzed in four
species Amphilophus citrinellus, Hypsophrys nicaraguensis, Parachromis managuensis and
Brycon guatemalensis. The linear regression between secchi depth and the CPUE were
significant for A. citrinellus and P. managuensis (Table 16). For these species increasing
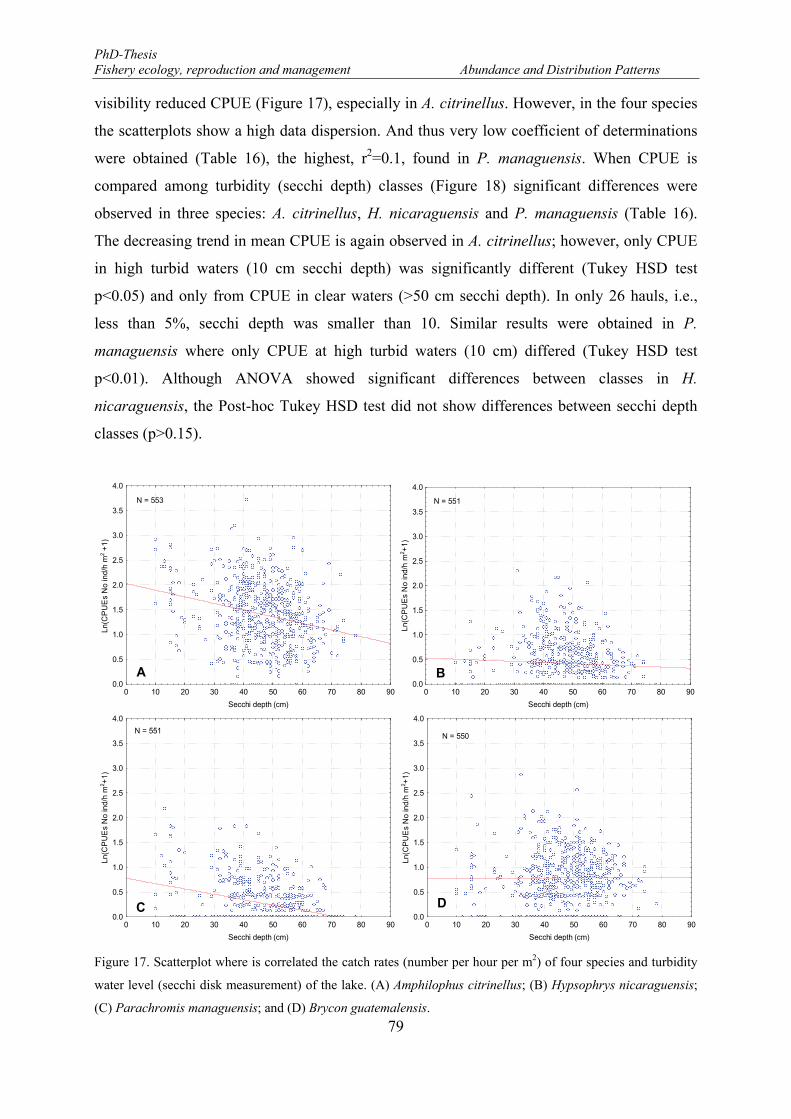
PhD-Thesis Fishery ecology, reproduction and management Abundance and Distribution Patterns
79
visibility reduced CPUE (Figure 17), especially in A. citrinellus. However, in the four species
the scatterplots show a high data dispersion. And thus very low coefficient of determinations
were obtained (Table 16), the highest, r2=0.1, found in P. managuensis. When CPUE is
compared among turbidity (secchi depth) classes (Figure 18) significant differences were
observed in three species: A. citrinellus, H. nicaraguensis and P. managuensis (Table 16).
The decreasing trend in mean CPUE is again observed in A. citrinellus; however, only CPUE
in high turbid waters (10 cm secchi depth) was significantly different (Tukey HSD test
p<0.05) and only from CPUE in clear waters (>50 cm secchi depth). In only 26 hauls, i.e.,
less than 5%, secchi depth was smaller than 10. Similar results were obtained in P.
managuensis where only CPUE at high turbid waters (10 cm) differed (Tukey HSD test
p<0.01). Although ANOVA showed significant differences between classes in H.
nicaraguensis, the Post-hoc Tukey HSD test did not show differences between secchi depth
classes (p>0.15).
Figure 17. Scatterplot where is correlated the catch rates (number per hour per m2) of four species and turbidity
water level (secchi disk measurement) of the lake. (A) Amphilophus citrinellus; (B) Hypsophrys nicaraguensis;
(C) Parachromis managuensis; and (D) Brycon guatemalensis.
0 10 20 30 40 50 60 70 80 90
Secchi depth (cm)
0.0
0.5
1.0
1.5
2.0
2.5
3.0
3.5
4.0
Ln(C
PU
Es
No
ind/
h m
2 +1)
N = 553
A
0 10 20 30 40 50 60 70 80 90
Secchi depth (cm)
0.0
0.5
1.0
1.5
2.0
2.5
3.0
3.5
4.0
Ln(C
PU
Es
No
ind/
h m
2 +1)
N = 551
C0 10 20 30 40 50 60 70 80 90
Secchi depth (cm)
0.0
0.5
1.0
1.5
2.0
2.5
3.0
3.5
4.0
Ln(C
PU
Es
No
ind/
h m
2 +1)
N = 550
D
0 10 20 30 40 50 60 70 80 90
Secchi depth (cm)
0.0
0.5
1.0
1.5
2.0
2.5
3.0
3.5
4.0
Ln(C
PU
Es
No
ind/
h m
2 +1)
N = 551
B
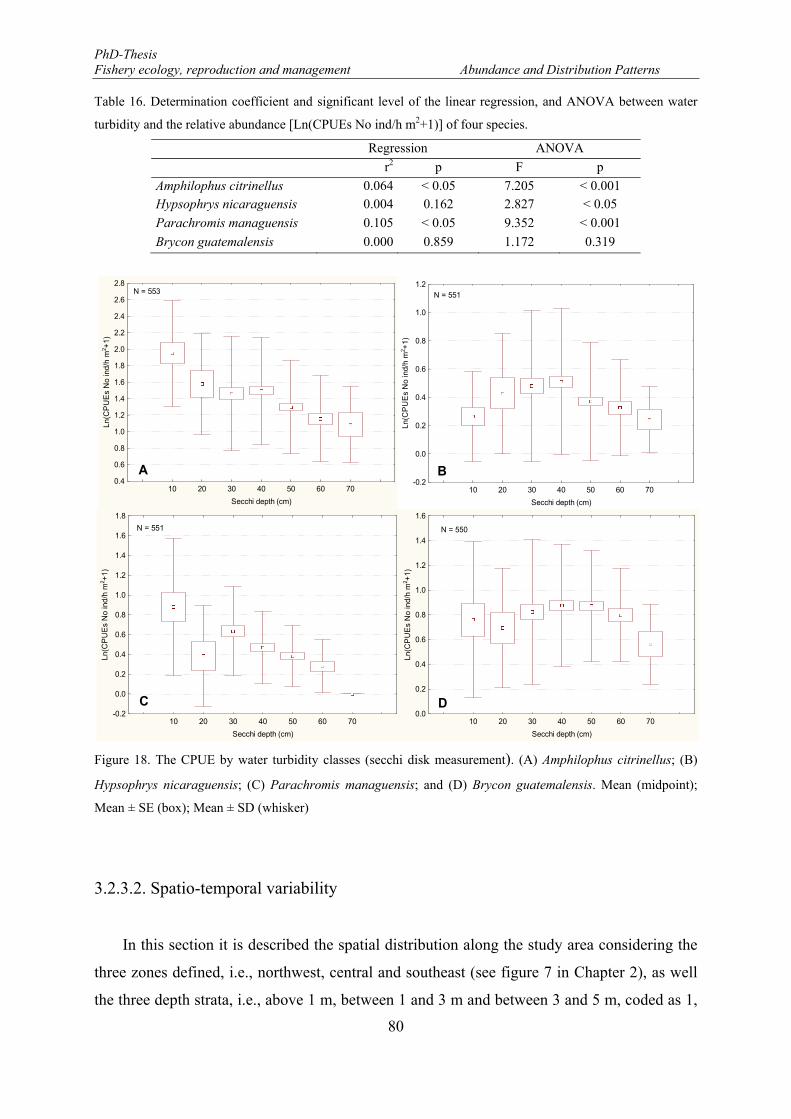
PhD-Thesis Fishery ecology, reproduction and management Abundance and Distribution Patterns
80
Table 16. Determination coefficient and significant level of the linear regression, and ANOVA between water
turbidity and the relative abundance [Ln(CPUEs No ind/h m2+1)] of four species.
Regression ANOVA
r2 p F p
Amphilophus citrinellus 0.064 < 0.05 7.205 < 0.001 Hypsophrys nicaraguensis 0.004 0.162 2.827 < 0.05
Parachromis managuensis 0.105 < 0.05 9.352 < 0.001
Brycon guatemalensis 0.000 0.859 1.172 0.319
Figure 18. The CPUE by water turbidity classes (secchi disk measurement). (A) Amphilophus citrinellus; (B)
Hypsophrys nicaraguensis; (C) Parachromis managuensis; and (D) Brycon guatemalensis. Mean (midpoint);
Mean ± SE (box); Mean ± SD (whisker)
3.2.3.2. Spatio-temporal variability
In this section it is described the spatial distribution along the study area considering the
three zones defined, i.e., northwest, central and southeast (see figure 7 in Chapter 2), as well
the three depth strata, i.e., above 1 m, between 1 and 3 m and between 3 and 5 m, coded as 1,
10 20 30 40 50 60 70
Secchi depth (cm)
0.4
0.6
0.8
1.0
1.2
1.4
1.6
1.8
2.0
2.2
2.4
2.6
2.8
Ln(C
PU
Es
No
ind/
h m
2 +1)
N = 553
A
10 20 30 40 50 60 70
Secchi depth (cm)
-0.2
0.0
0.2
0.4
0.6
0.8
1.0
1.2
1.4
1.6
1.8
Ln(C
PU
Es
No
ind/
h m
2 +1)
N = 551
C
10 20 30 40 50 60 70
Secchi depth (cm)
0.0
0.2
0.4
0.6
0.8
1.0
1.2
1.4
1.6
Ln(C
PU
Es
No
ind/
h m
2 +1)
N = 550
D
10 20 30 40 50 60 70
Secchi depth (cm)
-0.2
0.0
0.2
0.4
0.6
0.8
1.0
1.2
Ln(C
PU
Es
No
ind/
h m
2 +1)
N = 551
B
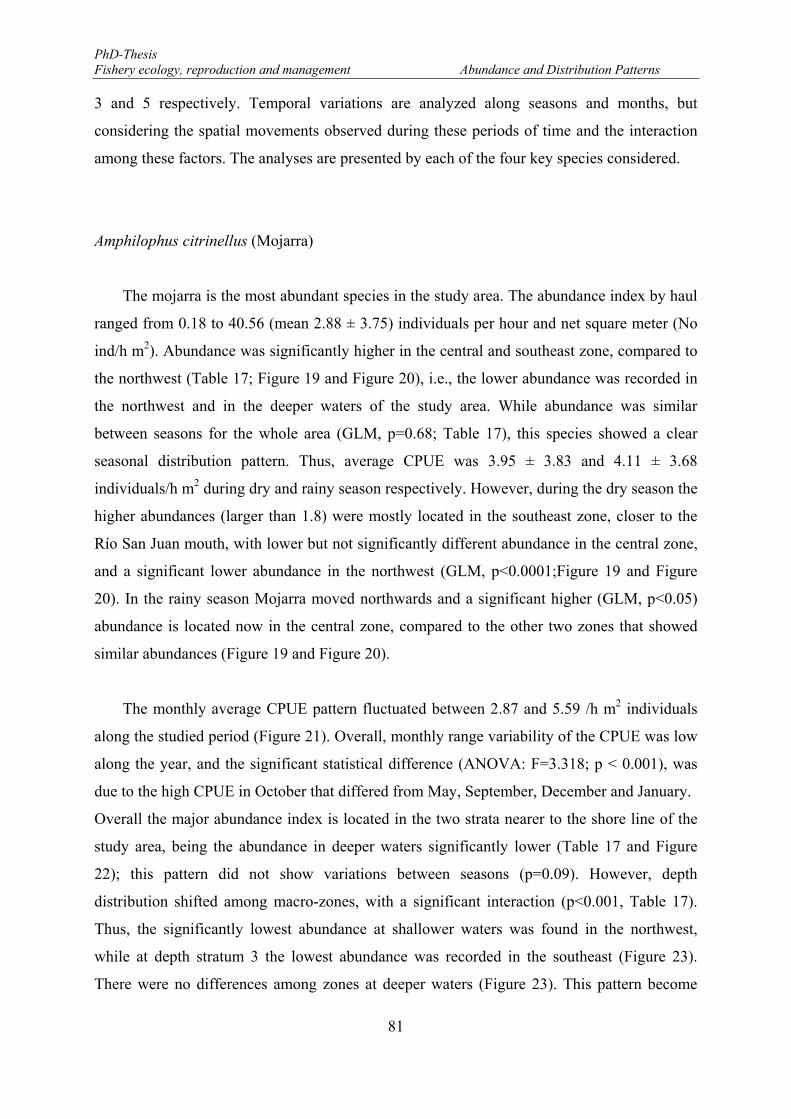
PhD-Thesis Fishery ecology, reproduction and management Abundance and Distribution Patterns
81
3 and 5 respectively. Temporal variations are analyzed along seasons and months, but
considering the spatial movements observed during these periods of time and the interaction
among these factors. The analyses are presented by each of the four key species considered.
Amphilophus citrinellus (Mojarra)
The mojarra is the most abundant species in the study area. The abundance index by haul
ranged from 0.18 to 40.56 (mean 2.88 ± 3.75) individuals per hour and net square meter (No
ind/h m2). Abundance was significantly higher in the central and southeast zone, compared to
the northwest (Table 17; Figure 19 and Figure 20), i.e., the lower abundance was recorded in
the northwest and in the deeper waters of the study area. While abundance was similar
between seasons for the whole area (GLM, p=0.68; Table 17), this species showed a clear
seasonal distribution pattern. Thus, average CPUE was 3.95 ± 3.83 and 4.11 ± 3.68
individuals/h m2 during dry and rainy season respectively. However, during the dry season the
higher abundances (larger than 1.8) were mostly located in the southeast zone, closer to the
Río San Juan mouth, with lower but not significantly different abundance in the central zone,
and a significant lower abundance in the northwest (GLM, p<0.0001;Figure 19 and Figure
20). In the rainy season Mojarra moved northwards and a significant higher (GLM, p<0.05)
abundance is located now in the central zone, compared to the other two zones that showed
similar abundances (Figure 19 and Figure 20).
The monthly average CPUE pattern fluctuated between 2.87 and 5.59 /h m2 individuals
along the studied period (Figure 21). Overall, monthly range variability of the CPUE was low
along the year, and the significant statistical difference (ANOVA: F=3.318; p < 0.001), was
due to the high CPUE in October that differed from May, September, December and January.
Overall the major abundance index is located in the two strata nearer to the shore line of the
study area, being the abundance in deeper waters significantly lower (Table 17 and Figure
22); this pattern did not show variations between seasons (p=0.09). However, depth
distribution shifted among macro-zones, with a significant interaction (p<0.001, Table 17).
Thus, the significantly lowest abundance at shallower waters was found in the northwest,
while at depth stratum 3 the lowest abundance was recorded in the southeast (Figure 23).
There were no differences among zones at deeper waters (Figure 23). This pattern become
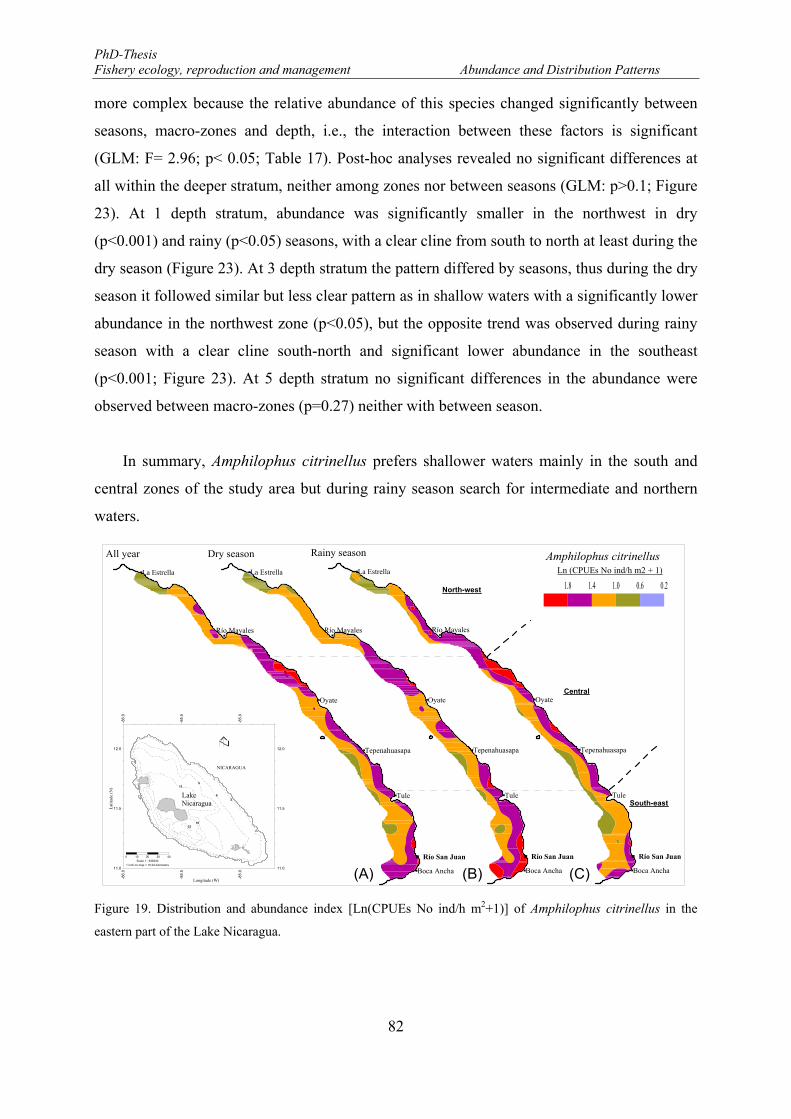
PhD-Thesis Fishery ecology, reproduction and management Abundance and Distribution Patterns
82
more complex because the relative abundance of this species changed significantly between
seasons, macro-zones and depth, i.e., the interaction between these factors is significant
(GLM: F= 2.96; p< 0.05; Table 17). Post-hoc analyses revealed no significant differences at
all within the deeper stratum, neither among zones nor between seasons (GLM: p>0.1; Figure
23). At 1 depth stratum, abundance was significantly smaller in the northwest in dry
(p<0.001) and rainy (p<0.05) seasons, with a clear cline from south to north at least during the
dry season (Figure 23). At 3 depth stratum the pattern differed by seasons, thus during the dry
season it followed similar but less clear pattern as in shallow waters with a significantly lower
abundance in the northwest zone (p<0.05), but the opposite trend was observed during rainy
season with a clear cline south-north and significant lower abundance in the southeast
(p<0.001; Figure 23). At 5 depth stratum no significant differences in the abundance were
observed between macro-zones (p=0.27) neither with between season.
In summary, Amphilophus citrinellus prefers shallower waters mainly in the south and
central zones of the study area but during rainy season search for intermediate and northern
waters.
Figure 19. Distribution and abundance index [Ln(CPUEs No ind/h m2+1)] of Amphilophus citrinellus in the
eastern part of the Lake Nicaragua.
Río Mayales
Boca Ancha
Tule
Tepenahuasapa
Oyate
La Estrella
Río San Juan
Río Mayales
Boca Ancha
Tule
Tepenahuasapa
Oyate
La Estrella
Río San Juan
Ln (CPUEs No ind/h m2 + 1)
Dry seasonAll year
Río Mayales
Boca Ancha
Tule
Tepenahuasapa
Oyate
La Estrella
Río San Juan
Rainy season
-86.
0 -8
6.0
-85.
5 -8
5.5
-85.
0 -8
5.0
11.0 11.0
11.5 11.5
12.0 12.0
2LakeNicaragua
3316
139
6
NICARAGUA
Latit
ude
(N)
Longitude (W)
0 10 20 30 40Scale 1 : 639343
1 inch on map = 16.24 kilometers
North-west
Central
South-east
0.20.61.01.41.8
Amphilophus citrinellus
(A) (B) (C)
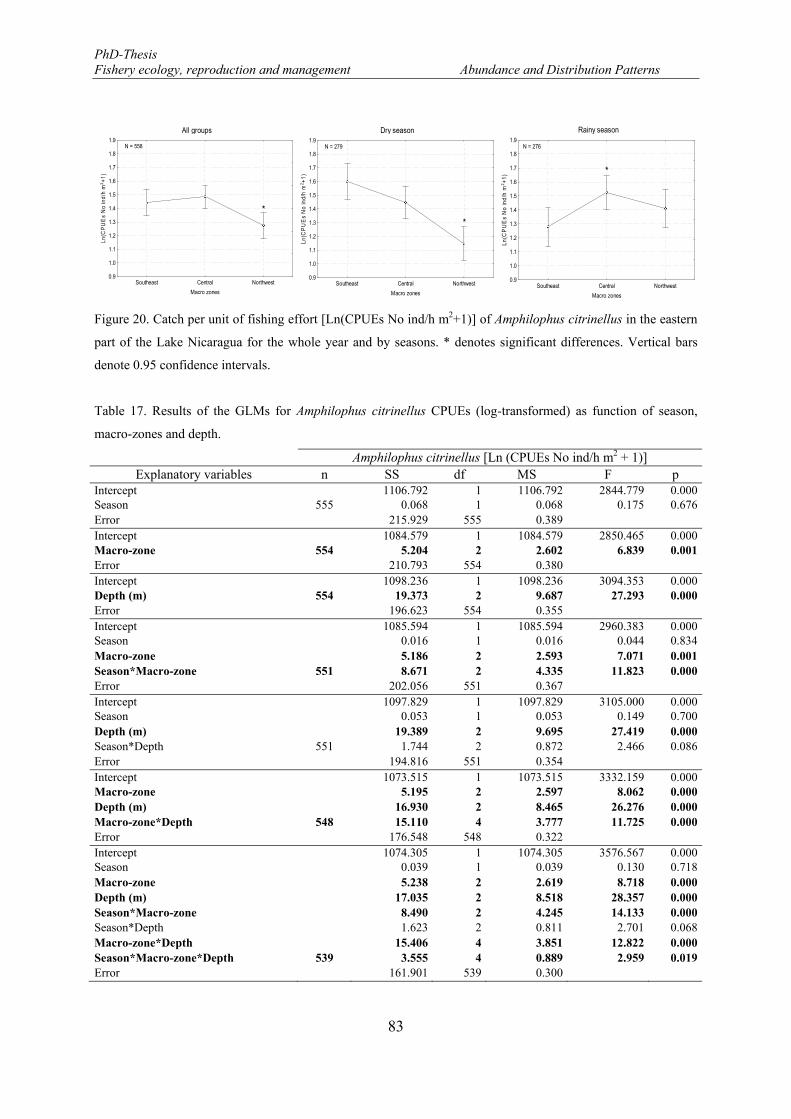
PhD-Thesis Fishery ecology, reproduction and management Abundance and Distribution Patterns
83
Figure 20. Catch per unit of fishing effort [Ln(CPUEs No ind/h m2+1)] of Amphilophus citrinellus in the eastern
part of the Lake Nicaragua for the whole year and by seasons. * denotes significant differences. Vertical bars
denote 0.95 confidence intervals.
Table 17. Results of the GLMs for Amphilophus citrinellus CPUEs (log-transformed) as function of season,
macro-zones and depth.
Amphilophus citrinellus [Ln (CPUEs No ind/h m2 + 1)] Explanatory variables n SS df MS F p
Intercept 1106.792 1 1106.792 2844.779 0.000Season 555 0.068 1 0.068 0.175 0.676Error 215.929 555 0.389 Intercept 1084.579 1 1084.579 2850.465 0.000Macro-zone 554 5.204 2 2.602 6.839 0.001Error 210.793 554 0.380 Intercept 1098.236 1 1098.236 3094.353 0.000Depth (m) 554 19.373 2 9.687 27.293 0.000Error 196.623 554 0.355 Intercept 1085.594 1 1085.594 2960.383 0.000Season 0.016 1 0.016 0.044 0.834Macro-zone 5.186 2 2.593 7.071 0.001Season*Macro-zone 551 8.671 2 4.335 11.823 0.000Error 202.056 551 0.367 Intercept 1097.829 1 1097.829 3105.000 0.000Season 0.053 1 0.053 0.149 0.700Depth (m) 19.389 2 9.695 27.419 0.000Season*Depth 551 1.744 2 0.872 2.466 0.086Error 194.816 551 0.354 Intercept 1073.515 1 1073.515 3332.159 0.000Macro-zone 5.195 2 2.597 8.062 0.000Depth (m) 16.930 2 8.465 26.276 0.000Macro-zone*Depth 548 15.110 4 3.777 11.725 0.000Error 176.548 548 0.322 Intercept 1074.305 1 1074.305 3576.567 0.000Season 0.039 1 0.039 0.130 0.718Macro-zone 5.238 2 2.619 8.718 0.000Depth (m) 17.035 2 8.518 28.357 0.000Season*Macro-zone 8.490 2 4.245 14.133 0.000Season*Depth 1.623 2 0.811 2.701 0.068Macro-zone*Depth 15.406 4 3.851 12.822 0.000Season*Macro-zone*Depth 539 3.555 4 0.889 2.959 0.019Error 161.901 539 0.300
All groups
Southeast Central Northwest
Macro zones
0.9
1.0
1.1
1.2
1.3
1.4
1.5
1.6
1.7
1.8
1.9
Ln(C
PU
Es
No
ind/
h m
2 +1)
N = 558
*
Rainy season
Southeast Central Northwest
Macro zones
0.9
1.0
1.1
1.2
1.3
1.4
1.5
1.6
1.7
1.8
1.9
Ln(C
PU
Es
No
ind/
h m
2 +1)
N = 276
*
Dry season
Southeast Central Northwest
Macro zones
0.9
1.0
1.1
1.2
1.3
1.4
1.5
1.6
1.7
1.8
1.9
Ln(C
PU
Es
No
ind/
h m
2 +1)
N = 279
*
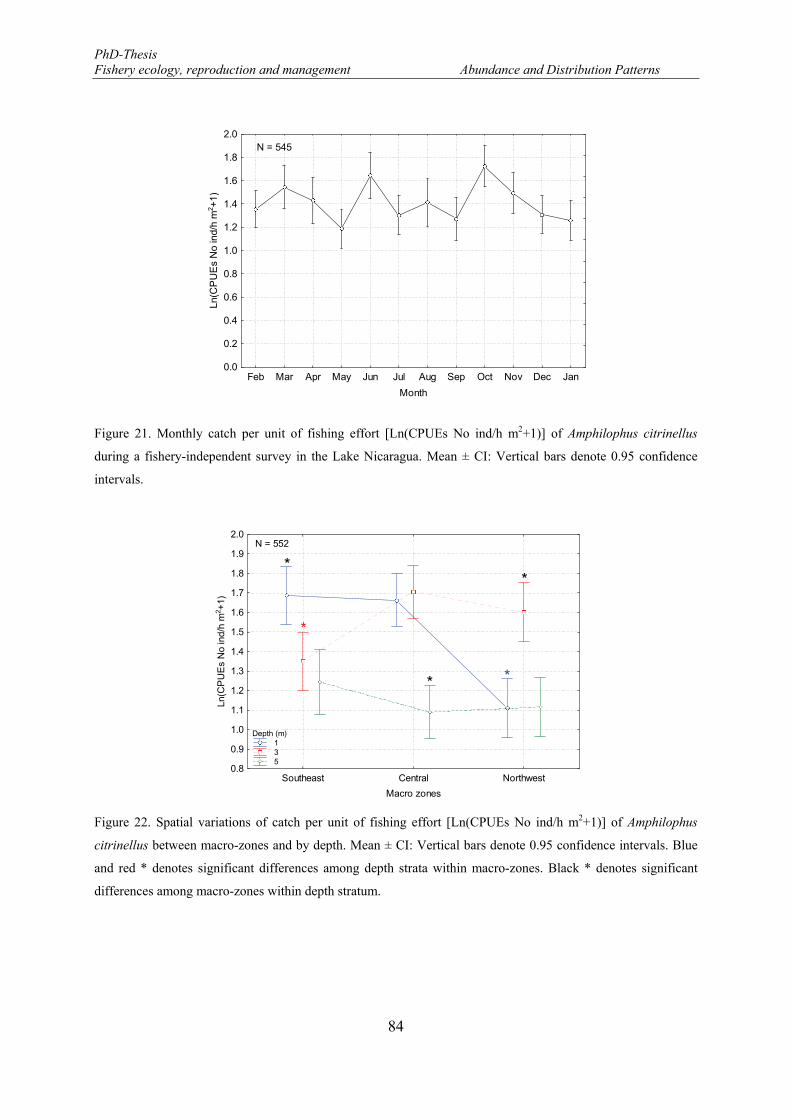
PhD-Thesis Fishery ecology, reproduction and management Abundance and Distribution Patterns
84
Figure 21. Monthly catch per unit of fishing effort [Ln(CPUEs No ind/h m2+1)] of Amphilophus citrinellus
during a fishery-independent survey in the Lake Nicaragua. Mean ± CI: Vertical bars denote 0.95 confidence
intervals.
Figure 22. Spatial variations of catch per unit of fishing effort [Ln(CPUEs No ind/h m2+1)] of Amphilophus
citrinellus between macro-zones and by depth. Mean ± CI: Vertical bars denote 0.95 confidence intervals. Blue
and red * denotes significant differences among depth strata within macro-zones. Black * denotes significant
differences among macro-zones within depth stratum.
Feb Mar Apr May Jun Jul Aug Sep Oct Nov Dec Jan
Month
0.0
0.2
0.4
0.6
0.8
1.0
1.2
1.4
1.6
1.8
2.0
Ln(C
PU
Es
No
ind/
h m
2 +1)
N = 545
Southeast Central Northwest
Macro zones
0.8
0.9
1.0
1.1
1.2
1.3
1.4
1.5
1.6
1.7
1.8
1.9
2.0
Ln(C
PU
Es
No
ind/
h m
2 +1)
Depth (m) 1 3 5
N = 552
*
*
*
*
*
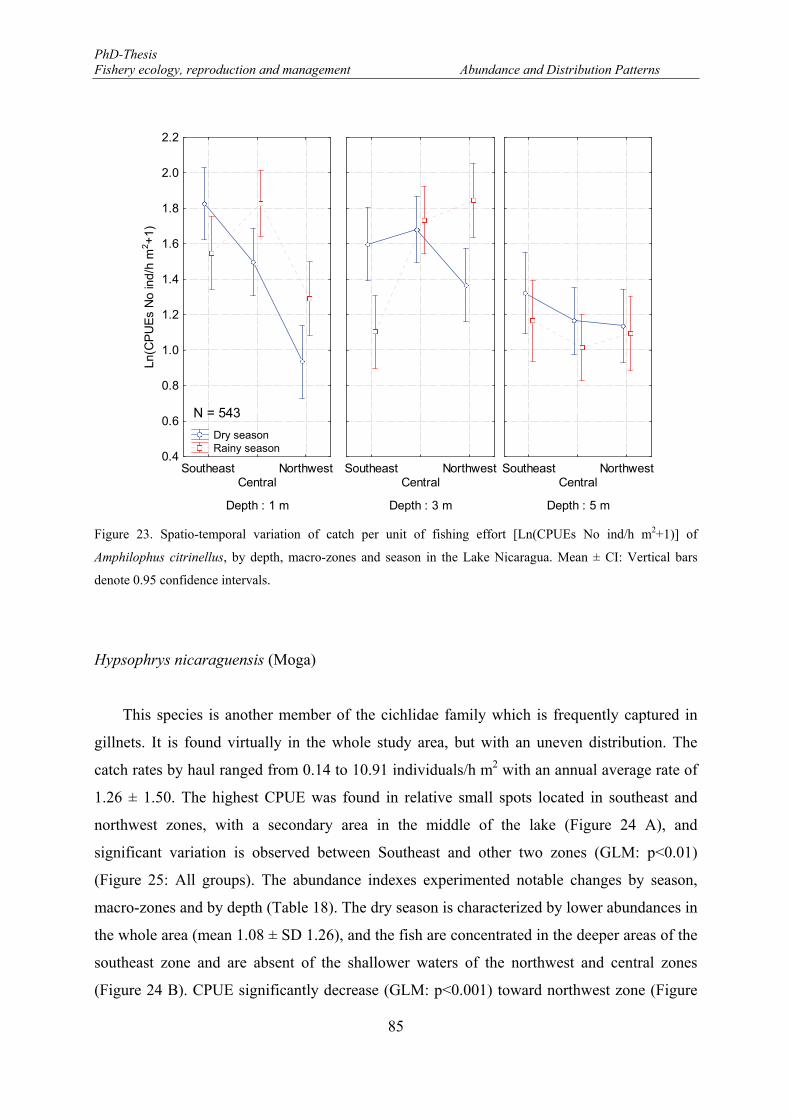
PhD-Thesis Fishery ecology, reproduction and management Abundance and Distribution Patterns
85
Figure 23. Spatio-temporal variation of catch per unit of fishing effort [Ln(CPUEs No ind/h m2+1)] of
Amphilophus citrinellus, by depth, macro-zones and season in the Lake Nicaragua. Mean ± CI: Vertical bars
denote 0.95 confidence intervals.
Hypsophrys nicaraguensis (Moga)
This species is another member of the cichlidae family which is frequently captured in
gillnets. It is found virtually in the whole study area, but with an uneven distribution. The
catch rates by haul ranged from 0.14 to 10.91 individuals/h m2 with an annual average rate of
1.26 ± 1.50. The highest CPUE was found in relative small spots located in southeast and
northwest zones, with a secondary area in the middle of the lake (Figure 24 A), and
significant variation is observed between Southeast and other two zones (GLM: p<0.01)
(Figure 25: All groups). The abundance indexes experimented notable changes by season,
macro-zones and by depth (Table 18). The dry season is characterized by lower abundances in
the whole area (mean 1.08 ± SD 1.26), and the fish are concentrated in the deeper areas of the
southeast zone and are absent of the shallower waters of the northwest and central zones
(Figure 24 B). CPUE significantly decrease (GLM: p<0.001) toward northwest zone (Figure
Depth : 1 m
SoutheastCentral
Northwest0.4
0.6
0.8
1.0
1.2
1.4
1.6
1.8
2.0
2.2Ln
(CP
UE
s N
o in
d/h
m2+
1)
Depth : 3 m
SoutheastCentral
Northwest
Depth : 5 m
SoutheastCentral
Northwest
Dry season Rainy season
N = 543
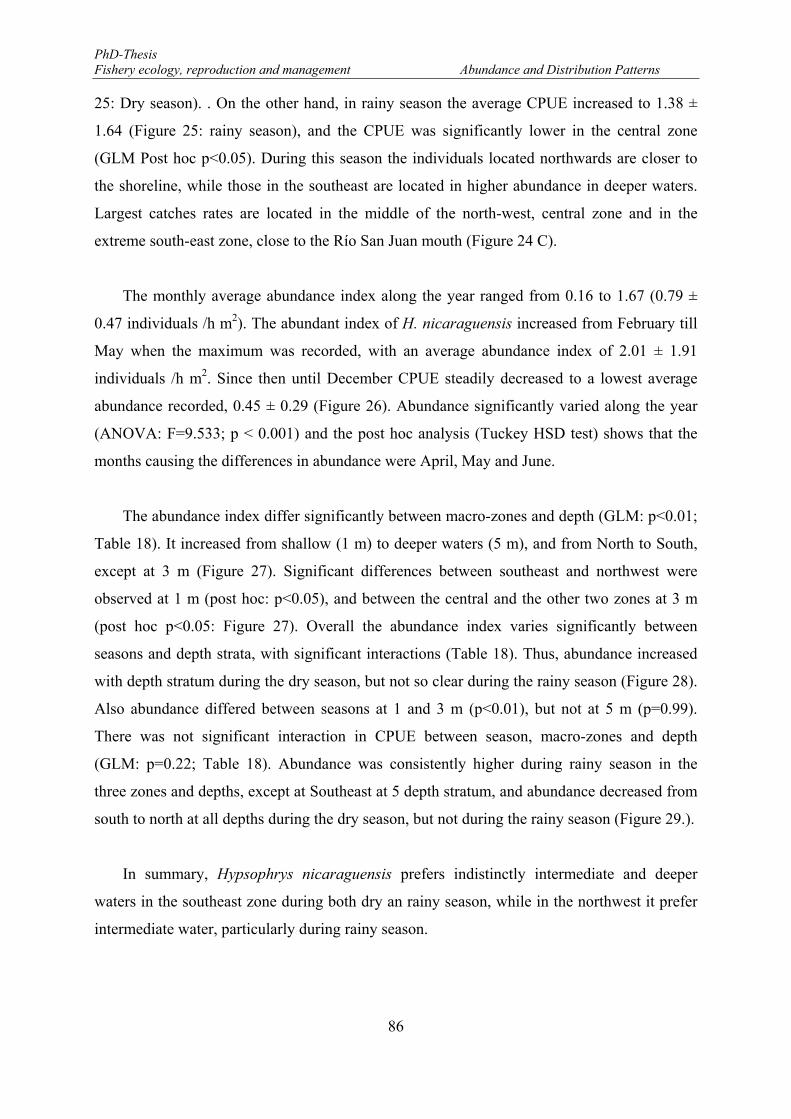
PhD-Thesis Fishery ecology, reproduction and management Abundance and Distribution Patterns
86
25: Dry season). . On the other hand, in rainy season the average CPUE increased to 1.38 ±
1.64 (Figure 25: rainy season), and the CPUE was significantly lower in the central zone
(GLM Post hoc p<0.05). During this season the individuals located northwards are closer to
the shoreline, while those in the southeast are located in higher abundance in deeper waters.
Largest catches rates are located in the middle of the north-west, central zone and in the
extreme south-east zone, close to the Río San Juan mouth (Figure 24 C).
The monthly average abundance index along the year ranged from 0.16 to 1.67 (0.79 ±
0.47 individuals /h m2). The abundant index of H. nicaraguensis increased from February till
May when the maximum was recorded, with an average abundance index of 2.01 ± 1.91
individuals /h m2. Since then until December CPUE steadily decreased to a lowest average
abundance recorded, 0.45 ± 0.29 (Figure 26). Abundance significantly varied along the year
(ANOVA: F=9.533; p < 0.001) and the post hoc analysis (Tuckey HSD test) shows that the
months causing the differences in abundance were April, May and June.
The abundance index differ significantly between macro-zones and depth (GLM: p<0.01;
Table 18). It increased from shallow (1 m) to deeper waters (5 m), and from North to South,
except at 3 m (Figure 27). Significant differences between southeast and northwest were
observed at 1 m (post hoc: p<0.05), and between the central and the other two zones at 3 m
(post hoc p<0.05: Figure 27). Overall the abundance index varies significantly between
seasons and depth strata, with significant interactions (Table 18). Thus, abundance increased
with depth stratum during the dry season, but not so clear during the rainy season (Figure 28).
Also abundance differed between seasons at 1 and 3 m (p<0.01), but not at 5 m (p=0.99).
There was not significant interaction in CPUE between season, macro-zones and depth
(GLM: p=0.22; Table 18). Abundance was consistently higher during rainy season in the
three zones and depths, except at Southeast at 5 depth stratum, and abundance decreased from
south to north at all depths during the dry season, but not during the rainy season (Figure 29.).
In summary, Hypsophrys nicaraguensis prefers indistinctly intermediate and deeper
waters in the southeast zone during both dry an rainy season, while in the northwest it prefer
intermediate water, particularly during rainy season.
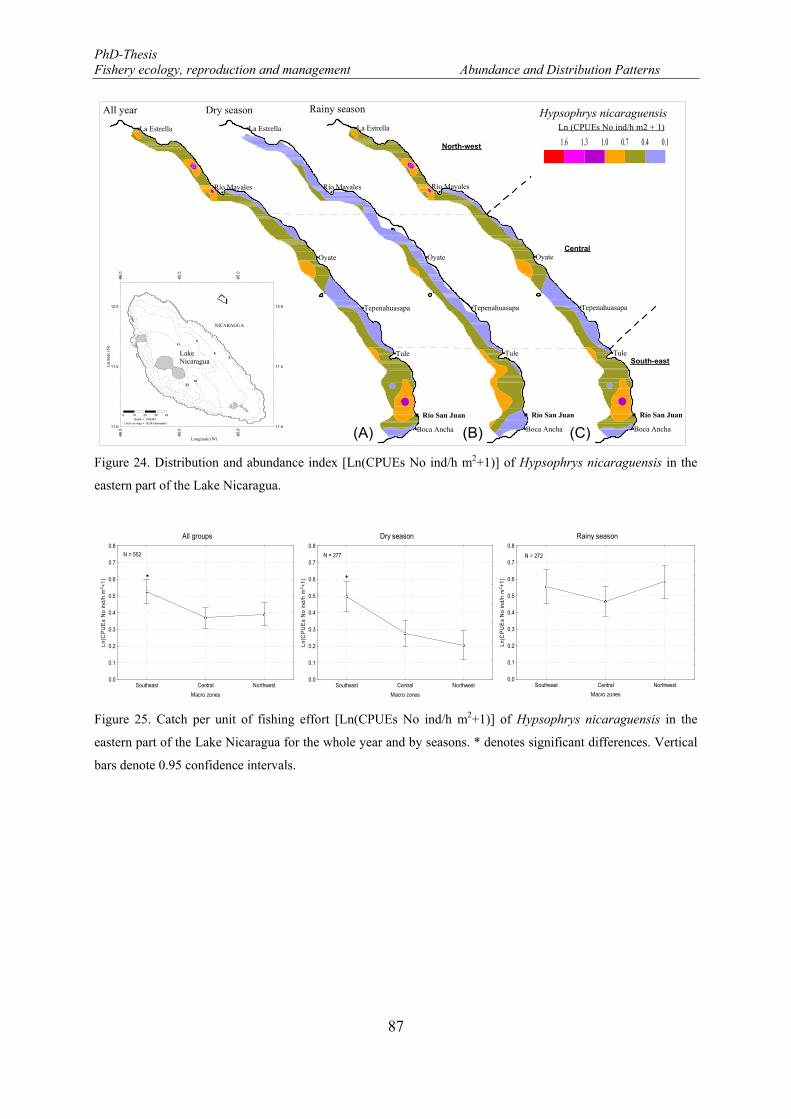
PhD-Thesis Fishery ecology, reproduction and management Abundance and Distribution Patterns
87
Figure 24. Distribution and abundance index [Ln(CPUEs No ind/h m2+1)] of Hypsophrys nicaraguensis in the
eastern part of the Lake Nicaragua.
Figure 25. Catch per unit of fishing effort [Ln(CPUEs No ind/h m2+1)] of Hypsophrys nicaraguensis in the
eastern part of the Lake Nicaragua for the whole year and by seasons. * denotes significant differences. Vertical
bars denote 0.95 confidence intervals.
All groups
Southeast Central Northwest
Macro zones
0.0
0.1
0.2
0.3
0.4
0.5
0.6
0.7
0.8
Ln(C
PU
Es
No
ind/
h m
2 +1)
N = 552
*
Rainy season
Southeast Central Northwest
Macro zones
0.0
0.1
0.2
0.3
0.4
0.5
0.6
0.7
0.8
Ln(C
PU
Es
No
ind/
h m
2 +1)
N = 272
Dry season
Southeast Central Northwest
Macro zones
0.0
0.1
0.2
0.3
0.4
0.5
0.6
0.7
0.8
Ln(C
PU
Es
No
ind/
h m
2 +1)
N = 277
*
Río Mayales
Boca Ancha
Tule
Tepenahuasapa
Oyate
La Estrella
Río San Juan
Río Mayales
Boca Ancha
Tule
Tepenahuasapa
Oyate
La Estrella
Río San Juan
Ln (CPUEs No ind/h m2 + 1)
Dry seasonAll year
Río Mayales
Boca Ancha
Tule
Tepenahuasapa
Oyate
La Estrella
Río San Juan
Rainy season-8
6.0
-86.
0
-85.
5 -8
5.5
-85.
0 -8
5.0
11.0 11.0
11.5 11.5
12.0 12.0
2LakeNicaragua
3316
139
6
NICARAGUA
Latit
ude
(N)
Longitude (W)
0 10 20 30 40Scale 1 : 639343
1 inch on map = 16.24 kilometers
North-west
Central
South-east
0.10.40.71.01.31.6
Hypsophrys nicaraguensis
(A) (B) (C)
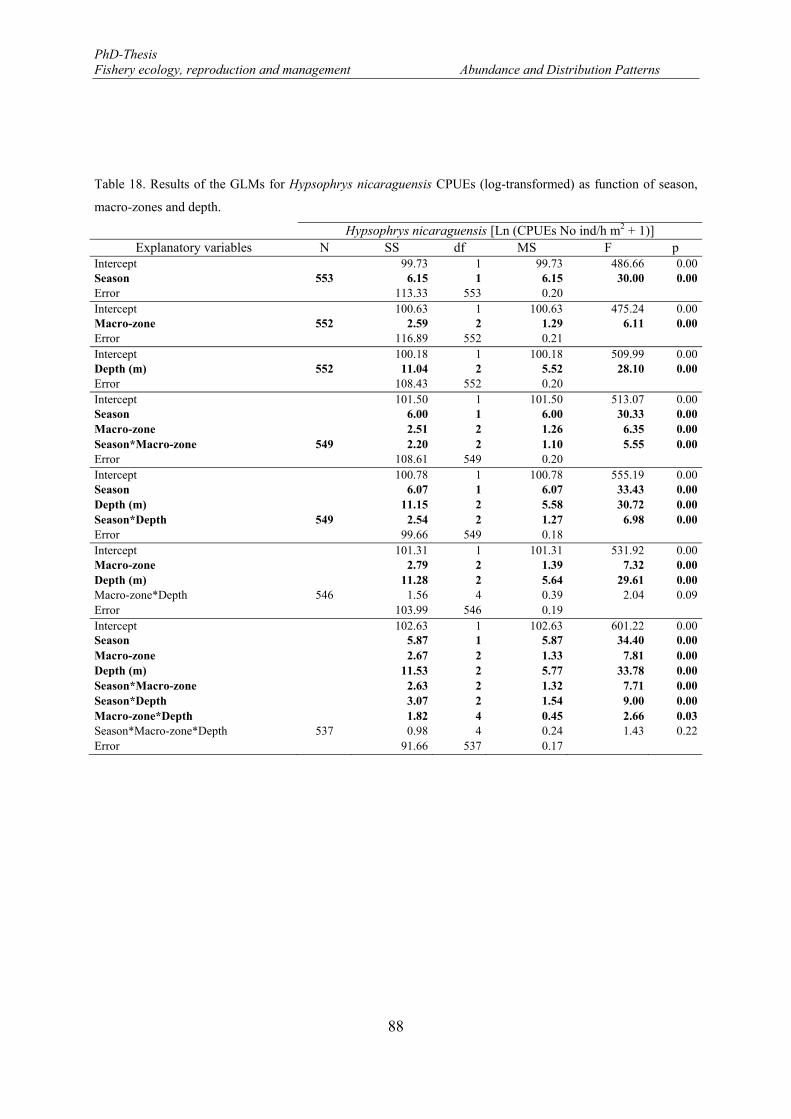
PhD-Thesis Fishery ecology, reproduction and management Abundance and Distribution Patterns
88
Table 18. Results of the GLMs for Hypsophrys nicaraguensis CPUEs (log-transformed) as function of season,
macro-zones and depth.
Hypsophrys nicaraguensis [Ln (CPUEs No ind/h m2 + 1)] Explanatory variables N SS df MS F p
Intercept 99.73 1 99.73 486.66 0.00Season 553 6.15 1 6.15 30.00 0.00Error 113.33 553 0.20 Intercept 100.63 1 100.63 475.24 0.00Macro-zone 552 2.59 2 1.29 6.11 0.00Error 116.89 552 0.21 Intercept 100.18 1 100.18 509.99 0.00Depth (m) 552 11.04 2 5.52 28.10 0.00Error 108.43 552 0.20 Intercept 101.50 1 101.50 513.07 0.00Season 6.00 1 6.00 30.33 0.00Macro-zone 2.51 2 1.26 6.35 0.00Season*Macro-zone 549 2.20 2 1.10 5.55 0.00Error 108.61 549 0.20 Intercept 100.78 1 100.78 555.19 0.00Season 6.07 1 6.07 33.43 0.00Depth (m) 11.15 2 5.58 30.72 0.00Season*Depth 549 2.54 2 1.27 6.98 0.00Error 99.66 549 0.18 Intercept 101.31 1 101.31 531.92 0.00Macro-zone 2.79 2 1.39 7.32 0.00Depth (m) 11.28 2 5.64 29.61 0.00Macro-zone*Depth 546 1.56 4 0.39 2.04 0.09Error 103.99 546 0.19 Intercept 102.63 1 102.63 601.22 0.00Season 5.87 1 5.87 34.40 0.00Macro-zone 2.67 2 1.33 7.81 0.00Depth (m) 11.53 2 5.77 33.78 0.00Season*Macro-zone 2.63 2 1.32 7.71 0.00Season*Depth 3.07 2 1.54 9.00 0.00Macro-zone*Depth 1.82 4 0.45 2.66 0.03Season*Macro-zone*Depth 537 0.98 4 0.24 1.43 0.22Error 91.66 537 0.17
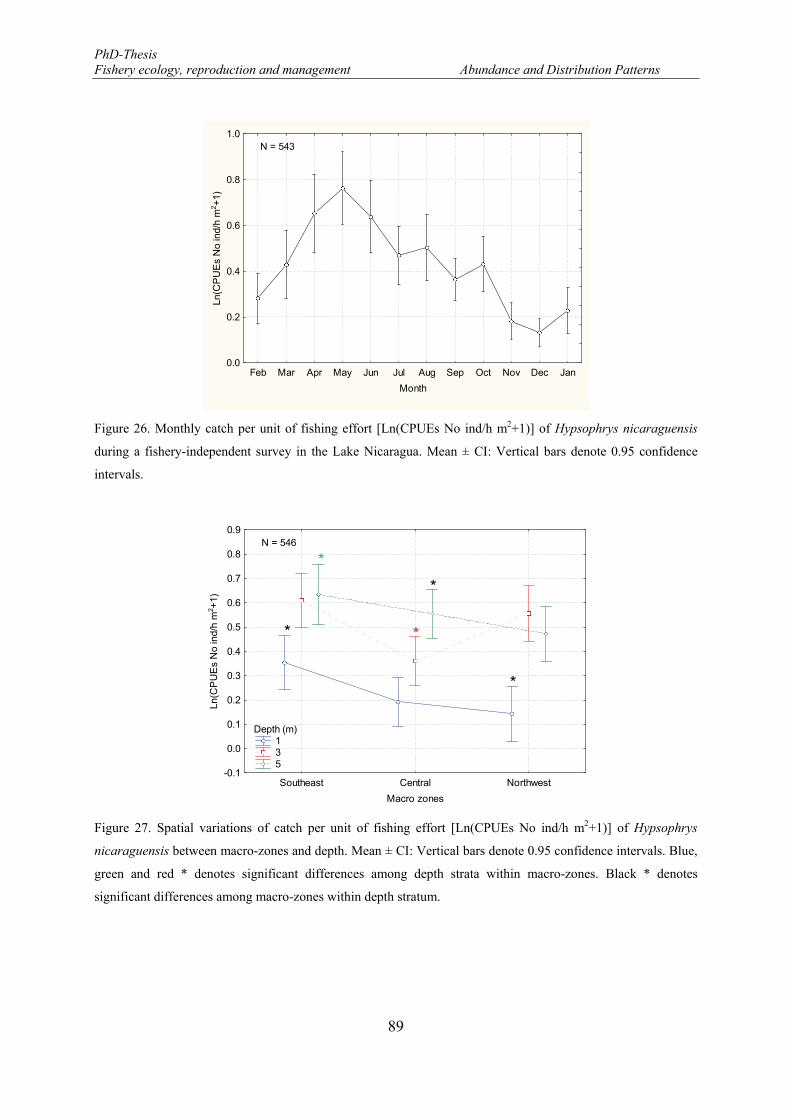
PhD-Thesis Fishery ecology, reproduction and management Abundance and Distribution Patterns
89
Figure 26. Monthly catch per unit of fishing effort [Ln(CPUEs No ind/h m2+1)] of Hypsophrys nicaraguensis
during a fishery-independent survey in the Lake Nicaragua. Mean ± CI: Vertical bars denote 0.95 confidence
intervals.
Figure 27. Spatial variations of catch per unit of fishing effort [Ln(CPUEs No ind/h m2+1)] of Hypsophrys
nicaraguensis between macro-zones and depth. Mean ± CI: Vertical bars denote 0.95 confidence intervals. Blue,
green and red * denotes significant differences among depth strata within macro-zones. Black * denotes
significant differences among macro-zones within depth stratum.
Feb Mar Apr May Jun Jul Aug Sep Oct Nov Dec Jan
Month
0.0
0.2
0.4
0.6
0.8
1.0
Ln(C
PU
Es
No
ind/
h m
2 +1)
N = 543
Southeast Central Northwest
Macro zones
-0.1
0.0
0.1
0.2
0.3
0.4
0.5
0.6
0.7
0.8
0.9
Ln(C
PU
Es
No
ind/
h m
2 +1)
Depth (m) 1 3 5
N = 546
*
*
*
*
*
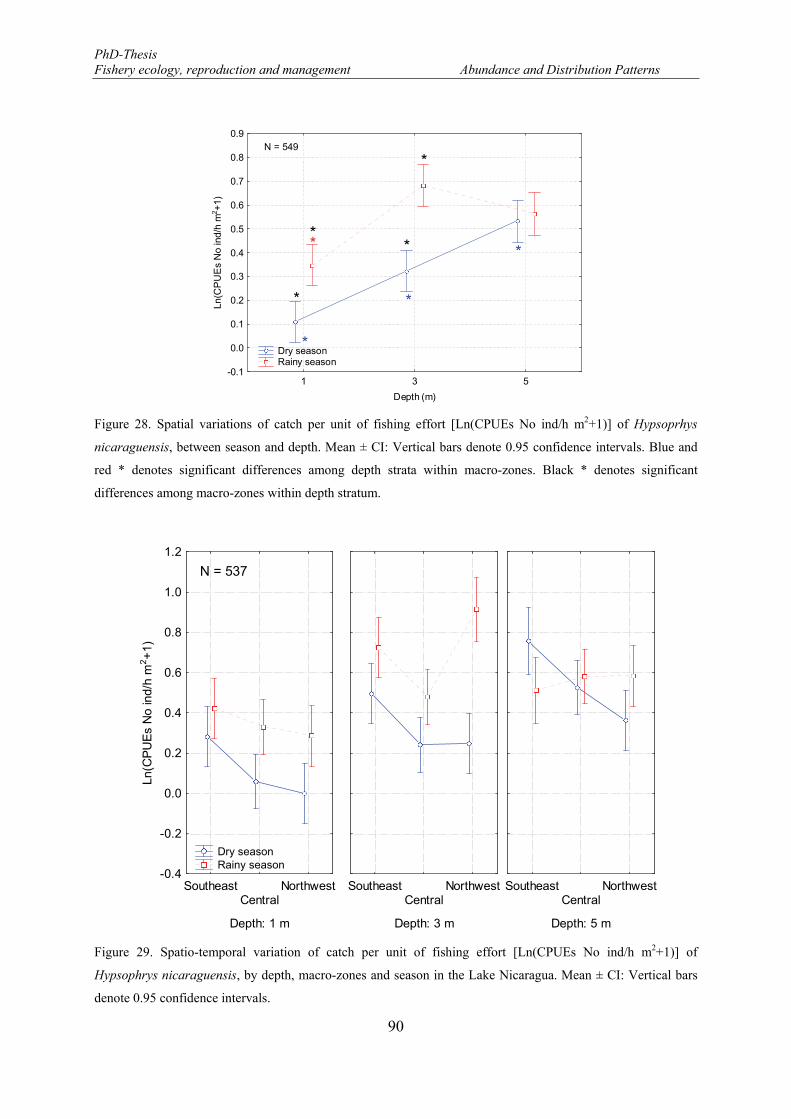
PhD-Thesis Fishery ecology, reproduction and management Abundance and Distribution Patterns
90
Figure 28. Spatial variations of catch per unit of fishing effort [Ln(CPUEs No ind/h m2+1)] of Hypsoprhys
nicaraguensis, between season and depth. Mean ± CI: Vertical bars denote 0.95 confidence intervals. Blue and
red * denotes significant differences among depth strata within macro-zones. Black * denotes significant
differences among macro-zones within depth stratum.
Figure 29. Spatio-temporal variation of catch per unit of fishing effort [Ln(CPUEs No ind/h m2+1)] of
Hypsophrys nicaraguensis, by depth, macro-zones and season in the Lake Nicaragua. Mean ± CI: Vertical bars
denote 0.95 confidence intervals.
1 3 5
Depth (m)
-0.1
0.0
0.1
0.2
0.3
0.4
0.5
0.6
0.7
0.8
0.9
Ln(C
PU
Es
No
ind/
h m
2 +1)
Dry season Rainy season
N = 549
*
*
*
*
*
***
Depth: 1 m
SoutheastCentral
Northwest-0.4
-0.2
0.0
0.2
0.4
0.6
0.8
1.0
1.2
Ln(C
PU
Es
No
ind/
h m
2+
1)
Depth: 3 m
SoutheastCentral
Northwest
Depth: 5 m
SoutheastCentral
Northwest
Dry season Rainy season
N = 537
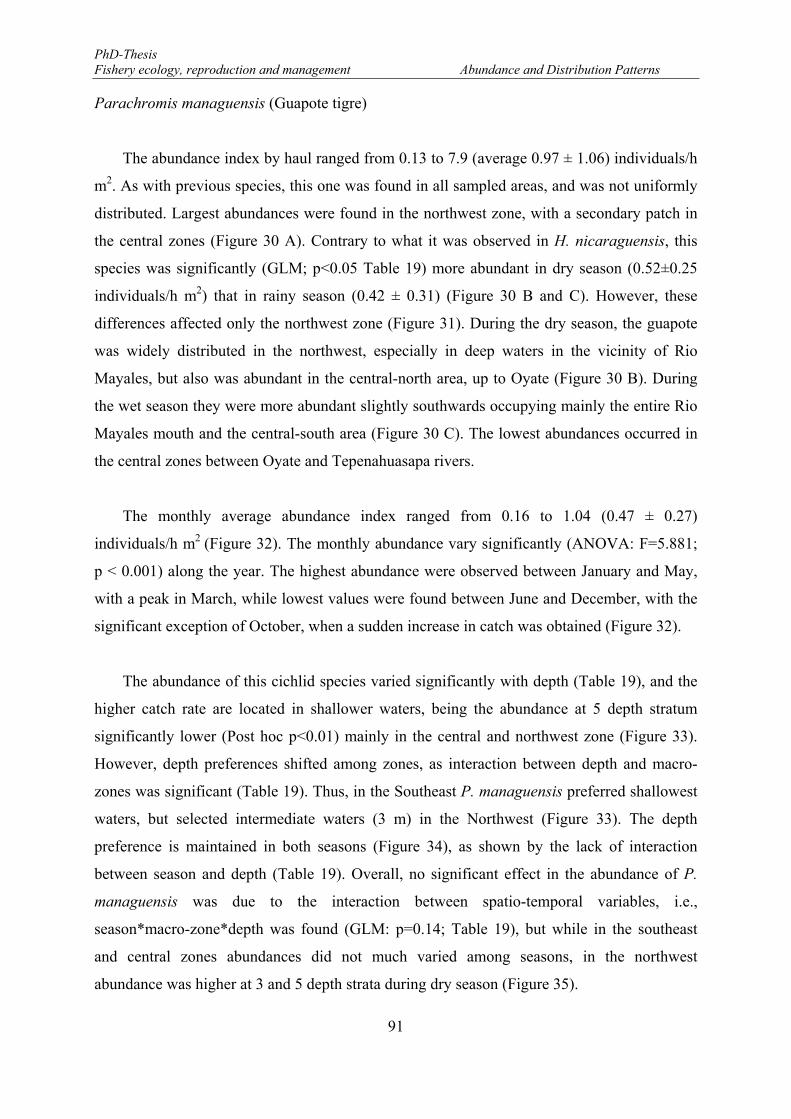
PhD-Thesis Fishery ecology, reproduction and management Abundance and Distribution Patterns
91
Parachromis managuensis (Guapote tigre)
The abundance index by haul ranged from 0.13 to 7.9 (average 0.97 ± 1.06) individuals/h
m2. As with previous species, this one was found in all sampled areas, and was not uniformly
distributed. Largest abundances were found in the northwest zone, with a secondary patch in
the central zones (Figure 30 A). Contrary to what it was observed in H. nicaraguensis, this
species was significantly (GLM; p<0.05 Table 19) more abundant in dry season (0.52±0.25
individuals/h m2) that in rainy season (0.42 ± 0.31) (Figure 30 B and C). However, these
differences affected only the northwest zone (Figure 31). During the dry season, the guapote
was widely distributed in the northwest, especially in deep waters in the vicinity of Rio
Mayales, but also was abundant in the central-north area, up to Oyate (Figure 30 B). During
the wet season they were more abundant slightly southwards occupying mainly the entire Rio
Mayales mouth and the central-south area (Figure 30 C). The lowest abundances occurred in
the central zones between Oyate and Tepenahuasapa rivers.
The monthly average abundance index ranged from 0.16 to 1.04 (0.47 ± 0.27)
individuals/h m2 (Figure 32). The monthly abundance vary significantly (ANOVA: F=5.881;
p < 0.001) along the year. The highest abundance were observed between January and May,
with a peak in March, while lowest values were found between June and December, with the
significant exception of October, when a sudden increase in catch was obtained (Figure 32).
The abundance of this cichlid species varied significantly with depth (Table 19), and the
higher catch rate are located in shallower waters, being the abundance at 5 depth stratum
significantly lower (Post hoc p<0.01) mainly in the central and northwest zone (Figure 33).
However, depth preferences shifted among zones, as interaction between depth and macro-
zones was significant (Table 19). Thus, in the Southeast P. managuensis preferred shallowest
waters, but selected intermediate waters (3 m) in the Northwest (Figure 33). The depth
preference is maintained in both seasons (Figure 34), as shown by the lack of interaction
between season and depth (Table 19). Overall, no significant effect in the abundance of P.
managuensis was due to the interaction between spatio-temporal variables, i.e.,
season*macro-zone*depth was found (GLM: p=0.14; Table 19), but while in the southeast
and central zones abundances did not much varied among seasons, in the northwest
abundance was higher at 3 and 5 depth strata during dry season (Figure 35).
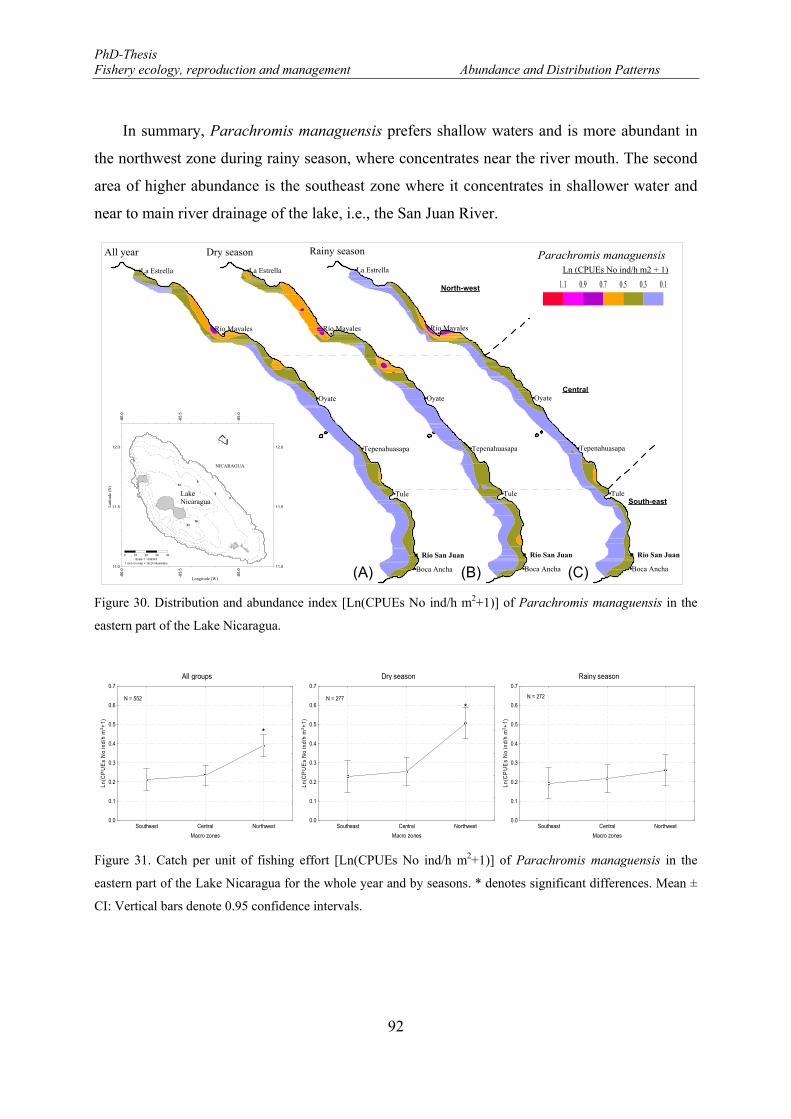
PhD-Thesis Fishery ecology, reproduction and management Abundance and Distribution Patterns
92
In summary, Parachromis managuensis prefers shallow waters and is more abundant in
the northwest zone during rainy season, where concentrates near the river mouth. The second
area of higher abundance is the southeast zone where it concentrates in shallower water and
near to main river drainage of the lake, i.e., the San Juan River.
Figure 30. Distribution and abundance index [Ln(CPUEs No ind/h m2+1)] of Parachromis managuensis in the
eastern part of the Lake Nicaragua.
Figure 31. Catch per unit of fishing effort [Ln(CPUEs No ind/h m2+1)] of Parachromis managuensis in the
eastern part of the Lake Nicaragua for the whole year and by seasons. * denotes significant differences. Mean ±
CI: Vertical bars denote 0.95 confidence intervals.
All groups
Southeast Central Northwest
Macro zones
0.0
0.1
0.2
0.3
0.4
0.5
0.6
0.7
Ln(C
PU
Es
No
ind/
h m
2 +1)
N = 552
*
Dry season
Southeast Central Northwest
Macro zones
0.0
0.1
0.2
0.3
0.4
0.5
0.6
0.7
Ln(C
PU
Es
No
ind/
h m
2 +1)
N = 277
*
Rainy season
Southeast Central Northwest
Macro zones
0.0
0.1
0.2
0.3
0.4
0.5
0.6
0.7
Ln(C
PU
Es
No
ind/
h m
2 +1)
N = 272
Río Mayales
Boca Ancha
Tule
Tepenahuasapa
Oyate
La Estrella
Río San Juan
Río Mayales
Boca Ancha
Tule
Tepenahuasapa
Oyate
La Estrella
Río San Juan
Ln (CPUEs No ind/h m2 + 1)
Dry seasonAll year
Río Mayales
Boca Ancha
Tule
Tepenahuasapa
Oyate
La Estrella
Río San Juan
Rainy season
-86.
0 -8
6.0
-85.
5 -8
5.5
-85.
0 -8
5.0
11.0 11.0
11.5 11.5
12.0 12.0
2LakeNicaragua
3316
139
6
NICARAGUA
Latit
ude
(N)
Longitude (W)
0 10 20 30 40Scale 1 : 639343
1 inch on map = 16.24 kilometers
(A) (B) (C)
North-west
Central
South-east
0.10.30.50.70.91.1
Parachromis managuensis
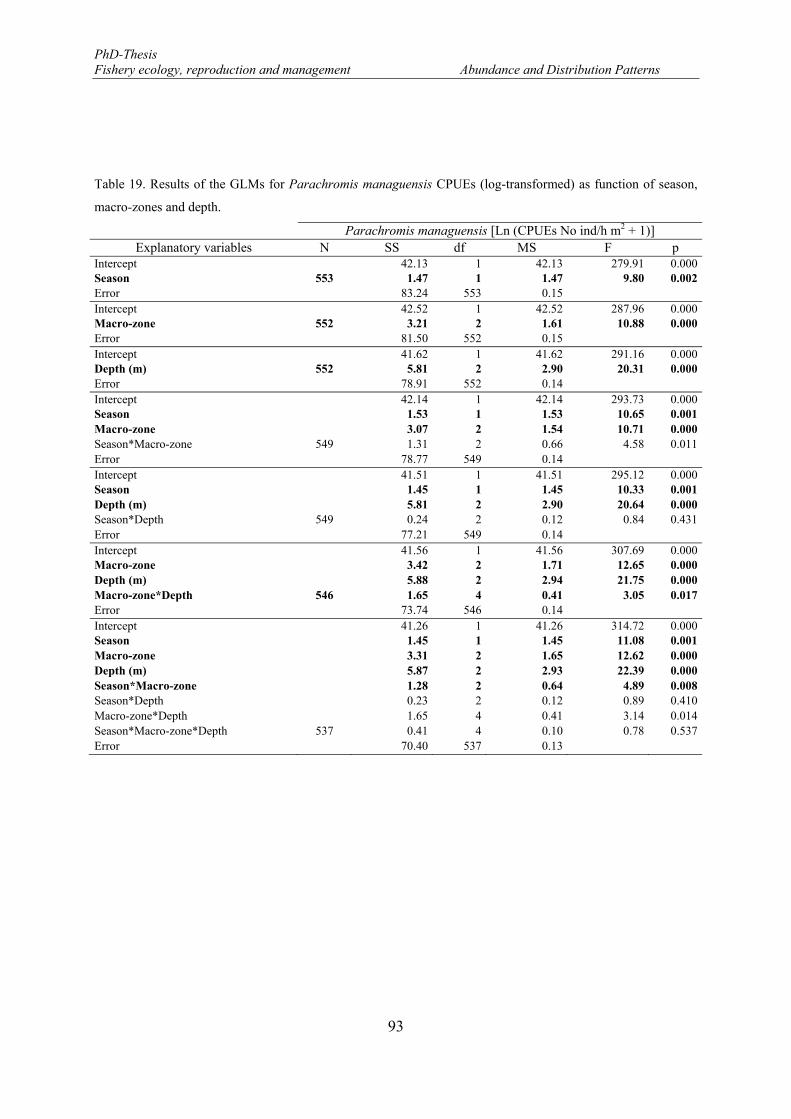
PhD-Thesis Fishery ecology, reproduction and management Abundance and Distribution Patterns
93
Table 19. Results of the GLMs for Parachromis managuensis CPUEs (log-transformed) as function of season,
macro-zones and depth.
Parachromis managuensis [Ln (CPUEs No ind/h m2 + 1)] Explanatory variables N SS df MS F p
Intercept 42.13 1 42.13 279.91 0.000Season 553 1.47 1 1.47 9.80 0.002Error 83.24 553 0.15 Intercept 42.52 1 42.52 287.96 0.000Macro-zone 552 3.21 2 1.61 10.88 0.000Error 81.50 552 0.15 Intercept 41.62 1 41.62 291.16 0.000Depth (m) 552 5.81 2 2.90 20.31 0.000Error 78.91 552 0.14 Intercept 42.14 1 42.14 293.73 0.000Season 1.53 1 1.53 10.65 0.001Macro-zone 3.07 2 1.54 10.71 0.000Season*Macro-zone 549 1.31 2 0.66 4.58 0.011Error 78.77 549 0.14 Intercept 41.51 1 41.51 295.12 0.000Season 1.45 1 1.45 10.33 0.001Depth (m) 5.81 2 2.90 20.64 0.000Season*Depth 549 0.24 2 0.12 0.84 0.431Error 77.21 549 0.14 Intercept 41.56 1 41.56 307.69 0.000Macro-zone 3.42 2 1.71 12.65 0.000Depth (m) 5.88 2 2.94 21.75 0.000Macro-zone*Depth 546 1.65 4 0.41 3.05 0.017Error 73.74 546 0.14 Intercept 41.26 1 41.26 314.72 0.000Season 1.45 1 1.45 11.08 0.001Macro-zone 3.31 2 1.65 12.62 0.000Depth (m) 5.87 2 2.93 22.39 0.000Season*Macro-zone 1.28 2 0.64 4.89 0.008Season*Depth 0.23 2 0.12 0.89 0.410Macro-zone*Depth 1.65 4 0.41 3.14 0.014Season*Macro-zone*Depth 537 0.41 4 0.10 0.78 0.537Error 70.40 537 0.13
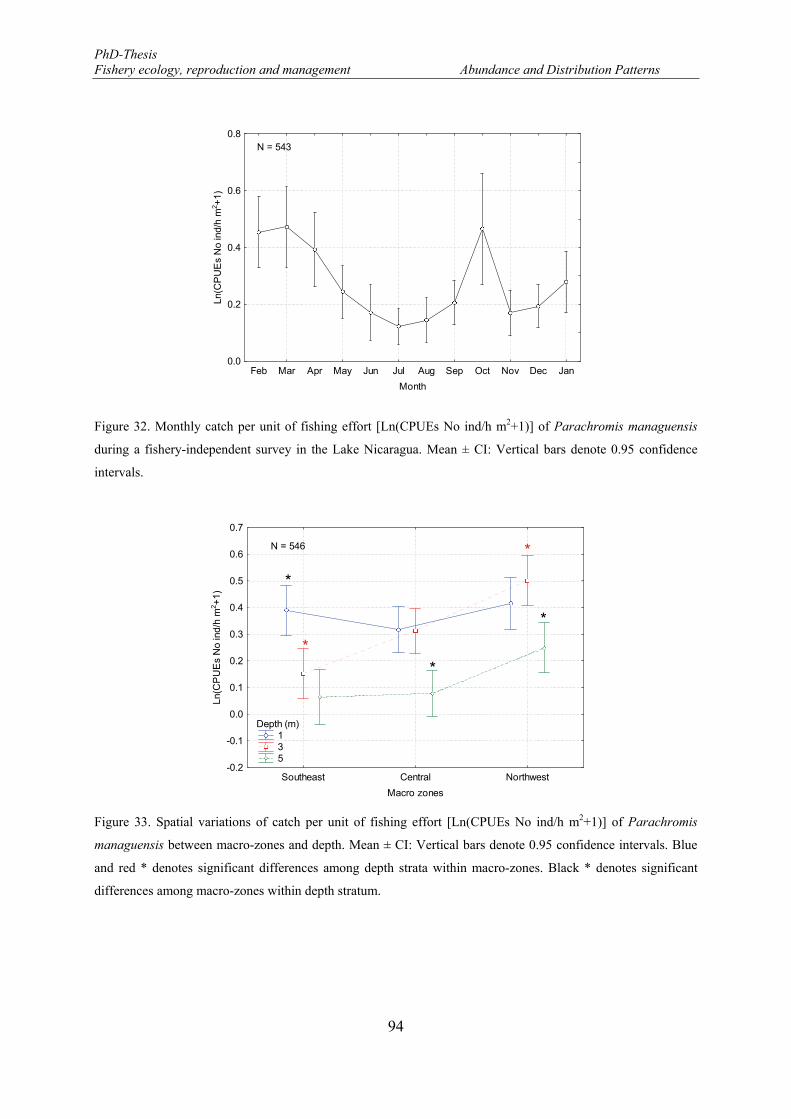
PhD-Thesis Fishery ecology, reproduction and management Abundance and Distribution Patterns
94
Figure 32. Monthly catch per unit of fishing effort [Ln(CPUEs No ind/h m2+1)] of Parachromis managuensis
during a fishery-independent survey in the Lake Nicaragua. Mean ± CI: Vertical bars denote 0.95 confidence
intervals.
Figure 33. Spatial variations of catch per unit of fishing effort [Ln(CPUEs No ind/h m2+1)] of Parachromis
managuensis between macro-zones and depth. Mean ± CI: Vertical bars denote 0.95 confidence intervals. Blue
and red * denotes significant differences among depth strata within macro-zones. Black * denotes significant
differences among macro-zones within depth stratum.
Feb Mar Apr May Jun Jul Aug Sep Oct Nov Dec Jan
Month
0.0
0.2
0.4
0.6
0.8
Ln(C
PU
Es
No
ind/
h m
2 +1)
N = 543
Southeast Central Northwest
Macro zones
-0.2
-0.1
0.0
0.1
0.2
0.3
0.4
0.5
0.6
0.7
Ln(C
PU
Es
No
ind/
h m
2 +1)
N = 546
Depth (m) 1 3 5
*
*
*
*
*
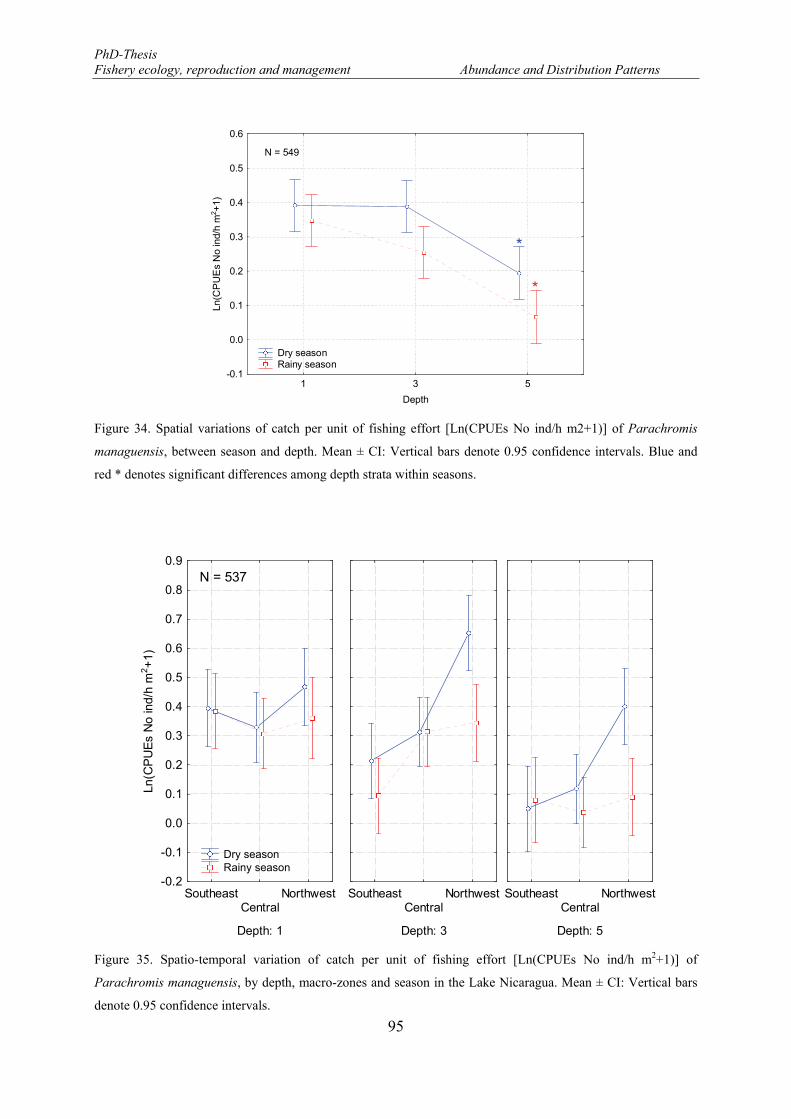
PhD-Thesis Fishery ecology, reproduction and management Abundance and Distribution Patterns
95
Figure 34. Spatial variations of catch per unit of fishing effort [Ln(CPUEs No ind/h m2+1)] of Parachromis
managuensis, between season and depth. Mean ± CI: Vertical bars denote 0.95 confidence intervals. Blue and
red * denotes significant differences among depth strata within seasons.
Figure 35. Spatio-temporal variation of catch per unit of fishing effort [Ln(CPUEs No ind/h m2+1)] of
Parachromis managuensis, by depth, macro-zones and season in the Lake Nicaragua. Mean ± CI: Vertical bars
denote 0.95 confidence intervals.
1 3 5
Depth
-0.1
0.0
0.1
0.2
0.3
0.4
0.5
0.6
Ln(C
PU
Es
No
ind/
h m
2 +1)
Dry season Rainy season
N = 549
*
*
Depth: 1
SoutheastCentral
Northwest-0.2
-0.1
0.0
0.1
0.2
0.3
0.4
0.5
0.6
0.7
0.8
0.9
Ln(C
PU
Es
No
ind/
h m
2+
1)
Depth: 3
SoutheastCentral
Northwest
Depth: 5
SoutheastCentral
Northwest
Dry season Rainy season
N = 537
PhD-Thesis Fishery ecology, reproduction and management Abundance and Distribution Patterns
96
Brycon guatemalensis (Machaca)
The overall CPUE by haul of this species, ranged from 0.1 to 16.7 (mean 1.8 ± 1.6)
specimens per hour and square meter of the net, and the annual average was 0.8 ± 0.4. As
expected this species was widely distributed in the area (Figure 36 A), but in average largest
CPUE was found in the extreme areas, the southeast and northwest, with catches above 1.3
individual/h m2. In the central part of the study area, the average CPUE decreased to a less
than 1.0. However, no significant CPUE differences between areas were detected (Table 20
and Figure 37 All groups). The distribution pattern of the relative abundance index in the
study area was significantly different between seasons (Table 20), as CPUE increased from
1.6 ± 1.1 to 2.0 ± 1.9 individuals/h m2, respectively. During the dry season (Figure 36 B and
Figure 37, Dry season) largest abundance (above 1 individuals/h m2) was found in the
southeast zone, otherwise was evenly distributed in the whole area at lower abundances
(below 1 individuals/h m2), and more frequently in deeper waters, but differences between
zone are not statistical significant (GLM: p=0.49; Figure 37). During rainy season the overall
abundance was not significant among zones (GLM: p=0.41; Figure 37 Rainy season), but
some spots of higher abundance were observed close to rivers drainage, as Mayales in the
northwest, Acoyapa in the central, Tule in the southeast, and in front of San Juan River and
Boca Ancha rivers (Figure 36 C).
The monthly abundance index varied from 0.8 to 2.1 (mean 1.5 ± 0.4) individual/h m2
(Figure 38) and was relatively low in March 0.8 ± 0.8 and November 1.0 ± 0.9 individual/h
m2. The rest of the year the CPUE was relatively higher, especially during the rainy season
(May to October) when increased to a maximum in June of 2.3 ± 2.8 individual/h m2.
However, during the dry season the abundance largely fluctuated (Figure 38 ). The catch rates
were statistically significant among months (ANOVA: F=3.37, p<0.001). The post hoc
analysis indicated that differences in the catch rates occurred in the period June-September
(Tuckey HSD test: p<0.05).
The abundance index of Brycon differed between depth strata, with a significant
interaction with zones (Tukey HSD test: p<0.05). Thus, CPUE increased from southeast to
northwest in shallower and deeper waters, but at 3 depth stratum an opposite pattern was
observed (Figure 39). While no differences in abundance between zones was observed at 1
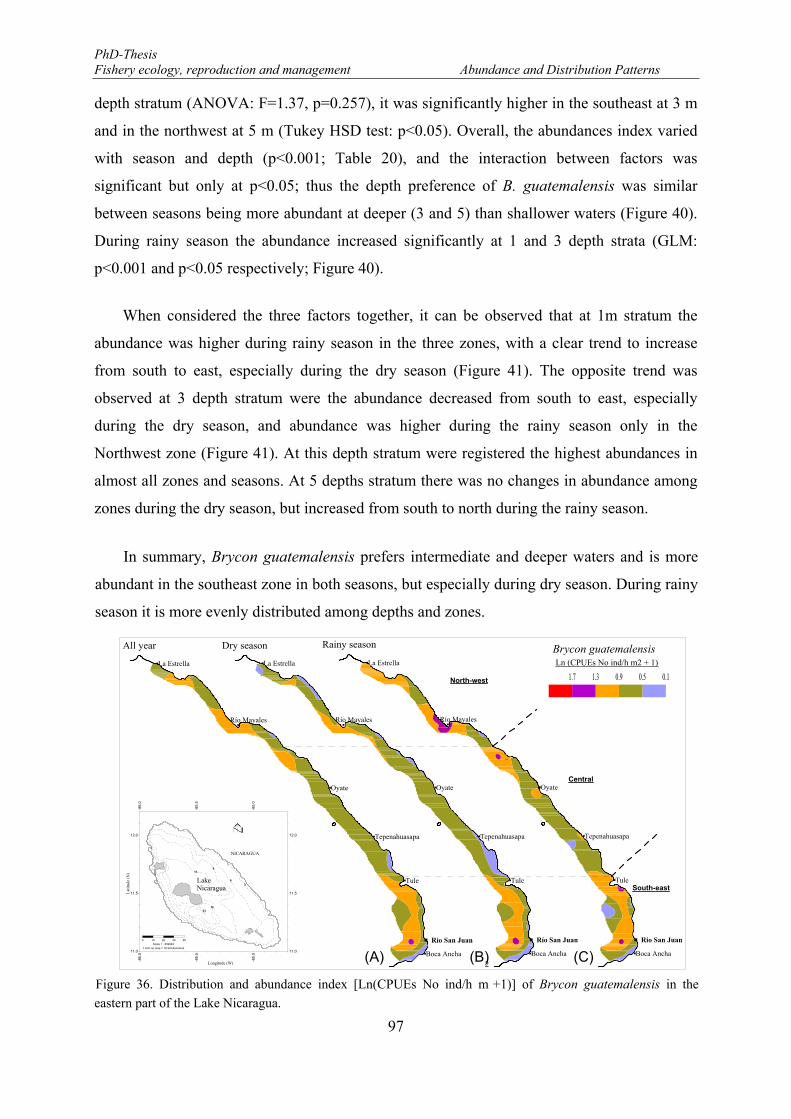
PhD-Thesis Fishery ecology, reproduction and management Abundance and Distribution Patterns
97
depth stratum (ANOVA: F=1.37, p=0.257), it was significantly higher in the southeast at 3 m
and in the northwest at 5 m (Tukey HSD test: p<0.05). Overall, the abundances index varied
with season and depth (p<0.001; Table 20), and the interaction between factors was
significant but only at p<0.05; thus the depth preference of B. guatemalensis was similar
between seasons being more abundant at deeper (3 and 5) than shallower waters (Figure 40).
During rainy season the abundance increased significantly at 1 and 3 depth strata (GLM:
p<0.001 and p<0.05 respectively; Figure 40).
When considered the three factors together, it can be observed that at 1m stratum the
abundance was higher during rainy season in the three zones, with a clear trend to increase
from south to east, especially during the dry season (Figure 41). The opposite trend was
observed at 3 depth stratum were the abundance decreased from south to east, especially
during the dry season, and abundance was higher during the rainy season only in the
Northwest zone (Figure 41). At this depth stratum were registered the highest abundances in
almost all zones and seasons. At 5 depths stratum there was no changes in abundance among
zones during the dry season, but increased from south to north during the rainy season.
In summary, Brycon guatemalensis prefers intermediate and deeper waters and is more
abundant in the southeast zone in both seasons, but especially during dry season. During rainy
season it is more evenly distributed among depths and zones.
Figure 36. Distribution and abundance index [Ln(CPUEs No ind/h m
2
+1)] of Brycon guatemalensis in the
eastern part of the Lake Nicaragua.
Río Mayales
Boca Ancha
Tule
Tepenahuasapa
Oyate
La Estrella
Río San Juan
Río Mayales
Boca Ancha
Tule
Tepenahuasapa
Oyate
La Estrella
Río San Juan
Ln (CPUEs No ind/h m2 + 1)
Dry seasonAll year
Río Mayales
Boca Ancha
Tule
Tepenahuasapa
Oyate
La Estrella
Río San Juan
Rainy season
-86.
0 -8
6.0
-85.
5 -8
5.5
-85.
0 -8
5.0
11.0 11.0
11.5 11.5
12.0 12.0
2LakeNicaragua
3316
139
6
NICARAGUA
Latit
ude
( N)
Longitude (W)
0 10 20 30 40Scale 1 : 639343
1 inch on map = 16.24 kilometers
(A) (B) (C)
North-west
Central
South-east
0.10.50.91.31.7
Brycon guatemalensis
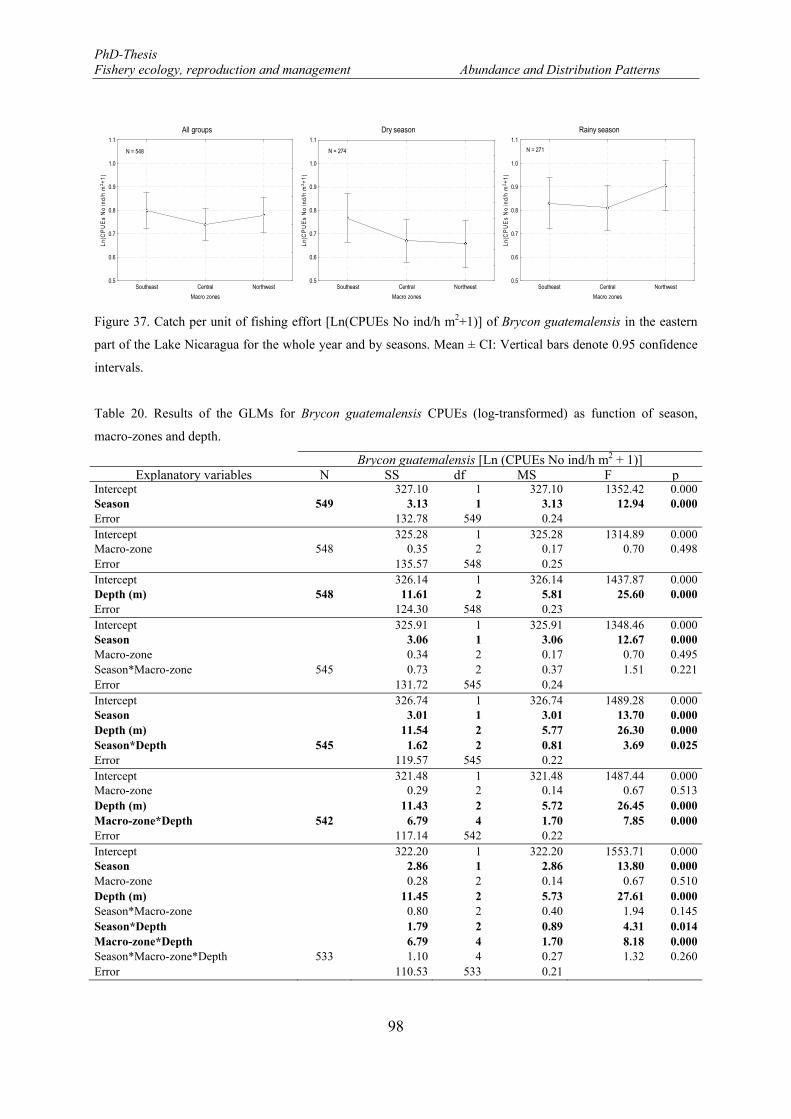
PhD-Thesis Fishery ecology, reproduction and management Abundance and Distribution Patterns
98
Figure 37. Catch per unit of fishing effort [Ln(CPUEs No ind/h m2+1)] of Brycon guatemalensis in the eastern
part of the Lake Nicaragua for the whole year and by seasons. Mean ± CI: Vertical bars denote 0.95 confidence
intervals.
Table 20. Results of the GLMs for Brycon guatemalensis CPUEs (log-transformed) as function of season,
macro-zones and depth.
Brycon guatemalensis [Ln (CPUEs No ind/h m2 + 1)] Explanatory variables N SS df MS F p
Intercept 327.10 1 327.10 1352.42 0.000Season 549 3.13 1 3.13 12.94 0.000Error 132.78 549 0.24 Intercept 325.28 1 325.28 1314.89 0.000Macro-zone 548 0.35 2 0.17 0.70 0.498Error 135.57 548 0.25 Intercept 326.14 1 326.14 1437.87 0.000Depth (m) 548 11.61 2 5.81 25.60 0.000Error 124.30 548 0.23 Intercept 325.91 1 325.91 1348.46 0.000Season 3.06 1 3.06 12.67 0.000Macro-zone 0.34 2 0.17 0.70 0.495Season*Macro-zone 545 0.73 2 0.37 1.51 0.221Error 131.72 545 0.24 Intercept 326.74 1 326.74 1489.28 0.000Season 3.01 1 3.01 13.70 0.000Depth (m) 11.54 2 5.77 26.30 0.000Season*Depth 545 1.62 2 0.81 3.69 0.025Error 119.57 545 0.22 Intercept 321.48 1 321.48 1487.44 0.000Macro-zone 0.29 2 0.14 0.67 0.513Depth (m) 11.43 2 5.72 26.45 0.000Macro-zone*Depth 542 6.79 4 1.70 7.85 0.000Error 117.14 542 0.22 Intercept 322.20 1 322.20 1553.71 0.000Season 2.86 1 2.86 13.80 0.000Macro-zone 0.28 2 0.14 0.67 0.510Depth (m) 11.45 2 5.73 27.61 0.000Season*Macro-zone 0.80 2 0.40 1.94 0.145Season*Depth 1.79 2 0.89 4.31 0.014Macro-zone*Depth 6.79 4 1.70 8.18 0.000Season*Macro-zone*Depth 533 1.10 4 0.27 1.32 0.260Error 110.53 533 0.21
All groups
Southeast Central Northwest
Macro zones
0.5
0.6
0.7
0.8
0.9
1.0
1.1
Ln(C
PU
Es
No
ind/
h m
2 +1)
N = 548
Dry season
Southeast Central Northwest
Macro zones
0.5
0.6
0.7
0.8
0.9
1.0
1.1
Ln(C
PU
Es
No
ind/
h m
2 +1)
N = 274
Rainy season
Southeast Central Northwest
Macro zones
0.5
0.6
0.7
0.8
0.9
1.0
1.1
Ln(C
PU
Es
No
ind/
h m
2 +1)
N = 271
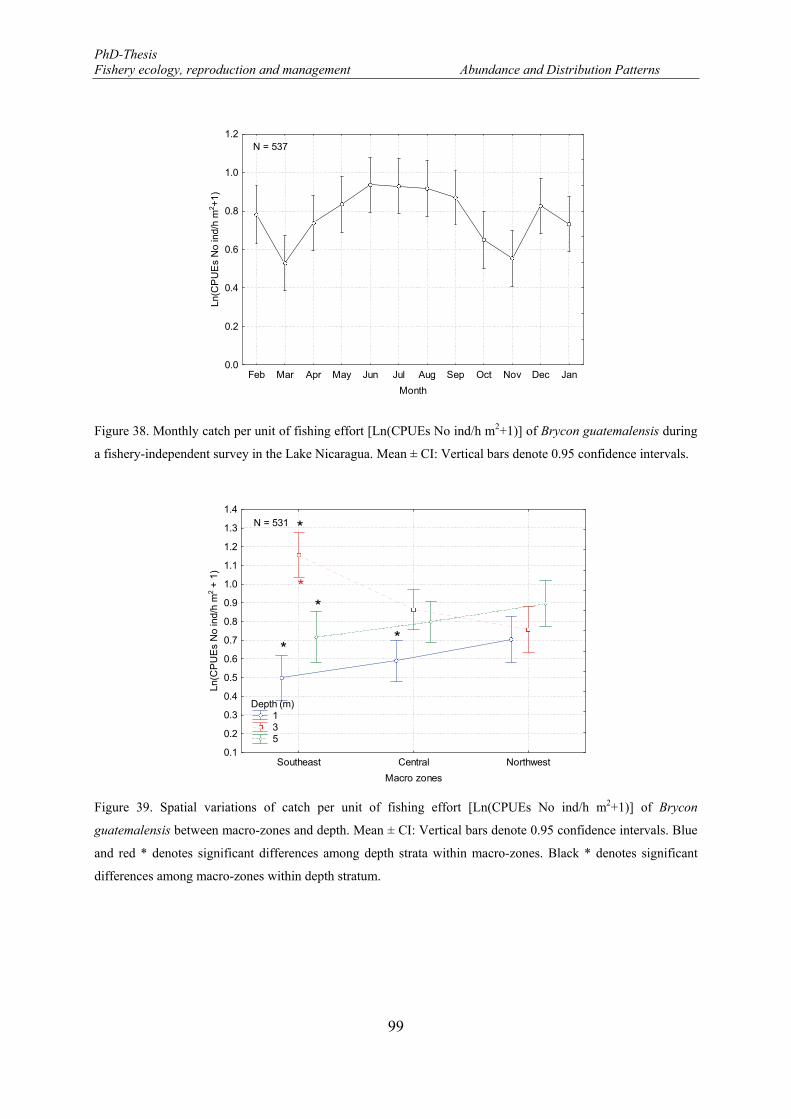
PhD-Thesis Fishery ecology, reproduction and management Abundance and Distribution Patterns
99
Figure 38. Monthly catch per unit of fishing effort [Ln(CPUEs No ind/h m2+1)] of Brycon guatemalensis during
a fishery-independent survey in the Lake Nicaragua. Mean ± CI: Vertical bars denote 0.95 confidence intervals.
Figure 39. Spatial variations of catch per unit of fishing effort [Ln(CPUEs No ind/h m2+1)] of Brycon
guatemalensis between macro-zones and depth. Mean ± CI: Vertical bars denote 0.95 confidence intervals. Blue
and red * denotes significant differences among depth strata within macro-zones. Black * denotes significant
differences among macro-zones within depth stratum.
Feb Mar Apr May Jun Jul Aug Sep Oct Nov Dec Jan
Month
0.0
0.2
0.4
0.6
0.8
1.0
1.2
Ln(C
PU
Es
No
ind/
h m
2 +1)
N = 537
Southeast Central Northwest
Macro zones
0.1
0.2
0.3
0.4
0.5
0.6
0.7
0.8
0.9
1.0
1.1
1.2
1.3
1.4
Ln(C
PU
Es
No
ind/
h m
2 + 1
)
Depth (m) 1 3 5
N = 531
*
*
*
**
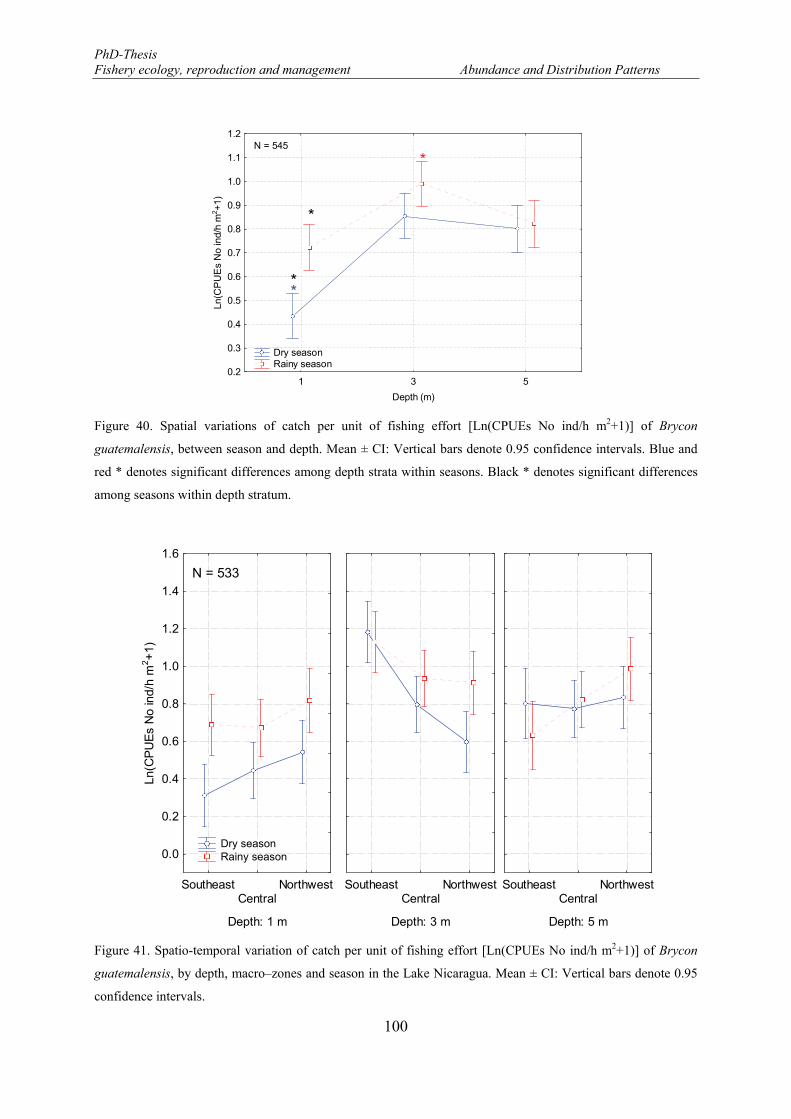
PhD-Thesis Fishery ecology, reproduction and management Abundance and Distribution Patterns
100
Figure 40. Spatial variations of catch per unit of fishing effort [Ln(CPUEs No ind/h m2+1)] of Brycon
guatemalensis, between season and depth. Mean ± CI: Vertical bars denote 0.95 confidence intervals. Blue and
red * denotes significant differences among depth strata within seasons. Black * denotes significant differences
among seasons within depth stratum.
Figure 41. Spatio-temporal variation of catch per unit of fishing effort [Ln(CPUEs No ind/h m2+1)] of Brycon
guatemalensis, by depth, macro–zones and season in the Lake Nicaragua. Mean ± CI: Vertical bars denote 0.95
confidence intervals.
1 3 5
Depth (m)
0.2
0.3
0.4
0.5
0.6
0.7
0.8
0.9
1.0
1.1
1.2
Ln(C
PU
Es
No
ind/
h m
2 +1)
N = 545
Dry season Rainy season
**
*
*
Depth: 1 m
SoutheastCentral
Northwest
0.0
0.2
0.4
0.6
0.8
1.0
1.2
1.4
1.6
Ln(C
PU
Es
No
ind/
h m
2+
1)
Depth: 3 m
SoutheastCentral
Northwest
Depth: 5 m
SoutheastCentral
Northwest
Dry season Rainy season
N = 533
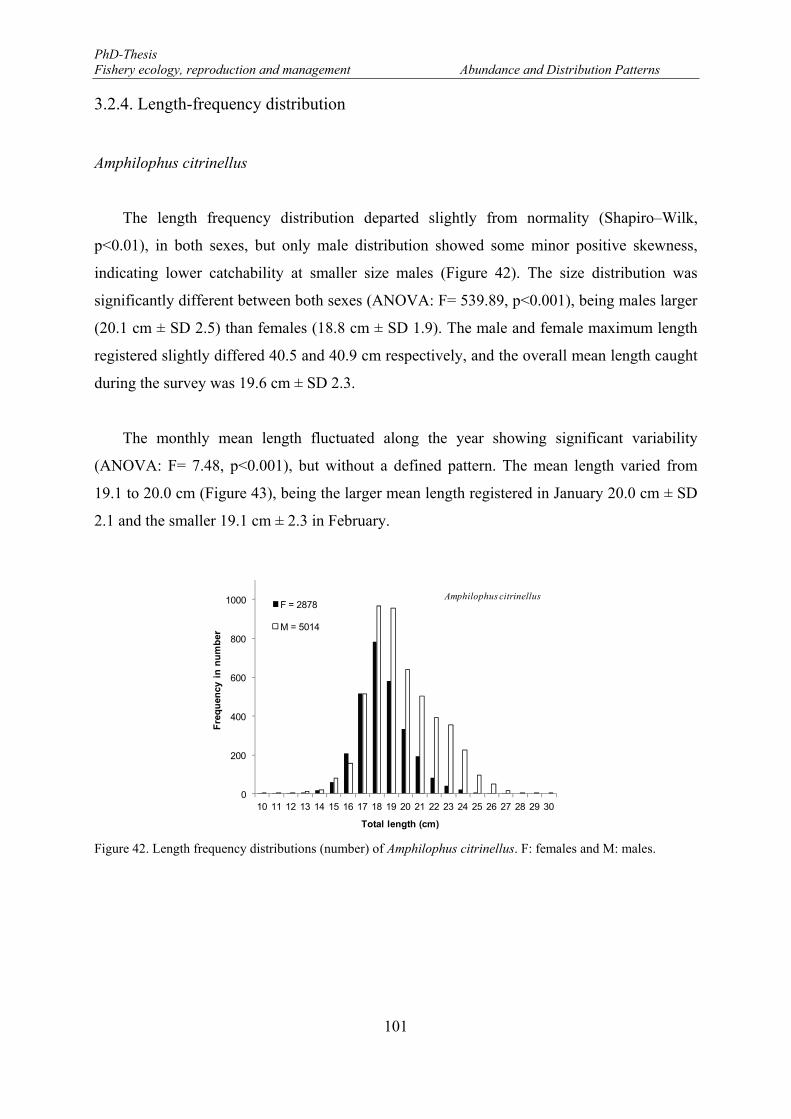
PhD-Thesis Fishery ecology, reproduction and management Abundance and Distribution Patterns
101
3.2.4. Length-frequency distribution
Amphilophus citrinellus
The length frequency distribution departed slightly from normality (Shapiro–Wilk,
p<0.01), in both sexes, but only male distribution showed some minor positive skewness,
indicating lower catchability at smaller size males (Figure 42). The size distribution was
significantly different between both sexes (ANOVA: F= 539.89, p<0.001), being males larger
(20.1 cm ± SD 2.5) than females (18.8 cm ± SD 1.9). The male and female maximum length
registered slightly differed 40.5 and 40.9 cm respectively, and the overall mean length caught
during the survey was 19.6 cm ± SD 2.3.
The monthly mean length fluctuated along the year showing significant variability
(ANOVA: F= 7.48, p<0.001), but without a defined pattern. The mean length varied from
19.1 to 20.0 cm (Figure 43), being the larger mean length registered in January 20.0 cm ± SD
2.1 and the smaller 19.1 cm ± 2.3 in February.
Figure 42. Length frequency distributions (number) of Amphilophus citrinellus. F: females and M: males.
0
200
400
600
800
1000
10 11 12 13 14 15 16 17 18 19 20 21 22 23 24 25 26 27 28 29 30
Fre
qu
ency
in
nu
mb
er
Total length (cm)
Amphilophus citrinellusF = 2878
M = 5014
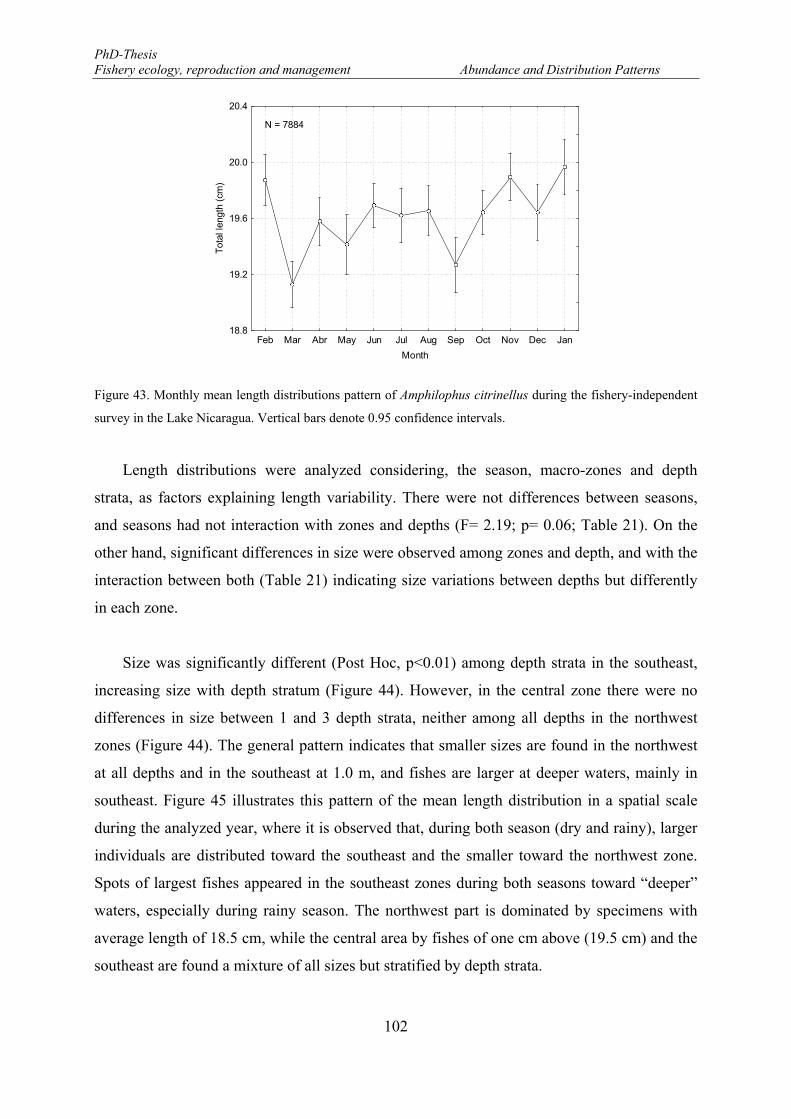
PhD-Thesis Fishery ecology, reproduction and management Abundance and Distribution Patterns
102
Figure 43. Monthly mean length distributions pattern of Amphilophus citrinellus during the fishery-independent
survey in the Lake Nicaragua. Vertical bars denote 0.95 confidence intervals.
Length distributions were analyzed considering, the season, macro-zones and depth
strata, as factors explaining length variability. There were not differences between seasons,
and seasons had not interaction with zones and depths (F= 2.19; p= 0.06; Table 21). On the
other hand, significant differences in size were observed among zones and depth, and with the
interaction between both (Table 21) indicating size variations between depths but differently
in each zone.
Size was significantly different (Post Hoc, p<0.01) among depth strata in the southeast,
increasing size with depth stratum (Figure 44). However, in the central zone there were no
differences in size between 1 and 3 depth strata, neither among all depths in the northwest
zones (Figure 44). The general pattern indicates that smaller sizes are found in the northwest
at all depths and in the southeast at 1.0 m, and fishes are larger at deeper waters, mainly in
southeast. Figure 45 illustrates this pattern of the mean length distribution in a spatial scale
during the analyzed year, where it is observed that, during both season (dry and rainy), larger
individuals are distributed toward the southeast and the smaller toward the northwest zone.
Spots of largest fishes appeared in the southeast zones during both seasons toward “deeper”
waters, especially during rainy season. The northwest part is dominated by specimens with
average length of 18.5 cm, while the central area by fishes of one cm above (19.5 cm) and the
southeast are found a mixture of all sizes but stratified by depth strata.
Feb Mar Abr May Jun Jul Aug Sep Oct Nov Dec Jan
Month
18.8
19.2
19.6
20.0
20.4
Tot
al le
ngth
(cm
)
N = 7884
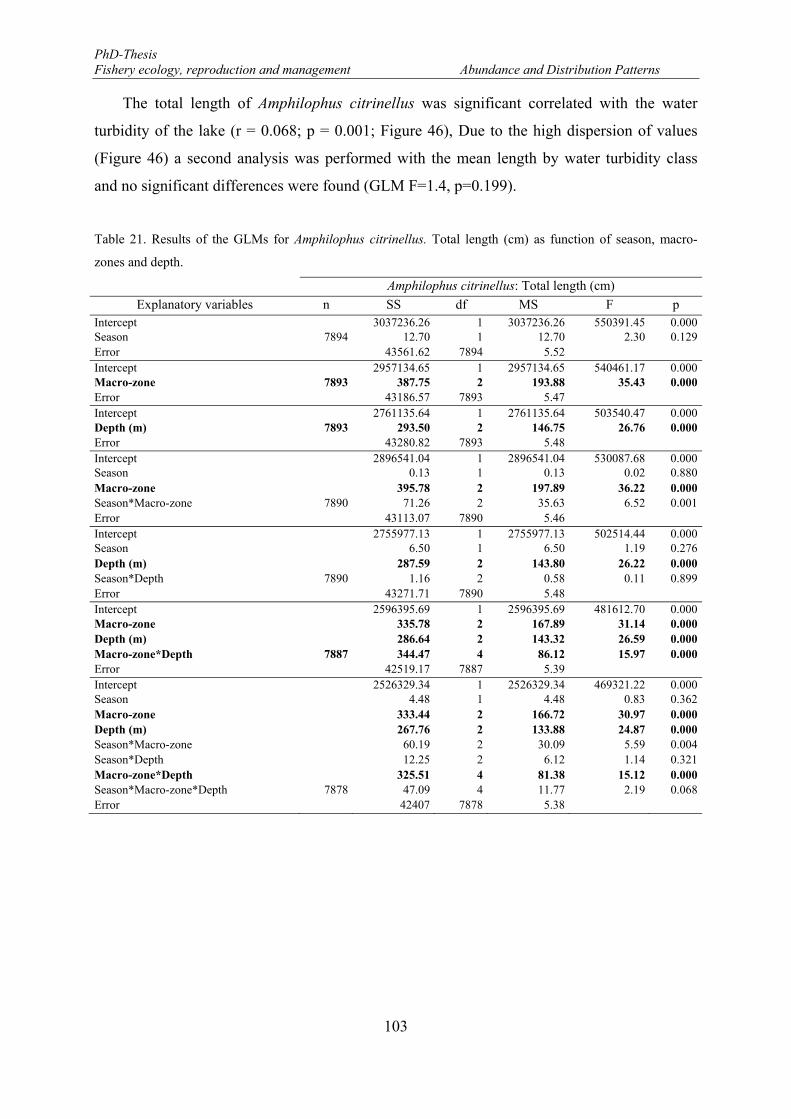
PhD-Thesis Fishery ecology, reproduction and management Abundance and Distribution Patterns
103
The total length of Amphilophus citrinellus was significant correlated with the water
turbidity of the lake (r = 0.068; p = 0.001; Figure 46), Due to the high dispersion of values
(Figure 46) a second analysis was performed with the mean length by water turbidity class
and no significant differences were found (GLM F=1.4, p=0.199).
Table 21. Results of the GLMs for Amphilophus citrinellus. Total length (cm) as function of season, macro-
zones and depth.
Amphilophus citrinellus: Total length (cm)
Explanatory variables n SS df MS F p Intercept 3037236.26 1 3037236.26 550391.45 0.000Season 7894 12.70 1 12.70 2.30 0.129Error 43561.62 7894 5.52 Intercept 2957134.65 1 2957134.65 540461.17 0.000Macro-zone 7893 387.75 2 193.88 35.43 0.000Error 43186.57 7893 5.47 Intercept 2761135.64 1 2761135.64 503540.47 0.000Depth (m) 7893 293.50 2 146.75 26.76 0.000Error 43280.82 7893 5.48 Intercept 2896541.04 1 2896541.04 530087.68 0.000Season 0.13 1 0.13 0.02 0.880Macro-zone 395.78 2 197.89 36.22 0.000Season*Macro-zone 7890 71.26 2 35.63 6.52 0.001Error 43113.07 7890 5.46 Intercept 2755977.13 1 2755977.13 502514.44 0.000Season 6.50 1 6.50 1.19 0.276Depth (m) 287.59 2 143.80 26.22 0.000Season*Depth 7890 1.16 2 0.58 0.11 0.899Error 43271.71 7890 5.48 Intercept 2596395.69 1 2596395.69 481612.70 0.000Macro-zone 335.78 2 167.89 31.14 0.000Depth (m) 286.64 2 143.32 26.59 0.000Macro-zone*Depth 7887 344.47 4 86.12 15.97 0.000Error 42519.17 7887 5.39 Intercept 2526329.34 1 2526329.34 469321.22 0.000Season 4.48 1 4.48 0.83 0.362Macro-zone 333.44 2 166.72 30.97 0.000Depth (m) 267.76 2 133.88 24.87 0.000Season*Macro-zone 60.19 2 30.09 5.59 0.004Season*Depth 12.25 2 6.12 1.14 0.321Macro-zone*Depth 325.51 4 81.38 15.12 0.000Season*Macro-zone*Depth 7878 47.09 4 11.77 2.19 0.068Error 42407 7878 5.38
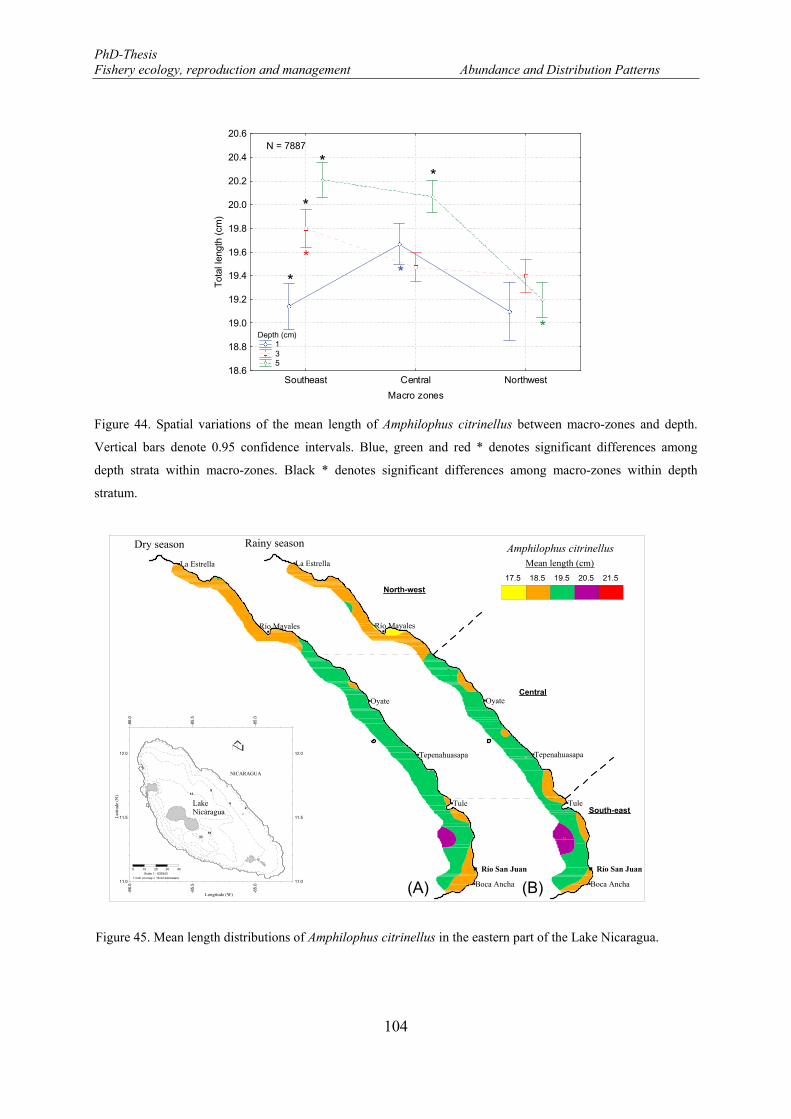
PhD-Thesis Fishery ecology, reproduction and management Abundance and Distribution Patterns
104
Figure 44. Spatial variations of the mean length of Amphilophus citrinellus between macro-zones and depth.
Vertical bars denote 0.95 confidence intervals. Blue, green and red * denotes significant differences among
depth strata within macro-zones. Black * denotes significant differences among macro-zones within depth
stratum.
Figure 45. Mean length distributions of Amphilophus citrinellus in the eastern part of the Lake Nicaragua.
Southeast Central Northwest
Macro zones
18.6
18.8
19.0
19.2
19.4
19.6
19.8
20.0
20.2
20.4
20.6
Tot
al le
ngth
(cm
)
N = 7887
Depth (cm) 1 3 5
*
*
*
*
*
**
Río Mayales
Boca Ancha
Tule
Tepenahuasapa
Oyate
La Estrella
Río San Juan
Mean length (cm)
Dry season
Río Mayales
Boca Ancha
Tule
Tepenahuasapa
Oyate
La Estrella
Río San Juan
Rainy season
-86.
0 -8
6.0
-85.
5 -8
5.5
-85.
0 -8
5.0
11.0 11.0
11.5 11.5
12.0 12.0
2LakeNicaragua
3316
139
6
NICARAGUA
Lati t
ude
(N)
Longitude (W)
0 10 20 30 40Scale 1 : 639343
1 inch on map = 16.24 kilometers
(A) (B)
17.5 18.5 19.5 20.5 21.5
South-east
Central
North-west
Amphilophus citrinellus
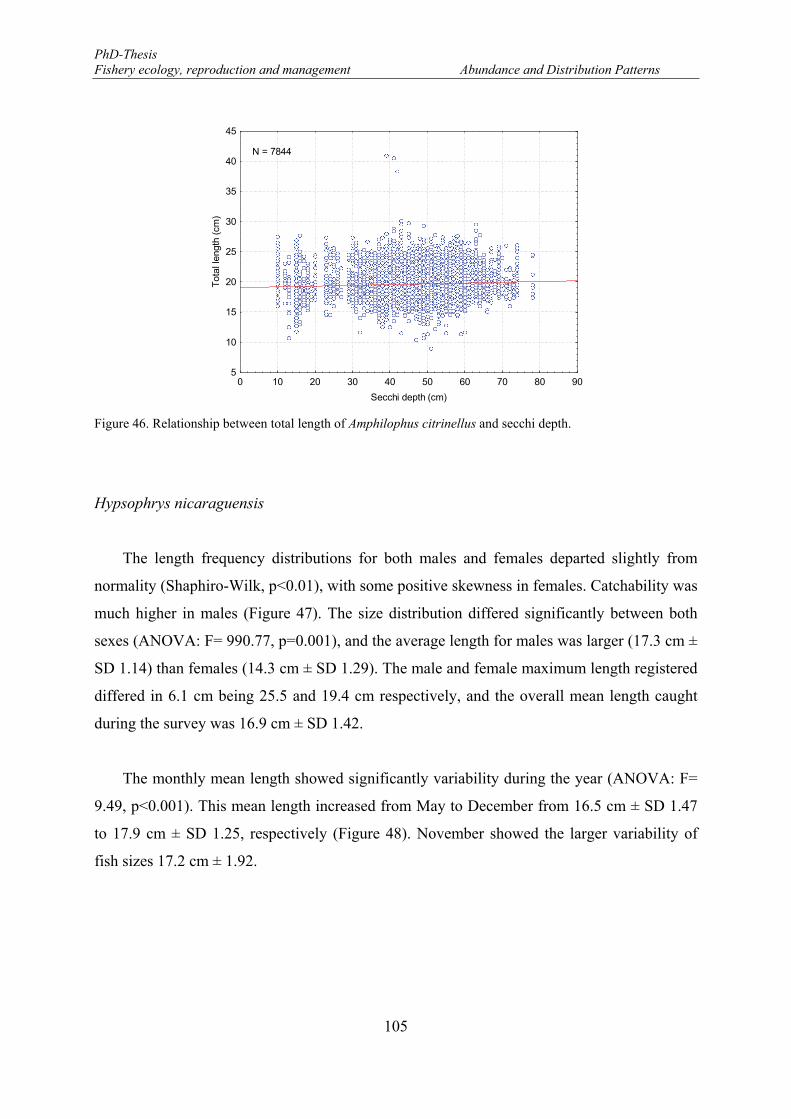
PhD-Thesis Fishery ecology, reproduction and management Abundance and Distribution Patterns
105
Figure 46. Relationship between total length of Amphilophus citrinellus and secchi depth.
Hypsophrys nicaraguensis
The length frequency distributions for both males and females departed slightly from
normality (Shaphiro-Wilk, p<0.01), with some positive skewness in females. Catchability was
much higher in males (Figure 47). The size distribution differed significantly between both
sexes (ANOVA: F= 990.77, p=0.001), and the average length for males was larger (17.3 cm ±
SD 1.14) than females (14.3 cm ± SD 1.29). The male and female maximum length registered
differed in 6.1 cm being 25.5 and 19.4 cm respectively, and the overall mean length caught
during the survey was 16.9 cm ± SD 1.42.
The monthly mean length showed significantly variability during the year (ANOVA: F=
9.49, p<0.001). This mean length increased from May to December from 16.5 cm ± SD 1.47
to 17.9 cm ± SD 1.25, respectively (Figure 48). November showed the larger variability of
fish sizes 17.2 cm ± 1.92.
0 10 20 30 40 50 60 70 80 90
Secchi depth (cm)
5
10
15
20
25
30
35
40
45
Tot
al le
ngth
(cm
)
N = 7844
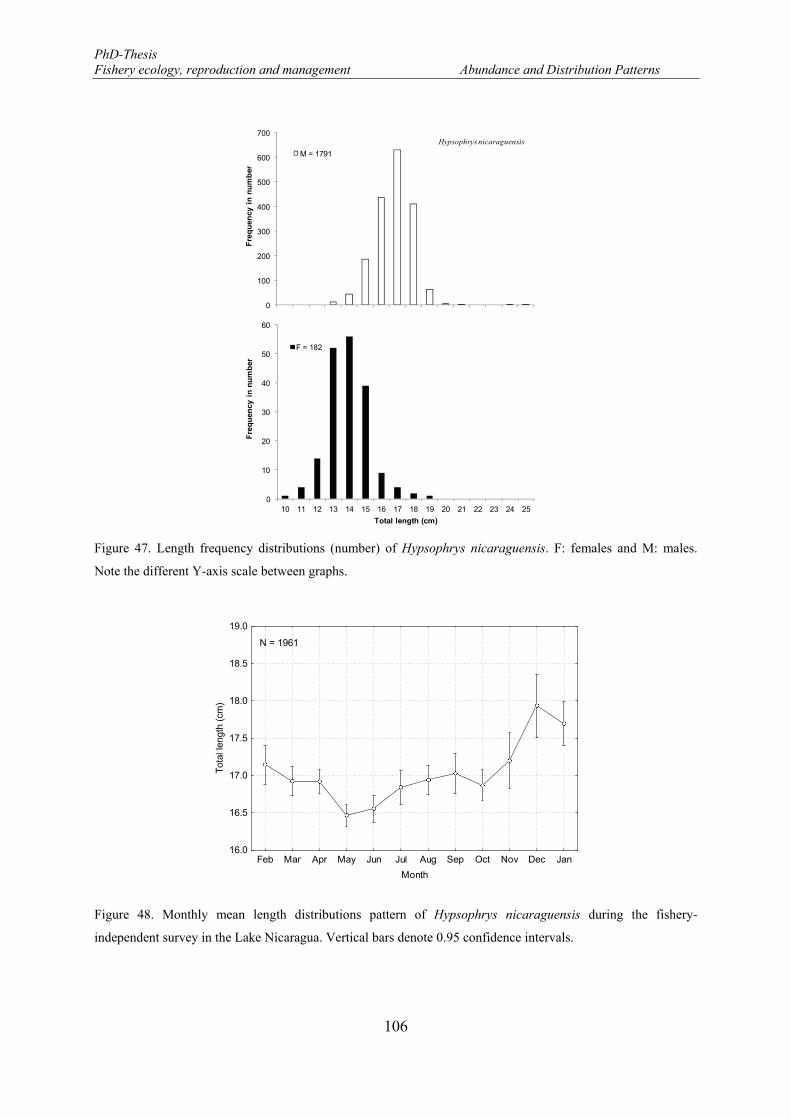
PhD-Thesis Fishery ecology, reproduction and management Abundance and Distribution Patterns
106
Figure 47. Length frequency distributions (number) of Hypsophrys nicaraguensis. F: females and M: males.
Note the different Y-axis scale between graphs.
Figure 48. Monthly mean length distributions pattern of Hypsophrys nicaraguensis during the fishery-
independent survey in the Lake Nicaragua. Vertical bars denote 0.95 confidence intervals.
0
100
200
300
400
500
600
700
Fre
qu
ency
in
nu
mb
er
Hypsophrys nicaraguensis
M = 1791
0
10
20
30
40
50
60
10 11 12 13 14 15 16 17 18 19 20 21 22 23 24 25
Fre
qu
ency
in
nu
mb
er
Total length (cm)
F = 182
Feb Mar Apr May Jun Jul Aug Sep Oct Nov Dec Jan
Month
16.0
16.5
17.0
17.5
18.0
18.5
19.0
Tot
al le
ngth
(cm
)
N = 1961
PhD-Thesis Fishery ecology, reproduction and management Abundance and Distribution Patterns
107
The size distribution showed significant differences between macro-zones and depth
strata, but not between seasons (Table 22). The significant interactions obtained indicate a
complex pattern of size variability between macro-zones, depth and season.
Size was significantly higher (Post Hoc, p<0.05) at depth 5 stratum in the southeast only,
and differences in size were not observed in the central and northwest zones (Figure 49). On
the other hand, size was significantly smaller in the southeast zone at depth 1 stratum (Post
Hoc, p<0.05). Differences in size from southeast to northwest were not observed along each
depth stratum, except in the 5 depth strata in the southeast (Figure 49). The general pattern
indicates that smaller and larger sizes are found in the southeast in shallower zones (1.0 m)
and deeper zones (5.0 m) respectively. Figure 50 illustrates the complexity of the mean length
distribution in a spatial, where it is observed that during both seasons larger individuals are
distributed mainly towards the southeast and the smaller towards the northwest zone. But
patches of larger and smaller fish are scattered along the zones, thus during dry season areas
of larger fishes are located between Oyate and Tepenahuasapa rivers, the surrounding area of
Tule rivers and offshore (deeper water) in the southeast zone, while during rainy season larger
fish appeared distributed in spots along the whole area, but larger spots are observed in the
southeast. The entire area appeared dominated by size of 16.5 cm.
The total length of Hypsophrys nicaraguensis was significant correlated with the water
turbidity of the lake (p<0.001) with low coefficient of correlation (r=0.105). Due to data
dispersion of values (Figure 51) a second analysis was performed with the mean length by
water turbidity class, with range of 10 cm, and significant differences were found (GLM
F=3.057, p<0.01). Post Hoc analysis shows differences in fish length (p<0.05) only at 60 cm
of secchi depth.
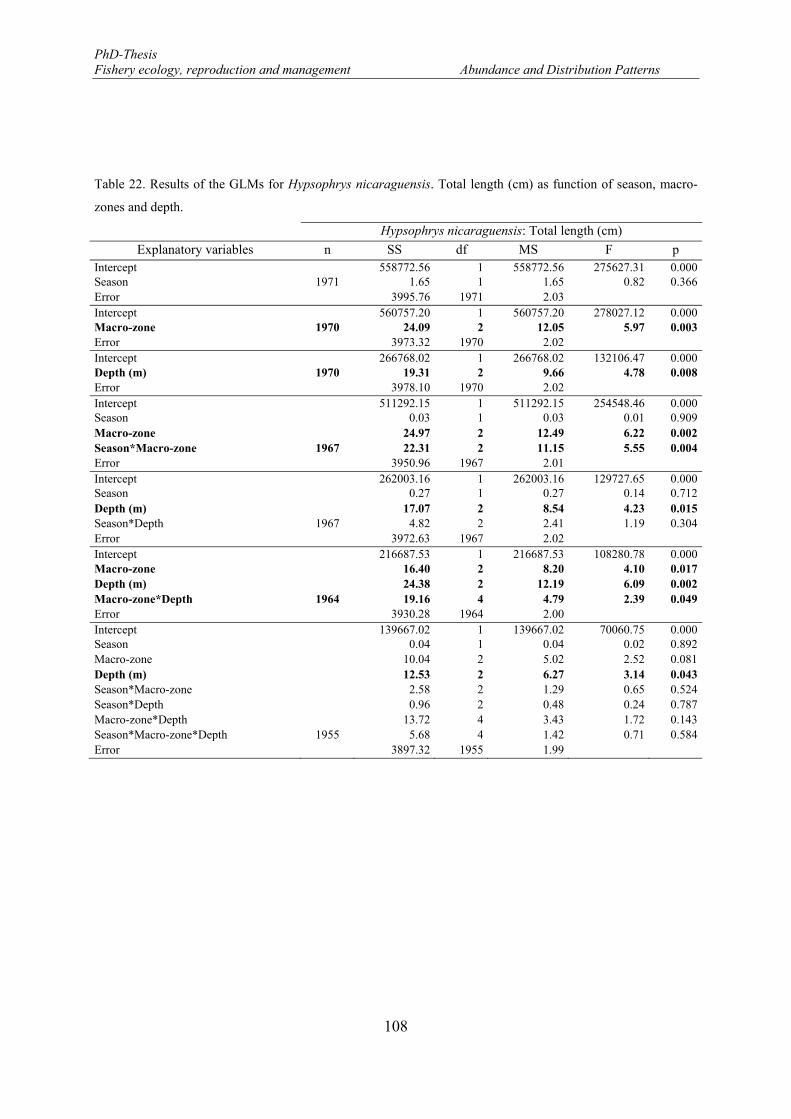
PhD-Thesis Fishery ecology, reproduction and management Abundance and Distribution Patterns
108
Table 22. Results of the GLMs for Hypsophrys nicaraguensis. Total length (cm) as function of season, macro-
zones and depth.
Hypsophrys nicaraguensis: Total length (cm)
Explanatory variables n SS df MS F p Intercept 558772.56 1 558772.56 275627.31 0.000Season 1971 1.65 1 1.65 0.82 0.366Error 3995.76 1971 2.03 Intercept 560757.20 1 560757.20 278027.12 0.000Macro-zone 1970 24.09 2 12.05 5.97 0.003Error 3973.32 1970 2.02 Intercept 266768.02 1 266768.02 132106.47 0.000Depth (m) 1970 19.31 2 9.66 4.78 0.008Error 3978.10 1970 2.02 Intercept 511292.15 1 511292.15 254548.46 0.000Season 0.03 1 0.03 0.01 0.909Macro-zone 24.97 2 12.49 6.22 0.002Season*Macro-zone 1967 22.31 2 11.15 5.55 0.004Error 3950.96 1967 2.01 Intercept 262003.16 1 262003.16 129727.65 0.000Season 0.27 1 0.27 0.14 0.712Depth (m) 17.07 2 8.54 4.23 0.015Season*Depth 1967 4.82 2 2.41 1.19 0.304Error 3972.63 1967 2.02 Intercept 216687.53 1 216687.53 108280.78 0.000Macro-zone 16.40 2 8.20 4.10 0.017Depth (m) 24.38 2 12.19 6.09 0.002Macro-zone*Depth 1964 19.16 4 4.79 2.39 0.049Error 3930.28 1964 2.00 Intercept 139667.02 1 139667.02 70060.75 0.000Season 0.04 1 0.04 0.02 0.892Macro-zone 10.04 2 5.02 2.52 0.081Depth (m) 12.53 2 6.27 3.14 0.043Season*Macro-zone 2.58 2 1.29 0.65 0.524Season*Depth 0.96 2 0.48 0.24 0.787Macro-zone*Depth 13.72 4 3.43 1.72 0.143Season*Macro-zone*Depth 1955 5.68 4 1.42 0.71 0.584Error 3897.32 1955 1.99
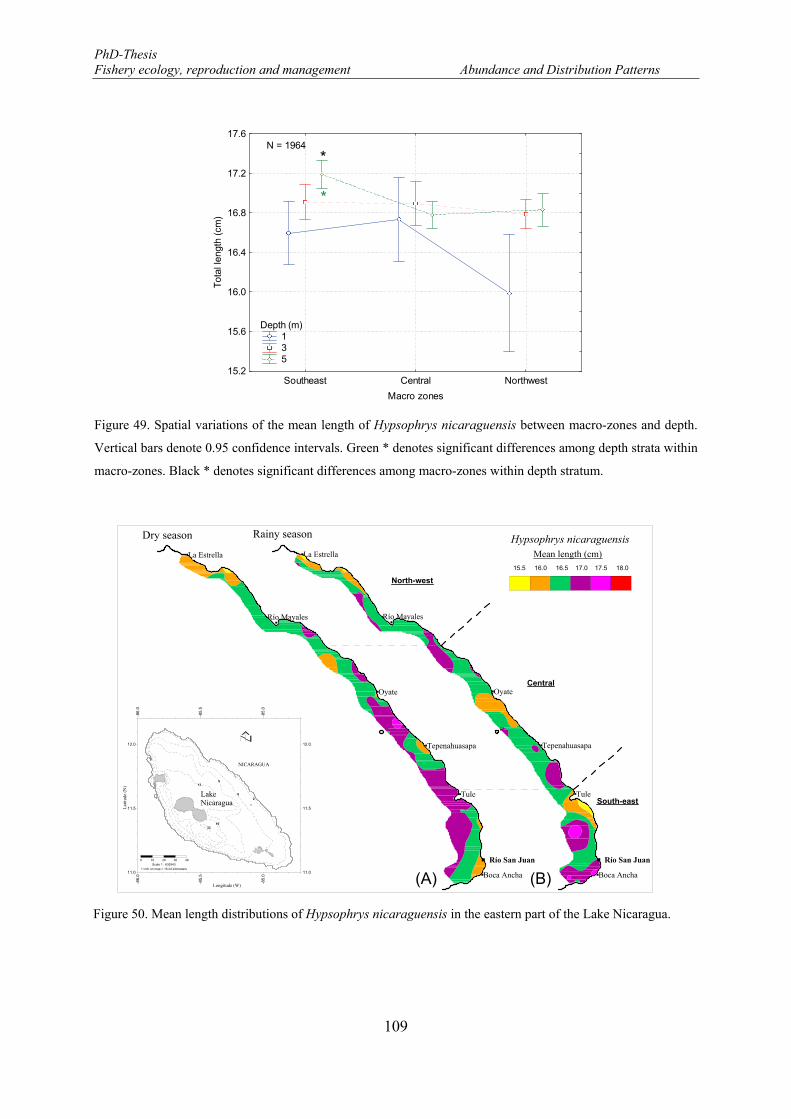
PhD-Thesis Fishery ecology, reproduction and management Abundance and Distribution Patterns
109
Figure 49. Spatial variations of the mean length of Hypsophrys nicaraguensis between macro-zones and depth.
Vertical bars denote 0.95 confidence intervals. Green * denotes significant differences among depth strata within
macro-zones. Black * denotes significant differences among macro-zones within depth stratum.
Figure 50. Mean length distributions of Hypsophrys nicaraguensis in the eastern part of the Lake Nicaragua.
Southeast Central Northwest
Macro zones
15.2
15.6
16.0
16.4
16.8
17.2
17.6
Tot
al le
ngth
(cm
)
N = 1964
Depth (m) 1 3 5
*
*
Río Mayales
Boca Ancha
Tule
Tepenahuasapa
Oyate
La Estrella
Río San Juan
Mean length (cm)
Dry season
Río Mayales
Boca Ancha
Tule
Tepenahuasapa
Oyate
La Estrella
Río San Juan
Rainy season
-86.
0 -8
6.0
-85.
5 -8
5.5
-85.
0 -8
5.0
11.0 11.0
11.5 11.5
12.0 12.0
2LakeNicaragua
3316
139
6
NICARAGUA
Lati t
ude
(N)
Longitude (W)
0 10 20 30 40Scale 1 : 639343
1 inch on map = 16.24 kilometers
(A) (B)
15.5 16.0 16.5 17.0 17.5 18.0
South-east
Central
North-west
Hypsophrys nicaraguensis
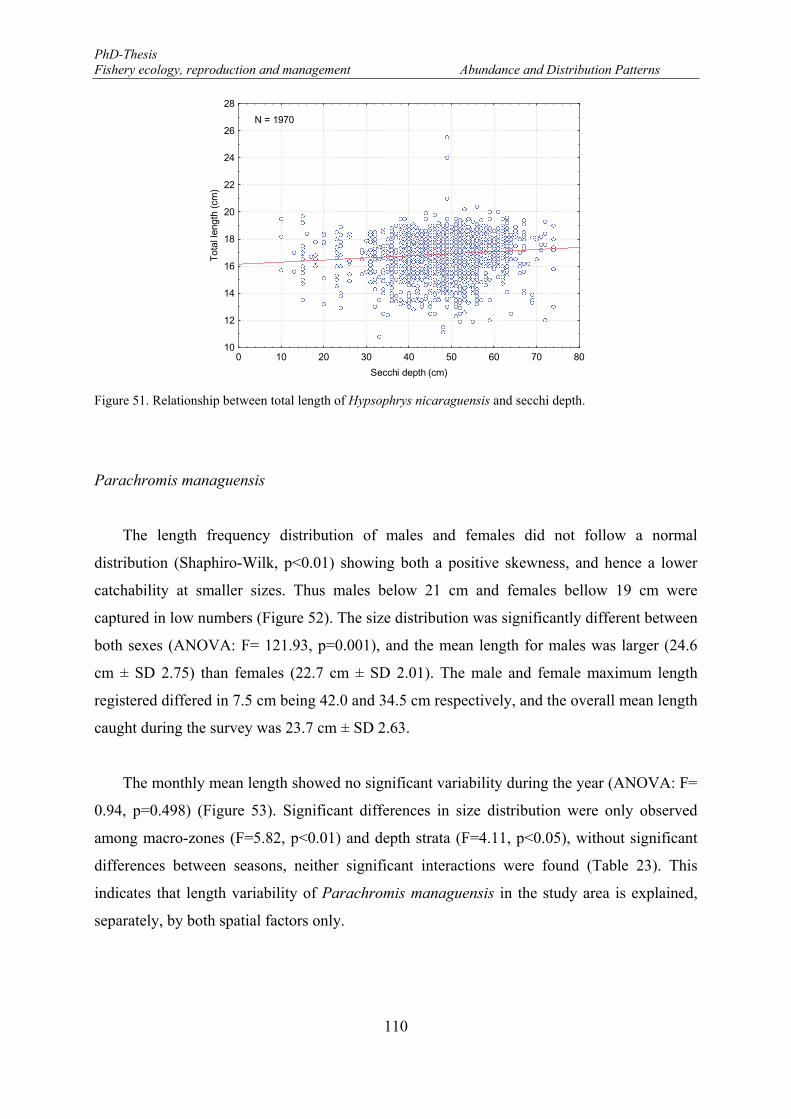
PhD-Thesis Fishery ecology, reproduction and management Abundance and Distribution Patterns
110
Figure 51. Relationship between total length of Hypsophrys nicaraguensis and secchi depth.
Parachromis managuensis
The length frequency distribution of males and females did not follow a normal
distribution (Shaphiro-Wilk, p<0.01) showing both a positive skewness, and hence a lower
catchability at smaller sizes. Thus males below 21 cm and females bellow 19 cm were
captured in low numbers (Figure 52). The size distribution was significantly different between
both sexes (ANOVA: F= 121.93, p=0.001), and the mean length for males was larger (24.6
cm ± SD 2.75) than females (22.7 cm ± SD 2.01). The male and female maximum length
registered differed in 7.5 cm being 42.0 and 34.5 cm respectively, and the overall mean length
caught during the survey was 23.7 cm ± SD 2.63.
The monthly mean length showed no significant variability during the year (ANOVA: F=
0.94, p=0.498) (Figure 53). Significant differences in size distribution were only observed
among macro-zones (F=5.82, p<0.01) and depth strata (F=4.11, p<0.05), without significant
differences between seasons, neither significant interactions were found (Table 23). This
indicates that length variability of Parachromis managuensis in the study area is explained,
separately, by both spatial factors only.
0 10 20 30 40 50 60 70 80
Secchi depth (cm)
10
12
14
16
18
20
22
24
26
28
Tot
al le
ngth
(cm
)
N = 1970
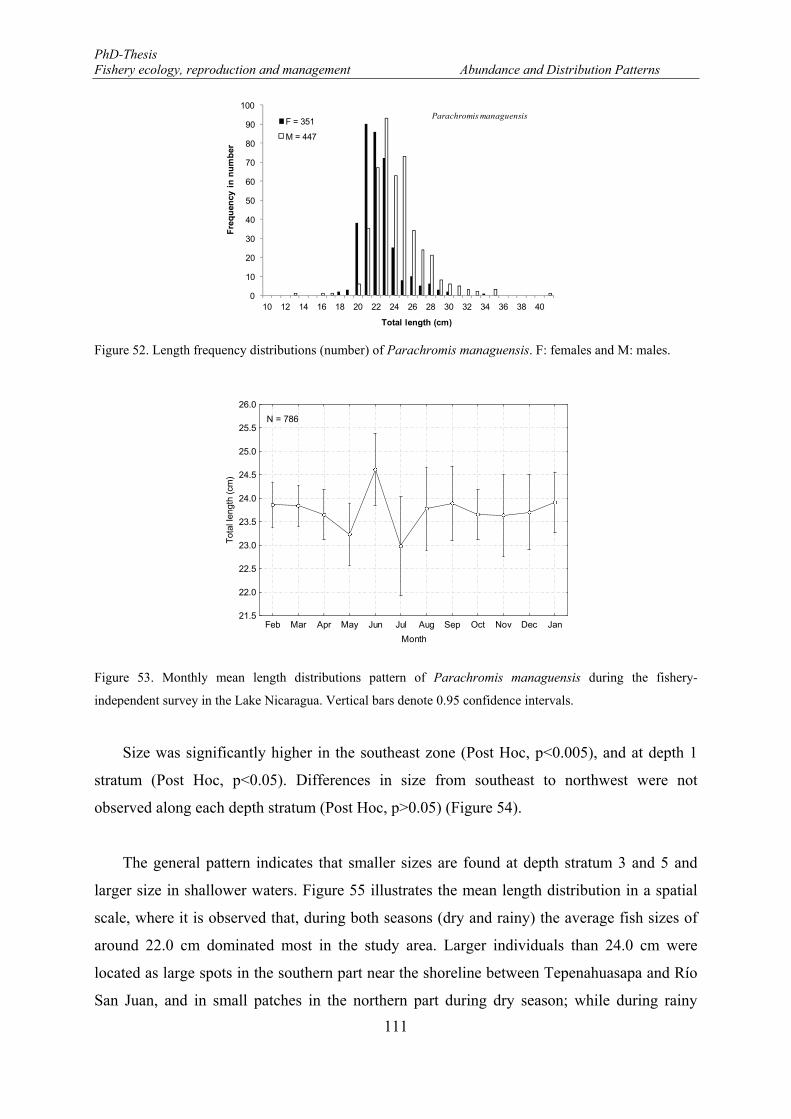
PhD-Thesis Fishery ecology, reproduction and management Abundance and Distribution Patterns
111
Figure 52. Length frequency distributions (number) of Parachromis managuensis. F: females and M: males.
Figure 53. Monthly mean length distributions pattern of Parachromis managuensis during the fishery-
independent survey in the Lake Nicaragua. Vertical bars denote 0.95 confidence intervals.
Size was significantly higher in the southeast zone (Post Hoc, p<0.005), and at depth 1
stratum (Post Hoc, p<0.05). Differences in size from southeast to northwest were not
observed along each depth stratum (Post Hoc, p>0.05) (Figure 54).
The general pattern indicates that smaller sizes are found at depth stratum 3 and 5 and
larger size in shallower waters. Figure 55 illustrates the mean length distribution in a spatial
scale, where it is observed that, during both seasons (dry and rainy) the average fish sizes of
around 22.0 cm dominated most in the study area. Larger individuals than 24.0 cm were
located as large spots in the southern part near the shoreline between Tepenahuasapa and Río
San Juan, and in small patches in the northern part during dry season; while during rainy
0
10
20
30
40
50
60
70
80
90
100
10 12 14 16 18 20 22 24 26 28 30 32 34 36 38 40
Fre
qu
ency
in
nu
mb
er
Total length (cm)
Parachromis managuensisF = 351
M = 447
Feb Mar Apr May Jun Jul Aug Sep Oct Nov Dec Jan
Month
21.5
22.0
22.5
23.0
23.5
24.0
24.5
25.0
25.5
26.0
Tot
al le
ngth
(cm
)
N = 786
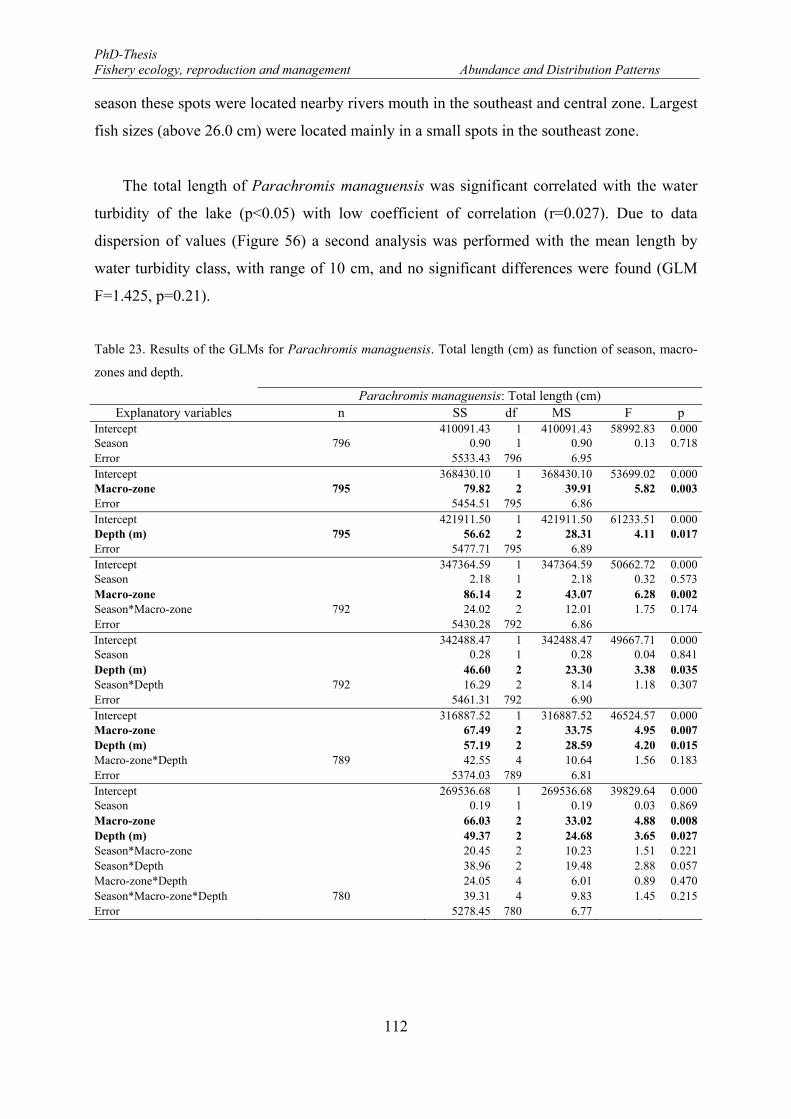
PhD-Thesis Fishery ecology, reproduction and management Abundance and Distribution Patterns
112
season these spots were located nearby rivers mouth in the southeast and central zone. Largest
fish sizes (above 26.0 cm) were located mainly in a small spots in the southeast zone.
The total length of Parachromis managuensis was significant correlated with the water
turbidity of the lake (p<0.05) with low coefficient of correlation (r=0.027). Due to data
dispersion of values (Figure 56) a second analysis was performed with the mean length by
water turbidity class, with range of 10 cm, and no significant differences were found (GLM
F=1.425, p=0.21).
Table 23. Results of the GLMs for Parachromis managuensis. Total length (cm) as function of season, macro-
zones and depth.
Parachromis managuensis: Total length (cm) Explanatory variables n SS df MS F p
Intercept 410091.43 1 410091.43 58992.83 0.000Season 796 0.90 1 0.90 0.13 0.718Error 5533.43 796 6.95 Intercept 368430.10 1 368430.10 53699.02 0.000Macro-zone 795 79.82 2 39.91 5.82 0.003Error 5454.51 795 6.86 Intercept 421911.50 1 421911.50 61233.51 0.000Depth (m) 795 56.62 2 28.31 4.11 0.017Error 5477.71 795 6.89 Intercept 347364.59 1 347364.59 50662.72 0.000Season 2.18 1 2.18 0.32 0.573Macro-zone 86.14 2 43.07 6.28 0.002Season*Macro-zone 792 24.02 2 12.01 1.75 0.174Error 5430.28 792 6.86 Intercept 342488.47 1 342488.47 49667.71 0.000Season 0.28 1 0.28 0.04 0.841Depth (m) 46.60 2 23.30 3.38 0.035Season*Depth 792 16.29 2 8.14 1.18 0.307Error 5461.31 792 6.90 Intercept 316887.52 1 316887.52 46524.57 0.000Macro-zone 67.49 2 33.75 4.95 0.007Depth (m) 57.19 2 28.59 4.20 0.015Macro-zone*Depth 789 42.55 4 10.64 1.56 0.183Error 5374.03 789 6.81 Intercept 269536.68 1 269536.68 39829.64 0.000Season 0.19 1 0.19 0.03 0.869Macro-zone 66.03 2 33.02 4.88 0.008Depth (m) 49.37 2 24.68 3.65 0.027Season*Macro-zone 20.45 2 10.23 1.51 0.221Season*Depth 38.96 2 19.48 2.88 0.057Macro-zone*Depth 24.05 4 6.01 0.89 0.470Season*Macro-zone*Depth 780 39.31 4 9.83 1.45 0.215Error 5278.45 780 6.77
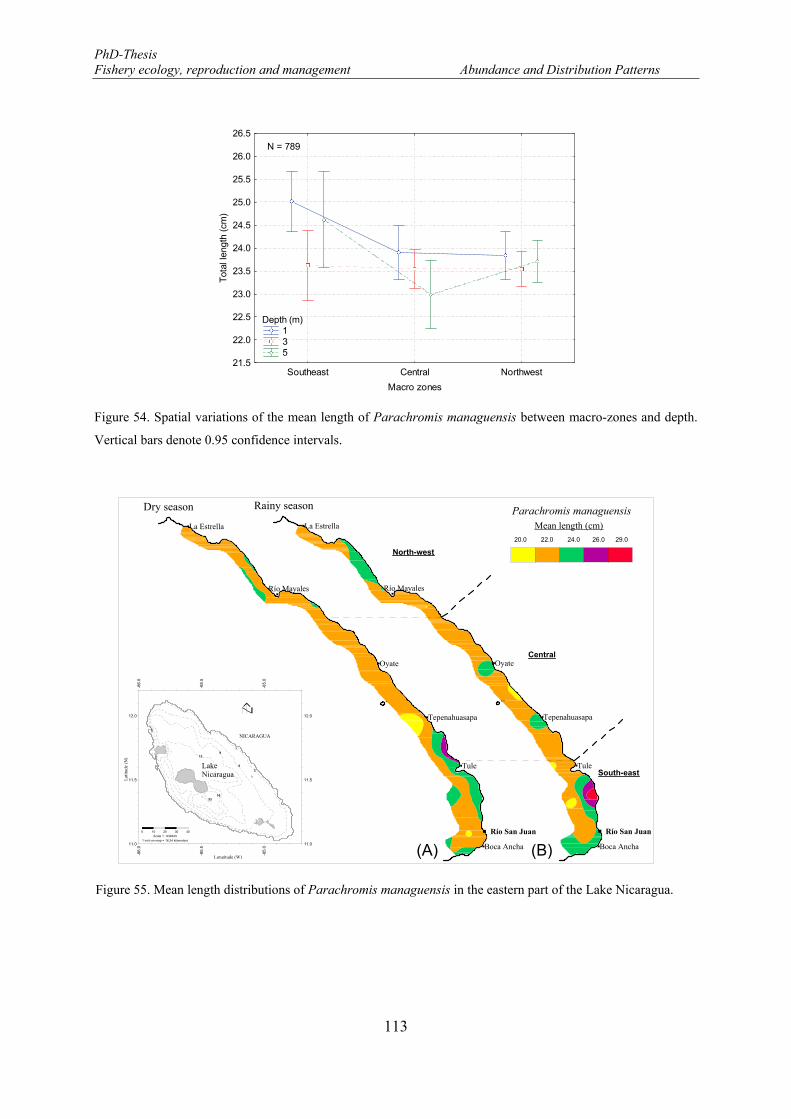
PhD-Thesis Fishery ecology, reproduction and management Abundance and Distribution Patterns
113
Figure 54. Spatial variations of the mean length of Parachromis managuensis between macro-zones and depth.
Vertical bars denote 0.95 confidence intervals.
Figure 55. Mean length distributions of Parachromis managuensis in the eastern part of the Lake Nicaragua.
Southeast Central Northwest
Macro zones
21.5
22.0
22.5
23.0
23.5
24.0
24.5
25.0
25.5
26.0
26.5
Tot
al le
ngth
(cm
)
N = 789
Depth (m) 1 3 5
Río Mayales
Boca Ancha
Tule
Tepenahuasapa
Oyate
La Estrella
Río San Juan
Mean length (cm)
Dry season
Río Mayales
Boca Ancha
Tule
Tepenahuasapa
Oyate
La Estrella
Río San Juan
Rainy season
-86.
0 -8
6.0
-85.
5 -8
5.5
-85.
0 -8
5.0
11.0 11.0
11.5 11.5
12.0 12.0
2LakeNicaragua
3316
139
6
NICARAGUA
Lati t
ude
(N)
Longitude (W)
0 10 20 30 40Scale 1 : 639343
1 inch on map = 16.24 kilometers
(A) (B)
20.0 22.0 24.0 26.0 29.0
South-east
Central
North-west
Parachromis managuensis
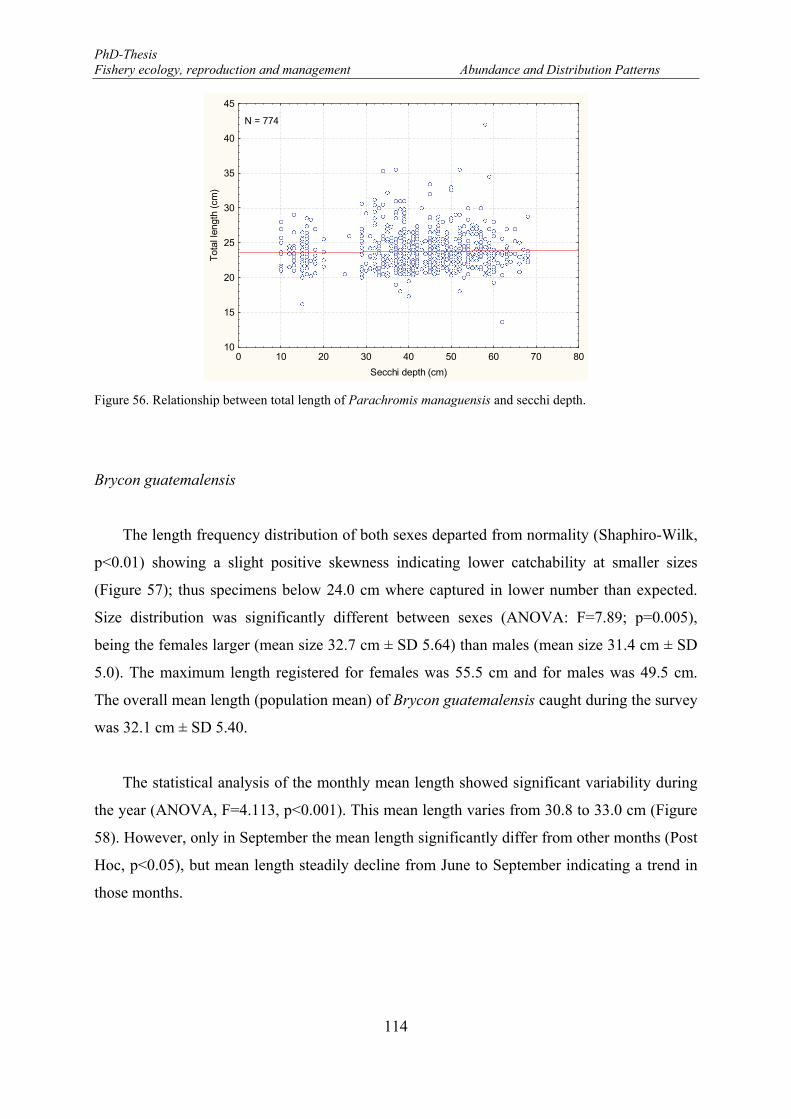
PhD-Thesis Fishery ecology, reproduction and management Abundance and Distribution Patterns
114
Figure 56. Relationship between total length of Parachromis managuensis and secchi depth.
Brycon guatemalensis
The length frequency distribution of both sexes departed from normality (Shaphiro-Wilk,
p<0.01) showing a slight positive skewness indicating lower catchability at smaller sizes
(Figure 57); thus specimens below 24.0 cm where captured in lower number than expected.
Size distribution was significantly different between sexes (ANOVA: F=7.89; p=0.005),
being the females larger (mean size 32.7 cm ± SD 5.64) than males (mean size 31.4 cm ± SD
5.0). The maximum length registered for females was 55.5 cm and for males was 49.5 cm.
The overall mean length (population mean) of Brycon guatemalensis caught during the survey
was 32.1 cm ± SD 5.40.
The statistical analysis of the monthly mean length showed significant variability during
the year (ANOVA, F=4.113, p<0.001). This mean length varies from 30.8 to 33.0 cm (Figure
58). However, only in September the mean length significantly differ from other months (Post
Hoc, p<0.05), but mean length steadily decline from June to September indicating a trend in
those months.
0 10 20 30 40 50 60 70 80
Secchi depth (cm)
10
15
20
25
30
35
40
45
Tot
al le
ngth
(cm
)
N = 774
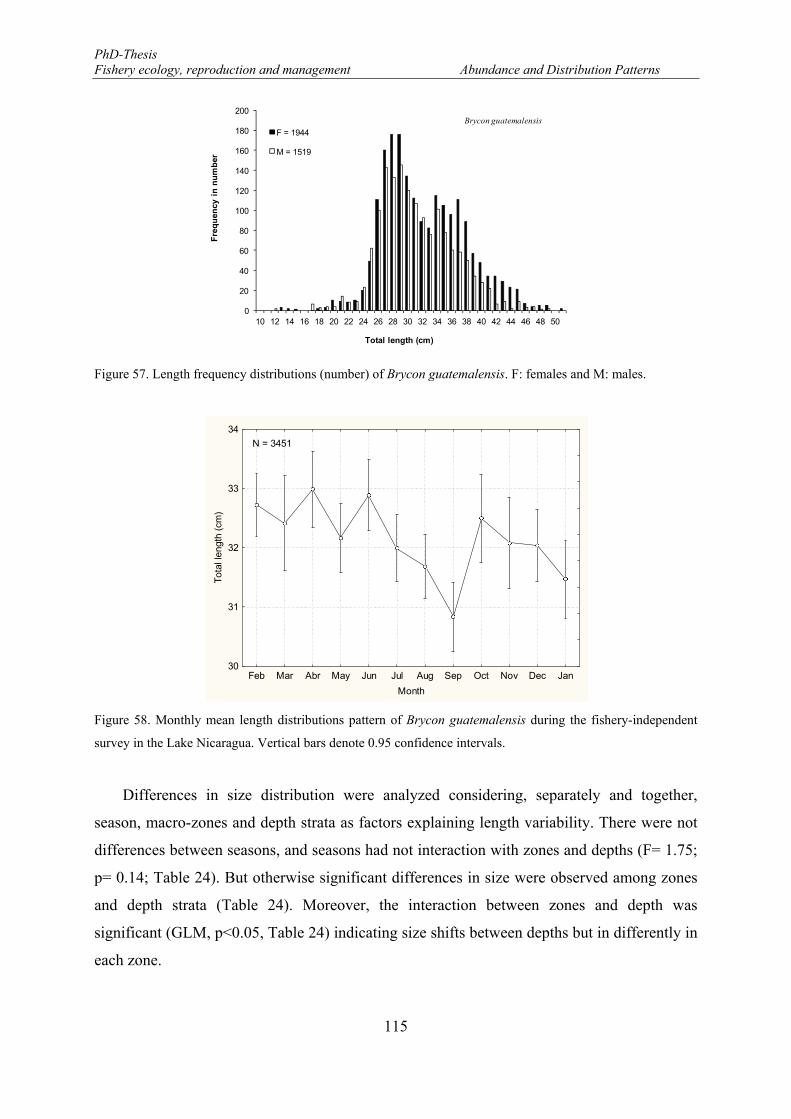
PhD-Thesis Fishery ecology, reproduction and management Abundance and Distribution Patterns
115
Figure 57. Length frequency distributions (number) of Brycon guatemalensis. F: females and M: males.
Figure 58. Monthly mean length distributions pattern of Brycon guatemalensis during the fishery-independent
survey in the Lake Nicaragua. Vertical bars denote 0.95 confidence intervals.
Differences in size distribution were analyzed considering, separately and together,
season, macro-zones and depth strata as factors explaining length variability. There were not
differences between seasons, and seasons had not interaction with zones and depths (F= 1.75;
p= 0.14; Table 24). But otherwise significant differences in size were observed among zones
and depth strata (Table 24). Moreover, the interaction between zones and depth was
significant (GLM, p<0.05, Table 24) indicating size shifts between depths but in differently in
each zone.
0
20
40
60
80
100
120
140
160
180
200
10 12 14 16 18 20 22 24 26 28 30 32 34 36 38 40 42 44 46 48 50
Fre
qu
ency
in
nu
mb
er
Total length (cm)
Brycon guatemalensis
F = 1944
M = 1519
Feb Mar Abr May Jun Jul Aug Sep Oct Nov Dec Jan
Month
30
31
32
33
34
Tot
al le
ngth
(cm
)
N = 3451
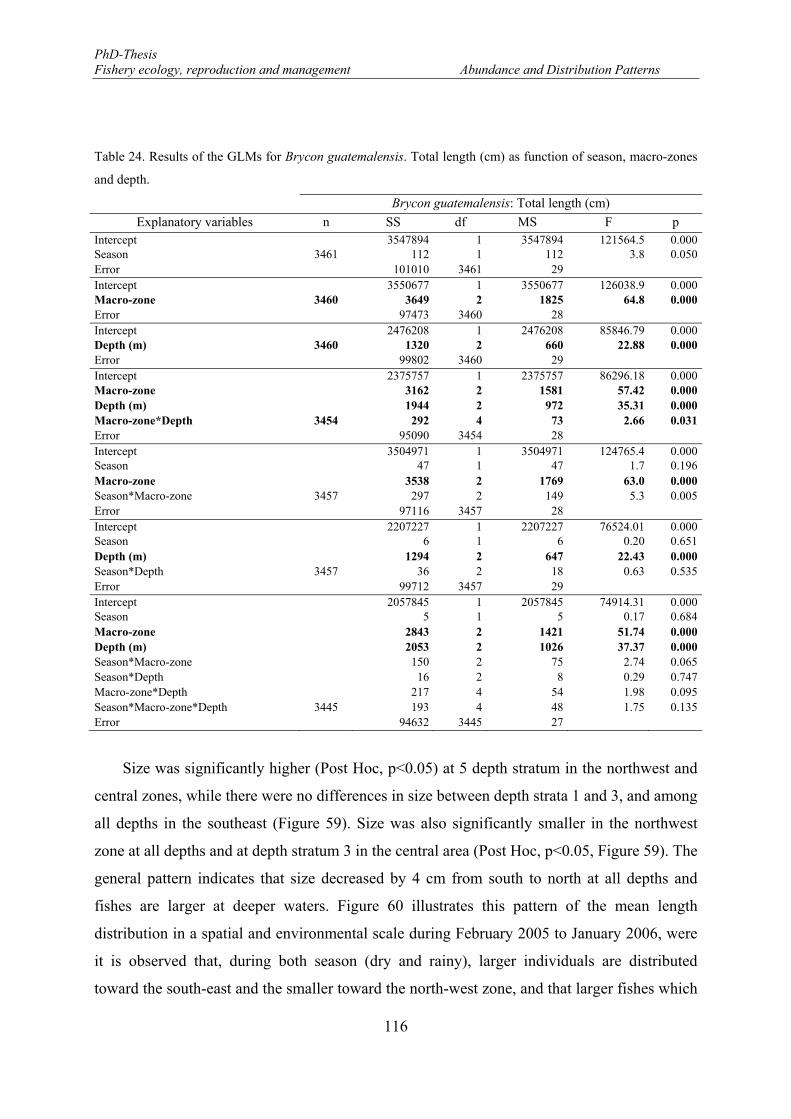
PhD-Thesis Fishery ecology, reproduction and management Abundance and Distribution Patterns
116
Table 24. Results of the GLMs for Brycon guatemalensis. Total length (cm) as function of season, macro-zones
and depth.
Brycon guatemalensis: Total length (cm)
Explanatory variables n SS df MS F p Intercept 3547894 1 3547894 121564.5 0.000Season 3461 112 1 112 3.8 0.050Error 101010 3461 29 Intercept 3550677 1 3550677 126038.9 0.000Macro-zone 3460 3649 2 1825 64.8 0.000Error 97473 3460 28 Intercept 2476208 1 2476208 85846.79 0.000Depth (m) 3460 1320 2 660 22.88 0.000Error 99802 3460 29 Intercept 2375757 1 2375757 86296.18 0.000Macro-zone 3162 2 1581 57.42 0.000Depth (m) 1944 2 972 35.31 0.000Macro-zone*Depth 3454 292 4 73 2.66 0.031Error 95090 3454 28 Intercept 3504971 1 3504971 124765.4 0.000Season 47 1 47 1.7 0.196Macro-zone 3538 2 1769 63.0 0.000Season*Macro-zone 3457 297 2 149 5.3 0.005Error 97116 3457 28 Intercept 2207227 1 2207227 76524.01 0.000Season 6 1 6 0.20 0.651Depth (m) 1294 2 647 22.43 0.000Season*Depth 3457 36 2 18 0.63 0.535Error 99712 3457 29 Intercept 2057845 1 2057845 74914.31 0.000Season 5 1 5 0.17 0.684Macro-zone 2843 2 1421 51.74 0.000Depth (m) 2053 2 1026 37.37 0.000Season*Macro-zone 150 2 75 2.74 0.065Season*Depth 16 2 8 0.29 0.747Macro-zone*Depth 217 4 54 1.98 0.095Season*Macro-zone*Depth 3445 193 4 48 1.75 0.135Error 94632 3445 27
Size was significantly higher (Post Hoc, p<0.05) at 5 depth stratum in the northwest and
central zones, while there were no differences in size between depth strata 1 and 3, and among
all depths in the southeast (Figure 59). Size was also significantly smaller in the northwest
zone at all depths and at depth stratum 3 in the central area (Post Hoc, p<0.05, Figure 59). The
general pattern indicates that size decreased by 4 cm from south to north at all depths and
fishes are larger at deeper waters. Figure 60 illustrates this pattern of the mean length
distribution in a spatial and environmental scale during February 2005 to January 2006, were
it is observed that, during both season (dry and rainy), larger individuals are distributed
toward the south-east and the smaller toward the north-west zone, and that larger fishes which
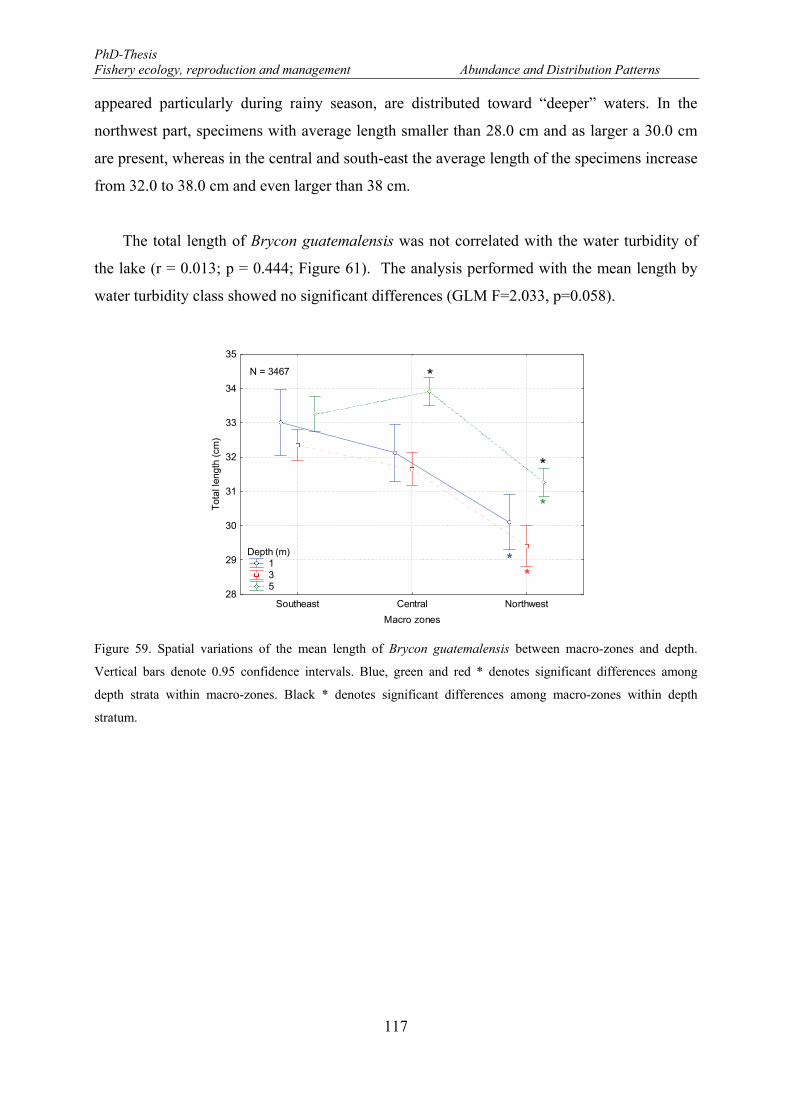
PhD-Thesis Fishery ecology, reproduction and management Abundance and Distribution Patterns
117
appeared particularly during rainy season, are distributed toward “deeper” waters. In the
northwest part, specimens with average length smaller than 28.0 cm and as larger a 30.0 cm
are present, whereas in the central and south-east the average length of the specimens increase
from 32.0 to 38.0 cm and even larger than 38 cm.
The total length of Brycon guatemalensis was not correlated with the water turbidity of
the lake (r = 0.013; p = 0.444; Figure 61). The analysis performed with the mean length by
water turbidity class showed no significant differences (GLM F=2.033, p=0.058).
Figure 59. Spatial variations of the mean length of Brycon guatemalensis between macro-zones and depth.
Vertical bars denote 0.95 confidence intervals. Blue, green and red * denotes significant differences among
depth strata within macro-zones. Black * denotes significant differences among macro-zones within depth
stratum.
Southeast Central Northwest
Macro zones
28
29
30
31
32
33
34
35
Tot
al le
ngth
(cm
)
Depth (m) 1 3 5
N = 3467 *
*
**
*
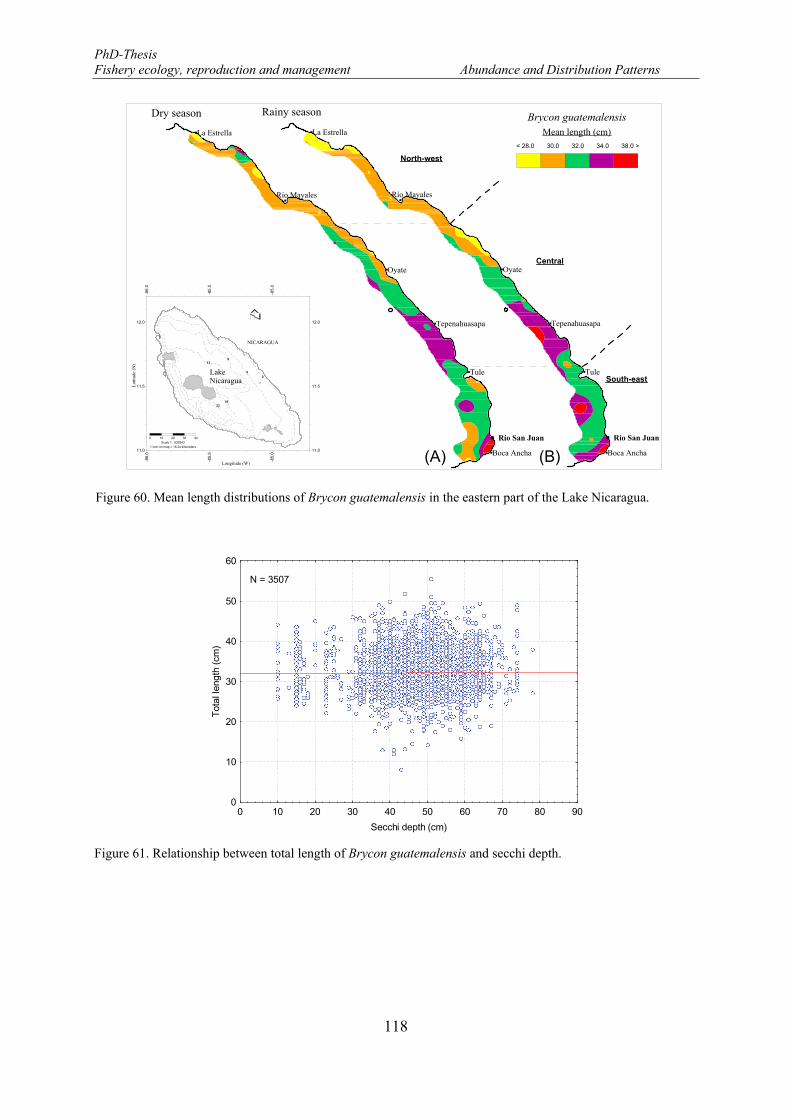
PhD-Thesis Fishery ecology, reproduction and management Abundance and Distribution Patterns
118
Figure 60. Mean length distributions of Brycon guatemalensis in the eastern part of the Lake Nicaragua.
Figure 61. Relationship between total length of Brycon guatemalensis and secchi depth.
0 10 20 30 40 50 60 70 80 90
Secchi depth (cm)
0
10
20
30
40
50
60
Tot
al le
ngth
(cm
)
N = 3507
Río Mayales
Boca Ancha
Tule
Tepenahuasapa
Oyate
La Estrella
Río San Juan
Mean length (cm)
Dry season
Río Mayales
Boca Ancha
Tule
Tepenahuasapa
Oyate
La Estrella
Río San Juan
Rainy season
-86.
0 -8
6.0
-85.
5 -8
5.5
-85.
0 -8
5.0
11.0 11.0
11.5 11.5
12.0 12.0
2LakeNicaragua
3316
139
6
NICARAGUA
Lati t
ude
(N)
Longitude (W)
0 10 20 30 40Scale 1 : 639343
1 inch on map = 16.24 kilometers
(A) (B)
< 28.0 30.0 32.0 34.0 38.0 >
South-east
Central
North-west
Brycon guatemalensis
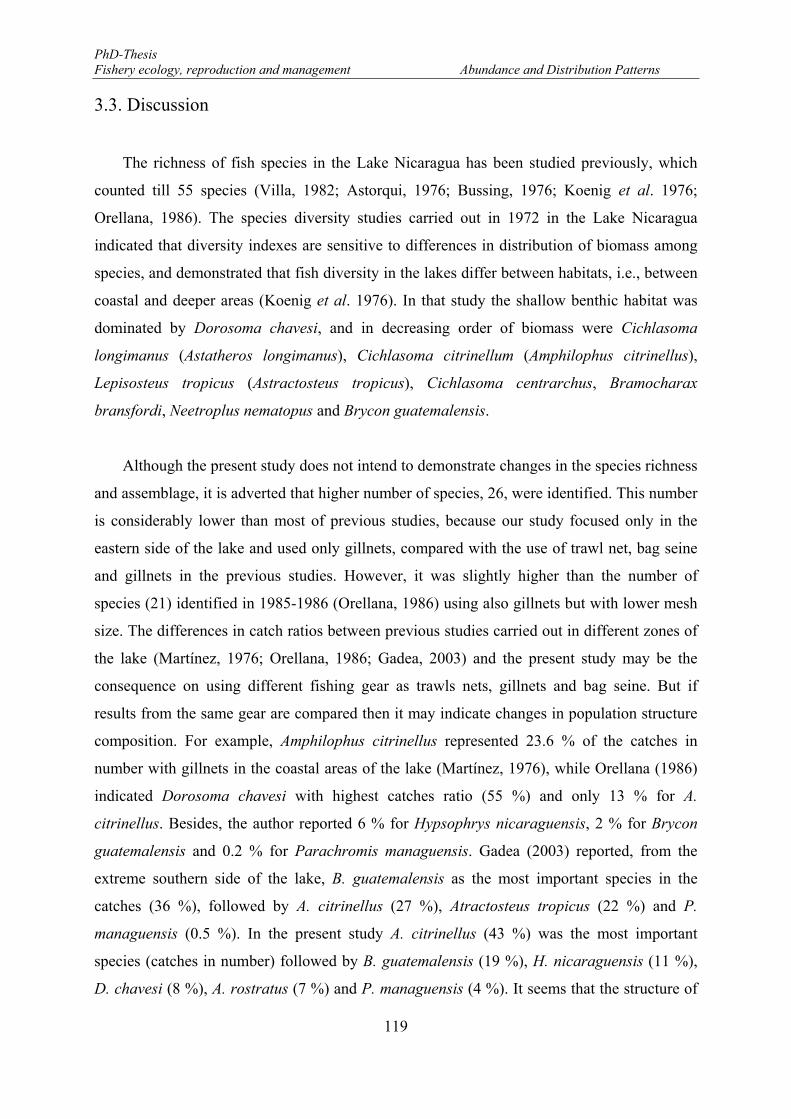
PhD-Thesis Fishery ecology, reproduction and management Abundance and Distribution Patterns
119
3.3. Discussion
The richness of fish species in the Lake Nicaragua has been studied previously, which
counted till 55 species (Villa, 1982; Astorqui, 1976; Bussing, 1976; Koenig et al. 1976;
Orellana, 1986). The species diversity studies carried out in 1972 in the Lake Nicaragua
indicated that diversity indexes are sensitive to differences in distribution of biomass among
species, and demonstrated that fish diversity in the lakes differ between habitats, i.e., between
coastal and deeper areas (Koenig et al. 1976). In that study the shallow benthic habitat was
dominated by Dorosoma chavesi, and in decreasing order of biomass were Cichlasoma
longimanus (Astatheros longimanus), Cichlasoma citrinellum (Amphilophus citrinellus),
Lepisosteus tropicus (Astractosteus tropicus), Cichlasoma centrarchus, Bramocharax
bransfordi, Neetroplus nematopus and Brycon guatemalensis.
Although the present study does not intend to demonstrate changes in the species richness
and assemblage, it is adverted that higher number of species, 26, were identified. This number
is considerably lower than most of previous studies, because our study focused only in the
eastern side of the lake and used only gillnets, compared with the use of trawl net, bag seine
and gillnets in the previous studies. However, it was slightly higher than the number of
species (21) identified in 1985-1986 (Orellana, 1986) using also gillnets but with lower mesh
size. The differences in catch ratios between previous studies carried out in different zones of
the lake (Martínez, 1976; Orellana, 1986; Gadea, 2003) and the present study may be the
consequence on using different fishing gear as trawls nets, gillnets and bag seine. But if
results from the same gear are compared then it may indicate changes in population structure
composition. For example, Amphilophus citrinellus represented 23.6 % of the catches in
number with gillnets in the coastal areas of the lake (Martínez, 1976), while Orellana (1986)
indicated Dorosoma chavesi with highest catches ratio (55 %) and only 13 % for A.
citrinellus. Besides, the author reported 6 % for Hypsophrys nicaraguensis, 2 % for Brycon
guatemalensis and 0.2 % for Parachromis managuensis. Gadea (2003) reported, from the
extreme southern side of the lake, B. guatemalensis as the most important species in the
catches (36 %), followed by A. citrinellus (27 %), Atractosteus tropicus (22 %) and P.
managuensis (0.5 %). In the present study A. citrinellus (43 %) was the most important
species (catches in number) followed by B. guatemalensis (19 %), H. nicaraguensis (11 %),
D. chavesi (8 %), A. rostratus (7 %) and P. managuensis (4 %). It seems that the structure of
PhD-Thesis Fishery ecology, reproduction and management Abundance and Distribution Patterns
120
the ichthyic composition and assemblage in the lake has varied since 1972 (Koenig et al.
1976) and 1985-1986 (Orellana, 1986). These changes can be related to different level of
exploitation of fish stock, thus in 1972, the Guapotes (P. managuensis and P. dovii), snook
(Centropomus parallelus) and Sawfish (Pristis perotteti) were considered first-class fish
whereas Gaspar or Gar (Atractosteus tropicus), Mojarra (A. citrinellus, H. nicaraguensis) and
Machaca (B. guatemalensis) were considered second-class fish because their low
commercialization (Davies & Pierce (1972). In recent years this situation has reversed due to
the low abundance of those species once commercialized as first-class. The decreasing
abundance in biomass of some species is probably due to the increasing fishing effort as
consequence of the growing number of full-time fishers in the lake.
In theory, during a fishing operation with gillnets it is expected an increase of the catches
with an increase of the fishing time, i.e., a linear relationship between catches and net soak
time. However, the relationship between the catches and fishing effort, expressed in hours, for
at least the four main species considered in this study, was asymptotic, which shows in
practice a saturation process of the gillnet performance during fishing operation. Hence, the
observed operation pattern can be separated in three periods: a first one where catches are
very low, which might be related to the disturbances exerted when fishing operation start, and
as the fishing hours increase, an increase of catches occur (the second period), reaching a
maximum level of catches between 6 and 7 hours. Finally a third period is observed, when a
reduction of the catches and CPUEs occur for longer setting times. This last period has been
interpreted as a decreasing efficiency of the net when fish accumulate (Kennedy, 1951;
Beverton & Holt 1957). This relationship between catches and soak time (effort), has been
found in other studies, for example Kennedy (1951) found a clear reduction in the catch per
day when nets were allowed to stand for two or three days as compared to their being lifted
daily, and Hickford & Schiel (1996) observed about the same numbers of fish caught in 6-
hour-day and 15-hour-night settings for four New Zealand reef species, i.e., when catch rates
were compared no statistical difference was found between the catch per hour in the long and
short settings. Engås (1983) compared catches of blue ling (Molva dypterygia) in gillnets
lifted at 1, 2 or 3 day intervals and found no differences in catch per day in two experiments
whereas a third experiment showed increasing catch rates with increasing set time.
PhD-Thesis Fishery ecology, reproduction and management Abundance and Distribution Patterns
121
The fishing gear performance has being related to the net saturation level, because the
meshes are occupied by fishes (Hamley, 1975), furthermore, over the fishing period an
increasing number of these catching sites may be occupied thereby decreasing the fishing
power of the gear over time (Hovgård & Lassen, 2000). These authors have indicated that the
interpretation of gillnet CPUEs is hampered by the fact that the gear is characterised by a
fixed number of positions where the fish may be caught, i.e., the number of meshes. The net
saturation level assumes that the mesh of the net are occupied by fishes (Hamley, 1975; Li &
Jiao, 2011), and then saturated. However, visual observation of the girth retained species in
this study suggests that nets are saturated at different gear segments depending of the fish
species. As the most notorious case Brycon guatemalensis was mostly retained at the upper
sections of the nets, while lower sections were less occupied by this species and occupied by
others. This may suggest that fish swim at basically the same height explaining fish clustering
in the net and then saturated at that level, which in time may be related with its benthopelagic
behaviour (Froese & Pauly, 2004) and migratory habits (Horn, 1997). On the other hand,
because the demersal habitat of most cichlids species (Oldfields, McCrary & McKaye 2006)
this are thought to be retained more in the lower level of the net. This observation of fish
behaviour may have an interesting implication from a fisheries management and economics
point of view, since it can increase gillnet selectivity by using nets of different heights and
soaked at different depths. Thus, for example, for catching B. guatemalensis fishers would not
need the use of net covering the entire water column; instead of that, nets should be shorter
and covering only the upper part of the water column which would allow a better and easier
fishing operation, reducing costs and bycatch. This empirical observation here pointed out
should be considered in multi-specific fisheries, since it would help in the protection of
species none commercially but biologically important and to avoid fish discards.
Nevertheless, the four species analysed in this chapter showed a very similar saturation point
at 6-7 hours. The average soak time was 6.4±0.4 hours showing the validity and
appropriateness of the survey design, and hence CPUE was used as abundance index without
further transformation (Li & Jiao, 2011).
Gill nets have been widely used in fisheries surveys (Hansen, Schorfhaar & Selgeby,
1998), and CPUE used as an index of fish abundance based on multi-mesh gillnet sampling
design, has been used for applied research (European Union, 2000; Sondergaard et al., 2005;
Diekmann et al., 2005). However, the information obtained on the fish stock depends strongly
PhD-Thesis Fishery ecology, reproduction and management Abundance and Distribution Patterns
122
on the choice of sampling methods (Jackson & Harvey, 1997; Jurvelius, Kolari & Leskelä,
2011). Therefore, the use of more than one sampling methods is generally preferred in order
to achieve a comprehensive overview of the abundance and spatiotemporal distribution
pattern (Kubecka et al., 2009). The efficiency of passive types of sampling gear such as
gillnets largely depends on both technical and biological factors, including mesh size, net
length, soak time, set and life time, gear saturation, fish abundance, morphology, behaviours,
the activity of the fish (Beverton & Holt 1957; Hamley, 1975; Olin et al., 2004; Rotherham et
al., 2006). Because of that, gillnet is thought to reduces the accuracy and reliability of CPUE
estimates, which may increase the probability of underestimation the real population size and
may result in under-exploitation of fish stock (Beverton & Holt 1957; Olin et al., 2004;
Rotherham et al., 2006). Thus, the estimates of fish abundance are accordingly indirect
(Hamley, 1975). Because gillnets are considered destructive as they kill most individuals
entangled in the meshes if the nets are left for several hours, and that situation has low
acceptance by the public and the recreational fishery community (Winfield et al., 2009),
recently modern hydroacoustics equipment, a sophisticated active fishing technology has
evolved (Simmonds & MacLennan, 2005) and frequently applied to sample fish assemblages.
This hydroacoustics techniques applied in research on fish abundance in many European lakes
have validated CPUE obtained from gillnet sampling. That because the strong correspondence
between gillnet catch per unit effort and hydroacoustically derived fish biomass in stratified
lakes have been observed (Emmrich et al., 2012). Thus, very likely in our study the estimated
CPUE can be considered as a good index of fish abundance.
However, the behavioural response of each fish assemblages to water turbidity may affect
the estimated fish abundance. But a weak or not at all relationship between CPUE and water
turbidity was observed. Turbidity may affect fish catchability, i.e., the interaction between
fish abundance and the fishing effort (Arreguín-Sánchez, 1996), because of the differences in
fish behavioural response to different level of water transparency. From an ecological point of
view the change of water transparency is one of the major drivers of lake ecology (Welcomme
et al., 2010) but the oligomesotrophic (PNUMA-OEA, 1997) characteristic of the Lake
Nicaragua seems to preserve good condition for the living resources. From a strictly fishery
perspective, the changes in water transparency modifies the net efficiency for some species,
through the alteration of fish behaviour. Clearest water allows the fishes to detect the gear
reducing fish-net encounters. Moderate levels of turbidity apparently decrease the likelihood
PhD-Thesis Fishery ecology, reproduction and management Abundance and Distribution Patterns
123
that fish will perceive the net material (Kirkland, 1965) increasing catch opportunities.
Conversely, reduced light penetration caused by turbidity also alters the fish behaviour by
reducing reactive distances, altering foraging behaviour, and decreasing association with
substrates, i.e., reducing catch rates (Noggle 1978; Gradall & Swenson 1982; Barrett et al.,
1992). The reducing reactive distance may applied to B. guatemalensis since this is known to
be a rapid swimmer because it migratory behaviour (Horn, 1997). This fish need enough
visibility to initiate its swimming activity since it seems to swim constantly and sustained,
then turbid water do not give the proper condition for this activity, therefore trammel is not
expected. However, in our study B. guatemalensis catch rate was not affected at all by
turbidity, in spite the wide range of turbidity recorded.
The fact of some cichlid species were more caught in turbid waters might be related with
the low capacity of those to visualise objects in those waters. Cichlids are probably less
adapted to habitat with low water transparency since these fish are visually oriented fish and
often associated with transparent water (Lowe-McConnell, 1999; Rodriguez & Lewis, 1997).
The low visibility pose has being adverted in haplochromine cichlids in which the decrease of
water clarity seems to affect foraging, social interactions (Fryer & Iles, 1972), to hamper mate
recognition or even frustrate breeding (Seehausen et al., 1998), and also may decrease prey
selectivity which result in an increased interspecific competition, that have negative impact on
species coexistence (Seehausen et al., 2003). Most cichlids are stenotopic (Eccles, 1986), i.e.,
able to adapt only to a narrow range of environmental conditions, which mean that under
unfavourable environmental conditions their distribution and abundance may be restricted. In
our study turbidity seems to have affected catch rate of two species only at very high values
of turbidity, i.e., less than 10 cm visibility. This situation occurred in less than 5% of the
hauls.
Intra-annual variation of the relative abundance index is hypothesised to be strongly
influenced by spatiotemporal effects, both horizontal (macro-zones) and vertical (depth), and
by environmental factors, i.e., the seasonality of precipitation. Each of these factors
independently and significantly determines the abundance index along the studied area.
However, the interaction between these factors was in most of the cases also significant
indicating a complex fish distribution and seasonal fish movements.
PhD-Thesis Fishery ecology, reproduction and management Abundance and Distribution Patterns
124
The four species covered in detail in this study are widely distributed in the eastern part
of the Lake Nicaragua. The more deterministic factors influencing the spatial distribution of
cichlids species was depth stratum and latitude, i.e., macro-zones. These species were more
abundant in shallower waters. Depth influences the composition of species in a fish
assemblage in floodplain lakes (Rodriguez & Lewis, 1997), due to variation in the hydro-
periods (Fernandes, Machado & Penha 2010), i.e., the period of time during which a wetland
is covered by water. The greater the depth of a body water, the greater the hydroperiod and,
therefore, the greater the time available for the processes of extinction or colonization of the
species in the assemblage (MacArthur & Wilson, 1967). The distribution and abundance of
cichlids may be also related to the affinity of these species with rocks or rocky areas (Olfields,
2006), that in the lake are located in areas near shore. However, rocky affinity may
temporarily change when searching for food in open waters and during spawning season, the
last may apply particularly for H. nicaraguensis which deposit the eggs in sand depressions
(Conkel, 1993).
The horizontal and vertical distribution of abundance of cichlids assemblages is probably
influenced by river drainages along the eastern coast and the different ecosystems found in the
lake as sandy, muddy and rocky areas, and edge vegetation (INFONAC, 1974). According to
INFONAC (1974) most of the lake bottom is muddy, regardless of its depth. However there
are several rocky patches in the southeast of Ometepe Island, near the mouth of the Rio
Mayales and around the Solentiname Archipelago. Particularly, the cichlids assemblage (A.
citrinellus, H. nicaraguensis and P. managuensis) and B. guatemalensis higher abundance
found in the surrounding area near the mouth of Río Mayales, with monthly average flow is
6.33 m3/s, might be consequence of the combination of its undiscovered ecological
importance for fish development and the rocky areas located near the river mouth. The higher
abundance of A. citrinellus, H. nicaraguensis and B. guatemalensis in the extreme southern
part of the lake is associated to the influence of the San Juan River, which has an outstanding
ecological importance (Bussing, 2002; Villa, 1982; PROCUENCA-SAN JUAN, 2004).
Although seasonality has been shown to affect the distribution and abundance pattern of
these three cichlids, its influence was negligible in A. citrinellus but certainly important in H.
nicaraguensis and in less extent in P. managuensis. Most studies on seasonal influence on the
cichlids abundance have being observed in rivers where dry or rainy periods induce rapid
PhD-Thesis Fishery ecology, reproduction and management Abundance and Distribution Patterns
125
changes in the level of water column, i.e., flooding during rainy season and drying up during
dry season. In lentic environments as lakes those effects occur moderately since these are
closed systems consisting of defined body water (Welcomme et al., 2010). Yet, this moderate
influence was evident in our study, particularly for H. nicaraguensis and P. managuensis that
showed lower relative abundance during rainy season. Although these cichlids apparently do
not undergo major reproductive migration, they may move in a horizontal plane colonizing
other rocky areas along the shore, disperse in the whole area or even move into tributary
rivers (Lowe-McConnell, 1999). Some cichlids move out from the lagoon onto the floodplain
during the flood at the beginning of the rainy season in Cuiabá River, Brazil (Fernandes,
Machado & Penha, 2010). The relative abundances of cichlid assemblages in some
neotropical areas were distinct between the seasons, which indicate that neither persistence
nor stability was maintained on a seasonal basis (Lourenço et al. (2012).
Season and depth are the main factors influencing abundance of B. guatemalensis.
Largest abundances were found in the southeast and northwest side, during both seasons (dry
and rainy), but highest abundances occurred in rainy season at shallower waters, and lower
abundance in the central part the area. Seasonality seems to strongly modulate the migratory
behaviour of this species from rivers to the lake environment and vice versa. The increasing
abundance during rainy season is more evident near the areas of rivers drainage. Rivers have
been known to be very important habitat for potamodromous (migrating within freshwater
only) species as B. guatemalensis, which inhabits the lakes of Nicaragua and exhibit a
migratory behaviour into tributary rivers (Drewe et al., 2003) to spawn (McLarney et al.,
2010). The seasonal migratory behaviour is confirmed by a parallel study carried out during
2005 in the San Juan River (RSJ), where major abundances of B. guatemalensis were found
upstream of the river during dry season, i.e., from November to March (PROCUENCA-SAN
JUAN, 2004). This finding indicates that probably the same pattern occur in other tributary
rivers located in the eastern side of the lake. Similar pattern was also found in Brycon
behreae, which during highest flows (rainy season), it comes out of the open regions of
Térraba River, Costa Rica, and concentrates in pools located at its shore and in the streams
(Ribeiro & Umaña, 2010). Low flows are directly associated to the absence of rainfall, i.e.,
dry season, whereas high flow is the result of rainfall during rainy season. The low and high
abundance of Brycon behreae is in line with the pattern of the abundance index observed in B.
guatemalensis in the lake (open waters), where lower and higher abundance index were found
PhD-Thesis Fishery ecology, reproduction and management Abundance and Distribution Patterns
126
in dry season (low flow) and in rainy season (high flow), respectively. Seasonality has been
identified as the main factor influencing the abundance of many other characoid fresh water
fishes in other neotropics areas (Kramer, 1978b). According with Magalhães, Batalha &
Pereira (2002), large scale events such as dry or rainy seasons usually alter the ecological
structure of communities through mortality and mass migrations, but the season have also
local effects over the habitat affecting abundance (Inoue & Nunokawa, 2002).
The abundance fluctuation in A. citrinellus and B. guatemalensis during the dry season,
and the lower abundance of H. nicaraguensis at the onset of the same period may respond to
the particular dynamic of the lake during this season. From October to March strong wind
(The Papagayo wind) blows through the gap in the mountain ranges of Central America and
over the lakes of Nicaragua (NASA SeaWIFS 2000-2001). This wind dominates the entire
southern side of Pacific Nicaragua, with velocity in the order of 7 m/s and occasionally
reaching speeds greater than 10 m/s (Brenes, Hernández & Gutiérrez, 1998), and in turn stress
over the entire water surface of the lake. The unidirectional wind stress over the entire lake
and affect the entire water column of the coastal area because the shallowness of this area.
This atmospheric condition might induce the cichlid species to seek for shelter and alter the
migration pattern in B guatemalensis causing in extreme cases even a movement out of the
area. The bad whether condition is probably responsible for some capture failures because
well of fishing gear malfunction when trammel the net, well a lack of fish movement. It may
explain the occurrences of zero-captures in dry season in the order of 65 %; against 35 %
during in rainy season where zero-capture occurrences may be also the result of some strong
storms occurred during the period of study. During rainy season the lake water level slowly
but steadily increase due to direct rainfall over the lake and the river discharges, the last
affecting more the adjacent areas of the river mouth. The changes in the lake ecosystem
during rainy seasons are reflected in the gaining depth because the water level rise and the
increasing water turbidity because suspended sediments are transported by river flows into the
lake. These two factors seems to favour the occurrence in open waters of B. guatemalensis but
the gradual decline in abundance of H. nicaraguensis and P. managuensis as they occupy
flooded areas in the lake shore. Undoubtedly, fish species in the lake distribute according to
depth, being the factor that best explain the distribution pattern within the studied area for all
species analysed. In the case of B. guatemalensis largest abundance were found at bigger
depths, i.e., at 3.0 and 5.0 m strata. But this vertical distribution pattern is also influenced by
PhD-Thesis Fishery ecology, reproduction and management Abundance and Distribution Patterns
127
season. This is an expected pattern giving the rise and fall of the lake water level, as a
consequence of dry and rainy season.
There was a clear spatial size distribution in all studied species. Larger fishes are found in
the south-east and to a lesser extent in the central zone of the lake, whereas in the north-west
area the individuals were smaller. This pattern might be related to the influence of San Juan
River (Rio San Juan-RSJ), which is the natural out-flood (drainage) of the lake, connecting
the lake with the Caribbean Sea. The river, from an ecological point of view, is the most
important river in the region because its extension and habitat diversity, as well the high
biodiversity, providing optimal conditions (temperature, solar illumination, currents, oxygen,
availability of food etc.) for growing and reproduction of many species (Bussing, 2002; Villa,
1982). Beside this, it is known that freshwater fishes exhibit home range or homing affinities,
daily or seasonal movement pattern or longer-distance migrations, which are considered to be
truly “autoecological”, because these patterns are more related with searching for optimal
environmental conditions (Matthews, 1998). This behaviour may explain the observed size
distribution pattern.
The selectivity of the gear used during the surveys prevent us to discern where the
juveniles of each species inhabits, i.e., in the lake or in the River. That because size of A.
citrinellus, H. nicaraguensis, P. managuensis and B. guatemalensis smaller than 14.0, 11.0,
17.0 and 20.0 cm, respectively, were not taken but the sampling gear used. A study carried
out along the San Juan River using gillnets with equal mesh size produced similar results, i.e.,
very low catches of smaller sizes (PROCUENCA-SAN JUAN, 2004). Nevertheless, it was
also observed a differential vertical size distribution. Because the shape of the lake, this may
be connected directly with depth preferences (different substrates) or with distance to the
shore. In any case it is clear that larger fish are found in the deeper waters studied (3-5 m),
excepting for P. managuensis which larger size has preferences for shallower water (1 to 3 m
depth). In shallow waters or inshore areas of the lake, a relative high proportion of specimens
were below the mean length estimated for each species, i.e., 64%, 41%, 70%, 50%, in dry
season and 66%, 57%, 83%, and 59%, in rainy season, for A. citrinellus, H. nicaraguensis, P.
managuensis and B. guatemalensis. This overall pattern of smaller size fish inhabiting in
shallower waters, particularly for Mojarras (included A. citrinellus and H. nicaraguensis) and
B. guatemalensis is in line with previous studies covering the entire lake, where mean length
PhD-Thesis Fishery ecology, reproduction and management Abundance and Distribution Patterns
128
of mojarras and Brycon in the coastal area was 19.0 and 37.6 cm, respectively and in deeper
water 21.5 and 46.6 cm, respectively (Orellana, 1986), which may indicate that fishes are
recruited to the fisheries in the lake. In spite of larger fish inhabiting mainly the southeast,
larger fishing effort are located in the north-west zone. This important aspect will be
discussed in Chapter 6.
Larger size ever reported in the lake on B. guatemalensis was 61.7 cm captured in the
southeast area close to RSJ (Gadea, 2003). This was similar to the recorded maximum size of
59 cm (IGFA, 2001) and in the present study (2005-2006), 55.5 cm, captured in the south-east
zone. The results of the most recent study in RSJ showed that most of the specimens captured
in the river ranged between 35 to 40 cm, with maximum length captured of 60 cm, mainly
captured upstream, i.e., the closer area to the lake, whereas downstream there was a tendency
to find smaller size, where recruitment of many species is considered to occur
(PROCUENCA-SAN JUAN, 2004). On the other hand, from sport fishing in RSJ have been
reported the capture of a specimens of 2.5 kg which is equivalent to 52 cm (MACHACA,
2011), and from Costa Rican rivers were reported specimen up to 50 cm and 4.3 kg (Bussing,
2002). These findings may support the hypothesis that the presence of larger fish in the south-
east and central zone are influenced by the San Juan River because the migratory movement
of the species upstream towards the lake. The migratory habits upstream of B. guatemalensis
for spawning or perhaps feeding has been already pointed out (Horn, 1997); very likely
associated to the precipitation seasonality (Lowe-McConnel, 1987).
129
CHAPTER 4: Reproductive Strategy of Brycon guatemalensis.
4.1. Introduction
The reproductive strategy is the combination of reproductive traits characteristic of
individuals belonging to the same gene pool. Some traits may be inflexible and show little
variation, while other traits may be plastic, so an individual can exhibit a wide range in their
expression. The different expressions of a trait in response to environmental changes are the
tactical responses of the individuals to those changes (Wootton, 1990). On the other hand,
Fostier (2008) defines reproductive strategy as the way in which a species allocates or budgets
energy to produce viable offspring. In all the definitions found are clearly identified that the
aim of each species is to produce the maximum amount of offspring. Teleosts fish have
developed a large variety of reproductive strategies and reproductive behaviours, e.g., ranging
from mass spawning to parental care, from strict gonochorism (separate sexes) to
simultaneous hermaphroditism, and from oviparity to viviparity, and one usually distinguishes
the r-strategy, in which energy is invested in a multitude of offspring that receive little or no
parental care, and the K-strategy, wherein energy is invested in a few, large offspring that
require considerable parental care (Fostier, 2008).
In some marine fishes have been described and identified the most common reproductive
strategies related to the oocytes development, ovary organization, recruitment of oocytes and
spawning pattern (Murua & Saborido-Rey, 2003). As many marine and brackish teleosts,
freshwater fishes exhibit a great variety of reproductive strategies. Teletchea et al. (2009)
defined 10 homogeneous clusters based on 29 reproductive traits such as oocyte size, egg
adhesiveness, age and length at sexual maturity of females and males, absolute fecundity
(eggs/females), relative fecundity (eggs/kg), maximum gonado-somatic (GSI) value,
spawning (season, duration, temperature, water type, substratum, site) and many others.
Within each strategy the variation of the traits outlines the variable reproductive potential of
the species, stock or an individual. Thus, the stock reproductive potential can be defined as
the capacity of a population to produce viable eggs and can be considered as the main
outcome of a reproductive strategy (Trippel, 1999; Murua & Saborido-Rey, 2003).
PhD-Thesis Fishery ecology, reproduction and management Reproductive strategy
130
In tropical fresh water environments, a great diversity of fishes from different families
with different reproductive strategies and behaviour is found; including the Characidae,
Cyprinidae and Siluriformes families. The Characidae family which includes Brycon
guatemalensis, is a large and diverse family of freshwater subtropical and tropical fish
(Oliveira et al., 2011) which a great diversity of reproductive behaviour. This vary from
groups of fishes with terrestrial spawning behaviour that spawn in foam nests (Kramer,
1978a), with non or weakly adhesive eggs (Rizzo et al., 1998; 2002), to fish spawning in
aquatic environments on aquatic plants, which is the most common pattern (Brederc & Rosen,
1966) or laying the eggs in excavated nests in the sand substratum as in B. guatemalensis
(Bussing, 2002).
Some comparative analyses have shown that some oogenesis patterns are common to
fishes of the same family in Neotropical freshwater fishes (Bazzoli & Rizzo, 1990). The eggs
surface has so far been examined only in a few Characiformes and Siluriformes (Rizzo et al.,
1998) and reproductive strategy (sedentary or migratory) and eggs adhesiveness (adhesive,
weakly adhesive and non-adhesive) have been also examined on 12 species of the Characidae
family (Rizzo et al., 2002). The structure of the jelly coat that provides adhesiveness has been
recently studied (Weber et al., 2012).
Reproductive behaviour adopted by the Characidae family has been associated with the
diversity of the environmental conditions where the species inhabit. The reproductive tactics
differ even between strong resemble species in molecular characteristic, morphology and
ecology as B. guatemalensis and B, chagrensis (PANCANAL, 2011), and with other parental
species as B. behreae and B. chagrensis, B. petrosus, e.g., B. guatemalensis spawn in sand
ground nests, whereas B. petrosus in a very similar environmental conditions spawn in
humidity land (Bussing, 2002). However, many reproductive characteristics of B.
guatemalensis, such as the duration and timing of the reproduction in response to
environmental conditions, remain still unknown. Besides, the duration and timing of the
reproduction is altered within the family in response to environmental conditions, also food
availability, predation, inter an intra-specific competition and the species’ social system is
altered, e.g., some species belonging to the same family spawn in dry season, whereas other in
rainy season, the diversity of seasonal patterns in this small group of related species presents
PhD-Thesis Fishery ecology, reproduction and management Reproductive strategy
131
some fascinating problems for the comparative study of life history strategies (Kramer,
1978a).
Because the very few information found in literature on B. guatemalensis reproductive
behaviour, comparative studies of life history strategies are difficult to perform. The objective
of the present work is to study the female reproductive strategy and traits of wild Machaca, B.
guatemalensis, using histology and focusing in three key reproductive parameters in fisheries
management: the reproductive cycle, the ontogenic maturation and the fecundity.
4.2. Results
The ovaries of B. guatemalensis, as many teleosts, are cystovarian type, i.e., the oocytes
are released directly into the lumen of the ovary and then to the oviduct. Then a real lumen is
observed as the ovary has a clear ovarian wall or membrane. Inside the ovary, complex folds
are observed where the follicles are observed connected to the supporting tissue or stroma,
blood vessels and nerves.
4.2.1. Oogenesis
The female gametogenesis is described based on histological analysis carried out on 371
ovaries. The different oocytes development stages were identified and described, and in
general it follows a typical teleost gametogenesis. The oocyte development can be divided in
several stages. Within the primary growth we have focused only in the most advance stage,
the so-called perinucleolar stage. Then we have considered the cortical alveoli, vitellogenesis
and follicle maturation stages.
Perinucleolar stage (PG)
The oocytes at this stage were observed in every fish analysed, as corresponding to an
iteroparous species. In 66 ovaries only these oocytes were detected, indicating the fish was
immature or was in regenerating phase (see 4.2.2. Reproductive cycle). Typically these
PhD-Thesis Fishery ecology, reproduction and management Reproductive strategy
132
oocytes showed a basophilic blue stained colour (with H&E), a spherical nucleus with
multiple nucleolus in the periphery of the nucleoplasm and the perinuclear ring is clearly
visible (Figure 62A). The oocytes diameter at this stage ranged from 43.5 to 186.8 µm (Table
25).
Cortical alveoli stage
The cortical alveoli stage (CA) is characterized by the occurrence of visible (under light
microscope) vesicles or alveoli spread in the cytoplasm. However, it was noticed that the
vesicles or alveoli were not clearly visible in the cytoplasm, having small size (Figure 62 B).
This circumstance does not seem to change until the onset of vitellogenesis. To overcome the
difficulty of observation of these structures and define clearly this stage, it was necessary to
look for other relevant characteristics of the oocytes at this stage, as the increase in size of the
oocyte and follicle thickness, with respect to the size and follicle thickness of oocytes in
primary growth stages. In 181 ovaries cortical alveoli was the most advanced development
stage. But in 187 females CA oocytes were visible within the ovary. The diameter of the
oocytes in CA stages ranged from 159.7 to 370.1 µm (Table 25).
Vitellogenesis
Basically the whole vitellogenesis was considered in a single stage (VIT1) ranging from
the first occurrence of yolk in the cytoplasm until the first signs of follicle maturation were
visible (see next stage). In 42 females this stage was the most advance stage observed within
the ovary, but 67 ovaries had oocytes in this stage. During the whole stage the follicle
envelops keep a round shape that became irregular when the oocytes reach maturation (VIT2)
(Figure 62 C). Yolk progressively accumulates around the nucleus and spread towards de
periphery. Clear and large vacuoles are observed as a ring around the yolk. This ring is
gradually constrained into the oocyte periphery. During this process the oocytes enlarge from
357.1 to 1140.1 µm (Table 25).
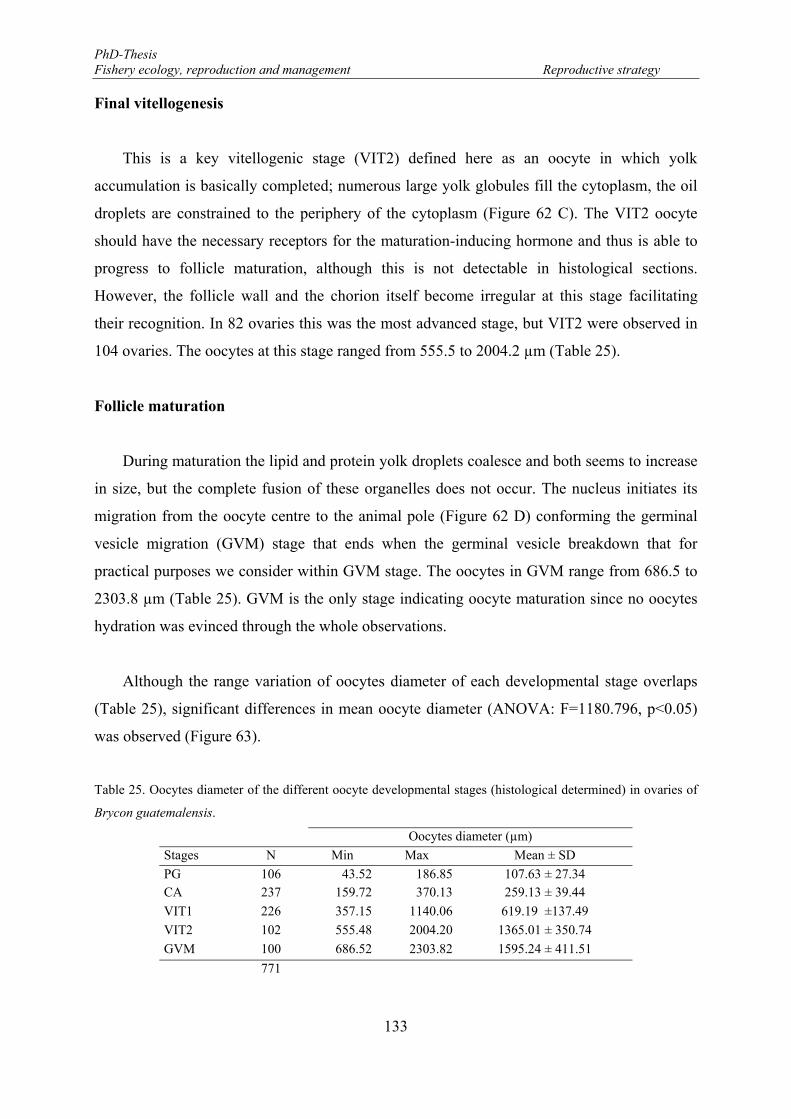
PhD-Thesis Fishery ecology, reproduction and management Reproductive strategy
133
Final vitellogenesis
This is a key vitellogenic stage (VIT2) defined here as an oocyte in which yolk
accumulation is basically completed; numerous large yolk globules fill the cytoplasm, the oil
droplets are constrained to the periphery of the cytoplasm (Figure 62 C). The VIT2 oocyte
should have the necessary receptors for the maturation-inducing hormone and thus is able to
progress to follicle maturation, although this is not detectable in histological sections.
However, the follicle wall and the chorion itself become irregular at this stage facilitating
their recognition. In 82 ovaries this was the most advanced stage, but VIT2 were observed in
104 ovaries. The oocytes at this stage ranged from 555.5 to 2004.2 µm (Table 25).
Follicle maturation
During maturation the lipid and protein yolk droplets coalesce and both seems to increase
in size, but the complete fusion of these organelles does not occur. The nucleus initiates its
migration from the oocyte centre to the animal pole (Figure 62 D) conforming the germinal
vesicle migration (GVM) stage that ends when the germinal vesicle breakdown that for
practical purposes we consider within GVM stage. The oocytes in GVM range from 686.5 to
2303.8 µm (Table 25). GVM is the only stage indicating oocyte maturation since no oocytes
hydration was evinced through the whole observations.
Although the range variation of oocytes diameter of each developmental stage overlaps
(Table 25), significant differences in mean oocyte diameter (ANOVA: F=1180.796, p<0.05)
was observed (Figure 63).
Table 25. Oocytes diameter of the different oocyte developmental stages (histological determined) in ovaries of
Brycon guatemalensis.
Oocytes diameter (µm)
Stages N Min Max Mean ± SD
PG 106 43.52 186.85 107.63 ± 27.34 CA 237 159.72 370.13 259.13 ± 39.44
VIT1 226 357.15 1140.06 619.19 ±137.49
VIT2 102 555.48 2004.20 1365.01 ± 350.74
GVM 100 686.52 2303.82 1595.24 ± 411.51
771
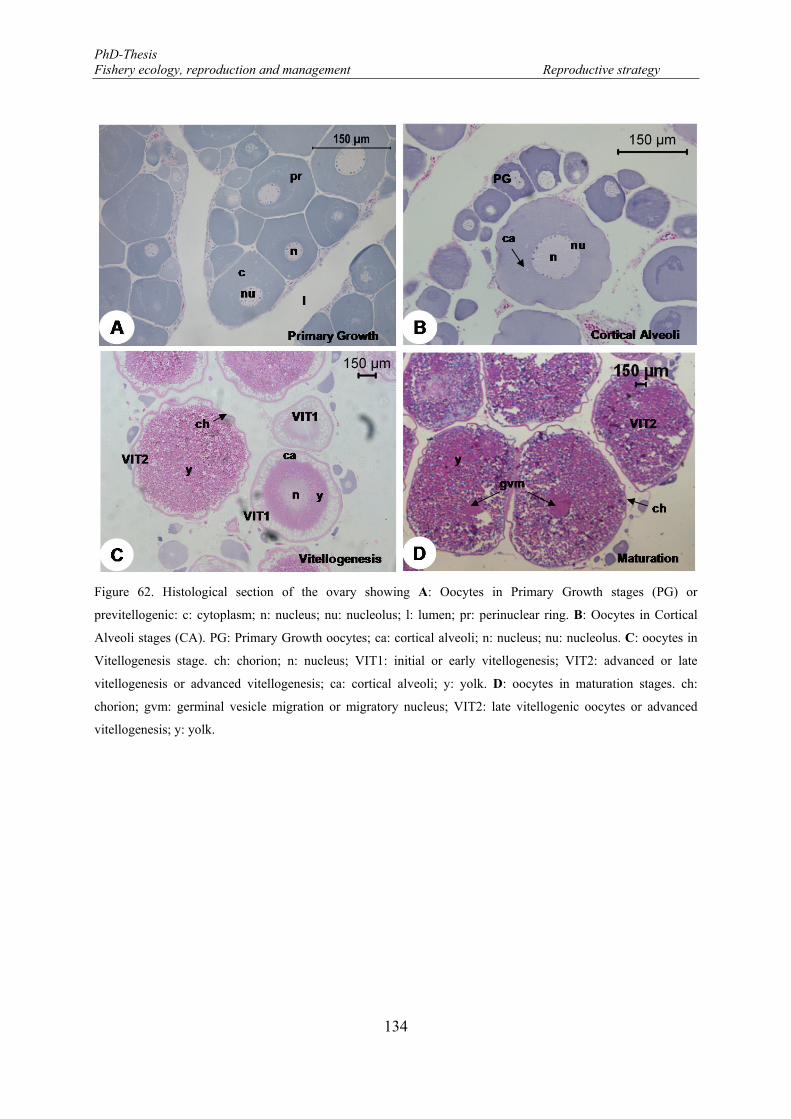
PhD-Thesis Fishery ecology, reproduction and management Reproductive strategy
134
Figure 62. Histological section of the ovary showing A: Oocytes in Primary Growth stages (PG) or
previtellogenic: c: cytoplasm; n: nucleus; nu: nucleolus; l: lumen; pr: perinuclear ring. B: Oocytes in Cortical
Alveoli stages (CA). PG: Primary Growth oocytes; ca: cortical alveoli; n: nucleus; nu: nucleolus. C: oocytes in
Vitellogenesis stage. ch: chorion; n: nucleus; VIT1: initial or early vitellogenesis; VIT2: advanced or late
vitellogenesis or advanced vitellogenesis; ca: cortical alveoli; y: yolk. D: oocytes in maturation stages. ch:
chorion; gvm: germinal vesicle migration or migratory nucleus; VIT2: late vitellogenic oocytes or advanced
vitellogenesis; y: yolk.
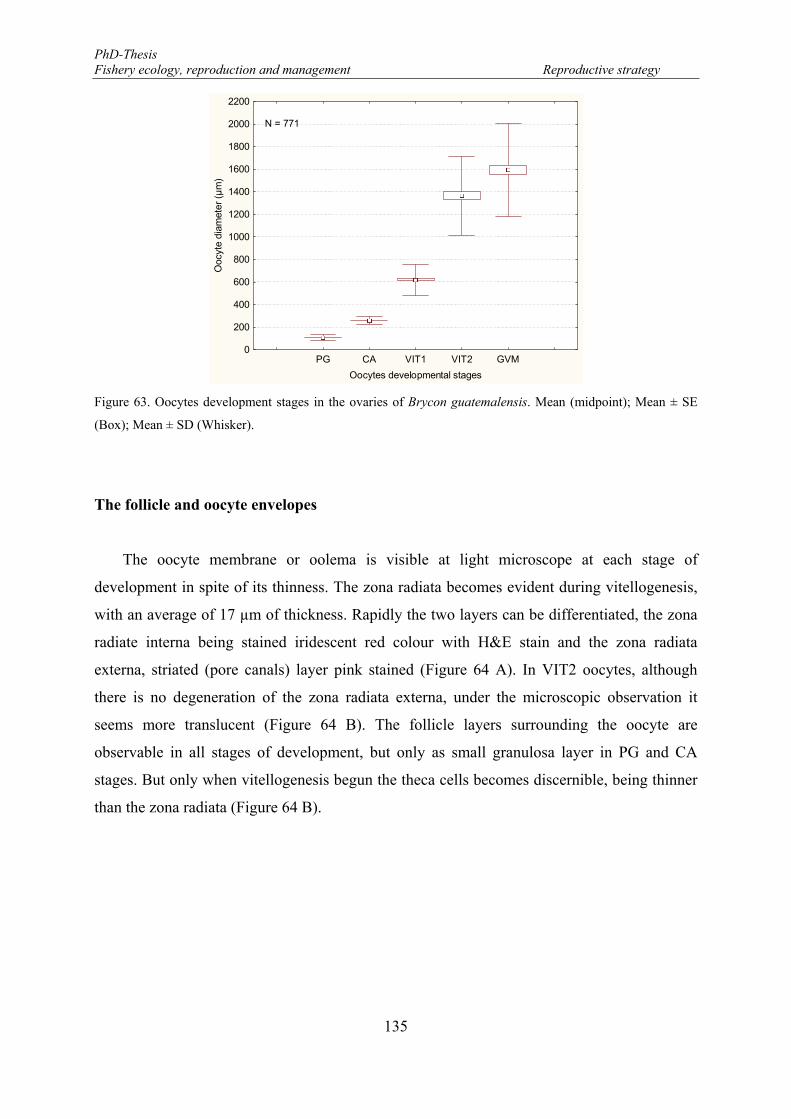
PhD-Thesis Fishery ecology, reproduction and management Reproductive strategy
135
Figure 63. Oocytes development stages in the ovaries of Brycon guatemalensis. Mean (midpoint); Mean ± SE
(Box); Mean ± SD (Whisker).
The follicle and oocyte envelopes
The oocyte membrane or oolema is visible at light microscope at each stage of
development in spite of its thinness. The zona radiata becomes evident during vitellogenesis,
with an average of 17 µm of thickness. Rapidly the two layers can be differentiated, the zona
radiate interna being stained iridescent red colour with H&E stain and the zona radiata
externa, striated (pore canals) layer pink stained (Figure 64 A). In VIT2 oocytes, although
there is no degeneration of the zona radiata externa, under the microscopic observation it
seems more translucent (Figure 64 B). The follicle layers surrounding the oocyte are
observable in all stages of development, but only as small granulosa layer in PG and CA
stages. But only when vitellogenesis begun the theca cells becomes discernible, being thinner
than the zona radiata (Figure 64 B).
PG CA VIT1 VIT2 GVM
Oocytes developmental stages
0
200
400
600
800
1000
1200
1400
1600
1800
2000
2200
Ooc
yte
diam
eter
(µ
m)
N = 771
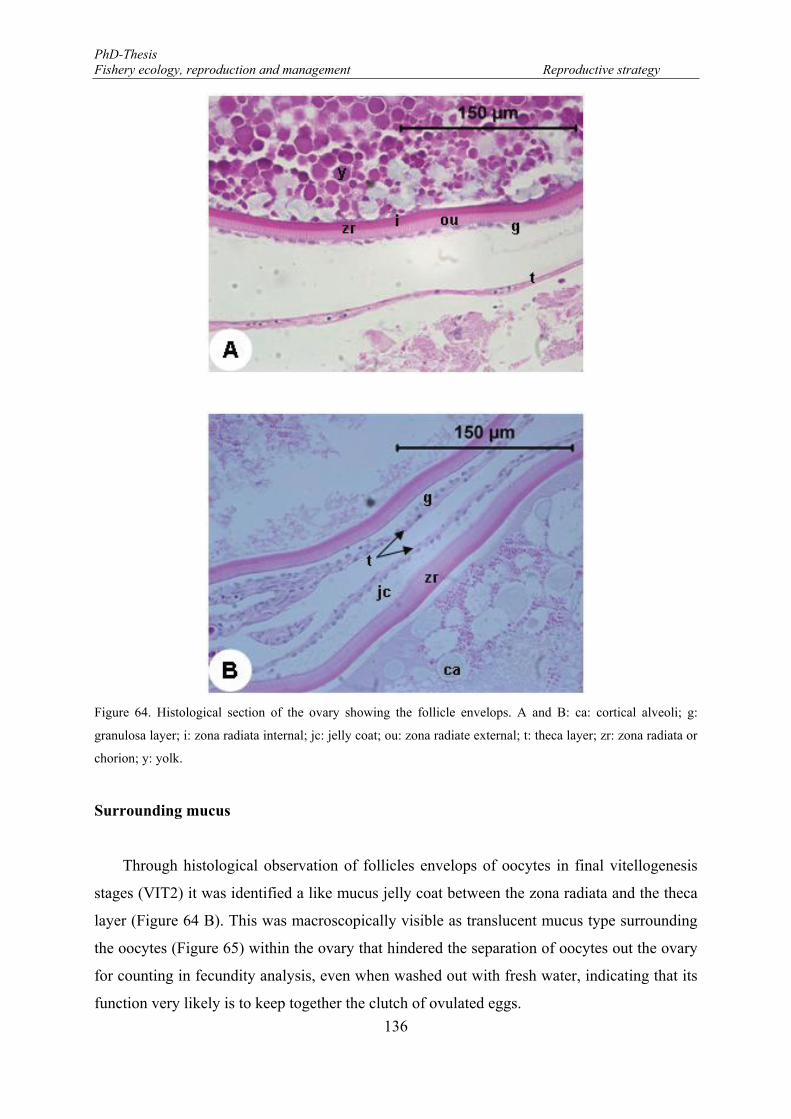
PhD-Thesis Fishery ecology, reproduction and management Reproductive strategy
136
Figure 64. Histological section of the ovary showing the follicle envelops. A and B: ca: cortical alveoli; g:
granulosa layer; i: zona radiata internal; jc: jelly coat; ou: zona radiate external; t: theca layer; zr: zona radiata or
chorion; y: yolk.
Surrounding mucus
Through histological observation of follicles envelops of oocytes in final vitellogenesis
stages (VIT2) it was identified a like mucus jelly coat between the zona radiata and the theca
layer (Figure 64 B). This was macroscopically visible as translucent mucus type surrounding
the oocytes (Figure 65) within the ovary that hindered the separation of oocytes out the ovary
for counting in fecundity analysis, even when washed out with fresh water, indicating that its
function very likely is to keep together the clutch of ovulated eggs.
PhD-Thesis Fishery ecology, reproduction and management Reproductive strategy
137
Postovulatory follicle
The postovulatory follicles (POF), which in short are the follicle remaining tissues after
ovulation, were observed only in ovaries where dominated oocytes in advanced vitellogenic
stages (VIT2). The POF prevalence was very low, observed in three females in August and in
one female in September, October and January respectively. In most of the cases these
structures were observed in latest stages of degeneration which difficult its correct
identification, because can be confused with β-atresia oocytes (Figure 66).
Figure 65. Oocytes surrounded by mucus.
Figure 66. Histological sections of fish ovary tissues showing postovulatory follicle (pof) structures.
PhD-Thesis Fishery ecology, reproduction and management Reproductive strategy
138
Atretic oocytes
Atretic oocytes were found at low prevalence (4.7% of the analysed females) and at
different rate of resorption (Figure 67A and B). But most of the atretic oocytes were observed
in very late alpha (α) stage. Atretic oocytes were observed in ovaries with VIT2 and GVM as
the most advanced stages, but also in one 28 cm female in which the prevailing oocyte stage
was cortical alveoli (pre-vitellogenic). Atretic oocytes were evident during the whole
spawning period (July to February), and generalized atresia was evidenced in ovaries
collected at the end of December and in January, in specimens with advanced yolked oocytes
(VIT2). The main characteristic observed was the chorion fragmentation and the complete
absence of follicular epithelium.
Figure 67. Histological sections showing oocytes in early (A) and late (B) atresia stages. ch: chorion; at: atretic
oocyte; VIT2: final vitellogenic oocyte.
4.2.2. Reproductive cycle
On the base of the most advanced oocytes developmental stages in each ovary as being
oocyte in PG, CA, VIT1, VIT2, GVM, and the presence of postovulatory follicles (POF) and
atretic oocyte identified and described in previous section, females ovaries and consequently
the female reproductive phase were categorized as Immature (I), Developing (D), Spawning
capable (SC), Actively spawning (AS), Regressing (Rgs) and Regenerating (Rgn) (Table 26).
PhD-Thesis Fishery ecology, reproduction and management Reproductive strategy
139
Table 26. Female reproductive phases as used in this study for Brycon guatemalensis.
Reproductive phase Description N
Immature (I): Never spawned The most advanced oocyte stage observed in the ovary is
Perinuclear stage (PG)
51
Developing (D): Females in the onset
of maturity
Oocytes in cortical alveoli (CA) and/or initial vitellogenic
(VIT1) stages are the most advanced stages in the ovaries
209
Spawning Capable (SC): Females are
developmentally and physiologically
able to spawn in the current annual
cycle
The most advanced oocytes stage observed in the ovary is Final
vitellogenesis stage (VIT2)
61
Actively Spawning (AS): Imminent
spawning during the current annual
cycle
The oocyte showing the migratory nucleus or migratory
germinal vesicle (Follicle maturation -GVM-) is the most
advanced stages observed in the ovary: Post-ovulatory follicles
might be present as well
21
Regressing (Rgs): Recent spawning
cessation
Atretic oocytes present in ovaries with VIT2 and GVM oocytes 15
Regenerating (Rgn): Females
sexually mature but reproductively
inactive, reorganizing the ovary for
the next breeding season
Perinucleolar oocytes are present but muscle bundles, enlarged
blood vessels, thick ovarian wall are observed
14
Total 371
Temporal dynamic
The reproductive cycle is described analyzing the reproductive phases along one year,
from February 2005 to January 2006. During this period, females in Developing were the
most observed phase (61.4% of all mature females), and were the most frequent in all
analysed months except April and May (Figure 68). The spawning season, defined by the
presence of spawning capable and actively spawning females, was relatively long, extending
from July (during the rainy season) till February (during the dry period). The highest
proportion of specimens in SC phase were observed in July and August (28.8 and 32.7%,
respectively), decreasing the spawning activity, although still high, in September to December
(14.8 % on average) while the lowest activity was observed in January-February (4.7%). The
proportion of specimens in the AS fluctuated along the spawning season, but major peak was
observed in October (17.6 %) and the lowest in September (2.0 %). While regressing (Rgs)
PhD-Thesis Fishery ecology, reproduction and management Reproductive strategy
140
females were observed all along the spawning season, regenerating (Rgn) coherently observed
from February to August (except March). However, due to low sample size in March-June the
analysis should be interpreted with caution, especially as spawning may initiate earlier.
Postovulatory follicles (POF) were observed in only 6 out (7.3 %) of 82 ovaries in SC
and AS phases, and they were collected in August (n=3), September, October and January
(n=1 in each of them). In most of cases these structures were at very advanced degeneration
stage. Atretic oocytes were observed in 15 (4.7 %) out 320 mature specimens, one in D phase
(in August) corresponding to a specimen of 28 cm length; nine in SC phase (from July to
January) and five in AS phase (in February, August, October and December), all these
specimens ranged from 29 to 44 cm length. Massive atresia was only observed in two
specimens in SC phase of 31.4 and 33.4 cm length collected in December and January,
respectively, most of the atretic oocytes were observed in very late alpha (α) atresia.
Figure 68. Frequency of incidence of reproductive phases for mature females of Brycon guatemalensis (N=320;
Bars). Reproductive phases: Developing-D (yellow); Spawning Capable-SC (red); Actively Spawning-AS (light
orange); Regressing-Rgs (blue sky); Regenerating-Rgn (blue). Mean monthly variation Gonadosomatic index
(GSI: N=240) (solid black line) and standard deviation (whiskers). Upper panel shows annual precipitation in
millimetres (mm).
-4
-2
0
2
4
6
8
10
0%
20%
40%
60%
80%
100%
Feb Mar Apr May Jun Jul Aug Sep Oct Nov Dec Jan
GS
I
Fre
qu
en
cy
15 1 2 2 59 52 50 34 28 41 36 Month
N
0
100
200
300
400
mm
Annual precipitation
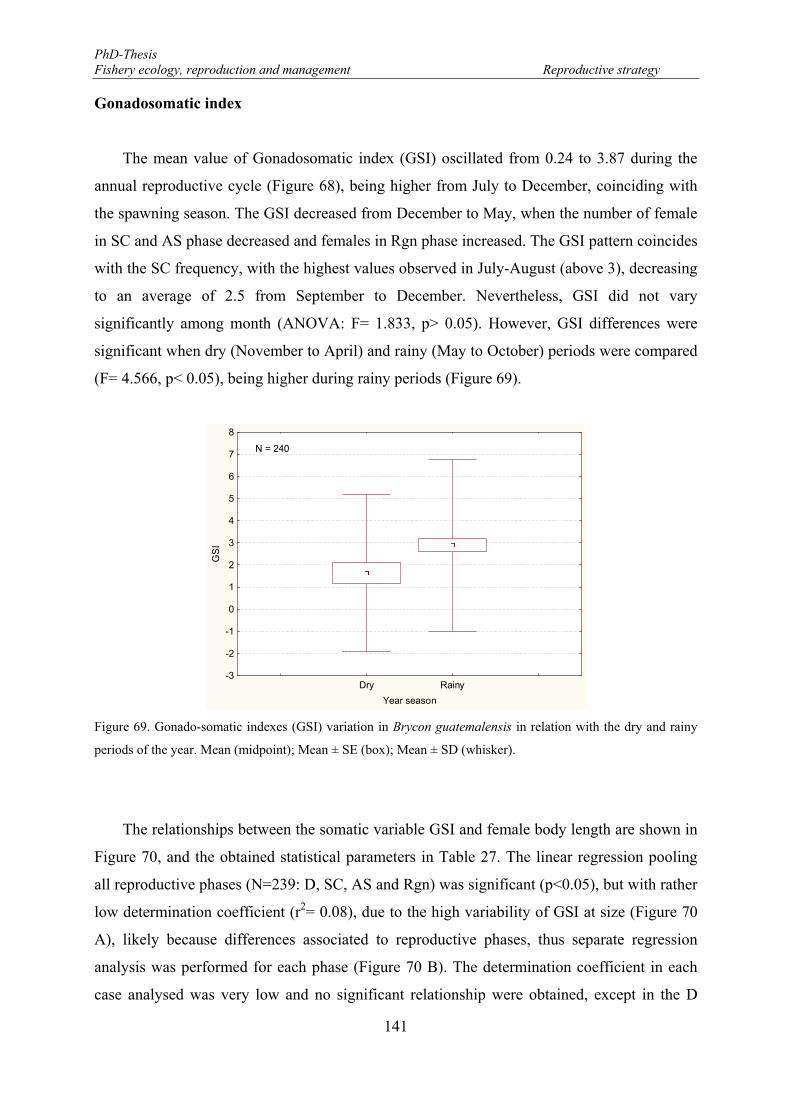
PhD-Thesis Fishery ecology, reproduction and management Reproductive strategy
141
Gonadosomatic index
The mean value of Gonadosomatic index (GSI) oscillated from 0.24 to 3.87 during the
annual reproductive cycle (Figure 68), being higher from July to December, coinciding with
the spawning season. The GSI decreased from December to May, when the number of female
in SC and AS phase decreased and females in Rgn phase increased. The GSI pattern coincides
with the SC frequency, with the highest values observed in July-August (above 3), decreasing
to an average of 2.5 from September to December. Nevertheless, GSI did not vary
significantly among month (ANOVA: F= 1.833, p> 0.05). However, GSI differences were
significant when dry (November to April) and rainy (May to October) periods were compared
(F= 4.566, p< 0.05), being higher during rainy periods (Figure 69).
Figure 69. Gonado-somatic indexes (GSI) variation in Brycon guatemalensis in relation with the dry and rainy
periods of the year. Mean (midpoint); Mean ± SE (box); Mean ± SD (whisker).
The relationships between the somatic variable GSI and female body length are shown in
Figure 70, and the obtained statistical parameters in Table 27. The linear regression pooling
all reproductive phases (N=239: D, SC, AS and Rgn) was significant (p<0.05), but with rather
low determination coefficient (r2= 0.08), due to the high variability of GSI at size (Figure 70
A), likely because differences associated to reproductive phases, thus separate regression
analysis was performed for each phase (Figure 70 B). The determination coefficient in each
case analysed was very low and no significant relationship were obtained, except in the D
Dry Rainy
Year season
-3
-2
-1
0
1
2
3
4
5
6
7
8
GS
I
N = 240
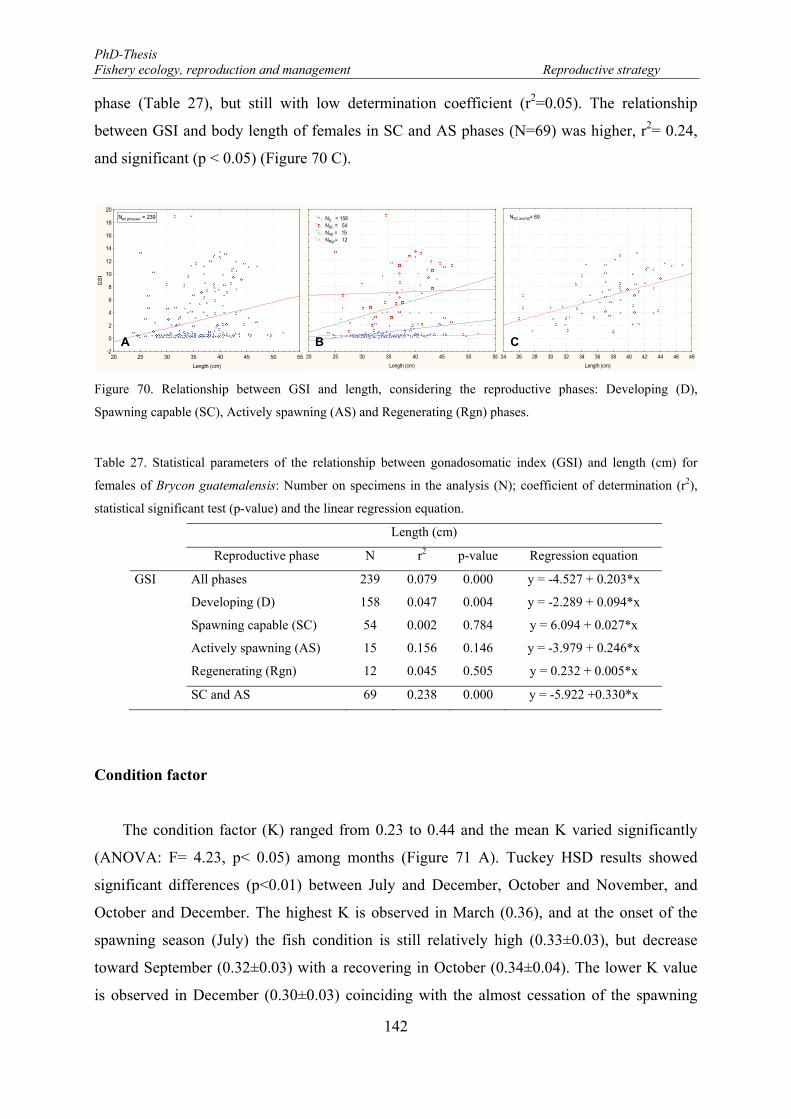
PhD-Thesis Fishery ecology, reproduction and management Reproductive strategy
142
phase (Table 27), but still with low determination coefficient (r2=0.05). The relationship
between GSI and body length of females in SC and AS phases (N=69) was higher, r2= 0.24,
and significant (p < 0.05) (Figure 70 C).
Figure 70. Relationship between GSI and length, considering the reproductive phases: Developing (D),
Spawning capable (SC), Actively spawning (AS) and Regenerating (Rgn) phases.
Table 27. Statistical parameters of the relationship between gonadosomatic index (GSI) and length (cm) for
females of Brycon guatemalensis: Number on specimens in the analysis (N); coefficient of determination (r2),
statistical significant test (p-value) and the linear regression equation.
Length (cm)
Reproductive phase N r2 p-value Regression equation
GSI All phases 239 0.079 0.000 y = -4.527 + 0.203*x
Developing (D) 158 0.047 0.004 y = -2.289 + 0.094*x
Spawning capable (SC) 54 0.002 0.784 y = 6.094 + 0.027*x
Actively spawning (AS) 15 0.156 0.146 y = -3.979 + 0.246*x
Regenerating (Rgn) 12 0.045 0.505 y = 0.232 + 0.005*x
SC and AS 69 0.238 0.000 y = -5.922 +0.330*x
Condition factor
The condition factor (K) ranged from 0.23 to 0.44 and the mean K varied significantly
(ANOVA: F= 4.23, p< 0.05) among months (Figure 71 A). Tuckey HSD results showed
significant differences (p<0.01) between July and December, October and November, and
October and December. The highest K is observed in March (0.36), and at the onset of the
spawning season (July) the fish condition is still relatively high (0.33±0.03), but decrease
toward September (0.32±0.03) with a recovering in October (0.34±0.04). The lower K value
is observed in December (0.30±0.03) coinciding with the almost cessation of the spawning
20 25 30 35 40 45 50 55
Length (cm)
ND = 158 NSC = 54 NAS = 15 NRgn= 12
20 25 30 35 40 45 50 55
Length (cm)
-2
0
2
4
6
8
10
12
14
16
18
20
GS
I
Nall phases = 239
24 26 28 30 32 34 36 38 40 42 44 46 48
Length (cm)
NSC and AS= 69
A B C
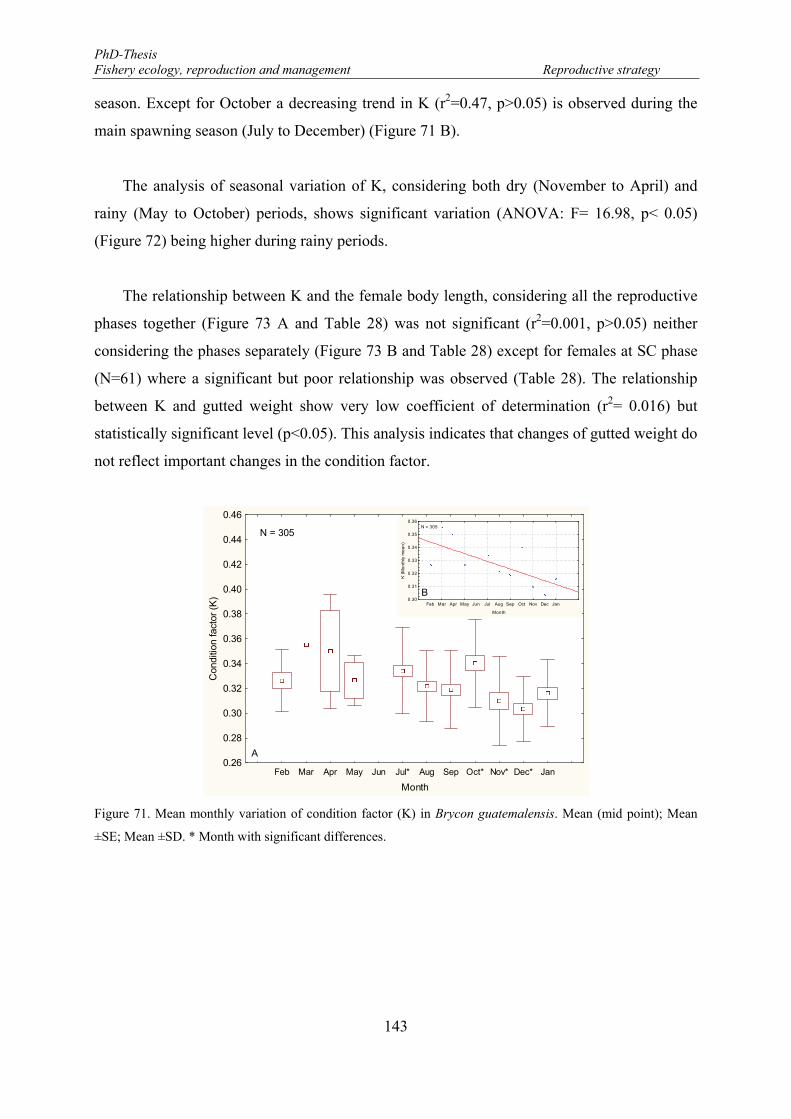
PhD-Thesis Fishery ecology, reproduction and management Reproductive strategy
143
season. Except for October a decreasing trend in K (r2=0.47, p>0.05) is observed during the
main spawning season (July to December) (Figure 71 B).
The analysis of seasonal variation of K, considering both dry (November to April) and
rainy (May to October) periods, shows significant variation (ANOVA: F= 16.98, p< 0.05)
(Figure 72) being higher during rainy periods.
The relationship between K and the female body length, considering all the reproductive
phases together (Figure 73 A and Table 28) was not significant (r2=0.001, p>0.05) neither
considering the phases separately (Figure 73 B and Table 28) except for females at SC phase
(N=61) where a significant but poor relationship was observed (Table 28). The relationship
between K and gutted weight show very low coefficient of determination (r2= 0.016) but
statistically significant level (p<0.05). This analysis indicates that changes of gutted weight do
not reflect important changes in the condition factor.
Figure 71. Mean monthly variation of condition factor (K) in Brycon guatemalensis. Mean (mid point); Mean
±SE; Mean ±SD. * Month with significant differences.
Feb Mar Apr May Jun Jul* Aug Sep Oct* Nov* Dec* Jan
Month
0.26
0.28
0.30
0.32
0.34
0.36
0.38
0.40
0.42
0.44
0.46
Con
ditio
n fa
ctor
(K
)
N = 305
Feb Mar Apr May Jun Jul Aug Sep Oct Nov Dec Jan
Month
0.30
0.31
0.32
0.33
0.34
0.35
0.36
K (
Mo
nth
ly m
ea
n)
N = 305
A
B
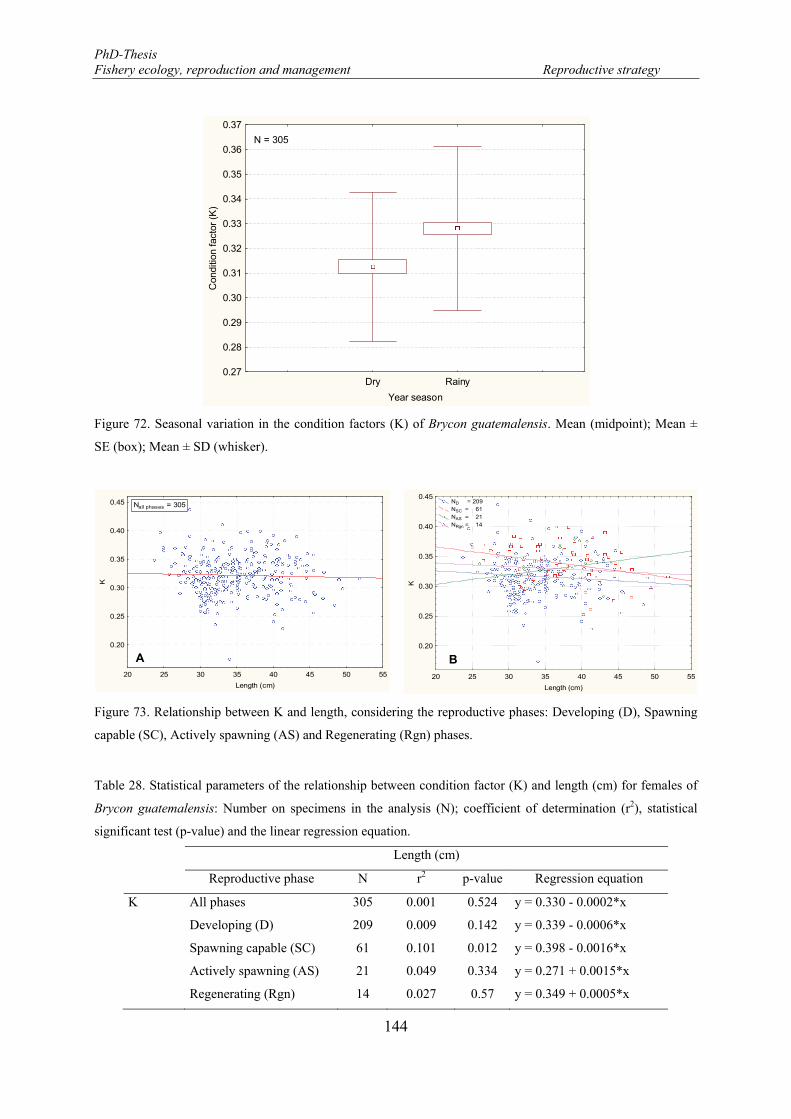
PhD-Thesis Fishery ecology, reproduction and management Reproductive strategy
144
Figure 72. Seasonal variation in the condition factors (K) of Brycon guatemalensis. Mean (midpoint); Mean ±
SE (box); Mean ± SD (whisker).
Figure 73. Relationship between K and length, considering the reproductive phases: Developing (D), Spawning
capable (SC), Actively spawning (AS) and Regenerating (Rgn) phases.
Table 28. Statistical parameters of the relationship between condition factor (K) and length (cm) for females of
Brycon guatemalensis: Number on specimens in the analysis (N); coefficient of determination (r2), statistical
significant test (p-value) and the linear regression equation.
Length (cm)
Reproductive phase N r2 p-value Regression equation
K All phases 305 0.001 0.524 y = 0.330 - 0.0002*x
Developing (D) 209 0.009 0.142 y = 0.339 - 0.0006*x
Spawning capable (SC) 61 0.101 0.012 y = 0.398 - 0.0016*x
Actively spawning (AS) 21 0.049 0.334 y = 0.271 + 0.0015*x
Regenerating (Rgn) 14 0.027 0.57 y = 0.349 + 0.0005*x
Dry Rainy
Year season
0.27
0.28
0.29
0.30
0.31
0.32
0.33
0.34
0.35
0.36
0.37
Con
ditio
n fa
ctor
(K
)
N = 305
20 25 30 35 40 45 50 55
Length (cm)
0.20
0.25
0.30
0.35
0.40
0.45
K
Nall phases = 305
A
20 25 30 35 40 45 50 55
Length (cm)
0.20
0.25
0.30
0.35
0.40
0.45
K
ND = 209 NSC = 61 NAS = 21 NRgn = 14
B
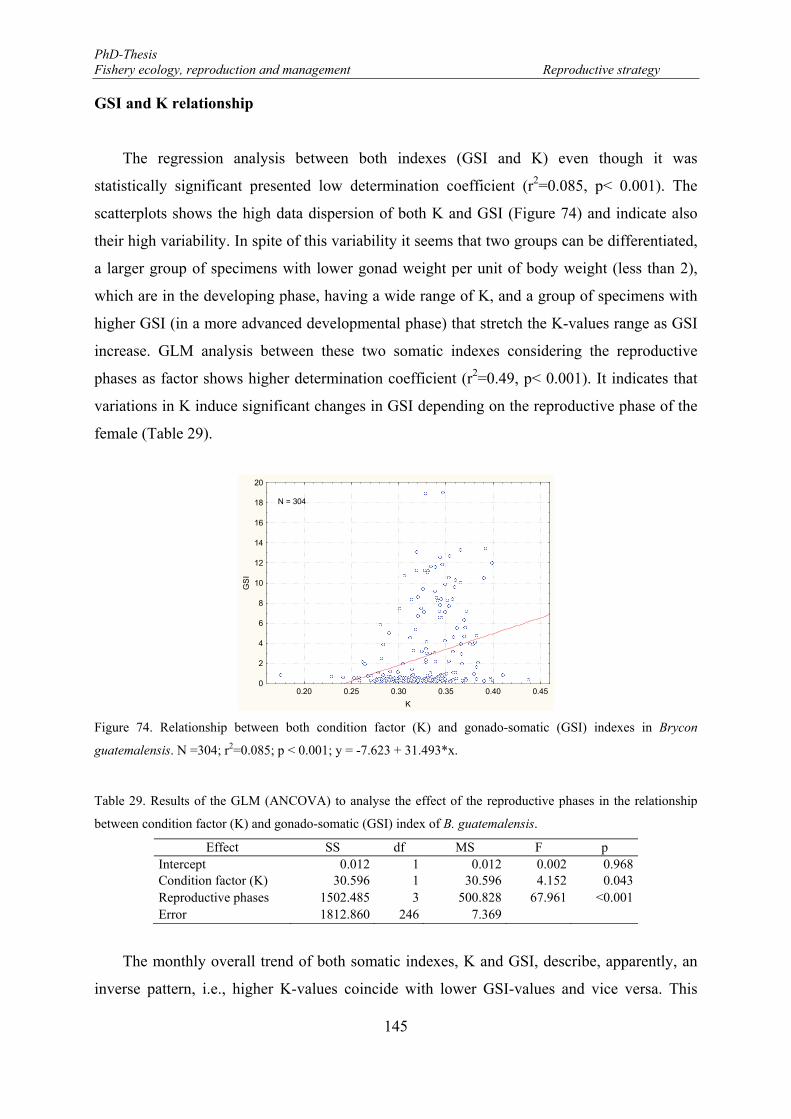
PhD-Thesis Fishery ecology, reproduction and management Reproductive strategy
145
GSI and K relationship
The regression analysis between both indexes (GSI and K) even though it was
statistically significant presented low determination coefficient (r2=0.085, p< 0.001). The
scatterplots shows the high data dispersion of both K and GSI (Figure 74) and indicate also
their high variability. In spite of this variability it seems that two groups can be differentiated,
a larger group of specimens with lower gonad weight per unit of body weight (less than 2),
which are in the developing phase, having a wide range of K, and a group of specimens with
higher GSI (in a more advanced developmental phase) that stretch the K-values range as GSI
increase. GLM analysis between these two somatic indexes considering the reproductive
phases as factor shows higher determination coefficient (r2=0.49, p< 0.001). It indicates that
variations in K induce significant changes in GSI depending on the reproductive phase of the
female (Table 29).
Figure 74. Relationship between both condition factor (K) and gonado-somatic (GSI) indexes in Brycon
guatemalensis. N =304; r2=0.085; p < 0.001; y = -7.623 + 31.493*x.
Table 29. Results of the GLM (ANCOVA) to analyse the effect of the reproductive phases in the relationship
between condition factor (K) and gonado-somatic (GSI) index of B. guatemalensis.
Effect SS df MS F p Intercept 0.012 1 0.012 0.002 0.968 Condition factor (K) 30.596 1 30.596 4.152 0.043 Reproductive phases 1502.485 3 500.828 67.961 <0.001 Error 1812.860 246 7.369
The monthly overall trend of both somatic indexes, K and GSI, describe, apparently, an
inverse pattern, i.e., higher K-values coincide with lower GSI-values and vice versa. This
0.20 0.25 0.30 0.35 0.40 0.45
K
0
2
4
6
8
10
12
14
16
18
20
GS
I
N = 304
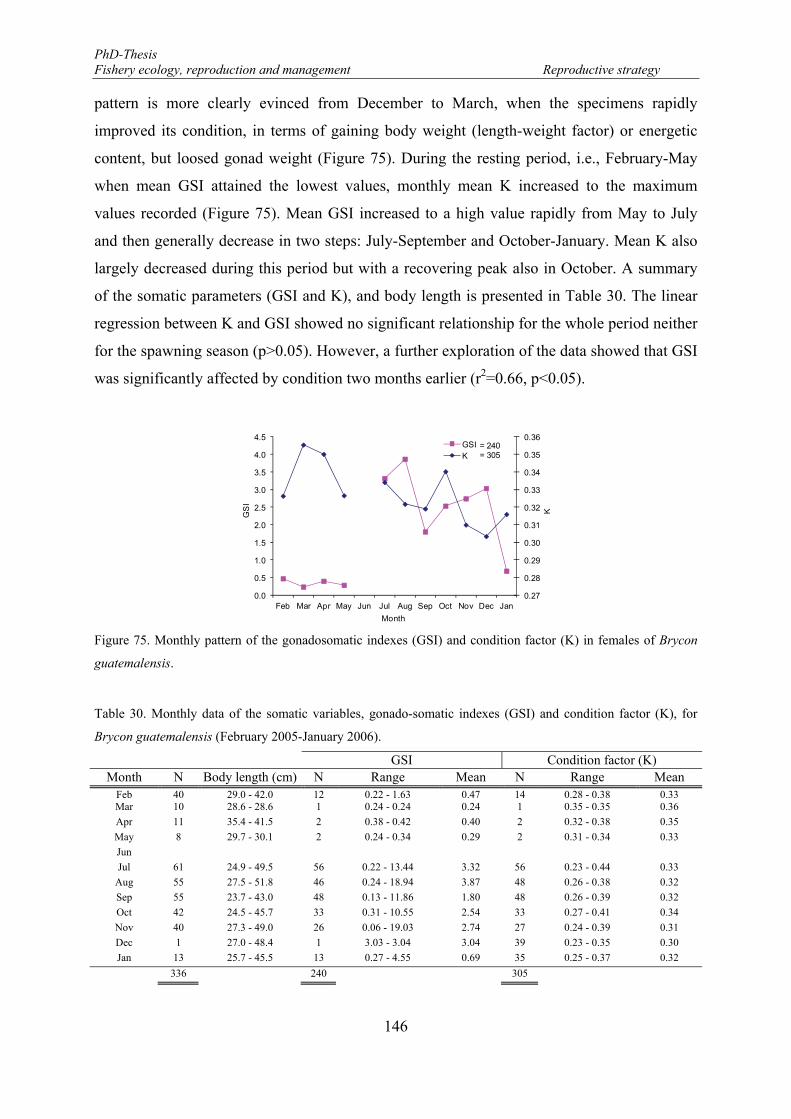
PhD-Thesis Fishery ecology, reproduction and management Reproductive strategy
146
pattern is more clearly evinced from December to March, when the specimens rapidly
improved its condition, in terms of gaining body weight (length-weight factor) or energetic
content, but loosed gonad weight (Figure 75). During the resting period, i.e., February-May
when mean GSI attained the lowest values, monthly mean K increased to the maximum
values recorded (Figure 75). Mean GSI increased to a high value rapidly from May to July
and then generally decrease in two steps: July-September and October-January. Mean K also
largely decreased during this period but with a recovering peak also in October. A summary
of the somatic parameters (GSI and K), and body length is presented in Table 30. The linear
regression between K and GSI showed no significant relationship for the whole period neither
for the spawning season (p>0.05). However, a further exploration of the data showed that GSI
was significantly affected by condition two months earlier (r2=0.66, p<0.05).
Figure 75. Monthly pattern of the gonadosomatic indexes (GSI) and condition factor (K) in females of Brycon
guatemalensis.
Table 30. Monthly data of the somatic variables, gonado-somatic indexes (GSI) and condition factor (K), for
Brycon guatemalensis (February 2005-January 2006).
GSI Condition factor (K) Month N Body length (cm) N Range Mean N Range Mean
Feb 40 29.0 - 42.0 12 0.22 - 1.63 0.47 14 0.28 - 0.38 0.33Mar 10 28.6 - 28.6 1 0.24 - 0.24 0.24 1 0.35 - 0.35 0.36
Apr 11 35.4 - 41.5 2 0.38 - 0.42 0.40 2 0.32 - 0.38 0.35
May 8 29.7 - 30.1 2 0.24 - 0.34 0.29 2 0.31 - 0.34 0.33
Jun
Jul 61 24.9 - 49.5 56 0.22 - 13.44 3.32 56 0.23 - 0.44 0.33
Aug 55 27.5 - 51.8 46 0.24 - 18.94 3.87 48 0.26 - 0.38 0.32
Sep 55 23.7 - 43.0 48 0.13 - 11.86 1.80 48 0.26 - 0.39 0.32
Oct 42 24.5 - 45.7 33 0.31 - 10.55 2.54 33 0.27 - 0.41 0.34
Nov 40 27.3 - 49.0 26 0.06 - 19.03 2.74 27 0.24 - 0.39 0.31
Dec 1 27.0 - 48.4 1 3.03 - 3.04 3.04 39 0.23 - 0.35 0.30
Jan 13 25.7 - 45.5 13 0.27 - 4.55 0.69 35 0.25 - 0.37 0.32
336 240 305
0.27
0.28
0.29
0.30
0.31
0.32
0.33
0.34
0.35
0.36
0.0
0.5
1.0
1.5
2.0
2.5
3.0
3.5
4.0
4.5
Feb Mar Apr May Jun Jul Aug Sep Oct Nov Dec Jan
KGS
I
Month
GSIK
= 240= 305
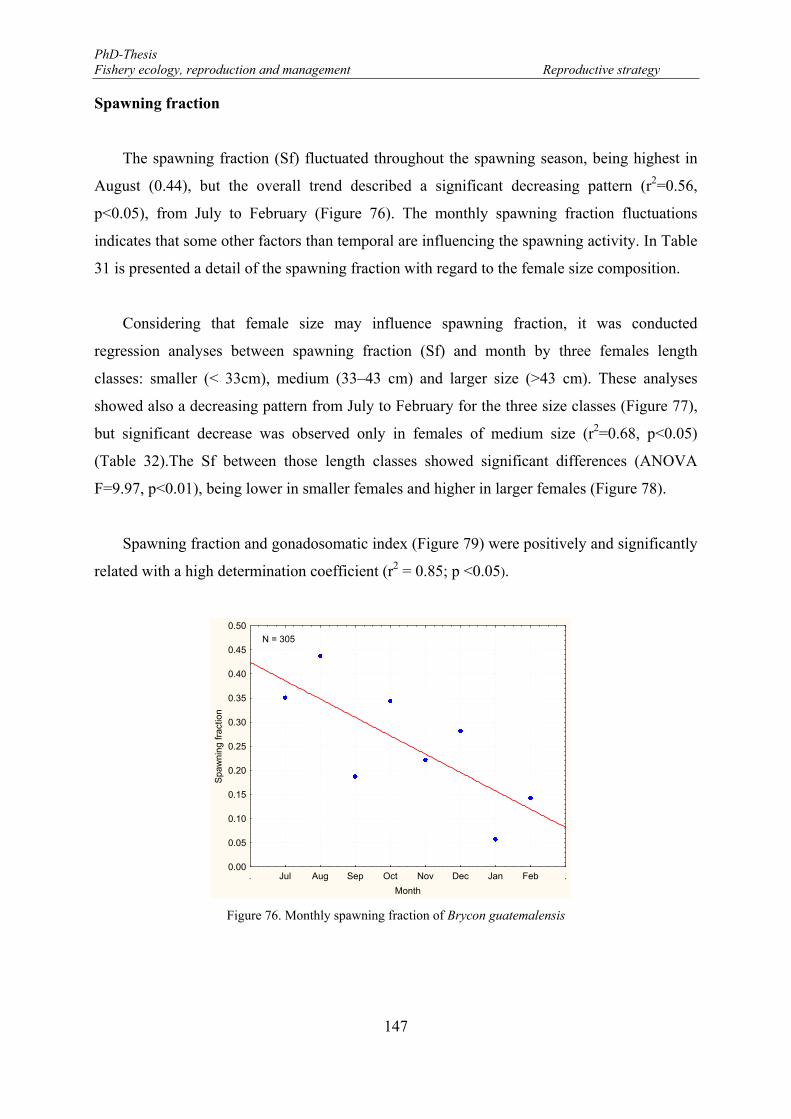
PhD-Thesis Fishery ecology, reproduction and management Reproductive strategy
147
Spawning fraction
The spawning fraction (Sf) fluctuated throughout the spawning season, being highest in
August (0.44), but the overall trend described a significant decreasing pattern (r2=0.56,
p<0.05), from July to February (Figure 76). The monthly spawning fraction fluctuations
indicates that some other factors than temporal are influencing the spawning activity. In Table
31 is presented a detail of the spawning fraction with regard to the female size composition.
Considering that female size may influence spawning fraction, it was conducted
regression analyses between spawning fraction (Sf) and month by three females length
classes: smaller (< 33cm), medium (33–43 cm) and larger size (>43 cm). These analyses
showed also a decreasing pattern from July to February for the three size classes (Figure 77),
but significant decrease was observed only in females of medium size (r2=0.68, p<0.05)
(Table 32).The Sf between those length classes showed significant differences (ANOVA
F=9.97, p<0.01), being lower in smaller females and higher in larger females (Figure 78).
Spawning fraction and gonadosomatic index (Figure 79) were positively and significantly
related with a high determination coefficient (r2 = 0.85; p <0.05).
Figure 76. Monthly spawning fraction of Brycon guatemalensis
. Jul Aug Sep Oct Nov Dec Jan Feb .Month
0.00
0.05
0.10
0.15
0.20
0.25
0.30
0.35
0.40
0.45
0.50
Spa
wni
ng fr
actio
n
N = 305
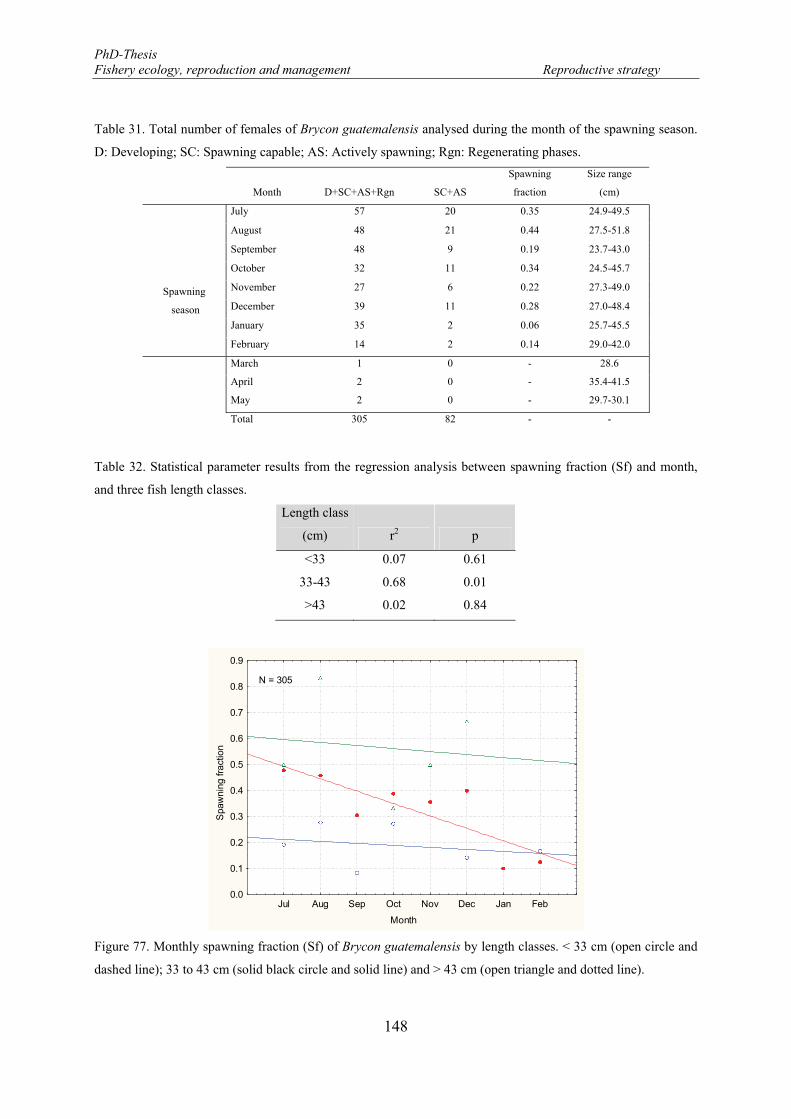
PhD-Thesis Fishery ecology, reproduction and management Reproductive strategy
148
Table 31. Total number of females of Brycon guatemalensis analysed during the month of the spawning season.
D: Developing; SC: Spawning capable; AS: Actively spawning; Rgn: Regenerating phases.
Month
D+SC+AS+Rgn
SC+AS
Spawning
fraction
Size range
(cm)
Spawning
season
July 57 20 0.35 24.9-49.5
August 48 21 0.44 27.5-51.8
September 48 9 0.19 23.7-43.0
October 32 11 0.34 24.5-45.7
November 27 6 0.22 27.3-49.0
December 39 11 0.28 27.0-48.4
January 35 2 0.06 25.7-45.5
February 14 2 0.14 29.0-42.0
March 1 0 - 28.6
April 2 0 - 35.4-41.5
May 2 0 - 29.7-30.1
Total 305 82 - -
Table 32. Statistical parameter results from the regression analysis between spawning fraction (Sf) and month,
and three fish length classes.
Length class
(cm) r2 p
<33 0.07 0.61
33-43 0.68 0.01
>43 0.02 0.84
Figure 77. Monthly spawning fraction (Sf) of Brycon guatemalensis by length classes. < 33 cm (open circle and
dashed line); 33 to 43 cm (solid black circle and solid line) and > 43 cm (open triangle and dotted line).
Month
Spa
wni
ng fr
actio
n
Jul Aug Sep Oct Nov Dec Jan Feb0.0
0.1
0.2
0.3
0.4
0.5
0.6
0.7
0.8
0.9
N = 305
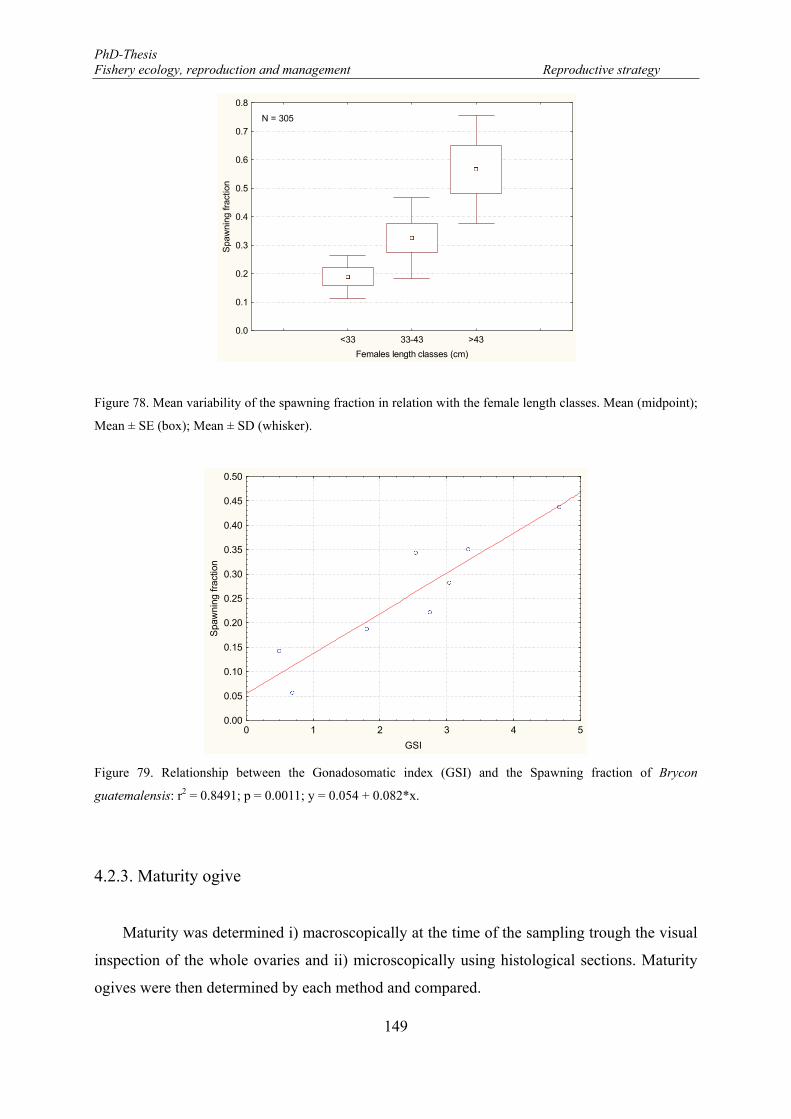
PhD-Thesis Fishery ecology, reproduction and management Reproductive strategy
149
Figure 78. Mean variability of the spawning fraction in relation with the female length classes. Mean (midpoint);
Mean ± SE (box); Mean ± SD (whisker).
Figure 79. Relationship between the Gonadosomatic index (GSI) and the Spawning fraction of Brycon
guatemalensis: r2 = 0.8491; p = 0.0011; y = 0.054 + 0.082*x.
4.2.3. Maturity ogive
Maturity was determined i) macroscopically at the time of the sampling trough the visual
inspection of the whole ovaries and ii) microscopically using histological sections. Maturity
ogives were then determined by each method and compared.
<33 33-43 >43
Females length classes (cm)
0.0
0.1
0.2
0.3
0.4
0.5
0.6
0.7
0.8
Spa
wni
ng fr
actio
n
N = 305
0 1 2 3 4 5
GSI
0.00
0.05
0.10
0.15
0.20
0.25
0.30
0.35
0.40
0.45
0.50
Spa
wni
ng fr
actio
n
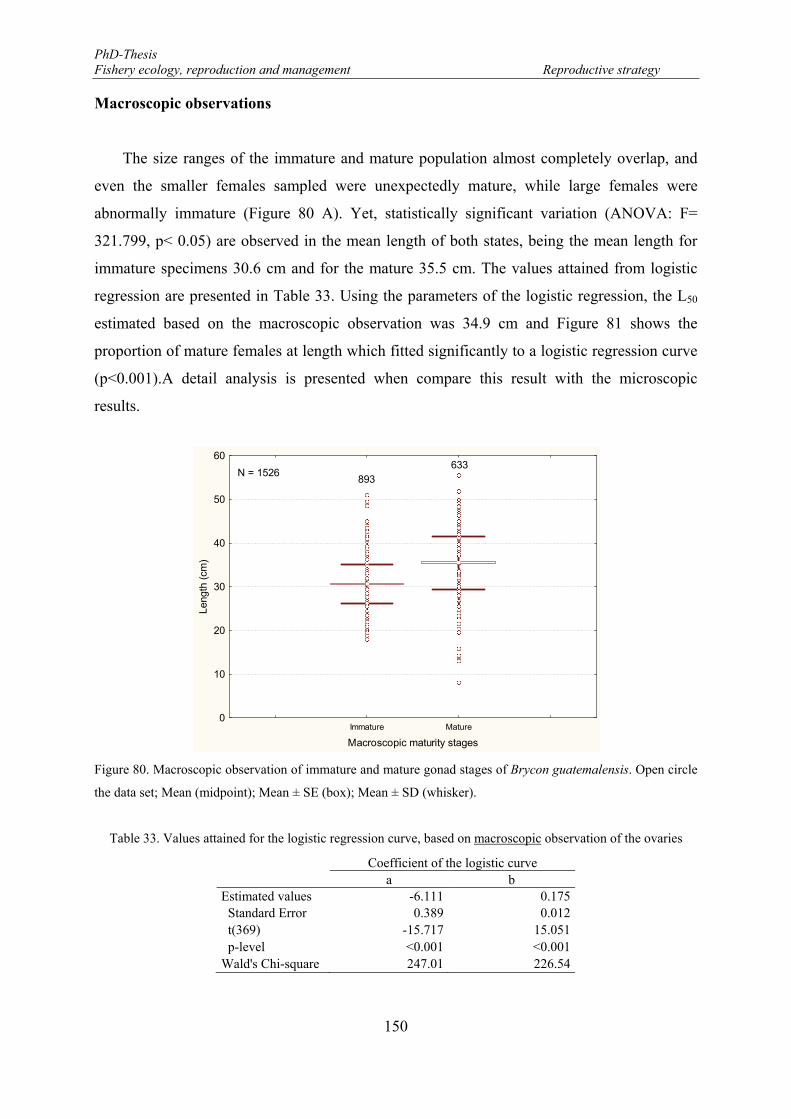
PhD-Thesis Fishery ecology, reproduction and management Reproductive strategy
150
Macroscopic observations
The size ranges of the immature and mature population almost completely overlap, and
even the smaller females sampled were unexpectedly mature, while large females were
abnormally immature (Figure 80 A). Yet, statistically significant variation (ANOVA: F=
321.799, p< 0.05) are observed in the mean length of both states, being the mean length for
immature specimens 30.6 cm and for the mature 35.5 cm. The values attained from logistic
regression are presented in Table 33. Using the parameters of the logistic regression, the L50
estimated based on the macroscopic observation was 34.9 cm and Figure 81 shows the
proportion of mature females at length which fitted significantly to a logistic regression curve
(p<0.001).A detail analysis is presented when compare this result with the microscopic
results.
Figure 80. Macroscopic observation of immature and mature gonad stages of Brycon guatemalensis. Open circle
the data set; Mean (midpoint); Mean ± SE (box); Mean ± SD (whisker).
Table 33. Values attained for the logistic regression curve, based on macroscopic observation of the ovaries
Coefficient of the logistic curve a b Estimated values -6.111 0.175 Standard Error 0.389 0.012 t(369) -15.717 15.051 p-level <0.001 <0.001 Wald's Chi-square 247.01 226.54
Immature Mature
Macroscopic maturity stages
0
10
20
30
40
50
60
Leng
th (
cm)
N = 1526893
633

PhD-Thesis Fishery ecology, reproduction and management Reproductive strategy
151
Figure 81. Macroscopic maturity ogives estimated for Brycon guatemalensis. Arrows indicate L50 = 34.9 cm; red
circle represent the females proportion.
Microscopic observations
Based on the whole set of data from the histological analysis (371 ovaries) the proportion
of mature females at size was estimated. The size range for immature and mature individuals
overlapped between 22 and 35 cm, and consistently smaller and larger females were immature
and mature respectively and the mean length for immature specimen was 26.6 cm and for
mature 34.8 cm (Figure 82). The statistical analysis evinced significant differences (ANOVA:
F= 146.593, p< 0.05) in the mean length between immature and mature specimen. The values
attained from logistic regression are presented in Table 34. and the portion of mature females
fitted significantly (p< 0.001) to a logistic regression curve (Figure 83) The estimated length
at 50% maturity of female B. guatemalensis was 27.3 cm.
0%
10%
20%
30%
40%
50%
60%
70%
80%
90%
100%
5 10 15 20 25 30 35 40 45 50 55 60 65
Fra
ctio
n o
f fe
ma
le m
atu
re
Length (cm)
N = 1526
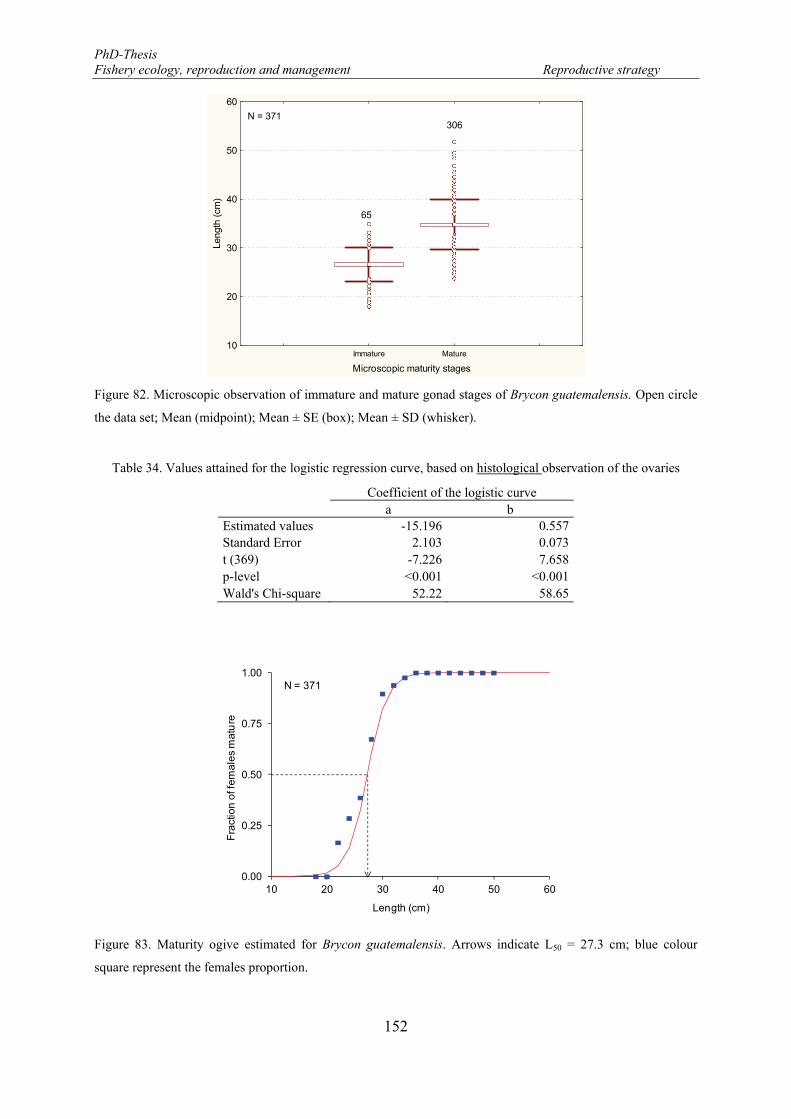
PhD-Thesis Fishery ecology, reproduction and management Reproductive strategy
152
Figure 82. Microscopic observation of immature and mature gonad stages of Brycon guatemalensis. Open circle
the data set; Mean (midpoint); Mean ± SE (box); Mean ± SD (whisker).
Table 34. Values attained for the logistic regression curve, based on histological observation of the ovaries
Coefficient of the logistic curve a b Estimated values -15.196 0.557 Standard Error 2.103 0.073 t (369) -7.226 7.658 p-level <0.001 <0.001 Wald's Chi-square 52.22 58.65
Figure 83. Maturity ogive estimated for Brycon guatemalensis. Arrows indicate L50 = 27.3 cm; blue colour
square represent the females proportion.
Immature Mature
Microscopic maturity stages
10
20
30
40
50
60
Leng
th (
cm)
N = 371
65
306
0.00
0.25
0.50
0.75
1.00
10 20 30 40 50 60
Fra
ctio
n o
f fe
ma
les
ma
ture
Length (cm)
N = 371
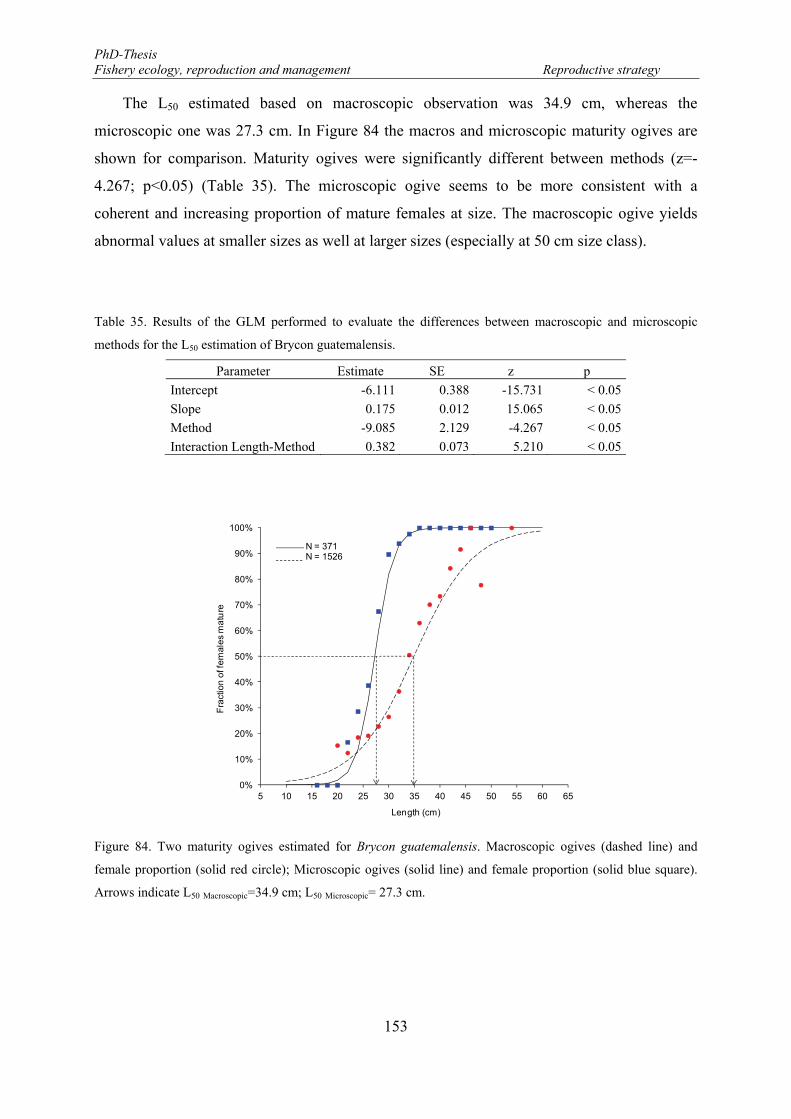
PhD-Thesis Fishery ecology, reproduction and management Reproductive strategy
153
The L50 estimated based on macroscopic observation was 34.9 cm, whereas the
microscopic one was 27.3 cm. In Figure 84 the macros and microscopic maturity ogives are
shown for comparison. Maturity ogives were significantly different between methods (z=-
4.267; p<0.05) (Table 35). The microscopic ogive seems to be more consistent with a
coherent and increasing proportion of mature females at size. The macroscopic ogive yields
abnormal values at smaller sizes as well at larger sizes (especially at 50 cm size class).
Table 35. Results of the GLM performed to evaluate the differences between macroscopic and microscopic
methods for the L50 estimation of Brycon guatemalensis.
Parameter Estimate SE z p
Intercept -6.111 0.388 -15.731 < 0.05
Slope 0.175 0.012 15.065 < 0.05
Method -9.085 2.129 -4.267 < 0.05
Interaction Length-Method 0.382 0.073 5.210 < 0.05
Figure 84. Two maturity ogives estimated for Brycon guatemalensis. Macroscopic ogives (dashed line) and
female proportion (solid red circle); Microscopic ogives (solid line) and female proportion (solid blue square).
Arrows indicate L50 Macroscopic=34.9 cm; L50 Microscopic= 27.3 cm.
0%
10%
20%
30%
40%
50%
60%
70%
80%
90%
100%
5 10 15 20 25 30 35 40 45 50 55 60 65
Fra
ctio
n o
f fe
ma
les
ma
ture
Length (cm)
N = 371N = 1526
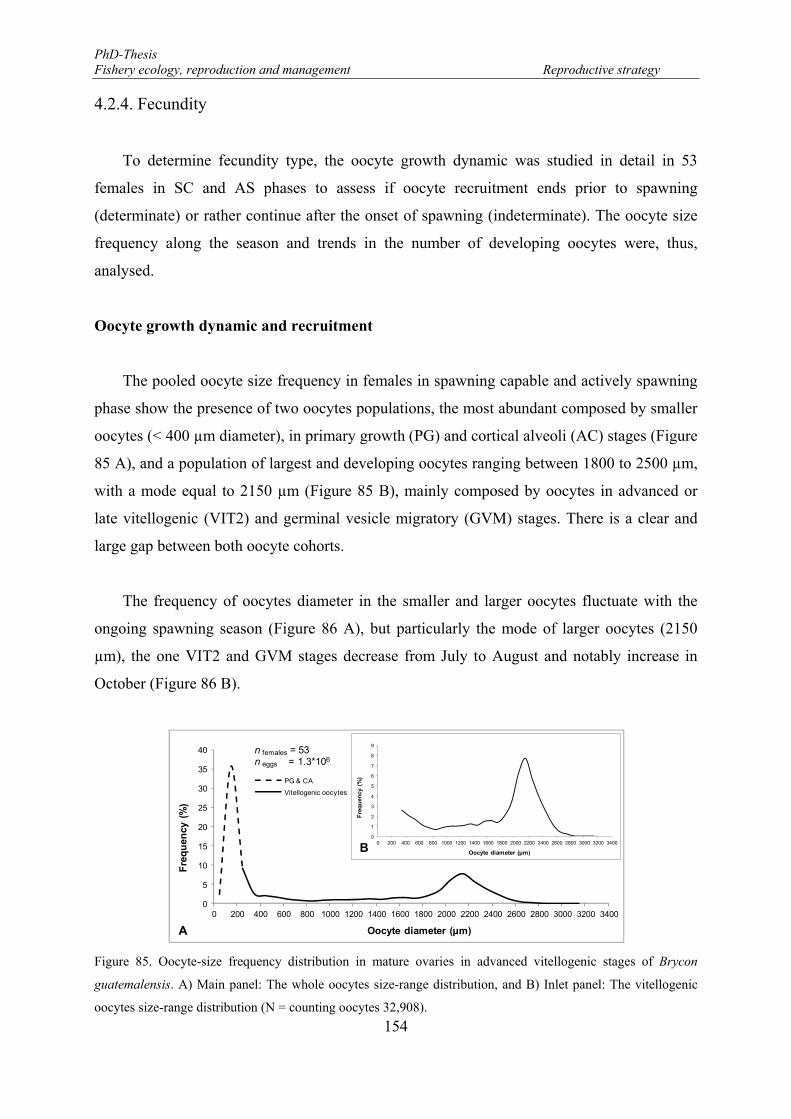
PhD-Thesis Fishery ecology, reproduction and management Reproductive strategy
154
4.2.4. Fecundity
To determine fecundity type, the oocyte growth dynamic was studied in detail in 53
females in SC and AS phases to assess if oocyte recruitment ends prior to spawning
(determinate) or rather continue after the onset of spawning (indeterminate). The oocyte size
frequency along the season and trends in the number of developing oocytes were, thus,
analysed.
Oocyte growth dynamic and recruitment
The pooled oocyte size frequency in females in spawning capable and actively spawning
phase show the presence of two oocytes populations, the most abundant composed by smaller
oocytes (< 400 µm diameter), in primary growth (PG) and cortical alveoli (AC) stages (Figure
85 A), and a population of largest and developing oocytes ranging between 1800 to 2500 µm,
with a mode equal to 2150 µm (Figure 85 B), mainly composed by oocytes in advanced or
late vitellogenic (VIT2) and germinal vesicle migratory (GVM) stages. There is a clear and
large gap between both oocyte cohorts.
The frequency of oocytes diameter in the smaller and larger oocytes fluctuate with the
ongoing spawning season (Figure 86 A), but particularly the mode of larger oocytes (2150
µm), the one VIT2 and GVM stages decrease from July to August and notably increase in
October (Figure 86 B).
Figure 85. Oocyte-size frequency distribution in mature ovaries in advanced vitellogenic stages of Brycon
guatemalensis. A) Main panel: The whole oocytes size-range distribution, and B) Inlet panel: The vitellogenic
oocytes size-range distribution (N = counting oocytes 32,908).
0
5
10
15
20
25
30
35
40
0 200 400 600 800 1000 1200 1400 1600 1800 2000 2200 2400 2600 2800 3000 3200 3400
Fre
qu
ency
(%
)
Oocyte diameter (µm)
PG & CA
Vitellogenic oocytes
n females = 53n eggs = 1.3*106
0
1
2
3
4
5
6
7
8
9
0 200 400 600 800 1000 1200 1400 1600 1800 2000 2200 2400 2600 2800 3000 3200 3400
Fre
qu
ency
(%
)
Oocyte diameter (µm)
A
B
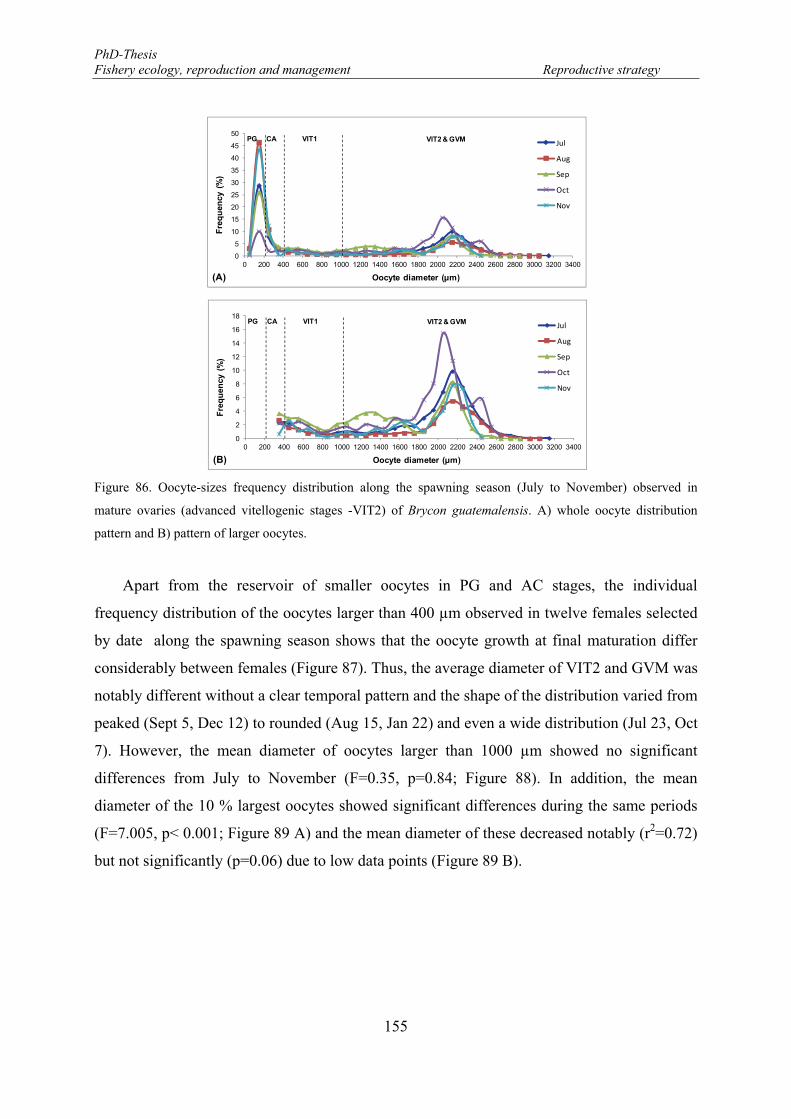
PhD-Thesis Fishery ecology, reproduction and management Reproductive strategy
155
Figure 86. Oocyte-sizes frequency distribution along the spawning season (July to November) observed in
mature ovaries (advanced vitellogenic stages -VIT2) of Brycon guatemalensis. A) whole oocyte distribution
pattern and B) pattern of larger oocytes.
Apart from the reservoir of smaller oocytes in PG and AC stages, the individual
frequency distribution of the oocytes larger than 400 µm observed in twelve females selected
by date along the spawning season shows that the oocyte growth at final maturation differ
considerably between females (Figure 87). Thus, the average diameter of VIT2 and GVM was
notably different without a clear temporal pattern and the shape of the distribution varied from
peaked (Sept 5, Dec 12) to rounded (Aug 15, Jan 22) and even a wide distribution (Jul 23, Oct
7). However, the mean diameter of oocytes larger than 1000 µm showed no significant
differences from July to November (F=0.35, p=0.84; Figure 88). In addition, the mean
diameter of the 10 % largest oocytes showed significant differences during the same periods
(F=7.005, p< 0.001; Figure 89 A) and the mean diameter of these decreased notably (r2=0.72)
but not significantly (p=0.06) due to low data points (Figure 89 B).
0
5
10
15
20
25
30
35
40
45
50
0 200 400 600 800 1000 1200 1400 1600 1800 2000 2200 2400 2600 2800 3000 3200 3400
Fre
qu
ency
(%
)
Oocyte diameter (µm)
Jul
Aug
Sep
Oct
Nov
(A)
PG CA VIT1 VIT2 & GVM
0
2
4
6
8
10
12
14
16
18
0 200 400 600 800 1000 1200 1400 1600 1800 2000 2200 2400 2600 2800 3000 3200 3400
Fre
qu
ency
(%
)
Oocyte diameter (µm)
Jul
Aug
Sep
Oct
Nov
(B)
PG CA VIT1 VIT2 & GVM
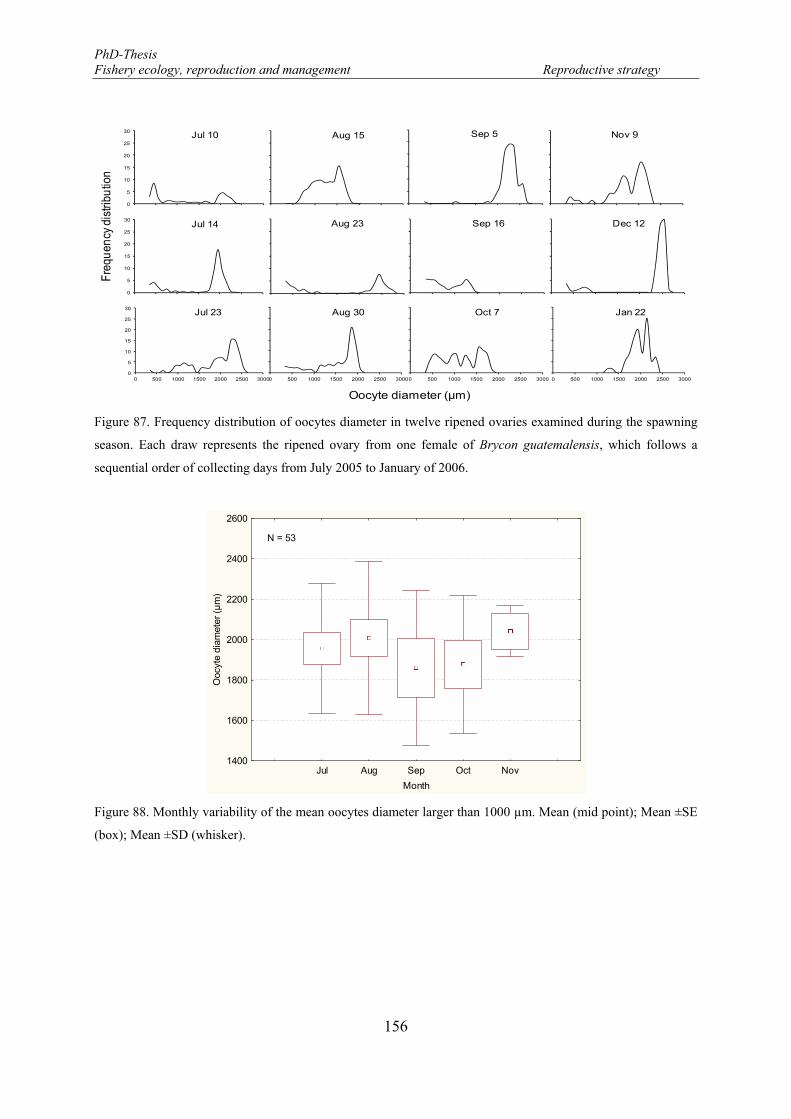
PhD-Thesis Fishery ecology, reproduction and management Reproductive strategy
156
Figure 87. Frequency distribution of oocytes diameter in twelve ripened ovaries examined during the spawning
season. Each draw represents the ripened ovary from one female of Brycon guatemalensis, which follows a
sequential order of collecting days from July 2005 to January of 2006.
Figure 88. Monthly variability of the mean oocytes diameter larger than 1000 µm. Mean (mid point); Mean ±SE
(box); Mean ±SD (whisker).
0
5
10
15
20
25
30Jul 10
0
5
10
15
20
25
30Jul 14
0
5
10
15
20
25
30
0 500 1000 1500 2000 2500 3000
Jul 23
Aug 15
0 500 1000 1500 2000 2500 3000
Aug 30
Sep 5
Sep 16
0 500 1000 1500 2000 2500 3000
Oct 7
Nov 9
Dec 12
0 500 1000 1500 2000 2500 3000
Jan 22
Aug 23
Freq
uenc
y di
strib
utio
n
Oocyte diameter (µm)
Jul Aug Sep Oct Nov
Month
1400
1600
1800
2000
2200
2400
2600
Ooc
yte
diam
eter
(µ
m)
N = 53
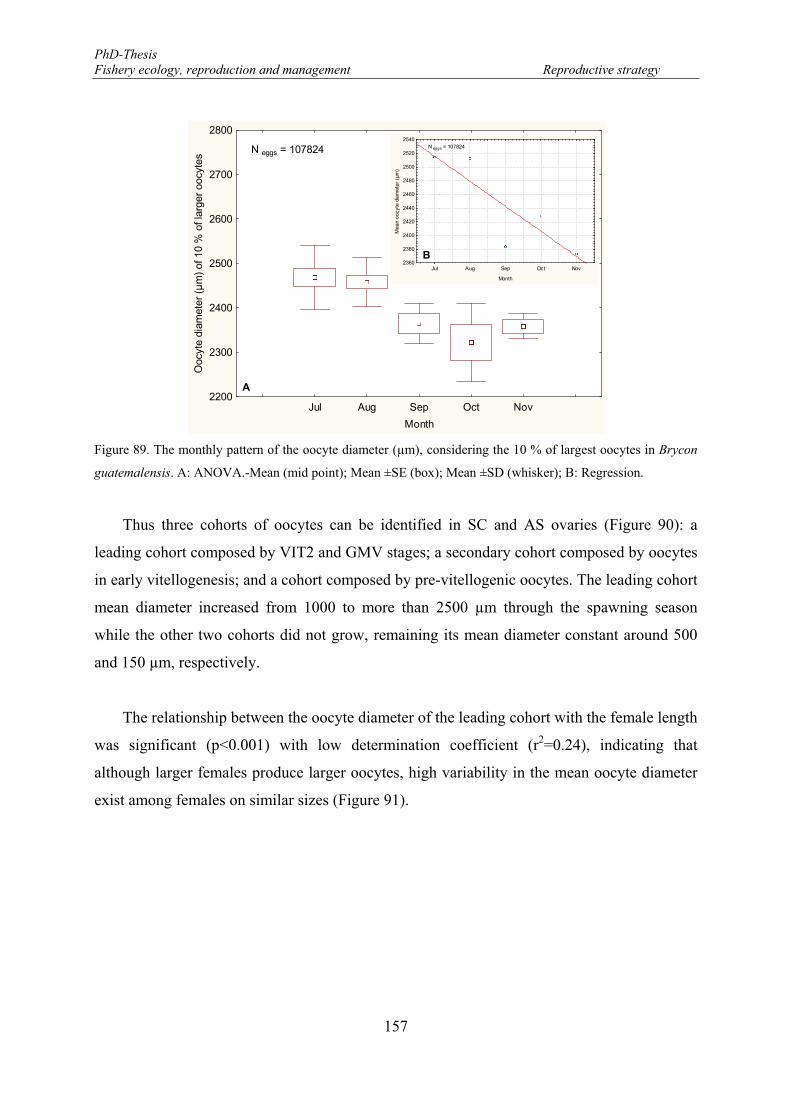
PhD-Thesis Fishery ecology, reproduction and management Reproductive strategy
157
Figure 89. The monthly pattern of the oocyte diameter (µm), considering the 10 % of largest oocytes in Brycon
guatemalensis. A: ANOVA.-Mean (mid point); Mean ±SE (box); Mean ±SD (whisker); B: Regression.
Thus three cohorts of oocytes can be identified in SC and AS ovaries (Figure 90): a
leading cohort composed by VIT2 and GMV stages; a secondary cohort composed by oocytes
in early vitellogenesis; and a cohort composed by pre-vitellogenic oocytes. The leading cohort
mean diameter increased from 1000 to more than 2500 µm through the spawning season
while the other two cohorts did not grow, remaining its mean diameter constant around 500
and 150 µm, respectively.
The relationship between the oocyte diameter of the leading cohort with the female length
was significant (p<0.001) with low determination coefficient (r2=0.24), indicating that
although larger females produce larger oocytes, high variability in the mean oocyte diameter
exist among females on similar sizes (Figure 91).
Jul Aug Sep Oct Nov
Month
2200
2300
2400
2500
2600
2700
2800
Ooc
yte
diam
eter
(µ
m)
of 1
0 %
of l
arge
r oo
cyte
s
N eggs = 107824
Jul Aug Sep Oct Nov
Month
2360
2380
2400
2420
2440
2460
2480
2500
2520
2540
Mea
n oo
cyte
dia
met
er (
µm)
N eggs = 107824
A
B
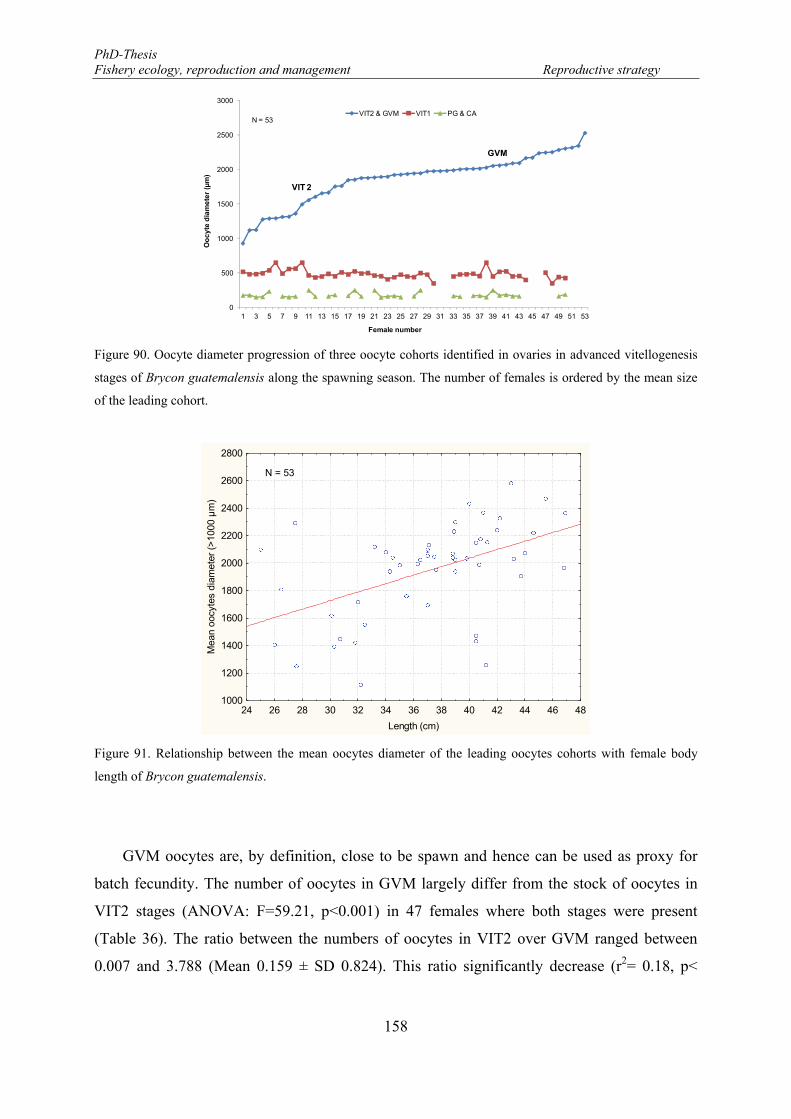
PhD-Thesis Fishery ecology, reproduction and management Reproductive strategy
158
Figure 90. Oocyte diameter progression of three oocyte cohorts identified in ovaries in advanced vitellogenesis
stages of Brycon guatemalensis along the spawning season. The number of females is ordered by the mean size
of the leading cohort.
Figure 91. Relationship between the mean oocytes diameter of the leading oocytes cohorts with female body
length of Brycon guatemalensis.
GVM oocytes are, by definition, close to be spawn and hence can be used as proxy for
batch fecundity. The number of oocytes in GVM largely differ from the stock of oocytes in
VIT2 stages (ANOVA: F=59.21, p<0.001) in 47 females where both stages were present
(Table 36). The ratio between the numbers of oocytes in VIT2 over GVM ranged between
0.007 and 3.788 (Mean 0.159 ± SD 0.824). This ratio significantly decrease (r2= 0.18, p<
0
500
1000
1500
2000
2500
3000
1 3 5 7 9 11 13 15 17 19 21 23 25 27 29 31 33 35 37 39 41 43 45 47 49 51 53
Oo
cy
te d
iam
ete
r (µ
m)
Female number
VIT2 & GVM VIT1 PG & CA
VIT 2
GVM
N = 53
24 26 28 30 32 34 36 38 40 42 44 46 48
Length (cm)
1000
1200
1400
1600
1800
2000
2200
2400
2600
2800
Mea
n oo
cyte
s di
amet
er (
>10
00 µ
m)
N = 53
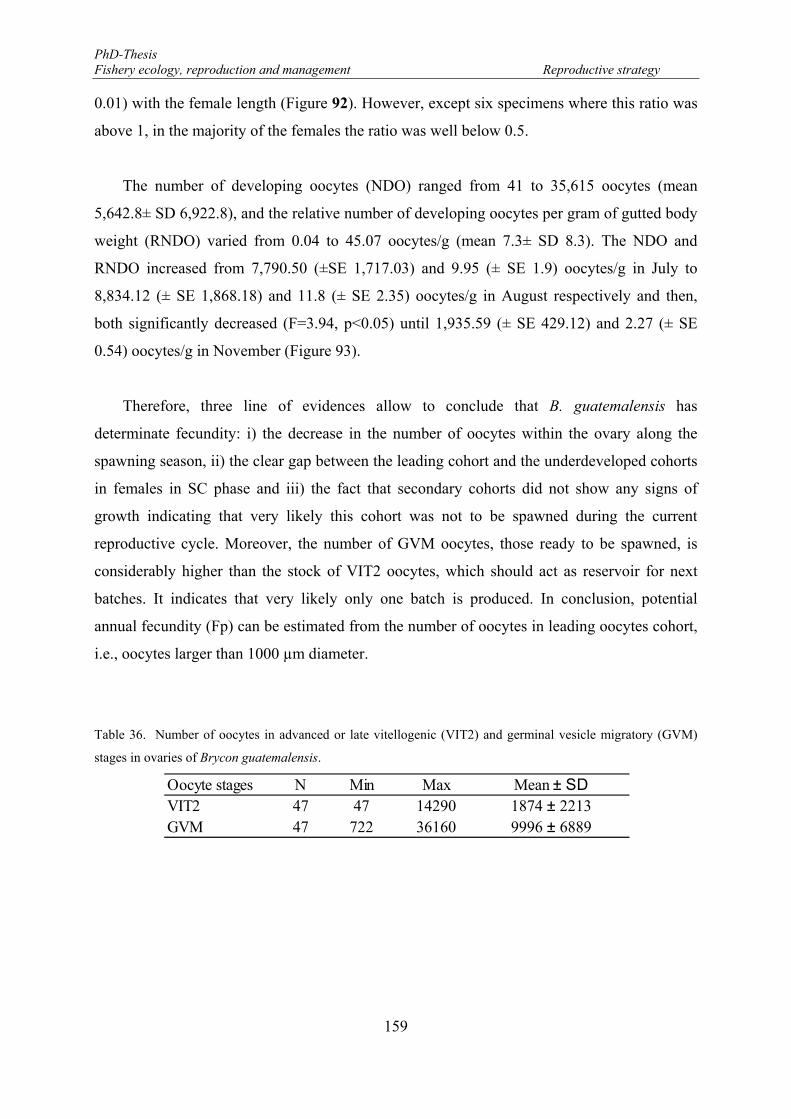
PhD-Thesis Fishery ecology, reproduction and management Reproductive strategy
159
0.01) with the female length (Figure 92). However, except six specimens where this ratio was
above 1, in the majority of the females the ratio was well below 0.5.
The number of developing oocytes (NDO) ranged from 41 to 35,615 oocytes (mean
5,642.8± SD 6,922.8), and the relative number of developing oocytes per gram of gutted body
weight (RNDO) varied from 0.04 to 45.07 oocytes/g (mean 7.3± SD 8.3). The NDO and
RNDO increased from 7,790.50 (±SE 1,717.03) and 9.95 (± SE 1.9) oocytes/g in July to
8,834.12 (± SE 1,868.18) and 11.8 (± SE 2.35) oocytes/g in August respectively and then,
both significantly decreased (F=3.94, p<0.05) until 1,935.59 (± SE 429.12) and 2.27 (± SE
0.54) oocytes/g in November (Figure 93).
Therefore, three line of evidences allow to conclude that B. guatemalensis has
determinate fecundity: i) the decrease in the number of oocytes within the ovary along the
spawning season, ii) the clear gap between the leading cohort and the underdeveloped cohorts
in females in SC phase and iii) the fact that secondary cohorts did not show any signs of
growth indicating that very likely this cohort was not to be spawned during the current
reproductive cycle. Moreover, the number of GVM oocytes, those ready to be spawned, is
considerably higher than the stock of VIT2 oocytes, which should act as reservoir for next
batches. It indicates that very likely only one batch is produced. In conclusion, potential
annual fecundity (Fp) can be estimated from the number of oocytes in leading oocytes cohort,
i.e., oocytes larger than 1000 µm diameter.
Table 36. Number of oocytes in advanced or late vitellogenic (VIT2) and germinal vesicle migratory (GVM)
stages in ovaries of Brycon guatemalensis.
Oocyte stages N Min Max Mean ± SDVIT2 47 47 14290 1874 ± 2213GVM 47 722 36160 9996 ± 6889
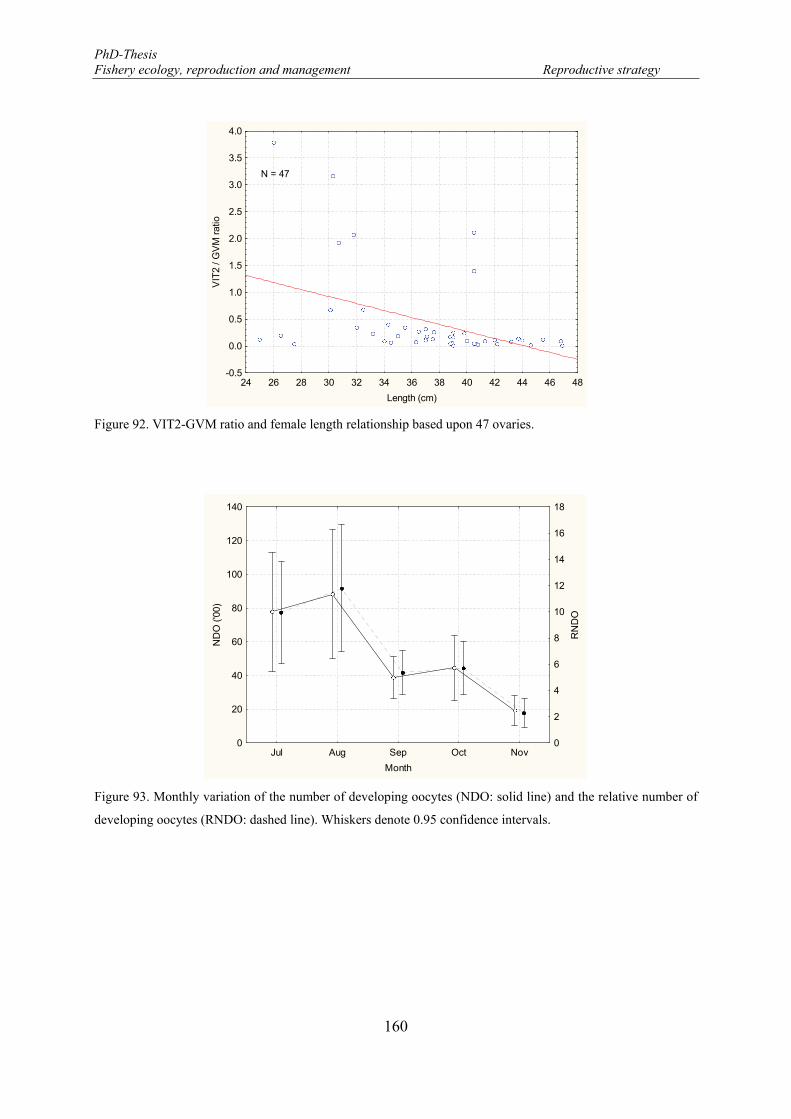
PhD-Thesis Fishery ecology, reproduction and management Reproductive strategy
160
Figure 92. VIT2-GVM ratio and female length relationship based upon 47 ovaries.
Figure 93. Monthly variation of the number of developing oocytes (NDO: solid line) and the relative number of
developing oocytes (RNDO: dashed line). Whiskers denote 0.95 confidence intervals.
24 26 28 30 32 34 36 38 40 42 44 46 48
Length (cm)
-0.5
0.0
0.5
1.0
1.5
2.0
2.5
3.0
3.5
4.0
VIT
2 / G
VM
rat
io
N = 47
Jul Aug Sep Oct Nov
Month
0
20
40
60
80
100
120
140
ND
O (
'00)
0
2
4
6
8
10
12
14
16
18
RN
DO
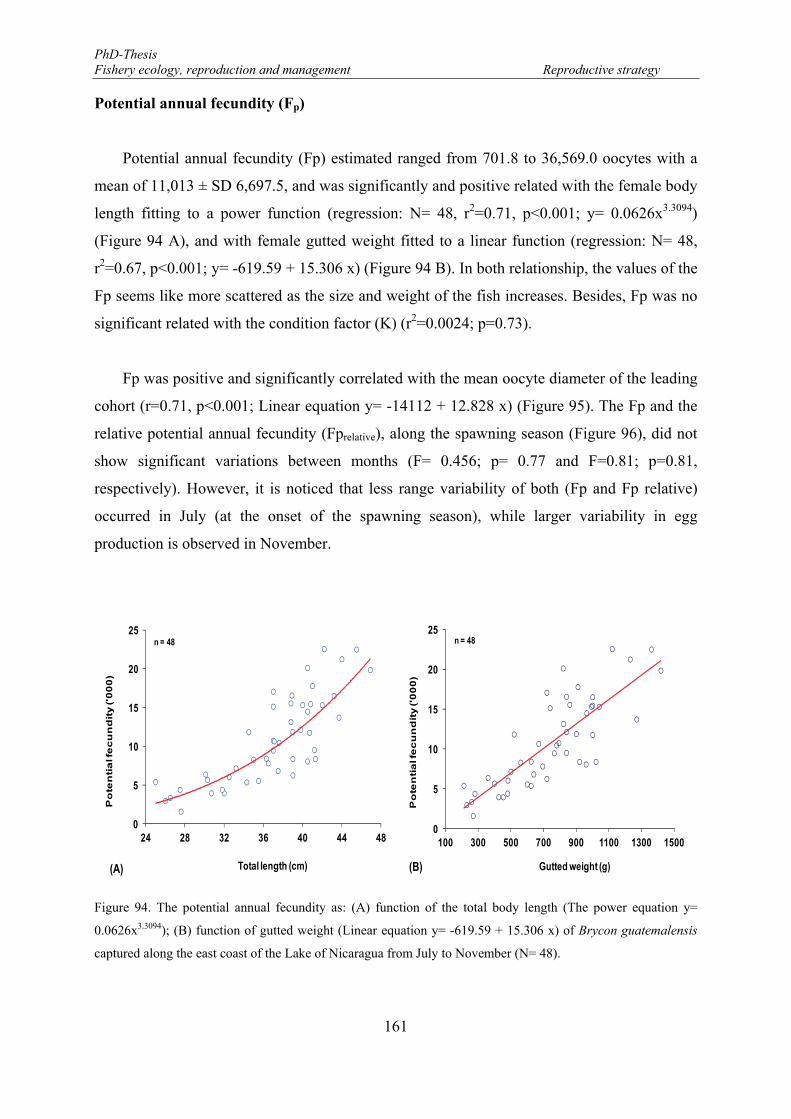
PhD-Thesis Fishery ecology, reproduction and management Reproductive strategy
161
Potential annual fecundity (Fp)
Potential annual fecundity (Fp) estimated ranged from 701.8 to 36,569.0 oocytes with a
mean of 11,013 ± SD 6,697.5, and was significantly and positive related with the female body
length fitting to a power function (regression: N= 48, r2=0.71, p<0.001; y= 0.0626x3.3094)
(Figure 94 A), and with female gutted weight fitted to a linear function (regression: N= 48,
r2=0.67, p<0.001; y= -619.59 + 15.306 x) (Figure 94 B). In both relationship, the values of the
Fp seems like more scattered as the size and weight of the fish increases. Besides, Fp was no
significant related with the condition factor (K) (r2=0.0024; p=0.73).
Fp was positive and significantly correlated with the mean oocyte diameter of the leading
cohort (r=0.71, p<0.001; Linear equation y= -14112 + 12.828 x) (Figure 95). The Fp and the
relative potential annual fecundity (Fprelative), along the spawning season (Figure 96), did not
show significant variations between months (F= 0.456; p= 0.77 and F=0.81; p=0.81,
respectively). However, it is noticed that less range variability of both (Fp and Fp relative)
occurred in July (at the onset of the spawning season), while larger variability in egg
production is observed in November.
Figure 94. The potential annual fecundity as: (A) function of the total body length (The power equation y=
0.0626x3.3094); (B) function of gutted weight (Linear equation y= -619.59 + 15.306 x) of Brycon guatemalensis
captured along the east coast of the Lake of Nicaragua from July to November (N= 48).
0
5
10
15
20
25
24 28 32 36 40 44 48
Po
ten
tia
l fe
cu
nd
ity ('0
00
)
Total length (cm)(A)
n = 48
0
5
10
15
20
25
100 300 500 700 900 1100 1300 1500
Po
ten
tia
l fe
cu
nd
ity ('0
00
)
Gutted weight (g)(B)
n = 48
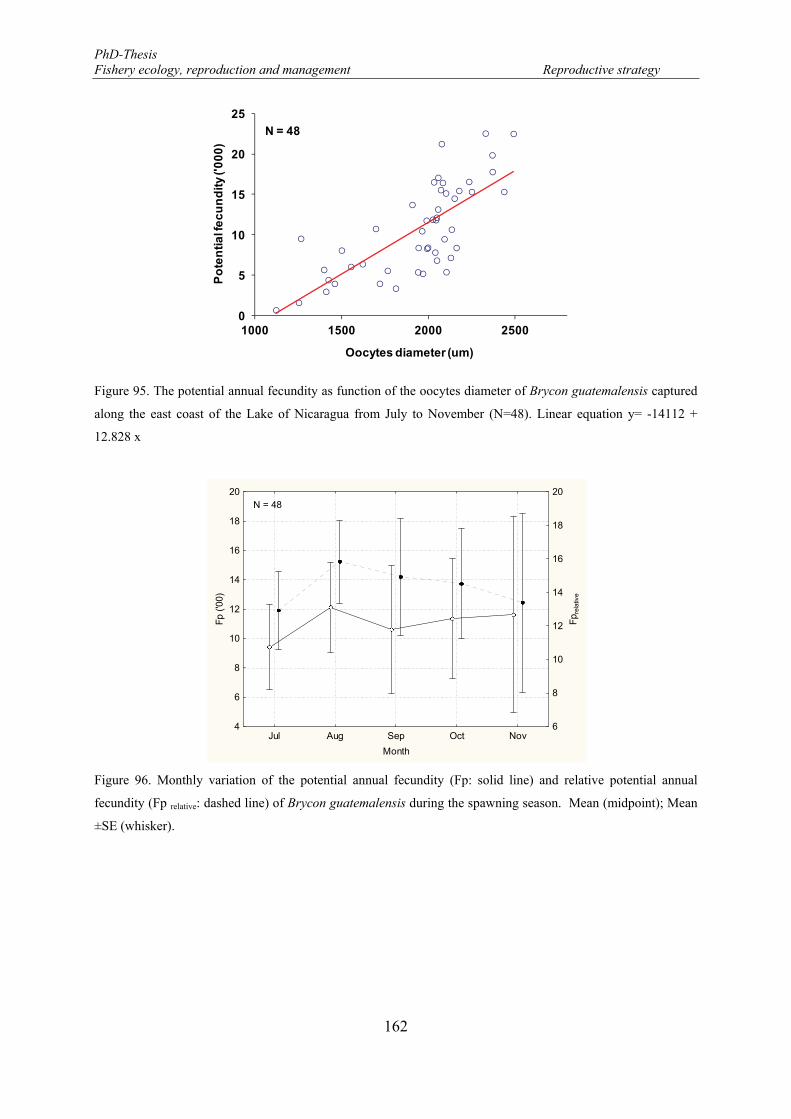
PhD-Thesis Fishery ecology, reproduction and management Reproductive strategy
162
Figure 95. The potential annual fecundity as function of the oocytes diameter of Brycon guatemalensis captured
along the east coast of the Lake of Nicaragua from July to November (N=48). Linear equation y= -14112 +
12.828 x
Figure 96. Monthly variation of the potential annual fecundity (Fp: solid line) and relative potential annual
fecundity (Fp relative: dashed line) of Brycon guatemalensis during the spawning season. Mean (midpoint); Mean
±SE (whisker).
0
5
10
15
20
25
1000 1500 2000 2500
Po
ten
tia
l fe
cu
nd
ity
('0
00
)
Oocytes diameter (um)
N = 48
Jul Aug Sep Oct Nov
Month
4
6
8
10
12
14
16
18
20
Fp
('00)
6
8
10
12
14
16
18
20
Fp r
elat
ive
N = 48
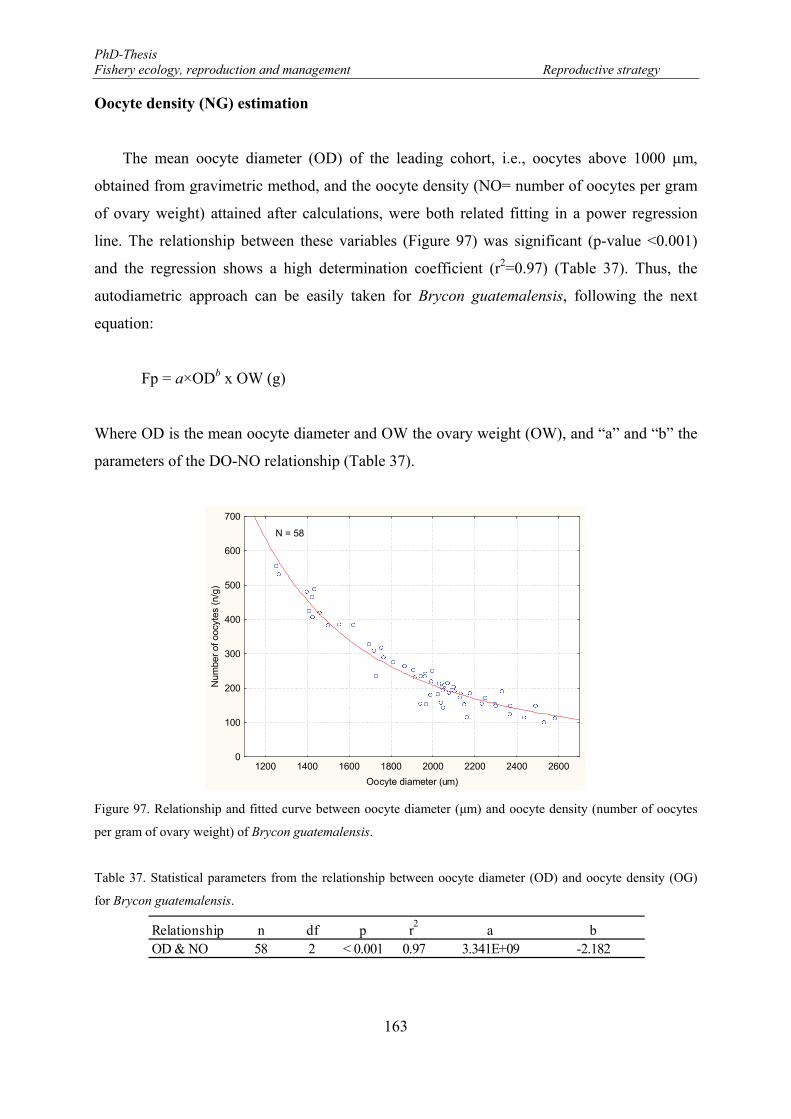
PhD-Thesis Fishery ecology, reproduction and management Reproductive strategy
163
Oocyte density (NG) estimation
The mean oocyte diameter (OD) of the leading cohort, i.e., oocytes above 1000 μm,
obtained from gravimetric method, and the oocyte density (NO= number of oocytes per gram
of ovary weight) attained after calculations, were both related fitting in a power regression
line. The relationship between these variables (Figure 97) was significant (p-value <0.001)
and the regression shows a high determination coefficient (r2=0.97) (Table 37). Thus, the
autodiametric approach can be easily taken for Brycon guatemalensis, following the next
equation:
Fp = a×ODb x OW (g)
Where OD is the mean oocyte diameter and OW the ovary weight (OW), and “a” and “b” the
parameters of the DO-NO relationship (Table 37).
Figure 97. Relationship and fitted curve between oocyte diameter (μm) and oocyte density (number of oocytes
per gram of ovary weight) of Brycon guatemalensis.
Table 37. Statistical parameters from the relationship between oocyte diameter (OD) and oocyte density (OG)
for Brycon guatemalensis.
1200 1400 1600 1800 2000 2200 2400 2600
Oocyte diameter (um)
0
100
200
300
400
500
600
700
Num
ber
of o
ocyt
es (
n/g)
N = 58
Relationship n df p r2
a bOD & NO 58 2 < 0.001 0.97 3.341E+09 -2.182
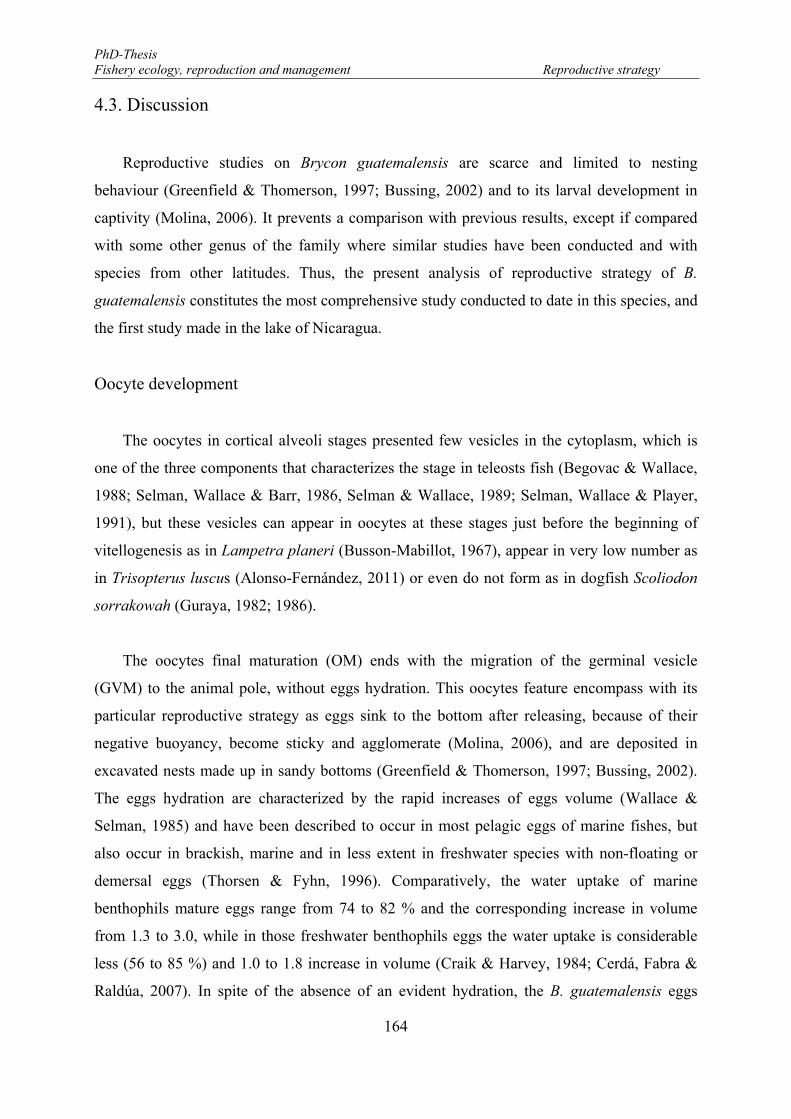
PhD-Thesis Fishery ecology, reproduction and management Reproductive strategy
164
4.3. Discussion
Reproductive studies on Brycon guatemalensis are scarce and limited to nesting
behaviour (Greenfield & Thomerson, 1997; Bussing, 2002) and to its larval development in
captivity (Molina, 2006). It prevents a comparison with previous results, except if compared
with some other genus of the family where similar studies have been conducted and with
species from other latitudes. Thus, the present analysis of reproductive strategy of B.
guatemalensis constitutes the most comprehensive study conducted to date in this species, and
the first study made in the lake of Nicaragua.
Oocyte development
The oocytes in cortical alveoli stages presented few vesicles in the cytoplasm, which is
one of the three components that characterizes the stage in teleosts fish (Begovac & Wallace,
1988; Selman, Wallace & Barr, 1986, Selman & Wallace, 1989; Selman, Wallace & Player,
1991), but these vesicles can appear in oocytes at these stages just before the beginning of
vitellogenesis as in Lampetra planeri (Busson-Mabillot, 1967), appear in very low number as
in Trisopterus luscus (Alonso-Fernández, 2011) or even do not form as in dogfish Scoliodon
sorrakowah (Guraya, 1982; 1986).
The oocytes final maturation (OM) ends with the migration of the germinal vesicle
(GVM) to the animal pole, without eggs hydration. This oocytes feature encompass with its
particular reproductive strategy as eggs sink to the bottom after releasing, because of their
negative buoyancy, become sticky and agglomerate (Molina, 2006), and are deposited in
excavated nests made up in sandy bottoms (Greenfield & Thomerson, 1997; Bussing, 2002).
The eggs hydration are characterized by the rapid increases of eggs volume (Wallace &
Selman, 1985) and have been described to occur in most pelagic eggs of marine fishes, but
also occur in brackish, marine and in less extent in freshwater species with non-floating or
demersal eggs (Thorsen & Fyhn, 1996). Comparatively, the water uptake of marine
benthophils mature eggs range from 74 to 82 % and the corresponding increase in volume
from 1.3 to 3.0, while in those freshwater benthophils eggs the water uptake is considerable
less (56 to 85 %) and 1.0 to 1.8 increase in volume (Craik & Harvey, 1984; Cerdá, Fabra &
Raldúa, 2007). In spite of the absence of an evident hydration, the B. guatemalensis eggs
PhD-Thesis Fishery ecology, reproduction and management Reproductive strategy
165
increase 1.6-fold in volume during final maturation, which is in the range for freshwater
benthophilics eggs previously mentioned. Moreover, the maximum diameter recorded in our
study from histological section, 2.3 mm, is close to the measured eggs diameter under
laboratory condition, just before hatching, 2.5 mm (Molina, 2006). However, the average
oocyte diameter at OM in our study was smaller, 1.6 mm, and similar to B. petrosus whose
eggs measured 1.6-1.9 mm (Kramer, 1978a). The increase in oocyte size during OM in our
study ranged 0.23 and 0.30 mm, similar to many others freshwater teleosts fishes whose eggs
diameter, during germinal vesicle breaks down (GVBD), increases in less than one mm, e.g.,
in common killifish Fundulus heteroclitus (1.4 to 2.0 mm), Fundulus grandis (1.6 to 2.2 mm),
Fundulus majalis (1.7 to 2.5 mm), Cyprinodon variegates (0.85 to 1.2 mm), Chasmodes
saburrae (0.80 to 1.00 mm), Dormitator maculates (0.28 to 0.30 mm), or Gobionellus
boleosoma ( 0.25 to 0.33 mm) (Skoblina, 2010). For these species, oocytes increased in
average 33% in size (142% in volume, i.e., 2.4-fold), while the egg increase in B.
guatemalensis was 16% in size (56% in volume, i.e., 1.6-fold), i.e., within the variation
freshwater teleosts but well below the average.
Eggs of B. guatemalensis are released surrounded by mucus, produced within the ovary,
that is visually observed when enter in contact with water. This mucus formation occur in
some teleosts during vitellogenesis, when their epithelial organization is disrupted, the
organelles fragmented, and the cells are transformed into an irregular mass of “mucosomes”
which, on contact with water following oviposition, swells to form an adhesive coat of
mucopolysaccharides and mucoproteins that causes the eggs to adhere to the nests wall and to
each other (McMillan, 2007). Rizzo et al. (2002) present a list of 12 species of the Characidae
family in which are categorized the eggs adhesiveness of each species in 1. Adhesive; 2.
Weakly adhesive; and 3. Non-adhesive. Following the presented categories, the eggs
adhesiveness characteristic of B. guatemalensis could be included in the category of adhesive
eggs, since the surrounding mucus stuck the eggs firmly to each other and formed a coherent
egg mass, whereas its close parent B. petrosus is in the category of weakly adhesive eggs and
spawn out of water on damp gravel at the edge of a riffle (Kramer, 1978a).
PhD-Thesis Fishery ecology, reproduction and management Reproductive strategy
166
Reproductive cycle
The more clear spawning evidence was the observation of GVM since postovulatory
follicle (POF) frequency was very low. The POF duration may be temperature-dependent,
because the metabolic rate of poikilotherms, like fish, may be directly affected by ambient
(Hunter & Macewicz, 1985), and varies between species (Fitzhugh & Hettler, 1995). These
can be rapidly deteriorate and become undetectable within few days (Hunter & Golber, 1980)
or up to 48 hours in common snook at 29 ºC, (Ronald, 2002) or even in 15 hours at high water
temperature of 28 to 30 ºC as in Callionymus enneactis (Takita et al., 1983). This is likely the
reason for the low frequency of POF in ovaries of B. guatemalensis observed during this
study, since water temperatures in the Lake Nicaragua has an average temperature of 28.6 ºC
(Hernández-Portocarrero & Saborido-Rey, 2007). The presence-absence of POF in the ovaries
of B. guatemalensis seems to be also influenced by the time of the day the samples were
collected in the wild, this asseveration is based in the fact that in tropical areas the water
temperature rapidly increase as sunrise, in two or more degrees, thus it seems to be advisable
to collect samples before sunrise to increase POF frequency. One last consideration to the low
frequency of POF is that spawning ground did not overlap with the fishing ground where
females were collected because it migratory behaviour to spawn (Horn, 1997; Drewe et al.,
2003; McLarney, et al., 2010). More importantly is to determine the diel periodicity, i.e., the
synchronicity of individual spawn times, which varies considerably among species (Lowerre-
Barbieri et al., 2011a). The sampling in this study was conducted in the morning (around
dawn). If spawning consistently at the afternoon and POF degenerates in few hours, it may
explain the low prevalence of POF. Fish must be sampled at given intervals over 24–48 h
(Hunter & Macewicz, 1985) to assess the full range of times over which fish spawn.
According to our results B. guatemalensis exhibits a protracted spawning season lasting 8
months (from July to February), with the highest activity between July and November. The
proportion of spawning fraction (Sf) estimated on the prevalence of the spawning capable and
actively spawning females over all mature females was supported on the defined spawning
season, the dominant presence of developing phase over the rest of the phases, the negligible
presence of POF and the evidence that highest spawning event take place in July and August.
This method has been used in species with determinate fecundity as Trisopterus luscus
(Alonso-Fernández, 2011), and differ with the most common methods used for indeterminate
PhD-Thesis Fishery ecology, reproduction and management Reproductive strategy
167
fecundity and batch spawner species as Merluccius merluccius (Korta et al., 2010). Other
characids fishes inhabiting mildly seasonal environments display considerable diversity in the
reproductive timing, ranging from an extremely brief period (1 or 2 days per year) as
Bryconamericus emperador, through moderately long breeding seasons (2 month) as B.
petrosus and 4 month as Hyphessobrycon panamensis to essentially continuous breeding in
Roeboides and Gephyrocharax (Kramer, 1978a). The reproductive period of characids such as
Salminus hilarii, Bryconamericus emperador and Piabucina panamensis in Brazil respond to
the rainfall season (spring to late summer), river flood and high water temperature (Honji et
al., 2009) which provide a suitable environment for survival of the offspring, but particularly
the rainfall intensity is the most important synchronizing factor in tropical fish reproduction
(Lowe-McConnel, 1987; Andrade & Braga, 2005). The influence of this environmental
parameter is also evinced in B. guatemalensis, since in the present study it has been observed
that spawning onset coincides with the rainfall and completely cesses in dry season. However,
unlike B. guatemalensis, other species like Hyphessobrycon panamensis and B. petrosus
mature and spawn during the dry season, between November and April and from January to
March, respectively (Kramer, 1978a; 1978b).
Somatic indexes
Highest values of GSI were observed from July to December without a clear peak during
this period. The lowest values were recorded during dry months indicating the complete
spawning cessation; the end of spawning is also confirmed by the generalised follicular
atresia in December and January. On the contrary, both GSI mean and variance largely
fluctuated during spawning season. In species with determinate fecundity, as Trisopterus
luscus, GSI sharply decrease as spawning progress without further eggs replacement (Alonso-
Fernández et al., 2008). Large fluctuation in GSI is likely associated to the presence of
different reproductive phases and different fish sizes in the spawning stock, i.e., an
asynchronicity in the spawning activity within the mature stock. The influence of fish size on
gonad development has been evinced in the northern anchovy Engraulis mordax in which
small fish usually have a lower GSI than larger one and this effect increases with ovary
development (Hunter & Golber, 1980). Shepherd & Grimes (1984) found in weakfish
(Cynoscion regalis) that GSI was size-dependent and that larger fish develops their gonad
earlier than smaller fish and therefore spawn earlier. However, Lowerre-Barbieri, Chittenden
PhD-Thesis Fishery ecology, reproduction and management Reproductive strategy
168
& Barbieri (1996) did not found that evidence in weakfish based in GSI data, and attributed
this relationship to a temporary presence of the species in the study area, because migratory
behaviour. In our study, spawning activity shifted considerably among female size classes,
and the decrease in the activity along the spawning season was also related with fish size, i.e.,
smaller females have an earlier spawning cessation, coupled to the finalization of the rainy
season (November), while larger females have a more extended spawning season, till
February, and this may explain the protracted spawning season of the species. This spawning
structuring, already observed in other species (Alonso-Fernández & Saborido-Rey, 2011) may
explains the observed variations in GSI for the whole population.
Mean GSI ranges from 1% to 4% being relatively low in comparison with other
freshwater fish of the Characidae family as Oligosarcus jenynsii (1% to 8%) and Oligosarcus
robustus (1% to 10%) (Nunes, Pellanda & Hartz, 2004), which might indicate a relatively
lower energy investment in reproduction, but bioenergetics studies would be necessary to test
this hypothesis.
From January to April, when generally no reproduction takes place, the fish condition
sharply improve in terms of gaining body weight, probably due to intense feeding and to the
low spending energy, reduced to nourishment and swimming activity, as shown in other
species (Dutil, Lambert & Chabot, 2003). The intense feeding during these months could be a
strategy to accumulate energy during periods when food is available to be subsequently
allocated to reproduction as reserves used on vitellogenesis (Barbieri, Hartz & Verani, 1996).
However, from May to December, when the condition of the fishes largely fluctuates, it
experiments small but significant decrease. The decrease of K in May is the first evidence of
energy utilization and might be related to the onset of ripening, since variations in K primarily
reflect state of sexual maturity (Williams, 2000). The decline of K the following months is
attributed to the yolk accumulation (vitellogenesis), since as pointed out before, GSI is higher
in July. Lowest condition when gonad is fully developed indicates a major resource transfer to
the gonads during the reproductive period (Vazzoler, 1996). The fact of condition decreasing
along spawning season indicates a continuous use of stored energy, as a capital breeder
(Alonso-Fernández & Saborido-Rey, 2012). The condition factor, K, decreased rapidly when
the eggs are released in salmonid fish (Brown trout, Salmo trutta, rainbow trout,
Oncorhynchus mykiss and chinook salmon, O. tshawytscha) (Barnham & Baxter, 2003).
PhD-Thesis Fishery ecology, reproduction and management Reproductive strategy
169
Based on the available energy reserves in cod, Dutil & Lambert (2000) found that two distinct
groups of fish participate in reproduction: early spawners having lower fat reserves and late
spawners having good condition fish. In B. guatemalensis, the decreasing tendency of K till
September followed by a recuperation of the physiological condition in October support the
idea of size structuring of the spawning activity as discussed earlier, i.e., some females are
early spawners and cease their reproductive activity while others continue spawning and
become later spawners.
Lizama & Ambrosio (2002) compared the condition factor of nine species of Characidae
family and found greater differences in K along the year, however in all species K decreased
with the onset of the spawning and in most of them highest K occur in the smallest fish
length. This pattern is unclear in B. guatemalensis since K in smaller and larger females
showed a high variance, except in female close to spawn, i.e., spawning capable phase, in
which highest K occur in smaller females. The decoupling pattern of both GSI and K along
the spawning season and the influence of fish size, support the idea of size structuring
spawning discussed earlier, which induce a population asynchrony, mainly in the spawning
cessation.
The seasonal patterns observed in B. guatemalensis contribute to confirm the high
diversity of seasonal patterns found in the Characidae family, revealing the complexity of its
life history, and support the hypothesis that reproductive seasonality in the characids is
controlled by the environmental condition and body size (Kramer, 1978a). In our study the
rainy season seems to be the trigger of spawning season and the duration and timing of the
spawning are female size-dependent. One fact that favours the size segregation of spawning
activity is the competition for breeding sites (Kramer, 1978a), since B. guatemalensis needs to
excavate holes (nests) in sandy bottoms for placing the eggs (Greenfield & Thomerson, 1997;
Bussing, 2002) and therefore sand ground is a limited resource. Also inter-specific
competition for breeding sites may exist with, for example, Cichlasoma citrinellum (recently:
Amphilophus citrinellum) which breed in sand grounds between depths from 3.0 to 6.0 m, in a
30 cm holes (McKaye, 1977). Thus, competition for the suitable environment for releasing
eggs can take place and migrations may occur. Segregation in timing of spawning may be a
clear advantage reducing competition. However, further studies are needed since
discrepancies exist about B. guatemalensis spawning grounds, e.g., Horn (1997) mentioned
PhD-Thesis Fishery ecology, reproduction and management Reproductive strategy
170
the migratory habits upstream (towards the lakes) of B. guatemalensis for spawning or
perhaps feeding, on the contrary McLarney et al. (2010) indicate that this species inhabits the
lakes of Nicaragua and moves into tributaries to spawn.
Maturity
Maturity has been poorly studied in B. guatemalensis and other species of the Characidae
family. Maturity ogives and the corresponding size at 50% maturity are commonly used in
fisheries management in many ways, but mostly to estimate spawning stock biomass and to
establish a minimum landing size, and often biological reference points are also based on
these estimations. In data limited stocks L50 can be critical to establish size-based indicators
(SBIs) as management procedure (Shin et al., 2005). In the Lake Nicaragua there is no
specific regulation for B. guatemalensis. Hence, a proper estimation of L50 is required.
The L50 macroscopically determined in the present study was 34.9 cm, which was close
to L50 (34.6 cm) estimated from an empirical relationship between length at first maturity and
asymptotic length (Froese & Binohlan, 2000). However, these values are well above the L50
microscopically estimated, 27, 3 cm. Macroscopic classifications of the gonad stages methods
produce many uncertainties and interpretation errors should be assessed when macroscopic
classification of gonads stages are carried out, that because boundaries, between different
development stages, are subjectively estimated (Williams, 2007). The misclassifications and
uncertainties may introduce bias in the L50 estimation. The sub or over-estimation of L50 can
induce unreliable management measures that should ensure the protection of the immature
stock. Also the onset and cessation of the spawning season, i.e., the duration of the season,
can be wrongly estimated if females at immature and recovery phases are confounding, as
often occur when maturity is staged macroscopically (Murua et al., 2003; Domínguez-Petit et
al., 2008).
To reduce errors in macroscopic staging, it has been recommended to estimate maturity
ogive only during the spawning season (Hunter & Macewicz, 2003). However, in spite in this
study maturity ogive was estimated in different periods including the spawning season, still
unreliable results were obtained. Moreover, the size distribution of immature and mature
females complete overlap, and even the smaller fish sampled were determined as mature. The
PhD-Thesis Fishery ecology, reproduction and management Reproductive strategy
171
uncertainties of macroscopic observations indicate that relying on this procedure is no longer
feasible especially when the results have an implication for the management regulations.
Histological (microscopic) determination of L50 in B. guatemalensis, considering in the
analysis whole year period or the spawning season only, showed no differences, and was
estimated in 27.3 cm. The lack of discrepancy of these results supports the robustness of the
microscopic method, which generates less biased estimates of maturity (Hunter et al., 1992).
The great majority of species studied in Paraná River, included species of Characidae
family, reach maturity with less than 20 cm in length (Agostinho, Vazzoler & Thomaz, 1995),
e.g., L50 in Brycon opalinus were about 18 cm (Gomiero & Braga, 2007). Differences in
length at maturity between Paraná River and the lake environments have been observed in
Prochilodus lineatus, that mature at larger sizes in lakes (Agostinho et al., 1993), indicating
that different stocks can occur in similar environments. However, larger L50 has been reported
for B. hilarii, 26.6 cm (Vicentin, Costa & Súarez, 2012). Size at maturity is known to be a
highly plastic parameter sensible to growth rate, food availability and feeding capacity,
including foraging behaviour (Saborido-Rey & Kjesbu, 2005). Consequently it often changes
under external pressure, such as intensive fishing or environmental factors (Trippel 1995;
Dominguez-Petit et al., 2008; Cook & Heath, 2005). Although it normally shows density-
dependent phenotypic plasticity, genetic changes have been also reported (Pérez-Rodriguez,
Morgan & Saborido-Rey, 2009). Shifts in maturation severely determine the population
dynamics (Saborido-Rey & Trippel, 2013). There are not historical data on maturity in
Brycon guatemalensis, and then it is not possible to analyse changes in length at maturity.
Therefore, it is highly advisable to conduct maturity studies on regular basis in B.
guatemalensis in the lake and in the main tributaries.
Fecundity
A number of evidences analyzed indicated that B. guatemalensis shows determinate
fecundity. The presence of a major gap between the reservoir of small unyolked (primary
growth) oocytes and the dominant population of larger and more advanced development
oocytes stages or leading cohort, in mature ovaries, indicates that the ovary dynamic of B.
guatemalensis adjust to the “group-synchronous” type ovary organization described by
PhD-Thesis Fishery ecology, reproduction and management Reproductive strategy
172
Wallace & Selman (1981) which has been associated with iteroparous species with
determinate fecundity (Hunter & Macewicz, 1985; Murua & Saborido-Rey, 2003). At the
same time the decreasing tendency of the number of oocytes present in the ovary during the
spawning season (NDO and RNDO) indicates a lack of oocyte recruitment to the leading
cohort during the spawning confirming the determinate fecundity in B. guatemalensis. The
leading cohort, i.e., oocytes in VIT2 or GVM clearly dominate the oocyte frequency in
spawning capable females, although a second cohort of developing oocytes, at initial
vitellogenesis stage (VIT1), was present in the majority of spawning capable females. But the
modal progression pattern of both oocytes cohorts differs notably, and while the leading
cohort develops, the second remains at the same small diameter, generating also a clear size
gap of more than 1 mm between these cohorts. The second cohort was probably the one
entering in atresia at the end of the spawning season (December and January). Moreover, the
number of oocytes of the leading cohort was five times larger on average than the number of
oocytes in the secondary cohort. Because oocytes of the leading cohort entered in GVM at the
same time, it probably indicates that B. guatemalensis spawn only one batch in each breeding
season, i.e., it is a total spawner (Murua & Saborido-Rey, 2003). If a second batch is spawned
(recruited from the few oocytes of the secondary cohort) it must be considerably smaller in
numbers. Nevertheless, in six specimens the number of oocytes in the secondary cohort was
1.5-3.5 times larger than the leading cohort. There are two possible explanations, either some
specimens spawn more than two batches, or, more likely, in those specimens the oocyte
recruitment from VIT1 to VIT2 was not yet finalized, underestimating the size of the leading
cohort. Therefore, the estimated number of oocytes in the leading cohort, the one closer to be
spawned and composed by larger oocytes (>1000 µm) should be considered as the potential
annual fecundity.
The potential annual fecundity was highly variable, between 700 and 35,500 eggs (mean
11,013 ± 6,697), well above the fecundity of other characids as Bryconamericus iheringii in
which fecundity range from 370 to 1600 (933.71 ± 303.10) and Bryconamericus stramineus
from 98 to 1100 (371.3 ± 244.6) (Lampert, Azevedo & Bernhardt, 2004; 2007), although the
size structure of both populations differs notably with Brycon to establish a sound
comparison. But fecundity was in the same order as in Salminus hilarii (Characidae family)
with a similar female size range (Honji et al., 2009). Atresia occurred along the spawning
season with very low incidence (4 %), and generalised atresia was observed only in two
PhD-Thesis Fishery ecology, reproduction and management Reproductive strategy
173
females at the end of the spawning period (December and January, respectively) coinciding
with the cessation of the spawning season, which is typical in most of seasonal spawning fish
(Hunter & Macewicz, 1985). The low prevalence of atresia can be the result of a rapid
turnover rate that makes difficult to find this structure in a standard field sampling. However,
given the known duration of atretic stages in other species which always are above several
days (Hunter & Macewicz, 1985; Miranda et al., 1999; Witthames, Thorsen & Kjesbu 2010),
unlikely rapid atresia degeneration may explain the low prevalence. The low number of
generalised atresia might indicate reproductive success, since, the high incidence of atresia
has been linked to a reproductive failure, e.g., in Fathead Minnows (Pimephales promelas)
was established a critical threshold value of 20% as indicative of potentially impaired
reproduction (McCormick, Stokes & Hermanutz, 1989). Although atresia has been
acknowledged as mechanism to regulate fecundity (Hay & Brett, 1988), the low prevalence
seems to not affect fecundity, and therefore we can conclude that atretic losses did not
constitute an important fraction to be considered in the potential annual fecundity.
Fecundity is considered to be a key factor in population dynamics (Hilborn & Walters,
1992; Marshall et al., 2003) that evolves temporally and spatially within a given species.
Fecundity is a highly plastic trait, showing inter and intra-specific variations. Differences in
fecundity among species often reflect different reproductive strategies (Pitcher & Hart, 1982;
Wootton, 1984; Murua & Saborido-Rey, 2003). Within a certain species, fecundity could vary
in response to particular environmental conditions of a specific habitat, as latitudinal
variability (Witthames et al., 1995). Even annual and long-term changes in fecundity were
reported within a fish stock (Horwood, Bannister & Howlett, 1986; Rijnsdorp, 1991; Kjesbu
et al., 1998) and changes among successive reproductive periods and between individuals
with same size in the same reproductive period (Vazzoler, 1996). Generally, it is known that
fecundity is proportional to female size/age and condition (Kjesbu et al. 1991; Marshall et al.
1998, 1999; Cooper et al., 2013). It is the case of B. guatemalensis in our study where
fecundity was positively determined by fish size and weight, but allometric coefficient
obtained with the relationship between fecundity and fish size was well above three indicating
that larger females produce more eggs than predicted by weight, i.e., showing higher
reproductive potential. The importance of stock reproductive potential is further discussed in
Chapter 6.
PhD-Thesis Fishery ecology, reproduction and management Reproductive strategy
174
Although fish weight is a reliable indicator of the capacity of oocytes production also, it
depends on many biotic (e.g., food availability) and abiotic (e.g., environmental stress)
factors, and may vary along the year (Bagenal, 1967), being fish size a more reliable predictor
of fecundity (Thorsen, Marchall & Kjesbu, 2006). However, this seems to be species-
dependent since the fecundity and fish weight shows a better relationship in Bryconamericus
iheringii, whereas in Bryconamericus stramineus no differences were obtained between
fecundity and female size and weight (Lampert, Azevedo & Bernhardt, 2004; 2007).
Moreover, larger females produce also bigger oocytes, as shown by the fairly good correlation
between fecundity and oocyte diameter, also found in other determinate fecundity species as
Dover sole (Hunter et al., 1992). These findings may have importance understanding
recruitment process in B. guatemalensis, since larger eggs presumable produce larger larvae
with higher possibilities of surviving (Hislop, 1984), as they grow faster and are more
resistant to starvation (Berkeley, Chapman & Sogard, 2004b). The diameter of fully mature
oocytes of a 42 cm female from this study (2.17 ± 1.36 mm) was similar to that reported for a
same size fish keep under controlled condition (2.31 ± 0.08 mm, Molina, 2006), but
considerably larger than Salminus hilari which, in wild, produce eggs of no more than 1.4 mm
(Takahashi, 2006).
The individual distribution pattern of the oocytes development stages, observed in each
females along the spawning season, evidence the spawning asynchrony among females and
partially explain the protracted of the spawning period (6-8 month). Although fishes of
determinate fecundity typically have short spawning seasons (1-2 month), and protracted
spawning seasons are typical from fish with indeterminate fecundity, also species with
determinate fecundity show long seasons (six month) as Dover sole (Hunter et al., 1992). In
B. guatemalensis the protracted spawning season can be the consequence of differences in
reproductive behaviour among different size classes, both in terms of reproductive timing,
condition, egg production and egg quality as shown above, that may indicate intra-specific
spawning competition, which may explain the occurrence of the greatest reproductive event of
the species in July. Kramer (1978a) studied six species of the Characidae family, and
indicated some competition level in relation to the duration and timing of the reproductive
period. Nevertheless, females spawning late in the season seem to perform worst, as indicated
by the decrease in egg size in B. guatemalensis as spawning season progress. Normally
females have high energy reserves early in the spawning season and thus may have more
PhD-Thesis Fishery ecology, reproduction and management Reproductive strategy
175
resources to produce more yolked and larger oocytes (Lowerre-Barbieri, Chittenden &
Barbieri, 1996). With the ongoing spawning season of Brycon the frequency of larger oocytes
becomes lower, which could be a response of the decrease of energy supply reflected in the
condition factor decline, but also to changes in the environmental condition, from rainy to dry
season, which might induced oocyte maturation at smaller size.
The potential annual fecundity of B. guatemalensis could be estimated by using the
calibration curve obtained from the relationship of the oocyte diameter (OD) and the number
of oocytes per gram of ovary weight (NO) since both set of observation fit well and were
highly correlated. This correlation type named the auto-diametric fecundity method was
developed by Thorsen & Kjesbu (2001) to estimate the potential fecundity of Atlantic cod,
and has been applied with successful result in other species, especially those with group-
synchronous ovary development and determinate fecundity from northern latitudes (Lambert,
2008; Alonso-Fernández et al., 2009; Witthames et al., 2009; Thorsen et al., 2010). The
method has also being applied in species characterized by asynchronous oocyte development
and determinate fecundity (Alonso-Fernández et al., 2009; Alonso-Fernández, 2011). The
application of the auto-diametric fecundity method will ease considerably the routine
estimation of fecundity and hence improve our knowledge on egg production and
reproductive potential.
The reproductive strategy study on B. guatemalensis should contribute to improve fishery
management and therefore the sustainability of its exploitation (See Chapter 5 and 6). This is
the first time that reproductive cycle, and particularly spawning season, is defined based on a
detailed histological analyses. Our findings can lead to adoption of closed season that
currently is not implemented. A better estimate of L50 on histological bases shows that it
matures at lower size (27.3 cm) than the one reported based on macroscopic observations,
which has a great implication for assessment and management. Finally, it has been shown that
larger females own larger reproductive potential. Hence, these results are used to evaluate the
impact of fishing on the spawning stock size or biomass (SSB) and the stock reproductive
potential (SRP) to be applied in the management of the species, in the next chapter.

177
CHAPTER 5: Reproduction in Fisheries Management
5.1. Introduction
In order to make sustainable the fishery activity, the fisheries management action requires
the good understanding of the methods of exploitation of fish stock and the biological
response capacity of the stock to a defined level of exploitation. The establishment of a
minimum landing size (MLS) is one of the most common management measures to prevent
overexploitation, particularly in data limited stocks exploited by the small-scale fisheries.
Often this technical measure is reinforced with regulations on fishing gears mesh size.
Generally, legal mesh size is determined combining gear selectivity and length-at-maturation
(L50) of the target species. The last aim is the protection of the immature or juvenile
component of the stock, a measure that often is considered enough to ensure the sustainability
of the fishery since it allows the fish to reach maturation and spawn at least once.
Although the protection of juveniles and the spawning stock biomass has been the focus
of sustainable fisheries management, there is increasing evidence that these efforts are not
sufficient to avoid overexploitation (Saborido-Rey & Trippel, 2013). The demonstrated higher
contribution of larger fish to stock productivity has shown that conserving sufficient
reproductive potential of the exploited stock is a determinant factor for stock sustainability
(Berkeley et al., 2004a; 2004b, Bobko & Berkeley, 2004; Birkeland & Dayton, 2005; Kjesbu,
1989); Trippel, 1999; Winters, Wheeler & Stansbury, 1993; Lambert, 2008). Thus, it is
essential to implement stock reproductive potential into assessment advice for harvested
marine species (Morgan et al., 2012) protecting the most productive stock fraction through
management actions. Therefore, a management measure, now required to achieve maximum
sustainable yield (MSY), should ensure the conservation of stock productivity which is linked
to egg production and stock structure, both affecting the estimation of MSY (Cerviño et al.,
2012).
Gillnets are the most common fishing gears used in small-scale fisheries (Hovgård &
Lassen, 2000). Gillnets are known to have a dome-shaped selectivity curve, which reflects
size-specific probabilities of capture that increase from near 0 to a maximum before declining
symmetrically with further increases in fish size to values near or equal to 0 (Hamley, 1975).
PhD-Thesis Fishery ecology, reproduction and management Reproduction in fisheries management
178
Thus gillnet shows a higher selectivity in comparison with bottom trawl (Martín, Sartor &
García-Rodríguez, 1999) and can be controlled to avoid catch fish below and above given
sizes, i.e., on a desirable size range (Gulland, 1983). In the Lake Nicaragua gillnets are widely
used and due to high species diversity and richness (Koenig et al., 1976; Bussing 1976, and
see Chapter 3), many different species can be caught by the same gillnet. Fisheries in the lake
target 31 species caught with different fishing gears (trawl, bag seine and gillnet), and out of
these, 19 are caught mostly by gillnets (Orellana, 1986). In the eastern side of the Lake, where
most of the fishery is found, 24 species are fished by gillnets (Hernández-Portocarrero &
Saborido-Rey, 2007). Brycon guatemalensis or Machaca is one of the most fished species
because of its high biomass (Orellana, 1986; see Chapter 3). Overall, the fisheries
management measures in the Lake Nicaragua mainly consist in the regulation of the mesh-
size derived from catches and effort data, abundance of the species, indirect estimations of
biomass (Orellana, 1986; Gadea, 2003) and by combining the results of the size at 50%
maturity (macroscopic determination) with gillnet selectivity (Hernández-Portocarrero &
Saborido-Rey, 2007).
Selectivity studies are requested for a proper management, as optimal mesh size
contribute in obtaining the maximum yield (McCombie, 1961), protecting small fish and
minimizing escapement of injured or dying fish (French & Dunn, 1973). Gillnet selectivity,
usually described by curves, one for each mesh size, show how the probability of catching a
fish changes according to its size (Hamley & Regier, 1973), nevertheless fish population are
heterogeneous not only in size, but also in age, sex, condition, behaviour, habitat, etc.,
subsequently each individual is not equally vulnerable to the same fishing method. Fishing
involves several aspects: time and space overlapping of fish and fishing activity, fish
interaction with fishing gear and finally fish probability being caught by gears (Hamley,
1975). Despite most of selectivity studies are focused on relationship between fish and mesh
size, some studies demonstrated the influence of other factors like fish behaviour (Clark,
1960) or maturity stage and fish shape (McCombie & Berst, 1969) on gillnets selectivity
patterns. As the environmental factors influence the reproductive dynamic and behaviour of
the species (Kramer, 1978a; Honji, et al., 2009; Andrade & Braga, 2005; Lowe-McConnell,
1987), these factors should be also considered in selectivity studies.
PhD-Thesis Fishery ecology, reproduction and management Reproduction in fisheries management
179
From chapter 4 we know that females annual reproductive cycle of Brycon guatemalensis
is characterized by the presence of developing phase along the year, and a protracted
spawning season from July to December, with a higher spawning fraction occurring in July
and August. Also that fecundity studies indicated it has determinate fecundity, and that larger
female has a higher reproductive potential both in terms of quantity, i.e., egg production and
quality, i.e., larger eggs.
The data collected from females of B. guatemalensis in the lake are used in the present
study to introduce several aspect of the biology of the species that contribute to improve the
management, such as the influence of reproductive strategies and tactics of the females on the
catches and vice-versa the effect of the gillnets on the immature portions of the stock, the
spawning stock size or biomass (SSB) and the stock reproductive potential (SRP). Besides,
the influence of reproductive behaviour pattern on catches and its relation with the dry and
rainy season of the year is also studied. Finally, some alternative management measurements
are provided.
PhD-Thesis Fishery ecology, reproduction and management Reproduction in fisheries management
180
5.2. Results
In this section, it is analyzed the gillnet selectivity effect on i) the population size
structure of Amphilophus citrinellus, Hypsophrys nicaraguensis, Parachromis managuensis
and Brycon guatemalensis, on both sexes, and ii) on the length at 50 % maturity of these
species. The effect of each net mesh size on the reproductive phases and egg production is
also analyzed but only in B. guatemalensis.
5.2.1. Gillnet selectivity
Gear selectivity analyses were performed on Amphilophus citrinellus, Hypsophrys
nicaraguensis, Parachromis managuensis and Brycon guatemalensis. Four nets of mesh size
75, 100, 125 and 150 mm stretch mesh were used (see Chapter 2, Material and methods for
details). Table 38 shows the estimated parameters of the selectivity curves for each species
and the observed and estimated values of the catch. The number of specimens captured for H.
nicaraguensis and P. managuensis in the largest net (150 mm) was very low and thus
abundance was not estimated. The optimum length (OL) and selection factor (SF) estimated
in all mesh size was lower for H. nicaraguensis, followed by A. citrinellus, P. managuensis
and being the highest in B. guatemalensis, and particularly the SF decreases with the
increasing mesh size (Table 38). The differences of SF estimated in the 75 mm mesh size are
smaller between A. citrinellus and H. nicaraguensis (0.5) which are species similar in body
height and shapes, and much higher (1.6) between P. managuensis and B. guatemalensis.
Males of A. citrinellus, H. nicaraguensis and P. managuensis were captured in higher
number in each net during the whole study period (Table 39), except in the case of P.
managuensis in which male and females were captured in similar number in the smaller net of
75 mm (Figure 98). Especially high value was observed in H. nicaraguensis in the 75 mm net.
On the contrary females of B. guatemalensis were more often caught in all gillnets although
sex ratio was, nevertheless more similar than in the other species (Table 39). Figure 98 shows
the catches by month, sex and mesh size (with the 125 ad 150 mm nets pooled as one) for
each species. Males and females catches of A. citrinellus fluctuated without a clear trend, both
PhD-Thesis Fishery ecology, reproduction and management Reproduction in fisheries management
181
along the year and among nets. Similarly H. nicaraguensis catches fluctuated, but showing a
decreasing trend with lower values towards the rainy season of the year, especially in males.
Table 38. Observed parameter of the captured specimens (male and females) and the estimated parameters from
the gillnet selectivity analysis, by mesh size net tested in the Lake Nicaragua.
Mesh size of the net (mm) Species/ Parameters Total 75 100 125 150
Amphilophus citrinellus Observed Number of specimens (♂+♀) 6745 5198 1322 197 28Observed mean length in cm 18.4 21.7 22.5 23.5Size range in cm 11-27 12-29 15-30 19-29Observed modal length in cm 18.0 23.0 23.0 25.0 EstimatedAbundance (A) 8154 5674 1865 612 3Estimated mean length in cm 18.6 20.7 22.4 29.0Standard Deviation 1.869 2.801 1.514 --Optimum length (OL) in cm 17.9 23.8 29.8 35.7Selection factor (SF) for each net 6.142 7.219 5.027 --Selection factor (SF) whole set of net 5.952 Hypsophrys nicaraguensis Observed Number of specimens (♂+♀) 1653 1419 214 18 2Observed mean length in cm 16.7 16.3 17.0 16.0Size range in cm 11-20 12-21 15-18 16.0Observed modal length in cm 17.0 16.0 18.0 -- EstimatedAbundance (A) 2229 1595 634 -- --Estimated mean length in cm 16.7 16.1 -- --Standard Deviation 1.380 1.007 -- --Optimum length (OL) in cm 15.9 21.2 26.5 --Selection factor (SF) for each net 6.661 4.477 -- --Selection factor (SF) whole set of net 5.300 Parachromis managuensis Observed Number of specimens (♂+♀) 724 655 62 6 1Observed mean length in cm 23.2 28.2 31.4 31.0Size range in cm 19-30 20-35 22-35 31.0Observed modal length in cm 23.0 28.0 35.0 -- EstimatedAbundance (A) 871 762 99 10 --Estimated mean length in cm 23.1 27.1 33.2 --Standard Deviation 2.2 2.9 1.3 --Optimum length (OL) in cm 22.8 30.3 37.9 --Selection factor (SF) for each net 7.922 7.382 -- --Selection factor (SF) whole set of net 7.586 Brycon guatemalensis Observed Number of specimens (♂+♀) 2927 1769 929 164 65Observed mean length in cm 29.1 35.6 39.8 41.8Size range in cm 17-48 18-45 22-49 27-51Observed modal length in cm 29.0 34.0 40.0 45.0 EstimatedAbundance (A) 4476 2759 1312 285 120Estimated mean length in cm 29.6 36.0 39.6 45.9Standard Deviation 2.8 4.1 2.8 1.3Optimum length (OL) in cm 26.7 35.6 44.4 53.3Selection factor (SF) for each net 9.517 9.129 8.291 --Selection factor (SF) whole set of net 8.801
PhD-Thesis Fishery ecology, reproduction and management Reproduction in fisheries management
182
For this species catches of both sexes decreased notably in the largest mesh size net.
Somehow a similar pattern is observed in P. managuensis in the 75 mm net where catches of
both sexes decreased during the dry season and the lower catches were observed at the
beginning of rainy season. From that period catches increased at the same level in both sexes,
with unusual high values in October. Different to the observed in cichlids, in B. guatemalensis
female were captured in higher number than males, but the decreasing pattern toward the
rainy season was also observed in both sexes in the two largest mesh sizes nets, while there
was not a clear pattern in the 75 mm net.
Table 39. Average sex ratio (male: female) for each species captured in the Lake Nicaragua and mesh size net.
Sex ratio (♂ : ♀)
Species / Mesh size net 75 mm 100 mm >125 mm
Amphilophus citrinellus 1.4 : 1 3.9 : 1 5.3 : 1
Hypsophrys nicaraguensis 22.8 : 1 4.9 : 1 --
Parachromis managuensis 1.1 : 1 2.3 : 1 --
Brycon guatemalensis 1 : 1.2 1 : 1.5 1 : 1.5
The selectivity curves for the different gillnet combination by species were obtained by
plotting the probabilities of captures against fish size (Figure 99). Differences in width
reflects the fish size range captured and hence the efficiency of the net. The nets captured the
wider size range of A. citrinellus and B. guatemalensis while narrower size ranges were
captured of H. nicaraguensis and P. managuensis.
The size distributions of estimated abundance for the four species, male and female
together, are shown in Figure 100. H. nicaraguensis shows the smaller sizes and narrower
size range but relative high abundance, A. citrinellus and P. managuensis shows similar size
range (10 cm) but towards largest size in the latest. B. guatemalensis is the largest fish among
the four species analyzed, with the wider size range, but also with the largest minimum size
captured. H. nicaraguensis and P. managuensis were most captured in the 75 and 100 mm
nets, A. citrinellus was captured in higher portion in these two nets but also in the 125 mm
nets, whereas B. guatemalensis was captured in all nets. In summary, selectivity factor was
quite different for these species.
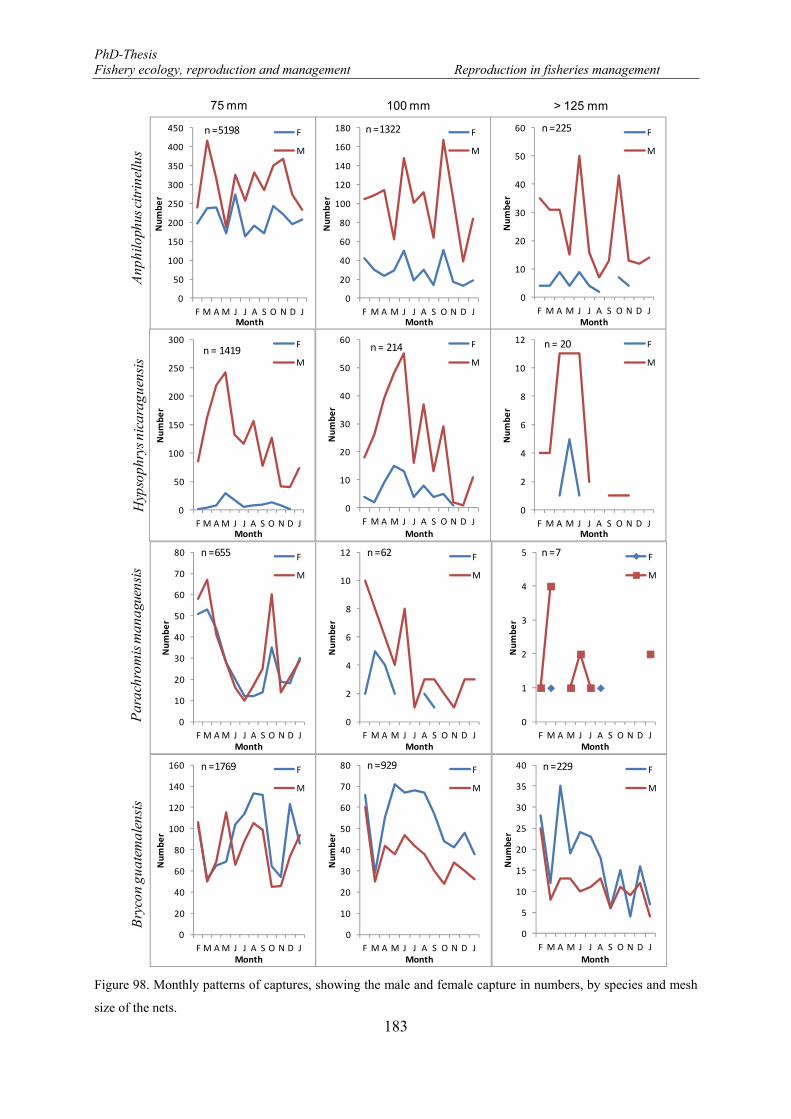
PhD-Thesis Fishery ecology, reproduction and management Reproduction in fisheries management
183
Figure 98. Monthly patterns of captures, showing the male and female capture in numbers, by species and mesh
size of the nets.
0
50
100
150
200
250
300
F M AM J J A S O N D J
Number
Month
F
Mn = 1419
0
10
20
30
40
50
60
F M A M J J A S O N D J
Number
Month
F
M
n = 214
0
2
4
6
8
10
12
F M A M J J A S O N D J
Number
Month
F
M
n = 20
0
50
100
150
200
250
300
350
400
450
F M A M J J A S O N D J
Number
Month
F
M
n =5198
0
20
40
60
80
100
120
140
160
180
F M A M J J A S O N D J
Number
Month
F
M
n =1322
0
10
20
30
40
50
60
F M A M J J A S O N D J
Number
Month
F
M
n =225
0
10
20
30
40
50
60
70
80
F M AM J J A S O N D J
Number
Month
F
M
n =655
0
2
4
6
8
10
12
F M A M J J A S O N D J
Number
Month
F
M
n =62
0
1
2
3
4
5
F M A M J J A S O N D J
Number
Month
F
M
n =7
0
20
40
60
80
100
120
140
160
F M AM J J A S O N D J
Number
Month
F
M
n =1769
0
10
20
30
40
50
60
70
80
F M A M J J A S O N D J
Number
Month
F
M
n =929
0
5
10
15
20
25
30
35
40
F M A M J J A S O N D J
Number
Month
F
M
n =229
Hyp
soph
rys n
icar
ague
nsis
Anp
hilo
phus
citr
inel
lus
Par
achr
omis
man
ague
nsis
Bry
con
guat
emal
ensi
s
75 mm 100 mm > 125 mm
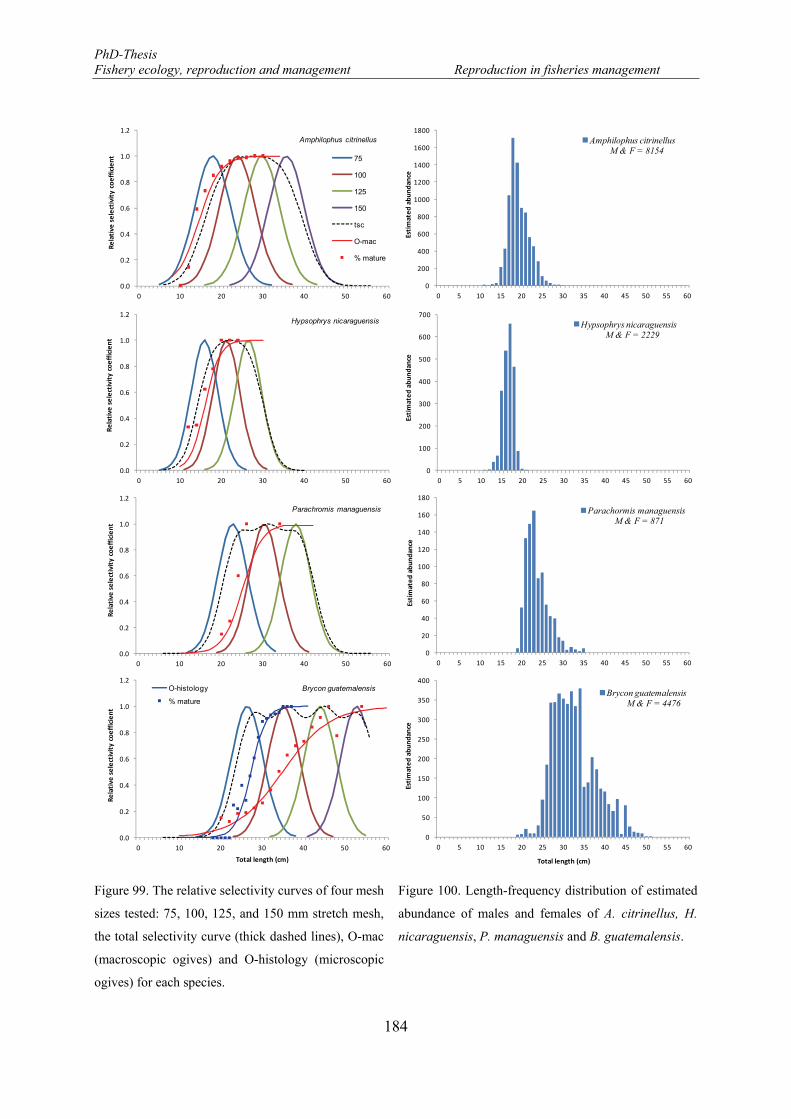
PhD-Thesis Fishery ecology, reproduction and management Reproduction in fisheries management
184
Figure 99. The relative selectivity curves of four mesh
sizes tested: 75, 100, 125, and 150 mm stretch mesh,
the total selectivity curve (thick dashed lines), O-mac
(macroscopic ogives) and O-histology (microscopic
ogives) for each species.
Figure 100. Length-frequency distribution of estimated
abundance of males and females of A. citrinellus, H.
nicaraguensis, P. managuensis and B. guatemalensis.
0
200
400
600
800
1000
1200
1400
1600
1800
0 5 10 15 20 25 30 35 40 45 50 55 60
Estimated abundance
Amphilophus citrinellusM & F = 8154
0
100
200
300
400
500
600
700
0 5 10 15 20 25 30 35 40 45 50 55 60
Estimated abundance
Hypsophrys nicaraguensisM & F = 2229
0
20
40
60
80
100
120
140
160
180
0 5 10 15 20 25 30 35 40 45 50 55 60
Estimated abundance
Parachormis managuensisM & F = 871
0
50
100
150
200
250
300
350
400
0 5 10 15 20 25 30 35 40 45 50 55 60
Estimated abundance
Total length (cm)
Brycon guatemalensisM & F = 4476
0.0
0.2
0.4
0.6
0.8
1.0
1.2
0 10 20 30 40 50 60
Relative
selectivity coefficient 75
100
125
150
tsc
O-mac
% mature
Amphilophus citrinellus
0.0
0.2
0.4
0.6
0.8
1.0
1.2
0 10 20 30 40 50 60
Relative
selectivity coefficient
Parachromis managuensis
0.0
0.2
0.4
0.6
0.8
1.0
1.2
0 10 20 30 40 50 60
Relative
selectivity coefficient
Total length (cm)
O-histology
% mature
Brycon guatemalensis
0.0
0.2
0.4
0.6
0.8
1.0
1.2
0 10 20 30 40 50 60
Relative
selectivity coefficient
Hypsophrys nicaraguensis
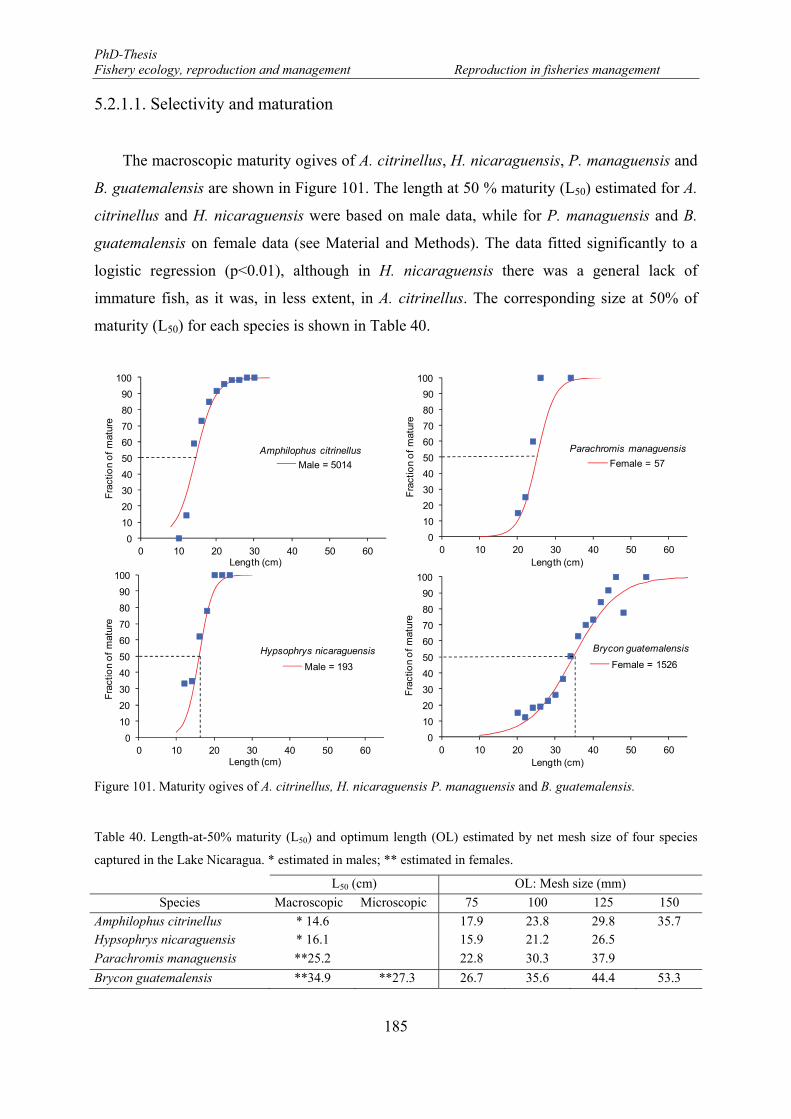
PhD-Thesis Fishery ecology, reproduction and management Reproduction in fisheries management
185
5.2.1.1. Selectivity and maturation
The macroscopic maturity ogives of A. citrinellus, H. nicaraguensis, P. managuensis and
B. guatemalensis are shown in Figure 101. The length at 50 % maturity (L50) estimated for A.
citrinellus and H. nicaraguensis were based on male data, while for P. managuensis and B.
guatemalensis on female data (see Material and Methods). The data fitted significantly to a
logistic regression (p<0.01), although in H. nicaraguensis there was a general lack of
immature fish, as it was, in less extent, in A. citrinellus. The corresponding size at 50% of
maturity (L50) for each species is shown in Table 40.
Figure 101. Maturity ogives of A. citrinellus, H. nicaraguensis P. managuensis and B. guatemalensis.
Table 40. Length-at-50% maturity (L50) and optimum length (OL) estimated by net mesh size of four species
captured in the Lake Nicaragua. * estimated in males; ** estimated in females.
L50 (cm) OL: Mesh size (mm)
Species Macroscopic Microscopic 75 100 125 150
Amphilophus citrinellus * 14.6 17.9 23.8 29.8 35.7 Hypsophrys nicaraguensis * 16.1 15.9 21.2 26.5
Parachromis managuensis **25.2 22.8 30.3 37.9
Brycon guatemalensis **34.9 **27.3 26.7 35.6 44.4 53.3
0
10
20
30
40
50
60
70
80
90
100
0 10 20 30 40 50 60
Fra
ctio
n o
f m
atur
e
Length (cm)
Amphilophus citrinellus
Male = 5014
0
10
20
30
40
50
60
70
80
90
100
0 10 20 30 40 50 60
Fra
ctio
n o
f m
atur
e
Length (cm)
Hypsophrys nicaraguensis
Male = 193
0
10
20
30
40
50
60
70
80
90
100
0 10 20 30 40 50 60
Fra
ctio
n o
f m
atur
e
Length (cm)
Parachromis managuensis
Female = 57
0
10
20
30
40
50
60
70
80
90
100
0 10 20 30 40 50 60
Fra
ctio
n o
f m
atur
e
Length (cm)
Brycon guatemalensis
Female = 1526
PhD-Thesis Fishery ecology, reproduction and management Reproduction in fisheries management
186
For each species the macroscopically estimated L50 and the optimum length (OL) at each
mesh size of the gill nets are presented in Table 40, and L50 are plotted in Figure 99. All L50 of
cichlids felt in the area of the curve where these lengths had more than 80 % probability of
being captured in the 75 mm mesh size. Instead, the L50 estimated for B. guatemalensis had
100 % probability of being captured in the 100 mm mesh size (Figure 99) since both L50 and
OL were similar (Table 40). Considering the maturity ogives based on macroscopic
determination, the higher proportions of immature fishes, within each mesh size, were
captured in the smaller mesh size, i.e., 75 mm, except for H nicaraguensis which higher
proportion of immature were captured in the 100 mm net (Table 41). In mesh size larger than
100 mm this proportion notably decreased, excepting for B guatemalensis that decreased
steadily (Table 41).
On the other hand, considering the estimated maturity ogives obtained by histological
procedures (only for B. guatemalensis, see section 4.2.3), the 75 mm net captures 28.1% of
immature fish, while the proportion of immature captured by the 100 mm net drop to 4.5%
(Table 41). The larger mesh size analyzed (125 and 150 mm) only capture mature fish. The
L50 estimated for B. guatemalensis in 27.3 cm slightly above from the optimum length
(OL=26.7 cm) of being caught estimated for the net of 75 mm mesh, therefore, the L50
estimated fall in the range of 24 to 30 cm at which the net has 80 % efficiency (Figure 99),
confirming that this net is highly efficient in capturing specimen around the L50.
Table 41. Proportion of immature fish captured within each mesh size net of each species, based on macroscopic
and microscopic maturity ogives.
Net mesh size (mm)
Species 75 100 125 150
From macroscopic ogives
Amphilophus citrinellus 19.2 12.1 4.9 0.3 Hypsophrys nicaraguensis 53.3 62.6
Parachromis managuensis 68.0 34.8 3.5
Brycon guatemalensis 74.1 44.7 28.2 8.9
From microscopic ogives
Brycon guatemalensis 28.1 4.5 0.2 0.0
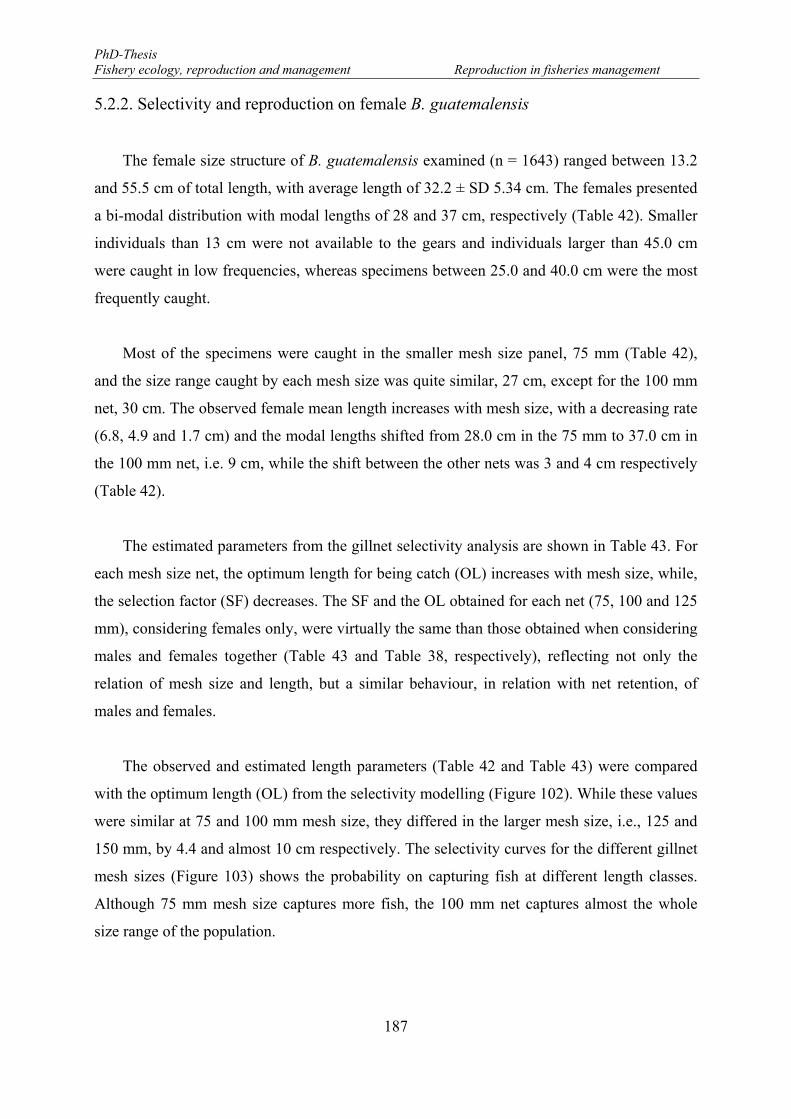
PhD-Thesis Fishery ecology, reproduction and management Reproduction in fisheries management
187
5.2.2. Selectivity and reproduction on female B. guatemalensis
The female size structure of B. guatemalensis examined (n = 1643) ranged between 13.2
and 55.5 cm of total length, with average length of 32.2 ± SD 5.34 cm. The females presented
a bi-modal distribution with modal lengths of 28 and 37 cm, respectively (Table 42). Smaller
individuals than 13 cm were not available to the gears and individuals larger than 45.0 cm
were caught in low frequencies, whereas specimens between 25.0 and 40.0 cm were the most
frequently caught.
Most of the specimens were caught in the smaller mesh size panel, 75 mm (Table 42),
and the size range caught by each mesh size was quite similar, 27 cm, except for the 100 mm
net, 30 cm. The observed female mean length increases with mesh size, with a decreasing rate
(6.8, 4.9 and 1.7 cm) and the modal lengths shifted from 28.0 cm in the 75 mm to 37.0 cm in
the 100 mm net, i.e. 9 cm, while the shift between the other nets was 3 and 4 cm respectively
(Table 42).
The estimated parameters from the gillnet selectivity analysis are shown in Table 43. For
each mesh size net, the optimum length for being catch (OL) increases with mesh size, while,
the selection factor (SF) decreases. The SF and the OL obtained for each net (75, 100 and 125
mm), considering females only, were virtually the same than those obtained when considering
males and females together (Table 43 and Table 38, respectively), reflecting not only the
relation of mesh size and length, but a similar behaviour, in relation with net retention, of
males and females.
The observed and estimated length parameters (Table 42 and Table 43) were compared
with the optimum length (OL) from the selectivity modelling (Figure 102). While these values
were similar at 75 and 100 mm mesh size, they differed in the larger mesh size, i.e., 125 and
150 mm, by 4.4 and almost 10 cm respectively. The selectivity curves for the different gillnet
mesh sizes (Figure 103) shows the probability on capturing fish at different length classes.
Although 75 mm mesh size captures more fish, the 100 mm net captures almost the whole
size range of the population.
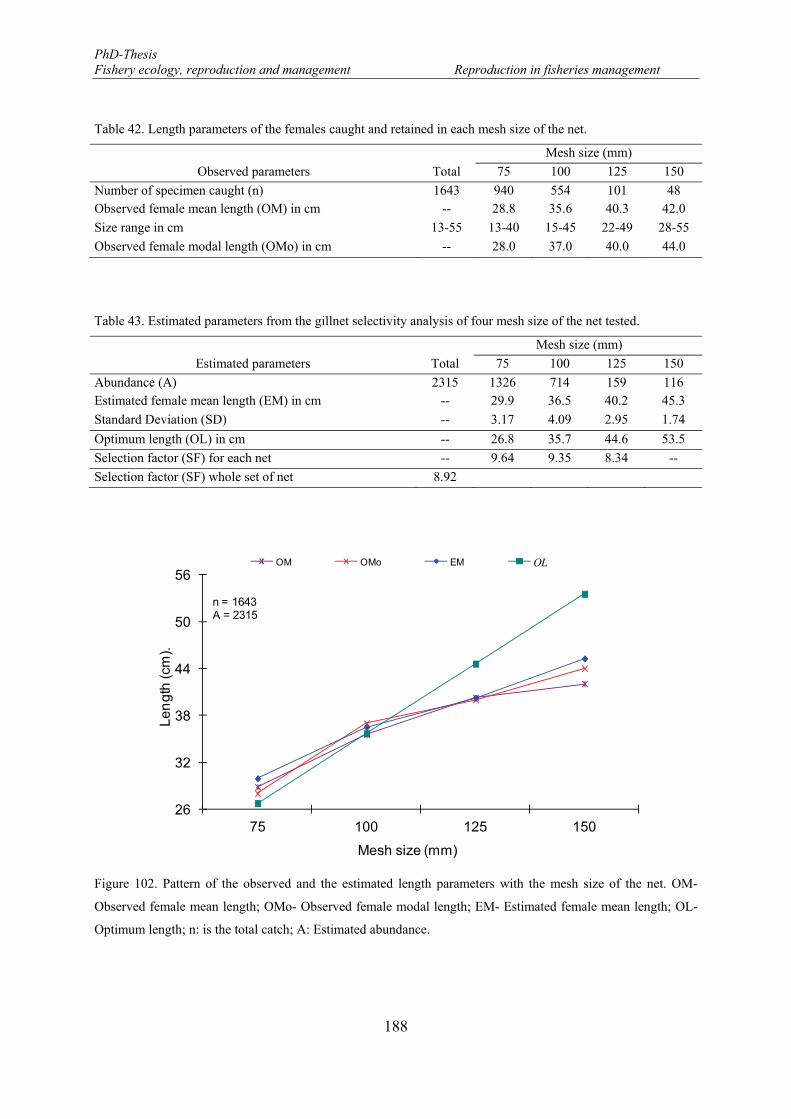
PhD-Thesis Fishery ecology, reproduction and management Reproduction in fisheries management
188
Table 42. Length parameters of the females caught and retained in each mesh size of the net.
Mesh size (mm)
Observed parameters Total 75 100 125 150
Number of specimen caught (n) 1643 940 554 101 48 Observed female mean length (OM) in cm -- 28.8 35.6 40.3 42.0
Size range in cm 13-55 13-40 15-45 22-49 28-55
Observed female modal length (OMo) in cm -- 28.0 37.0 40.0 44.0
Table 43. Estimated parameters from the gillnet selectivity analysis of four mesh size of the net tested.
Mesh size (mm)
Estimated parameters Total 75 100 125 150
Abundance (A) 2315 1326 714 159 116 Estimated female mean length (EM) in cm -- 29.9 36.5 40.2 45.3
Standard Deviation (SD) -- 3.17 4.09 2.95 1.74
Optimum length (OL) in cm -- 26.8 35.7 44.6 53.5
Selection factor (SF) for each net -- 9.64 9.35 8.34 --
Selection factor (SF) whole set of net 8.92
Figure 102. Pattern of the observed and the estimated length parameters with the mesh size of the net. OM-
Observed female mean length; OMo- Observed female modal length; EM- Estimated female mean length; OL-
Optimum length; n: is the total catch; A: Estimated abundance.
26
32
38
44
50
56
75 100 125 150
Le
ng
th (c
m).
Mesh size (mm)
OM OMo EM OL
n = 1643A = 2315
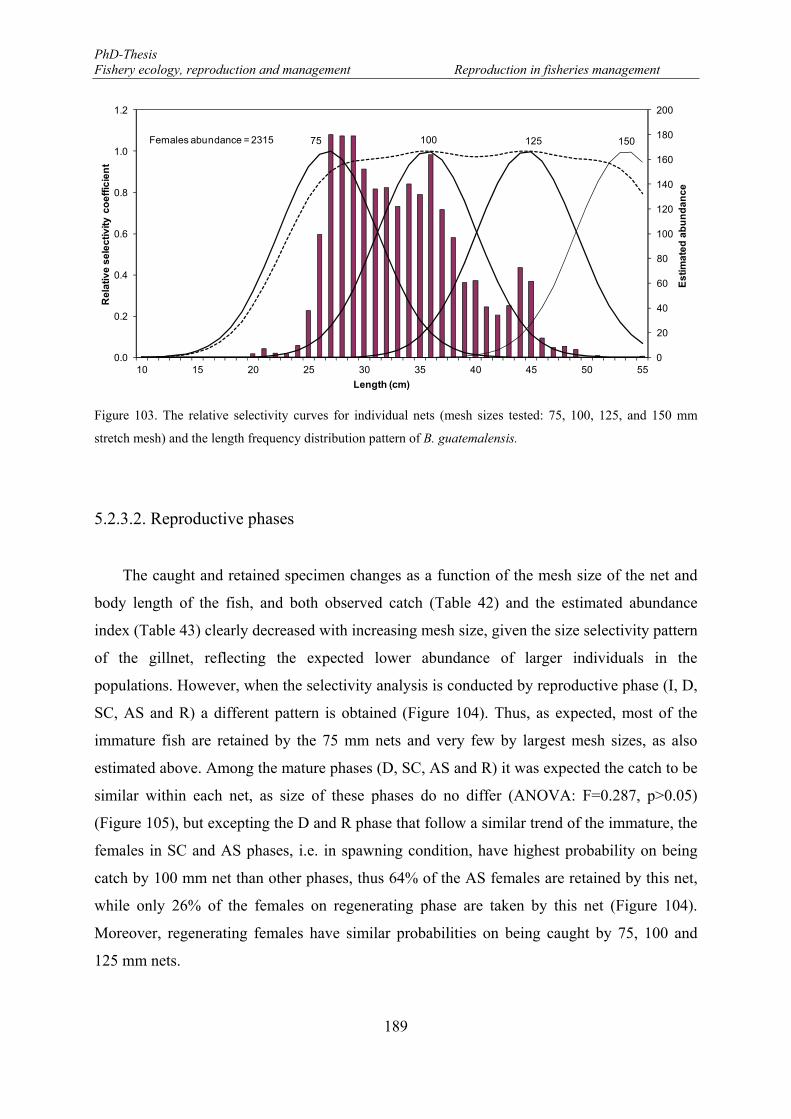
PhD-Thesis Fishery ecology, reproduction and management Reproduction in fisheries management
189
Figure 103. The relative selectivity curves for individual nets (mesh sizes tested: 75, 100, 125, and 150 mm
stretch mesh) and the length frequency distribution pattern of B. guatemalensis.
5.2.3.2. Reproductive phases
The caught and retained specimen changes as a function of the mesh size of the net and
body length of the fish, and both observed catch (Table 42) and the estimated abundance
index (Table 43) clearly decreased with increasing mesh size, given the size selectivity pattern
of the gillnet, reflecting the expected lower abundance of larger individuals in the
populations. However, when the selectivity analysis is conducted by reproductive phase (I, D,
SC, AS and R) a different pattern is obtained (Figure 104). Thus, as expected, most of the
immature fish are retained by the 75 mm nets and very few by largest mesh sizes, as also
estimated above. Among the mature phases (D, SC, AS and R) it was expected the catch to be
similar within each net, as size of these phases do no differ (ANOVA: F=0.287, p>0.05)
(Figure 105), but excepting the D and R phase that follow a similar trend of the immature, the
females in SC and AS phases, i.e. in spawning condition, have highest probability on being
catch by 100 mm net than other phases, thus 64% of the AS females are retained by this net,
while only 26% of the females on regenerating phase are taken by this net (Figure 104).
Moreover, regenerating females have similar probabilities on being caught by 75, 100 and
125 mm nets.
0
20
40
60
80
100
120
140
160
180
200
0.0
0.2
0.4
0.6
0.8
1.0
1.2
10 15 20 25 30 35 40 45 50 55
Es
tim
ate
d a
bu
nd
an
ce
Re
lati
ve
se
lec
tiv
ity
co
eff
icie
nt
Length (cm)
75 100 125 150Females abundance = 2315
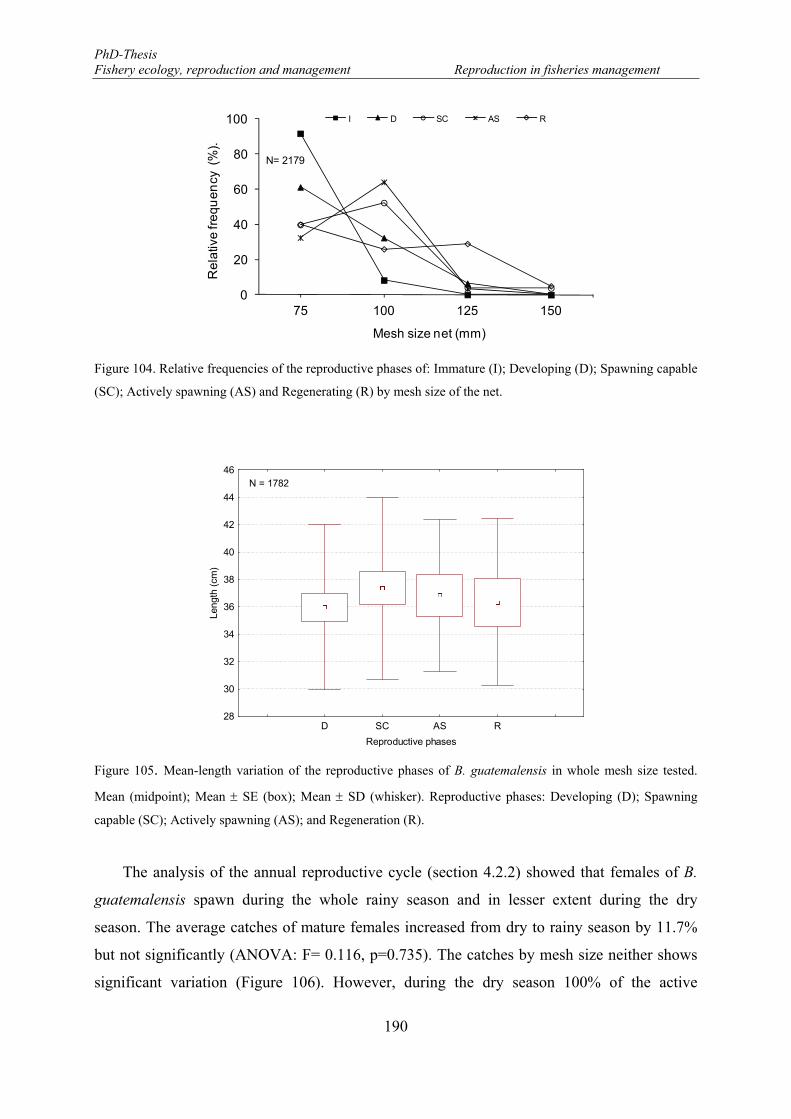
PhD-Thesis Fishery ecology, reproduction and management Reproduction in fisheries management
190
Figure 104. Relative frequencies of the reproductive phases of: Immature (I); Developing (D); Spawning capable
(SC); Actively spawning (AS) and Regenerating (R) by mesh size of the net.
Figure 105. Mean-length variation of the reproductive phases of B. guatemalensis in whole mesh size tested.
Mean (midpoint); Mean SE (box); Mean SD (whisker). Reproductive phases: Developing (D); Spawning
capable (SC); Actively spawning (AS); and Regeneration (R).
The analysis of the annual reproductive cycle (section 4.2.2) showed that females of B.
guatemalensis spawn during the whole rainy season and in lesser extent during the dry
season. The average catches of mature females increased from dry to rainy season by 11.7%
but not significantly (ANOVA: F= 0.116, p=0.735). The catches by mesh size neither shows
significant variation (Figure 106). However, during the dry season 100% of the active
0
20
40
60
80
100
75 100 125 150
Re
lativ
e fr
eq
ue
ncy
(%
).
Mesh size net (mm)
I D SC AS R
N= 2179
D SC AS R
Reproductive phases
28
30
32
34
36
38
40
42
44
46
Leng
th (
cm)
N = 1782
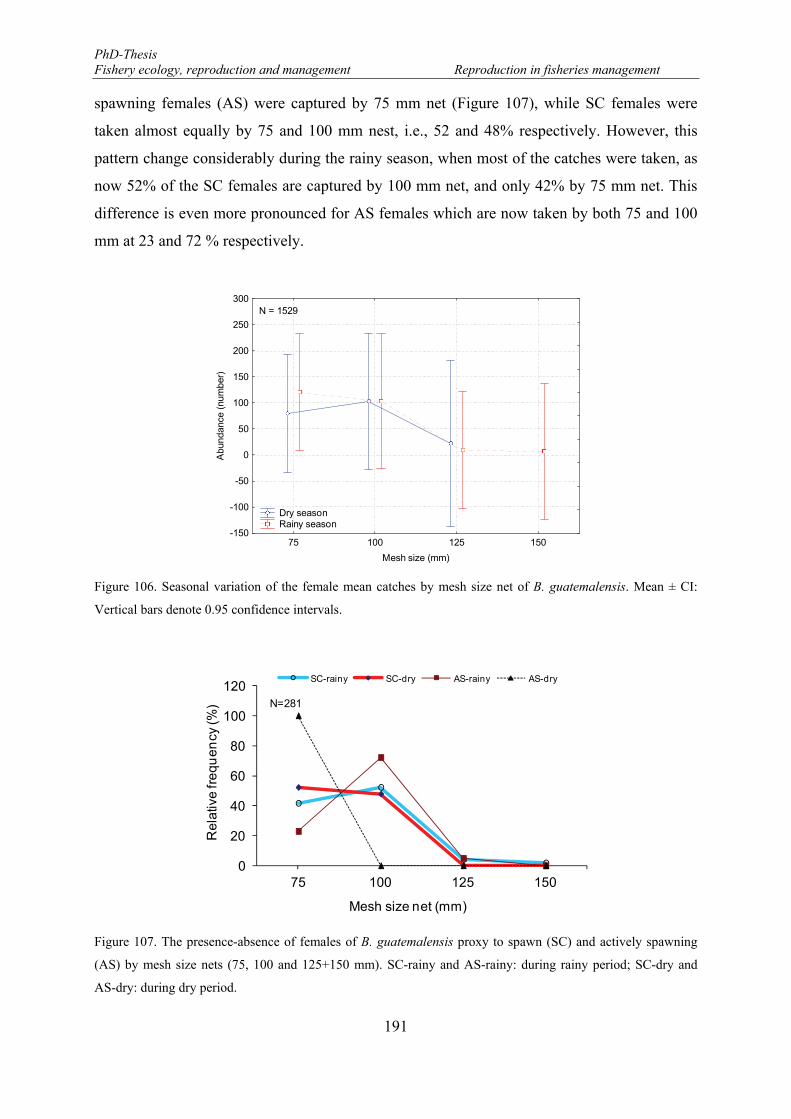
PhD-Thesis Fishery ecology, reproduction and management Reproduction in fisheries management
191
spawning females (AS) were captured by 75 mm net (Figure 107), while SC females were
taken almost equally by 75 and 100 mm nest, i.e., 52 and 48% respectively. However, this
pattern change considerably during the rainy season, when most of the catches were taken, as
now 52% of the SC females are captured by 100 mm net, and only 42% by 75 mm net. This
difference is even more pronounced for AS females which are now taken by both 75 and 100
mm at 23 and 72 % respectively.
Figure 106. Seasonal variation of the female mean catches by mesh size net of B. guatemalensis. Mean ± CI:
Vertical bars denote 0.95 confidence intervals.
Figure 107. The presence-absence of females of B. guatemalensis proxy to spawn (SC) and actively spawning
(AS) by mesh size nets (75, 100 and 125+150 mm). SC-rainy and AS-rainy: during rainy period; SC-dry and
AS-dry: during dry period.
75 100 125 150
Mesh size (mm)
-150
-100
-50
0
50
100
150
200
250
300
Abu
ndan
ce (
num
ber)
N = 1529
Dry season Rainy season
0
20
40
60
80
100
120
75 100 125 150
Re
lativ
e fr
eq
ue
ncy
(%)
Mesh size net (mm)
SC-rainy SC-dry AS-rainy AS-dry
N=281
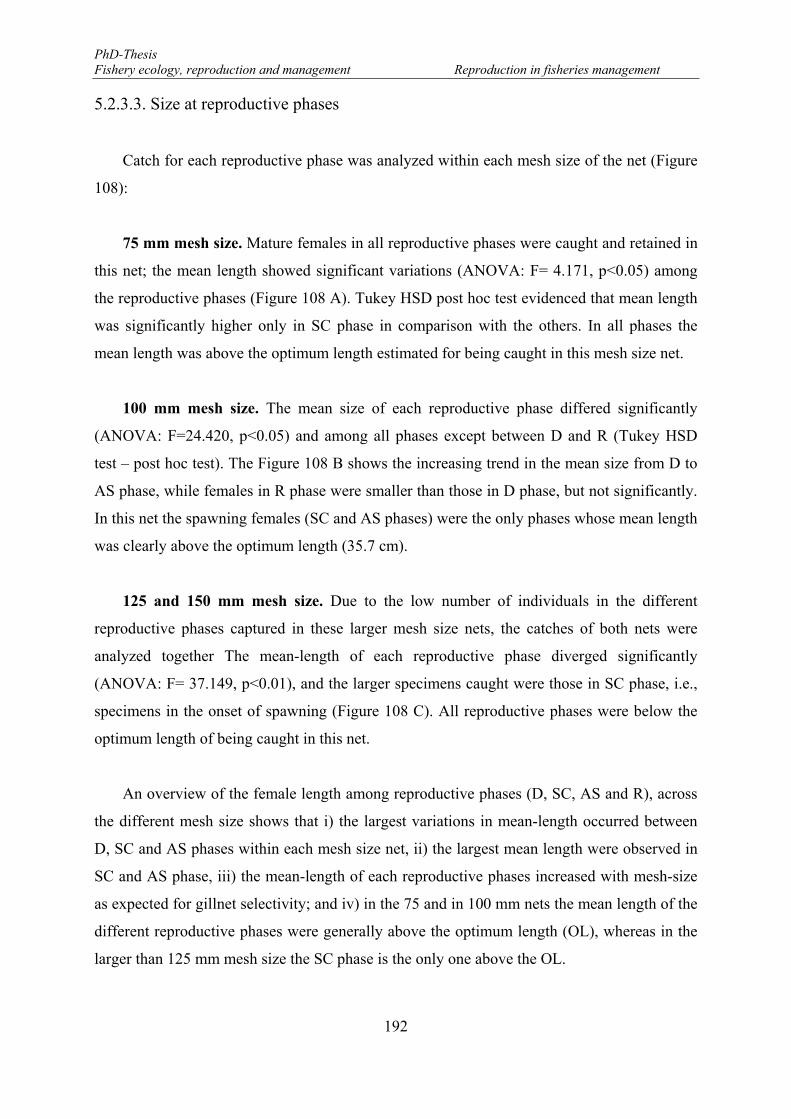
PhD-Thesis Fishery ecology, reproduction and management Reproduction in fisheries management
192
5.2.3.3. Size at reproductive phases
Catch for each reproductive phase was analyzed within each mesh size of the net (Figure
108):
75 mm mesh size. Mature females in all reproductive phases were caught and retained in
this net; the mean length showed significant variations (ANOVA: F= 4.171, p<0.05) among
the reproductive phases (Figure 108 A). Tukey HSD post hoc test evidenced that mean length
was significantly higher only in SC phase in comparison with the others. In all phases the
mean length was above the optimum length estimated for being caught in this mesh size net.
100 mm mesh size. The mean size of each reproductive phase differed significantly
(ANOVA: F=24.420, p<0.05) and among all phases except between D and R (Tukey HSD
test – post hoc test). The Figure 108 B shows the increasing trend in the mean size from D to
AS phase, while females in R phase were smaller than those in D phase, but not significantly.
In this net the spawning females (SC and AS phases) were the only phases whose mean length
was clearly above the optimum length (35.7 cm).
125 and 150 mm mesh size. Due to the low number of individuals in the different
reproductive phases captured in these larger mesh size nets, the catches of both nets were
analyzed together The mean-length of each reproductive phase diverged significantly
(ANOVA: F= 37.149, p<0.01), and the larger specimens caught were those in SC phase, i.e.,
specimens in the onset of spawning (Figure 108 C). All reproductive phases were below the
optimum length of being caught in this net.
An overview of the female length among reproductive phases (D, SC, AS and R), across
the different mesh size shows that i) the largest variations in mean-length occurred between
D, SC and AS phases within each mesh size net, ii) the largest mean length were observed in
SC and AS phase, iii) the mean-length of each reproductive phases increased with mesh-size
as expected for gillnet selectivity; and iv) in the 75 and in 100 mm nets the mean length of the
different reproductive phases were generally above the optimum length (OL), whereas in the
larger than 125 mm mesh size the SC phase is the only one above the OL.
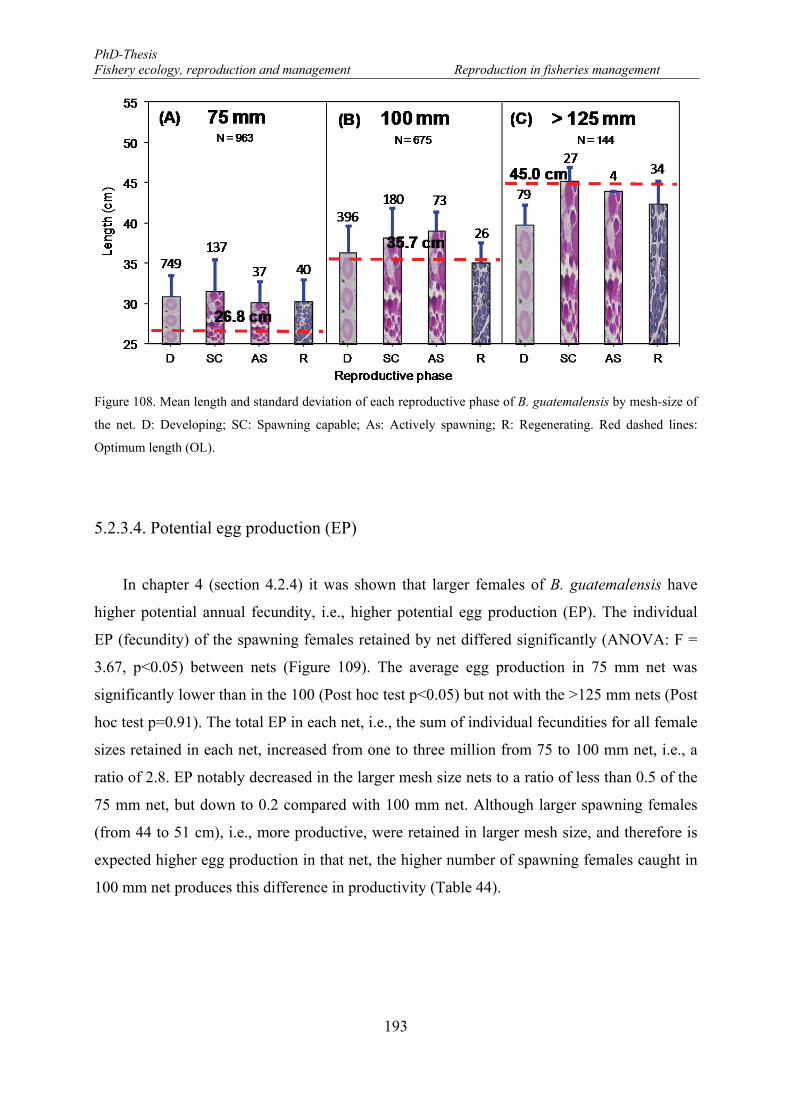
PhD-Thesis Fishery ecology, reproduction and management Reproduction in fisheries management
193
Figure 108. Mean length and standard deviation of each reproductive phase of B. guatemalensis by mesh-size of
the net. D: Developing; SC: Spawning capable; As: Actively spawning; R: Regenerating. Red dashed lines:
Optimum length (OL).
5.2.3.4. Potential egg production (EP)
In chapter 4 (section 4.2.4) it was shown that larger females of B. guatemalensis have
higher potential annual fecundity, i.e., higher potential egg production (EP). The individual
EP (fecundity) of the spawning females retained by net differed significantly (ANOVA: F =
3.67, p<0.05) between nets (Figure 109). The average egg production in 75 mm net was
significantly lower than in the 100 (Post hoc test p<0.05) but not with the >125 mm nets (Post
hoc test p=0.91). The total EP in each net, i.e., the sum of individual fecundities for all female
sizes retained in each net, increased from one to three million from 75 to 100 mm net, i.e., a
ratio of 2.8. EP notably decreased in the larger mesh size nets to a ratio of less than 0.5 of the
75 mm net, but down to 0.2 compared with 100 mm net. Although larger spawning females
(from 44 to 51 cm), i.e., more productive, were retained in larger mesh size, and therefore is
expected higher egg production in that net, the higher number of spawning females caught in
100 mm net produces this difference in productivity (Table 44).
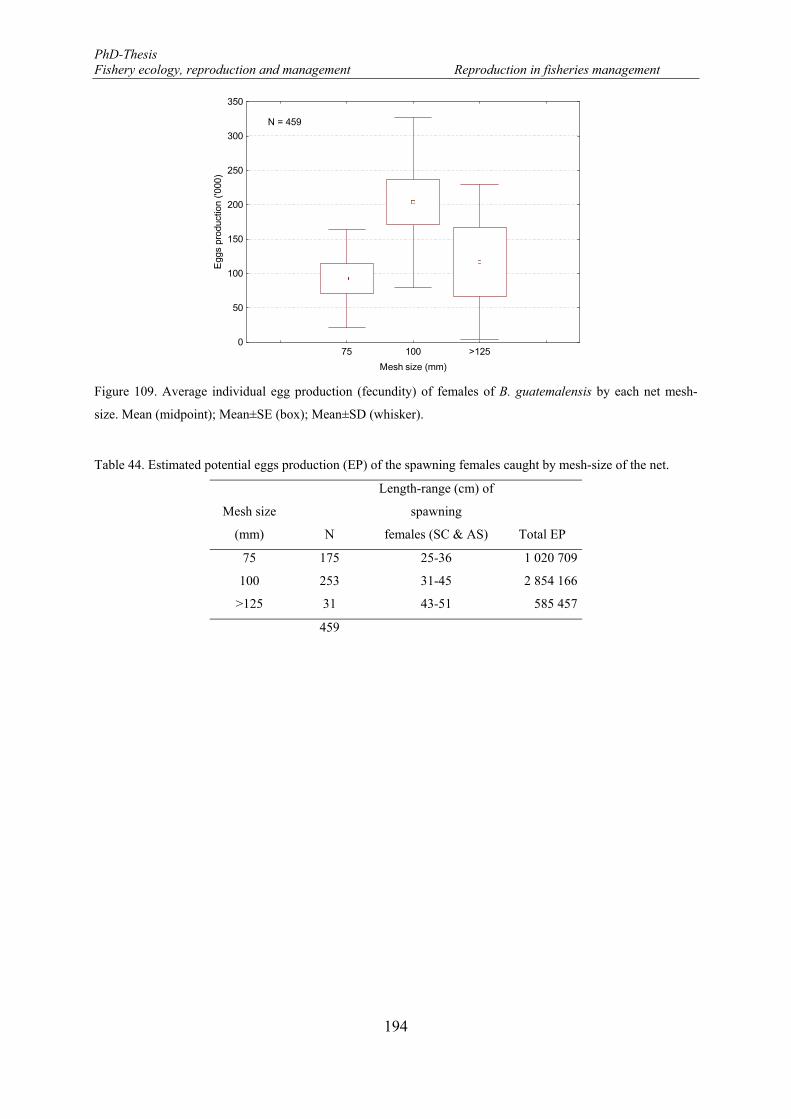
PhD-Thesis Fishery ecology, reproduction and management Reproduction in fisheries management
194
Figure 109. Average individual egg production (fecundity) of females of B. guatemalensis by each net mesh-
size. Mean (midpoint); Mean±SE (box); Mean±SD (whisker).
Table 44. Estimated potential eggs production (EP) of the spawning females caught by mesh-size of the net.
Mesh size
(mm) N
Length-range (cm) of
spawning
females (SC & AS) Total EP
75 175 25-36 1 020 709
100 253 31-45 2 854 166
>125 31 43-51 585 457
459
75 100 >125
Mesh size (mm)
0
50
100
150
200
250
300
350
Egg
s pr
oduc
tion
('000
)
N = 459
PhD-Thesis Fishery ecology, reproduction and management Reproduction in fisheries management
195
5.3. Discussion
Gillnet selectivity
In the present study all selectivity curves were formulated accordance to the “principle of
geometrical similarity” (Baranov, 1948), that produce bell-shaped curves. Each curve cover
up a relative wide but limited fish size range, confirming that gillnet are selective for a certain
size range only (Sparre & Venema, 1998). However, the net selectivity largely differed
among species. Out of the four mesh size tested, the more efficient net in term of catch
abundance of smaller specimens was, as expected, the 75 mm, whereas in terms of catches of
wider range of size-class, the 100 mm mesh size is more efficient, meaning that both induce
high fishing mortality. However, except for B. guatemalensis, most of the fish were retained
in the 75 mm net.
Considering that gillnet is a passive gear, selectivity depend on the probability that the
fish encounters the net and on the probability that the fish is caught and retained by the net
(Hamley, 1975). Gillnet selectivity largely depend on many technical factors intrinsically
related to the fishing gear performance. Therefore, awareness of net construction and design
should be account for. Hovgård & Lassen (2000) consider the major gear parameters for
optimizing research with gillnet in order to choose as efficient a gear as possible are: colour of
netting, dimensions of netting material, types of netting material, hanging ratio and design of
net. All this aspects of net construction may affect the net performance and the interaction
between the net and the fish. The characteristic of the gillnet type used in the present study are
described in Chapter 2.
Net twine colour and thickness induce changes of fish visibility at different water
turbidity level. These affect avoidance behaviour of fish and the probability of catching fish
that swim into the net (Hamley, 1975). Experiments have shown that avoidance decreased
with decreasing light intensity (Parrish, 1969), therefore, is recommend darker nets in good
light or clear water, and lighter nets in turbid water. Visibility of nets can affect their
selectivity, because the reactions of fish to nets colour can changes with growth and species.
Beside, thinner twine can catch many times more fish, but too thin twine may be broken by
large fish (Hamley, 1975). Gillnet selectivity differ between multifilament or monofilament
PhD-Thesis Fishery ecology, reproduction and management Reproduction in fisheries management
196
nylon net because differences in elasticity and flexibility of the net twines. This affects the
probability of holding fish that have swum into the net (Hamley, 1975).
Hanging ratio used in the present study was established in 0.5 (See chapter 2).
Commercial nets typically have a hanging ratio between 0.25 and 0.65 (Hovgård & Lassen,
2000). For research purposes hanging ratio is an important parameter since it may affects gear
selectivity, and usually it should vary from 0.4 to 0.6 (Engås, 1983). Experiments have shown
different results by using different hanging ratio with different targeted species. For example,
the decrease in hanging ratio has resulted in an increase of the number of smaller fish
becoming entangled in the net which is the case of Tilapia mosambica and blue ling (Riedel,
1963; Engås, 1983), while the number of larger perch increased when the hanging ratio
decreased (Mohr, 1965). No changes in length frequencies for roach Rutilus rutilus was
observed when changing hanging ratio. Overall, in several studies higher catch are observed
for the more loosely hung nets. In the species studied in the present work the effect of hanging
ratio has not been evaluated.
Other factors affecting gear performance are the net interactions and saturation. For
selectivity studies the full size range of the fish population need not be covered and fewer
mesh-sizes are therefore necessary in the research gillnet series (Hovgård & Lassen, 2000).
However, multimesh type of net series without separation between nets is not recommended
because fish that are too large to be caught in a mesh size may be led to a more appropriate
mesh-size by the net wall. This violates the fundamental assumption of indirect estimation
that a fish of a particular size has an equal probability of encountering all different mesh-sizes
(Hamley, 1975; Hovgård & Lassen, 2000). On the other hand, for gillnets the importance of
gear saturation appears to be relatively weak (Hovgård & Lassen, 2000). Some studies have
indicated a reduction in CPUE for longer setting times (Kennedy, 1951; Hovgård, 1996).
Engås (1983) compared catches of blue ling (Molva dypterygi) in gillnets lifted at 1, 2 or 3
day intervals and found no differences in catch per day in two experiments whereas a third
experiment showed increasing catch rates with increasing set time. In some others
experiments have not found statistical differences between the catch per hour in the long and
short settings (Hickford & Schiel, 1996).
PhD-Thesis Fishery ecology, reproduction and management Reproduction in fisheries management
197
In the gear selectivity curves the left slope represents smaller fish wedged in the meshes,
while the right slope are largest fish mainly tangled by head parts (Hamley, 1975). However,
in the present study only wedged fish were considered for gillnet selectivity analysis. This is
evinced in the curve normality, since gillnet selectivity curves generally are more skewed to
the right when many fish are tangled (Ishida et al, 1968). Overall size selection ranges
observed in each mesh indicate heterogeneity of sizes in the lake. Selectivity was quite
different among species partly reflecting growth pattern what explains the maximum size
captured in each species, as some of them were virtually not captured by largest mesh sizes.
Overall, the maximum size theoretically retained by the gears used was 50 cm, well above the
maximum lengths recorded for A. citrinellus (41), H. nicaraguensis (25) and P. managuensis
(42), but not B. guatemalensis (55.5). It indicates that the range of mesh sizes used in this
study is suitable to study growth and population dynamics of large fish.
The absence of larger fish in the catches may indicate a migration pattern out of the lake,
but very likely it indicates the expected maximum size of each species within the lake
ecosystem. If fish ageing were possible then mortality curves can be estimated using this
sampling methodology. On the other hand, the fact of the minimum size captured differed
among species must be explained only due to fish shape and/or different behaviour of the life
stages of each species. A. citrinellus and H. nicaraguensis are very similar in body shapes,
having both dorsoventral compressed bodies (Klingenberg, Barluenga & Meyer, 2003).
However, P. managuensis and B. guatemalensis are more rounded fish. To what extent this
difference in fish shape has affected the catch rates of smaller fish should be further
investigated using smaller mesh sizes. Nevertheless, the similar smaller fish sizes in both A.
citrinellus and H. nicaraguensis may indicate similar home range and behaviour, like
swimming, foraging or mating activity, and also that both share similar habitat. Instead, in P.
managuensis and B. guatemalensis, although similar in body shape, the minimum size
differed in the 75 and 100 mm net but not in the 125 mm. According to Ishida (1969) the
condition of a fish affects is girth at abdomen more than a head and small changes in
plumpness affects mostly the left slope. However, changes in body shape in smaller fishes not
only differ at abdomen level but at the head. This apply even for smaller males of cichlid
species as A. citrinellus, which develop a hump on their head during reproductive periods
(Bussing, 2002) that favour its retention in gillnets. However, considering that most of the
fish at these sizes were immature, the lower than expected catches of these sizes can be also
PhD-Thesis Fishery ecology, reproduction and management Reproduction in fisheries management
198
related with fish not being available to the gear. Low availability, which affects catchability,
could be related with a reduced swimming activity or more likely because smaller fish of
these species occupy a habitat not covered by the sampling scheme, as the rocky and
vegetation patches in the lake edges.
On the other hand, the higher abundance of males in each net is related with the sexual
size dimorphism found in adults of these species as males are larger than females in order to
maintain a hierarchical dominance on other males and to achieve best reproductive success as
in A. citrinellus, (Oldfield, McCrary & Mckaye, 2006; Elmer, Lehtonen & Meyer, 2009), H.
nicaraguensis (Bussing, 2002) and P. managuensis (Meral, 1973). Because cichlids
assemblages are highly territorial fishes when begin the breeding season and exhibit
biparental care, females-only care or may switch between these two strategies (Kolm et al.,
2006; Gonzalez-Voyer, Fitzpatrick & Kolm, 2008), during some periods one of the sex (male
or female) might reduce or increase the probability of being caught by the fishing gear. Thus,
the breeding season is protracted in A. citrinellus and H. nicaraguensis, occurring the whole
year although with more intensity during rainy season (Hernández-Portocarrero & Saborido-
Rey 2007). It can be hypothesized that females are less accessible to the gear than males
during the breeding season, i.e., most of the year. In the case of P managuensis, a seasonal
breeding season has been reported (Conkel, 1993) and in consequence males and females
were caught in similar proportions.
Off the cichlids group, B. guatemalensis is the largest fish, and the major abundance
range between 25 and 35 cm length, and different to the previous species, females were larger
than males which explains partially the highest proportion of females in the catches. It may
also be explained by a differential migratory behaviour searching for spawning grounds, or
because changes in body shape due to female gravidity.
In summary, the survey design of our study with the use of four mesh size nets is suitable
to understand population dynamics of large immature and mature fish of each species, but
inappropriate for recruitment analysis. As discussed in Chapter 3 the gillnet catches obtained
in this study reflect abundance of fish stock and cover up a wide size range of immature and
adult population present in the lake.
PhD-Thesis Fishery ecology, reproduction and management Reproduction in fisheries management
199
Among the four species the cichlid A. citrinellus is the most abundant species in the
eastern coastal area of the Lake Nicaragua representing 43 % of the total abundance, followed
by B. guatemalensis (19 %), H. nicaraguensis (11 %) and P. managuensis (4 %). This pattern
of abundance seems to have changed since 1982-1983 years, when Dorosoma chavesi was the
most abundant (55 %) in the coastal area around the lake and in decreasing order followed by
A. citrinellus, H. nicaraguensis, B. guatemalensis and P. managuensis with 12.5%, 6.4%,
1.8% and 0.2 % respectively (Orellana, 1986). However, abundance reported from the
extreme southern side of the lake showed B. guatemalensis as the most important species in
the catches (36 %), followed by A. citrinellus (27 %), Atractosteus tropicus (22 %) and P.
managuensis (0.5 %) (Gadea, 2003) differing also in the order of importance with the present
study in that particular zone.
Mean length caught and retained in the whole gear for A. citrinellus, H. nicaraguensis, P.
managuensis and B. guatemalensis varied from 18.4 to 23.5; 16.7 to 17; 23.2 to 31.4 and 29.1
to 41.8 cm respectively. In the study conducted in the coastal areas around the whole lake in
1982-1983 (Orellana, 1986) cichlids were grouped in Mojarra category (including A.
citrinellus, H. nicaraguensis and A. longimanus) and the mean catches-at-length yielded a
mean length of 26.0 to 24.0 cm in the gillnets monofilament type 75 and 130 mm
respectively. Similar trend was observed here for B. guatemalensis, i.e., 53.0 and 51.0 cm in
both respective mesh sizes. These lengths were not in the size range of being caught with a
high probability in the nets of similar size in the present study, i.e., 75, 100 and 125 mm
tested. In fact in the present study those lengths for Mojarras have less than 40 % and as
higher as 90 % probability of being caught in the 75 and 100 mm net respectively, while B
guatemalensis were in the size range of 80 % probability of being caught and retained in the
150 mm net. The differences of catch-at-length between both studies suggest that A.
citrinellus and B. guatemalensis population in the lake has declined its sizes. Furthermore, the
study carried out along the San Juan River using gillnets with equal mesh size (75, 100, 125
and 150 mm stretch mesh with hanging ratio of 0.6) produced similar results than the present
study, i.e., very low catches of smaller sizes of B. guatemalensis (PROCUENCA-SAN JUAN,
2004) confirming the net selectivity. In most of its catches, Brycon size ranged between 35
and 40 cm. The low number of B. guatemalensis specimens captured in the 125 mm net, with
mean length of 42.0 cm contrast with the higher catches of similar mean length of 43.0 cm
reported in this net by Gadea (2003), who considered this net the more efficient one. This is
PhD-Thesis Fishery ecology, reproduction and management Reproduction in fisheries management
200
probably related with the relative restricted area where that study was conducted, i.e.,
southeast side, since in the present study, also higher abundance (see section 3.2.2.2) and
larger fish were found (section 3.2.4) in that area.
The selectivity results indicate the size at which fish is more vulnerable to be caught.
Those specimens with length close to the optimum length (OL) estimated for each net mesh
sizes are the most vulnerable of being caught and retained. As the fish size departs from this
optimum the probability of capture decreases (Hamley, 1975), i.e., less vulnerable. As
mentioned in Chapter 2, the fishers in the lake use the same mesh sizes as used in our study
and mostly the 75 and 100 mm. The catches-at-length pattern of cichlid species shows that
these are highly vulnerable of being caught (above 90%) in the smallest mesh sizes, i.e., 75
and 100 mm, excepting P. managuensis which slightly reduce its probability of being caught
in the 100 mm to a 80%. Thus a great proportion of the population of these species is
vulnerable to these nets. In B. guatemalensis the larger sizes reduce the probability of being
catch to a 75 % in the 75 mm, i.e., 25 % escapement, indicating an escapement portion of
larger fish to that net. This is not the case of B. guatemalensis, where the population size
range considerably exceeds the sizes captured by each net. Thus, the rate of escapement using
one particular net by fishers is a priori high enough to reduce the vulnerability in this species.
Thus, in the 75 mm net escapement of females larger than 34 cm occur in similar magnitude
(86%) as in the whole population (male and female), i.e., have high probability of
escapement; in larger mesh size (> 125 mm) the escapement portion of females larger than 49
cm is more than 50 %. On the contrary, smaller fishes are not captured by larger mesh sizes
(>125 mm), and thus fish smaller than 39 cm has more than 50 % probability of escapement.
The most vulnerable part of the population of cichlids is males and females in B.
guatemalensis, particularly during reproductive periods. The male-female proportions of each
species obtained in the present study very likely are similar to those in the catches in a routine
fishing operations performed by the fishers in the lake. The pattern of catches have great
implication for species conservation and the sustainability of the fisheries, because the
equilibrium in the sex ratio can be severely altered and consequently the potential
reproductive ratio (PRR) of some species may be directly affected, e.g., parental care in
cichlid groups where male play an important role, and the spawning stock biomass in B.
guatemalensis.
PhD-Thesis Fishery ecology, reproduction and management Reproduction in fisheries management
201
Length at 50% maturity
Fish body size is a key component on life history determining the ecological processes of
a species. Changes in size distributions may have many causes, but fishing is considered one
of the most important factor because is always size-selective (Shin et al., 2005). In most
fisheries larger fish in the stock, probably being the mature one, are the main target, and this
is thought to modify the size structure and functioning of fish assemblages, with
consequences for productivity and resilience of some stocks (Shin et al., 2005). The size
distribution, i.e., length frequency distribution, of fish assemblages derived from surveys such
as mean length in a population, mean length in a community, mean maximum length in a
community, length at maturity, are used as size-based indictor (SBI) and may provide a
relevant integration of the effects of fisheries on community structure and processes (Shin et
al., 2005). SBIs are typically used to describe the response of communities or individual
populations to exploitation (Garcia et al., 2003). Maturity ogives and the corresponding size
at 50% maturity are commonly used in fisheries management in many ways, but mostly to
estimate spawning stock biomass and to establish a minimum landing size (MLS), and often
biological reference points (RP) or references direction of changes (RD) are also based on
these estimations. Shifts in maturation severely determine the population dynamics (Saborido-
Rey & Trippel, 2013). In data limited stocks L50 can be critical to establish size-based
indicators (SBIs) as management procedure (Shin et al., 2005). As reference point (RP) for
SBIs, length higher than mean length at maturity have being suggested to ensure that at least
half the individuals of a cohort caught have had a chance to spawn at least once (Caddy &
Mahon, 1995). This measure should be accompanied with mesh size regulation used for
exploited stocks, since it objective are in line with the establishment of the RP. Jones (1984)
indicates two important objectives of mesh size regulation. One of the objectives is to
conserve the spawning stock, and by that a suitable choice of mesh size should reduce the rate
of capture of juveniles, and make it more likely that an individual will survive to the size of
first maturity and have an opportunity of spawning at least once. The second important
objective is to increase the long-term sustainable yield, and by that to conceive of an optimum
exploitation pattern, or harvesting strategy, which leads to the optimum yield per year class.
The estimated female L50 for H. nicaraguensis, A. citrinellus and P. managuensis, based
on macroscopic determination, 16.1cm, 14.6 cm and 25.2 cm respectively, were too close to
PhD-Thesis Fishery ecology, reproduction and management Reproduction in fisheries management
202
the optimum length (OL) of the 75 mm mesh size gillnet. Only in the case of A. citrinellus
optimum length was above L50. This indicates that this mesh size may be adequate for these
species, although some vulnerability to recruitment overfishing will exits, especially in the
case of H. nicaraguensis where the entire size range of the population is taken by this mesh
size net. Different L50, macroscopically determined, has being reported for H. nicaraguensis
and A. citrinellus, i.e., 12.5 cm and 16.0 cm, respectively (Orellana, 1986). These differences
may indicate temporal changes in maturity, but can be also the consequence of the uncertainty
when using macroscopic maturity stage, as discussed below.
In the case of B. guatemalensis the estimated L50 was 34.9 cm, well above the OL
obtained for 75 mm mesh size and only slightly below the 100 mm mesh OL. Clearly, and
according to traditional fisheries management, the 75 mm net is inadequate because it may
produce growth overfishing, but yet, some vulnerability to the 100 mm mesh size net exits in
this species. However, the microscopic maturity ogives produced a L50 estimated in 27.3 cm,
i.e., considerably smaller than the macroscopic and now closer to OL of the 75 mm mesh size.
Fish on the size of 50% maturity has 100 % probability of being caught and retained in this
net. In any case the L50 falls in the range of 24.0 to 30.0 cm at which the net has 80 %
efficiency. However, the efficiency of this net for fish about 20 cm drops considerably,
protecting the mature stock of the population, but with risk of growth overfishing. Therefore,
when considering the four species together and from a traditional fisheries management
perspective, the 75 mm mesh size gillnet may become hazardous and subsequently its use for
fishing operation should not recommended and larger mesh size nets should be considered.
Thus, the minimum landing size of the species should be larger than L50 estimated.
L50 is an important parameter to track maturation temporal shifts in a population and an
important predictor of the risk of overexploitation (Reynolds et al., 2005). Therefore, the
accuracy of its estimation is critical for the conservation of exploited fish stocks (Hannah,
Blume & Thompson, 2009). The few data on length at maturity of fish stock from the Lake
Nicaragua used for establishment of minimum landing size have been based on macroscopic
(visual) assessment of ovary condition. However, there is abundant evidence that histological
evaluation of ovarian thin-sections is much more accurate (Lowerre-Barbieri et al., 2011b,
and reference therein). The current management measures should be revised based on more
PhD-Thesis Fishery ecology, reproduction and management Reproduction in fisheries management
203
reliable biological information. Yet, ontogenic maturity should not be the only life history
parameter that should be considered in fisheries management.
Considering the uncertainties in the different L50 macroscopically estimated for A.
citrinellus, H. nicaraguensis and P. managuensis, the correspondent estimated mean length
(from selectivity analysis) caught in the 75 mm mesh size, as closer sizes to L50, is
recommended as reference direction of changes (RD) for monitoring landing size in those
species, i.e., 18.6, 16.7 and 23.1 cm, respectively. This RD can be used while a biological
reference such as a more precise L50 estimation is obtained. For B. guatemalensis, the L50
microscopically determined (27.3 cm) can be used as RP due to the accurate of its estimation,
and considering 20 % increase over the size at maturity, a 30 cm minimum landing size
(MLS) is recommended. The recommended MLS for B. guatemalensis would have 40 %
probability of being caught in the 100 mm mesh size net.
Reproductive behaviour
The traditional gear selectivity analysis focus on the fish size range caught and retained,
and a direct comparison with the minimum landing size (MLS) fixed for a species in
particular. This MLS is sometimes based on some biological information, as discussed above.
However, this approach considers the physical characteristics of the fishing gear and the size
of the fish only, but leaves aside the fish behaviour which also affects the fish catches
(Arreguín-Sánchez, 1996). For example cichlid A. citrinellus is known to be territorial fish
during breeding season (McKaye & Barlow, 1976), and among cichlidae family some species
exhibit biparental care, female-only care, as well as some that may switch between these two
strategies (Kolm et al., 2006; Gonzalez-Voyer et al., 2008). This indicates that during these
periods one of the sexes, reduce considerably its spatial activity or home range, and very
likely reducing also the probability of being caught by a passive fishing gear, as gillnets. It
might produce a sex-dependent catchability, i.e., the interaction between the resource
abundance and the fishing effort (Arreguín-Sánchez, 1996), and hence a higher fishing
mortality in one sex if fishing mortality remains constant during these periods. Estimation of
sex ratio, to be used for stock assessment for example, should consider fish behaviour to
avoid bias, especially, but not only, if estimated from fishery data.
PhD-Thesis Fishery ecology, reproduction and management Reproduction in fisheries management
204
Reproductive activity of species analyzed here take place mostly during rainy season,
both for cichlids (Hernández-Portocarrero & Saborido-Rey, 2007) and in B. guatemalensis
(section 4.2.2), in the latest species with major intensity in July and August. The selectivity
analysis conducted by reproductive phase showed the catch composition of B. guatemalensis
in the different gillnets changes depending on female size but also in relation to the
reproductive phase of the female. Thus, unexpectedly the 100 mm net resulted to be the more
efficient net in removing the spawning females (SC and AS phase) from the mature stock, i.e.,
among all mesh size nets used, this is the one catching more spawning females, while females
in developing and regressing are mostly, and expected, caught in 75 mm, even though catches
in the 75 mm shows more uniformity in females size. The reason behind this may be related
to the body shape of the females, well because they are gravid or because its condition,
producing a higher retention in gillnets of that mesh size (McCombie & Berst, 1969). Both
would affect its girth at abdomen more than in the head (Ishida, 1969).
Potential egg production (EP)
The reproductive studies on B. guatemalensis (see section 4.2.4) have demonstrated that
its potential fecundity (Fp) increases allometrically with female length, with an allometric
coefficient significantly larger than 3, i.e., larger females produce more eggs than the body
biomass predicts. Moreover, larger females produce larger eggs too, which might be an
indicative of better egg quality and highest survival rate (Saborido-Rey, Murua & Macchi,
2011 and references therein). In summary, larger females own larger reproductive potential
and hence contributing unequally to future recruitment and the sustainability of the fishery
(Saborido-Rey & Trippel, 2013 and references therein).
The maintenance of the spawning stock biomass (SSB) has been considered one of the
key factors to produce sufficient recruitment to the fisheries, since the stock-recruitment
relationship imply that spawners biomass influence the recruitment (Myers & Barrowman,
1996), under the assumptions that SSB is an index of egg production (Beverton & Holt,
1957). However, this assumption has been widely invalidated (Saborido-Rey & Trippel, 2013,
and references therein) and the concept of stock reproductive potential (SRP, Trippel, 1999)
has often replaced SSB. Several SRP indexes have been developed, but undoubtedly, total egg
production (TEP) is a better estimate of a stock’s reproductive output than the less sensitive
PhD-Thesis Fishery ecology, reproduction and management Reproduction in fisheries management
205
SSB (Marshall, 2009). There is recent and increasing evidence that variations over time in
stock structure, sex ratio, fish condition, growth rate, maturation and fecundity produce large
variability in TEP (Saborido-Rey & Trippel, 2013, and references therein). In determinate
fecundity species, like B. guatemalensis, annual TEP can be estimated from the spawning
stock size structure, i.e., female abundance at each size class, and the potential fecundity at
size (Murua & Saborido-Rey, 2003).
The impact of fishing gear on the stock egg production has been seldom studied; and even
more rarely in gillnets used in small-scale fisheries. In the present study it was shown that the
75 mm net catches a higher proportion of smaller spawning females, very likely recruit
spawners, i.e., those that have matured in the year in course. These are less experienced
females having an earlier spawning cessation (see section 4.2.3), but more importantly being
less productive in terms of egg production and egg quality. However, our study demonstrates
that the 100 mesh size net is more harmful in terms of egg production removal, since it causes
the highest fishing mortality among the more productive spawning females stock. Additional
benefits of the larger individuals in a population have been mentioned as the enhancement of
the survival and reproductive success of the next generation, and that young fishes learn the
route to spawning aggregation by following the more experienced adults (Birkeland &
Dayton, 2005). The importance on conserving stock reproductive potential allowing larger
fish to survive is crucial in fishery management and has been demonstrated essential in
marine fishes (Berkeley et al., 2004a; Bobko & Berkeley, 2004; Birkeland & Dayton, 2005;
Saborido-Rey & Trippel, 2013, and references therein). Our results are in line with these
evidences as larger female B. guatemalensis has longer spawning season and higher
reproductive potential.
The catchability coefficient is defined as the proportion of individuals in a fishing ground
of a certain size removed by a gear with some efficiency (Gulland, 1983), thus considering
the physical characteristics of the fishing gear in relation to the size of the fish alone.
However, our findings suggest that this coefficient should also consider the fish reproductive
performance. The spawning females seems less vulnerable to the smallest net, i.e., 75 mm due
to differences between the optimum length (OL) and the mean length of each reproductive
phase, whereas in the larger mesh size than 125 mm net, the low vulnerability of those
females is due mainly to size selectivity. However, the 125 mm net produces a very low yield

PhD-Thesis Fishery ecology, reproduction and management Reproduction in fisheries management
206
(catch rate) clearly inadequate for a profitable fishery. On the other hand, the 100 mm net
efficiently protect juveniles and recruit spawners, avoiding growth overfishing, but it captures
with great efficiency very productive females. These findings indicates that to increase the
egg production of the females stock and to reduce the fishing mortality of young females, a
compromise between the use of one or another mesh size should exits depending on the
management strategy. It is advisable to use the 100 mm net during dry season protecting
recruitment and females in the onset of the ontogenic maturation, but switching to 75 mm bet
during the rainy season, especially in July and August when spawning activity of B.
guatemalensis is higher, and hence protecting females with larger reproductive potential. This
management measures would be in agreement with the biology of the species and may
provide stock sustainability.
207
CHAPTER 6: Concluding Remarks
Abundance, distribution and movement patterns
The ichthyic population structure in the lake shows long-term changes since the 70´s
reflecting very likely changes in exploitation pattern as well. By the 70´s, Guapotes
(Parachromis managuensis and Parachromis dovii), Snook (Centropomus parallelus), Shark
(Carcharhinus leucas) and Sawfish (Pristis perotteti) were the target of the fishery and hence
highly exploited-, whereas Gaspar or Gar (Atractosteus tropicus), Mojarra (Amphilophus
citrinellus, Hypsophrys nicaraguensis) and Machaca (Brycon guatemalensis) were less
exploited because their low commercial importance (Davies & Pierce, 1972). By the 90´s, the
overexploitation of the big fishes, and in particular Shark and Sawfish, and the symptoms of
overexploitation of Snook and Gar forced changes in the fish exploitation and
commercialization patterns. Currently all the species listed above, excepting Shark and
Sawfish, are the main target of the fishery. In addition, fishing effort pattern showed
important changes also. Although the total number of fishers remained similar, the time spent
in fishing activity increased, increasing therefore the fishing effort. Thus, the number of
fishers operating in the lake did not substantially changed from 1972 when 600 fishers were
registered (Davies, & Pierce, 1972) to 2002 when 762 were registered (ADPESCA/AECI
2002), neither the fishing techniques. However, by 1972 fishing was a part-time activity
because fishers often shifted seasonally from agriculture to fishing; in recent times they
permanently dedicate to the fishing activity, increasing the annual total number of fishing
hours. This change in fish exploitation pattern is thought to have induced a pressure on fish
stocks in the lake that led to overexploitation and to a lack of recovery of the resources.
The research surveys carried out in the lake allowed to detect those long-term changes in
the fish population structure, but when conducted on monthly basis, as done in this study, they
also detect short-term changes as spatial and vertical changes between “shallow benthic”
habitat (coastal zones: from 3.7 to 9.1 m depth) dominated by Dorosoma chavesi, and “deep
benthic” habitat (central zone of the lakes: from 12.8 to 16.5 m depth) dominated by Rhamdia
spp (Koenig et al., 1976; Orellana, 1986), between zones of the southeast quadrant (Gadea,
2003) and along the San Juan River (PROCUENCA-SAN JUAN, 2004). In the present study
spatio-temporal changes in population structure have been shown both horizontally, i.e., along
PhD-Thesis Fishery ecology, reproduction and management Concluding remarks
208
the “coastal area” and vertically, i.e., between depths. Short-term migrations seems to be
connected with the fish life history, moving across different habitats during their life span
according to their habitat affinity and by environmental factors, in particular the rainfall that
affects the water level, the flooding areas and hence the existence of different habitats suitable
for feeding or reproduction. These movements can be described as follows: a. Movements
within shallowness areas or “coastal areas” of the lake, that occur along its larger axis
between rocky and /or muddy areas, which is exhibited by some cichlid (Mojarras) species as
Amphilophus sp; b. Movement between the shallow waters and open water (central zone of
the lake or deeper zones) observed in Moga, H. nicaraguensis; c. Movements from the rivers
to the lake, both shallow and open waters, and viceversa, which are characteristic of species
with migratory habits as Machaca, B. guatemalensis; and d. Movements that imply fish
migration in and out of the lake toward the Caribbean Sea, during which fish cross four
different habitats as mentioned, the Caribbean Sea, the San Juan River, the lake shallower
areas and finally the open water in the lake. This last movement type is characteristics of
those fishes with marine affinity, among others Sabalete, Dorosoma chavesi; Guavina,
Gobiomorus dormitor; Snook (Robalo), Centropomus parallelus; and Roncador, Pomadasys
croco.
Freshwater fish exhibit home range or homing affinities, daily or seasonal movement
pattern or longer-distance migrations, reflecting the autecology of the species in the search for
optimal environmental conditions (Matthews, 1998). The different movement patterns
described in the species inhabitant the lake are manifested in their spatiotemporal variations
of the abundance and size distribution. The Cichlids covered in this study, A. citrinellus, H.
nicaraguensis and P. managuensis, and the Characid B. guatemalensis (Characidae family)
are widely distributed in the eastern part of the Lake Nicaragua. The more deterministic
factors influencing the spatial distribution of cichlids species was depth and latitude, i.e.,
macro-zones. These species were more abundant in shallower waters of the southern and
northern zones. While season and depth were the main factors influencing abundance of B.
guatemalensis, which largest abundances were found in the southeast and northwest side,
during both dry and rainy seasons, but highest abundances occurred in rainy season at
shallower waters, and lower abundance in the central zones. Seasonality strongly modulates
the migratory behaviour of B. guatemalensis from rivers to the lake environment and vice
versa. During rainy season it is allocated near the river drainage of both outermost zones, i.e.,
PhD-Thesis Fishery ecology, reproduction and management Concluding remarks
209
southeast and northwest, while in dry season its major abundance are found upstream in the
tributary San Juan (PROCUENCA-SAN JUAN 2004). Although depth is a significant factor
influencing the distribution pattern of the four species, its importance vary with the hydro-
periods fluctuations (Fernandes, Machado & Penha, 2010) that in lakes occur moderately
(Welcomme et al., 2010). The greater the depth of the water body, the greater the hydro-
period and, therefore, the greater the time available for processes of extinction or colonization
of the species in the assemblage (MacArthur & Wilson, 1967).
There was a clear spatial size distribution in all studied species. Larger fishes are found in
the southeast and to a lesser extent in the central zone of the lake, whereas in the northwest
area the individuals were smaller. In spite of fishes are unevenly distributed, in size, the
number of fishers is similar among areas (CETMAR, 2005). On the other hand, larger fish are
found in the deeper waters studied (3-5 m), while smaller sizes are found in shallowest water,
excepting for P. managuensis which larger size has preferences for shallower water (1-3 m).
This overall pattern of smaller size fish inhabiting in shallower waters is in line with previous
studies covering the entire lake (Orellana, 1986), which indicates that recruitment not only
occur in the lake, but very likely linked to the shore. Considering that the area surveyed
overlapped with the traditional fishing ground and the fishing gear used is the same as those
used by fishers, very likely the size composition of landings should be similar with the size
distribution found in this study. Thus the size composition in the landings should range
between 13 and 18 cm in H. nicaraguensis; 18 and 23 cm in A. citrinellus; 21 and 27 cm in P.
managuensis and 26 and 38 cm in B. guatemalensis. Differences in fish abundances and sizes
along the eastern side of the lake reflect the presence of different ecosystems and the rivers
influence, since higher abundances and larger fish are found in areas of river drainages. Very
likely the reason for this is the high nutrient load of these areas (PROCUENCA-SAN JUAN,
2004). However, fish reproductive behaviour also determines the distribution and abundance
patterns in this part of the lake. Although cichlids apparently do not undergo major
reproductive migration, they move to colonize rocky areas along the shore, disperse in the
whole area or even move into tributary rivers (Lowe-McConnell, 1999). On the contrary B.
guatemalensis display strong migratory behaviour from the lake into tributary rivers and vice
versa (Drewe et al. 2003; Horn, 1997; McLarney et al. 2010). This is confirmed in our study,
that shows also a connection between the migratory behaviour and reproduction which occur
mainly during rainy season.
PhD-Thesis Fishery ecology, reproduction and management Concluding remarks
210
The Lake Nicaragua is a very dynamic ecosystem influenced by strong winds during dry
season and by high precipitation and river discharge during rainy season. The Papagayo wind
shrieks over the lake from October to March (NASA SeaWIFS 2000-2001) affecting the
entire water column of the eastern side due to the shallowness of this area These factors cause
periods of different water stability and consequently induce periods of presence-absence of
particular species in the shallower area. This probably affect the behaviour of the species, e.g.,
instability in cichlids might induce sheltering until weather conditions improves, which is
reflected in a lower abundance; excepting in P. managuensis which average abundance is
higher; on the contrary, in B. guatemalensis it may induce an erratic migration pattern that is
reflected in the monthly pattern of abundance. On the other hand, from April to October the
strong wind effects over the lake disappear and rainy season start (in May). It produces a rise
of lakes water level and consequently depth increase, as well a nutrient enrichment from
rivers runoff (PROCUENCA-SAN JUAN, 2004). In this new situation, changes in species
distribution may take place for feeding and/or reproduction. For example, feeding is known to
induce temporarily changes in H. nicaraguensis, from rocky affinity, to searching for food in
open waters (Conkel, 1993) and the lower abundance in the study area may reflect this
behavior. In the case of B. guatemalensis the gently and sustained increase of abundance
during rainy periods may reflect massive migrating pattern through shallow areas.
All of the above shows the ecological importance of the shallowness areas, along the
shoreline of the lake. They are the key habitat for shelter, reproduction and breeding of
territorial fishes, and the main path for potamodromous fish that migrate from tributary rivers
to deeper water of the lakes and for diadromous fish that migrate between the coastal
Caribbean Sea and the lake. Therefore, this corridor should be considered as buffer or
transitional zone for sustainability of fish assemblages.
Implications in fisheries and lake management
Fishing mortality over immature fish seems to be very limited in the lake given the gillnet
selectivity estimated in our study. However, environmental modifications and in particular
alteration of the shoreline, constitutes a clear threat to the whole population, but in particular
to the juvenile stock and recruits that take advantage of the shallower waters. Thus, in order to
PhD-Thesis Fishery ecology, reproduction and management Concluding remarks
211
promote a sustainable fishery and given the characteristics of the Lake Nicaragua fishery and
environment, management actions should not be based alone on the classic fishery
management. Regulating catch and effort, temporal and/or spatial closures, fish size
limitations, gear restrictions and other measures are still important but yet not sufficient. It is
desirable to restock vulnerable and valuable native species to improve recruitment or to
maintain productive species. Also it is desirable the removal of unwanted species such as
recent reported invasive pez Diablo of the Loriicaridae family which is know responsible for
high ecologic impact in freshwater environments (Marenco, 2010). But overall the protection
of the habitats, especially the shoreline and including the water quality, is essential to
maintain healthy fish populations, and hence an integrated management approach should be
taken.
Changes in the water quality is the major driver of lake ecology and shifts in water
transparency and dissolved oxygen regimes (Welcomme et al., 2010), and processes of
eutrophication is one of the most important management problem facing conservationist today
(Maitland & Morgan, 1997). The trophic state of the Lake Nicaragua has changed from early
eutrophic (waters rich in mineral and organic nutrients that promote a proliferation of plant
life) or mesotrophic (narrow range of nutrients, principally phosphate and nitrate) (Patrick,
1954; Hutchinson, Patrick & Deevey, 1956) to oligo-mesotrophic (from low to intermediate
primary productivity) (PNUMA-OEA, 1997). However, it has been reported a eutrophic
condition and high productivity level of the Lake, indicating a deterioration of water quality
(PROCUENCA-SAN JUAN, 2004). Eutrophication is likely to be the main cause of the
extinction of fish in many lakes, e.g., the vendace, Coregonus albula, in the Castle and Mill
Lochs in Scotland and the melt, Osmerus eperlanus, in Rostherne Mere in England (Maitland
& Lyle, 1991). In the Lake Nicaragua important quantity of dead fishes has been observed
from time to time in the shallowness areas due to unknown causes.
The deforestation of the surrounding slopes followed by the runoff increases the presence
of sediments in the water lake, reported as one of the major conservation problems in lakes
(Maitland & Morgan, 1997). On one hand it increases sedimentation problems, which have
been reported in the Lake Nicaragua (PROCUENCA-SAN JUAN, 2004). It may destroy
habitats where fish spawn and breeding take place (Welcomme et al., 2010). Both A.
citrinellus and B. guatemalensis lay eggs in sandy bottoms (McKaye, 1977; Greenfield &
PhD-Thesis Fishery ecology, reproduction and management Concluding remarks
212
Thomerson, 1997; Bussing W., 2002). On the other hand sediments increases water turbidity
that alters behaviour of fishes and influence vulnerability to fishing gear. Moderate levels of
turbidity apparently decrease the likelihood that fish will perceive the gear presence
(Kirkland, 1965) but also reduce the reactive distances, altering foraging behaviour, and
decreasing association with substrates (Noggle 1978; Gradall & Swenson 1982; Barrett et al.,
1992). This seems to be the case of B. guatemalensis, a rapid swimmer that swim constantly
and sustained because it migratory behaviour (Horn, 1997) that needs enough visibility for
swimming activity. Most cichlids are stenotopic (Eccles, 1986), i.e., able to adapt only to a
narrow range of environmental conditions. Therefore, cichlids are probably less adapted to
habitat with low water transparency since these fish are visually oriented and often associated
with transparent water (Lowe-McConnell, 1999; Rodriguez & Lewis, 1997). The low
visibility has being adverted in haplochromine cichlids in which the decrease of water clarity
seems to affect foraging, social interactions (Fryer & Iles, 1972), to hamper mate recognition
or even frustrate breeding (Seehausen et al., 1998), and also may decrease prey selectivity
which result in an increased interspecific competition, that have negative impact on species
coexistence (Seehausen et al., 2003).
In the fishing ground the males and females abundance change according to the intrinsic
behaviour pattern showed by each sex within each species. The differential behaviour is
related to the habitat preferences, reproductive biology and reproductive strategy in responses
to the fluctuating environment. However, species vulnerability to the fishing gear also
changes because sexual size dimorphism and changes in body shape during reproductive
periods. Cichlids are highly territorial fishes during breeding season and exhibit biparental
care, females-only care or may switch between these two strategies (Kolm et al., 2006;
Gonzalez-Voyer et al., 2008). However, we hypothesized that females are less accessible to
the gear than males during the breeding season, i.e., most of the year, probably because
maternal care predominate over paternal care. In the case of P managuensis, stronger breeding
seasonality has been reported (Conkel, 1993) and in consequence males and females were
caught in similar proportions when the whole year is considered. Males vulnerability also is
thought to obey of being larger than females in order to maintain a hierarchical dominance on
other males and to achieve best reproductive success as in A. citrinellus, (Oldfield, McCrary
& Mckaye, 2006; Elmer, Lehtonen & Meyer, 2009), H. nicaraguensis (Bussing, 2002) and P.
managuensis (Meral, 1973). Moreover, sex differential changes in body shape may affect also
PhD-Thesis Fishery ecology, reproduction and management Concluding remarks
213
catchability, as some cichlid males, even the smaller ones, develop a hump on their head
during reproductive periods, as in A. citrinellus (Bussing, 2002), that favour its retention in
gillnets, increasing its vulnerability. In B. guatemalensis differences in size, being females
larger than males, differential migratory behaviour between sexes, which is more conspicuous
in females, and female changes in body shape due to the ovary development, may explain the
higher catchability of females, especially during rainy season. In consequence, the sex ratio
estimated from fishery and even from fishery-independent surveys should be used with
caution for both, stock assessment and management. It may reflect catchability, i.e., the
interaction between stock structure, the distribution of fishing effort and the gear selectivity
(Arreguín-Sánchez, 1996).
More importantly, the sex ratios obtained in the present study are very likely similar to
those in the fishery, as we used a similar gear. The pattern of catches have great implication
for species conservation and the sustainability of the fisheries, because the equilibrium in the
sex ratio can be severely altered and consequently the potential reproductive ratio of the
species may be directly affected, e.g., parental care in cichlid groups where male play an
important role, or the spawning stock biomass. Thus, the decreasing trend in A. citrinellus
catch ratios between earlier studies (Martínez, 1976), posterior results (Orellana, 1986; Gadea,
2003) and the present study, it might be a symptom of a unbalance sex ratio. Therefore,
fisheries management should consider these findings when establishing measures and
regulations to avoid the depletion of a stock by a simple overfishing of one sex, by reducing
fishing mortality of the more vulnerable sex for each species.
Considering that fishing is the main factor affecting population size structure and
functioning of fish assemblages, it is of relevant the establishment of size-based indicator
(SBIs), typically used to describe the response of communities or individual populations to
exploitation (Garcia et al., 2003), among these, mean length, mean maximum length and
length at maturity (L50) (Shin et al., 2005). L50 is an important parameter to track maturation
temporal shifts in a population and an important predictor of the risk of overexploitation
(Reynolds et al., 2005), because shifts in maturation severely determine the population
dynamics (Saborido-Rey & Trippel, 2013). However, this study has shown the uncertainties
in the L50 estimation in cichlids species, and in B. guatemalensis was demonstrated that
macroscopic observations tend to overestimate L50, and there is a need for improving the
PhD-Thesis Fishery ecology, reproduction and management Concluding remarks
214
estimation of maturity ogives using microscopic methods. Therefore, as reference direction of
changes (RD) for monitoring size exploitation pattern in cichlids (A. citrinellus, H.
nicaraguensis, P. managuensis), we recommended the respective mean length obtained in this
study, whereas for B. guatemalensis we recommended a minimum landing sizes (MLS) based
on the L50 microscopically estimated (see chapter 5 for details).
In fishery biology, analysis of life history traits related to reproduction has mainly
focused on females, in part because offspring production is limited to a greater degree by egg
production (Helfman et al, 1997) and because females provide nourishment to the developing
embryos and thus at least during the very early life stages the maternal role is more important
than the paternal role in influencing progeny production (Murua &Saborido-Rey, 2003). But
fishes exhibit great diversity of reproductive strategies and associated traits (Helfman et al.,
1997; Pitcher & Hart, 1982; Wootton, 1984; Murua & Saborido-Rey, 2003). The knowledge
of those strategies and reproductive patterns, at least from the commercial important species,
may lead to the adoption of management actions based on biological sound scientific
information. Little is known on the reproductive ecology of the lake species, and in
particularly on aspects like fecundity type, ovarian development organization, spawning
season and frequency, potential fecundity, influence of the environmental fluctuation.
Therefore, the implication of those biological aspects on fisheries management is not possible.
In our study we have tried to elucidate such implications on focusing, comprehensively, on
the reproductive ecology of B. guatemalensis.
B. guatemalensis shows a seasonal breeding activity that occurs during rainy season, with
main peak in July-August. This peak coincides with the massive presence in the lake from
May to August of eggs and larvae of an insect of the chironomidae family which is a major
food source of small fishes and particularly for those living in muddy zones (enlace, 2001).
Feeding occur when eggs of the insect, which initially are placed on the water surface, sink to
the bottom where becomes larvae. In spite of the seasonality its spawning season is protracted
because spawning asynchrony at population level. Spawning activity is considerably
dependent on female size, i.e., smaller females have an earlier spawning cessation, while
larger females have a more extended spawning season. Gillnet selectivity in B. guatemalensis
was related with fish size, as expected. However, during the reproductive season the
proportion of fishes captured in each gillnet differed unexpectedly among reproductive
PhD-Thesis Fishery ecology, reproduction and management Concluding remarks
215
phases. Of particular importance are the selectivity pattern of fishes in spawning phases, since
high fishing mortality (catches) on these affect the egg production and the subsequent
recruitment. The fact that females in spawning capable and actively spawning are more
vulnerable to the 100 mesh size, may have an important impact on the spawning stock
biomass. The identification of the more vulnerable females group being fished out may lead
to more effective management action, in particular regulating mesh size and avoiding over-
exploitation of the spawning stock biomass.
The reproductive potential is a measure of the capacity of a population to produce viable
eggs and larvae, and can considered as the main outcome of a reproductive strategy (Murua &
Saborido-Rey, 2003). The conservation of a given spawning stock biomass (SSB) has been
considered one of the key factors to produce sufficient recruitment to the fisheries, since the
stock-recruitment relationship imply that spawners biomass influence the recruitment (Myers
& Barrowman, 1996), under the assumptions that SSB is an index of egg production
(Beverton & Holt, 1957). However, this assumption has been widely invalidated (Saborido-
Rey & Trippel, 2013 and references therein) and the concept of stock reproductive potential
(SRP, Trippel, 1999) has often replaced SSB. Several SRP indexes have been developed, but
undoubtedly total egg production (TEP) is a better estimate of a stock’s reproductive output
than the less sensitive SSB (Marshall, 2009). There is recent and increasing evidence that
variations over time in stock structure, sex ratio, fish condition, growth rate, maturation and
fecundity produce large variability in TEP (Saborido-Rey & Trippel, 2013 and references
therein). TEP is very much depending on fecundity, spawning duration and spawning
frequency, all of these increasing with age and size (Fitzhugh et al., 2012). Our findings
demonstrated that B. guatemalensis egg production is related to spawning duration and
fecundity which in turn are related to female condition and length. Moreover, egg quality of
larger females is higher and it decays as spawning progress, associated to the declining
condition factor of females and also to changes in the environmental conditions, as rainy
season close to the end, which might induce oocyte maturation at smaller sizes. Thus, stock
structure, and not only biomass, is the key component to understand reproductive potential
and recruitment.
From fisheries sustainability point of view, the estimated egg production actually
represents the loss egg production when those females are removed from the fishing ground.
PhD-Thesis Fishery ecology, reproduction and management Concluding remarks
216
Through this study is demonstrated that 75 mm net remove a higher proportion of smaller
spawning females, very likely recruit spawners. These are less experienced females having an
earlier spawning cessation, but more importantly being less productive in terms of egg
production and egg quality. On the contrary the 100 mesh size net is more harmful in terms of
egg production removal, since it causes the highest fishing mortality among the more
productive females. Benefits of maintaining larger individuals in a population have been
mentioned as the enhancement of the offspring survival and reproductive success, and that
young fishes learn the route to spawning aggregation by following the more experienced
adults (Birkeland & Dayton, 2005). Classically, fisheries management is oriented to protect
juveniles and recruit spawners, avoiding growth overfishing. To reduce fishing mortality of
young females it is recommended the use of the 100 mm net, which will protect recruitment
and females in the onset of the ontogenic maturation. However, reducing fishing mortality
over the more productive females, and consequently to minimizing the loss of eggs
production, would imply using in the fishery the 75 mm net. Coping with this paradox is
possible if the 100 mm net is used during the dry season, and the 75 mm during the rainy
season, especially in July and August when spawning activity of B. guatemalensis is higher,
and hence protecting females with larger reproductive potential. These management measures
would be in agreement with the biology of the species and may provide stock sustainability.
Obviously, these types of management measures are based on a single species, which have a
particular reproductive strategy, i.e., determinate fecundity and total spawner. However,
fisheries in the Lake Nicaragua are multi-specific, and many species are target or by-catch of
the fishery. Undoubtedly, the reproductive strategy must differ among them and specific
biological studies are required to achieve a balanced management in the lake.
Of course, alternative management measures can be taken depending on the management
goals. Thus, if protecting spawning females becomes critical, for stock rebuilding for
instance, the uses of 100 mm mesh size during whole year and a closing season in July and
August can be approached. Also it is interesting to consider the vertical spatial use of each
species, i.e., the benthopelagic and/or demersal behaviour, as a regulation of the gear height
may improve the gear selectivity. Our findings show that the species cluster in the net in
different positions and management actions can be taken to reduce by-catch. Reducing the
gear height might allow to perform a better fishing operation targeting only the species of
interest, avoiding fish discards and leave space in the water column for the freely movements
PhD-Thesis Fishery ecology, reproduction and management Concluding remarks
217
of non commercially but biologically important species. Nevertheless, the implementation of
these scientific recommendations does not lack difficulties. Fishery in the lake has been
always claimed being for subsistence and with relatively low income for fishers. The use of
two distinct fishing gears during the year may affect fishers’ income. On the other hand, the
implementation of a close season implies stopping fishing, with important implications in the
community economy. Beyond that, institutions responsible for monitoring, control and
surveillance may find difficulties in the application of the management measures due to the
usual high fisher resistance and low institutional capacity. Under these circumstances co-
management may contribute to develop alternative management approaches more easily to be
adopted and in consequence promoting resources sustainability. Co-management should be
viewed not as a single strategy to solve all problems of fisheries and coastal resources
management, but rather as a process of resource management – maturing, adjusting and
adapting to changing conditions over time. Thus, the co-management process is inherently
adaptive, relying on systematic learning and the progressive accumulation of knowledge for
improved resource management (Pomeroy & Rivera-Guieb, 2006). Co-management
experiences have been successful, at a certain level, in some estuarine water bodies in
Nicaragua, in the sense of community participation on management actions. Therefore, we
believe that this co-management performance can be taken over for fishery in the lake to
promote sustainability of the fishery.

218
CHAPTER 7: Conclusions
Population ecology. Abundance and distribution patterns
1. The fishes studied are widely distributed in the eastern side of the Lake Nicaragua and
the fish distribution and abundance are not influenced by water turbidity but this may
affect fish catchability because of the differences in fish behavioural response to
different level of water transparency.
2. Intra-annual variations of fish abundances are strongly influenced by spatiotemporal
effects, both horizontal (macro-zones), vertical (depth) and by environmental factors,
i.e., the seasonality of precipitation.
3. Although seasonality has been shown to affect the distribution and abundance pattern of
three cichlids, its influence was negligible in A. ctitrinellus but certainly important in H.
nicaraguensis and in less extent in P. managuensis. The more deterministic factors
influencing the spatial distribution of the cichlids A. citrinellus, H. nicaraguensis and P.
managuensis was depth and macro-zones, being more abundant in shallow water and in
the southeast zone.
4. Season (dry and rainy) and depth are the main factors influencing abundance of B.
guatemalensis. Largest abundances were found in the southeast and northwest side,
during both seasons, but highest abundances occurred in rainy season at shallower
waters, and lower abundance in the central zone.
5. All species studied shows similar spatial size distribution pattern. Larger fishes are
found in the southeast and to a lesser extent in the central zone of the lake, whereas in
the northwest area the individuals are smaller. Besides, larger fish are found in the
deeper waters studied (3 and 5 depth strata), excepting for P. managuensis which larger
size has preferences for shallower water (1 to 3 depth strata).
6. The selectivity of the gear used during the surveys prevents us to discern where the
juveniles of each species inhabit. That because size of A. citrinellus, H. nicaraguensis,
PhD-Thesis Fishery ecology, reproduction and management Conclusions
219
P. managuensis and B. guatemalensis smaller than 14.0, 11.0, 17.0 and 20.0 cm,
respectively, were not captured during the surveys.
Reproductive strategy of Brycon guatemalensis
7. The Brycon guatemalensis oocyte final maturation ends with the migration of the
germinal vesicle to the animal pole, without oocyte hydration. However, oocytes
increase 1.6-fold in volume during final maturation. Eggs of B. guatemalensis are
released surrounded by mucus, produced within the ovary, that is visually observed
when enter in contact with water.
8. The reproductive season of B. guatemalensis occurs mainly during rainy season which
trigger the spawning season. Spawning completely cesses in dry season. It exhibits a
protracted spawning season lasting 8 months (from July to February), with the higher
activity between July and November. But highest spawning event occurring in July and
August.
9. Duration and timing of the spawning season are female size-dependent. Smaller females
have an earlier spawning cessation (early spawners), coupled to the finalization of the
rainy season (November), while larger females have a more extended spawning season
(later spawners), till February.
10. The gonadosomatic index (GSI) and the female condition (K) relate fairly well with the
reproductive cycle. At the onset of the spawning both GSI and K reflect gonad
maturation and energy utilization for reproduction. The decoupling pattern of both
along the spawning season and the influence of fish size indicates female population
asynchrony at spawning activity, i.e., smaller females have an earlier spawning
cessation, while larger have a more extended spawning season.
11. The length at 50% maturity (L50) of B. guatemalensis, using microscopic (histological)
ogives, was estimated in 27.3 cm. This evinced the macroscopic overestimation of L50
in 7.6 cm and the imprecise that macroscopic methods can be. These results have a great
implication for assessment and management of the stock in the Lake Nicaragua, since in
PhD-Thesis Fishery ecology, reproduction and management Conclusions
220
the current management measures, minimum landing size and mesh size of the net can
be better established based on more reliable biological information.
12. The ovary dynamic of B. guatemalensis adjust to the “group-synchronous” type ovary
organization. The species shows determinate fecundity and probably spawn only one
batch in each breeding season, i.e., is a total spawner.
13. Spawning asynchronous among female population was also evinced through the
individual distribution pattern of the oocytes development stages. The protracted
spawning season can be consequence of different reproductive behaviour among
different size classes, both in term of reproducing timing, condition, egg production and
egg quality. Females spawning late in the season decrease eggs size as spawning season
progress, and the frequency of larger oocytes becomes lower.
14. Larger females show higher reproductive potential, i.e., produce more eggs and these
are larger. The potential annual fecundity of B. guatemalensis fluctuates between 700 to
35,500 eggs and the average egg production of the stock, in the area of study, was
11,013 ± 6697 eggs. The low incidence of atresia in Brycon might indicate high
reproductive success, since the high incidence of atresia has been linked to a
reproductive failure.
Reproduction in fisheries management
15. The net of 75 mm mesh-size is the more efficient catching smaller specimens, as
expected, whereas in terms of catches of wider range of size-class, the 100 mm mesh
size is more efficient, meaning that both induce high fishing mortality.
16. Differences in selectivity among species partly reflect growth pattern explained by
maximum size captured in each species, as some of them were virtually not captured by
largest mesh sizes. The theoretically retained maximum size by the gears used was well
above the maximum lengths recorded for cichlids species, but not for B. guatemalensis,
indicating that the range of mesh sizes used in this study is suitable to study growth and
population dynamics of large fish. On the other hand, the fact of the minimum size
PhD-Thesis Fishery ecology, reproduction and management Conclusions
221
captured differed among species must be explained only due to fish shape and/or
different behaviour of the life stages of each species.
17. Cichlid species shows high vulnerability of being caught (above 90%) in the smallest
mesh sizes, i.e., 75 and 100 mm, excepting P. managuensis which slightly reduce its
probability of being caught in the 100 mm to a 80%. Thus, a great proportion of the
population of these species is vulnerable to these mesh sizes. In B. guatemalensis the
larger sizes reduce the probability of being catch to a 75 % in the 75 mm, i.e., 25 %
escapement.
18. The most vulnerable part of the population of cichlids species are males and females in
B. guatemalensis, particularly during reproductive periods. The male-female
proportions of each species very likely are similar to those in the catches in a routine
fishing operations performed by the fishers in the lakes. Therefore, care should be
taking because the equilibrium in the sex ratio can be severely altered and consequently
the potential reproductive ratio of some species may be directly affected, e.g., parental
care in cichlid groups where male play an important role, and the spawning stock
biomass in B. guatemalensis.
19. B. guatemalensis on the size of 50% maturity (microscopic estimation), has 100 %
probability of being caught and retained in the 75 mm net, and L50 falls in the range of
24.0 to 30.0 cm at which the net has 80 % efficiency. However, the efficiency of this net
for fish about 20 cm drops considerably, protecting the largest part of the mature stock
of the population, but with risk of growth overfishing. Therefore, its use in fishery
activities should not recommended and larger mesh size should be considered.
20. For A. citrinellus, H. nicaraguensis and P. managuensis, the correspondent estimated
mean length (from selectivity analysis) caught in the 75 mm mesh size, as closer sizes
to L50, is recommended as reference direction of changes for monitoring landing size in
those species, i.e., 18.6, 16.7 and 23.1 cm, respectively.
21. For B. guatemalensis, the L50 microscopically determined (27.3 cm) can be used as RP
due to the accurate of its estimation, and considering 20 % increase over the size at
PhD-Thesis Fishery ecology, reproduction and management Conclusions
222
maturity, a 30 cm minimum landing size (MLS) is recommended. The recommended
MLS for B. guatemalensis would have 40 % probability of being caught in the 100 mm
mesh size net.
22. The catch composition of B. guatemalensis in the different gillnets changes depending
on female size but also in relation to the reproductive phase of the female. The 100 mm
net is the more efficient net in removing the spawning females (SC and AS phase) from
the mature stock, while females in developing and regenerating are mostly caught in 75
mm, even though catches in the 75 mm shows more uniformity in females size.
23. The impact of gillnet, used in small-scale fisheries, on the stock egg production has
been rarely studied. The 75 mm net catches a higher proportion of smaller spawning
females, very likely recruit spawners, which have an earlier spawning cessation and are
less productive in terms of egg production and egg quality. However, our study
demonstrates that the 100 mesh size net is more harmful in terms of egg production
removal, since it causes the highest fishing mortality among the more productive
spawning females stock.
24. To increase the egg production of the females stock and to reduce the fishing mortality
of young females it is advisable to use the 100 mm net during dry season protecting
recruitment and females in the onset of the ontogenic maturation, but switching to 75
mm bet during the rainy season, especially in July and August when spawning activity
of B. guatemalensis is higher, and hence protecting females with larger reproductive
potential.

223
References
Adams W.F., Fowler S.L., Charvet-Almeida P., Faria V., Soto J. & Furtado M. (2006) Pristis
pectinata. In: Red list of threatened species (IUCN, 2011). Version 2011. 2. www.iucnredlist.org. [Consulted: 6 December 2011].
ADPESCA/AECI (2002) Diagnóstico de la Actividad Pesquera y Acuícola. Administración Nacional
de Pesca y Acuicultura (ADPESCA). Agencia Española de Cooperación Iberoamericana (AECI). 390 p. In: Análisis de los datos del censo de embarcaciones Proyecto “Incremento del Perfil de la Pesca Artesanal en las Políticas Nacionales de Nicaragua” FAO FishCode-STF- OSPESCA. 93 p. ftp://ftp.fao.org/FI/DOCUMENT/fishcode/stf/web/nicaragua/censo_embarcaciones.pdf. [Consulted: 8 December 2011].
ADPESCA (2006) Anuario Pesquero y de Acuicultura 2005.
http://www.clmeproject.org/documentos/A%20-%20OSPESCA/129.CIPA-ADPESCA_2006_NI.pdf. Agareso (2010) Pesca artesanal Centroamérica. El Salvador - Nicaragua – Honduras – Guatemala.
http://agaresopescacentroamerica.blogspot.com/2010/06/falta-el-pescado-y-no-sabemos-por-que.html. [Consulted: 9 December 2011].
Agostinho A.A., Vazzoler A.E.A.M., Gomes L.C. & Okada E.K (1993) Estratificación espacial y
comportamiento de Prochilodus scrofa en distintas fases del ciclo de vida, en la planicie de inundación del alto rio Paraná y embalse de Itaipu, Paraná, Brazil. Rev. D`Hydrobiol. Trop., 26(1):79-90.
Agostinho A.A., Vazzoler A.E.A.M. & Thomaz M.S. (1995) The high River Paraná Basin:
Limnological and Ichthyological aspects. Universidade estadual de Maringá-NUPELIA, AvColombo, 5790-87020-900 Maringá-PR-Brazil.
Alheit J. (1985) Spawning frequency of Peruvian anchovies taken with a purse seine. In: An egg
production method for estimating spawning biomass of pelagic fish: Application to the Northern anchovy, Engraulis mordax (Eds. Lasker R., 1985). U.S. Dep.Comm. NOAA Tech. Rep., 36: 59-61.
Alonso-Fernández A. (2011) Bioenergetics approach to fish reproductive potential: case of Trisopterus
luscus (Teleostei) on the Galician Shelf (NW Iberian Peninsula). PhD. Thesis. http://hdl.handle.net/10261/34319.
Alonso-Fernández A., Domínguez-Petit R., Bao M., Rivas C. & Saborido-Rey F. (2008) Spawning
pattern and reproductive strategy of female pouting Trisopterus luscus (Gadidae) on the Galician shelf of north-western Spain. Aquat. Living Resour., 21: 383-393.
Alonso-Fernández A. & Saborido-Rey F. (2011) Maternal influence on the variation of the
reproductive cycle of Trisopterus luscus (Gadidae). The reproductive cycle of Trisopterus luscus (Gadidae). Ciencias Marinas, 37 (4B): 513-687.
Alonso-Fernández A. & Saborido-Rey F. (2012) Relationship between energy allocation and
reproductive strategy in Trisopterus luscus. Journal of Experimental Marine Biology and Ecology, 416-417(0): 8-16.
PhD-Thesis Fishery ecology, reproduction and management References
224
Alonso-Fernández A., Vallejo A.C., Saborido-Rey F., Murua H. & Trippel E.A. (2009) Fecundity estimation of Atlantic cod (Gadus morhua) and haddock (Melanogrammus aeglefinus) of Georges Bank: Application of the autodiametric method. Fish. Res., 99(1): 47-54.
Andrade P.M. & Braga F.M.S. (2005) Reproductive seasonality of fishes from a lotic stretch of the
Grande River, high Paraná river basin, Brazil. Braz. J. Biol., 65(3): 387-394. ISSN 1519-6984. Anon (1961) North Pacific will be full of monofilament next year. Pac. Fisherman 59(12):14. In:
Review of gillnet selectivity (Hamley J.M., 1975). J. Fish. Res. Board Can., 32: 1943-1969. Arreguín-Sánchez F. (1996) Catchability: a key parameter for fish stock assessment. Reviews in Fish
Biology and Fisheries, 6(2): 221-242. Doi 10.1007/BF00182344. Astorqui I. (1976) Peces de la cuenca de los grandes lagos de Nicaragua. Papers in the Biological
Sciences Investigations of the Ichthyofauna of Nicaraguan Lakes. University of Nebraska – Lincoln. http://digitalcommons.unl.edu/ichthynicar/14.
Bagenal T.B. (1967) A short review of fish fecundity. p. 89-111, In: Reproductive biology of
Bryconamericus iheringii (Ostariophysi: Characidae) from rio Vacacaí, RS, Brazil (Lampert V.R.; Azevedo M.A. & Bernhardt F.C., 2004). Neotrop. ichthyol. [online]. 2004, 2(4): 209-215. ISSN 1679-6225.
Baranov F.I. (1914) The capture of fish by gillnets. Mater. Poznaniyu Russ. Rybolov. 3(6): 56-99.
(Partially transl. from Russian by Ricker W.E.). In: Review of gillnet selectivity (Hamley J.M., 1975). J. Fish. Res. Board Can., 32: 1943-1969.
Baranov F.I. (1948) Theory and assessment of fishing gear. Pishchepromizdat, Moscow. (Ch. 7
Theory of fishing with gill nets transl. from Russian by Ont. Dep. Lands For., Maple, Ont., 45 p.) In: Review of gillnet selectivity (Hamley J.M., 1975). J. Fish. Res. Board Can., 32: 1943-1969.
Barbieri G., Hartz S.M. & Verani J.R. (1996) O fator de condição e índice hepatossomático como
indicadores do período de desova de Astyanax fasciatus da represa do Lobo, São Paulo (Osteichthyes, Characidae). Iheringia, Sér. Zool. (81): 97-100. In: Reproductive biology of Bryconamericus iheringii (Ostariophysi: Characidae) from rio Vacacaí, RS, Brazil. Neotrop. ichthyol. [online] (Lampert V.R., Azevedo M.A. & Bernhardt F.C., 2004). 2004, 2(4): 209-215. ISSN 1679-6225.
Barnham C.A. & Baxter A.F. (2003) Condition factor, K, for Salmonid fish. Fisheries notes. State of
Victoria. Department of Primary Industries 2003. March 1998. FN0005. ISSN 1440-2254. Barrett J.C., Grossman G.D. & Rosenfeld J. (1992) Turbidity-induced changes in reactive distance of
rainbow trout. Transactions of the American Fisheries Society 121(4):437-443. Battaile B.C. & Quinn T.J.II. (2004) Catch per unit effort standardization of the eastern Bering Sea
walleye pollock (Theragra chalcogramma) fleet. Fish. Res. 70: 161–177. Doi: 10.1016/j. fishres.2004.08.029. In: How reliable are the abundance indices derived from commercial catch–effort standardization? (Chen Y., et al., 2009). Canadian Journal of Fisheries and Aquatic Sciences, 66(7): 1169-1178.
Bazzoli N. & Rizzo E. (1990) A comparative cytological and cytochemical study of the oogenesis in
ten Brazilian teleost fish species. European Archives of Biology, 101: 399–410.
PhD-Thesis Fishery ecology, reproduction and management References
225
Begovac & Wallace (1988) Stages of oocyte development in the pipefish, Syngnathus scovelli. J. Morphol., 197: 353-369. In: Fish histology. Female reproductive systems (McMillan B.D. 2007). ISBN 978-1-4020-5415-0 (HB).
Berkeley S.A., Chapman C. & Sogard S. (2004b) Maternal age as a determinant of larval growth and
survival in a marine fish, Sebastes melanops. Ecology, 85 (5): 1258–1264. Berkeley S.A., Hixon M.A., Larson R.J., Love M.S. (2004a) Fisheries sustainability via protection of
age structure and spatial distribution of fish populations. Fisheries, 29(8): 23–32. Beverton R.J.H. & Holt S.J. (1957) On the dynamic of exploited fish populations. Fish. Invest. Ninist.
Agric. Fish Food (Gt. Brit.) Ser. II, 19:533 p. ISBN 0412549603. Birkeland Ch. & Dayton P.K. (2005) The importance in fishery management of leaving the big ones.
TRENDS in Ecology and Evolution, 20(7): 356-358. Bishop J., Venables W.N. & Wang Y. (2004) Analysing commercial catch and effort data from a
Penaeid trawl fishery: a comparison of linear models, mixed models and generalized estimating equations approaches. Fish. Res., 70(2-3): 179–193. Doi:10.1016/j.fishres.2004.08.003.
Bobko S.J. & Berkeley S.A. (2004) Maturity, ovarian cycle, fecundity, and age-specific parturition of
black rockfish (Sebastes melanops). Fish. Bull., 102: 418–429. Brederc M., JR. & Rosen D.E. (1966) Modes of reproduction in fishes. Natural History Press, Garden
City, N.Y. In: Terrestrial Group Spawning of Brycon petrosus (Pisces: Characidae) in Panama (Kramer L. D., 1978b).Copeia. 1978(3): 536-537.
Brenes C., Hernández A. & Gutiérrez A. (1998) Sea surface thermocline variations along the
Nicaraguan Pacific coastal waters. Top. Meteor. Oceanogr., 5(1): 17-25. Brönmark C. & Hansson Lars-Anders (2005) The Biology of Lakes and Ponds. Oxford University
Press, Oxford. 285 p. Brown-Peterson N.J., Wyanski D.M., Saborido-Rey F., Macewicz B.J. & Lowerre-Barbieri S.K.
(2011) A Standardized Terminology for Describing Reproductive Development in Fishes, Marine and Coastal Fisheries., 3(1): 52-70.
Bussing W.A. (1976) Geographic distribution of the San Juan ichthyofauna of Central America with
remarks on its origin and ecology. Paper in the Biological Sciences. Investigations of the ichthyofauna of Nicaraguan Lakes, (ed. Thorson B.T., 1976). University of Nebraska – Lincoln.
Bussing W.A. (2002) Peces de las aguas continentales de Costa Rica. Freshwater fishes of Costa Rica.
- 2, ed., 1. reimpr, - San José. C. R.: Editorial de la Universidad de Costa Rica. 2002. 504 p. ISBN 9977-67-489-2.
Busson-Mabillot S. (1967) Structure ovarienne chez la Lamproie de Planer adulte, Lampetra planeri
(Bloch). II. Arch. Zool. Exper. Gen., 108: 423 -446. In: Fish histology. Female reproductive systems (McMillan B. D., 2007). ISBN 978-1-4020-5415-0 (HB).
Caddy J.F. & Mahon R. (1995) Reference points for fisheries management. FAO Fisheries Technical
Paper, 347. 83 p. Camacho P. & Gadea V. (2005) Estudio técnico científico del róbalo en Río San Juan y el gran Lago
de Nicaragua. 1a ed. Managua: Proyecto Araucaria Río San Juan - MARENA, 2005. 150 p.
PhD-Thesis Fishery ecology, reproduction and management References
226
Cerdà J., Fabra M. & Raldúa D. (2007) Physiological and molecular basis of fish oocyte hydration. In:
The Fish Oocyte: From Basic Studies to Biotechnological Applications (Eds. Babin P.J., Cerdà J. & Lubzens E., editors). (Dordrecht: Springer), 349–396.
Cervigón F. (1991) Los peces marinos de Venezuela. Volumen I. Segunda edición. Fundación
científica Los Roques. Venezuela. In: Estudio técnico científico del róbalo en Río San Juan y el Gran Lago de Nicaragua (Camacho P. & Gadea V., 2005). 1a ed. Managua: Proyecto Araucaria Río San Juan - MARENA, 2005. 150 p.
Cerviño S., Domínguez-Petit R., Jardim E., Mehaultd S., Piñeiro C., & Saborido-Rey F. (2012) Impact
of egg production and stock structure on MSY reference points and its management implications for southern hake (Merluccius merluccius). Fish. Res. (2012), http://dx.doi.org/10.1016/j.fishres.2012.07.016
CETMAR (2005) Caracterización socioeconómica de la pesca en el Lago de Nicaragua. Estudio
Socio-económico y de mercado en el Proyecto de apoyo a la actividad pesquera de las comunidades pesqueras artesanales del Lago Nicaragua y Río San Juan, 62 p.
Clark J.R. (1960) Report on selectivity of fishing gear. ICNAF Spec. Publ., 2: 27-36. Conkel D. (1993) Cichlids of North and Central America. T.F.H. Publications, Inc., USA.
http://dx.doi.org/ In: FishBase. World Wide Web electronic publication. www.fishbase.org, (version Froese, R. & Pauly D. Editors. 2011).
Cook R.M., Heath, M.R. (2005) The implications of warming climate for the management of North
Sea demersal fisheries. ICES Journal of Marine Science, 62: 1322–1326. Cooper W.T. Barbieri L.R. Murphy M.D. & Lowerre-Barbieri S.K. (2013) Assessing stock
reproductive potential in species with indeterminate fecundity: Effects of age truncation and size-dependent reproductive timing. Fisheries Research, 138(0): 31-41.
Cowx I.G. (1999) An appraisal of stocking strategies in the light of developing country constraints.
Fisheries Management and Ecology, 6: 21-34. Cowx I.G. (1994) Stocking strategies. Fisheries Management and Ecology, 1:15-30.
Doi:10.1111/j.1365-2400.1970.tb00003.x). Cowx I.G. (1998) Stocking and introduction of fish. Oxford: Fishing news books, Blackwell Science,
456 p. In: Fish ecology and conservation in Lake Banyoles (Spain): the neglected problem of exotic species (García-Berthou E. & Moreno-Amich R., 2002): 223-231.
Craik J.C.A. & Harvey S.M. (1984) Biochemical Changes Occurring during Final Maturation of Eggs
of Certain Marine and Freshwater Teleosts, Journal of Fish. Biolog., 24(5): 599–610. Davies D.W. & Pierce C.P. (1972) Lake Nicaragua fisheries survey. Distributed by NTIS Project:
Agency for International Development A.I.D./csd. 49 p. Diekmann M., Brämick U., Lemcke R. & Mehner T. (2005) Habitat-specific fishing revealed distinct
indicator species in German lowland lake fish communities. Journal of Applied Ecology., 42: 901–909.
Domínguez-Petit R. (2007) Study of Reproductive Potential of Merluccius merluccius in the Galician
Shelf. PhD Thesis. University of Vigo (Spain). http://hdl.handle.net/10261/4377.
PhD-Thesis Fishery ecology, reproduction and management References
227
Domínguez-Petit R., Korta M., Saborido-Rey F., Murua H., Saínza M., & Piñeiro C. (2008) Changes
in size at maturity of European hake Atlantic populations in relation with stock structure and environmental regimes. J. Mar. Syst., 71: 260–278.
Drewe K.E., Horn M.H., Dickson K.A. & Gawlicka A. (2003) Insectivore to frugivore: ontogenetic
changes in gut morphology and digestive enzyme activity in the characid fish Brycon guatemalensis from Costa Rican rain forest streams. Journal of Fish Biology (2004). 64: 890–902.
Dutil J.D. & Lambert Y. (2000) Natural mortality from poor condition in Atlantic cod (Gadus
morhua). Canadian Journal of Fisheries and Aquatic Sciences, 57: 826–836. Dutil J.D., Lambert Y. & Chabot D. (2003) Winter and spring changes in condition factor and energy
reserves of wild cod compared with changes observed during food-deprivation in the laboratory. ICES J. Mar. SCI., 60: 780-786.
Eccles H. (1986) Is speciation of demersal fishes in Lake Tanganyika restrained by physical
limnological conditions?. Biological Journal of the Linnean Society, 29(2): 115–122. Article first published online: 28 JUN 2008. Doi: 10.1111/j.1095-8312.1986.tb01826.x.
Elmer K.R., Lehtonen T.K. & Meyer A. (2009) Color assortative mating contributes to sympatric
divergence of neotropical cichlid fish. Evolution, 63(10): 2750-2757. Emmrich M., Winfield J.I., Guillard J., Rustadbakken A., Verges Ch., Volta P., Jeppensen E.,
Lauridsen T.L., Brucet S., Holmgren K., Arguillier Ch. & Mehner T. (2012) Strong correspondence between gillnet catch per unit effort and hydroacoustically derived fish biomass in stratified lakes. Freshwater Biology, 57: 2436-2448.
Engås A. (1983) The importance of various gear parameters in the gillnet fishery for blueling (Molva
dypterygia). M.Sc. thesis, University of Bergen (in Norwegian). In: Manual on estimation of selectivity for gillnet and longline gears in abundance surveys (Hovgård H. & Lassen H., 2000). FAO Fisheries Technical Paper. No. 397. Rome, FAO. 2000. 84p.
enlace (2001) Los sayules o chayules no chupan, no pican. Enero 2001. Consulted 28 febrero 2013.
http://revistaenlace.simas.org.ni/edicion/75. European Union (2000) Directive 2000 ⁄60EC of the European Parliament and of the Council of
Establishment a framework of the community action in the field of water policy. European Commission. Official Journal of the European Communities. L 327. 72 p.
FAO (2012) The State of World Fisheries and Aquaculture. FAO Fisheries and Aquaculture
Department. Food and Agriculture Organization of the United Nations. Rome, 2012. FAO. © (2013) CWP Handbook of Fishery Statistical Standards. Section N: FISHING EFFORT.
CWP Data Collection. In: FAO Fisheries and Aquaculture Department [online]. Rome. [Consulted: 12 January 2013]. http://www.fao.org/fishery/cwp/handbook/N/en.
Fernandes, Machado & Penha (2010) Spatial pattern of a fish assemblage in a seasonal tropical
wetland: effects of habitat, herbaceous plant biomass, water depth, and distance from species sources. Neotropical Ichthyology, 8(2):289-298.
Fitzhugh R.G. & Hettler F.W. (1995) Temperature influence on postovulatory follicle degeneration in
Atlantic menhaden, Brevoortia tyrannus. Fishery Bulletin, 93(3): 568 – 572.
PhD-Thesis Fishery ecology, reproduction and management References
228
Fitzhugh G.R., Shertzer K.W., Kellison G.T. & Wyanski D.M. (2012) Review of size- and age-dependence in batch spawning: implications for stock assessment of fish species exhibiting indeterminate fecundity. Fishery Buletin, 110: 413–425.
Fostier A. (2008) Reproductive strategies. Reprofish. 8th International symposium on reproductive
physiology of fish June 3-8, 2007 - Saint-Malo, FRANCE. <http://www.inra.fr/reprofish_eng/la_reproduction_des_poissons/reproduction_des_especes_cles/strategies_reproductives.> [Consulted: 18 August 2011].
French R.R. & Dunn J.R. (1973) Loss of salmon from high-seas gillnetting with reference to the
Japanese salmon mothership fishery. Fish. Bull., 71: 845-875. Froese R. & Pauly D. Editors (2004). FishBase. World Wide Web electronic publication.
www.fishbase.org, version (05/2004) and Lima, F.C.T. 2003. Froese R. & Binohlan C. (2000) Empirical relationships to estimate asymptotic length, length at first
maturity and length at maximum yield per recruit in fishes, with a simple method to evaluate length frequency data. Journal of Fish Biology, 56: 758-773.
Fryer G. & Iles T.D. (1972) The cichlid fishes of the Great Lakes of Africa. Their biology and
evolution. Oliver & Boyd, Edinburgh, 641 p. In: Evolution and speciation of African cichlids (Ribbink A.J., 1988). Chapitre 2.
Gadea E.V. (2003) Estudio biológico pesquero de las especies comerciales en San Carlos y
Solentiname. Río San Juan Nicaragua. Asociación de Cooperación Rural en Africa y América Latina (ACRA), 90 p.
Garcia S., Zerbi A., Aliaume C., Do Chi T. & Lasserre G. (2003) The ecosystem approach to fisheries.
Issues, terminology, principles, institutional foundations, implementation and outlook. FAO Fisheries Technical Paper, 443. 71 pp.
Gomiero L.M. & Braga F.M.S. (2007) Reproduction of Pirapitinga do Sul (Brycon opalinus Cuvier,
1819) in the Parque Estadual da Serra do Mar-Núcleo Santa Virgínia, São Paulo, Brazil.67(3):541-549.
Gonzalez L. (2011) Chapter 8. State of the bay. The Bay’s Living Resources. In: Galveston Bay status
and trends. A characterization of the Galveston Bay Ecosystem. Third Edition. (Lester J.L & Gonzalez L., 2011). A publication of the Galveston Bay Estuary. http://www.galvbaydata.org/Portals/2/StateOfTheBay/2011/Chapters/Chapter%208%20-%20The%20Bays%20Living%20Resources.pdf [Consulted: 13 September 2011].
Gonzalez-Voyer A, Fitzpatrick J.L. & Kolm N. (2008) Sexual selection determines parental care
patterns in cichlid fishes. Evolution, 62: 2015–2026. Doi:10.1111/j.1558-5646.2008.00426.x. Gradall K.S. & Swenson W.A. (1982) Responses of Brook Trout and Creek Chubs to turbidity.
Transaction of the American Fisheries Society 111:392-395. Greenfield D.W. & Thomerson J.E. (1997) Fishes of the Continental Waters of Belize. Gainesville:
University Press of Florida. 311 p. ISBN 0- 8130-1497-2. Gulland J.A. (1983) Fish stock assessment. A manual of basic methods. Chichester, John Wiley and
Sons, FAO/Wiley series on food and agriculture. 1: 223 p.
PhD-Thesis Fishery ecology, reproduction and management References
229
Guraya S.S. (1982) Recent progress in the structure, origin, composition, and function of cortical granules in animal egg. Int. Rev. Cytol., 78: 257 -360. In: Fish histology. Female reproductive systems (McMillan B. D., 2007). ISBN 978-1-4020-5415-0 (HB).
Guraya S.S. (1986) The Cell and molecular biology of fish oogenesis. Monographs in developmental
biology, H.W. Sauer, ed. Basel: S. Karger A.G., 18:223 p. Hamley J.M. (1975) Review of gillnet selectivity. J. Fish. Res. Board Can., 32: 1943-1969. Hamley J.M. & Regier H.A. (1973) Direct estimates of gillnet selectivity to walleye (Stizostedion
vitreum vitreum). J. Fish. Res. Board Can., 30: 817 -830. Doi: 10.1139/f73-137. Hannah R.W., Blume M.T. & Thompson J.E. (2009) Length and age at maturity of female yelloweye
rockfish (Sebastes rubberimus) and cabezon (Scorpaenichthys marmoratus) from Oregon waters based on histological evaluation of maturity. Fish division. Oregon Department of Fish and Wildlife Marine. 29 p.
Hansen M. J., Schorfhaar R. G. & Selgeby J. H. (1998) Gill-Net Saturation by Lake Trout in Michigan
Waters of Lake Superior. North American Journal of Fisheries Management, 18:847–853. Harley S.J., Myers R.A. & Dunn A. (2001) Is catch-per-unit-effort proportional to abundance? Can. J.
Fish. Aquat. Sci., 58(9): 1760–1772. Doi:10.1139/cjfas-58-9-1760. Haslob H., Kraus G. & Saborido-Rey F. (2012) The dynamics of postovulatory follicle degeneration
and oocyte growth in Baltic sprat. Journal of Sea Research, 67(1): 27-33. Hayes C.W. (1899) Physiography and geology of region adjacent to the Nicaragua canal route. Bull.
Geol. Soc. Amer., 10:285-348. In: Geographic Distribution of the San Juan Ichthyofauna of Central America with Remarks on its Origin and Ecology (Bussing W.A.1976). Papers in the Biological Sciences Investigations of the Ichthyofauna of Nicaraguan Lakes. Universidad de Costa Rica.
Hay D.E. & Brett J.R. (1988) Maturation and fecundity of Pacific herring (Clupea harengus pallasi):
an experimental study with comparisons to natural populations. Canadian Journal of Fisheries and Aquatic Sciences, 45: 399-406.
Helfman G.S., Collette B.B. & Facey D.E. (1997) The diversity of fishes. 528 pp. Blackwell Science:
Oxford. ISBN 0 86542 256 7. In: Female reproductive strategies of marine fish species of the north Atlantic (Murua H. & Saborido-Rey F., 2003). J. Northw. Atl. Fish. Sci., 33: 23-31.
Hernández-Portocarrero A. & Saborido-Rey F. (2007) Abundancia relativa de los peces en la costa
oriental del Lago de Nicaragua: compendio de investigaciones de la ictiofauna de importancia comercial en Río San Juan y el Lago de Nicaragua: Volumen III. Managua: INPESCA. MARENA, 2007. 146 p. http://hdl.handle.net/10261/58336.
Hickford M.J.H. & Schiel D.R. (1996) Gillnetting in southern New Zealand: duration effects of sets
and entanglement modes of fish. Fish. Bull., 94: 669–677. Hickley P. & Aprahamian M. (2000) Fisheries science and the managerial imperative. In: (Eds. Cowx
I. G.) Management and Ecology of River Fisheries. Oxford: Fishing New Books, Blackwell Science, 346-360.
Hilborn R. & Walters C.J. (1992) Quantitative fisheries stock assessment: choice, dynamics and
uncertainty. Chapman & Hall. London 570 p.
PhD-Thesis Fishery ecology, reproduction and management References
230
Hislop J.R.G. (1984) A comparison of the reproductive tactics and strategies of cod, haddock, whiting and Norway pout in the North Sea. In: Fish reproduction (Eds. Potts G. W. & Wooton R. J., 1984), 410 p. Academic Press Inc, London.
Holden M.J. & Raitt D.F.S. (1974) Manual of fisheries science Part 2. Methods of resource
investigation and their application. FAO Fish. Tech. Rep., (115): Rev. 1, 214 p. Holt S.J. (1963) A method for determining gear selectivity and its application. ICNAF Spec. Publ. 5:
106-115. (First appeared in 1957: ICNAF/ICES/FAO Jt. Sci. Meet., Lisbon. Contrib. S-15, 21 p. Honji R.M., Narcizo A.M., Borella M.I., Romagosa E., Moreira R.G. (2009) Patterns of oocyte
development in natural habitat and captive Salminus hilarii Valenciennes, 1850 (Teleostei: Characidae). Fish Physiol Biochem., 35(1): 109-23. Epub 2008 Jun 10.
Horn H.M. (1997) Evidence for dispersal of fig seeds by the fruit-eating characid fish Brycon
guatemalensis Regan in a Costa Rican tropical rain forest. Oecología, 109: 259-264. Horwood J.W., Bannister R.C.A. & Howlett G.J. (1986) Comparative Fecundity of North Sea Plaice
(Pleuronectes platessa L.). Proc. R. Soc., B 228: 401-431. Hovgård H. (1996) A two-step approach to estimating selectivity and fishing power of research
gillnets used in Greenland waters. Can. J. Fish. Aquat. Sci., 53: 1007–1013. In: Manual on estimation of selectivity for gillnet and longline gears in abundance surveys (Hovgård H. & Lassen H., 2000). FAO Fisheries Technical Paper. No. 397. Rome, FAO. 2000.
Hovgård H. & Lassen H. (2000) Manual on estimation of selectivity for gillnet and longline gears in
abundance surveys. FAO Fisheries Technical Paper. No. 397. Rome, FAO. 2000. 84p. Hunter J.R. & Macewicz B.J. (1985) Measurement of spawning frequency in multiple spawning fishes. NOAA Technical Report NMFS. 36:79-94. Hunter J.R. & Macewicz B.J. (2003) Improving the accuracy and precision of reproductive
information used in fisheries. p 57-68. In: Modern approaches to assess maturity and fecundity of warm- and cold-water fish and squids (Kjesbu O.S., Hunter J.R. & Witthames P.R., 2003). Report of the working group, Bergen, 137 p.
Hunter J.R. & Golberg S.R. (1980) Spawning incidence and batch fecundity in northern anchovy,
Engraulis mordax. Fish. Bull., 77: 641-652. Hunter J.R., Macewicz B.J. & Kimbrell C.A. (1989) Fecundity and other aspects of the reproduction
of sablefish, Anoplopoma fimbria, in central California waters. Calif. Coop. Fish. Rep., 30: 61-72. Hunter J.R., Macewicz B.J., Chyan-huei Lo.N. & Kimbrell C.A. (1992) Fecundity, spawning, and
maturity of female Dover sole Microstomus pacificus, with an evaluation of assumptions and precision. Fishery Bulletin, 90: 101-128.
Hunter J.R. & Macewicz B.J. (1985) Rate of atresia in the ovary of captive and wild anchovy,
Engraulis mordax. Fishery Bulletin, 83(2): 79-94. Hutchinson G.E., Patrick R. & Deevey E.S. (1956) Sediments of Lake Patzcuaro, Michoacan, Mexico;
Geol. Soc. America Bull., 67: 1491-1504. In: Bottom sediments of Lake Nicaragua and Lake Managua, western Nicaragua (Swain F.M., 1976). Papers in the Biological Sciences. Investigations of the ichthyofauna of Nicaraguan Lakes. University of Nebraska-Lincoln. Journal of sedimentary petrology (1966), 36(2): 522-540.
PhD-Thesis Fishery ecology, reproduction and management References
231
IGFA (2001) Database of IGFA angling records until 2001. IGFA, Fort Lauderdale, USA.
http://www.fishbase.org/references/FBRefSummary.php?ID=40637. [Consulted: 24 September 2011]
INFONAC (1974) Informe sobre los resultados del programa de investigación de los recursos
pesqueros del Lago de Nicaragua. Instituto de Fomento Nacional, Division de Pesca, Managua. In: Geography of Lake Nicaragua (Incer J., 1976). Investigations of the Ichthyofauna of Nicaraguan Lakes. Paper 2. http://digitalcommons.unl.edu/ichthynicar/2.
Inoue M. & Nunokawa M. (2002) Effects of longitudinal variations in stream habitat structure on fish
abundance: an analysis based on subunit-scale habitat classification. Freshwater Biology, 47: 1594-1607. Doi: 10.1046/j.1365-2427.1999.00481.x. ISSN: 0046-5070.
INPESCA (2011) Anuario Pesquero y de Acuicultura 2010. 63 p.
http://www.inpesca.gob.ni/images/ANUARIO%20PESQUERO%20Y%20ACUICOLA%20%20DE%20NICARAGUA%20%202010.pdf.
Ishida T., Miura T., Shiraishi Y., Tanaka S. & Tanaka M. (1968) Mesh selectivity of gill nets for some
freshwater fishes. (In Japanese with English summary). Bull. Freshwater Fish. Res. Lab. 18: 13-20. In: Review of gillnet selectivity (Hamley J.M., 1975). J. Fish. Res. Board Can., 32: 1943-1969.
Ishida T. (1969) The salmon gillnet mesh selectivity curve. Int. North Pac. Fish. Comm. Bull. 26: 1-
11. In: Review of gillnet selectivity (Hamley J.M., 1975). J. Fish. Res. Board Can., 32: 1943-1969. Jackson D.A. & Harvey H.H. (1997) Qualitative and quantitative sampling of lake fish communities.
Canadian Journal of Fisheries and Aquatic Sciences, 54: 2807–2813. Jensen N.H. (1976) Reproduction of the bull shark, Carcharhinus leucas, in the Lake Nicaragua-Rio
San Juan System. In: Investigations of the Ichthyofauna of Nicaraguan Lakes (Thorson B.T., 1976 ed.). School of Life Sciences, University of Nebraska.-Lincoln.
Jones R. (1984) Mesh size regulation and its role on fisheries management. In: Papers presented at the
Expert Consultation on the regulation of fishing effort (fishing mortality) (FAO, 1984). Rome, 17–26 January 1983. A preparatory meeting for the FAO World Conference on fisheries management and development. FAO Fish.Rep., (289) Suppl.2: 214 p.
Jurvelius J., Kolari I. & Leskela A. (2011) Quality and status of fish stocks in lakes: gillnetting,
seining, trawling and hydroacoustics as sampling methods. Hydrobiologia, 660: 29–36. Karlsen L. & Bjarnason B.A. (1986) Small-scale fishing with driftnets. FAO Fish. Tech. Pap., (284):
64 p. Kjesbu O.S. (1989) The spawning activity of cod, 74 J. Northw. Atl. Fish. Sci., 25, 1999 Gadus
morhua L. J. Fish Biol., 34: 195–206. Kjesbu O.S. Witthames P.R, Solemdal P. & Walker G. (1998) Temporal variation in the fecundity of
Arcto-Norwegian cod (Gadus morhua) in response to natural changes in food and temperature. Journal of Sea Research, 40: 303-21.
Kjesbu O.S., Klungsoyr J., Kyrvi H., Witthames P.R. &Walker G. (1991) Fecundity, atresia and egg
size of captive Atlantic cod (Gadus morhua) in relation to proximate body composition. Canadian Journal of Fisheries and Aquatic Sciences, 48: 2333-2343.
PhD-Thesis Fishery ecology, reproduction and management References
232
Kennedy W.A. (1951) The relationship of fishing effort by gillnets to the interval between lifts. J. Fish. Res. Bd. Can., 8: 264–274. In: Manual on estimation of selectivity for gillnet and longline gears in abundance surveys (Hovgård H. & Lassen H., 2000). FAO Fisheries Technical Paper. No. 397. Rome, FAO. 2000.
Ketúnin D.N., Akimov V.A., Verzin I., & Pilatov V. (1983) Investigaciones económicas de peces de
los depósitos de aguas interiores de la república de Nicaragua (el Lago de Nicaragua). Ministerio de Economía Pesquera de la URSS. In: Estudio de la biomasa del Lago de Nicaragua (López A., 2004). Xunta de Galicia. Proyecto: “Apoyo a la actividad pesquera de las comunidades pesqueras del Lago Nicaragua (Cuenca del Río Mayales, Departamento de Chontales y Río San Juan)” AECI/ADPESCA. 35 p.
Kirkland L. (1965) A tagging experiment on spotted and largemouth bass using an electric shocker
and the Peterson disc tag. Proceedings of the Southeastern Association of Game and Fish Commissioners 16 (1962): 424-432. In: Effects of intraspecific density and environmental variables on electrofishing catchability of brown and rainbow trout in the Colorado River (Speas W. D., Walters C. J., Ward D. L. & Rogers R. S., 2004). North American Journal of Fisheries Management, 24: 586-596.
Klingenberg C.P., Barluenga M. & Meyer A. (2003) Body shape variation in cichlid fishes of the
Amphilophus citrinellus species complex. Biological Journal of the Linnean Society, 80: 397–408. Koenig K.W., Beatty R.J. & Martínez S.C. (1976) Species diversity and distribution of Fish in Lake
Nicaragua. Papers in the Biological Sciences. Investigations of the Ichthyofauna of Nicaraguan Lakes. (Ed. Thorson B. T., 1976). 321-324.
Kolm N., Goodwin N.B., Balshine S., Reynolds J.D. (2006) Life history evolution in cichlids 1:
revisiting the evolution of life histories in relation to parental care. J. Evol. Biol., 19:66–75. Doi:10.1111/j.1420-9101.2005.00984.x
Korta M., Domínguez-Petit R., Murua H., Saborido-Rey F. (2010) Regional variability in reproductive
traits of European hake Merluccius merluccius L. populations. Fisheries Research, 104: 64–72. Kramer L. D. (1978b) Terrestrial Group Spawning of Brycon petrosus (Pisces: Characidae) in
Panama.Copeia, 1978(3): 536-537. Kramer L.D. (1978a) Reproductive seasonality in the fishes of a tropical stream. Ecology, 59(5): 976-
985. Ecological Society of America. Kubecka J., Hohausova E., Matena J., Peterka J., Amarasinghe U.S., Bonar S.A., Hateley J., Hickley
P. & Suuronen P. (2009) The true picture of a lake or reservoir fish stock: a review of needs and progress. Fisheries Research, 96: 1–5.
Lambert D. (1992) Zero-inflated Poisson regression, with application to random defects in
manufacturing. American Statistical Association and American Society for Quality Technometrics, 34: 1 – 14.
Lambert Y. (2008) Why should we closely monitor fecundity in marine fish populations? J. Northw.
Atl. Fish. Sci., 41: 93–106. 106. Doi:10.2960/J.v41.m628. Lampert V.R., Azevedo M.A. & Bernhardt F.C. (2004) Reproductive biology of Bryconamericus
iheringii (Ostariophysi: Characidae) from rio Vacacaí, RS, Brazil. Neotrop. ichthyol. [online]. 2004, 2(4): 209-215. ISSN 1679-6225.
PhD-Thesis Fishery ecology, reproduction and management References
233
Lampert V.R.; Azevedo M.A. & Bernhardt F.C. (2007) Reproductive biology of Bryconamericus stramineus Eigenmann, 1908 (Ostariophysi: Characidae) from the rio Ibicuí, RS, Brazil. Braz. arch. biol. technol. 50(6): 995-1004. ISSN 1516-8913.
Larkins H.A. (1963) Comparison of salmon catches in monofilament and multifilament gill nets.
Commer. Fish. Rev. 26 (5): 1-11. In: Review of gillnet selectivity (Hamley J.M., 1975). J. Fish. Res. Board Can., 32: 1943-1969.
Larkins H.A. (1964) Comparison of salmon catches in monofilament and multifilament gill nets-Part
II. Commer. Fish. Rev. 26 (10): 1-7. In: Review of gillnet selectivity (Hamley J. M., 1975). J. Fish. Res. Board Can., 32: 1943-1969.
Li Y. & Jiao Y. (2011) Gill-net saturation in Lake Erie: Effects of soak time and fish accumulation on
catch per unit effort of Walleye and Yellow Perch. North American Journal of Fisheries Management, 31:280–290. ISSN: 0275-5947 print / 1548-8675 online. Doi: 10.1080/02755947.2011.574931.
Lizama M.P. & Ambrosio A.M. (2002) Condition factor in nine species of fish of the Characidae
family in the upper Paraná River floodplain, Brazil. Braz. J. Biol. [online]. 2002, 62(1): 113-124. ISSN 1519-6984.
Lourenço L., Fernandes, I., Penha J., & Mateus L. (2012) Persistence and stability of cichlid
assemblages in neotropical floodplain lagoons. Environmental Biology of Fishes, 93(3): 427 p. Academic Journal.
Lowe-McConnell R.H. (1999) Estudos Ecológicos de Comunidades de Peixes Tropicais. Editora da
Universidade de São Paulo, São Paulo, Brasil. 534p. In: Spatial pattern of a fish assemblage in a seasonal tropical wetland: effects of habitat, herbaceous plant biomass, water depth, and distance from species sources (Fernandes, Machado & Penha 2010.) Neotropical Ichthyology, 8(2): 289-298.
Lowe-McConnell R.H. (1987) Ecological studies in tropical fish communities. Cambridge, UK:
Cambridge University Press. 382 p. ISBN 0-521-23601-0 (hardback). Lowerre-Barbieri S.K. & Barbieri L.R. (1993) A new method of oocyte separation and preservation
for fish reproduction studies. Fish. Bull., 91(1): 165-170. Lowerre-Barbieri S., Brown Peterson N., Murua H., Tomkiewicz J., Wyanski D. & Saborido-Rey F.
(2011b) Emerging issues and methodological advances in fisheries reproductive biology: the importance of histological tools. Marine and Coastal Fisheries: Dynamics, Management, and Ecosystem Science, 3: 32–51.
Lowerre-Barbieri S.K., Chittenden M.E. & Barbieri L.R. (1996) The multiple spawning pattern of
weakfish in the Chesapeake Bay and Middle Atlantic Bight. Journal of Fish Biology, 48: 1139–1163. Doi: 10.1111/j.1095-8649.1996.tb01811.x
Lowerre-Barbieri S., Ganias K., Saborido-Rey F., Murua H., Hunter J. (2011a) Reproductive timing in
marine fishes: variability, temporal scales, and methods. Marine and Coastal Fisheries: Dynamics, Management, and Ecosystem Science, 3:71–91.
MACHACA (2011) http://www.jjphoto.dk/fish_archive/warm_freshwater/brycon_guatemalensis.htm. [Consulted: 24 September 2011].
PhD-Thesis Fishery ecology, reproduction and management References
234
MacArthur R.H & Wilson E.O. (1967) The Theory of Island Biogeography. Princeton University Press, Princeton. 224 p. ISBN: 9780691088365.
Magalhães M.F., Batalha D.C. & Pereira M.J. (2002) Gradients in stream fish assemblages across a
mediterranean landscape: contributions of environmental factors and spatial structure. Freshwater Biology, 47: 1015-1031.
Maitland P.S. & Morgan N.C. (1997) Conservation management of freshwater habitats. Lakes, rivers
and wetlands. Chapman & Hall. 233 p. Maitland P.S. & Lyle A.A. (1991) Conservation of freshwater fish in the British Isles: The current
status and biology of threatened species. Aquatic Conserv: Mar. Freshw. Ecosyst., 1: 25–54. Doi: 10.1002/aqc.3270010104.
Marenco Y.C. (2010) El pez Diablo una especie exótica invasora. Biocenosis 23 (2):16-19.
http://web.uned.ac.cr/biocenosis/images/stories/Vol232/04-marenco-pez.pdf.[Consulted 01 March]. Marshall C.T. (2009) Implementing information on stock reproductive potential in fisheries
management: the motivation, challenges and opportunities. In: Fish Reproductive Biology. Implications for assessment and management (Jakobsen T., Fogarty M.J., Megrey B.A. & Moksness E., 2010 Eds.). Wiley-Blackwell, Oxford, UK: 395–420.
Marshall C.T., Kjesbu O.S., Yaragina N.A., Solemdal P. & Ulltang O. (1998) Is spawning biomass a
sensitive measure of the reproductive and recruitment potential of Northeast Arctic cod? Canadian Journal of Fisheries and Aquatic Sciences, 55: 1766–1783.
Marshall C.T., O'Brien L., Tomkiewicz, J., Köster W.F., Kraus G., Marteinsdottir G., Morgan M.J.,
Saborido-Rey F., Blanchard L.J., Secor H.D. Wright J.P., Mukhina V.N. & Björnsson H. (2003) Developing alternative indices of reproductive potential for use in fisheries management: Case studies for stocks spanning an information gradient. J. Northw. Atl. Fish. Sci., 33: 161-190.
Marshall C.T., Yaragina N.A., Lambert Y. & Kjesbu O.S. (1999) Total lipid energy as a proxy for
total egg production by fish stocks. Nature, 402 (6759): 288-290. Martin P., Sartor P. & Garcia-Rodriguez M. (1999) Exploitation patterns of European hake Merluccius
merluccius, red mullet Mullus barbatus and striped red mullet Mullus surmuletus in the western Mediterranean. J. Appl. Ichthyol., 15: 24-28.
Martínez C.S. (1976) Relative Abundance and Distribution of the Mojarra (Cichlasoma citrinellum) in
Lake Nicaragua. Investigations of the Ichthyofauna of Nicaraguan Lakes. Paper 25. http://digitalcommons.unl.edu/ichthynicar/25.
Matthews W.J. (1998) Patterns in freshwater fish ecology. 756 p. Springer, 1998. ISBN 041202831X,
9780412028311. Maunder M.N. & Hoyle S.D. (2006) A novel method to estimate relative abundance from purse-seine
catch-per-set data using known abundance of another species. http://www.iattc.org/PDFFiles2/StockAssessmentReports/SAR7-Novel-method-ENG.pdf [Consulted: 30 September 2011].
Maunder M.N. & Punt A.E. (2004) Standardizing catch and effort data: a review of recent approaches.
Fish. Res., 70(2–3): 141–159. Doi:10.1016/j.fishres.2004.08.002.
PhD-Thesis Fishery ecology, reproduction and management References
235
McCullagh P. & Nelder J.A. (1989) Generalized Linear Models, Second Edition (Chapman & Hall/CRC; 2nd revised edition (1 August 1989). Monographs on Statistics & Applied Probability. 532 p. ISBN-10: 0412317605.
McCombie A.M. (1961) Gill-net selectivity of lake white fish from Goderich-Bayfield area, Lake
Huron. Trans. Am. Fish. Soc., 90: 337-340. McCombie A.M. & Berst A.H. (1969) Some effect of shape and structure of fish on selectivity of
gillnets. J. Fish. Res. Bd. Canada, 26: 2681-2689. McCormick H. J., Stokes G.N., & Hermanutz R.O. (1989) Oocyte Atresia and Reproductive Success
in Fathead Minnows (Pimephales promelas) Exposed to Acidified Hardwater Environments. Arch. Environ. Contam. Toxicol., 18: 207-214.
McDavitt M.T. (2002) Lake Nicaragua revisited: conversations with a former sawfish fisherman. In:
Shark News 14: Newsletter of the IUCN Shark Specialist Group 14: 5. http://www.iucnssg.org/tl_files/Assets/pdf/SN/SN14%20LOW%20RES.pdf. [Consulted: 7 December 2011].
McKaye K.R. (1977) Competition for breeding sites between the cichlid fishes of Lake Jiloa,
Nicaragua. Ecology, 58: 291-302. McKaye, K.R. & Barlow G.W. (1976) Competition between color morphs of the Midas cichlid,
Cichlasoma citrinellum, in Lake Jiloa, Nicaragua. Pp. 467–475. In: (Thorson T. B., 1976 ed.) Investigations of the ichthyofauna of Nicaraguan Lakes. University of Nebraska School of Life Sciences, Lincoln, NE.
McMillan B.D. (2007) Fish histology. Female reproductive systems. ISBN 978-1-4020-5415-0 (HB). McLarney W.O., Mafla H.M., Arias A.M. & Bouchonnet D. (2010) The threat to biodiversity and
ecosystem function in the la Amistad World Heritage Site, Panama and Costa Rica, from proposed hydroelectric dams. 125 p.
Meral G.H. (1973) The adaptive significance of territoriality in New World Cichlidae. Unpublished
Ph.D. thesis, University of California, Berkeley. In: Giant Predatory Cichlids, The true guapotes (Loiselle P. V., 1980) Marine Aquarium Magazine, August 1980; 39-47, 71-74.
Miller R.R. (1966) Geographical distribution of Central American freshwater fishes. Copeia 1966(4):
773-802. In: Geographic distribution of the San Juan ichthyofauna of Central America with remarks on its origin and ecology (Bussing W.A., 1976). Paper in the Biological Sciences. Investigations of the ichthyofauna of Nicaraguan Lakes, (ed. Thorson B.T., 1976), University of Nebraska-Lincoln.
Miranda A.C.L., Bazzoli N., Rizzo E. & Sato Y. (1999) Ovarian follicular atresia in two teleost
species: a histological and ultrastructural study. Tissue & Cell, 31(5): 480–488. Mohr H. (1965) Auswirkung der einstellung von kiemennetzen auf die fangigkeit von barsch und
plotze. Arch. Fishereiwiss. 16. 108-115. In: Manual on estimation of selectivity for gillnet and longline gears in abundance surveys (Hovgård H. & Lassen H., 2000). FAO Fisheries Technical Paper. No. 397. Rome, FAO. 2000. 84p.
Molina A.A. (2006) Desarrollo larval de Brycon guatemalensis (Regan, 1908) (Pisces: Characidae).
BRENESIA, 66: 31-36.
PhD-Thesis Fishery ecology, reproduction and management References
236
Montenegro-Guillén S. (2003) Lake Cocibolca/Nicaragua. Lake basin management initiative. Experience and lessons learned brief. 29 p. http://www.worldlakes.org/uploads/cocibolca_30sep04.pdf.
Morgan M.J., Marshall C.T., O'Brien L., Mosqueira I. & Cerviño S. (2012) Report of the Workshop
on Implementation of Stock Reproductive Potential into Assessment and Management Advice for Harvested Marine Species. Scientific Council Studies, 44: 1–75. Doi:10.2960/S.v44.m1.
Murua H. & Motos L. (2006) Reproductive strategy and spawning activity of the European hake,
Merluccius merluccius (L.), in the Bay of Biscay. J. Fish. Biol., 69: 1288-1303. Murua H. & Saborido-Rey F. (2003) Female reproductive strategies of marine fish species of the north
Atlantic. J. Northw. Atl. Fish. Sci., 33: 23-31. Myers A.R. & Barrowman J.N. (1996) Is fish recruitment related to spawner abundance?. Fishery
Bulletin, 94(4): 707-724. NASA-Papagayo wind (). http://en.wikipedia.org/wiki/Papagayo_wind [Consulted 18 October 2011] NASA SeaWIFS (2000-2001) http://disc.sci.gsfc.nasa.gov/oceancolor/additional/science-focus/ocean-
color/papagayo.shtml [Consulted 18 October 2011]. National Research Council (2000) Improving the collection, management and use of marine fisheries
data. National Academy Press, Washington, D. C. NICANOR S.A. (2000) Documento de Impacto Ambiental Proyecto ‘‘Cultivo de Tilapia en Jaulas
Flotantes en la Isla de Ometepe’’, Altagracia, Rivas, Nicaragua, 130 pp. In: Tilapia (Teleostei: Cichlidae) status in Nicaraguan natural waters (McCrary J.K., Murphy B.R., Stauffer J.R.Jr. & Hendrix S.S., 2007) Environ Biol Fish., 78:107–114. Doi 10.1007/s10641-006-9080-x.
Noggle C.C. (1978) Behavioral, physiological, and lethal effects of suspended sediment on juvenile
salmonids. Master´s thesis. University of Washington, Seattle. In: Effects of intraspecific density and environmental variables on electrofishing catchability of brown and rainbow trout in the Colorado River (Speas W. D., Walters C. J., Ward D. L. & Rogers R. S., 2004). North American Journal of Fisheries Management, 24: 586-596.
Normas Jurídicas de Nicaragua (2008) Vedas de especies silvestres. Resolución Ministerial No. 003-
2008. Aprobada: 28 Enero 2008. Publicada en La Gaceta No. 37 21-02-08 http://legislacion.asamblea.gob.ni/Normaweb.nsf/($All)/071884F2B3F0FB7F062575E60054A7C4?OpenDocument. [Consulted: 5 December 2011].
Nunes D.M., Pellanda M. & Hartz S.M. (2004) Dinâmica reprodutiva de Oligosarcus jenynsii e O.
robustus (Characiformes, Characidae) na Lagoa Fortaleza, Rio Grande do Sul, Brasil. Iheringia Série Zoolgia, Porto Alegre, 94(1): 5-11.
Oldfield R., McCrary J. & McKaye K. (2006) Habitat Use, Social Behavior, and Female and Male
Size Distributions of Juvenile Midas Cichlids, Amphilophus cf. citrinellus, in Lake Apoyo, Nicaragua. Caribbean Journal of Science, 42(2): 197-207.
Olin M., Kurkilahti M., Peitola P. & Ruuhijärvi J. (2004) The effects of fish accumulation on the
catchability of multimesh gillnet. Fisheries Research, 68: 135–147. Oliveira C., Avelino G.S., Abe K.T., Mariguela T.C., Benine R.C., Orti G., Vari R.P., & Correa e
Castro R.M. (2011) Phylogenetic relationships within the speciose family Characidae (Teleostei:
PhD-Thesis Fishery ecology, reproduction and management References
237
Ostariophysi: Characiformes) based on multilocus analysis and extensive ingroup sampling. BMC Evolutionary Biology, 11: 275. Doi: 10.1186/1471-2148-11-275.
Orellana F. (1986) Evaluación de los recursos pesqueros del Lago de Nicaragua, preparado por el
Centro de Investigaciones Pesqueras, Instituto Nicaragüense de la Pesca, INPESCA. In: Trabajos presentados al Taller Internacional sobre ecología y manejo de peces en lagos y embalses (Eds. Vila I. & Fagetti E., 1986). Santiago, Chile, 5–10 de noviembre de 1984. COPESCAL Doc.Téc. (4): 237 p.
PANCANAL.com.<http://www.pancanal.com/esp/cuenca/rocc/6-10.pdf>[Consulted: 18 August
2011]. Parrish B.B. (1969) A review of some experimental studies of fish reactions to stationary and moving
objects of relevance to fish capture processes. FAO Fish.Rep., 2(62):233-45. Patrick R. (1954) The diatom flora of Bethany Bog: Jour. Protozoology, 1: 34-37. In: Bottom
sediments of Lake Nicaragua and Lake Managua, western Nicaragua (Swain F.M., 1976). Papers in the Biological Sciences. Investigations of the ichthyofauna of Nicaraguan Lakes. University of Nebraska-Lincoln. Journal of sedimentary petrology (1966), 36(2): 522-540.
Pitcher T.J. & Hart P.J.B. (1982) Fisheries ecology. Kluwer Academic Publishers. ISBN: 0412382601. Pérez-Rodriguez A., Morgan J. & Saborido-Rey F. (2009) Comparison of Demographic and Direct
Methods to calculate Probabilistic Maturation Reaction Norms for Flemish Cap cod (Gadus morhua). Evolutionary Applications, 2(3): 291-298
PNUMA-OEA (1997) Estudio de diagnóstico de la cuenca del Rio San Juan y lineamientos del plan de
acción. Manejo ambiental y desarrollo sostenible de la Cuenca de Río San Juan. Programa de las Naciones Unidas para el Medio Ambiente. Oficina de Desarrollo Sostenible y Medio Ambiente. Secretaría General de la Organización de Estados Americanos. Washington, D.C., EEUU, 268 p. ISBN: 0827037627.
Pomeroy R.S. & Rivera-Guieb R. (2006) Fishery Co-management: a Practical Handbook. CABI
Publishing. Wallingford, UK and International Development Research Centre, Ottawa, Canada. ISBN 1-55250-184-1 (IDRC e-book), 253 p.
Pope J.A., Margaretts A.R., Hamley J.M. & Akyüz E.F. (1975) Manual of methods for fish stock
assessment. Part III. Selectivity of fishing gear. FAO (Food Agr. Organ U. N.) Fish Tech. Pap. (41) Rev. 1. (In press). In: Review of gillnet selectivity (Hamley, J.M. 1975). J. Fish. Res. Board Can., 32: 1943-1969.
PRADEPESCA (1995) Encuesta de las actividades pesqueras con énfasis en la pesca artesanal.
Enfoque Regional Centroamericano, septiembre 1995. Programa regional de Apoyo al Desarrollo de la Pesca en el Istmo Centroamericano. Unión Europea- OLDEPESCA (CONVENIO ALA 90/09).
PROCUENCA-SAN JUAN (2004) Integración de los estudios básicos. Formulación de un programa
de acciones estratégicas para la gestión integrada de los recursos hídricos y el desarrollo sostenible de la cuenca del Río San Juan y su zona costera. 330 p. In: Lake Cocibolca/Nicaragua. Lake basin management initiative. Experience and lessons learned brief (Montenegro-Guillén S., 2003). 29 p. http://www.worldlakes.org/uploads/cocibolca_30sep04.pdf.
Regan C.T. 1906-08. Pisces. In: Biologia Centrali-Americana 8: 1-203. In: Geographic distribution of
the San Juan ichthyofauna of Central America with remarks on its origin and ecology (Bussing
PhD-Thesis Fishery ecology, reproduction and management References
238
W.A., 1976). Paper in the Biological Sciences. Investigations of the ichthyofauna of Nicaraguan Lakes. (ed. Thorson B.T. 1976). University of Nebraska-Lincoln.
Reynolds J.D., Dulvy N.K., Goodwin N.B. & Hutchings J.A. (2005) Biology of extinction risk in
marine fishes. Proc. R. Soc., B 272: 2337-2344. Ribeiro C.T. & Umaña V.G. (2010) Distribution of Agonostomus monticola and Brycon behreae in the
Río Grande de Térraba, Costa Rica and relations with water flow. Neotropical Ichthyology, 8(4):841-849. ISSN 1679-6225.
Riedel D. (1963) Contribution to the experimental determination of the selection parameter of gillnets.
Arch. Fischereiwiss. 14: 85–97. In: Manual on estimation of selectivity for gillnet and longline gears in abundance surveys (Hovgård H. & Lassen H., 2000). FAO Fisheries Technical Paper. No. 397. Rome, FAO. 2000.
Rijnsdorp A.D. (1991) Changes in fecundity of female North Sea plaice (Pleuronectes platessa L.)
between three periods since 1900. ICES Journal of Marine Science, 48 (3): 253-280. In: Pleuronectes platessa Family Pleuronectidae (ICES-FishMap___).
Rizzo E., Moura T.F.C., Sato Y. & Bazzoli N. (1998) Oocyte surface in four teleosts fish species
postspawning and fertilization. Brazilian Archives of Biology and Technology, 41: 37–48. Rizzo E., Sato Y., Barreto B.P. & Godinho H.P. (2002) Adhesiveness and surface patterns of eggs in
neotropical freshwater teleosts. Journal of Fish Biology, 61: 615–632. Doi: 10.1006/jfbi.2002.2085 Robson D.S. (1966) Estimation of the relative fishing power of individual ships. Research Bulletin,
International Commission for the North-west Atlantic Fisheries 3: 5-14. In: Application to the tweedie distribution to zero-catch data in CPUE analysis (Shono H., 2008). Fisheries Research, 93 (2008): 154-162.
Rodríguez M.A. & Lewis M.L. (1997) Structure of fish assemblages along environmental gradients in
floodplain lakes of the Orinoco river. Ecological Monographs, 67(1): 109-128. Ronald G.T. (2002) Laboratory calibration of postovulatory follicles from natural spawning common
snook. Florida Chapter, American Fisheries Society 19th Annual Meeting 12-14 February 2002, Brooksville Florida.
Rotherham D., Gray C.A., Broadhurst M.K., Johnson D.D., Barnes L.M., & Jones M.V. (2006)
Sampling estuarine fish using multi-mesh gill nets: effects of panel length and soak and setting times. Journal of Experimental Marine Biology and Ecology, 331: 226–239.
Saborido-Rey F. & Junquera S. (1998) Histological assessment of variation in sexual maturity of Cod
(Gadus morhua L.) at the Flemish Cap (north-west Atlantic). ICES J. Mar Sci., 55: 515-521. Saborido-Rey F & Kjesbu O.S. (2005) Growth and maturation dynamics. 26 p.
http://hdl.handle.net/10261/47150. Saborido-Rey F. & Trippel E. (2013) Fish reproduction and fisheries. Fisheries Research, 138: 1-4. Saborido-Rey F., Murua H. & Macchi G.J. (2011) I Iberoamerican symposium on reproductive
ecology, recruitment and fisheries. Ciencias Marinas, 37(4B): i-xii. Seehausen O. & Van Alphen J.J.M. (1998) The effect of male colouration on female mate choice in
closely related Lake Victoria cichlids (Haplochromis nyererei complex). Behav. Ecol. Sociobiol.,
PhD-Thesis Fishery ecology, reproduction and management References
239
42: 1–8. In: Male mating preferences pre-date the origin of a female trait polymorphism in an incipient species complex of Lake Victoria cichlids (Pierotti M.E.R. & Seehause O., 2006). Journal Compilation European Society for Evolutionary Biology. Doi:10.1111/j.1420-9101.2006.01206.x.
Seehausen O., Koetsier E., Schneider M.V., Chapman L.J., Chapman C.A., Knight M.E., Turner G.F.,
van Alphen J.J.M. & Bills R. (2003) Nuclear markers reveal unexpected genetic variation and a Congolese-Nilotic origin of the Lake Victoria cichlid species flock. Proc. R. Soc. Lond. B Biol. Sci. 270: 129–137. In: Male mating preferences pre-date the origin of a female trait polymorphism in an incipient species complex of Lake Victoria cichlids (Pierotti M.E.R. & Seehause O., 2006). Journal Compilation European Society for Evolutionary Biology. Doi:10.1111/j.1420-9101.2006.01206.x.
Selman K., Wallace R.A. & Barr V. (1986) Oogenesis in Fundulus heteroclitus. IV. Yolk-vesicle
formation. J. Exp. Zool., 239: 277-288. Selman K. & Wallace R.A. (1989) Cellular aspects of oocyte growth in teleosts. Zool. Sci., 6:211-231. Selman K., Wallace R.A. & Player D. (1991) Ovary of the seahorse, Hippocampus erectus. J.
Morphol., 209: 285-304. Shepherd G.R. & Grimes C.B. (1984) Reproduction of weakfish, Cynoscion regalis, in the New York
Bight and evidence for geographically specific life history characteristics. Fishery Bulletin, 82: 501-511.
Shin Y-J., Rochet M-J., Jennings S., Field J.G. & Gislason H. (2005) Using size-based indicators to
evaluate the ecosystem effects of fishing. ICES Journal of Marine Science, 62: 384-396. Shono H. (2008) Application to the tweedie distribution to zero-catch data in CPUE analysis.
Fisheries Research, 93: 154 – 162. Simmonds J. & MacLennan D. (2005) Fisheries Acoustics: Theory and Practice. 2nd edn. Blackwell
Science. Oxford. Fish and Aquatic Resources Series, 10. Skoblina M.N. (2010) Hydration of Oocytes in Teleost Fishes. ISSN 00623604, Russian Journal of
Developmental Biology, 2010, 41(1): 1–12. © Pleiades Publishing, Inc., 2010. Original Russian Text © M.N. Skoblina, 2010, published in Ontogenez, 2010, 41(1): 5-18.
Søndergaard M., Jeppesen E., Jensen J.P. & Amsinck S.L. (2005) Water framework directive:
ecological classification of Danish lakes. Journal of Applied Ecology, 42: 616–629. Sparre P. & Venema S.C. (1998) Introduction to tropical fish stock assessment. Part 1. Manual. FAO
Fisheries Technical Paper. No. 306.1, Rev. 2. Rome, FAO. 1998. 407p. Swain F.M. (1976) Bottom sediments of Lake Nicaragua and Lake Managua, western Nicaragua.
Papers in the Biological Sciences. Investigations of the ichthyofauna of Nicaraguan Lakes. University of Nebraska-Lincoln. Journal of sedimentary petrology (1966), 36(2): 522-540.
Takahashi E.L.H. (2006) Ciclo reprodutivo da tabarana Salminus hilarii (Valenciennes, 1849)
(Characidae, Salmininae) naregia˜o do baixo Rio Sorocaba, SP. PhD thesis. Sa˜o Paulo State University, Sa˜o Paulo. In: Patterns of oocyte development in natural habitat and captive Salminus hilarii Valenciennes, 1850 (Teleostei: Characidae) (Honji R.M., Narcizo A.M., Borella M.I., Romagosa E. & Moreira R.G., 2009). Fish Physiol Biochem., 35(1): 109-23. Epub 2008 Jun 10.
PhD-Thesis Fishery ecology, reproduction and management References
240
Takita T., Iwamoto T., Kai S. & Sogabe I. (1983) Maturation and spawning of the dragonet, Callionymus enneactis, in an aquarium. Jpn. J. Ichthyol., 30(3): 221 -226.
Teletchea F., Fostier A., Kamler E., Gardeur J.N., Le Bail P.Y., Jalabert B. & Fontaine P. (2009)
Comparative analysis of reproductive traits in 65 freshwater fish species: application to the domestication of new fish species. Rev Fish Biol Fisheries, 19: 403–430.
Thorsen A. & Fyhn H.J. (1996) Final oocyte maturation in vivo and in vitro in marine fishes with
pelagic eggs; yolk protein hydrolysis and free amino acid content. J. Fish Biol., 48(6): 1195-1209. Doi: 10.1111/j.1095-8649.1996.tb01814.x.
Thorsen A. & Kjesbu O.S. (2001) A rapid method for estimation of oocyte size and potential fecundity
in Atlantic cod using a computer-aided particle analysis system. J. Sea Res., 46(3-4): 295-308. Thorsen A., Marshall C.T. & Kjesbu O.S. (2006) Comparison of various potential fecundity models
for north-east Arctic cod Gadus morhua, L. using oocyte diameter as a standardizing factor. J. Fish. Biol., 69(6): 1709-1730.
Thorsen A., Witthames P.R., Marteinsdóttir G., Nash R.D.M. & Kjesbu O.S. (2010) Fecundity and
growth of Atlantic cod (Gadus morhua L.) along a latitudinal gradient. Fisheries Research, 104(1–3): 45–55.
Thorson T.B. (1976a) Movement of Bull Sharks, Carcharhinus leucas, between Caribbean Sea and
Lake Nicaragua demonstrated by tagging. Investigation of the ichthyofauna of Nicaraguan Lakes. Paper in the Biological Sciences. Reprinted by COPEIA, 1971, (2): 336-338.
Thorson T.B. (1976b) Observations on the reproduction of the Sawfish, Pristis perotteti, in Lake
Nicaragua, with recommendations for its conservation. Paper in the Biological Sciences. Investigation of the ichthyofauna of Nicaraguan Lakes.
Thorson T.B. (1982) The Impact of Commercial Exploitation on Sawfish and Shark Populations in
Lake Nicaragua. Fisheries. 7(2): 2-10. Doi:10.1577/1548-8446(1982). In: Lake Nicaragua revisited: conversations with a former sawfish fisherman (McDavitt M. T., 2002). In: Shark News 14: Newsletter of the IUCN Shark Specialist Group 14: 5. http://www.iucnssg.org/tl_files/Assets/pdf/SN/SN14%20LOW%20RES.pdf. [Consulted: 7 December 2011].
Tomkiewicz J., Morgan M.J., Burnett J. & Saborido-Rey F.(2003) Available information for
estimating reproductive potential of northwest Atlantic groundfish stock. J.Northw. Atl. Fish Sci., 33: 1-21.
Trippel E.A. (1995) Age at maturity as a stress indicator in fisheries. BioScience, 45(11): 759-771. Trippel E.A. (1999) Estimation of Stock Reproductive Potential: History and Challenges for Canadian
Atlantic Gadoid Stock Assessments. J. Northw. Atl. Fish. Sci., 25: 61-81. Tyler C.R. & Sumpter J.P. (1996) Oocyte growth and development in teleosts. Rev. Fish Biol. Fish., 6:
287-318. Vazzoler A. (1996) Biologia da reprodução de peixes teleósteos: teoria e prática. EDUEM, SBI,
Maringá, 169p.
PhD-Thesis Fishery ecology, reproduction and management References
241
Vicentin W., Costa F.E. dos S. & Súarez (2012) Length–weight relationships and length at first maturity for fish species in the upper Miranda River, southern Pantanal wetland, Brazil. Journal of Applied Ichthyology, 28: 143-145.
Villa J. (1982) Peces nicaragüenses de agua dulce. Colección Cult. Banco de América, Serie.
Geografía Naturaleza, 3: 253 p. Wallace R.A. & Selman K. (1981) Cellular and dynamic aspects of oocyte growth in teleosts. Amer.
Zool., 21: 325-343. Wallace R.A. & Selman K. (1985) Major protein changes during vitellogenesis and maturation of
Fundalus oocytes. Dev. Biol., 110: 492-498. Weber A.A., Arantes F.P., Sato Y., Rizzo E. & Bazzoli N. (2012) Oocyte adhesiveness and embryonic
development of Astyanax bimaculatus (Linnaeus, 1758) (Pisces: Characidae). Zygote: 1-5. Welcomme R.L., Cowx I.G., Coates D., Béné C., Funge-Smith S., Halls A., & Lorenzen K. (2010)
Inland fisheries and aquaculture. Phil. Trans. R. Soc., B (2010) 365: 2881-2896 West G. (1990) Methods of assessing ovarian development in fishes: a review. Aust. J. Mar. Freshw.
Res., 41: 199-222. Williams J.E. (2000) The Coefficient of Condition of Fish. Chapter 13 in Schneider, James C. (ed.)
2000. Manual of fisheries survey methods II: with periodic updates. Michigan Department of Natural Resources, Fisheries Special Report 25, Ann Arbor.
Williams K. (2007) Evaluation of the macroscopic staging method for determining maturity of female
Walleye Pollock Theragra chalcogramma in Shelikof Strait, Alaska. Reprinted from the Alaska Fishery Research Bulletin, 12(2):252-263.
Winfield I.J., Fletcher J.M., James J.B. & Bean C.W. (2009) Assessment of fish populations in still
waters using hydroacoustics and survey gill netting: Experiences with Arctic charr (Salvelinus alpinus) in the UK. Fisheries Research, 96: 30–38.
Winters G. H., Wheeler J. P. & Stansbury D. (1993) Variability in the reproductive output of spring-
spawning herring in the north-west Atlantic. ICES J. Mar.Sci., 50: 15-25. Doi:10.1006/jmsc.1993.1003.
Witthames P.R., Greer-Walker M., Dinis M.T. & Whiting C.L. (1995) The geographical variation in
the potential fecundity of Dover sole Solea solea (L) from European Shelf edge waters during 1991. N. J. Sea Res., 34(1): 45-58.
Witthames P.R., Thorsen A., Greenwood L.N., Saborido-Rey F., Dominguez R., Murua H., Korta M.
& Kjesbu, O.S. (2009) Advances in methods for determining fecundity: application of the new methods to marine fishes. Fish Bull., 107: 148-164.
Witthames P.R., Thorsen A. & Kjesbu O.S. (2010). The fate of vitellogenic follicles in experimentally
monitored Atlantic cod Gadus morhua (L.): Application to stock assessment. Fisheries Research, 104(1-3): 27-37.
Wootton R.J. (1990) Ecology of teleost fishes. Chapman and Hall, London, 386 p. ISBN:
0412317206(Hb).

PhD-Thesis Fishery ecology, reproduction and management References
242
Wootton R.J. (1984) Introduction: tactics and strategies in fish reproduction. In: Fish reproductions: strategies and tactics. (eds. Potts G.W. & Wootton R.J., 1984). Academic Press, New York, 1-12 p.
Wyllie E.T. (1987) Thirty-four species of California rockfishes: maturity and seasonality of
reproduction. Fish. Bull., 85(2): 229-251.

Appendix I: RESUMEN


Universida Vigo
Departamento de Ecoloxía e Bioloxía Animal
Memoria de Tesis Doctoral para optar al título de Doctor por la Universidad de Vigo
Ecología pesquera de los peces de agua dulce en el Lago de Nicaragua. Reproducción y manejo de
Brycon guatemalensis
Presentada por:
Aldo Hernández Portocarrero
Vigo, España 2013
de

i
Introducción
Los cuerpos de agua dulce son sistemas muy dinámicos, pero a la vez muy vulnerables
frente al impacto de las actividades humanas. Sorprendentemente, estos ecosistemas
responden positivamente a las medidas de manejo (Maitland & Morgan, 1997). Los habitas
dulce acuícolas han sido divididos en humedales y aguas abiertas. Estos son muy variables en
características y varían en lenticos (lagos) y loticos (ríos) (Maitland & Morgan, 1997). Los
lagos son sistemas cerrados con un cuerpo de agua definido y ecología relativamente más
estable que los ríos (Welcomme et al., 2010). En los lagos de áreas tropicales la temperatura
no varía mucho, y la profundidad es uno del parámetro más importante que influye en el
ecosistema (Maitland & Morgan, 1997). La transparencia del agua depende de la profundidad
de la zona fótica la cual puede ser alterada por la cantidad de sedimentos que entra en el
ecosistema. En los lagos se han observado cambios ecológicos debido a la introducción de
especies exóticas, causando la extinción de especies nativas por depredación u otros
mecanismos (Cowx, 1998a; 1999).
Las pesquerías en cuerpos de aguas continentales (CAC) se han incrementado de 9.8
millones de toneladas en el 2006 a 11.5 millones de toneladas en 2011 (FAO, 2012). A pesar
del incremento de la producción se sabe de que el grado de utilización de los recursos
pesqueros varía de un lago a otro de acuerdo a dos tipos de pesquerías: demersal/ costero y
pelágico/aguas abiertas. Esto contribuye a la percepción de que las pesquerías en algunos
CAC no son sostenibles debido a que las capturas están descendiendo, especies están
desapareciendo y muchos otros síntomas de sobrepesca son reportados (Welcomme et al.,
2010). Las pesquerías son generalmente caracterizadas por ser pesquerías de pequeña escala
practicadas de manera artesanal que tienen una gran importancia como fuente de alimento y
empleo para el desarrollo de las comunidades rurales.
El Lago de Nicaragua es el más grande de Centro América con una superficie de 8000
km2, es el noveno lago más grande de las Américas y el diecinueveavo más grande en el
mundo. Este ha sido reconocido como un importante cuerpo de agua con una importante
fuente de recursos vivos para el sector pesquero (Davies & Pierce, 1972), pero sus
dimensiones lo convierten en un CAC muy atractivo para el desarrollo de la acuicultura. Sin
PhD-Tesis Ecología pesquera, reproducción y manejo Introducción
ii
embargo, contrasta con el hecho que algunas especies están sobreexplotadas y otras en riesgo
de sobreexplotación si no se toman medidas de manejo (Thorson, 1982; Adams et al., 2006).
En el Lago de Nicaragua las precipitaciones oscilan entre 700 y 2500 mm y una marcada
estación seca (PENUMA-OEA, 1997). Las aguas del lago atraviesan por ocho diferentes
ecosistemas terrestres (Montenegro-Guillén, 2003). La ausencia de estratificación física-
química y clorofila a, indica que es un lago polimíctico, y el cálculo del índice trófico de
Carlson indica que es un lago eutrófico con tendencia a disminuir la calidad de sus aguas
(PROCUENCA-SAN JUAN, 2004). Los cambios en la calidad de las aguas son lo que más
afectan la ecología de los lagos, afectando su transparencia, el régimen de oxígeno disuelto y
la residencia de los organismos (Welcomme et al., 2010). En la zona tropical donde está
localizado el Lago de Nicaragua predominan dos estaciones bien definidas, la estación
lluviosa de Mayo a Octubre y la estaciona seca de Noviembre a Abril. Además el lago es
afectado por los vientos Alisios que soplan de este a oeste durante los meses de Enero a Mayo
que no permiten una estratificación térmica del lago.
El subsistema del lago recibe contribuciones de numerosos ríos siendo los más
importantes los localizados en parte este del lago tales como Malacatoga, Tecolostote,
Mayales, Acoyapa, Oyate, Comastro y Tule. La salida natural del lago es el Río San Juan el
cual drena sus aguas al Mar Caribe. El nivel del agua del lago oscila entre 3 y 4 metros cada
año y el nivel más bajo y más alto ocurre en Abril y Octubre, respectivamente. Las
temperaturas de superficie de las aguas del lago varían entre los 25º y 28º C sin haber
estratificación térmica.
Los estudios sobre la distribución taxonómica de los peces continentales en Centro
América han permitido reconocer la existencia de cuatro provincias, entre ellas la Provincia
de San Juan (Bussing, 1976), a la cual fueron asignados los peces de agua dulce de Nicaragua.
La mayor diversidad de peces se encuentra en el Río San Juan (46 especies), 32 de ellas se
encuentran en Lago de Nicaragua. Nueve especies con afinidad marina que entran al lago han
sido reportadas.
Las áreas de reproducción de las especies más estudiadas como los ciclidos son las zonas
rocosas (McKaye, 1977; Olfield, McCrary & McKaye, 2006), mientras que las depresiones
PhD-Tesis Ecología pesquera, reproducción y manejo Introducción
iii
arenosas son habitas adecuados para el desove de otros ciclidos como Hypsophrys (Conkel,
1993). El reclutamiento de especies migratorias como Brycon guatemalensis, que exhiben
migración potádroma ha sido identificado a lo largo del río San Juan (PROCUENCA-SAN
JUAN, 2004) mientras las zonas de desove ocurren río arriba hacia el lago (Horn, 1997) y en
los ríos tributarios (McLarney et al., 2010).
El patrón de explotación de los peces en el lago de Nicaragua ha variado pasando de
explotar grandes peces como el Pez Sierra y Tiburón Toro para consumo domestico y
exportación (Thorson, 1982) a pescar peces más pequeños como Robalos, Gaspar, Guapote,
(Parachromis spp.) y una variedad de Mojarras (Amphilophus ssp.). Los datos históricos de
desembarque de 30 años hasta 1987 fueron menores 300 toneladas lo que se debe
probablemente a que estos datos provienen de los principales mercados de comercialización
del producto. Las estadísticas han mejorado desde 1993, y de 1994 a 2006 se reflejaron
estadísticas de desembarque no registrado equivalente al 100 % de lo registrado (ADPESCA,
2006). Sin embargo, no permiten obtener una clara estimación de la composición por especie
de las capturas.
La actividad pesquera en el Lago de Nicaragua es desarrollada principalmente por
pescadores artesanales. Esta actividad ha variado de ser ejercida de manera temporal a
permanente (Davies & Pierce, 1972). La pesca se caracteriza por el uso principalmente de
redes de enmalle o agalleras (gillnet) bajo la modalidad de pesca pasiva. Sin embargo, estas
son utilizadas bajo otras modalidades como la modalidad de “Chinchorro playero” y
“pimponeo”. Otra forma de pesca es el uso de líneas de mano (línea y anzuelo).
La pesquería en el Lago de Nicaragua enfrenta la misma complejidad de cualquier otra
pesquería a aguas continentales, debido principalmente a la naturaleza multiespecífica de su
explotación, i.e., muchas especies, con diferentes tallas y formas son capturadas con el mismo
tipo de red. Las medidas regulatorias de la pesquería en el Lago de Nicaragua están en la línea
de: i) recuperación de los recursos sobreexplotados como Tiburón Toro y Pez Sierra
(Thorson, 1982; McDavitt, 2002; Adams et al., 2006); ii) prevención de sobreexplotación de
otras especies como Gaspar, Robalo, Roncador (Camacho & Gadea, 2005); iii) la
sostenibilidad de los recursos comercialmente explotados tales como Mojarras, Guapotes,
Machaca, Guavina y Bagres (Gadea, 2003; Hernández-Portocarrero & Saborido-Rey, 2007).
PhD-Tesis Ecología pesquera, reproducción y manejo Introducción
iv
Las regulaciones adoptadas para las pesquerías del lago van desde la prohibición del uso de
redes de arrastre, de palangres y uso de redes agalleras cerca de la boca o dentro de los ríos.
Sin embargo, medidas de referencia biológica para el manejo de los recursos pesqueros aún
no se han establecido, ya que la mayoría de las medidas están basada en la evaluación de la
distribución y abundancia de las capturas de las especies importantes comercialmente, sobre
estudios de selectividad de la red y en la determinación macroscópica de dos parámetros
biológicos como longitud de madurez y estados de madurez gonadal (Davies & Pierce, 1972;
INFONAC, 1974; Martínez, 1976; Ketúnin et al., 1983; Orellana, 1986; Gadea, 2003,
Hernández-Portocarrero & Saborido-Rey, 2007).
Actualmente hay un vacío de conocimiento sobre otros parámetros biológicos
importantes como la dinámica del comportamiento reproductivo de la población a nivel inter
e intra específico, el ciclo reproductivo, área de desove, producción de huevos y
características maternales que afectan el producto final de la reproducción. Esto previene la
implementación de acciones de manejo dirigidas a la conservación del potencial reproductivo
(Saborido-Rey & Trippel, 2013), tales como épocas y/o zonas de veda, y mínima y máxima
talla de desembarque. En este estudio además de proveer información acerca del actual estado
de distribución y abundancia de regulaciones de Amphilophus citrinellus, Hypsophrys
nicaraguensis, Parachromis managuensis, y Brycon guatemalensis, es suministrada
información de la estrategia reproductiva de B. guatemalensis y propuesta algunas medidas de
manejo alternativo basado en características biológicas.
El objetivo del presente estudio es desarrollar una herramienta de manejo apropiado en el
Lago de Nicaragua basado en conocimiento biológico y ecológico de las especies explotadas.
Para alcanzar los objetivos del estudio es analizado: a) la distribución y abundancia relativa de
las principales especies a una escala temporal y espacial en función de los factores
ambientales basado en las exploraciones pesqueras mensuales realizadas en el algo (Chapter
3); b) la estrategia reproductiva aplicando procedimientos histológicos, enfocado en la
biología reproductiva y potencial reproductivo del stock utilizando como caso de estudio
Brycon guatemalensis (Chapter 4); c) el impacto del arte de pesca sobre el potencial
reproductivo del stock (SRP), determinando la parte de la población más sensible y relevante,
en términos de productividad para delinear el manejo del stock de peces en el Lago de
Nicaragua (Chapter 5).
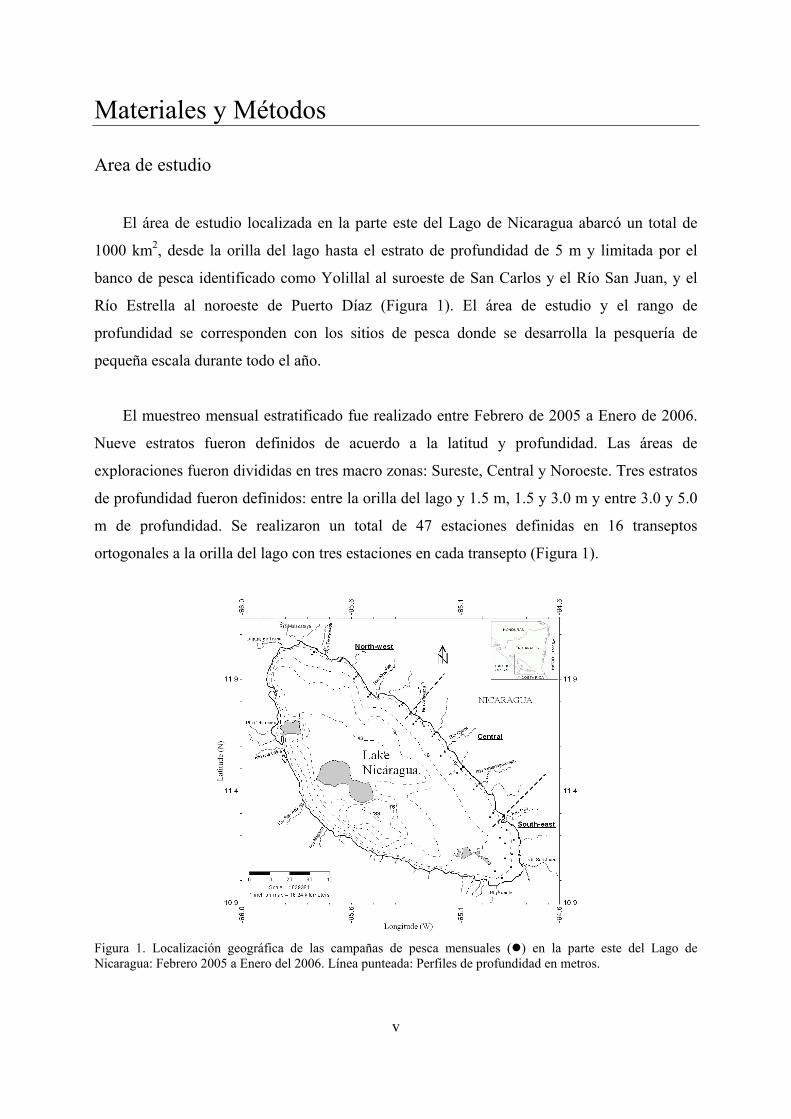
v
Materiales y Métodos
Area de estudio
El área de estudio localizada en la parte este del Lago de Nicaragua abarcó un total de
1000 km2, desde la orilla del lago hasta el estrato de profundidad de 5 m y limitada por el
banco de pesca identificado como Yolillal al suroeste de San Carlos y el Río San Juan, y el
Río Estrella al noroeste de Puerto Díaz (Figura 1). El área de estudio y el rango de
profundidad se corresponden con los sitios de pesca donde se desarrolla la pesquería de
pequeña escala durante todo el año.
El muestreo mensual estratificado fue realizado entre Febrero de 2005 a Enero de 2006.
Nueve estratos fueron definidos de acuerdo a la latitud y profundidad. Las áreas de
exploraciones fueron divididas en tres macro zonas: Sureste, Central y Noroeste. Tres estratos
de profundidad fueron definidos: entre la orilla del lago y 1.5 m, 1.5 y 3.0 m y entre 3.0 y 5.0
m de profundidad. Se realizaron un total de 47 estaciones definidas en 16 transeptos
ortogonales a la orilla del lago con tres estaciones en cada transepto (Figura 1).
Figura 1. Localización geográfica de las campañas de pesca mensuales () en la parte este del Lago de Nicaragua: Febrero 2005 a Enero del 2006. Línea punteada: Perfiles de profundidad en metros.
PhD-Tesis Ecología pesquera, reproducción y manejo Materiales y métodos
vi
Para la captura de los peces se utilizaron tres redes enmalle (agalleras) monofilamento de
200 metros de largo, cada una compuesta de 50 m, con luz de malla de 75, 100, 125 y 150
mm de malla estirada. La altura de la red se correspondieron con el estrato de profundidad,
i.e., 1.5, 3.0 y 5.0 metros.
La captura fue registrada en número de individuos. Los peces enmallados fueron
separados por luz de malla de la red, a los que se tomaron datos biomorfométricos adicionales
como altura del cuerpo entre el opérculo y la aleta dorsal.
A los especímenes colectados se les tomó datos de talla, peso entero y eviscerado, se
determinó el sexo (macho y hembra) y se colectaron ovarios de Brycon guatemalensis que
fueron pesados en condición fresca. En total 371 ovarios fueron colectados y fijados en
formalina al 4 %.
Distribución y abundancia
Captura Por Unidad de Esfuerzo (CPUE): En el presente estudio la CPUE es
expresada como la proporción entre la captura (en número de especímenes) y el esfuerzo (en
horas multiplicado por el área de la red). La CPUE fue modelado en función de la escala
espaciotemporal y de los factores ambientales. Debido a la ocurrencia de “cero” capturas en
algunas estaciones de pesca, el método “ad hoc” (Robson, 1966) fue utilizado para al cálculo
de la CPUE de A. citrinellus, H. nicaraguensis, P. managuensis y B. guatemalensis, al que fue
sumado un valor constante antes de ser transformado:
Ln (CPUE n/h * m2 + 1)
Estudios reproductivos
Desarrollo del ovocito: Mediante procedimientos histológicos fueron analizados los
ovarios de 371 hembras de B. guatemalensis en los que se determinó el estado de desarrollo
de los ovocitos en base a la terminología de clasificación (Wallace & Selman, 1981; West,
1990; Tyler & Sumpter, 1996; Saborido-Rey & Junquera, 1998; Murua & Saborido-Rey,
2003) siguiente: crecimiento primario (PG), alvéolos corticales (CA), vitelogénesis inicial
PhD-Tesis Ecología pesquera, reproducción y manejo Materiales y métodos
vii
(VIT1), vitelogénesis avanzada (VIT2) y vesícula germinal migratoria (GVM), además se
identificaron las estructuras: folículos post-ovulatorios (POF) y huevos en atresia.
Ciclo reproductivo: Las gónadas fueron clasificadas en fases reproductivas siguiendo la
terminología propuesta por Brown-Peterson et al., (2011), incluyendo en este estudio la sub-
fase puesta activa (AS) como una fase reproductiva. Así seis fases fueron consideradas para la
clasificación reproductiva: Inmaduros (I), Desarrollo (D), Capacidad de desove (SC), Puesta
activa (AS), Regresión (Rgs) y Recuperación (Rgn) basadas en la presencia de los diferentes
estados de desarrollo de los ovocitos como PG, AC, VIT1, VIT2, GVM ovocitos en atresia y
en la presencia de POF.
Fracción desovante (Sf): La fracción desovante (Sf) definida como la fracción de
hembras maduras que desovan por día (Alheit, 1985) fue calculada en base a la prevalencia de
estados de desove o fases determinadas a partir del muestreo de gónadas al azar:
Índices somáticos: El índice gonadosomático (GSI) y el factor de condición (K) fue
estimado en 240 y 305 especímenes, respectivamente, de acuerdo a:
∗ 100 ∗ 100
Madurez: La ojiva de madurez de hembras de B. guatemalensis fue determinada
utilizando los resultados de la observación macroscópica de 1526 ovarios examinados, y los
resultados de las observaciones histológica (microscópica) de las 371 ovarios. La madurez fue
analizada en función de la longitud del pez ajustada a una ecuación logística:
Pe
e
a bL
a bL
1; y su transformación logarítmica: bLa
P
P
ˆ1
ˆln
Donde “P” es la proporción de individuos maduros, “a” y “b” los coeficientes estimados de la
ecuación logística y “L” la talla. La L50 es definida como –a/b.
Sf =
SC + AS
D + SC + AS + Rgn
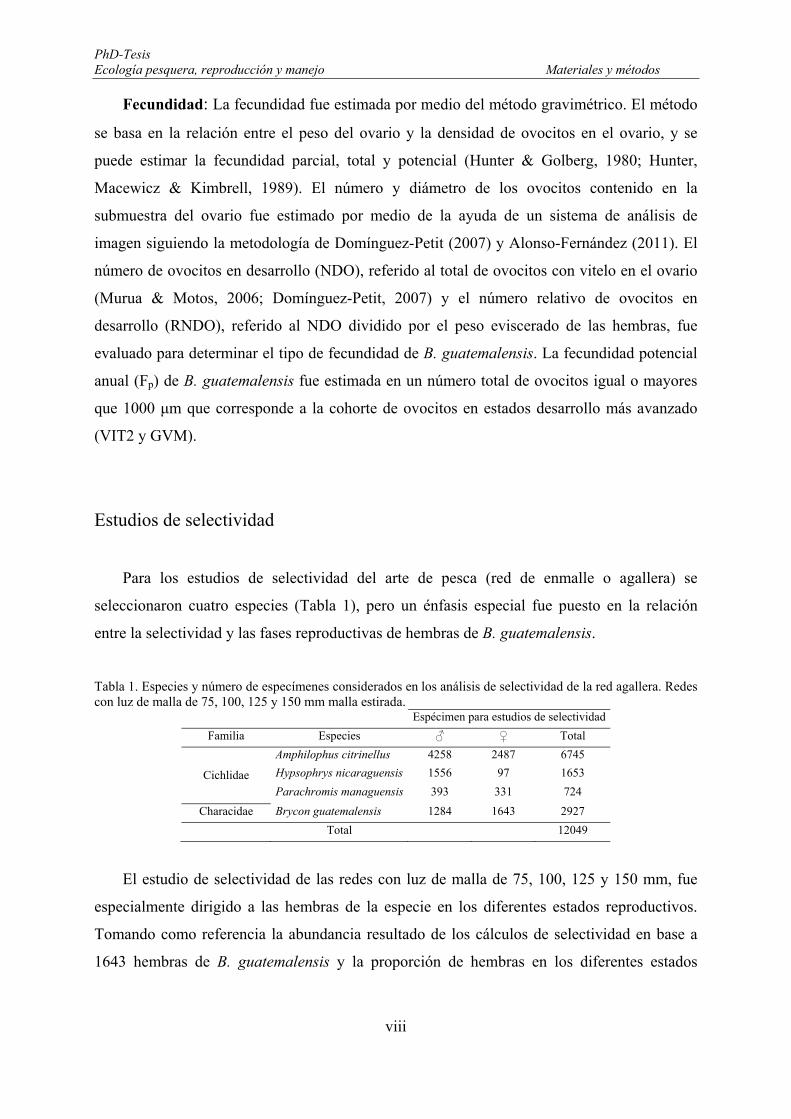
PhD-Tesis Ecología pesquera, reproducción y manejo Materiales y métodos
viii
Fecundidad: La fecundidad fue estimada por medio del método gravimétrico. El método
se basa en la relación entre el peso del ovario y la densidad de ovocitos en el ovario, y se
puede estimar la fecundidad parcial, total y potencial (Hunter & Golberg, 1980; Hunter,
Macewicz & Kimbrell, 1989). El número y diámetro de los ovocitos contenido en la
submuestra del ovario fue estimado por medio de la ayuda de un sistema de análisis de
imagen siguiendo la metodología de Domínguez-Petit (2007) y Alonso-Fernández (2011). El
número de ovocitos en desarrollo (NDO), referido al total de ovocitos con vitelo en el ovario
(Murua & Motos, 2006; Domínguez-Petit, 2007) y el número relativo de ovocitos en
desarrollo (RNDO), referido al NDO dividido por el peso eviscerado de las hembras, fue
evaluado para determinar el tipo de fecundidad de B. guatemalensis. La fecundidad potencial
anual (Fp) de B. guatemalensis fue estimada en un número total de ovocitos igual o mayores
que 1000 μm que corresponde a la cohorte de ovocitos en estados desarrollo más avanzado
(VIT2 y GVM).
Estudios de selectividad
Para los estudios de selectividad del arte de pesca (red de enmalle o agallera) se
seleccionaron cuatro especies (Tabla 1), pero un énfasis especial fue puesto en la relación
entre la selectividad y las fases reproductivas de hembras de B. guatemalensis.
Tabla 1. Especies y número de especímenes considerados en los análisis de selectividad de la red agallera. Redes con luz de malla de 75, 100, 125 y 150 mm malla estirada.
Espécimen para estudios de selectividad
Familia Especies ♂ ♀ Total
Cichlidae
Amphilophus citrinellus 4258 2487 6745
Hypsophrys nicaraguensis 1556 97 1653
Parachromis managuensis 393 331 724
Characidae Brycon guatemalensis 1284 1643 2927
Total 12049
El estudio de selectividad de las redes con luz de malla de 75, 100, 125 y 150 mm, fue
especialmente dirigido a las hembras de la especie en los diferentes estados reproductivos.
Tomando como referencia la abundancia resultado de los cálculos de selectividad en base a
1643 hembras de B. guatemalensis y la proporción de hembras en los diferentes estados
PhD-Tesis Ecología pesquera, reproducción y manejo Materiales y métodos
ix
reproductivos, determinados histológicamente en 371 hembras, se estimó el número de
hembras en la población utilizando la siguiente ecuación:
∑
Donde NRlm = número total de peces de talla l por luz de malla m en la diferentes fases
reproductivas.
El impacto de cada luz de malla en el stock de inmaduros y maduros fue evaluado
utilizando la ojiva de maduración macroscópica estimada para H. nicaraguensis, A.
citrinellus, P. managuensis y B. guatemalensis previamente estimada (Hernández-
Portocarrero & Saborido-Rey, 2007) y la ojiva microscópica estimada para B. guatemalensis.
Adicionalmente, basados en los estudios histológicos, fue evaluado impacto de la selectividad
en el stock de hembras de B. guatemalensis en las fases reproductivas de los individuos
maduros.
Además, el impacto de las redes en la producción de huevos fue evaluado estimando el
potencial de huevos producidos por las hembras capturadas en cada luz de malla de la red,
utilizando la ecuación potencial obtenida de la relación de la fecundidad potencial y la
longitud de las hembras de B. guatemalensis:
∗ 0.0626 .
Donde EPm es la producción potencial de huevos por luz de malla de la red: HRlm es el
número de hembras de talla l y luz de malla m.

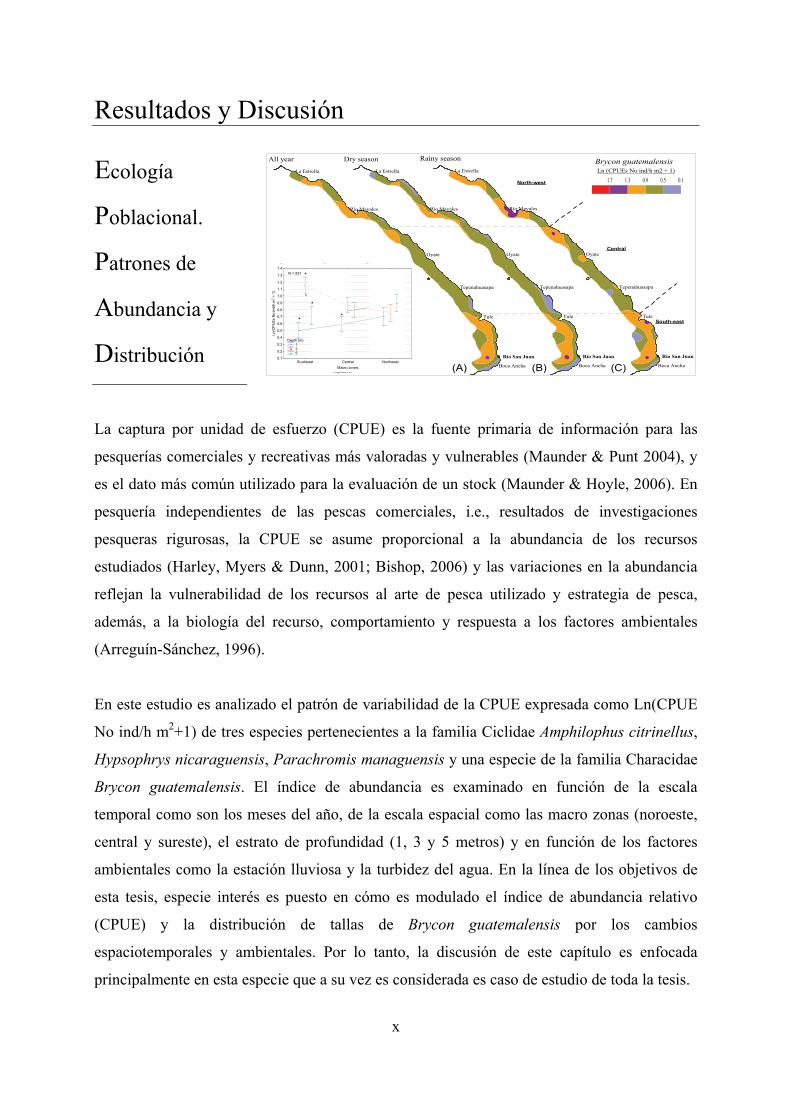
x
Resultados y Discusión
Ecología
Poblacional.
Patrones de
Abundancia y
Distribución
La captura por unidad de esfuerzo (CPUE) es la fuente primaria de información para las
pesquerías comerciales y recreativas más valoradas y vulnerables (Maunder & Punt 2004), y
es el dato más común utilizado para la evaluación de un stock (Maunder & Hoyle, 2006). En
pesquería independientes de las pescas comerciales, i.e., resultados de investigaciones
pesqueras rigurosas, la CPUE se asume proporcional a la abundancia de los recursos
estudiados (Harley, Myers & Dunn, 2001; Bishop, 2006) y las variaciones en la abundancia
reflejan la vulnerabilidad de los recursos al arte de pesca utilizado y estrategia de pesca,
además, a la biología del recurso, comportamiento y respuesta a los factores ambientales
(Arreguín-Sánchez, 1996).
En este estudio es analizado el patrón de variabilidad de la CPUE expresada como Ln(CPUE
No ind/h m2+1) de tres especies pertenecientes a la familia Ciclidae Amphilophus citrinellus,
Hypsophrys nicaraguensis, Parachromis managuensis y una especie de la familia Characidae
Brycon guatemalensis. El índice de abundancia es examinado en función de la escala
temporal como son los meses del año, de la escala espacial como las macro zonas (noroeste,
central y sureste), el estrato de profundidad (1, 3 y 5 metros) y en función de los factores
ambientales como la estación lluviosa y la turbidez del agua. En la línea de los objetivos de
esta tesis, especie interés es puesto en cómo es modulado el índice de abundancia relativo
(CPUE) y la distribución de tallas de Brycon guatemalensis por los cambios
espaciotemporales y ambientales. Por lo tanto, la discusión de este capítulo es enfocada
principalmente en esta especie que a su vez es considerada es caso de estudio de toda la tesis.
Río Mayales
Boca Ancha
Tule
Tepenahuasapa
Oyate
La Estrella
Río San Juan
Río Mayales
Boca Ancha
Tule
Tepenahuasapa
Oyate
La Estrella
Río San Juan
Ln (CPUEs No ind/h m2 + 1)
Dry seasonAll year
Río Mayales
Boca Ancha
Tule
Tepenahuasapa
Oyate
La Estrella
Río San Juan
Rainy season
11.0 11.0
11.5 11.5
12.0 12.0
2LakeNicaragua
3316
139
6
NICARAGUA
Longitude (W)
0 10 20 30 40
Scale 1 : 6393431 inch on map = 16.24 kilometers
(A) (B) (C)
North-west
Central
South-east
0.10.50.91.31.7
Brycon guatemalensis
Southeast Central Northwest
Macro zones
0.1
0.2
0.3
0.4
0.5
0.6
0.7
0.8
0.9
1.0
1.1
1.2
1.3
1.4Ln
(CP
UE
s N
o in
d/h
m2 +
1)
Depth (m) 1 3 5
N = 531
*
*
*
**
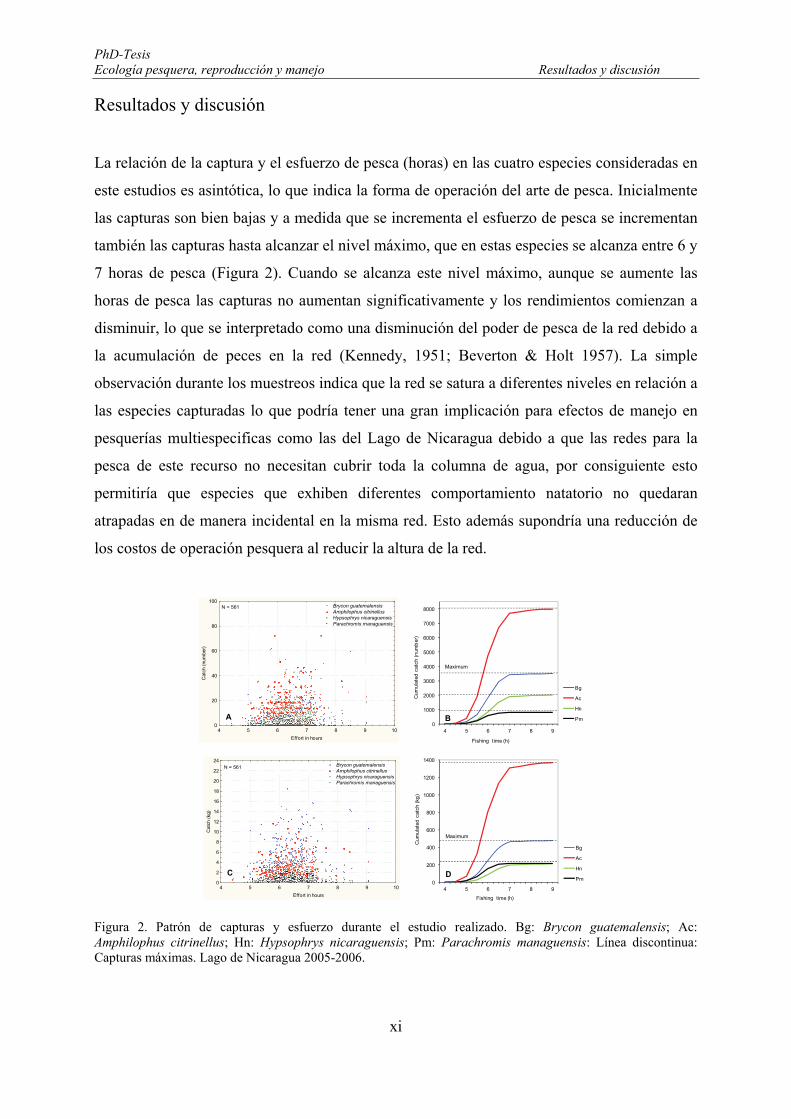
PhD-Tesis Ecología pesquera, reproducción y manejo Resultados y discusión
xi
Resultados y discusión
La relación de la captura y el esfuerzo de pesca (horas) en las cuatro especies consideradas en
este estudios es asintótica, lo que indica la forma de operación del arte de pesca. Inicialmente
las capturas son bien bajas y a medida que se incrementa el esfuerzo de pesca se incrementan
también las capturas hasta alcanzar el nivel máximo, que en estas especies se alcanza entre 6 y
7 horas de pesca (Figura 2). Cuando se alcanza este nivel máximo, aunque se aumente las
horas de pesca las capturas no aumentan significativamente y los rendimientos comienzan a
disminuir, lo que se interpretado como una disminución del poder de pesca de la red debido a
la acumulación de peces en la red (Kennedy, 1951; Beverton & Holt 1957). La simple
observación durante los muestreos indica que la red se satura a diferentes niveles en relación a
las especies capturadas lo que podría tener una gran implicación para efectos de manejo en
pesquerías multiespecificas como las del Lago de Nicaragua debido a que las redes para la
pesca de este recurso no necesitan cubrir toda la columna de agua, por consiguiente esto
permitiría que especies que exhiben diferentes comportamiento natatorio no quedaran
atrapadas en de manera incidental en la misma red. Esto además supondría una reducción de
los costos de operación pesquera al reducir la altura de la red.
Figura 2. Patrón de capturas y esfuerzo durante el estudio realizado. Bg: Brycon guatemalensis; Ac: Amphilophus citrinellus; Hn: Hypsophrys nicaraguensis; Pm: Parachromis managuensis: Línea discontinua: Capturas máximas. Lago de Nicaragua 2005-2006.
0
1000
2000
3000
4000
5000
6000
7000
8000
4 5 6 7 8 9
Cum
ulat
ed c
atch
(nu
mb
er)
Fishing time (h)
Bg
Ac
Hn
PmB
Maximum
0
200
400
600
800
1000
1200
1400
4 5 6 7 8 9
Cum
ulat
ed c
atch
(kg
)
Fishing time (h)
Bg
Ac
Hn
PmD
Maximum
4 5 6 7 8 9 10
Effort in hours
0
2
4
6
8
10
12
14
16
18
20
22
24
Cat
ch (
kg)
Brycon guatemalensis Amphilophus citrinellus Hypsophrys nicaraguensis Parachromis managuensis
N = 561
4 5 6 7 8 9 10
Effort in hours
0
20
40
60
80
100
Cat
ch (
num
ber)
Brycon guatemalensis Amphilophus citrinellus Hypsophrys nicaraguensis Parachromis managuensis
N = 561
A
C
PhD-Tesis Ecología pesquera, reproducción y manejo Resultados y discusión
xii
Las redes de enmalle (gillnet) han sido ampliamente utilizadas para investigaciones
pesqueras (Hansen, Schorfhaar & Selgeby, 1998) y la CPUE es usada en investigaciones
aplicadas como un índice de abundancia de los peces, basado en diseños de muestreo
utilizando varias mallas (European Union, 2000; Sondergaard et al., 2005; Diekmann et al.,
2005). Pero la eficiencia de este tipo de arte depende grandemente de factores técnicos y
biológicos, incluyendo luz de malla, longitud de la red, tiempo de calado, saturación de la red,
abundancia de los peces, morfología, comportamiento y actividad del pez (Beverton & Holt
1957; Hamley, 1975; Olin et al., 2004; Rotherham et al., 2006). A pesar de que el arte está
muy influenciado por los factores indicados, técnicas hydroacústicas para estimar biomasa de
peces en lagos estratificados han mostrado una fuerte correspondencia con las CPUE
obtenidas con gillnet (Emmrich et al., 2012). Por lo que probablemente la CPUE estimada en
el presente estudio puede ser considerada como un buen índice de abundancia de los peces del
Lago de Nicaragua.
La variación de la abundancia interanual es hipotéticamente está fuertemente influencia
por el efecto espaciotemporal, tanto horizontal (macro zonas) y vertical (profundidad), y por
los factores ambientales como la estacionalidad de la precipitación. Cada uno de estos
factores de manera independiente determina significativamente la abundancia en el área de
estudio, pero también las interacciones entre estos factores indican la complejidad de la
distribución de los peces y los movimientos estacionales.
Las cuatro especies estudiadas se distribuyen ampliamente en la parte este del Lago de
Nicaragua (Figura 3). Los factores más determinantes que influyeron en la distribución
espacial de los ciclidos fueron la profundidad y las macro zonas (Figura 4). Estas especies
fueron más abundantes en aguas someras. La profundidad influye en la composición de los
grupos de peces en los lagos (Rodriguez & Lewis, 1997), debido a la variación del periodo en
que los humedales son inundados o hidro periodo. (Fernandes, Machado & Penha 2010). La
distribución y abundancia de los ciclidos puede estar relacionada con la afinidad de estos con
las áreas rocosas (Olfields, 2006) que en el lago están localizadas cerca de la orilla.
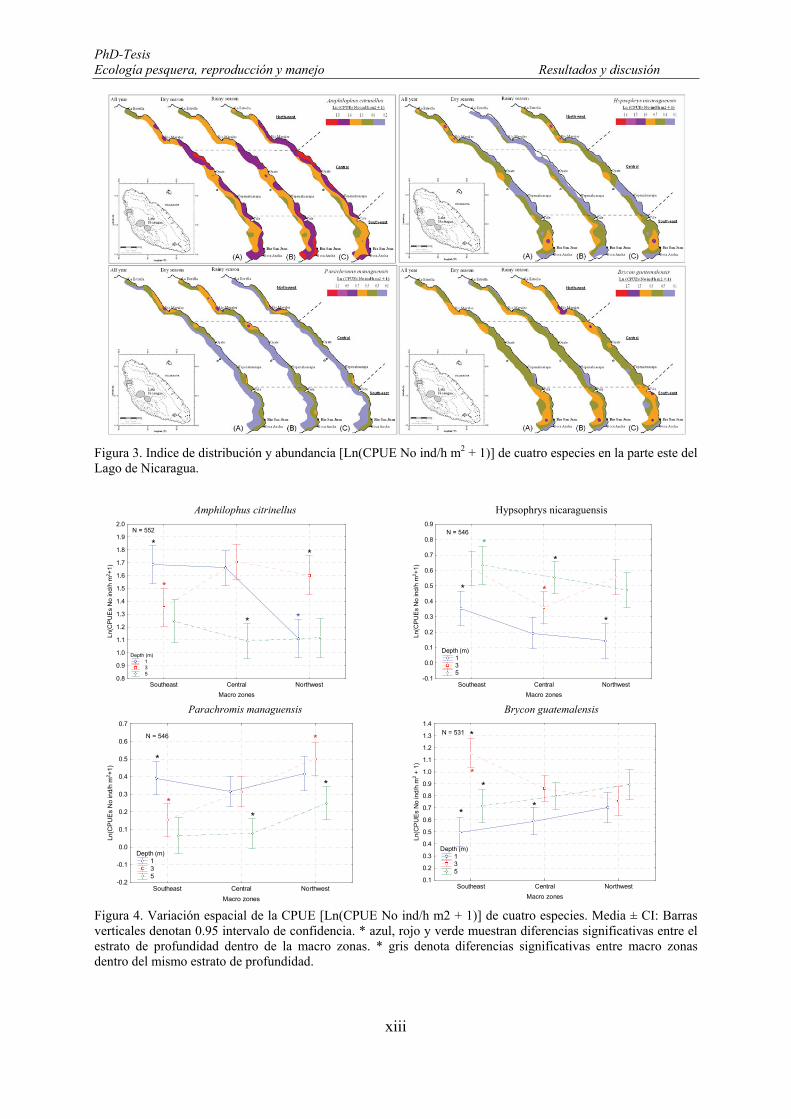
PhD-Tesis Ecología pesquera, reproducción y manejo Resultados y discusión
xiii
Figura 3. Indice de distribución y abundancia [Ln(CPUE No ind/h m2 + 1)] de cuatro especies en la parte este del Lago de Nicaragua.
Amphilophus citrinellus Hypsophrys nicaraguensis
Parachromis managuensis Brycon guatemalensis
Figura 4. Variación espacial de la CPUE [Ln(CPUE No ind/h m2 + 1)] de cuatro especies. Media ± CI: Barras verticales denotan 0.95 intervalo de confidencia. * azul, rojo y verde muestran diferencias significativas entre el estrato de profundidad dentro de la macro zonas. * gris denota diferencias significativas entre macro zonas dentro del mismo estrato de profundidad.
Southeast Central Northwest
Macro zones
0.8
0.9
1.0
1.1
1.2
1.3
1.4
1.5
1.6
1.7
1.8
1.9
2.0
Ln(C
PU
Es
No
ind/
h m
2 +1)
Depth (m) 1 3 5
N = 552
*
*
*
*
*
Southeast Central Northwest
Macro zones
-0.1
0.0
0.1
0.2
0.3
0.4
0.5
0.6
0.7
0.8
0.9
Ln(C
PU
Es
No
ind/
h m
2 +1)
Depth (m) 1 3 5
N = 546
*
*
*
*
*
Southeast Central Northwest
Macro zones
-0.2
-0.1
0.0
0.1
0.2
0.3
0.4
0.5
0.6
0.7
Ln(C
PU
Es
No
ind/
h m
2 +1)
N = 546
Depth (m) 1 3 5
*
*
*
*
*
Southeast Central Northwest
Macro zones
0.1
0.2
0.3
0.4
0.5
0.6
0.7
0.8
0.9
1.0
1.1
1.2
1.3
1.4
Ln(C
PU
Es
No
ind/
h m
2 + 1
)
Depth (m) 1 3 5
N = 531
*
*
*
**
PhD-Tesis Ecología pesquera, reproducción y manejo Resultados y discusión
xiv
La estación del año y la profundidad son los principales factores que afectan la
abundancia de B. guatemalensis. Las mayores abundancias fueron encontradas en el sureste y
noroeste durante ambas estaciones (seca y lluviosa) pero las mayores abundancias ocurrieron
en la estación lluviosa en aguas someras y las más bajas en la zona central del área de estudio.
La estación parece modular fuertemente el comportamiento migratorio de esta especie de los
ríos al lago y viceversa. El aumento de la abundancia durante la estación lluviosa es más
evidente cerca de la zona de drenaje de los ríos. Los ríos son reconocidos como importantes
habitas para potadromous (migración dentro de ambientes acuáticos de agua dulce) especies
como Brycon guatemalensis la cual habita en el lago y exhibe comportamiento migratorio
hacia ríos tributarios (Drewe et al., 2003) para desovar (McLarney et al., 2010)
El patrón de distribución espacial de las tallas es muy evidente en todas las especies
estudiadas. Los peces de mayor talla son encontrados en el sureste y en menos concentración
en la zona central del área de estudio, mientras en el noroeste los especímenes son más
pequeños (Figura 5). Este patrón podría estar relacionado a la influencia del Río San Juan
(RSJ). El RSJ desde el punto de vista ecológico es el río más importante en la región debido a
su extensión y diversidad de habitas, así como por su gran biodiversidad, lo que provee de las
condiciones óptimas para el crecimiento y reproducción de muchas especies (Bussing, 2002;
Villa, 1982).
La selectividad del arte de pesca utilizado durante el estudio no permite conocer el habita de
los juveniles ya que tallas de A. citrinellus, H. nicaraguensis, P. managuensis y B.
guatemalensis menores de 14.0, 11.0, 17.0 y 20.0 cm, respectivamente, no fueron capturadas
por la red. En el presente estudio las mayores tallas fueron encontradas en estratos más
profundos (3 y 5 m). En aguas someras el mayor porcentaje de los especímenes tenían tallas
por debajo de la longitud media estimada para cada especie (A. citrinellus, H. nicaraguensis,
P. managuensis y B. guatemalensis), i.e., 64%, 41%, 70%, 50%, en la estación seca y 66%,
57%, 83%, y 59%, en la estación lluviosa, respectivamente (Figura 6).
La talla máxima reportada de B. guatemalensis fue de 61.7 cm capturada en la zona sureste
cerca del RSJ (Gadea, 2003). Esta talla es similar a la talla máxima (59 cm) registrada por
IGFA (2001). En el presente estudio la talla máxima encontrada fue 55.5 cm, capturada en la
zona sureste y central de la zona de estudio.
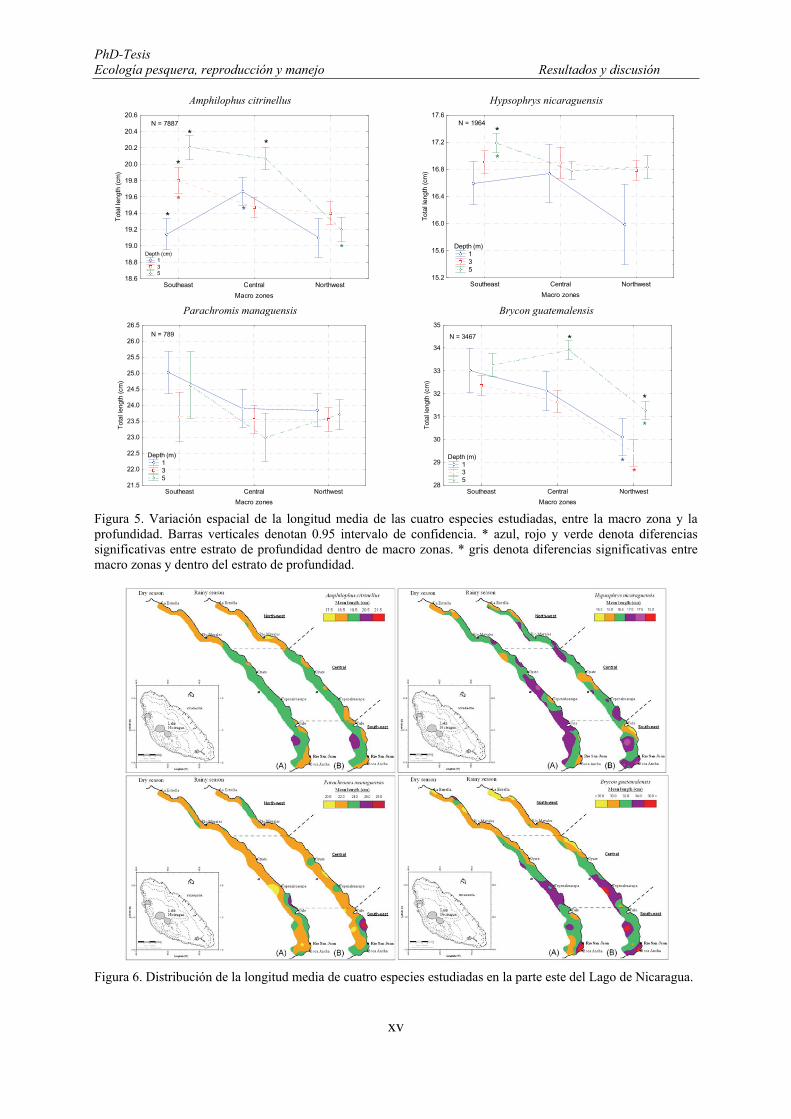
PhD-Tesis Ecología pesquera, reproducción y manejo Resultados y discusión
xv
Amphilophus citrinellus Hypsophrys nicaraguensis
Parachromis managuensis Brycon guatemalensis
Figura 5. Variación espacial de la longitud media de las cuatro especies estudiadas, entre la macro zona y la profundidad. Barras verticales denotan 0.95 intervalo de confidencia. * azul, rojo y verde denota diferencias significativas entre estrato de profundidad dentro de macro zonas. * gris denota diferencias significativas entre macro zonas y dentro del estrato de profundidad.
Figura 6. Distribución de la longitud media de cuatro especies estudiadas en la parte este del Lago de Nicaragua.
Southeast Central Northwest
Macro zones
18.6
18.8
19.0
19.2
19.4
19.6
19.8
20.0
20.2
20.4
20.6T
otal
leng
th (
cm)
N = 7887
Depth (cm) 1 3 5
*
*
*
*
*
**
Southeast Central Northwest
Macro zones
15.2
15.6
16.0
16.4
16.8
17.2
17.6
Tot
al le
ngth
(cm
)
N = 1964
Depth (m) 1 3 5
*
*
Southeast Central Northwest
Macro zones
21.5
22.0
22.5
23.0
23.5
24.0
24.5
25.0
25.5
26.0
26.5
Tot
al le
ngth
(cm
)
N = 789
Depth (m) 1 3 5
Southeast Central Northwest
Macro zones
28
29
30
31
32
33
34
35
Tot
al le
ngth
(cm
)
Depth (m) 1 3 5
N = 3467 *
*
**
*
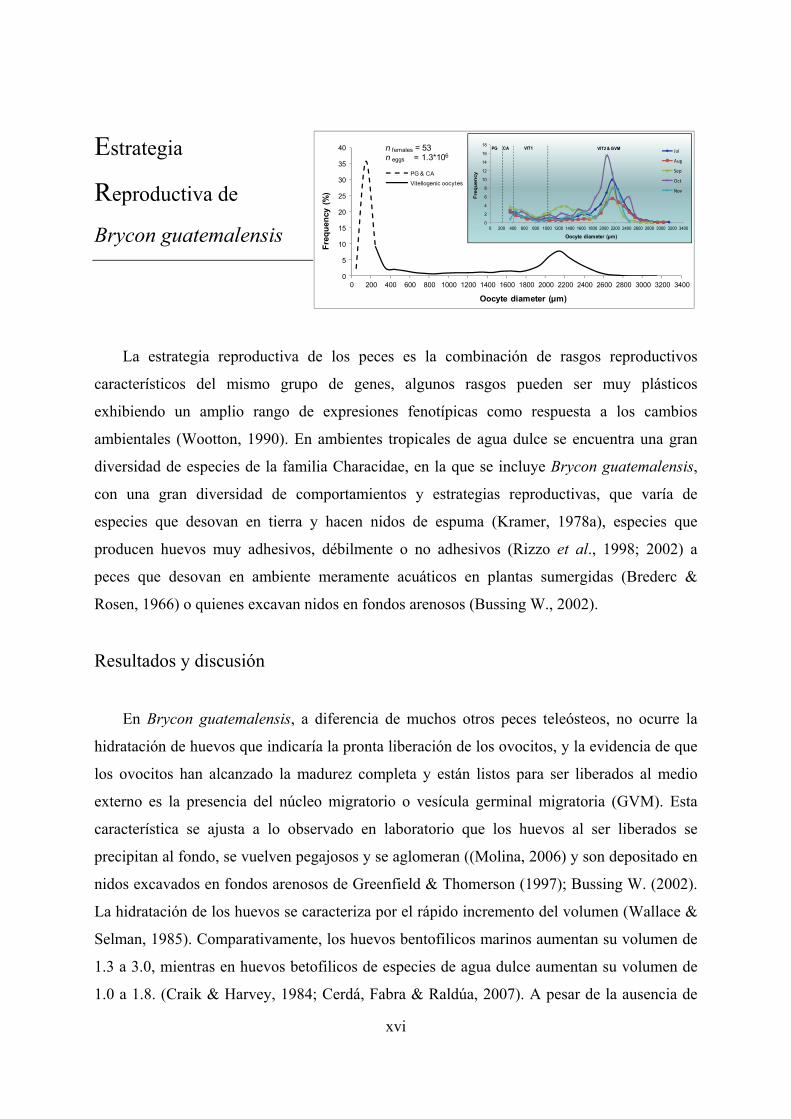
xvi
Estrategia
Reproductiva de
Brycon guatemalensis
La estrategia reproductiva de los peces es la combinación de rasgos reproductivos
característicos del mismo grupo de genes, algunos rasgos pueden ser muy plásticos
exhibiendo un amplio rango de expresiones fenotípicas como respuesta a los cambios
ambientales (Wootton, 1990). En ambientes tropicales de agua dulce se encuentra una gran
diversidad de especies de la familia Characidae, en la que se incluye Brycon guatemalensis,
con una gran diversidad de comportamientos y estrategias reproductivas, que varía de
especies que desovan en tierra y hacen nidos de espuma (Kramer, 1978a), especies que
producen huevos muy adhesivos, débilmente o no adhesivos (Rizzo et al., 1998; 2002) a
peces que desovan en ambiente meramente acuáticos en plantas sumergidas (Brederc &
Rosen, 1966) o quienes excavan nidos en fondos arenosos (Bussing W., 2002).
Resultados y discusión
En Brycon guatemalensis, a diferencia de muchos otros peces teleósteos, no ocurre la
hidratación de huevos que indicaría la pronta liberación de los ovocitos, y la evidencia de que
los ovocitos han alcanzado la madurez completa y están listos para ser liberados al medio
externo es la presencia del núcleo migratorio o vesícula germinal migratoria (GVM). Esta
característica se ajusta a lo observado en laboratorio que los huevos al ser liberados se
precipitan al fondo, se vuelven pegajosos y se aglomeran ((Molina, 2006) y son depositado en
nidos excavados en fondos arenosos de Greenfield & Thomerson (1997); Bussing W. (2002).
La hidratación de los huevos se caracteriza por el rápido incremento del volumen (Wallace &
Selman, 1985). Comparativamente, los huevos bentofilicos marinos aumentan su volumen de
1.3 a 3.0, mientras en huevos betofilicos de especies de agua dulce aumentan su volumen de
1.0 a 1.8. (Craik & Harvey, 1984; Cerdá, Fabra & Raldúa, 2007). A pesar de la ausencia de
0
5
10
15
20
25
30
35
40
0 200 400 600 800 1000 1200 1400 1600 1800 2000 2200 2400 2600 2800 3000 3200 3400
Fre
qu
ency
(%
)
Oocyte diameter (µm)
PG & CA
Vitellogenic oocytes
n females = 53n eggs = 1.3*106
0
2
4
6
8
10
12
14
16
18
0 200 400 600 800 1000 1200 1400 1600 1800 2000 2200 2400 2600 2800 3000 3200 3400
Fre
qu
en
cy
Oocyte diameter (µm)
Jul
Aug
Sep
Oct
Nov
PG CA VIT1 VIT2 & GVM
PhD-Tesis Ecología pesquera, reproducción y manejo Resultados y discusión
xvii
hidratación en los huevos de B. guatemalensis estos aumentan 1.6 veces su volumen durante
la maduración final. Este incremento está dentro del rango de incremento de otros peces
teleósteos de agua dulce pero por debajo del promedio. Los ovocitos de esta especie son
liberados envueltos en un mucus, producido dentro del ovario, que se observa al entrar en
contacto con el agua. Esta característica permite ubicar los huevos de B. guatemalensis en la
categoría de huevos adhesivos ya que este mucus hace que los huevos se mantenga unidos y
se forme una especie de masa de huevos.
El periodo de reproducción de las hembras de Brycon guatemalensis es relativamente
largo hasta de ocho meses (de Julio a Febrero) (Figura 7), con mayor actividad reproductiva
entre Julio y Noviembre. Sin embargo la fracción desovante (Sf) es mucho mayor en Julio y
Agosto. Este periodo reproductivo está estrechamente vinculado a la estación lluviosa del año.
En otras especies de esta misma familia, que habitan en otra latitudes, el comportamiento
reproductivo es bien diverso el que varía en el tiempo de desove, de 1 a 2 días en
Bryconamericus emperador, 2 meses Brycon petrosus y 4 meses en Hyphessobrycon
panamensis; hasta especies de desove continuo Roeboides y Gephyrocharax (Kramer, 1978a).
Los valores más altos del índice gonadosomático (GSI) se observaron de Julio a Diciembre
sin un pico definido. Los valores más bajos se observaron durante los meses del período seco
indicando la finalización del desove lo que es confirmado por la atresia generalizada en
Diciembre y Enero, pero tanto el GIS como la varianza fluctúan durante el periodo de desove,
lo que es asociado a la presencia de diferentes fases reproductivas y diferentes tallas de peces
dentro del stock de desovantes. La influencia de la talla de los peces en el desarrollo de las
gónadas se ha observado en Engraulis mordax en que los peces más pequeños tienen un bajo
GSI que los peces de mayor tamaño y esto afecto el desarrollo del ovario (Hunter & Golber,
1980). El cambio en la actividad de desove en B. guatemalensis en la cual hembras más
pequeñas finalizan el desove más temprano que las hembras de mayor tamaño podría explicar
las variaciones observadas en el GSI. El GSI de B. guatemalensis es más bajo (1 a 4 %) en
comparación a otras especies de agua dulce de la misma familia (Characidae) como
Oligosarcus jenynsii (1 a 8%) y Oligosarcus robustus (1 a 10%) (Nunes, Pellanda & Hartz,
2004), lo que podría indicar que B. guatemalensis invierte, relativamente, menos energía en la
reproducción.
PhD-Tesis Ecología pesquera, reproducción y manejo Resultados y discusión
xviii
Las variaciones de K a lo largo del año reflejan tanto un periodo de intensa alimentación
(Enero a Abril-período seco) y un periodo (Mayo a Diciembre) en que la condición de los
peces fluctúa grandemente pero decrece significativamente en Mayo. La disminución de K en
Mayo es la primera evidencia de utilización de energía que podría ser relacionada al inicio de
la maduración debido a que las variaciones de K primeramente reflejan estados de madurez
sexual (Williams, 2000). La disminución de K en los meses siguientes es atribuida a la
acumulación de vitelo (vitelogénesis). La tendencia decreciente de K hasta Septiembre
seguido de una recuperación en Octubre soporta la idea de que la actividad de desove está
relacionada con la estructura de las tallas de las hembras en desove. El patrón de K en B.
guatemalensis es muy similar al presentado por otros miembros de la familia Characidae
como Astyanax altiparanae y Aphyocharax nasutus (Lizama & Ambrocio, 2002). La
influencia de la talla de las hembras en K no fue claramente establecida pero de manera
indirecta se observó una relación con los estados de madurez. El desacoplamiento observado
entre GSI y K (Figura 8) a lo largo del periodo de desove y la influencia de la talla de las
hembras soporta la idea de que la actividad de desove está relacionada con la estructura de las
tallas de las hembras en desove.
La longitud a la que el 50 % de la población alcanza la madurez (L50) estimada
macroscópicamente fue de 34.6 cm es similar a la estimada por Froese & Binohlan (2000) en
34.6 cm. Sin embargo esto valores están muy por encima del valor de L50 estimada mediante
procedimientos histológicos 27.3 cm (Figura 9). El métodos de clasificación macroscópica de
las gónadas produce muchas incertidumbres y los errores de interpretación deben ser
evaluados debido a que los límites entre los estados de desarrollo gonadal son estimados muy
subjetivamente (Williams, 2007).
Los estudios de fecundidad realizados en B. guatemalensis indican que la especies tiene
una fecundidad determinada y que la dinámica del desarrollo ovario es del tipo sincrónico por
grupos descrito por Wallace & Selman (1981). Además, la tendencia decreciente del número
de ovocitos presentes en el ovario durante la época de desove (NDO y RNDO) (Figura 10)
indica que no hay reclutamiento de ovocitos a la cohorte más avanzada durante el desove
confirmando la fecundidad determinada de la especie. La cohorte de avanzada o “leading
cohort” (ovocitos > 1000 µm), i.e., ovocitos en VIT2 y/o GVM, dominan la frecuencia de
ovocitos en hembras con capacidad de desove, aunque una segunda cohorte de ovocitos VIT1
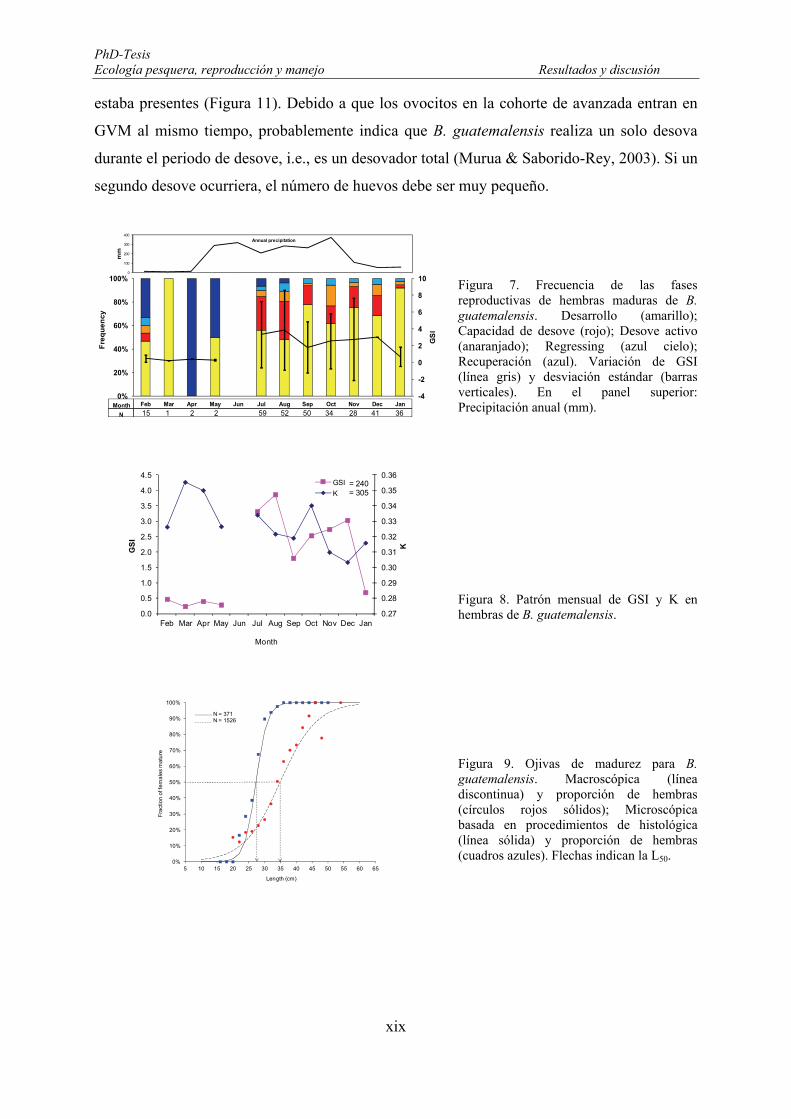
PhD-Tesis Ecología pesquera, reproducción y manejo Resultados y discusión
xix
estaba presentes (Figura 11). Debido a que los ovocitos en la cohorte de avanzada entran en
GVM al mismo tiempo, probablemente indica que B. guatemalensis realiza un solo desova
durante el periodo de desove, i.e., es un desovador total (Murua & Saborido-Rey, 2003). Si un
segundo desove ocurriera, el número de huevos debe ser muy pequeño.
Figura 7. Frecuencia de las fases reproductivas de hembras maduras de B. guatemalensis. Desarrollo (amarillo); Capacidad de desove (rojo); Desove activo (anaranjado); Regressing (azul cielo); Recuperación (azul). Variación de GSI (línea gris) y desviación estándar (barras verticales). En el panel superior: Precipitación anual (mm).
Figura 8. Patrón mensual de GSI y K en hembras de B. guatemalensis.
Figura 9. Ojivas de madurez para B. guatemalensis. Macroscópica (línea discontinua) y proporción de hembras (círculos rojos sólidos); Microscópica basada en procedimientos de histológica (línea sólida) y proporción de hembras (cuadros azules). Flechas indican la L50.
-4
-2
0
2
4
6
8
10
0%
20%
40%
60%
80%
100%
Feb Mar Apr May Jun Jul Aug Sep Oct Nov Dec Jan
GS
I
Fre
qu
en
cy
15 1 2 2 59 52 50 34 28 41 36 Month
N
0
100
200
300
400
mm
Annual precipitation
0.27
0.28
0.29
0.30
0.31
0.32
0.33
0.34
0.35
0.36
0.0
0.5
1.0
1.5
2.0
2.5
3.0
3.5
4.0
4.5
Feb Mar Apr May Jun Jul Aug Sep Oct Nov Dec Jan
KGS
I
Month
GSI
K= 240= 305
0%
10%
20%
30%
40%
50%
60%
70%
80%
90%
100%
5 10 15 20 25 30 35 40 45 50 55 60 65
Fra
ctio
n o
f fem
ale
s m
atu
re
Length (cm)
N = 371N = 1526
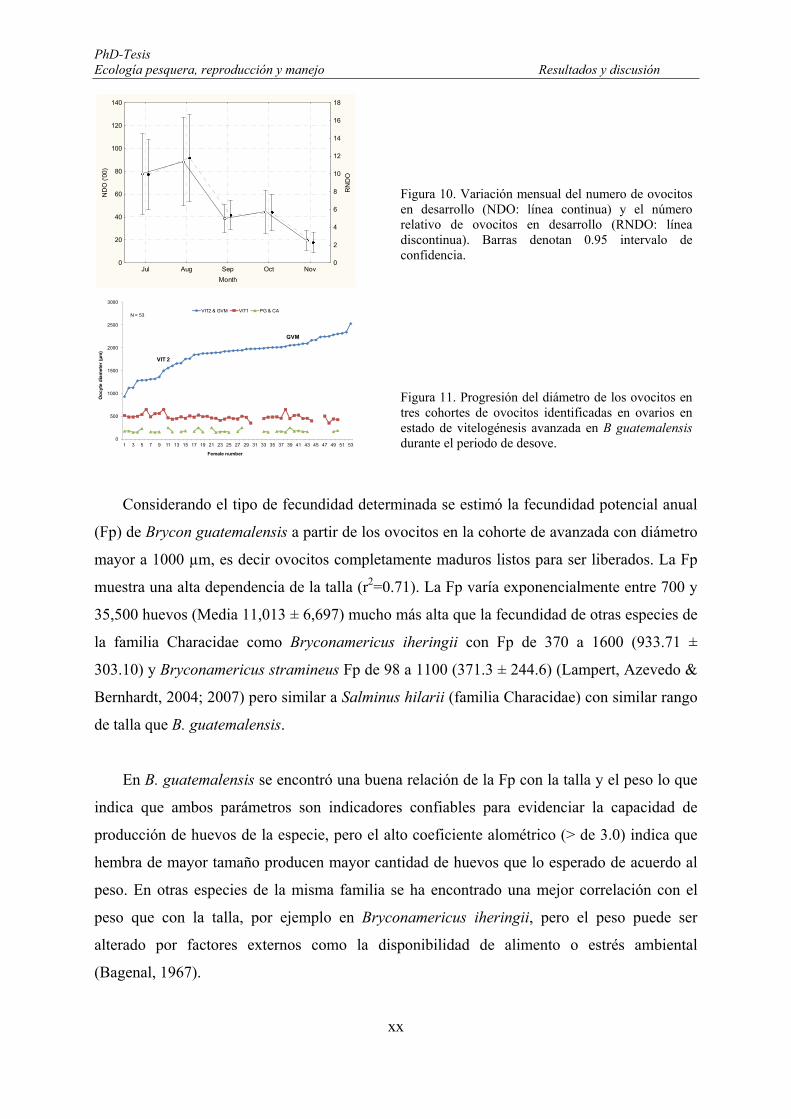
PhD-Tesis Ecología pesquera, reproducción y manejo Resultados y discusión
xx
Figura 10. Variación mensual del numero de ovocitos en desarrollo (NDO: línea continua) y el número relativo de ovocitos en desarrollo (RNDO: línea discontinua). Barras denotan 0.95 intervalo de confidencia.
Figura 11. Progresión del diámetro de los ovocitos en tres cohortes de ovocitos identificadas en ovarios en estado de vitelogénesis avanzada en B guatemalensis durante el periodo de desove.
Considerando el tipo de fecundidad determinada se estimó la fecundidad potencial anual
(Fp) de Brycon guatemalensis a partir de los ovocitos en la cohorte de avanzada con diámetro
mayor a 1000 µm, es decir ovocitos completamente maduros listos para ser liberados. La Fp
muestra una alta dependencia de la talla (r2=0.71). La Fp varía exponencialmente entre 700 y
35,500 huevos (Media 11,013 ± 6,697) mucho más alta que la fecundidad de otras especies de
la familia Characidae como Bryconamericus iheringii con Fp de 370 a 1600 (933.71 ±
303.10) y Bryconamericus stramineus Fp de 98 a 1100 (371.3 ± 244.6) (Lampert, Azevedo &
Bernhardt, 2004; 2007) pero similar a Salminus hilarii (familia Characidae) con similar rango
de talla que B. guatemalensis.
En B. guatemalensis se encontró una buena relación de la Fp con la talla y el peso lo que
indica que ambos parámetros son indicadores confiables para evidenciar la capacidad de
producción de huevos de la especie, pero el alto coeficiente alométrico (> de 3.0) indica que
hembra de mayor tamaño producen mayor cantidad de huevos que lo esperado de acuerdo al
peso. En otras especies de la misma familia se ha encontrado una mejor correlación con el
peso que con la talla, por ejemplo en Bryconamericus iheringii, pero el peso puede ser
alterado por factores externos como la disponibilidad de alimento o estrés ambiental
(Bagenal, 1967).
Jul Aug Sep Oct Nov
Month
0
20
40
60
80
100
120
140N
DO
('0
0)
0
2
4
6
8
10
12
14
16
18
RN
DO
0
500
1000
1500
2000
2500
3000
1 3 5 7 9 11 13 15 17 19 21 23 25 27 29 31 33 35 37 39 41 43 45 47 49 51 53
Oo
cyt
e d
iam
ete
r (µ
m)
Female number
VIT2 & GVM VIT1 PG & CA
VIT 2
GVM
N = 53

PhD-Tesis Ecología pesquera, reproducción y manejo Resultados y discusión
xxi
La fecundidad potencial anual de B. guatemalensis podría ser estimada la curva de
calibración obtenida de la relación del diámetro del ovocito (OD) con el número de ovocitos
por gramo de peso del ovario (NG) debido que ambas observaciones se ajustan bien y fueron
altamente correlacionados. Este tipo de correlación llamado “the auto-diametric fecundity
method” fue desarrollado por Thorsen & Kjesbu (2001) para estimar la fecundidad potencial
de Atlantic cod, y ha sido aplicado con buenos resultados en otras especies, especialmente
esas con ovario del tipo sincrónico por grupo y fecundidad determinada en latitudes de aguas
muy frías (Lambert, 2008; Alonso-Fernández et al., 2009; Witthames et al., 2009; Thorsen et
al., 2010).
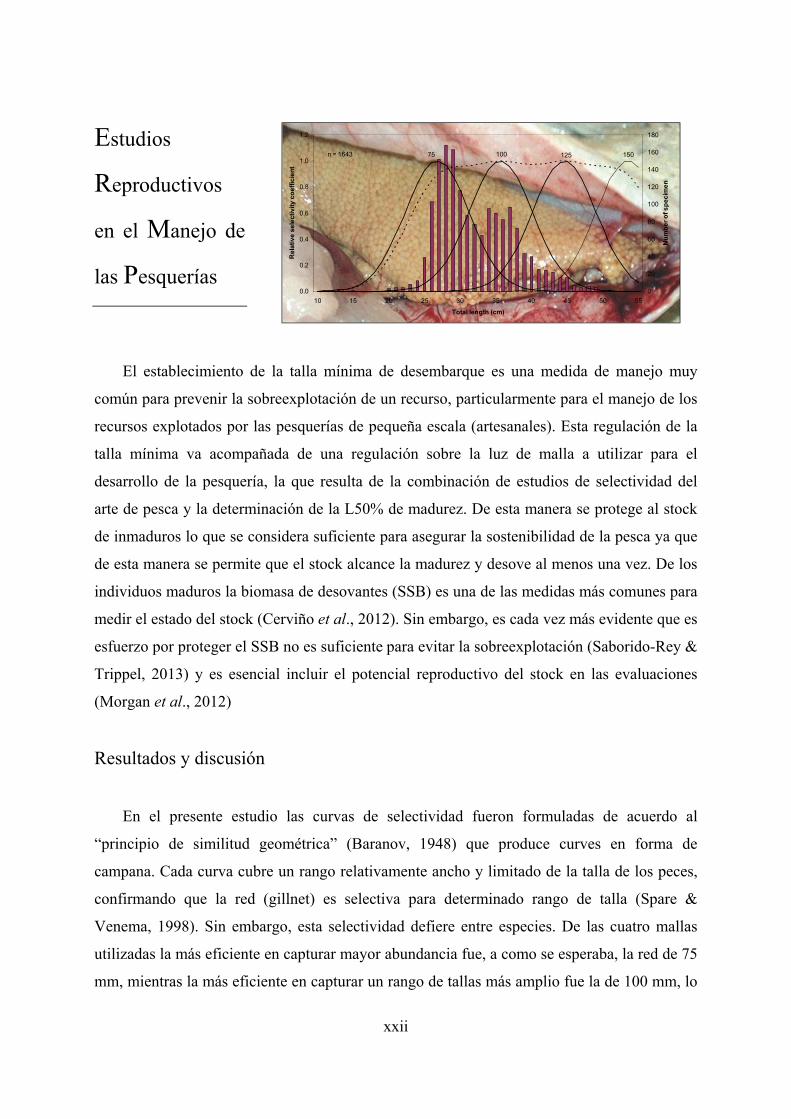
xxii
Estudios
Reproductivos
en el Manejo de
las Pesquerías
El establecimiento de la talla mínima de desembarque es una medida de manejo muy
común para prevenir la sobreexplotación de un recurso, particularmente para el manejo de los
recursos explotados por las pesquerías de pequeña escala (artesanales). Esta regulación de la
talla mínima va acompañada de una regulación sobre la luz de malla a utilizar para el
desarrollo de la pesquería, la que resulta de la combinación de estudios de selectividad del
arte de pesca y la determinación de la L50% de madurez. De esta manera se protege al stock
de inmaduros lo que se considera suficiente para asegurar la sostenibilidad de la pesca ya que
de esta manera se permite que el stock alcance la madurez y desove al menos una vez. De los
individuos maduros la biomasa de desovantes (SSB) es una de las medidas más comunes para
medir el estado del stock (Cerviño et al., 2012). Sin embargo, es cada vez más evidente que es
esfuerzo por proteger el SSB no es suficiente para evitar la sobreexplotación (Saborido-Rey &
Trippel, 2013) y es esencial incluir el potencial reproductivo del stock en las evaluaciones
(Morgan et al., 2012)
Resultados y discusión
En el presente estudio las curvas de selectividad fueron formuladas de acuerdo al
“principio de similitud geométrica” (Baranov, 1948) que produce curves en forma de
campana. Cada curva cubre un rango relativamente ancho y limitado de la talla de los peces,
confirmando que la red (gillnet) es selectiva para determinado rango de talla (Spare &
Venema, 1998). Sin embargo, esta selectividad defiere entre especies. De las cuatro mallas
utilizadas la más eficiente en capturar mayor abundancia fue, a como se esperaba, la red de 75
mm, mientras la más eficiente en capturar un rango de tallas más amplio fue la de 100 mm, lo
0.0
0.2
0.4
0.6
0.8
1.0
1.2
10 15 20 25 30 35 40 45 50 55
Total length (cm)
Rel
ativ
e s
ele
ctiv
ity
coe
ffic
ien
t0
20
40
60
80
100
120
140
160
180
Nu
mb
er o
f sp
ecim
en
75 100 125 150n = 1643
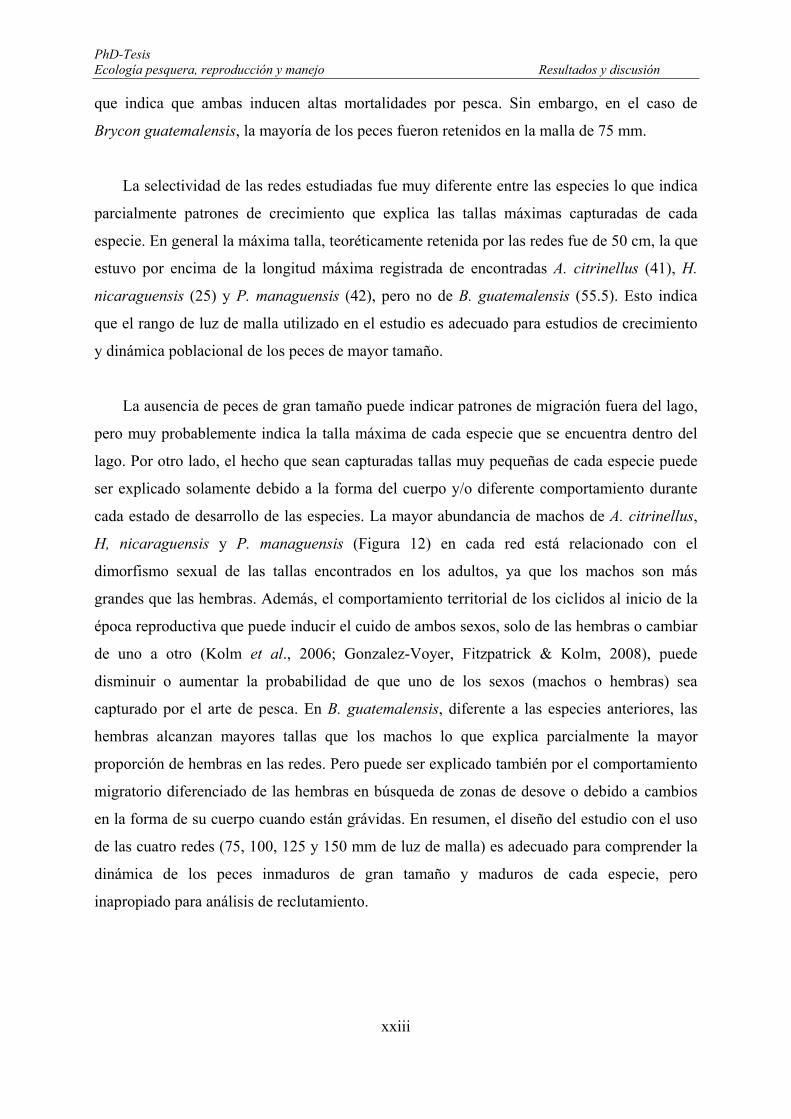
PhD-Tesis Ecología pesquera, reproducción y manejo Resultados y discusión
xxiii
que indica que ambas inducen altas mortalidades por pesca. Sin embargo, en el caso de
Brycon guatemalensis, la mayoría de los peces fueron retenidos en la malla de 75 mm.
La selectividad de las redes estudiadas fue muy diferente entre las especies lo que indica
parcialmente patrones de crecimiento que explica las tallas máximas capturadas de cada
especie. En general la máxima talla, teoréticamente retenida por las redes fue de 50 cm, la que
estuvo por encima de la longitud máxima registrada de encontradas A. citrinellus (41), H.
nicaraguensis (25) y P. managuensis (42), pero no de B. guatemalensis (55.5). Esto indica
que el rango de luz de malla utilizado en el estudio es adecuado para estudios de crecimiento
y dinámica poblacional de los peces de mayor tamaño.
La ausencia de peces de gran tamaño puede indicar patrones de migración fuera del lago,
pero muy probablemente indica la talla máxima de cada especie que se encuentra dentro del
lago. Por otro lado, el hecho que sean capturadas tallas muy pequeñas de cada especie puede
ser explicado solamente debido a la forma del cuerpo y/o diferente comportamiento durante
cada estado de desarrollo de las especies. La mayor abundancia de machos de A. citrinellus,
H, nicaraguensis y P. managuensis (Figura 12) en cada red está relacionado con el
dimorfismo sexual de las tallas encontrados en los adultos, ya que los machos son más
grandes que las hembras. Además, el comportamiento territorial de los ciclidos al inicio de la
época reproductiva que puede inducir el cuido de ambos sexos, solo de las hembras o cambiar
de uno a otro (Kolm et al., 2006; Gonzalez-Voyer, Fitzpatrick & Kolm, 2008), puede
disminuir o aumentar la probabilidad de que uno de los sexos (machos o hembras) sea
capturado por el arte de pesca. En B. guatemalensis, diferente a las especies anteriores, las
hembras alcanzan mayores tallas que los machos lo que explica parcialmente la mayor
proporción de hembras en las redes. Pero puede ser explicado también por el comportamiento
migratorio diferenciado de las hembras en búsqueda de zonas de desove o debido a cambios
en la forma de su cuerpo cuando están grávidas. En resumen, el diseño del estudio con el uso
de las cuatro redes (75, 100, 125 y 150 mm de luz de malla) es adecuado para comprender la
dinámica de los peces inmaduros de gran tamaño y maduros de cada especie, pero
inapropiado para análisis de reclutamiento.
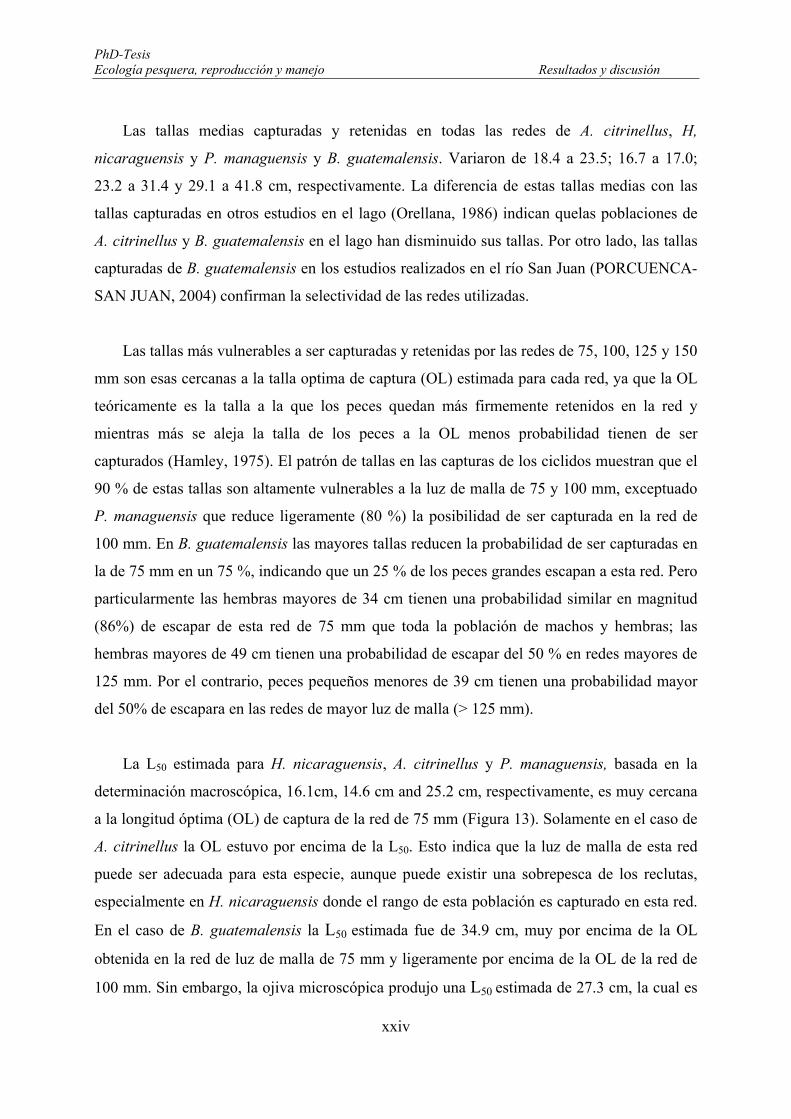
PhD-Tesis Ecología pesquera, reproducción y manejo Resultados y discusión
xxiv
Las tallas medias capturadas y retenidas en todas las redes de A. citrinellus, H,
nicaraguensis y P. managuensis y B. guatemalensis. Variaron de 18.4 a 23.5; 16.7 a 17.0;
23.2 a 31.4 y 29.1 a 41.8 cm, respectivamente. La diferencia de estas tallas medias con las
tallas capturadas en otros estudios en el lago (Orellana, 1986) indican quelas poblaciones de
A. citrinellus y B. guatemalensis en el lago han disminuido sus tallas. Por otro lado, las tallas
capturadas de B. guatemalensis en los estudios realizados en el río San Juan (PORCUENCA-
SAN JUAN, 2004) confirman la selectividad de las redes utilizadas.
Las tallas más vulnerables a ser capturadas y retenidas por las redes de 75, 100, 125 y 150
mm son esas cercanas a la talla optima de captura (OL) estimada para cada red, ya que la OL
teóricamente es la talla a la que los peces quedan más firmemente retenidos en la red y
mientras más se aleja la talla de los peces a la OL menos probabilidad tienen de ser
capturados (Hamley, 1975). El patrón de tallas en las capturas de los ciclidos muestran que el
90 % de estas tallas son altamente vulnerables a la luz de malla de 75 y 100 mm, exceptuado
P. managuensis que reduce ligeramente (80 %) la posibilidad de ser capturada en la red de
100 mm. En B. guatemalensis las mayores tallas reducen la probabilidad de ser capturadas en
la de 75 mm en un 75 %, indicando que un 25 % de los peces grandes escapan a esta red. Pero
particularmente las hembras mayores de 34 cm tienen una probabilidad similar en magnitud
(86%) de escapar de esta red de 75 mm que toda la población de machos y hembras; las
hembras mayores de 49 cm tienen una probabilidad de escapar del 50 % en redes mayores de
125 mm. Por el contrario, peces pequeños menores de 39 cm tienen una probabilidad mayor
del 50% de escapara en las redes de mayor luz de malla (> 125 mm).
La L50 estimada para H. nicaraguensis, A. citrinellus y P. managuensis, basada en la
determinación macroscópica, 16.1cm, 14.6 cm and 25.2 cm, respectivamente, es muy cercana
a la longitud óptima (OL) de captura de la red de 75 mm (Figura 13). Solamente en el caso de
A. citrinellus la OL estuvo por encima de la L50. Esto indica que la luz de malla de esta red
puede ser adecuada para esta especie, aunque puede existir una sobrepesca de los reclutas,
especialmente en H. nicaraguensis donde el rango de esta población es capturado en esta red.
En el caso de B. guatemalensis la L50 estimada fue de 34.9 cm, muy por encima de la OL
obtenida en la red de luz de malla de 75 mm y ligeramente por encima de la OL de la red de
100 mm. Sin embargo, la ojiva microscópica produjo una L50 estimada de 27.3 cm, la cual es
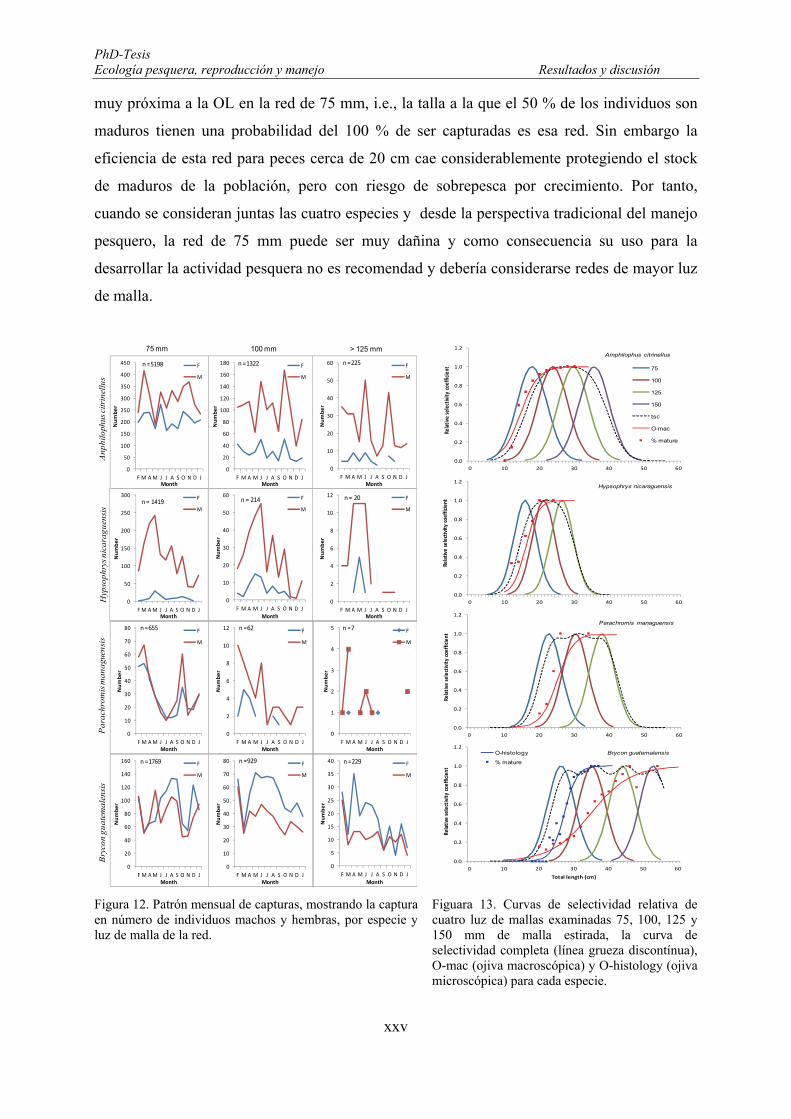
PhD-Tesis Ecología pesquera, reproducción y manejo Resultados y discusión
xxv
muy próxima a la OL en la red de 75 mm, i.e., la talla a la que el 50 % de los individuos son
maduros tienen una probabilidad del 100 % de ser capturadas es esa red. Sin embargo la
eficiencia de esta red para peces cerca de 20 cm cae considerablemente protegiendo el stock
de maduros de la población, pero con riesgo de sobrepesca por crecimiento. Por tanto,
cuando se consideran juntas las cuatro especies y desde la perspectiva tradicional del manejo
pesquero, la red de 75 mm puede ser muy dañina y como consecuencia su uso para la
desarrollar la actividad pesquera no es recomendad y debería considerarse redes de mayor luz
de malla.
Figura 12. Patrón mensual de capturas, mostrando la captura en número de individuos machos y hembras, por especie y luz de malla de la red.
Figuara 13. Curvas de selectividad relativa de cuatro luz de mallas examinadas 75, 100, 125 y 150 mm de malla estirada, la curva de selectividad completa (línea grueza discontínua), O-mac (ojiva macroscópica) y O-histology (ojiva microscópica) para cada especie.
0
50
100
150
200
250
300
F M AM J J A S O N D J
Number
Month
F
Mn = 1419
0
10
20
30
40
50
60
F M A M J J A S O N D J
Number
Month
F
M
n = 214
0
2
4
6
8
10
12
F M A M J J A S O N D J
Number
Month
F
M
n = 20
0
50
100
150
200
250
300
350
400
450
F M A M J J A S O N D J
Number
Month
F
M
n =5198
0
20
40
60
80
100
120
140
160
180
F M A M J J A S O N D J
Number
Month
F
M
n =1322
0
10
20
30
40
50
60
F M A M J J A S O N D J
Number
Month
F
M
n =225
0
10
20
30
40
50
60
70
80
F M AM J J A S O N D J
Number
Month
F
M
n =655
0
2
4
6
8
10
12
F M A M J J A S O N D J
Number
Month
F
M
n =62
0
1
2
3
4
5
F M A M J J A S O N D J
Number
Month
F
M
n =7
0
20
40
60
80
100
120
140
160
F M AM J J A S O N D J
Number
Month
F
M
n =1769
0
10
20
30
40
50
60
70
80
F M A M J J A S O N D J
Number
Month
F
M
n =929
0
5
10
15
20
25
30
35
40
F M A M J J A S O N D J
Number
Month
F
M
n =229
Hyp
sop
hrys
nic
arag
uens
isA
nphi
loph
us c
itrin
ellu
sP
ara
chro
mis
man
ague
nsis
Bry
con
gu
atem
alen
sis
75 mm 100 mm > 125 mm
0.0
0.2
0.4
0.6
0.8
1.0
1.2
0 10 20 30 40 50 60
Relative
selectivity coe
fficient 75
100
125
150
tsc
O-mac
% mature
Amphilophus citrinellus
0.0
0.2
0.4
0.6
0.8
1.0
1.2
0 10 20 30 40 50 60
Relative
selectivity coe
fficient
Parachromis managuensis
0.0
0.2
0.4
0.6
0.8
1.0
1.2
0 10 20 30 40 50 60
Relative
selectivity coe
fficient
Total length (cm)
O-histology
% mature
Brycon guatemalensis
0.0
0.2
0.4
0.6
0.8
1.0
1.2
0 10 20 30 40 50 60
Relative
selectivity coe
fficient
Hypsophrys nicaraguensis
PhD-Tesis Ecología pesquera, reproducción y manejo Resultados y discusión
xxvi
Los estudios de selectividad realizados en las fases reproductivas de B. guatemalensis
muestran que la composición de la tallas cambia en las diferentes redes dependiendo de la
talla de las hembras y de la fase reproductiva por la que atraviesan, i.e., en desarrollo (D), con
capacidad de desove (SC), puesta o desove activo (AS) y en recuperación (R). Así,
inesperadamente la red de 100 mm resultó ser la más eficiente en remover las hembras en
fases de desove (SC y AS) del stock de hembras maduras. Mientras hembras en fase de D y R
son más capturadas en la red de 75 mm. Esto puede ser relacionado con la forma del cuerpo
de las hembras, bien debido a su gravidez o su condición, produciendo una alta retención en
las redes (McCombie & Bert, 1969).
La fecundidad potencial de B. guatemalensis se incrementa exponencialmente con la
talla, además las hembras de mayor tamaño producen huevos más grandes y probablemente
de mejor calidad. Hembras de mayor tamaño tienen un mayor potencial reproductivo de
manera que contribuyen de manera distinta al reclutamiento y la sostenibilidad de las
pesquerías (Saborido-Rey & Trippel, 2013). El impacto de la red de 75 mm sobre la
producción de huevos del stock de hembras en desove es menor que el impacto de la de 100
mm debido a que causa mayor mortalidad por pesca de las hembras más productivas.
Los resultados obtenidos de B guatemalensis indican para incrementar la producción de
huevos del stock de hembras y reducir la mortalidad por pesca de las hembras jóvenes, es
recomendable el uso de la red de luz de malla de 100 mm durante la época seca protegiendo
así a los reclutas y hembras que inician la maduración, pero cambiando a la red de 75 mm
durante la época lluviosa, especialmente en Julio y Agosto cuando la actividad del desove es
mayor y de esa manera proteger a las hembras con mayor potencial reproductivo.

xxvii
Conclusiones
1. Los peces estudiados (Amphilophus citrinellus, Hypsophrys nicaraguensis, Parachromis
managuensis y Brycon guatemalensis) se distribuyen ampliamente en la parte este del
Lago de Nicaragua y su abundancia y distribución no está influenciada por la turbidez del
agua, pero la turbidez puede afectar la capturabilidad debido a las diferencias en el
comportamiento reproductivo de los peces o diferentes niveles de transparencia del agua.
2. La variación intra-anual de la abundancia de estos peces está fuertemente influenciada
por los efectos espaciotemporales, tanto horizontales (macro-zonas) como verticales
(profundidad) y por factores ambientales, i.e., estacionalidad de la precipitación.
3. Aunque la estación del año ha mostrado que afecta el patrón de distribución y
abundancia, su influencia es mínima en A. citrinellus pero ciertamente importante en H.
nicaraguensis y en menos medida en P. managuensis. El factor más determinante que
influencia la distribución espacial de los cíclidos A. citrinellus, H. nicaraguensis y P.
managuensis fueron la profundidad y las macro-zonas, siendo más abundantes en aguas
someras y en la zona sureste del área de estudio.
4. La estación (seca y lluviosa) y la profundidad son los principales factores que afectan la
abundancia de B. guatemalensis. Las mayores abundancias se encontraron en la parte
sureste y noroeste durante las dos estaciones del año, pero las mayores abundancias
ocurrieron en la época lluviosa en aguas someras y las más bajas en la zona central.
5. Todas las especies estudiadas mostraron un patrón de distribución similar. Los peces más
grandes se encontraron al sureste, peces de menor tamaño en la zona central y los más
pequeños al noroeste. Además, los peces más grandes se encontraron en aguas más
profundas (estratos 3 y 5 metros), exceptuando P. managuensis cuyas tallas más grandes
tienen preferencia por aguas someras (estratos 1 y 3 m).
6. La selectividad del arte de pesca utilizado no permitió identificar las zonas de
distribución de los individuos juveniles debido a que tallas menores de 14.0, 11.0, 17.0 y
PhD-Tesis Ecología pesquera, reproducción y manejo Conclusiones
xxviii
20.0 cm en A. citrinellus, H. nicaraguensis, P. managuensis y B. guatemalensis,
respectivamente, no fueron capturas durante las exploraciones.
7. Los ovocitos de B. guatemalensis completan su madurez con la migración del núcleo o
vesícula germinal migratoria hacia el polo animal sin alcanzar la hidratación. Sin
embargo, el ovocito aumenta su volumen en 1.6 veces al final de la maduración. Los
huevos de esta especie son liberados al medio rodeados de un mucus que es producido
dentro del ovario, este se observa visualmente cuando los huevos entran en contacto con
el agua.
8. La estación reproductiva de B. guatemalensis ocurre principalmente en la estación
lluviosa del año con la cual inicia el periodo de desove. La especie presenta un periodo de
desove prolongado que dura 8 meses (de Julio a Febrero), pero el desove es más intenso
de Julio a Noviembre. El evento de desove más importante ocurre en Julio y Agosto.
9. El momento y la duración del desove depende de la talla de las hembras. Las hembras
más pequeñas finalizan el desove más temprano (desovadores tempranos), coincidiendo
con la finalización de la estación lluviosa (Noviembre), mientras las hembras más
grandes tienen un periodo de desove más largo (desovadores tardíos), hasta Febrero.
10. El índice gonado-somático (GSI) y de condición (K) de las hembras muestran una buena
relación con el periodo reproductivo. Al inicio del desove ambos reflejan la maduración
de la gónada y la utilización de energía para la reproducción. El desacoplamiento
observado a lo largo del periodo de desove y la influencia de la talla indica que hay una
desincronización dentro de la población de las hembras durante el desove, i.e., las
hembras más pequeñas terminan de desovar antes que las hembras más grandes.
11. La longitud a la que el 50% de las hembras de B. guatemalensis alcanza la maduración
(L50), utilizando la ojiva microscópica (histológica), fue determinada en 27.3 cm. Esta
estimación evidencia una sobre-estimación de 7.6 cm de la L50 determinada
macroscópicamente y lo imprecisa de esta estimación. Este resultado tiene una gran
implicación para la evaluación y manejo del stock en el Lago de Nicaragua ya que las
PhD-Tesis Ecología pesquera, reproducción y manejo Conclusiones
xxix
medidas de manejo como talla mínima de desembarque y luz de malla de la red pueden
ser establecidas basadas en información biológica más confiable.
12. La dinámica del ovario de B. guatemalensis se ajusta al tipo de ovario de desarrollo
“sincrónico por grupo”. La especie muestra una fecundidad determinada y probablemente
realiza una sola puesta durante el periodo de desove, i.e., es un desovador total.
13. El patrón de distribución individual de los estados de desarrollo del ovocito evidencia una
desincronización en el desove de las hembras. El periodo de desove prolongado puede ser
consecuencia de diferencias en el comportamiento reproductivo de las diferentes clases
de tallas, en términos de tiempo de la reproducción, condición, producción de huevos y
calidad del huevo. Los huevos de las hembras que desovan más tarde tienden a ser más
pequeños a medida que avanza el periodo de desove, así también la frecuencia de huevos
grandes disminuye.
14. Las hembras más grandes muestran un mayor potencial reproductivo, i.e., producen más
huevos y estos son más grandes. La fecundidad potencial anual de B. guatemalensis
fluctúa entre 700 a 35,500 huevos y la producción promedio del stock de hembras en el
área de estudio fue de 11,013 ± 6697 huevos. La baja incidencia de atresia en B.
guatemalensis podría indicar alto éxito reproductivo, ya que la alta incidencia de atresia
ha sido vinculada a un fallo reproductivo.
15. La red de luz de malla de 75 mm es más eficiente en la captura de individuos pequeños,
en cambio la malla de 100 mm es más eficiente para la captura de individuos con un
rango de talla más amplio, lo que indica que ambas redes inducen alta mortalidad por
pesca.
16. Diferencias en la selectividad entre las especies refleja parcialmente patrones de
crecimiento lo que se explica por la talla mínima capturada de cada especie, ya que
algunas tallas no fueron capturadas en redes de mayor diámetro de luz de malla. La talla
máxima teórica retenida por el arte de pesca utilizado estuvo por encima la talla máxima
registrada en especies de cíclidos, pero no para B. guatemalensis, esto indica que el rango
de la luz de malla utilizada en este estudio es adecuado para estudiar el crecimiento y la
PhD-Tesis Ecología pesquera, reproducción y manejo Conclusiones
xxx
dinámica poblacional de los peces de mayor tamaño. Por otro lado, el hecho que las tallas
más pequeñas capturadas difieren entre las especias debe ser explicado solamente por la
forma del cuerpo del pez y/o a diferencias en el comportamiento reproductivo durante el
ciclo de vida de cada especie.
17. Los cíclidos muestran una alta vulnerabilidad (>90%) de ser capturados en redes con luz
de malla de 75 y 100 mm, exceptuando P. managuensis la cual reduce ligeramente la
probabilidad de ser capturado en la malla de 100 mm a un 80%. De manera que una gran
proporción de estas especies es vulnerable a estas mallas. En B. guatemalensis las tallas
más grandes reducen la probabilidad a un 75 % de ser capturados en la malla de 75 m,
i.e., tienen una probabilidad de escape del 25 %.
18. En cíclidos los más vulnerables son los machos y en B. guatemalensis las hembras,
especialmente durante los periodos reproductivos. La proporción de machos y hembras
obtenida de cada especie probablemente sea similar a la obtenida en las capturas en las
operaciones de pesca rutinarias de los pescadores en el lago. Por lo tanto, se debería tener
cuidado porque la proporción por sexo puede ser alterada severamente y
consecuentemente el potencial reproductivo de algunas especies puede ser directamente
afectado, por ejemplo, el cuidado parental en el grupo de los cíclidos donde el macho
juega un papel muy importante y en la biomasa del stock desovante en B. guatemalensis.
19. Hembras de B. guatemalensis sobre la talla del 50% de maduración (estimación
microscópica), tienen el 100 % de probabilidad de ser capturadas y retenidas en la red de
75 mm de luz de malla, y la L50 cae en el rango de 24.0 a 30.0 cm a la que la red tiene una
eficiencia de captura del 80 %. Sin embargo, la eficiencia de esta red para la captura de
peces de cerca de 20 cm cae considerablemente protegiendo la mayor parte del stock
maduro de la población, pero con riesgo de sobrepesca. Por lo que el uso de la malla de
75 mm no es recomendable para la actividad pesquera y redes de mayor luz de malla
debería considerarse.
20. Para las especies A. citrinellus, H. nicaraguensis, P. managuensis las correspondientes
longitudes medias (resultado del análisis de selectividad) capturadas en la red de 75 mm,
PhD-Tesis Ecología pesquera, reproducción y manejo Conclusiones
xxxi
18.6, 16.7, y 23.1 cm respectivamente, se recomiendan como referencia para monitorear
las tallas en los desembarques en esas especies.
21. Para B. guatemalensis la L50 determinada microscópicamente en 27.3 cm puede ser usada
como referencia debido a la precisión de su estimación. Considerando un incremento del
20 % sobre la talla de madurez se recomienda una talla mínima de desembarque (MLS)
de 30 cm. Esta talla tendría una probabilidad de 40 % de ser capturada en la red con luz
de malla de 100 mm.
22. La composición de las capturas de B. guatemalensis en las diferentes luz de malla de la
red cambia dependiendo de la talla y de la fase reproductiva por la que atraviesa. La red
de 100 mm es la más efectiva en remover las hembras en puesta de la población de
hembras maduras, i.e., con la capacidad de desovar –SC y en puesta activa –AS, mientras
que las hembras en fase de desarrollo (D) y en recuperación (R) son más capturadas en la
red de 75 mm, aunque si bien las capturas en esta red muestran mayor uniformidad en las
tallas.
23. El impacto de la redes (75, 100, 125 y 150 mm) utilizadas en la pesquería de pequeña
escala en el lago sobre la producción de huevos del stock de hembras ha sido poco
estudiada. La red de 75 mm captura la mayor proporción de hembras en puesta de talla
pequeña, probablemente ponedoras reclutas, las cuales finalizan el periodo de puesta
antes que las grandes y además son menos productivas en términos de producción de
huevos y calidad del huevo. Sin embargo, este estudio demuestra que la red de 100 mm
afecta más la producción de huevos, puesto que causa mayor mortalidad por pesca entre
las hembras más productivas del stock de hembras en puesta.
24. Para incrementar la producción de huevos del stock de hembras y reducir la mortalidad
por pesca de hembras jóvenes es aconsejable el uso de la red con luz de malla de 100 mm
durante la estación seca protegiendo el reclutamiento y a las hembras que inician la
maduración, pero cambiando su uso por la red de 75 mm durante la estación lluviosa,
especialmente en Julio y Agosto cuando el desove de B. guatemalensis es mayor; de esta
manera proteger a las hembras con mayor potencial reproductivo.


Tesis Doctoral
2013
Related Documents


