IIIEE Theses 2020:09 Re-thinking green roof design The prospect of a carbon sink structure investigated through a life cycle cost-benefit analysis Aziliz Le Rouzo Supervisors Dr. Bernadett Kiss International Institute for Industrial Environmental Economics (IIIEE), Lund Dr. Lars Hansson International Institute for Industrial Environmental Economics (IIIEE), Lund Thesis for the fulfilment of the Master of Science in Environmental Management and Policy Lund, Sweden, May 2020

Welcome message from author
This document is posted to help you gain knowledge. Please leave a comment to let me know what you think about it! Share it to your friends and learn new things together.
Transcript
IIIEE Theses 2020:09
Re-thinking green roof design
The prospect of a carbon sink structure investigated through a life cycle cost-benefit analysis
Aziliz Le Rouzo
Supervisors
Dr. Bernadett Kiss
International Institute for Industrial Environmental Economics (IIIEE), Lund
Dr. Lars Hansson
International Institute for Industrial Environmental Economics (IIIEE), Lund
Thesis for the fulfilment of the Master of Science in Environmental Management and Policy
Lund, Sweden, May 2020
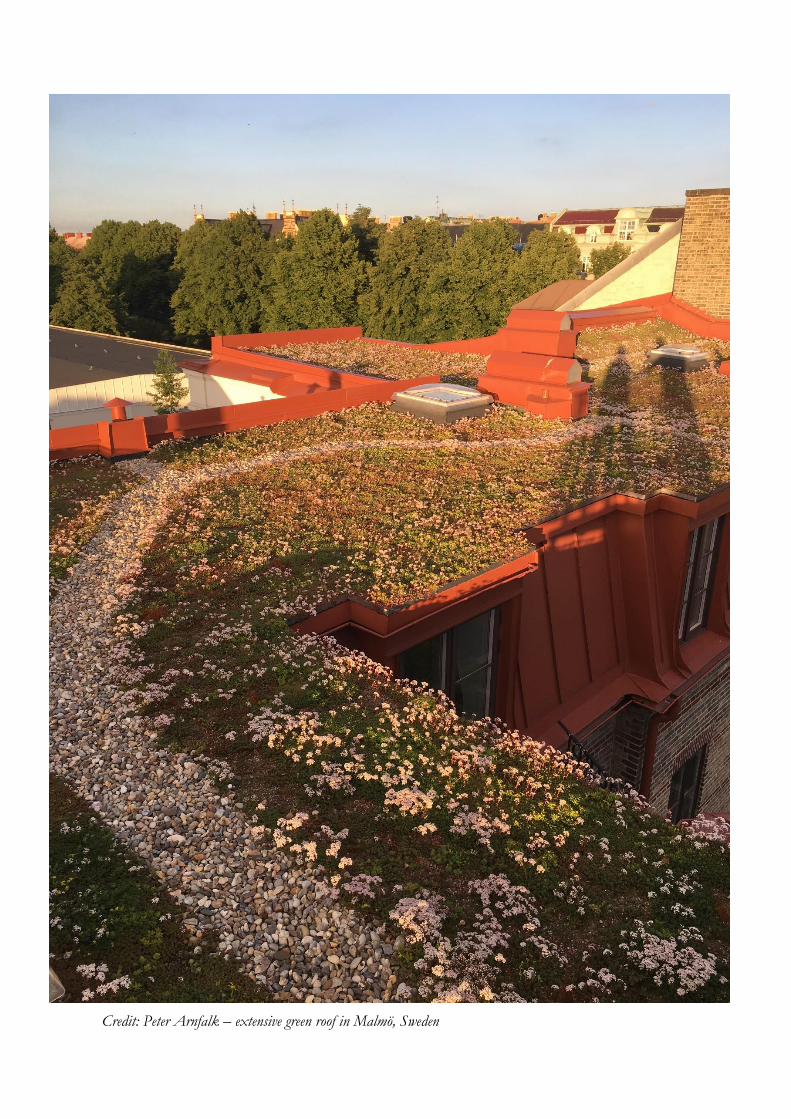
Credit: Peter Arnfalk – extensive green roof in Malmö, Sweden
“We set this house on fire forgetting that we live within.”
Jim Harrison, Saving Daylight
“We can't save the world by playing by the rules, because the rules have to be changed. Everything needs to change - and it has to start today.”
Greta Thunberg
© You may use the contents of the IIIEE publications for informational purposes only. You may not copy, lend, hire, transmit or redistribute these materials for commercial purposes or for compensation of any kind without written permission from IIIEE. When using IIIEE material you must include
the following copyright notice: ‘Copyright © Aziliz Le Rouzo, IIIEE, Lund University. All rights reserved’ in any copy that you make in a clearly visible position. You may not modify the materials without the permission of the author.
Published in 2020 by IIIEE, Lund University, P.O. Box 196, S-221 00 LUND, Sweden,
Tel: +46 – 46 222 02 00, Fax: +46 – 46 222 02 10, e-mail: [email protected].
ISSN 1401-9191

Re-Thinking Greeen Roof Design
I
Acknowledgements
First and foremost, I want to warmly thank my two supervisors, Berni and Lars without whom this thesis would not have been the same. Both of you have provided me with outstanding support throughout this whole period and I cannot thank you enough for your engagement. Berni, you have been particularly helpful in helping me structure my thoughts, giving me clear guidance when I most needed it! Lars, your economic insights, and dedicated involvement paired with cheerful life stories were critical in helping me build the CBA model, and kept the zoom meetings entertaining! Both of you made my thesis project a memorable experience and I will miss our zoom meetings!
I also want to give special thanks to Jonatan Malmberg who has provided me with useful advice throughout the project. I am particularly grateful for the time you invested in discussing the characteristics of the prototype with me and in reaching out to your contacts to help me collect data. On that note, I also want to thank all the green roof professionals, experts and stakeholders who took the time to answer my countless emails and phone calls, helping me gather the data I needed to conduct the analysis. I want to give additional recognition to John Symons who was kind enough to give me feedback on the values chosen for data transfer. His expertise helped guide my choices and I am very thankful for it.
Finally, I want to highlight that I was impressed and touched to see that such support was provided by a wide range of actors in a time of pandemic. With the Covid-19 outbreak I know that everyone has been subject to extra pressure and stress. I am therefore even more thankful to have been given that support during such unusual circumstances.
------------------------
Most importantly, I want to dedicate this thesis to Alex, my dedicated love, unconditional friend, and adventurous hiking partner! Thank you for bearing with me for all the years we were apart and for risking everything to come and live with me in Sweden. From Brittany to New Zealand, New Zealand to Canada, Canada to Sweden and finally New Zealand to Sweden we have crossed half the world for each other! The game we are playing is life and I am the luckiest girl to share it with you.
Mille mercis aussi à Manon! Thank you for all the unforgettable moments spent together in Montréal, thanks for coming to visit me all the way in Sweden and thanks for all the skypes before, during and after the thesis period!
Trugarez vras da ma familh evit bezañ bet bepred amañ evidon. Mammig, Tadig, Tangi ha Youna, c’hwi zo tud fiskal ha karout a ran arc’hanoc’h kalz! ♥
A thousand thanks also to our Trollebergsvägen neighbours who have made the quarantine much more bearable! Thanks for sharing these adventures with us, thanks Fynn for all the nice lunches, and thanks for all the memorable themed parties at your place earlier this year! Thanks Nat & Waba for all the support skypes throughout the thesis period, you girls are the best! Henrik thanks again for taking us to the most beautiful swimming spot in Skåne! A thousand thanks to all our friends for all the amazing diners and picnics which made these two years in Lund the best! Special thanks to Joonas and Eeva for the nicest introduction to Finland!
Last but not least, thank you EMP B25 for being the best classmates! From Kullen to Skanör and Bjärred and everything in between, I spent some of the best moments of my life hiking, biking, cooking and hanging out in the sauna! All the group works, study visits, birthday-fikas, parties, lunch runs have made the institute feel like my second home, my Swedish Hogwarts!

Aziliz Le Rouzo, IIIEE, Lund University
II
Abstract Green Roofs (GRs) have been used worldwide as a solution for greening cities, while providing useful services to society such as storm water management, improved air quality, energy savings, and increased biodiversity, to name a few. However, the environmental impact of their structure has been understudied, and more importantly, the carbon cost related to the use of materials that have a high carbon footprint has received little to no attention. In the context of an aspiring carbon neutral Sweden, public and private decision makers need better guidance when considering the implementation of GR systems. While cost-benefit analysis (CBA) is a decision support tool that has been commonly used to assess GR projects from an environmental, social, and economic point of view, the carbon impact of the structure layers has been left unaccounted for. This thesis aims to propose an analytical framework which incorporates the carbon footprint of each component used in the GR structure into CBA, to support more informed decision making.
This analytical framework is tested on two extensive GRs, one made with commonly used materials and one experimental prototype which is almost entirely made with carbon sink materials. This case study is designed to reveal the socio-economic trade-offs resulting from the use of conventional materials versus materials that have a lower carbon footprint. This comparison is also made to support future innovations in GR design and to bring forward the most cost-effective materials from a socio-economic perspective. The results of this thesis show that the two GR alternatives have a positive net present value (NPV) indicating that both projects bring more socio-economic benefits than they incur costs in their lifetime. However, the key findings reveal that while the structure of the conventional GR is a source of carbon which incurs socio-economic costs of 42 SEK/m2, the structure of the prototype is a carbon sink which brings socio-economic benefits of 63 SEK/m2. A comparison of the two extensive GRs shows that the avoided emissions from using the prototype instead of a traditional GR has a value of 105 SEK/m2. Moreover, when considering each component of the GR structure it becomes evident that while it is possible to replace traditional materials with carbon sink materials this generally comes with higher material costs. However, once the avoided CO2 emissions are accounted for, this choice seems of potential interest from a socio-economic perspective.
Keywords:
Carbon Footprint - Green Roof Design – Carbon Sink – Cost-Effectiveness - Life cycle Cost-Benefit Analysis
Re-Thinking Greeen Roof Design
III
Executive Summary Background:
The Special Report on Global Warming of 1.5°C issued by the Intergovernmental Panel on Climate Change (IPCC) left no doubt about the implications of climate change for the planet. Anthropogenic activities have already increased worldwide temperatures 1.0ºC above pre-industrial levels. The role of urban areas in climate change mitigation is crucial. They are host to more than half of the world’s population and consequently the source of a large share of global greenhouse gas (GHG) emissions. With climate-change risks such as rising sea levels, heat stress, extreme precipitation and storms, drought, water scarcity and pollution on the rise, urban areas are also at great risk (Revi et al., 2014).
Urban policies are therefore pivotal to reducing future levels of GHG emissions and in building long-term resilience to climate change risks. Contemporary policy agendas must address a complex multiplicity of threats at the scale of the urban fabric. Green roofs (GRs) work efficiently within this fabric while providing societal benefits such as storm water management, energy savings, heat-island effect reduction, carbon sequestration, increased biodiversity and urban greening, contributing to their worldwide renown.
Problem definition & Knowledge Gaps:
In a context where cities are aiming to implement solutions that will allow them to achieve their sustainability goals, it is important to assess each alternative with relevant decision support tools in order to achieve costs-effectiveness. Cost-benefit analysis (CBA) is commonly used to assess the implementation of GRs from an economic, social, and environmental perspective. A growing body of knowledge highlights that while GRs can represent relatively high private costs for investors, they provide a wide range of private and social benefits during their expected 50 year life-time. However, the overall environmental costs related to their implementation have been understudied, specifically, the environmental impact of the GR structure. The structural characteristics of GRs vary between typologies, providers and countries, but multiple plastic based components is a common trait. While many life cycle assessments (LCA) account for the carbon footprint of the GR structure, this is omitted in most CBA studies, which account for GR carbon impact through:
• the CO2 emissions sequestered by the plant cover through photosynthesis
• the reduced demand for energy due to improved insulation and/or indirectly to a decrease in neighbouring temperatures resulting from the positive impact of GRs on the heat-island effect
This despite growing evidence that it takes several years for the positive impact of GRs on CO2 emissions to compensate for the high carbon footprint of their structure (Kuronuma et al., 2018). In fact, Jones, Bathgate, Symons, and Williams (2018), assert that the carbon footprint of GR materials would need to be accounted for, before drawing any economic benefits from the carbon sequestered by GRs.
The possibility of GRs to act as carbon sinks needs to be further explored in a context where urban areas face more and more pressure to reduce their carbon emissions, such as the city of Malmö which, in cooperation with the city of Copenhagen, plans to make the Öresund region the first cross-border carbon neutral zone in Europe (Azzi, Karltun, & Sundberg, 2019 ; Malmö City, 2014). As carbon accounting becomes more widespread, and as decision makers seek to achieve carbon neutrality cost-effectively, assessing the carbon footprint of GRs will be vital.
Aziliz Le Rouzo, IIIEE, Lund University
IV
Such analytical decision support is what this thesis aims to achieve, by providing an analytical framework which allows for the inclusion of the carbon footprint of the GR structure in CBA.
Objectives & Methods:
To that end, the first objective of this thesis is to investigate how the conventional CBA of GRs can be extended to consider the life cycle carbon profile of their structure. An extensive literature review supports the conceptualisation of an analytical framework which is then tested on two GR systems in a comparative case study. One serves as a baseline, presenting the characteristics of an extensive GR made with conventional materials, while the other is a novel prototype using several carbon sink materials such as biochar and cork.
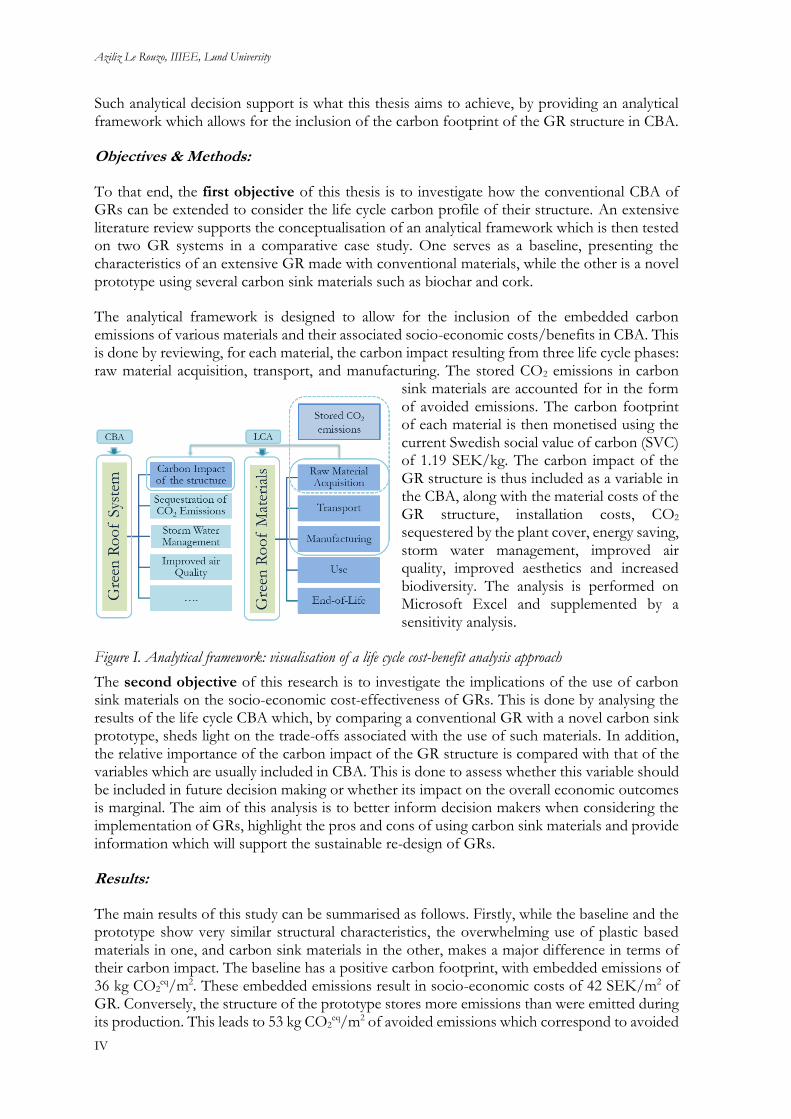
The analytical framework is designed to allow for the inclusion of the embedded carbon emissions of various materials and their associated socio-economic costs/benefits in CBA. This is done by reviewing, for each material, the carbon impact resulting from three life cycle phases: raw material acquisition, transport, and manufacturing. The stored CO2 emissions in carbon
sink materials are accounted for in the form of avoided emissions. The carbon footprint of each material is then monetised using the current Swedish social value of carbon (SVC) of 1.19 SEK/kg. The carbon impact of the GR structure is thus included as a variable in the CBA, along with the material costs of the GR structure, installation costs, CO2 sequestered by the plant cover, energy saving, storm water management, improved air quality, improved aesthetics and increased biodiversity. The analysis is performed on Microsoft Excel and supplemented by a sensitivity analysis.
Figure I. Analytical framework: visualisation of a life cycle cost-benefit analysis approach
The second objective of this research is to investigate the implications of the use of carbon sink materials on the socio-economic cost-effectiveness of GRs. This is done by analysing the results of the life cycle CBA which, by comparing a conventional GR with a novel carbon sink prototype, sheds light on the trade-offs associated with the use of such materials. In addition, the relative importance of the carbon impact of the GR structure is compared with that of the variables which are usually included in CBA. This is done to assess whether this variable should be included in future decision making or whether its impact on the overall economic outcomes is marginal. The aim of this analysis is to better inform decision makers when considering the implementation of GRs, highlight the pros and cons of using carbon sink materials and provide information which will support the sustainable re-design of GRs.
Results:
The main results of this study can be summarised as follows. Firstly, while the baseline and the prototype show very similar structural characteristics, the overwhelming use of plastic based materials in one, and carbon sink materials in the other, makes a major difference in terms of their carbon impact. The baseline has a positive carbon footprint, with embedded emissions of 36 kg CO2
eq/m2. These embedded emissions result in socio-economic costs of 42 SEK/m2 of GR. Conversely, the structure of the prototype stores more emissions than were emitted during its production. This leads to 53 kg CO2
eq/m2 of avoided emissions which correspond to avoided
Re-Thinking Greeen Roof Design
V
socio-economic costs of 63 SEK/m2. A comparison of the two extensive GRs shows that the avoided CO2
eq emissions from using the prototype instead of the baseline has a value of 105 SEK/m2. The socio-economic impact of these two structures are monetised using the SVC of 1.19 SEK/kg (applied since 2014), but the sensitivity analysis highlighted that if the new SVC of 7 SEK/kg (applied since April 2020) was to be used, this would result in higher costs for the baseline and higher benefits for the prototype.
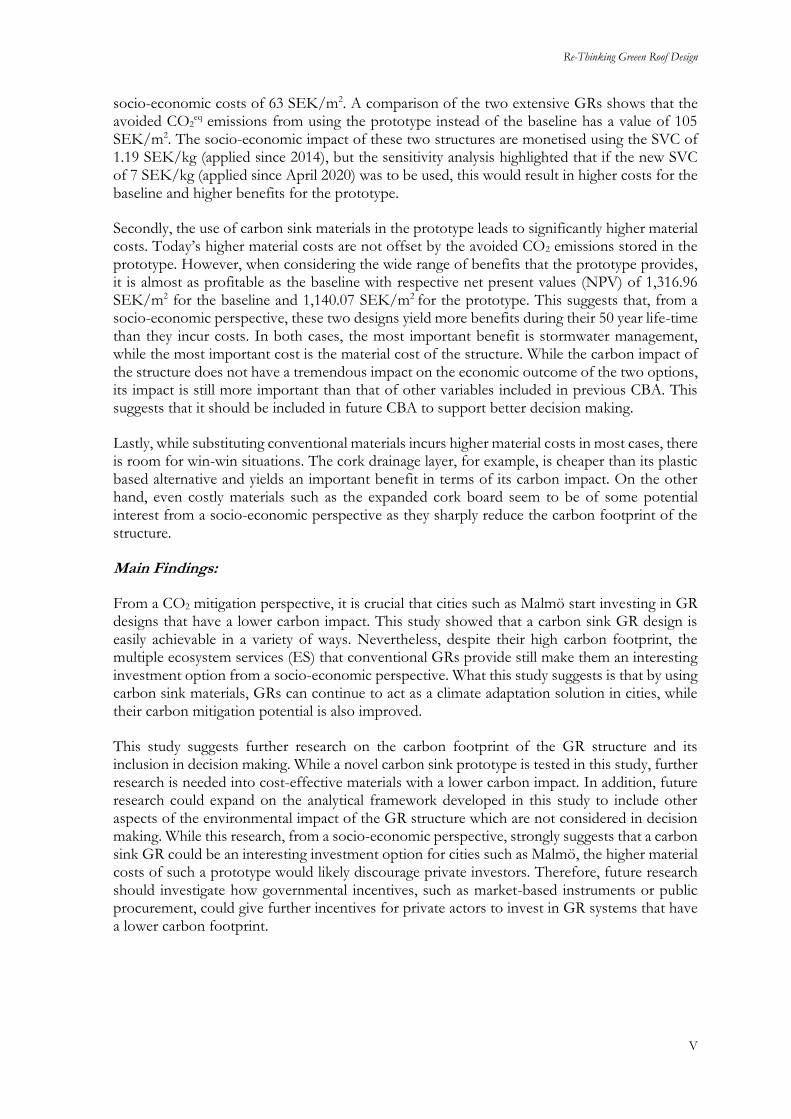
Secondly, the use of carbon sink materials in the prototype leads to significantly higher material costs. Today’s higher material costs are not offset by the avoided CO2 emissions stored in the prototype. However, when considering the wide range of benefits that the prototype provides, it is almost as profitable as the baseline with respective net present values (NPV) of 1,316.96 SEK/m2 for the baseline and 1,140.07 SEK/m2 for the prototype. This suggests that, from a socio-economic perspective, these two designs yield more benefits during their 50 year life-time than they incur costs. In both cases, the most important benefit is stormwater management, while the most important cost is the material cost of the structure. While the carbon impact of the structure does not have a tremendous impact on the economic outcome of the two options, its impact is still more important than that of other variables included in previous CBA. This suggests that it should be included in future CBA to support better decision making.
Lastly, while substituting conventional materials incurs higher material costs in most cases, there is room for win-win situations. The cork drainage layer, for example, is cheaper than its plastic based alternative and yields an important benefit in terms of its carbon impact. On the other hand, even costly materials such as the expanded cork board seem to be of some potential interest from a socio-economic perspective as they sharply reduce the carbon footprint of the structure.
Main Findings:
From a CO2 mitigation perspective, it is crucial that cities such as Malmö start investing in GR designs that have a lower carbon impact. This study showed that a carbon sink GR design is easily achievable in a variety of ways. Nevertheless, despite their high carbon footprint, the multiple ecosystem services (ES) that conventional GRs provide still make them an interesting investment option from a socio-economic perspective. What this study suggests is that by using carbon sink materials, GRs can continue to act as a climate adaptation solution in cities, while their carbon mitigation potential is also improved.
This study suggests further research on the carbon footprint of the GR structure and its inclusion in decision making. While a novel carbon sink prototype is tested in this study, further research is needed into cost-effective materials with a lower carbon impact. In addition, future research could expand on the analytical framework developed in this study to include other aspects of the environmental impact of the GR structure which are not considered in decision making. While this research, from a socio-economic perspective, strongly suggests that a carbon sink GR could be an interesting investment option for cities such as Malmö, the higher material costs of such a prototype would likely discourage private investors. Therefore, future research should investigate how governmental incentives, such as market-based instruments or public procurement, could give further incentives for private actors to invest in GR systems that have a lower carbon footprint.

Aziliz Le Rouzo, IIIEE, Lund University
VI
Table of Contents
ABSTRACT .................................................................................................................................... II
EXECUTIVE SUMMARY ............................................................................................................ III
LIST OF FIGURES ................................................................................................................... VIII
LIST OF TABLES ..................................................................................................................... VIII
LIST OF BOXES .......................................................................................................................... IX
LIST OF IMAGES ........................................................................................................................ IX
ABBREVIATIONS ....................................................................................................................... IX
1 INTRODUCTION .................................................................................................................. 1
1.1 BACKGROUND AND SIGNIFICANCE ............................................................................................................1 1.2 PROBLEM DEFINITION ..................................................................................................................................5 1.3 AIM AND RESEARCH QUESTIONS. ...............................................................................................................6 1.4 SCOPE ...............................................................................................................................................................7 1.5 EXTERNAL SUPPORT ......................................................................................................................................7 1.6 AUDIENCE .......................................................................................................................................................8 1.7 DISPOSITION ...................................................................................................................................................8
2 CBA FOR GREEN ROOFS – WHY AND WHY NOT? ....................................................... 9
2.1 COST-BENEFIT ANALYSIS .............................................................................................................................9 2.1.1 Motivation for Use in Environmental Decision Support Tools ..................................................................9 2.1.2 Socio-Economic Valuation ..................................................................................................................... 11 2.1.3 Monetising CO2 Emissions .................................................................................................................... 12
2.2 IMPACTS CONSIDERED IN CURRENT CBAS ............................................................................................. 13 2.2.1 Costs ...................................................................................................................................................... 13 2.2.2 Benefits ................................................................................................................................................... 14 2.2.3 Next Steps for CBA ............................................................................................................................. 16
2.3 THE INCLUSION OF A LIFE CYCLE PERSPECTIVE IN CBA .................................................................... 17 2.4 CARBON FOOTPRINT OF THE GR STRUCTURE ....................................................................................... 19
3 ANALYTICAL FRAMEWORK & METHODOLOGICAL APPROACH ............................ 21
3.1 RESEARCH DESIGN ..................................................................................................................................... 21 3.2 ANALYTICAL FRAMEWORK ........................................................................................................................ 22 3.3 DATA COLLECTION .................................................................................................................................... 24
3.3.1 Review of the costs and benefits to be included ......................................................................................... 24 3.3.2 Involvement of GR practitioners .............................................................................................................. 25 3.3.3 Benefit Transfer Approach ..................................................................................................................... 25 3.3.4 Inclusion of a life cycle perspective ............................................................................................................ 25
3.4 DATA ANALYSIS ........................................................................................................................................... 25 3.4.1 Calculation methods ............................................................................................................................... 25 3.4.2 Comparative analysis .............................................................................................................................. 28 3.4.3 Sensitivity analysis .................................................................................................................................. 28
4 A COMPARISON OF TWO GREEN ROOFS ..................................................................... 29
4.1 CASE STUDY ................................................................................................................................................. 29 4.1.1 Characteristics of the GRs ...................................................................................................................... 29 4.1.2 The use of new materials ......................................................................................................................... 30
4.2 COSTS, BENEFITS AND CARBON IMPACT ................................................................................................ 33 4.2.1 Baseline: Costs & Carbon Impact ......................................................................................................... 33 4.2.2 Prototype: Costs & Carbon Impact ........................................................................................................ 36

Re-Thinking Greeen Roof Design
VII
4.2.3 Additional costs of GR Systems .............................................................................................................. 39 4.2.4 Additional Benefits of GR Systems ......................................................................................................... 40
4.3 COMPARATIVE ANALYSIS ........................................................................................................................... 48 4.3.1 Comparative Carbon Impact of the two GR structures versus their material costs. ................................... 48 4.3.2 Life cycle CBA results: comparison of the two GR systems ...................................................................... 49
4.4 SENSITIVITY ANALYSIS ............................................................................................................................... 53 4.4.1 Socio-economic parameters ....................................................................................................................... 53 4.4.2 Risk Bearing Values .............................................................................................................................. 55 4.4.3 Reflection on NPV ................................................................................................................................ 55 4.4.4 Reflection on the Benefit/Cost Ratio ....................................................................................................... 56
5 DISCUSSION ........................................................................................................................ 60
5.1 OVERVIEW OF THE FINDINGS AND THEIR SIGNIFICANCE ................................................................... 60 5.1.1 Carbon footprint of the GR structure – a good estimate? ......................................................................... 60 5.1.2 CBA results – Comparable to previous studies? ..................................................................................... 61
5.2 CRITICAL REFLECTIONS AND FURTHER RESEARCH ............................................................................... 62 5.2.1 Methodological choices & Incertitude ....................................................................................................... 62 5.2.2 Own Contribution & Future Prospects .................................................................................................. 64 5.2.3 Generalisability ....................................................................................................................................... 66
6 CONCLUSIONS ................................................................................................................... 67
6.1 SUMMARY ...................................................................................................................................................... 67 6.2 RECOMMENDATIONS FOR FUTURE RESEARCH ....................................................................................... 68
BIBLIOGRAPHY .......................................................................................................................... 70
APPENDIX A: COSTS & BENEFITS FROM THE LITERATURE REVIEW ......................... 77
APPENDIX B: GREEN ROOF STRUCTURE FROM LITERATURE REVIEW CASES ........ 79
APPENDIX C: SUMMARY TABLE OF THE NECESSARY DATA FOR THE CBA ............... 82
APPENDIX D: TABLES USED FOR THE CALCULATION OF THE RESULTS .................. 83
APPENDIX E: SUMMARY TABLES OF THE STRUCTURAL COSTS & CARBON IMPACT
OF THE TWO GR STRUCTURES. ..................................................................................... 85
APPENDIX F: SENSITIVITY ANALYSIS SUPPLEMENTARY FIGURES ............................. 87
APPENDIX G: BENEFIT/COST RATIO. .................................................................................. 90
APPENDIX H: SUMMARY TABLES OF THE SENSITIVITY ANALYSIS. ............................ 94
APPENDIX I: COMMUNICATION RECORDS ...................................................................... 102
APPENDIX J: POLICY BRIEF .................................................................................................. 104

Aziliz Le Rouzo, IIIEE, Lund University
VIII
List of Figures Figure 1-1. Extensive Green Roof: Cross-section depicting the different GR layers ........ 4
Figure 2-1. Project versus product-oriented decision support tool .................................... 10
Figure 2-2. Prices in implemented carbon pricing initiatives for 2019 (US$/tCO2eq) ...... 12
Figure 3-1. Analytical framework: visualisation of a life cycle cost-benefit analysis approach ............................................................................................................................. 22
Figure 3-2. Model of the GR substrate ................................................................................... 27
Figure 4-1. Design of the baseline (left) versus the design of the prototype (right)......... 29
Figure 4-2. Comparative structural costs of the baseline versus that of the prototype ... 48
Figure 4-3. Climate impact of the structure of the baseline versus the prototype............ 49
Figure 4-4. Percentage share of the total costs for each variable ........................................ 51
Figure 4-5. Percentage share of the total benefits for each variable ................................... 51
Figure 4-6. Costs & Benefits of GR systems.......................................................................... 52
Figure 4-7. Impact of a change of social value of carbon from 1.19 SEK to 7, for each variable using a 3.5% discount rate. ............................................................................... 54
Figure 4-8. Different scenarios for the risk bearing values (4-7): biochar price, cork price and aesthetic value. ........................................................................................................... 55
Figure 4-9. Summary of the 7 scenarios for the sensitivity analysis .................................... 56
Figure 4-10. Comparative Benefit/Cost Ratio of the baseline versus the prototype ....... 56
Figure 4-11. Change in the material costs and carbon impact of the baseline versus the Prototype for each layer ................................................................................................... 58
Figure 4-12. Material costs of the prototype versus its carbon sink benefit ...................... 59
List of Tables Table 3-1. Average Exchange Rates from 02/01/2019 - 03/01/2020 .............................. 27
Table 3-2. Consumer Price Index variation over time .......................................................... 27
Table 3-3. Example of the necessary information for a life cycle inspired CBA .............. 28
Table 4-1. Structural characteristics of the baseline versus the prototype ......................... 29
Table 4-2. Oxygen:Carbon (O:C) molar ratio of biochar ..................................................... 31
Table 4-3. Net carbon emissions for A1-A3 with and without consideration of CO2 capture and biogenic CO2 emissions .............................................................................. 39
Table 4-4. Yearly carbon sequestration for both the baseline and prototype ................... 41
Table 4-5. Evaluation of the local and regional effects of air pollution in SEK/kg emissions for 2014 & 2020 .............................................................................................. 42

Re-Thinking Greeen Roof Design
IX
Table 4-6. Annual Benefits of Air Quality Improvement for NOx, VOC, SO2 and PM2.5 for the city of Malmö ....................................................................................................... 43
Table 4-7. Yearly storm water management benefit per m2 of GR .................................... 45
Table 4-8. Yearly energy savings for both the baseline and the prototype ....................... 46
Table 4-9. Present values of the costs & benefits of the baseline versus the prototype . 50
Table 5-1. Previous findings of the social NPV of extensive GR systems........................ 62
Table 5-2. Comparative social CO2 impacts of the two GR structures. ............................. 65
List of Boxes
Box 1-1. Useful Definitions - CO2 emissions mitigation ……………………………….3
Box 1-2. Carbon negative versus carbon positive………………………………………5
Box 4-1. Sensitivity Analysis Scenarios………………………………………………...53
List of Images Image 1-1. Extensive Green Roof in Malmö…………………………………………..2
Image 5-1. Extensive GRs in Lund – High Density Example………………………...66
Abbreviations
CCS - Carbon Capture and Storage
CPI - Consumer Price Index
CBA - Cost-Benefit Analysis
ES - Ecosystem Services
EPD - Environmental Product Declaration
GR - Green Roof
GHG - Greenhouse Gas
LCA - Life Cycle Assessment
NBS - Nature-Based Solutions
SGRI - Scandinavian Green Roof Institute
SVC - Social Value of Carbon

Re-Thinking Greeen Roof Design
1
1 Introduction
1.1 Background and Significance
Climate Change & Urban Areas
The Special Report on Global Warming of 1.5°C issued by the Intergovernmental Panel on Climate Change (IPCC) left no doubt about the implications of climate change for the planet. Worldwide temperatures have already increased by 1.0ºC above pre-industrial levels due to anthropogenic activities, and if the current rate of warming is sustained, global temperatures will increase by 1.5ºC between 2030 and 2052. Not exceeding the 1.5ºC threshold set at the Paris Agreement will require greenhouse gas emissions (GHG) to decrease drastically. The scale of the emission-reduction effort must be consequential as there is only one-in-two chance of limiting global warming to 1.5ºC, if global CO2 emissions reach zero in 30 years. Not reaching the 1.5ºC goal will have irrevocable consequences and will push a number of natural and human systems beyond their limit of adaptation (Amir et al., 2018 ; IPCC, 2018).
Urban areas hold a pivotal role in climate change mitigation as they are host to more than half of the world’s population. Urban residents and urban-based activities are consequently the source of a large share of global GHG emissions. In addition to being one of the main drivers of climate change, urban areas also contain the populations and economic activities which are most at risk from it. Urban climate-change risks such as rising sea levels, heat stress, extreme precipitation and storms, drought, water scarcity and pollution to name a few, are on the rise (Revi et al., 2014).
Nature-based solutions & Co-Benefits
Urban policies have major implications for climate change mitigation, both in terms of reducing future levels of GHG emissions as well as in building long-term resilience to climate change risks. In recent years, policy agendas have been focused on addressing the complexity and multiplicity of these threats while operating within spaces limited by the urban fabric. In this context, nature-based solutions (NBS) have received growing attention as they have the potential to tackle multiple challenges at once while making efficient use of space. By mimicking existing ecosystem functions, NBS use biomimicry to design solutions that optimise the co-benefits provided by the existing ecosystem services (ES) which urbanisation has compromised. These co-benefits can take the form of water purification and absorption, flood control, air purification, temperature control, carbon sequestration, to name a few (Revi et al., 2014 ; Dushkova & Haase, 2020). NBS aim to explore this potential by using nature-based processes to address sustainability challenges and help create more resilient living environments (Dorst, van der Jagt, Raven, & Runhaar, 2019). In short, by optimising the provision of environmental, social and economic co-benefits, NBS provide a framework for ecologically sensitive urban development (Dushkova & Haase, 2020).
Green Roofs
Green Roofs (GRs) are NBS that are slowly being included in urban adaptation plans all around the world (Oberndorfer et al., 2007). GRs are defined as a roof structure onto which vegetation is intentionally grown (GRO, 2011). The distinction is usually made between extensive GRs and intensive GRs, even though GR design also varies within these categories. Extensive GRs are usually light-weight, have a substrate less than 150mm deep, are often not accessible to the public and might not even be visible (Rowe & Getter, 2006). On the other hand, intensive GRs necessitate more depth, require more maintenance and are usually associated with roof gardens
Aziliz Le Rouzo, IIIEE, Lund University
2
(Bianchini & Hewage, 2012a). While both types of GRs tend to require high upfront costs borne by private actors, they also provide proven social and environmental benefits in the long-term (Bianchini & Hewage, 2012b). The types of co-benefits provided by extensive and intensive GRs are similar, but their magnitude varies according to their design as well as the specificities of their location. Their relatively lower implementation cost and less constraining design have however made extensive GRs typically more common.
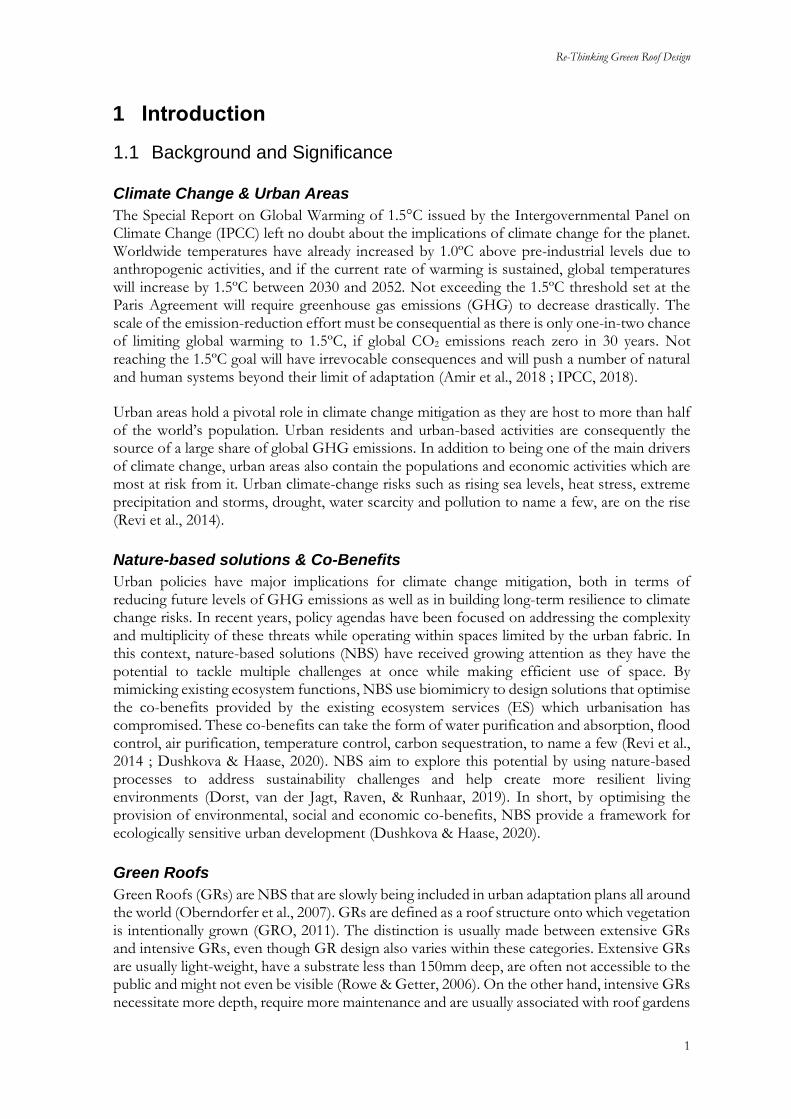
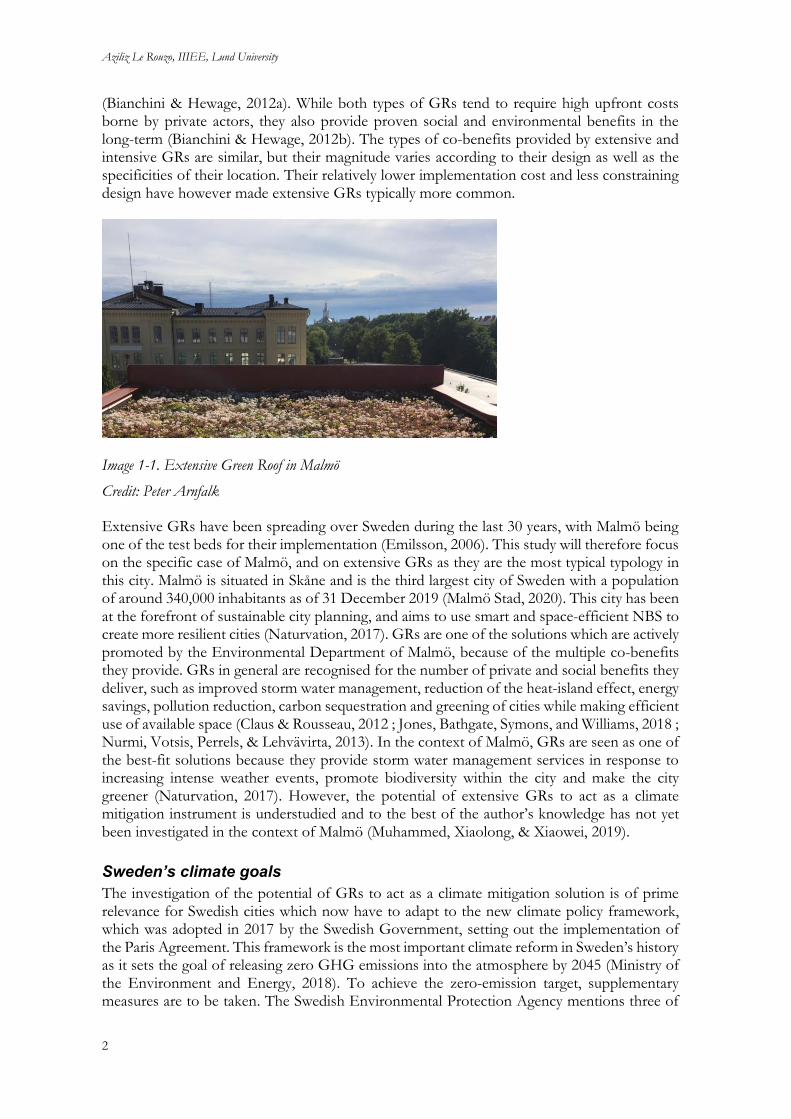
Image 1-1. Extensive Green Roof in Malmö
Credit: Peter Arnfalk
Extensive GRs have been spreading over Sweden during the last 30 years, with Malmö being one of the test beds for their implementation (Emilsson, 2006). This study will therefore focus on the specific case of Malmö, and on extensive GRs as they are the most typical typology in this city. Malmö is situated in Skåne and is the third largest city of Sweden with a population of around 340,000 inhabitants as of 31 December 2019 (Malmö Stad, 2020). This city has been at the forefront of sustainable city planning, and aims to use smart and space-efficient NBS to create more resilient cities (Naturvation, 2017). GRs are one of the solutions which are actively promoted by the Environmental Department of Malmö, because of the multiple co-benefits they provide. GRs in general are recognised for the number of private and social benefits they deliver, such as improved storm water management, reduction of the heat-island effect, energy savings, pollution reduction, carbon sequestration and greening of cities while making efficient use of available space (Claus & Rousseau, 2012 ; Jones, Bathgate, Symons, and Williams, 2018 ; Nurmi, Votsis, Perrels, & Lehvävirta, 2013). In the context of Malmö, GRs are seen as one of the best-fit solutions because they provide storm water management services in response to increasing intense weather events, promote biodiversity within the city and make the city greener (Naturvation, 2017). However, the potential of extensive GRs to act as a climate mitigation instrument is understudied and to the best of the author’s knowledge has not yet been investigated in the context of Malmö (Muhammed, Xiaolong, & Xiaowei, 2019).
Sweden’s climate goals
The investigation of the potential of GRs to act as a climate mitigation solution is of prime relevance for Swedish cities which now have to adapt to the new climate policy framework, which was adopted in 2017 by the Swedish Government, setting out the implementation of the Paris Agreement. This framework is the most important climate reform in Sweden’s history as it sets the goal of releasing zero GHG emissions into the atmosphere by 2045 (Ministry of the Environment and Energy, 2018). To achieve the zero-emission target, supplementary measures are to be taken. The Swedish Environmental Protection Agency mentions three of

Re-Thinking Greeen Roof Design
3
them on their website: 1) increase forests’ uptake of carbon dioxide, 2) effective emission reductions carried out outside the Swedish borders and 3) carbon capture and storage (CCS) based on the combustion of biomass (Swedish Environmental Protection Agency, n.d.). To understand how GRs could be used to serve a carbon capture and storage function, a better understanding of their impact on CO2 emissions is necessary.
Accounting for the Carbon Impact of GRs
The carbon impact of GR systems is complex. A preliminary literature review indicated that when investigating the role of GRs in CO2 emission reduction, a lack of consistency in the usage of the following terms was observed: carbon sequestration, carbon sink, carbon reservoir, carbon storage and CCS. Box 1-1 provides some introductory clarifications. Further elaboration on these terms will follow throughout the text.
Box 1-1. Useful Definitions - CO2 emissions mitigation
A distinction is made between carbon sequestration, which is understood as the active uptake and storage of carbon by plants which thus act as a carbon sink, and carbon storage, which refers to components that act as a reservoir of carbon (EEA, 2019 ; Spokas, 2010). This distinction is made as materials that store carbon have the potential to act as a carbon sink for a certain amount of time, but this property is entirely dependent on their end-of-life. In addition, while the sequestration of carbon by plants is a continuous process, the storage of carbon by CCS technologies only happens once and is sustained until the material is burned or degraded (Spokas, 2010). While these concepts are elaborated further in this study, the following paragraph describes how the carbon impact of GRs has been investigated thus far.
On one hand, GRs have the potential to actively reduce CO2 emissions over their lifetime but this benefit has to be nuanced as the structure of GRs can be a source of CO2 emissions over its life cycle (Kuronuma et al., 2018). When considering the implementation of GRs in cities, cost-benefit analysis (CBA) is a decision support tool that has been commonly used to account for the economic, environmental and social costs and benefits arising from these systems (Pearce, Atkinson, & Mourato, 2006). Conventional CBAs have investigated the carbon impact of GR systems considering the following elements:
• First, a reduction in emissions is achieved through the process of photosynthesis induced by the plant cover of the roof. The magnitude of this effect varies according to plant species, substrate type and climate.
• Secondly, indirect emission reductions result from a reduced energy demand on the building, both for heating in winter and for cooling in summer. This can be either due to better insulation or to a reduction in neighbouring temperatures via the heat-island reduction effect.
“Carbon capture and storage is a process consisting of the separation of CO2 from industrial and energy-related sources,
transport to a storage location and long-term isolation from the atmosphere.” (IPCC, 2005, p.3)
“Reservoir means a component or components of the climate system where a greenhouse gas or a precursor of a greenhouse gas is
stored.” (United Nations, 1992, p.7)
“Sink means any process, activity or mechanism which removes a greenhouse gas, an aerosol or a precursor of a greenhouse gas from
the atmosphere.” (United Nations, 1992, p.7)
Aziliz Le Rouzo, IIIEE, Lund University
4
Accordingly, the carbon sequestration realised by GR systems over their lifetime has been accounted for as a socio-economic benefit in CBA. However, the carbon footprint of their structure, which could incur both high environmental and social costs as well as benefits, is yet un-accounted for. Here, the carbon footprint of a GR is defined as the overall amount of GHG associated with its whole life cycle (Caro, 2019). The carbon footprint of GR systems can be investigated using a life cycle assessment (LCA), which is a method used to determine the environmental impact linked to a specific product system throughout its life cycle (Krey et al., 2014). While some LCAs have been able to quantify the carbon footprint of the GR structure, this potential externality has not been included in most CBAs. This despite growing evidence that it takes several years for the carbon sequestration and energy savings to offset the carbon footprint of the installation (Kuronuma et al., 2018). These findings encourage further research into how GR structures can be shifted from carbon sources to carbon sinks while incorporating the associated socio-economic impact in decision making (Jones et al., 2018 ; Kuronuma et al., 2018).
New Design – for a decreased carbon footprint
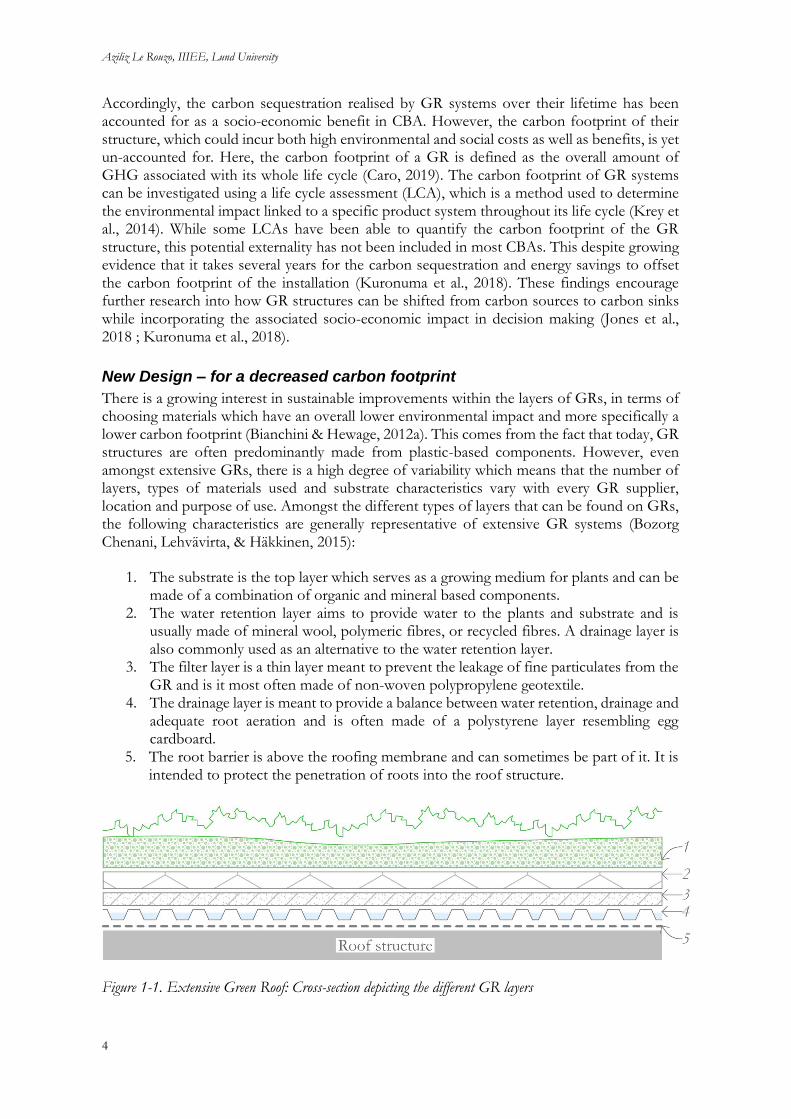
There is a growing interest in sustainable improvements within the layers of GRs, in terms of choosing materials which have an overall lower environmental impact and more specifically a lower carbon footprint (Bianchini & Hewage, 2012a). This comes from the fact that today, GR structures are often predominantly made from plastic-based components. However, even amongst extensive GRs, there is a high degree of variability which means that the number of layers, types of materials used and substrate characteristics vary with every GR supplier, location and purpose of use. Amongst the different types of layers that can be found on GRs, the following characteristics are generally representative of extensive GR systems (Bozorg Chenani, Lehvävirta, & Häkkinen, 2015):
1. The substrate is the top layer which serves as a growing medium for plants and can be made of a combination of organic and mineral based components.
2. The water retention layer aims to provide water to the plants and substrate and is usually made of mineral wool, polymeric fibres, or recycled fibres. A drainage layer is also commonly used as an alternative to the water retention layer.
3. The filter layer is a thin layer meant to prevent the leakage of fine particulates from the GR and is it most often made of non-woven polypropylene geotextile.
4. The drainage layer is meant to provide a balance between water retention, drainage and adequate root aeration and is often made of a polystyrene layer resembling egg cardboard.
5. The root barrier is above the roofing membrane and can sometimes be part of it. It is intended to protect the penetration of roots into the roof structure.
Figure 1-1. Extensive Green Roof: Cross-section depicting the different GR layers
Re-Thinking Greeen Roof Design
5
A growing body of studies highlight the need to develop new GR designs, including materials with a lower environmental footprint such as by-products or carbon negative materials such as CCS technologies (Pushkar, 2019 ; Bianchini & Hewage, 2012a ; Rincón et al., 2014 ; Kuronuma et al., 2018). There is therefore a need to investigate the extent to which the different layers of GRs could be substituted with materials that act as a carbon sink, while still providing an interesting investment option.
Box 1-2. Carbon negative versus carbon positive
In short, GRs are recognised as a sustainable solution to greening cities and growing attention has been given to the many ES they provide. The carbon footprint of GRs’ structure has received little attention, despite the fact that it will ultimately determine whether GR systems are a net source or sink of carbon. Accounting for the carbon footprint of the GR structure would be a necessary step before accounting for the reduction in carbon emissions induced by GR systems, in order to get a more realistic estimate of the carbon balance of that system. In fact, Jones et al., (2018), point out that the carbon footprint of GR materials would need to be accounted for, before drawing any economic benefits from the carbon sequestered by GRs. The possibility of GRs to act as carbon sinks needs to be further explored in a context where urban areas face more and more pressure to reduce their carbon emissions (Azzi et al., 2019). This prospect could be of particular interest for the city of Malmö which, in cooperation with the city of Copenhagen, plans to make the Öresund region the first cross-border carbon neutral zone in Europe (Malmö City, 2014).
1.2 Problem Definition The carbon impact of GRs is going to have an increasing importance as Swedish cities will have to choose between different measures to achieve their GHG emissions mitigation goals. Cost-effectiveness, which is defined as a measure of the cost at which a policy goal or outcome is achieved, is one of the prominent decision making criteria when considering different mitigation options (IPCC, 2018 ; Patwardhan et al., 2007). Cost-effectiveness is taken into account when considering the trade-offs between climate change impacts and the associated costs of emission mitigation (Patwardhan et al., 2007). Consequently, alternatives which achieve the GHG emission mitigation goals with the highest-cost effectiveness will be prioritised. Considering the carbon footprint of GRs in decision-making is going to be of central importance in the coming years as carbon accounting becomes more widespread, and as decision makers will seek to cost-effectively achieve carbon neutrality.
Getting a more accurate estimation of the net carbon footprint of GR systems over their lifetime will be therefore important when considering their future implementation. This especially as the recent review of the social value of carbon (SVC) by Arbetsgruppen för Samhällsekonomiska Kalkyler (ASEK) increased the SVC from 1.14 SEK(2014)/kg to 7 SEK(2020)/kg, which indicates a higher budget allocated to carbon sequestration. The ASEK guidelines are the result of a workgroup for CBA which is under the Ministry of Infrastructure,
“Net negative emissions: A situation of net negative emissions is achieved when, as result of human
activities, more greenhouse gases are removed from the atmosphere than are emitted into it. Where multiple
greenhouse gases are involved, the quantification of negative emissions depends on the climate metric chosen
to compare emissions of different gases (such as global warming potential, global temperature change
potential, and others, as well as the chosen time horizon).” (IPCC, 2018, p.555)
Following this definition, this study describes carbon negative materials as materials that store more carbon
than was produced during their manufacture, while carbon positive materials describe the opposite scenario.

Aziliz Le Rouzo, IIIEE, Lund University
6
Trafikverket. This new value became effective on April 1st 2020, and was computed to reflect the non-compliance fee when oil companies do not comply with the Swedish law “Duty of Reduction” (Trafikverket, 2019)1. Sweden’s political choice of increasing the SVC could potentially have consequential implications on future decision making. The contextual background of this extraordinary high value is an explicit ambition to stimulate road freight to shift to rail and maritime traffic (Trafikverket, 2019). This value will be applied in CBA when assessing investments in infrastructure and other measures to stimulate a modal shift. However, from a socio-economic cost-effective perspective, the same values and thus trade-offs between costs and benefits should apply to all sectors.2
This might not have a direct impact on the decision making of private actors, but at the municipal level it will most likely mean that more resources will be invested in carbon sequestration technologies. When comparing different alternatives, the municipality of Malmö will have a stronger incentive than ever to favour projects that have the lowest carbon footprint. Municipalities will therefore look for reliable decision-making tools with which to quantify the carbon impact of future projects.
Depending on the importance of the CO2 emission reduction potential of GRs compared with the other benefits they provide, the inclusion of the new SVC of 7 SEK/kg in CBA calculations could significantly increase the assessment of benefits provided by GRs. So far, the CO2 emission reduction induced by either sequestration from the plants or reduced energy consumption were found to be non-negligible though their importance varied depending on various factors such as roof, vegetation and substrate type. However, as mentioned above, little attention has been given to the role of the roof design in reducing the overall carbon footprint of GRs. While applied CBAs of GRs so far have only accounted for the CO2 emissions sequestered by the plant cover as well as the indirect reduction in energy consumption, they omitted the potential carbon embedded in the materials of the GR structure. Accounting for the avoided emissions associated with the use of materials that act as carbon sinks is therefore necessary in order to provide future investors with a more holistic perspective with estimates that reflect a higher SVC. This is what this thesis aims to achieve, by providing an analytical framework which allows for the inclusion of the carbon footprint of the GR structure in CBA.
1.3 Aim and Research Questions. The aim of this research is to investigate the implications of the use of carbon sink materials in the GR structure on the socio-economic cost-effectiveness of GR systems. This is done through the comparison of a commonly used GR (baseline) and a new GR prototype, in which certain components of the substrate and GR layers are substituted with materials that have a carbon sink potential or which have a lower carbon footprint. This thesis asks whether the substitution of these materials will only affect the carbon footprint of GRs or whether it will also impact other properties of the GR. This will help reveal the economic, social and environmental implications of the two types of GRs. As the performance of GRs is context specific, the city of Malmö where extensive GRs are relatively well established, was chosen as
1 This law requires oil companies to annually increase the share of biofuel in petrol and diesel. Oil companies that fail to
increase the share of renewable fuel have to pay a “Duty of Reduction Charge”. This charge is 4-5 kronor per kg CO2
reduction that is not achieved.
2 It must be noted that this is not yet clearly supported by governmental agencies and is thus, for now, only hypothetical. To
account for the possibility however, a sensitivity analysis will be performed (see Chapter 4).
Re-Thinking Greeen Roof Design
7
a case study. To address the aim of this study, I have worked with the following research questions:
RQ1) How can the conventional green roof cost-benefit analysis be extended to consider the life cycle carbon profile of the green roof structure?
RQ2) What are the implications of the use of carbon sink materials on the socio-economic cost-effectiveness of green roofs?
RQ1 will serve as the basis of the analytical framework, based on an extensive literature review. The question will be approached theoretically at first, through a conceptualisation of the analytical framework, and thereafter practically, by applying this framework to the case study. The analysis of the results obtained from conducting a life cycle inspired CBA on the two types of GRs will facilitate the answer to RQ2.
1.4 Scope
Geographical & Temporal Scopes
The geographical scope of this study is Malmö, Sweden. This city was chosen because of its proximity, the relative widespread of GRs in that area which thought to optimise the quality of the data collection process, the engagement of local authorities in promoting the implementation of GRs, as well as the presence of the Scandinavian Green Roof Institute (SGRI) which has been conducting a large amount of research and development projects locally and which constituted a precious source of information. Despite the fact that Malmö was chosen as a case study for conducting the life cycle inspired CBA, where data was not available locally, estimates from similar or nearby locations were used. The timespan of the CBA was decided to be 50 years which is the average lifespan of a typical GR. The CBA analysis was scoped down to only consider the different GRs layers thus considering GRs as an independent system. It did not take into account the building context though the impact of the building lifespan on GRs’ longevity was reflected upon.
Case Study Choice
Considering that geographical context, extensive green roofs were chosen as a case study as they are the most common in Malmö and generally all over Sweden (Emilsson, 2006). To evaluate the implications of the use of carbon sink materials on the cost-effectiveness of GR’s, a conventional GR was compared with a new GR prototype using a life cycle inspired CBA. This study does not compare these two GR systems with a standard roof as this study is interested in investigating the impact of the substitution of more environmentally friendly materials that have a lower carbon footprint with the materials commonly used on Swedish GRs. The analytical framework used in this study is a life cycle inspired CBA which was developed following an in-depth literature analysis focusing on the recent developments of CBA which include some elements of the life cycle. It must be noted that only the raw material extraction, transport and production phases of the materials’ life cycle is considered in the calculations.
1.5 External Support This thesis has been written with the support and advice of the SGRI in Malmö, represented by their former (2012-April 2020) manager Jonatan Malmberg. The SGRI has a long experience of working on GR projects and is a leading influence in that field in Scandinavia.
Aziliz Le Rouzo, IIIEE, Lund University
8
Their role varies from providing study visits and courses to the public, participating in research and development projects as well as providing consultation (SGRI, 2020).
The research topic of conducting a CBA on GRs started with an idea by the thesis author to evaluate the use of biochar as a substrate amendment. After that, the SGRI was contacted with the intention of obtaining support in the form of expert advice and data collection. Jonatan Malmberg, with inspiration from Dusty Gedge’s ideas (Green Infrastructure Consultancy), suggested the use of other low-carbon materials. While the original idea of a carbon sink prototype originated from this informal collaboration, this thesis helped refine the specific characteristics of the prototype by investigating for each of the proposed materials: their previous applications on GRs and demonstrated performance, their costs, and their carbon impact. However, the full socio-economic analysis was independently performed by the thesis author. Given the fact that the GR prototype was suggested by the SGRI, with inspiration from Green Infrastructure Consultancy, this thesis will inevitably play a role in advancing their own research. Against this background it is relevant to mention that the thesis author did not receive any type of funding for completing this work and thus the researcher’s own integrity was in no circumstance compromised.
1.6 Audience This thesis is aimed at decision makers and researchers interested in GR systems. Researchers will benefit from an extended approach to considering the carbon footprint of the GR structure in CBA. The results contribute to a more complete assessment of the costs & benefits associated with the implementation of GR systems which will be of use for decision makers. In addition, this study examines the trade-offs associated with the substitution of traditional GR layers with carbon negative alternatives while highlighting which materials are most cost-effective from a carbon mitigation perspective. Finally, it provides guidelines on how to re-consider GR design in order to reduce the carbon impact of their structure while optimising its cost-effectiveness.
1.7 Disposition Following the presentation of the background and definition of the problem, Chapter 1 introduced the research questions along with the scope of this study and its intended audience. In Chapter 2 an extensive literature review is conducted with the aim of 1) investigating the use of CBA in environmental decision making against other decision support tools, 2) exploring its mechanisms when applied to the case of GRs, while investigating which aspects of GR systems are considered in decision making, 3) examining how recent developments in CBA led to the inclusion of life cycle steps to better capture the environmental impact of the GR structure and finally 4) reviewing the carbon footprint of the GR structure and assessing whether it should be included in future CBAs to achieve more informed decision making. Chapter 3 elaborates upon the research design and analytical framework developed to conduct this study while providing a step by step guide to the methodological approach. Chapter 4 presents the results of this study, followed by their analysis which is complemented by a sensitivity analysis. Chapter 5 provides an interpretation of the results which serves to answer the research questions. The findings of this study are then discussed in comparison with previous research on the topic. Finally, the methodological approach and analytical framework are reflected upon. Lastly, Chapter 6 provides the core conclusions of this study while highlighting the contribution of this research within the field. In addition, new research gaps are emphasised along with recommendations for future research.

Re-Thinking Greeen Roof Design
9
2 CBA for Green Roofs – why and why not? This chapter first provides an overview of how and why CBA is used for environmental decision making, and more specifically when considering GR systems. It then highlights the variables that are considered by decision makers when looking at the implementation of GRs in urban areas, while also reviewing the methodological approaches used for the valuation of the different costs and benefits. As a third step, this chapter analyses recent developments in CBA, where life cycle steps are included in CBA calculations. Finally, it investigates the carbon footprint of GR structures and the importance it could have in future decision making if included in CBA calculations. The literature review was conducted using both Google scholar, Science Direct and the Lund University’s LUBsearch.
2.1 Cost-Benefit Analysis This first section aims to provide some background on CBA as a decision-making tool and the rationale for using it in environmental decision making. It then elaborates on the motivations for using it when applied to the specific case of GR systems. Finally, it introduces valuation methods that are typically used in CBA when valuing non-market goods such as the ES provided by GR systems.
2.1.1 Motivation for Use in Environmental Decision Support Tools
The growing adoption of GRs as an urban planning instrument means that there is a need to find supporting tools for decision-making to assess their economic, environmental and social impacts (Nurmi, Votsis, Perrels, & Lehvävirta, 2016). While several methods could be used to do so, such as the multi-criteria analysis, CBA or LCA, the focus of each of these methodologies is different (Hoogmartens, Van Passel, Van Acker, & Dubois, 2014). Each of these tools is based on different assumptions, uses different metrics and has different data requirements which means that the results they provide will differ. Such conflicting assessments are a source of doubt for decision makers and brings their individual relevance into question (Hoogmartens et al., 2014). Ultimately, the choice of an appropriate tool depends on the aim and scope of the study in question.
Monetary, Indicator-based and Biophysical Tools
Gasparatos & Scolobig (2012) make the distinction between three types of sustainability assessment tools: monetary, indicator-based and biophysical. Monetary tools such as CBA are preference based and rest on the assumption that value arises from the subjective preferences of individuals. The valuation perspective of monetary valuation tools is by definition anthropocentric where trade-offs are made between alternatives providing different levels of utility. On the other hand, indicator-based instruments such as the multi-criteria analysis involve important methodological choices when it comes to the indicator selection, weighing, normalisation and aggregation. These choices, again, are heavily reliant on the researchers’ assumption and are likely to lead to diverging results. Biophysical tools, on the other hand, adopt a more eco-centric valuation process by favouring alternatives that demand the lowest amount of natural resources. Each of these methods come with trade-offs which entails that the choice of the most appropriate decision support tool is therefore case specific and depends on the ontological and epistemological assumptions of researchers (Gasparatos & Scolobig, 2012).
Product versus Project Related Assessment Tools
Moreover, an important distinction needs to be made in terms of the scope of these approaches. Ghinea & Gavrilescu (2010) make the distinction between product-related
Aziliz Le Rouzo, IIIEE, Lund University
10
assessment tools such as LCA, project related assessment such as CBA and sector and country-related assessment such as multicriteria decision making. Their overview highlights that CBA is most useful when the maximisation of society’s utility is at the core of preoccupations while LCA favours the option that has the minimal environmental impact (Ghinea & Gavrilescu, 2010). However, they point out that LCA and CBA methodologies, to a certain extent, overlap.
In some cases, it can be beneficial to use them together, in which case, the results of the LCA can be used to quantify some of the environmental costs (Ghinea & Gavrilescu, 2010).
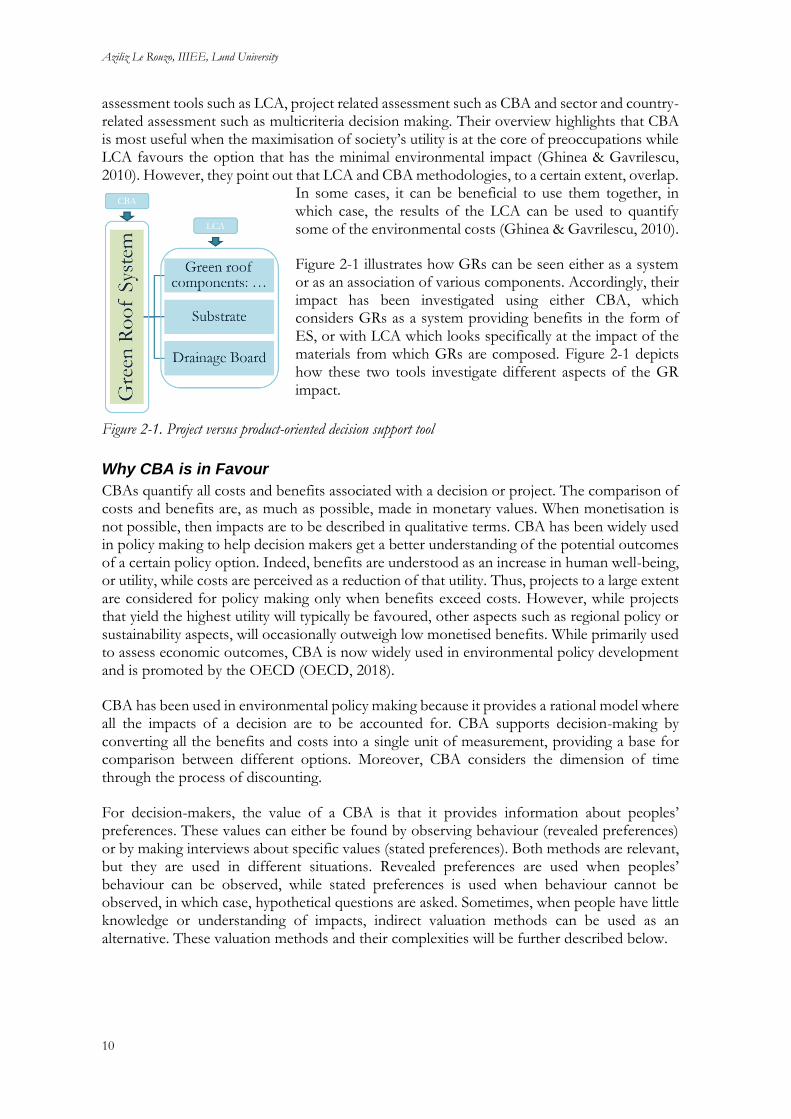
Figure 2-1 illustrates how GRs can be seen either as a system or as an association of various components. Accordingly, their impact has been investigated using either CBA, which considers GRs as a system providing benefits in the form of ES, or with LCA which looks specifically at the impact of the materials from which GRs are composed. Figure 2-1 depicts how these two tools investigate different aspects of the GR impact.
Figure 2-1. Project versus product-oriented decision support tool
Why CBA is in Favour
CBAs quantify all costs and benefits associated with a decision or project. The comparison of costs and benefits are, as much as possible, made in monetary values. When monetisation is not possible, then impacts are to be described in qualitative terms. CBA has been widely used in policy making to help decision makers get a better understanding of the potential outcomes of a certain policy option. Indeed, benefits are understood as an increase in human well-being, or utility, while costs are perceived as a reduction of that utility. Thus, projects to a large extent are considered for policy making only when benefits exceed costs. However, while projects that yield the highest utility will typically be favoured, other aspects such as regional policy or sustainability aspects, will occasionally outweigh low monetised benefits. While primarily used to assess economic outcomes, CBA is now widely used in environmental policy development and is promoted by the OECD (OECD, 2018).
CBA has been used in environmental policy making because it provides a rational model where all the impacts of a decision are to be accounted for. CBA supports decision-making by converting all the benefits and costs into a single unit of measurement, providing a base for comparison between different options. Moreover, CBA considers the dimension of time through the process of discounting.
For decision-makers, the value of a CBA is that it provides information about peoples’ preferences. These values can either be found by observing behaviour (revealed preferences) or by making interviews about specific values (stated preferences). Both methods are relevant, but they are used in different situations. Revealed preferences are used when peoples’ behaviour can be observed, while stated preferences is used when behaviour cannot be observed, in which case, hypothetical questions are asked. Sometimes, when people have little knowledge or understanding of impacts, indirect valuation methods can be used as an alternative. These valuation methods and their complexities will be further described below.

Re-Thinking Greeen Roof Design
11
2.1.2 Socio-Economic Valuation
The valuation of non-market goods or bads in conventional economic analysis for environmental decision-making is complex and brings up several challenges (Jones et al., 2018). This section will cover the three main categories of non-market valuation methods which are: revealed preference methods, stated preference methods and avoided cost methods.
Revealed Preference Methods
Revealed preference methods are valuation techniques which rely on the fact that many non-market goods are indirectly traded on markets. Revealed preference methods rely on observed behaviours of purchases in actual markets to value non-market goods or bads. One of the most common examples shows that the value associated with nature recreation can be captured by looking at the travel cost invested to reach a location. Another prominent application is hedonic pricing, whereby the value of environmental goods and services is perceived as an attribute of related purchases. A notable example consists of estimating the value of green areas in cities by investigating how proximity to a park increases property value. Moreover, shadow pricing is used in the case where there is a similar good or service to the one that is being studied, in which case its value is used as a proxy. An example could be the use of the entrance fee for a park as a proxy for the utility gained by visiting it. The final application consists of accounting for the averting behaviour and defensive expenditure approaches, whereby individuals take costly actions to avoid a non-market bad.
Stated Preference Methods
Stated preference methods rely on answers to carefully worded survey questions as opposed to observed behaviours and preferences. Contingent valuation is one of the most common stated preference methods, whereby respondents are directly asked for their willingness to pay for a certain change in the level of provision of a non-market good. Alternatively, respondents could also be asked how much they would be willing to accept in compensation of the loss of a non-market good or service. In a contingent valuation questionnaire, a hypothetical market is presented and respondents are expected to behave as though they were in a real market. This method has been subject to criticism, notably because it is believed that respondents are often unable to provide a realistic estimation of how much they would actually be willing to pay, which leads to overestimations (Jones et al., 2018).
Avoided Costs Methods
Avoided costs methods estimate the cost of a conventional approach to risk mitigation compared with the equivalent mitigation efforts with the alternative under study, such green infrastructure (OECD, 2018). A common example is that of wetlands, which provide ES in the form of improved water quality and pollution reduction. The estimated value of a wetland will be inferred from the cost of an alternative technology providing the same services, in this case a conventional water treatment process. This valuation technology is particularly applicable to GRs, where most of the benefits they provide such as storm water management, pollution reduction and carbon sequestration can be valued using an avoided cost approach (Jones et al., 2018). It should be noted that the avoided cost approach is applied to the SVC, which describes the monetary value of the worldwide damage induced by one tonne of CO2 emitted at any time in the future (Baranzini et al., 2017). While the SVC can be used to evaluate the cost of releasing carbon emissions into the atmosphere, the next section will discuss how other proxies can be used.
Aziliz Le Rouzo, IIIEE, Lund University
12
2.1.3 Monetising CO2 Emissions
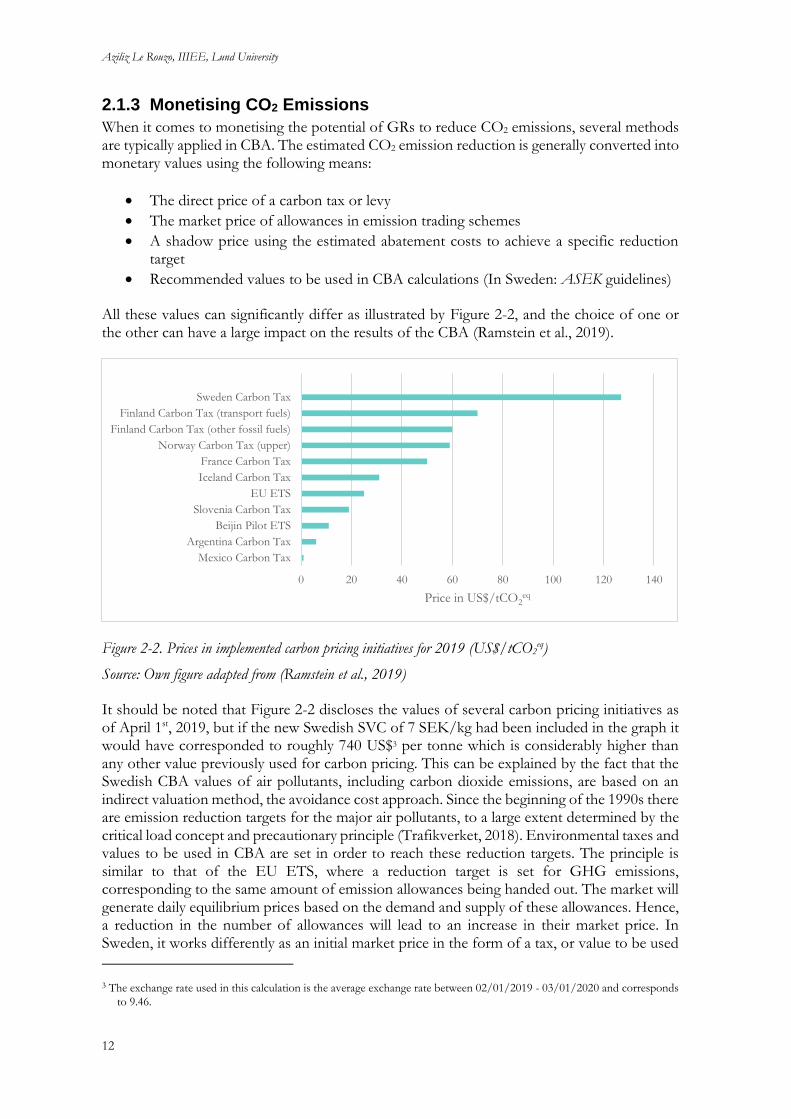
When it comes to monetising the potential of GRs to reduce CO2 emissions, several methods are typically applied in CBA. The estimated CO2 emission reduction is generally converted into monetary values using the following means:
• The direct price of a carbon tax or levy
• The market price of allowances in emission trading schemes
• A shadow price using the estimated abatement costs to achieve a specific reduction target
• Recommended values to be used in CBA calculations (In Sweden: ASEK guidelines)
All these values can significantly differ as illustrated by Figure 2-2, and the choice of one or the other can have a large impact on the results of the CBA (Ramstein et al., 2019).
Figure 2-2. Prices in implemented carbon pricing initiatives for 2019 (US$/tCO2eq)
Source: Own figure adapted from (Ramstein et al., 2019)
It should be noted that Figure 2-2 discloses the values of several carbon pricing initiatives as of April 1st, 2019, but if the new Swedish SVC of 7 SEK/kg had been included in the graph it would have corresponded to roughly 740 US$3 per tonne which is considerably higher than any other value previously used for carbon pricing. This can be explained by the fact that the Swedish CBA values of air pollutants, including carbon dioxide emissions, are based on an indirect valuation method, the avoidance cost approach. Since the beginning of the 1990s there are emission reduction targets for the major air pollutants, to a large extent determined by the critical load concept and precautionary principle (Trafikverket, 2018). Environmental taxes and values to be used in CBA are set in order to reach these reduction targets. The principle is similar to that of the EU ETS, where a reduction target is set for GHG emissions, corresponding to the same amount of emission allowances being handed out. The market will generate daily equilibrium prices based on the demand and supply of these allowances. Hence, a reduction in the number of allowances will lead to an increase in their market price. In Sweden, it works differently as an initial market price in the form of a tax, or value to be used
3 The exchange rate used in this calculation is the average exchange rate between 02/01/2019 - 03/01/2020 and corresponds
to 9.46.
0 20 40 60 80 100 120 140
Mexico Carbon Tax
Argentina Carbon Tax
Beijin Pilot ETS
Slovenia Carbon Tax
EU ETS
Iceland Carbon Tax
France Carbon Tax
Norway Carbon Tax (upper)
Finland Carbon Tax (other fossil fuels)
Finland Carbon Tax (transport fuels)
Sweden Carbon Tax
Price in US$/tCO2eq

Re-Thinking Greeen Roof Design
13
in project appraisals, is set as a means to give an incentive to reduce emissions. If the tax or value does not provide a strong enough incentive to reach the reduction targets, then the price should be increased. The new carbon dioxide value of 7 SEK/kg is motivated by this market principle and reflects a stronger focus on climate mitigation from the Swedish government (Ministry of the Environment and Energy, 2018). The choice of proxy for the valuation of carbon aspects is therefore of crucial importance, as it will reveal the importance bestowed upon climate mitigation which differs from country to country.
In conclusion, revealed preference methods, stated preference methods and avoided cost methods all provide a means to assign a monetary value to non-market goods or bads and are useful in environmental decision making. These methods are, however, subject to some criticism as data is often scarce and studies need to make use of the benefit-transfer approach, where values from studies conducted elsewhere are applied to the target location (Jones et al., 2018). Moreover, while individual preferences give good decision-support for governmental bodies when individuals have relevant knowledge about gains and losses, more complex situations necessitate expert judgement, where indirect valuation methods are thought to provide more accurate results. The next section will describe how these methods are used in practice when applied to GR systems.
2.2 Impacts considered in current CBAs This section aims to describe and compare how current CBA studies have been accounting for the costs and benefits resulting from the implementation of GR systems. It provides a review of which variables have been taken into account in decision making, which ones have been effectively quantified and which ones were not, due to a lack of data, the complexity of the calculations or the lack of an incentive to do so.
2.2.1 Costs
This section summarises all the costs that were mentioned in the chosen studies and the methodology used to monetise them when applicable. The numerical results are available in Table A-1 of Appendix A.
Construction Costs
The construction costs of GRs are compared with the cost of a standard roof, usually corresponding to a low-slope bitumen roof. The choice of benchmark is however study dependent, and prices vary depending on the type of roof covering and insulation layer (Rosasco & Perini, 2019). While some studies rely on practitioners’ interviews (Nurmi et al., 2016), most draw on previous research (Claus & Rousseau, 2012 ; Bianchini & Hewage, 2012b). Broadly the range of construction costs from these studies varied between 35€/m2 to more than 150€/m2.
Maintenance Costs
Maintenance costs of GRs need to be compared to the maintenance costs of conventional roofs over a decided time frame. On average the life-span of GRs is twice as long as that of conventional roofs (Rosasco & Perini, 2019). Rosasco & Perini (2019) provide a detailed study in which they list the maintenance costs of extensive GRs as follows: mowing, eradication of weeds, soil fertilisation and cleaning of ducts for collecting and removing rainwater.

Aziliz Le Rouzo, IIIEE, Lund University
14
Training Costs
Training costs have only been mentioned by Claus & Rousseau (2012). These costs are defined as the additional costs associated with the training of builders in making the necessary infrastructure for GRs. Claus & Rousseau (2012) deemed it negligible and did not attempt to quantify it.
Regulatory Costs
Regulatory costs have only been mentioned by Claus & Rousseau (2012). GRs are subsidised in Belgium, which results in additional costs. It is unclear whether GRs are not subsidised in other countries or whether this cost was just left out of the other studies. Claus & Rousseau (2012) distinguished between the direct regulatory costs paid by taxpayers and the indirect cost corresponding to the administrative burden and potential distortions on the labour market.
Environmental Costs
Jones’ et al., (2018) discuss several environmental costs that were usually left out of studies. This includes: water quality deterioration due to heavy metal concentrations when certain materials are used on the GR, increased energy use to pump irrigation systems and storm water disposal if the GR is not gravity-fed, embedded CO2 in the manufacture and installation of GRs and the creation of ecological traps for some species (Jones’ et al., 2018).
2.2.2 Benefits
The GRs’ benefits that can be quantified rather easily are those that have verifiable market values. On the other hand, non-market values are more challenging to capture and consequently rely on indirect valuation methods (Jones et al., 2018). The following section clearly illustrates how several of GRs’ benefits in the form of ES are often left out of studies or fail to be quantified. The numerical results are available in Table A-2 of Appendix A.
Increased Lifespan
Two main factors explain the significantly longer lifespan of GRs compared to conventional roofs. Firstly, the vegetation cover absorbs ultraviolet and infrared radiation which otherwise would damage the roof. Secondly, GRs can prove more resistant to extreme weather circumstances and temperature fluctuations. Thus, the expected renovation costs of GRs are minimal, and GRs reach an average lifespan on 50 years (Claus & Rousseau, 2012). Most studies estimate the price of replacing a conventional roof after about 25 years and use that amount to account for the benefit of having a longer lifespan (Bianchini & Hewage, 2012b; Rosasco & Perini, 2019). Though it is relatively easy to calculate, the benefit from having an increased lifespan is not systematically evaluated.
Energy Savings
Energy savings were mentioned in all the studies assessed in this literature review. Energy savings are complex to capture as they depend on the size of the building, the insulation requirements, the climate zone and the type of GR, with both the plant species and thickness of the roof being determining factors (Claus & Rousseau, 2012 ; Rosasco & Perini, 2019). Most studies directly derive values from other case studies, with the exception of Nurmi et al., (2016) who employed an avoided cost method while still using external data.

Re-Thinking Greeen Roof Design
15
Air Quality
All the studies assessed in this literature review mention air quality improvements associated with GRs. GRs can improve air quality by reducing concentrations of nitrogen oxides (NOx), sulphur dioxide (SO2), ozone (O3) and particulate matter concentrations. Yang, Yu, & Gong (2008) study, which quantified air pollution removal by GRs in Chicago, is often used as a point of reference. Their results indicate that a total of 1,675 kg of air pollutants are removed by 19.8 hectares of GRs in one year; with O3 accounting for half of the total. Nurmi et al., (2016) also draw information from studies conducted by the Finnish Transport Agency where the average cost of different emissions was valued by looking at the reduced mortality risk and the reduced morbidity risk. Jones’ et al., (2018) go one step further by listing direct and indirect costs arising from air quality degradation. In short, most studies work with data derived from other case studies.
Storm Water Management
GRs have many beneficial effects on storm water management. The main advantage corresponds to the lower volumes of water discharged in sewage systems due to the retaining potential of GRs. GRs retain rainwater and release it to the atmosphere via evapotranspiration. By doing so, the municipal wastewater treatment costs and the risk of flooding are reduced (Claus & Rousseau, 2012). Rosasco & Perini (2019) estimated the retention capacity by measuring the difference (%) between the volume of water falling on the surface of GRs and the volume of water absorbed and evaporated by GRs. Other papers used formulas to predict the annual runoff derived from previous studies. Finally, Bianchini & Hewage (2012b) estimated the savings made by building owners that get a discount for reducing effective impervious areas and use that value to approximate the benefits from better storm water management. They however point out that such compensations are not necessarily available elsewhere and that the results are therefore specific to the study area.
Heat Island Effect Reduction
Urban areas are characterised by dark surfaces such as concrete and asphalt, which have a low reflection potential (Bianchini & Hewage, 2012b). The heat-island effect is now a major problem faced by cities that see temperatures significantly increase in areas with a limited amount of vegetation. GRs can provide a solution to this problem by creating islands of coolness. However, Nurmi et al., (2016) highlight the fact that the heat-island effect reduction potential of GRs is still widely unknown. Most papers mention this potential but do not attempt to measure it, except Bianchini & Hewage (2012b). In their study, they estimated that effect by looking at the reduction in electricity consumption for cooling buildings. Jones’ et al., (2018) suggest that it could be measured by looking at the value of statistical life.
Improved Indoor Acoustics
GRs have the potential to improve the acoustic quality of a building (Claus & Rousseau, 2012). This benefit is not deemed the most significant and has not been studied extensively. Two methods have however been identified to quantify the noise insulation potential of GRs. Nurmi et al., (2016) used the avoided cost method, looking at the difference between adding a plasterboard layer to improve noise insulation or using a GR. Claus & Rousseau (2012) on the other hand, used the hedonic valuation method. They looked at the variation in property values due to improved indoor acoustics and were thus able to deduct residents’ utility in having better acoustics.

Aziliz Le Rouzo, IIIEE, Lund University
16
Greenhouse Gas Reduction
The GHG reduction potential of GRs is either discussed along with their pollution reduction potential or separately. As pointed out by Claus & Rousseau (2012), GRs have an impact on CO2 emissions in two ways. GRs’ vegetation directly sequesters CO2 through photosynthesis, but CO2 emissions are also indirectly reduced by the energy savings induced by GRs. Therefore, the allocation of the CO2 emissions is particularly complex and has not been quantified reliably yet. Bianchini & Hewage (2012b) attempted to estimate the overall benefit of reducing CO2 emissions by first quantifying the CO2 emission reduction potential of certain plan species used on GRs and then estimating the savings associated with avoiding paying a carbon tax.
Scenic Benefits and Increased Property Value
Scenic benefits of GRs and their impact on property values are often mentioned together even though they could be treated separately. On one hand, people derive an indirect benefit from looking at GRs and on the other hand, homeowners experience a direct benefit when they see the value of their house increase due to that scenic appreciation. Nurmi et al., (2016) state that most articles looking at the economics of GRs mention without quantifying their scenic, psychological or cultural benefits to residents. For the rare studies which tried to tackle that problem, the hedonic pricing method was used. For example, Nurmi et al., (2016) analysed housing transactions in Helsinki and looked at the value individuals placed on being located in the vicinity of a park. It was assumed that they would derive a similar utility from living close to a park to living close to a GR. Bianchini & Hewage (2012b) mention that the stated preference method could be used to quantify the aesthetic value of GRs, but they used the hedonic pricing method instead. The aesthetic value of GRs is highly dependent on how visible the GR is from the street, if people can access it and if it is consistent with the architectural landscape which makes it even more complex to grasp.
Biodiversity
The potential benefits of GRs on biodiversity are excluded from most studies. These benefits can however be quite consequent, as highlighted by Claus & Rousseau (2012). GRs provide habitat for fauna and flora and can thus contribute to the creation of wildlife corridors in urban areas. In this literature review, only Bianchini & Hewage (2012b) quantified this benefit by using the avoided cost method. They studied the special case of Portland, where funds were invested in the restoration of natural habitats in city. Though GRs do not offer the same benefits as natural habitats, the similarity was deemed high enough to use the avoided cost method. Jones’ et al., (2018) highlight that the willingness to pay approach could also be employed.
Fire Risk Reduction
Only Claus & Rousseau, (2012) mention the fire risk reduction potential of GRs. They highlight the fact that this aspect has not yet been studied and do not attempt to quantify themselves as they considered it negligible. The fire reduction potential of GRs seems to be highly dependent on the plant species used. On one hand, the most commonly used plant species, sedum, retains water and could thus reduce the risk of fire, but on the other hand, other plant species that dry easily could increase that risk.
2.2.3 Next Steps for CBA
The literature review highlighted that there are a few studies attempting to monetise the costs and benefits of GRs. The number of benefits mentioned outweigh the costs, though fewer of
Re-Thinking Greeen Roof Design
17
them have been quantified. Most of the costs are private costs, such as the implementation and maintenance costs, while a lot of the benefits are external, and especially those that have not yet been quantified are environmental and social. This confirms that current studies are mostly centred on the interest of private stakeholders and that there is a need to better integrate the valuation of environmental and social aspects. This however poses a challenge when private stakeholders are not likely to invest in GRs, even if the social and environmental benefits are better quantified, unless they benefit directly from these aspects. This calls for policy making based on more comprehensive CBA studies which will allow to pay private stakeholders for the services they provide to society by implementing GRs4.
This should be done with a special focus on the distinctions between the various types of GRs and the potential for using new building materials. Current studies do not account for the fact that the different characteristics of each type of GR will impact the results of CBAs. By better acknowledging these differences and acquiring a deeper understanding of the materials used in GR systems and their properties, there is strong potential to find more sustainable designs for GRs. More specifically, a stronger focus on the potential environmental damage incurred by the GR structure should be adopted.
For example, while the direct reduction in CO2 emissions realised by the plant cover and the indirect reduction resulting from reduced energy consumption have been included in CBA calculations, the carbon impact of GRs’ structure was left out from most previous studies. This is problematic as ideally, the embedded CO2 emissions in the manufacture and installation of GRs, would need to be accounted for before any other economic benefits associated with carbon reductions can accrue (Jones et al., 2018). The following section will explore how recent CBA studies have used some elements of the LCA methodology to bridge that gap.
2.3 The inclusion of a life cycle perspective in CBA
What can LCA bring to CBA?
LCA, unlike CBA, focuses on the upstream and downstream environmental impacts of a practice, product or process (Shafique, Azam, Rafiq, Ateeq, & Luo, 2019). When applied to GR systems, the LCA methodology can provide an assessment of the whole life cycle impact of GR components. The processes generally considered are the material extraction, transportation, operation, maintenance and end-of-life. Moreover, a wide range of impact categories can be considered such as the Global Warming Potential, the Ozone Depletion Potential, the Acidification Potential and the Eutrophication Potential to name a few. Conducting an LCA assessment on the different components of a GR system can provide an indication of which materials are the most environmentally friendly to use. However, when re-thinking GR design, the socio-economic cost-effectiveness of these materials is usually not assessed in LCA, nor is the trade-off between the use of more environmentally friendly materials and their relative costs evaluated (Shafique et al., 2019). While the integration of monetary valuation in LCA is gaining attention, this practice comes with challenges which so far have limited its diffusion (Pizzol, Weidema, Brandão, & Osset, 2015). On the other hand, the conversion of social and biophysical measures into monetary terms is a well-established practice in CBA, but life cycle impacts have been slow to be considered. Let us first get a better understanding of how the monetisation of life cycle steps has been applied in practice and how it has been integrated in the CBA methodology. To do so, two life cycle inspired CBAs on
4 Just as is the case with Payments for Environmental Services

Aziliz Le Rouzo, IIIEE, Lund University
18
GRs will be analysed and compared in the following section to identify similarities in the methodology.
The Inclusion of life cycle steps in CBA
Only two studies including life cycle steps in their CBA model were found relevant for this research. Yao, Chini, & Zeng, (2018) considered the reduction in CO2 emissions by integrating the Global Warming Potential results of the LCA in the calculations of the CBA. Bianchini & Hewage, (2012a) integrated the cost of pollution resulting from the production of GR materials, which are often made of polymers, in their CBA calculations. In the next paragraphs their analytical frameworks will be elaborated upon.
Yao, Chini, & Zeng, (2018) investigated the cost-effectiveness and environmental impacts of GRs compared to a conventional roof. They conducted a full but simplified LCA looking at the environmental impact of a GR system, using Athena Impact Estimator for Building. Their scope included the product manufacturing, construction of the GR, use phase in the form of energy consumption, and the end-of-life of the system. They used the estimated values for the Global Warming Potential of the total life cycle impact and converted them in a monetary value using $47/tonne as an estimation of the SVC. Overall, their results indicated that over a 50-year period, the CO2 emission reduction of a GR compared to its alternative was 215 tonnes of CO2 equivalents which corresponds to savings of $202 yearly (Yao et al., 2018). This reduction is solely due to the energy savings, which are accounted for in the use phase. Interestingly, all the other life cycle steps have a larger carbon impact than that of the conventional roof. Notably, the embedded carbon emissions in the GR materials is higher than for the conventional roof. Moreover, when looking at the distribution of the carbon impact, the use phase has the largest impact, closely followed by the embedded carbon emissions in the materials, the construction process and finally the end-of-life. Thus, this study provided a first estimation of the avoided carbon emissions resulting from the implementation of a GR instead of a conventional roof, while highlighting its non-negligible life cycle carbon impact. In addition, Yao et al., (2018) were able to put a monetary value on these savings which provided a first framework for the integration of LCA and CBA.
Bianchini & Hewage, (2012a) study focuses on the indirect costs resulting from the use of materials that have a high environmental impact. They point out that polymers such as low-density polyethylene and polypropylene are often used in GRs due to their high strength, durability, low production costs and ease of installation. Several LCA studies on GRs focused on the environmental impact of the GR structure, but none monetised this aspect (Bozorg Chenani, Lehvävirta, & Häkkinen, 2015 ; Peri, Traverso, Finkbeiner, & Rizzo, 2012 ; Pushkar, 2019 ; Rincón et al., 2014). Bianchini & Hewage, (2012a) therefore attempted to bridge that gap and incorporated the socio-environmental cost resulting from the use of these polymers into their CBA. Their study compared three alternatives: (1) extensive GR (2) intensive GR, and (3) an experimental construction and demolition waste based extensive GR. Their analysis considered the manufacturing, construction, operation, and decommission phases of these three GRs. They considered that the total air pollution costs corresponded to the sum of the carbon and nitrate costs. The improved air quality benefit corresponded to the CO2 emissions sequestered by the plant cover and the reduction in NOx emissions. Their calculations indicate that the pollution costs of extensive GRs vary between $14.06/m2 and $22.20/m2, while for the construction and demolition waste based GR a constant value of $3.20/m2 was found. In contrast, the improved air quality benefit varied between $0.025/m2 and $0.03/m2 yearly (Bianchini & Hewage, 2012a). These results are particularly interesting as most CBA studies only account for the air pollution reduction potential of GRs without contrasting this benefit with the pollution cost associated with the production of GR materials. This shows that,

Re-Thinking Greeen Roof Design
19
despite the fact that GRs have the potential to have a positive impact on air pollution, once the life cycle of the materials used in their structure is taken into account, this effect becomes more ambiguous. In addition, their study also highlights that the use of more environmentally friendly materials such as the construction and demolition waste can help reduce the environmental impact of the GR structure. Their results push for more research into the structure of GRs while also encouraging the substitution of polymers with more environmentally friendly materials. While the inclusion of a life cycle perspective in CBA revealed that the GR structure incurs pollution costs, it did not provide sufficient information on the hierarchy of the impact of each GR layer.
In conclusion, these two studies exemplified how the inclusion of the life cycle impact of the GR structure in CBA sheds light on environmental costs that would otherwise not be considered in decision making. This was done by using, in one case, a social cost of carbon of $47/tonne and, in the other, a carbon tax of $20/tonne paired with a NOx emission credit of $3,375/tonne. While both cases provided an estimation of the environmental cost of the whole GR structure, the individual impact of each GR layer was not researched. Further information on the impact of each GR layer was consequently sought by reviewing LCA studies, to understand to what degree the use of one material versus another can impact the overall environmental impact of the GR.
2.4 Carbon footprint of the GR structure This section aims to determine the magnitude of the embedded carbon emissions resulting from the production of GR materials, to investigate whether this impact should be considered in future CBA studies. Furthermore, special attention will be given to the impact of each GR layer to establish which layers bear the highest carbon footprint and should thus be excluded from future designs.
CO2 payoff of extensive GRs.
Kuronuma et al., (2018), to the best of the author’s knowledge, were the first to conduct a study looking specifically at the CO2 payoff of extensive GRs. Their research focused on estimating the payback time for a GR’s CO2 sequestration and reduction to offset the emissions induced by their production process and maintenance. To do so, they gathered information on the following: the amount of CO2 arising from the production of a modular GR, the amount of CO2 emitted yearly during maintenance practices, the annual CO2 sequestered by three grass species as well as one species of sedum and the CO2 emission reduction attributed to energy savings.
This study used the LCA methodology to estimate the environmental impact of GR system components throughout their life cycle. The functional unit used was 1m2 and the assumed lifetime was 45 years. The hypothetical GR model used in their study was an extensive GR with a 50mm depth substrate, excluding the vegetation mats. The system components and the materials they are made of are listed in Table B-1 of Appendix B. The MiLCA LCA software was used to calculate the CO2 emission factors for each component and maintenance practice. The amount of CO2 emitted by each component or maintenance practice per m2 of GR was then computed by multiplying its CO2 emission factor by the quantity of the component used in the GR system of study. The production process included the extraction and refinement of raw materials as well as the consumption of natural resources (Kuronuma et al., 2018).
Table B-1 illustrates that the materials currently used in the GR structure are, on the whole, not environmentally friendly and have a high carbon footprint. This was confirmed by this

Aziliz Le Rouzo, IIIEE, Lund University
20
study’s results, where it was found that the total CO2 emissions from the production of a modular green roof were 25.2 kg of CO2/m2. The substrate had the most important contribution due to its large volume compared to the other layers (Kuronuma et al., 2018). Out of the different components, the aluminium edge divider had the highest CO2 carbon footprint, closely followed by the reservoir tray, water proofing membrane and irrigation pipe which are made of similar materials (Kuronuma et al., 2018). Their results highlight that considering different mixes for the substrate could be a first step in decreasing the overall carbon footprint of the GR structure. Finally, their findings show that when considering the energy savings and carbon sequestration benefit realised by the GR system, the CO2 payoff varies between 5.8 to 15.9 years. While this study shows that GR systems can eventually contribute to a reduction in CO2 emissions, a lower carbon footprint could be achieved with the substitution of materials that have the highest embedded carbon in their manufacture (Kuronuma et al., 2018).
Full life cycle assessment of GRs’ layers.
Kuronuma et al., (2018) results are similar to what Bozorg Chenani et al., (2015) had found while conducting a full life cycle assessment of the different layers of GRs. Their study focused on analysing the environmental performance of two complete lightweight GR systems with the aim of assessing the environmental impact of each GR layer. They compared two alternatives which both had a substrate depth of 100mm but different substrate components. The specific characteristics of these two models are illustrated in Table B-2 (Bozorg Chenani et al., 2015).
Their study did not focus solely on the carbon footprint of the GR structure but more broadly on its overall environmental impact. Their results showed that the water retention, drainage, and substrate layers contained the components that had the greatest negative environmental impact. More specifically, rockwool, the plastic drainage layers, and expanded clay had the most important environmental burdens. Expanded clay was the main contributor to the substrate impacts due to its production process. Moreover, their results indicated that the choice of substrate components is important, with large differences between their two compositions. In terms of the carbon footprint, their results demonstrated that the total CO2
emissions resulting from the manufacturing of alternative one were 32.23 kg CO2eq/m2 and for
alternative two, 22.13 kg CO2eq/m2 (Bozorg Chenani et al., 2015).
In short, their study shed light on the overall environmental burden of GR layers, while providing indications on which materials bear the most important environmental impact and should thus be avoided. Bozorg Chenani et al., (2015) conclude their study by highlighting the need to find alternative materials for the design of GRs, giving a higher priority to recycled and local materials.
Re-Thinking Greeen Roof Design
21
3 Analytical Framework & Methodological Approach This chapter first elaborates upon the research design used in this study. It then presents the analytical framework which was developed to answer the RQs. Finally, it describes the different steps taken for data analysis.
3.1 Research Design An explorative research approach was chosen to investigate this topic as very little research had been conducted on it before. Mixed methods were used to provide a multidisciplinary perspective to the problem. Qualitative methods supported the literature review while quantitative methods were used to compare the prototype with the baseline.
“RQ1 How can the conventional green roof cost-benefit analysis be extended to consider the life cycle carbon profile of the green roof structure?” was answered on a theoretical level in the literature review and on a practical level in the results section. First, a comprehensive literature review was conducted with four objectives.
• First, it aimed to explore the rationale for using CBA analysis in environmental decision making, and more explicitly when applied to GR projects.
• Second, it sought to determine which costs and benefits had been previously mentioned and quantified in literature. The impacts considered in previous studies for decision making were highlighted along the identification of knowledge gaps.
• As a third step, impacts which are generally omitted from CBAs but that could be considered when factoring in GR’s mitigation and adaptation effects on climate change were identified. One of the variables excluded from previous CBA studies is the carbon footprint of GR layers which has however been investigated in LCAs. This section consequently assessed to what extent previous CBA studies had included the environmental impact of the GR structure in their calculations, how it was done and how it affected the results of the CBA.
• Finally, the impact of the GR structure was further investigated by analysing several LCA studies. This was done to get a better understanding of how important the carbon footprint of each GR layer is, to get a first idea of which materials should be replaced and ultimately to decide whether this impact should be included in CBA.
This extensive literature review helped to conceptualise an analytical framework, which was then applied to the case study to answer RQ1 on an applied level. A life cycle inspired CBA was conducted on two GRs with a different structure. One which served as a baseline and featured the characteristics of an extensive GR in Sweden, and one which is a prototype in which several layers were substituted with materials that have a potentially lower environmental impact and a lower carbon footprint such as cork and biochar. The practical implications of RQ1 are elaborated upon in Chapter 4.
To answer “RQ2) What are the implications of the use of carbon sink materials on the socio-economic cost-effectiveness of green roofs?” a comparative analysis between the baseline and the prototype was conducted. The performance of the two GR systems was compared and analysed through the lens of a life cycle inspired CBA. The modelling was conducted on Microsoft Excel, using a benefit-transfer approach when data was not available. The net-present value (NPV) of the two projects was used as a decision-criteria for the cost-effectiveness along with the benefit/cost ratio. Furthermore, a sensitivity analysis was conducted, exploring different scenarios to test the assumptions on the socio-economic parameters and on risk bearing variables.
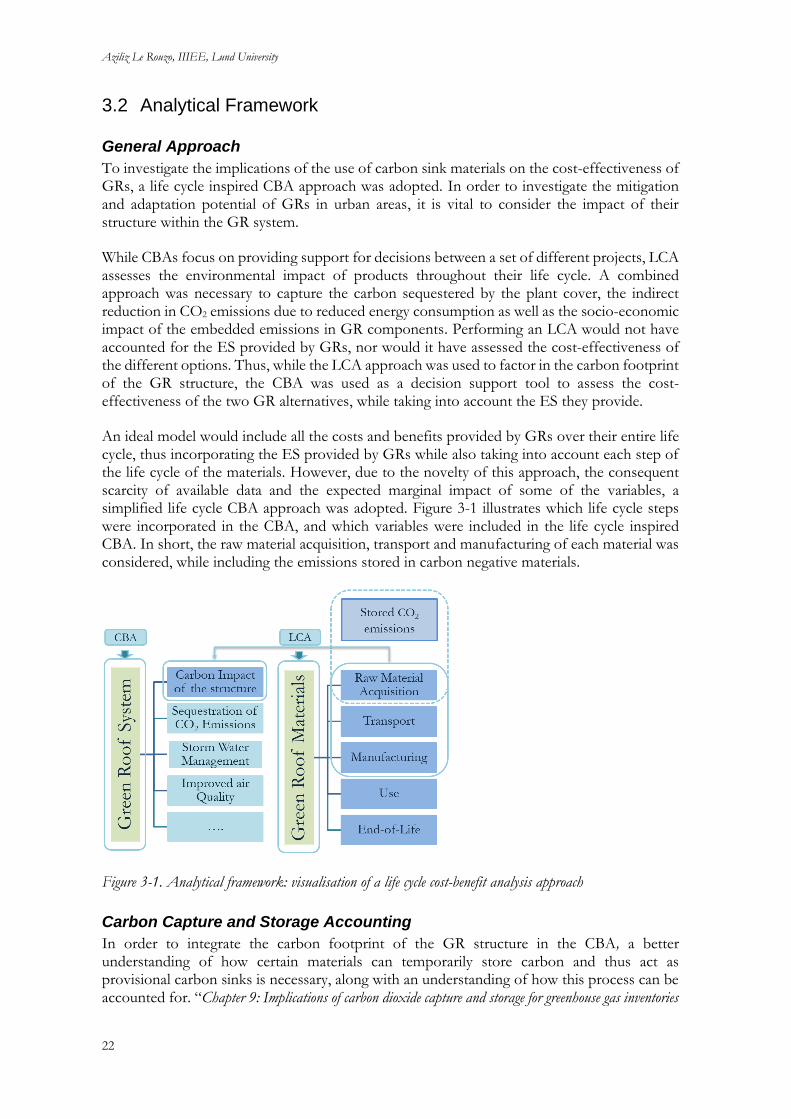
Aziliz Le Rouzo, IIIEE, Lund University
22
3.2 Analytical Framework
General Approach
To investigate the implications of the use of carbon sink materials on the cost-effectiveness of GRs, a life cycle inspired CBA approach was adopted. In order to investigate the mitigation and adaptation potential of GRs in urban areas, it is vital to consider the impact of their structure within the GR system.
While CBAs focus on providing support for decisions between a set of different projects, LCA assesses the environmental impact of products throughout their life cycle. A combined approach was necessary to capture the carbon sequestered by the plant cover, the indirect reduction in CO2 emissions due to reduced energy consumption as well as the socio-economic impact of the embedded emissions in GR components. Performing an LCA would not have accounted for the ES provided by GRs, nor would it have assessed the cost-effectiveness of the different options. Thus, while the LCA approach was used to factor in the carbon footprint of the GR structure, the CBA was used as a decision support tool to assess the cost-effectiveness of the two GR alternatives, while taking into account the ES they provide.
An ideal model would include all the costs and benefits provided by GRs over their entire life cycle, thus incorporating the ES provided by GRs while also taking into account each step of the life cycle of the materials. However, due to the novelty of this approach, the consequent scarcity of available data and the expected marginal impact of some of the variables, a simplified life cycle CBA approach was adopted. Figure 3-1 illustrates which life cycle steps were incorporated in the CBA, and which variables were included in the life cycle inspired CBA. In short, the raw material acquisition, transport and manufacturing of each material was considered, while including the emissions stored in carbon negative materials.
Figure 3-1. Analytical framework: visualisation of a life cycle cost-benefit analysis approach
Carbon Capture and Storage Accounting
In order to integrate the carbon footprint of the GR structure in the CBA, a better understanding of how certain materials can temporarily store carbon and thus act as provisional carbon sinks is necessary, along with an understanding of how this process can be accounted for. “Chapter 9: Implications of carbon dioxide capture and storage for greenhouse gas inventories

Re-Thinking Greeen Roof Design
23
and accounting” (IPCC, 2005) elaborates on how accounting methodologies which estimate the reduced or avoided emissions from CCS can be included in national GHG inventories, and in accounting schemes such as the Kyoto Protocol. This report is used as a guideline for incorporating the life cycle impact of GR materials in CBA as it provides the core principles for CCS accounting. Accounting for the CCS of CO2 is complex. A wide range of accounting rules have been developed with various purposes and different scales, making the selection of a methodological approach to account for project-related CO2 emission reduction from CCS technologies difficult. Conversely, the main complexities linked to the accounting of these emissions are clear. These will be highlighted and used for further reflection when building up the analytical framework used in this study (IPCC, 2005 ; IEAGHG, 2016).
First, system boundaries are at the core of accounting for the CO2 emission reduction from CCS technologies. The sectoral, spatial, and temporal boundaries need to be clearly defined and will vary in importance depending on the phase of the system. This is of particular importance for national inventories, when emissions might be captured in one location and released in another which leads to liability issues (IPCC, 2005). Secondly, a potential accounting subtility comes from the fact that it is unclear whether emissions that are temporarily stored should be accounted for in the same way as emissions that are permanently stored. There are therefore concerns when it comes to the displacement of emissions across temporal boundaries and how this should be accounted for is, for now, unclear. This complexity increases with the risk of physical leakage, which refers to the escape of CO2 from a reservoir. Such leakage can take the form of a gradual and long-term release or a sudden release due to the disruption of the reservoir. Finally, another question concerns the value of emissions over time and whether the avoided emissions linked to the use of CCS technology today can be credited using the same value now and in the future (IPCC, 2005 ; IEAGHG, 2016).
One alternative suggested for the accounting of these emissions is to track CO2 flows throughout the whole capture and storage system. This would entail that, for each process step, the total amount of CO2 produced, emitted into the atmosphere and stored would be accounted for. This approach is said to be transparent and consistent with the UNFCC agreements (IPCC, 2005). This is what previous LCA studies have attempted to do for the different materials of the GR structure.
In short, this section highlights that accounting for the avoided or reduced emissions associated with CCS is complex because of the possibility that CO2 emissions will be released in another location, sector and/or at another time. At present it is unclear how these emissions should be accounted for in the future, but one of the IPCC methodological recommendations encourages the inclusion of all the CO2 flows throughout the life cycle of the system (IPCC, 2005). In this study, a simplified approach was adopted to account for the avoided emissions resulting from the use of carbon sink materials in the GR structure.
Life Cycle Steps
The literature review highlighted that, to the best of the author’s knowledge, few CBAs so far included the carbon footprint of GR materials in their calculations. Indeed, while some LCAs investigated the carbon footprint of GR layers, the impact associated with the life cycle of these materials has rarely been monetised. Yao et al., (2018) is the only example, which could be found, where the estimated Global Warming Potential, expressed in kg of CO2
eq, of GR layers was used for the monetisation of the carbon impact of the GR structure. As previously mentioned, the social cost of carbon was used to convert the benefit associated with reduced carbon emissions to an economic value. All life cycle steps were considered in their study, from production and construction to use and end-of-life. This study will follow the same approach

Aziliz Le Rouzo, IIIEE, Lund University
24
where the carbon footprint of each GR layer will be monetised using the SVC used in the Swedish context.
Ideally, and if relevant data is available, the carbon impact of all life cycle steps should be accounted for in future life cycle inspired CBAs. However, quality data could only be found for the life cycle steps A1, A2, A3 which correspond to the extraction of raw-materials, transport and production for each material used in the GR structure. In addition, the end-of-life of GRs brings large uncertainties which makes its inclusion in CBA challenging. The avoided CO2 emissions attributed to the use of carbon negative materials are only retained, with certainty, for as long as these materials remain in the GR structure. The end-of-life phase of the GR structure will determine whether these stored CO2 emissions are released back to the atmosphere or not. If the materials were to be reused or stored in a way that preserves their carbon storage properties, these avoided CO2 emissions could not be released for an undetermined amount of time. Since there is no certainty that these emissions will not be released at the end-of-life of the GR, this study only highlights the potential of GRs to store carbon during their lifetime. There is no guarantee that an environmentally optimal disposal scenario will be achieved in 50 years-time, nor is there any strong argument supporting an alternative scenario. With such a high level of uncertainty, the end-of-life step was thus excluded from the scope of this study.
3.3 Data Collection Data collection was a lengthy process which unfolded in several steps. First, a review of previous CBA studies on GRs was conducted to get a broad overview of the variables deemed relevant to include in the calculations, the methodological processes used, as well as the values obtained (see Appendix A). Second, a review of LCA studies and Environmental Product Declarations (EPDs) of GR materials was conducted to gather information on the carbon emissions resulting from the life cycle of the GR layers’ materials. Thirdly, GR practitioners and material suppliers were contacted by email or by phone to enquire about the price of the different materials, installation cost and maintenance cost of GRs in Sweden. Finally, after reviewing the data available upon the completion of these steps, a benefit-transfer approach was applied to make up for the data that could not be obtained. This process is further described in the following sections.
3.3.1 Review of the costs and benefits to be included
The first step of the data collection consisted in conducting a previously described literature review to establish which costs and benefits of GRs had been mentioned and effectively quantified in previous literature. A content analysis of the chosen studies then helped establish best practices for the calculation of costs and benefits provided by GRs. This process helped build up an Excel table where the data needed was inventoried. A simplified version of this table can be found in Appendix C. Ideally, all the costs and benefits previously mentioned in literature should have been included, however, some of them were more relevant to the Swedish context than others. In addition, after getting a broad overview of the data available, the following selection was made. The costs included are the material cost of the structure, the installation cost, the maintenance cost, and the carbon impact of the structure which can be either a cost or a benefit depending on whether the structure is a source of a sink of carbon. In terms of benefits, the carbon impact of the structure was considered along with the reduction in CO2 emissions from the plant cover, the improved air quality, the improved storm water management, the energy savings, the improved aesthetics and the increased biodiversity. The heat-island effect and improved acoustics were excluded primarily due to a lack of data, but they were both expected to be marginal in the Swedish context.

Re-Thinking Greeen Roof Design
25
3.3.2 Involvement of GR practitioners
Several exchanges with the SGRI helped establish which data they could help provide. Specific data for Malmö was gathered using both the expertise and contacts of the expert from the SGRI as well as by directly contacting GR practitioners and material suppliers. Practitioners and material suppliers were contacted by email and by phone. Where data was still not available a benefit-transfer approach was taken.
3.3.3 Benefit Transfer Approach
A benefit transfer approach consists in using values from previous studies which can be transferred through time and space (Boyle et al., 2020). This approach is generally used when the study is under time or budget pressure or when data availability is scarce. There are two types of benefit transfer; value transfers and function transfers. Value transfer either takes a point-estimate of value from a similar existing study or averages estimates from several similar studies. Function transfer uses an estimated valuation function to compute a transfer estimate which is applicable to the new study conditions (Allen & John, 2008). This study uses a value transfer approach whereby values were borrowed from other studies and applied to the case of Malmö. Studies in nearby locations were prioritised, and when data was not available, the most similar studies in terms of roof type, location and climate were chosen. This approach was complemented by expert advice to better support the assumptions made. More specifically, email contact was established with a Post-Doctoral Research Fellow at the Victorian Institute of Strategic Economic Studies at Victoria University, who provided some support in finding the best estimates for data transfer.
3.3.4 Inclusion of a life cycle perspective
To conduct a life cycle inspired CBA looking specifically at the carbon footprint of the materials used in the roof layers, a second step to data collection was necessary. Information on the carbon emissions resulting from the extraction, transport and production of each material used in the GR layers was gathered by looking at various LCA studies as well as EPDs. The International EPD system, as well as the Institut Bauen und Umwelt e.V., were an important source of information, but independent LCA studies were also utilised (EPD, n.d. ; IBU, n.d.). EPDs were used as a main source of information as they are independently verified and registered documents that communicate transparent information on the life cycle of materials (EPD, n.d.). Most of the chosen EPDs follow the ISO 14025 standard and are registered on the International EPD system.
3.4 Data Analysis The collected data was analysed using the methodological approach of a CBA, complemented by the addition of a life cycle approach including the carbon footprint of the GR structure. All the calculations were made on Microsoft Excel, using the analytical tools offered by the software. This section will first present the calculation methods used, followed by the analytical process.
3.4.1 Calculation methods
Net Present Value & Cost/Benefit Ratio
Costs and benefits will arise at different moments of a project’s lifetime. Costs and benefits that accrue in the future are discounted to reflect the fact that consumers always derive a higher utility from getting something now than in the future (OECD, 2018). The temporal weight
Aziliz Le Rouzo, IIIEE, Lund University
26
which is used to reflect this time preference is called the discount factor which can be expressed as follow:
𝐷𝐹𝑡 =1
(1 + 𝑟)𝑡
Where DFt corresponds to the discount factor in period t and r is the discount rate. The discount factor evaluates the profitability of investments by converting them into today’s terms.
Benefits and costs are discounted to obtain a present value which simply corresponds to the sum of all the discounted future values (OECD, 2018). The present value of benefits and costs can be expressed through the following equation:
𝑃𝑉 (𝛽) = ∑𝛽
(1+𝑖)𝑡
𝑛
𝑡=1 & 𝑃𝑉(𝐶) = ∑
𝐶
(1+𝑖)𝑡
𝑛
𝑡=1
Where 𝛽 corresponds to benefits and C to costs, each arising at different time periods, represented by t.
Projects are then ranked and prioritised according to their net NPV. The NPV corresponds to the sum of the actualised benefits minus the sum of the actualised costs as illustrated below.
𝑁𝑃𝑉 = 𝑃𝑉 (𝛽) − 𝑃𝑉 (𝐶) which can be otherwise written as 𝑁𝑃𝑉 = ∑𝛽𝑡−𝐶𝑡
(1+𝑖)𝑡
𝑛
𝑡=1
Finally, the benefit/cost ratio is an additional indicator which can be used to assess the cost-effectiveness of projects. The benefit/cost ratio corresponds to the sum of the actualised benefits divided by the sum of the actualised costs.
𝐵𝑒𝑛𝑒𝑓𝑖𝑡
𝐶𝑜𝑠𝑡𝑅𝑎𝑡𝑖𝑜 =
𝑃𝑉(𝛽)
𝑃𝑉(𝐶)
These are the core formulas used to perform the life cycle CBA. Several additional methodological choices had to be made regarding socio-economic parameters and the conversion and use of the collected data.
Discount Rate
Several challenges come with discounting, such as the choice of the appropriate discount rate, which can either reflect a higher weight on the welfare of present or future generations, as well as the valuation of nonmarket environmental goods which requires the use of a more interdisciplinary perspective for valuation (Pearce, Atkinson, & Mourato, 2006). The ASEK guidelines recommend the use of a socio-economic discount rate of 3.5%. It must be noted that the recommended private discount rate is much higher, 5.0%. The choice of one or the other will have an impact on the results, which will be estimated with a sensitivity analysis (Trafikverket, 2014).
Exchange Rates
The average exchange rate for the last year was computed for four currencies. These exchange rates are the only exchange rates used throughout this study.
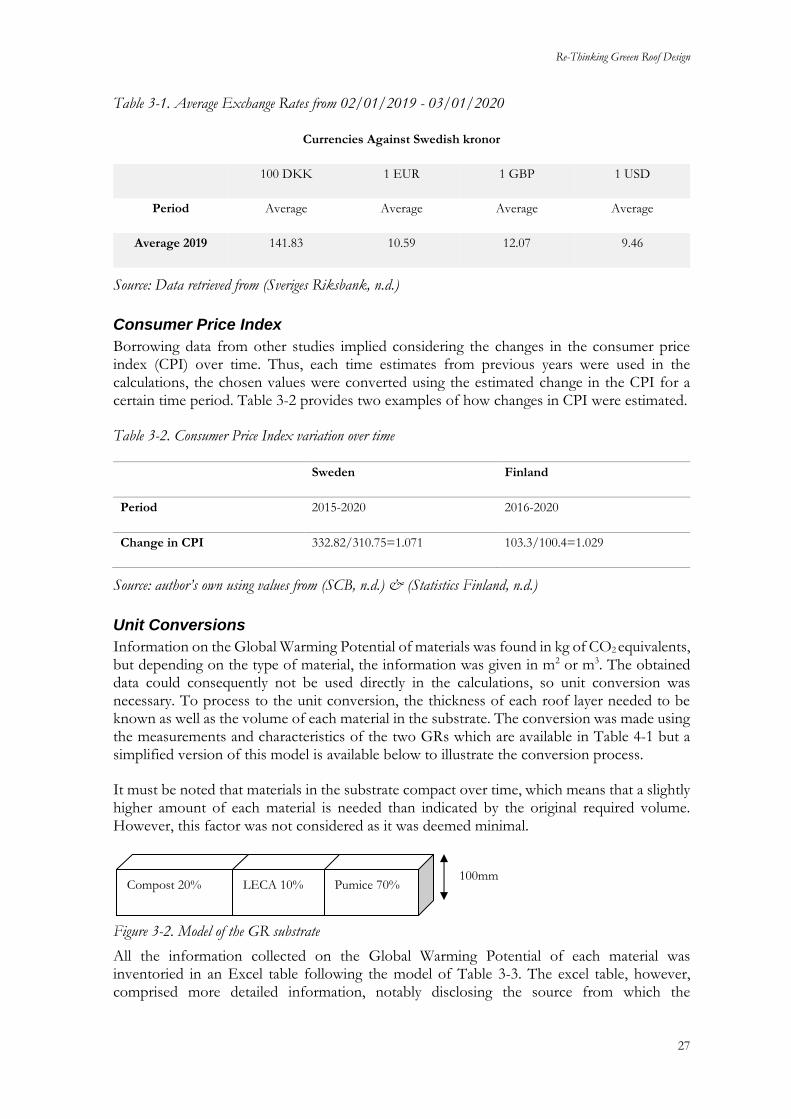
Re-Thinking Greeen Roof Design
27
Table 3-1. Average Exchange Rates from 02/01/2019 - 03/01/2020
Currencies Against Swedish kronor
100 DKK 1 EUR 1 GBP 1 USD
Period Average Average Average Average
Average 2019 141.83 10.59 12.07 9.46
Source: Data retrieved from (Sveriges Riksbank, n.d.)
Consumer Price Index
Borrowing data from other studies implied considering the changes in the consumer price index (CPI) over time. Thus, each time estimates from previous years were used in the calculations, the chosen values were converted using the estimated change in the CPI for a certain time period. Table 3-2 provides two examples of how changes in CPI were estimated.
Table 3-2. Consumer Price Index variation over time
Sweden Finland
Period 2015-2020 2016-2020
Change in CPI 332.82/310.75=1.071 103.3/100.4=1.029
Source: author’s own using values from (SCB, n.d.) & (Statistics Finland, n.d.)
Unit Conversions
Information on the Global Warming Potential of materials was found in kg of CO2 equivalents, but depending on the type of material, the information was given in m2 or m3. The obtained data could consequently not be used directly in the calculations, so unit conversion was necessary. To process to the unit conversion, the thickness of each roof layer needed to be known as well as the volume of each material in the substrate. The conversion was made using the measurements and characteristics of the two GRs which are available in Table 4-1 but a simplified version of this model is available below to illustrate the conversion process.
It must be noted that materials in the substrate compact over time, which means that a slightly higher amount of each material is needed than indicated by the original required volume. However, this factor was not considered as it was deemed minimal.
Figure 3-2. Model of the GR substrate
All the information collected on the Global Warming Potential of each material was inventoried in an Excel table following the model of Table 3-3. The excel table, however, comprised more detailed information, notably disclosing the source from which the
Compost 20%
LECA 10% Pumice 70% 100mm

Aziliz Le Rouzo, IIIEE, Lund University
28
information was obtained, as well as a more complete overview of how each LCA study was conducted and what A1, A2, A3 stood for in each study. Generally A1, A2, and A3 correspond to the raw material extraction, transport and production respectively, but some degree of variation was observed amongst chosen studies. Extra attention was therefore given while deciding upon the inclusion of the different life cycle steps. The values for A1, A2 and A3 here are expressed in kg CO2
eq.
Table 3-3. Example of the necessary information for a life cycle inspired CBA
Material Characteristics Unit Conversion A1 A2 A3
Cork Board Insulation Cork Board m3 m2 ✓ ✓ ✓
Stone Wool ISOVER stone wool insulation in the
form of sheets and felt
m3 m2 ✓ ✓ ✓
Polystyrene Soprema XPS insulation m2 none ✓ ✓ ✓
3.4.2 Comparative analysis
The comparative analysis focuses on several factors. First, the two GR systems are compared in terms of the carbon footprint of their structure and the associated costs resulting from the embedded emissions in GR materials. Secondly, the various benefits provided by the two GR systems are compared in an attempt to determine which option is best from a mitigation perspective and which option is best from an adaptation perspective. Finally, the NPV and benefit/cost ratio of the two options is discussed to assess which option is most cost-effective and under what conditions.
3.4.3 Sensitivity analysis
A sensitivity analysis is commonly used in CBA to assess uncertainty. More specifically, it helps determine how sensitive the NPV is to eventual changes in the key variables. In this way, the sensitivity analysis provides an indication of the robustness of the NPV when subjected to the various assumptions made on costs, time horizons, discount rates, etc. (OECD, 2018).
In this study, two types of sensitivity analysis are performed. First, in the case of uncertainty over certain values, a sensitivity analysis is performed to assess how the use of alternative values would impact the overall results of the CBA. Second, a sensitivity analysis is conducted using alternative values for the SVC and the discount rate as they are key parameters whose optimal values are disputed in literature.

Re-Thinking Greeen Roof Design
29
4 A COMPARISON OF TWO GREEN ROOFS This chapter begins with an introduction of the case study. Secondly, it presents the costs, benefits and carbon impact of the two GR systems under study. Thirdly, a comparative analysis between the prototype and the baseline is made. Finally, a sensitivity analysis is conducted to assess the sensitivity of the results to certain parameters.
4.1 Case Study
4.1.1 Characteristics of the GRs
The characteristics of the baseline (Fig. 4-1) were determined upon consultation of the websites of the main green roof providers in Sweden, VegTech and Zinco, as well as the Guidelines for the Planning, Construction and Maintenance of Green Roofs issued by the Landscape Development and Landscaping Research Society (FLL, 2018 ; ZinCo Green Roof Systems, n.d. ; VegTech, n.d.). Since most GR providers do not disclose their substrate recipe, the volume of each material was approximated following the recommendations of the representative from the SGRI. It must be noted that while the baseline presents all the characteristics of an extensive GR, it is not the most common design found in Sweden.
Figure 4-1. Design of the baseline (left) versus the design of the prototype (right)
Table 4-1. Structural characteristics of the baseline versus the prototype
Baseline Prototype
Layer Material Thickness Material Thickness
1) Plant Cover Sedum NA Sedum NA
2) Substrate Pumice 70%, Crushed Expanded Clay Aggregates 10%, Green Waste Compost 20%
100 mm Biochar 20%, Carbon8 60%, Green Waste Compost 10%, Granular Cork 10%
100 mm
3) Water Holding Layer
Mineral Wool 40 mm Biochar 30 mm
4) Drainage Layer HDPE 25 mm Cork 10 mm
5) Insulation Board Extruded Polystyrene Foam 50 mm Cork 50 mm
6) Root Barrier LDPE NA LDPE NA
3
4
5
6
2
1
Roof Structure Roof Structure

Aziliz Le Rouzo, IIIEE, Lund University
30
The design of the prototype (Fig. 4-1) was decided upon following numerous interviews with the representative from the SGRI. Such support was necessary to take into account factors that relied on expert advice, such as making sure that the chosen materials would hypothetically provide the same or similar functions to that of the materials that were replaced, in terms of plant growth support through their capacity to provide water, nutrients and oxygen to the plant roots. In the end, though the prototype’s design was decided upon in consultation with the SGRI, the engineering feasibility of this design is not part of the scope of this thesis. The substitution materials were chosen because of their potential to have a lower environmental footprint, to be more local and to act as a carbon sink, but no extensive review was made prior this choice investigating all the potential materials that could be used for this prototype.
4.1.2 The use of new materials
The use of new materials in the GR prototype requires some additional information on their characteristics, properties, and carbon profile. The prototype is essentially made of biochar and cork-based components, alongside compost, Carbon8 and one plastic based material. Biochar, cork and Carbon8 will be described in more detail below as the complexity of their carbon impact requires further explanations.
Carbon Capture & Storage
Growing attention has been given to carbon storage solutions worldwide. As mentioned in Chapter 1, the Swedish Environmental Protection Agency mentions the storage and capture of carbon, based on the combustion of biomass, as one of its supplementary solutions to achieve the zero-emission target (Swedish Environmental Protection Agency, n.d.). In addition, soil carbon enhancement is one of the CO2 removal technologies mentioned by the IPCC in their “Mitigation Pathways Compatible with 1.5°C in the Context of Sustainable Development” report (IPCC, 2018). This IPCC report describes biochar as a potential route for terrestrial carbon storage. While biochar is mostly used for agricultural purposes, its recent use as a GR substrate amendment is promising from a carbon sink perspective.
Biochar & Green Roofs
Biochar is a product of the pyrolysis of organic material. Thus, the properties, quality and uses of biochar vary with the type of organic material used in the production process (EBC, 2015). Though biochar has not been historically used on GRs, its use as a substrate amendment has increased in popularity, leading to the release of several recent studies investigating its potential to improve storm water management, nutrient runoff and improve plant growth on GRs (Kuoppamäki & Lehvävirta, 2016 ; Chen et al., 2018 ; Qianqian, Liping, Huiwei, & Long, 2019). Cao, Farrell, Kristiansen, & Rayner (2014), showed that biochar made GR substrates lighter and increased their water-holding capacity. Kuoppamäki & Lehvävirta (2016) found that amending GR substrates with biochar could be an efficient solution to address the pollution induced by nutrient leaching.
In addition, the release of the last IPCC report mentioning biochar as a carbon sequestration measure has also opened the way for the investigation of the role of biochar on the carbon sequestration potential of GRs (IPCC, 2018). Chen et al., (2018) pointed out that the use of biochar in GRs is not only gaining notability due to its capability to improve ecosystem productivity, but also due to its potential to store carbon. Recent attention was thus given to the role of biochar in improving the carbon sequestration potential of GRs. Chen et al., (2018) estimated that carbon storage potential of GRs amended with 10% biochar was equivalent to 11.9 kg/C/m2 which is the equivalent of 44 kg of CO2 per m2 of GR. These results are a first example of how the use of biochar in GRs could help reduce their carbon footprint. This thesis

Re-Thinking Greeen Roof Design
31
will take it one step further by testing the use of biochar in two layers of the GR structure, the substrate and the water holding layer. While biochar shows potential when applied in GRs, further information is needed on its carbon sink properties to highlight the benefits and risks associated with its use. The following section will thus provide additional information on how the multiple forms and characteristic of biochar can impact its carbon storage potential.
Biochar’s types and characteristics
The production of charcoal in a restricted oxygenated environment has a long history, dating back to the 15th century. Recently, biochar has been added to the list of products resulting from the combustion of biomass. While biochar is known to improve crop yield, due to its high carbon content when returned to soil, it has also received growing attention due to its carbon sequestration potential. This potential arises from the fact that carbon from the atmosphere is transferred to a slower cycling form which is likely to exist for hundreds or even thousands of years. As such, it can be considered as a carbon reservoir and growing attention has been given to its potential use as a climate negative technology (Amir et al., 2018 ; IPCC, 2018). However, this possibility is dependent on several factors, such as the type of biomass used for the production of biochar, the pyrolysis temperature which can range from 350-800ºC (with higher temperatures typically decreasing solid residuals’ yields), and whether the pyrolysis process is slow or fast (with slower pyrolysis producing higher yields of solid residuals). All these factors mean that there is a high variability in the chemical composition of biochar. Consequently, biochar cannot be understood as a description of a material with a single structure and chemical composition, but rather as a variety of structures with variable chemical compositions (Spokas, 2010). This is problematic when biochar’s potential to act as a carbon reservoir is investigated. The carbon stability of biochar types is dependent on several factors and further investigation is needed when considering the carbon sequestration potential of biochar. Table 4-2, which presents the results of the estimated half-life of biochar depending on the oxygen:carbon (O:C)
molar ratio, illustrates how the chemical characteristics of biochar will have a large impact on its carbon sequestration potential (Spokas, 2010). Here, the term half-life is understood as the amount of time for the carbon content of biochar to reduce to half of its initial value (Söderqvist, 2019). The oxygen:carbon (O:C) molar ratio of biochar was used both by Spokas, (2010) and Söderqvist, (2019) to predict the stability of biochar in soil.
Table 4-2. Oxygen:Carbon (O:C) molar ratio of biochar’s impact on its estimated half-life
Source: Own table with information from (Spokas, 2010)
Table 4-2 shows that the lower the oxygen: carbon (O:C) molar ratio of biochar, the higher the half-life and vice versa. However, even with an oxygen: carbon (O:C) molar ratio of 0.6, the half-life can still be 100 years, which suggests that, in any case, biochar can be an efficient carbon reservoir for at least 100 years. When talking about the carbon sink potential of biochar, it becomes evident that a number of factors will influence the time span for which biochar is an effective carbon sequestration measure.
Thus, even though biochar may be an interesting option to reduce GRs’ carbon footprint, it must be noted that biochar’s carbon storage potential varies depending on type, use and
O:C MOLAR
RATIO
ESTIMATED
HALF-LIFE
<0.2 > 1,000
0.2-0.6 100-1,000
>0.6 ≤100
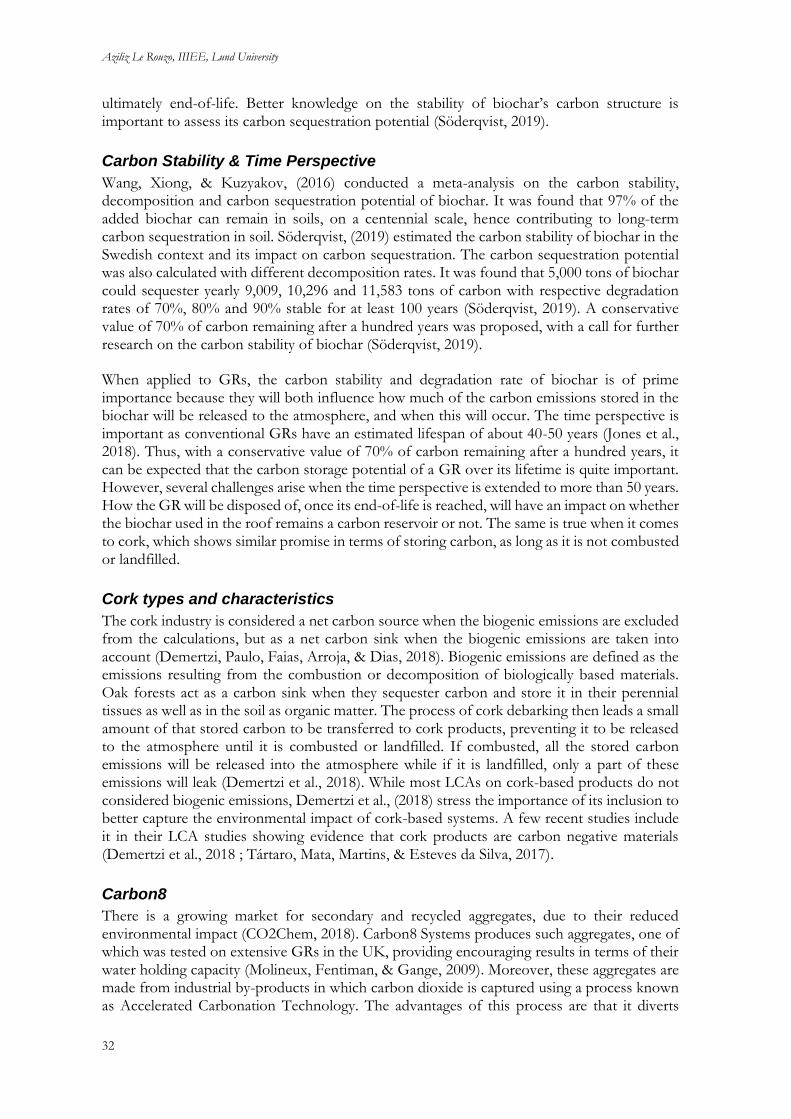
Aziliz Le Rouzo, IIIEE, Lund University
32
ultimately end-of-life. Better knowledge on the stability of biochar’s carbon structure is important to assess its carbon sequestration potential (Söderqvist, 2019).
Carbon Stability & Time Perspective
Wang, Xiong, & Kuzyakov, (2016) conducted a meta-analysis on the carbon stability, decomposition and carbon sequestration potential of biochar. It was found that 97% of the added biochar can remain in soils, on a centennial scale, hence contributing to long-term carbon sequestration in soil. Söderqvist, (2019) estimated the carbon stability of biochar in the Swedish context and its impact on carbon sequestration. The carbon sequestration potential was also calculated with different decomposition rates. It was found that 5,000 tons of biochar could sequester yearly 9,009, 10,296 and 11,583 tons of carbon with respective degradation rates of 70%, 80% and 90% stable for at least 100 years (Söderqvist, 2019). A conservative value of 70% of carbon remaining after a hundred years was proposed, with a call for further research on the carbon stability of biochar (Söderqvist, 2019).
When applied to GRs, the carbon stability and degradation rate of biochar is of prime importance because they will both influence how much of the carbon emissions stored in the biochar will be released to the atmosphere, and when this will occur. The time perspective is important as conventional GRs have an estimated lifespan of about 40-50 years (Jones et al., 2018). Thus, with a conservative value of 70% of carbon remaining after a hundred years, it can be expected that the carbon storage potential of a GR over its lifetime is quite important. However, several challenges arise when the time perspective is extended to more than 50 years. How the GR will be disposed of, once its end-of-life is reached, will have an impact on whether the biochar used in the roof remains a carbon reservoir or not. The same is true when it comes to cork, which shows similar promise in terms of storing carbon, as long as it is not combusted or landfilled.
Cork types and characteristics
The cork industry is considered a net carbon source when the biogenic emissions are excluded from the calculations, but as a net carbon sink when the biogenic emissions are taken into account (Demertzi, Paulo, Faias, Arroja, & Dias, 2018). Biogenic emissions are defined as the emissions resulting from the combustion or decomposition of biologically based materials. Oak forests act as a carbon sink when they sequester carbon and store it in their perennial tissues as well as in the soil as organic matter. The process of cork debarking then leads a small amount of that stored carbon to be transferred to cork products, preventing it to be released to the atmosphere until it is combusted or landfilled. If combusted, all the stored carbon emissions will be released into the atmosphere while if it is landfilled, only a part of these emissions will leak (Demertzi et al., 2018). While most LCAs on cork-based products do not considered biogenic emissions, Demertzi et al., (2018) stress the importance of its inclusion to better capture the environmental impact of cork-based systems. A few recent studies include it in their LCA studies showing evidence that cork products are carbon negative materials (Demertzi et al., 2018 ; Tártaro, Mata, Martins, & Esteves da Silva, 2017).
Carbon8
There is a growing market for secondary and recycled aggregates, due to their reduced environmental impact (CO2Chem, 2018). Carbon8 Systems produces such aggregates, one of which was tested on extensive GRs in the UK, providing encouraging results in terms of their water holding capacity (Molineux, Fentiman, & Gange, 2009). Moreover, these aggregates are made from industrial by-products in which carbon dioxide is captured using a process known as Accelerated Carbonation Technology. The advantages of this process are that it diverts

Re-Thinking Greeen Roof Design
33
waste from landfill, while creating a carbon negative aggregate (Zhu, 2019). Due to its carbon sink properties and previous successful applications on GRs, this aggregate was thought to be relevant to include in the GR substrate.
To enquire into the properties of this material and potential applications on GRs, the director of Carbon8 Systems was contacted by email (Paula Carey, Director at Carbon8, personal communication, February 27th 2020). It was highlighted that the life cycle impact of the aggregates they produce is extremely complex to evaluate, and that it will depend on which waste stream is treated and on the boundaries of the assessment. Nevertheless, previous assessments on their products seemed to indicate that the Accelerated Carbonation Technology produces carbon negative aggregates. Moreover, despite the sparse applications of this material on GRs so far, it seems that due to its light weight and low price this aggregate would easily replace traditional aggregates. Finally, when it comes to how Carbon8 would degrade in the substrate over a span of 50 years, it is presumed that it should stay in a relatively good state and could even become stronger with time (Paula Carey, Director at Carbon8, personal communication, February 27th 2020).
4.2 Costs, Benefits and Carbon Impact This section answers “RQ1) How can the conventional green roof cost-benefit analysis be extended to consider the life cycle carbon profile of the green roof structure?” by showing step by step how the analytical framework can be applied to the chosen case study. This is done by first going through the carbon impact of each layer of the baseline and the prototype. The associated carbon costs and benefits are calculated for each layer, along with the material costs of every component of the structure. Secondly, the additional costs associated with the GR systems, such as the installation cost and maintenance cost, are calculated and presented. Third, and finally, the chosen benefits of the two GR systems are calculated using a data transfer approach.
4.2.1 Baseline: Costs & Carbon Impact
This section goes through all the data that was gathered and selected to provide an estimation of the carbon footprint of the structure of the baseline. Table 4-1 provides some additional information on the characteristics of the baseline, where the materials used for each roof layer are detailed.
Plant Cover
The price of the plant cover was estimated at 20 SEK/m2 following expert advice from the SGRI. This price corresponds to the price of sedum cuttings that can be spread onto the substrate, but the price would be higher if pre-vegetated sedum mats for extensive GRs were used. It must be noted that the carbon sequestration realised by the plant cover is accounted for as an avoided cost and treated separately in section 4.2.4.
Pumice
Several pumice producers were contacted to get information on the carbon footprint resulting from the commercialisation of that material. The pumice used on GRs in Sweden usually comes by boat from Iceland after being mined. Information on the emissions from the mining process and transport were thus sought. While one of the main pumice providers was able to share information on the estimated price of pumice for the Swedish market (635 SEK/m3), no information could be found on the carbon footprint of that material. To the best of the author’s knowledge, no EPD or LCA study was available for pumice. However, information was found on materials made from pumice.

Aziliz Le Rouzo, IIIEE, Lund University
34
An EPD on PonceBloc block was utilised for this study as the main raw material of PonceBloc is pumice. Information on that material consequently gives an estimate for the climate impact of the volcanic rock (Institut Bauen und Umwelt & Ibu, 2016). Apart from pumice, PonceBloc is made of cement, water and closed-loop recycled materials. Using this EPD means that there is a risk that the impact of pumice might be overestimated as PonceBloc is not solely made of pumice, but it is the closest estimate that could be found. However, only the values for raw material supply and transport will be used for this study as the manufacturing process does not apply to the pumice used in GR substrates. In addition, the declared unit of this EPD is 1m3
of PonceBloc. The emissions resulting from the raw material extraction are 82.4 kg CO2eq while
transport leads to 4.06 kg CO2eq, which gives a total of 86.46 kg CO2
eq (Institut Bauen und Umwelt & Ibu, 2016). Considering that the 100mm substrate consists of 70% pumice, then the climate impact of pumice is 6.05 kg CO2
eq/m2 of GR.
Crushed Expanded Clay Aggregate
The largest producer of expanded clay light weight aggregates in Europe is LECA, hence information was sought on their materials (Leca®, n.d.). The price of LECA in Sweden was found by contacting a Sales Manager at LECA Sverige who gave an approximate price of 55€/m3 which corresponds to 582 SEK/m3. LECA constitutes 10% in volume of the substrate, which leads to a cost 5.82 SEK/m2 of GR.
When it comes to the carbon emissions resulting from the production of LECA, information was derived from the EPD issued by the Norwegian EPD foundation (The Norwegian EPD Foundation, 2015). This EPD investigates the impact of the production of lightweight expanded clay aggregate, grading 820mm, at LECA Rælingen. The functional unit used in this study is 1m3 of LECA. Their estimates show that from the raw material extraction, to production and transport, the total climate impact associated with 1m3 of LECA is 53 kg CO2
eq. However, considering that the substrate is 100mm and only comprises 10% of LECA in volume, then the climate impact of using LECA on GRs in 0.53 kg CO2
eq/m2 of GR.
Green Waste Compost
Sysav, south Skåne’s waste company produces compost from household and industry waste. The green waste compost used on GRs in Malmö would thus, most likely, come from Sysav. Information on the price of their compost was available on their website (Sysav, n.d.). Sysav provides different types of compost, but the compost with a screen-size between 0-10mm was found most appropriate for GRs according to the expert from the SGRI. The price per tonne is approximately 250 SEK. However, the weight per m3 of compost is difficult to estimate as it depends on the type of compost and the level of humidity of the material. The company was contacted to get a precise measure for the chosen type of compost, and an estimate of 800 kg/m3 was provided. Using this information, the price of green waste compost used in the calculations is 4 SEK/m2.
When it comes to the carbon footprint of compost, it was difficult to obtain information that could be used. Indeed, several studies conducted an LCA of compost production, but the functional units used were a tonne of organic waste, the production of a tonne of tomatoes or similar functional units (Martínez-Blanco et al., 2013 ; Martínez-Blanco, Muñoz, Antón, & Rieradevall, 2009 ; Jeong, Cho, Lee, Kim, & Kim, 2019). None of these estimates could be used for this study as information on the emissions of a tonne of green waste compost was necessary. Pergola et al., (2020) study was used as it provided an estimation of the life cycle impact of one tonne of compost in Italy. However, the type of compost investigated was not municipal but agricultural waste compost. The production process can be described as follows:
Re-Thinking Greeen Roof Design
35
the agricultural waste is transported to the plant where it is first mixed, then processed and finally screened before being stored before use (Pergola et al., 2020). Martínez Blanco, (2012) study indicates that the production process for municipal compost is likely to follow roughly the same steps. It is unclear whether the impact of the compost supplied by Sysav would be greater or lower than the estimation from Pergola et al., (2020). However, this estimate will still be used in this study, as a first attempt to quantify the carbon footprint of the compost used on GRs. Pergola et al., (2020) found that the production of 1 tonne of light compost resulted in 250 kg CO2
eq, while the production of 1 tonne of heavy compost resulted in 199 kg CO2
eq (Pergola et al., 2020). Here it is assumed that light compost would be used on GRs, which leads to an estimated 250 kg CO2
eq per tonne of compost used in the substrate. Knowing that compost corresponds to 20% of the substrate in volume, this leads to 5.00 kg CO2
eq/m2.
Water Holding Layer
The Swedish Guideline for GRs indicate that stone wool insulation mats can be used to retain moisture (Vinnova, n.d.). Information on the climate impact of this material was found on the International EPD System database (International EPD System, 2019). This EPD investigated the life cycle impact of Saint-Gobain ISOVER’s stone wool insulation materials. Saint-Gobain ISOVER is one of the big market players when it comes to sustainable insulation solutions (ISOVER, n.d.). It was thus inferred that their product could provide a good estimate for a typical stone wool insulation material used on GRs. The EPD estimated that 1m3 of this material would lead to the emission of 190 kg CO2
eq from raw material extraction to transport and production (International EPD System, 2019). Since the water holding fabric is around 40mm thick, this leads to 7.6 kg CO2
eq/m2. The price for mineral wool was obtained by contacting Saint-Gobain ISOVER’s Swedish branch. The estimated price of a 40mm stone wool insulation mat was 55 SEK/m2.
Drainage Board
The drainage layer can be made from various materials such as hard plastic, polystyrene, foam, coarse gravel and crushed recycled bricks, depending on the type of GR (GRO, 2011). For example, ZinCo’s extensive GR models use recycled polyolefin (ZinCo, n.d.). As no public information could be found on the carbon footprint of this specific product, a representative of ZinCo was directly consulted (ZinCo representative, personal communication, February 19th 2020). It turned out that ZinCo is actively working on standardising this type of information for their whole product range and expected this information to be available in a few months’ time. Since no EPD or LCA could be found on that material, general data on the environmental impact of plastic production was sought. PlasticsEurope, (2014) provides an estimation of the climate impact associated with the production of 1 kg of high-density polyethylene, i.e. 1.80 kg CO2
eq according to their estimate. ZinCo’s drainage layer is approximately 25mm and weights 1.6 kg/m². Using these estimates, and assuming that a similar material would be used, this means that the climate impact of the drainage board could be approximately 2.9 kg CO2
eq/m2 of GR.
The estimated price of a typical drainage board in Sweden was given by the SGRI and was evaluated at about 100 SEK/m2. This price reflects the average charge from the following GR providers, Zinco, Byggros and Svenska Naturtak.
Insulation Board
Information on the carbon footprint of a typical extruded polystyrene (XPS) insulation board was found on an EPD provided on one of Soprema’s products. Soprema is a key player in the construction sector and a major provider of insulation products and waterproofing solutions
Aziliz Le Rouzo, IIIEE, Lund University
36
(Soprema, n.d.). Other EPDs were also considered, one issued by the International EPD system and one by the Institut Bauen und Umwelt e.V. (International EPD System, 2008 ; Institut Bauen und Umwelt, 2018). However, both of these studies were less recent and looked at slightly different materials than those used in the study. Moreover, Soprema’s insulation board seemed to better correspond to a typical insulation material used on GRs in Sweden. The chosen study was issued by BRE Global Ltd, which is an independent, third-party approval organisation, offering certification of products, services and systems internationally. Their estimations indicate that the carbon impact of one m2 of Soprema’s XPS insulation board from a cradle-to-grave perspective is about 12.9 kg CO2
eq (BRE Global, 2019). It must also be noted that the estimated footprint from the two other EPDs provided similar estimates, with values ranging from 5.09 to 11.77 kg CO2
eq for life cycle steps A1-A3 (raw material extraction, transport and production).
When it came to the price of such an insulation board, the Sales Manager of Soprema Sweden was contacted. The estimated price per m3 of insulation material was estimated to be roughly 720 SEK. Considering that the insulation layer in the baseline would have a thickness of about 50mm, the estimated price is then 36 SEK/m2.
Root Barrier
Information on the environmental profile of the root barrier was scarce and no EPD or LCA could be found on that material. However, the root barrier is usually made of either polyethylene or polyvinyl chloride (Bozorg Chenani et al., 2015). ZinCo’s website indicates that the root barrier that they use in their extensive GRs is made of high-pressure low-density polyethylene, with a thickness of approximately 0.34mm and a weight of approximately 320g/m2 (ZinCo, n.d.). These product characteristics will be used in this study.
PlasticsEurope (2014) issued an EPD based upon life cycle inventory data from PlasticsEurope’s member companies. Their LCA indicates that the production of 1 kg of high-pressure low-density polyethylene leads to the emissions of 1.87 kg CO2
eq. Using the assumption that the root barrier would weigh roughly 320g/m2, this means that the emissions of the root barrier would be about 0.6 kg CO2
eq/m2 of GR (PlasticsEurope, 2014). Finally, the price of the root protection barrier was given by the SGRI, where it was estimated to be around 50 SEK/m2.
4.2.2 Prototype: Costs & Carbon Impact
This section goes through all the data that was gathered and selected to provide an estimation of the carbon footprint of the structure of the baseline. Table 4-1 displays additional information on the characteristics of the prototype, where the materials used for each roof layer are detailed.
Plant Cover
The seeds used in the prototype are the same as in the baseline, so the price is estimated to be 20 SEK/m2, as previously mentioned.
Biochar
When it comes to determining the carbon impact of biochar, the estimates of Hamedani et al., (2019) were used. This study was deemed most relevant as it provided detailed information on the assumptions used in the LCA, was recent and was conducted in Belgium which can be argued to have a similar context to that of Sweden. Hamedani et al., (2019) estimated that

Re-Thinking Greeen Roof Design
37
biochar produced from willow has the potential to reduce CO2 emissions more than other types of biochar that have a less stable carbon content, such as for example pig manure biochar. They based their calculations on the assumption that willow biochar consisted of 80% of stable carbon. Using that assumption, their findings show that the net carbon impact of one tonne of willow biochar is of -2,089.65 kg of CO2
eq. To verify the reliability of this figure, expert advice was sought. The CEO of Ecoera was consulted, as one of the 15 members of the expert panel which developed the Biochar Carbon Offset Methodology, and thus an expert on the subject (International Biochar Innitiative, n.d.)(CEO at ECOERA, personal communication, 24th February 2020). The numbers provided by Ecoera were very similar to that of Hamedani et al., (2019), finding approximately that 2.5 tonnes of CO2
eq were stored for every tonne of biochar used as a soil amendment. Considering that biochar corresponds to 20% of the substrate’s volume, the climate impact associated with the use of biochar as a substrate amendment is thus -12.5 kg CO2
eq/m2.
Estimations on the market price of biochar in Sweden were shared by two providers, Ecoera and Ecotopic. Ecotopic gave a broad estimate which ranged between 1,350 to 4,500 SEK per m3, while Ecoera estimated that one cubic metre of biochar would cost 2,600 SEK. These numbers were averaged which gave an estimated average price of 2,817 SEK per cubic metre. This corresponds to roughly 56 SEK/m2 of GR. Due to the high variability of prices, a sensitivity will be conducted with the highest estimate.
Carbon8
To further investigate the carbon negativity of the Carbon8 aggregates, EPDs and LCAs were sought. However, since Carbon8 products are relatively new, only one LCA assessment could be found. This study investigated the life cycle environmental impact of concrete blocks made from Carbon8 aggregates, along with other more typical materials used for concrete production. The functional unit chosen in this study was 1m2 of wall made concrete blocks. This estimate could not be used due to convertibility issues. The data needed would have rather been an estimation of the life cycle impact of 1m3 of aggregate. This LCA nevertheless shows that the climate impact of this alternative concrete is lower than that of conventional concrete which supports the claim that these aggregates have a low or negative environmental impact (CO2Chem, 2018). This confirms that such aggregates are carbon negative, but due to the current lack of data, no value could be assigned to that benefit. The impact of the use of Carbon8 aggregates in the substrate was therefore assumed to be null. This assumption will potentially lead to an underestimation of the carbon stored in the prototype, but a precautionary approach was judged most adequate due to the lack of data.
Information on the price of this material was obtained from the director of Carbon8 Systems (Paula Carey, Director at Carbon8, personal communication, February 27th 2020). The price of Carbon8 was said to vary depending on the chosen type of material, but that generally the price was around 10€ per tonne. The bulk density was said to be about 1,000 kg/m3 which means that a price of 10€ per m3 could be used for the calculations. Using an exchange rate of 10.59 (see 3.4.2 Calculations methods) and taking into account the fact that the substrate comprises 60% of Carbon8, this leads to a price of about 6.35 SEK/m2.
Green Waste Compost
The same compost is used in the baseline and in the prototype. Therefore, the same estimates were used for both cases.

Aziliz Le Rouzo, IIIEE, Lund University
38
Granular Cork
When it comes to granular cork, a Danish cork retailer Korkbyg was contacted (Korkbyg, n.d.). Korkbyg commissions Amorim Cork’s products, the world largest producer of cork, in Scandinavia (Amorim Cork, n.d.). They estimated that granular cork would cost 1,500 DKK/m3 which corresponds to 2,127 SEK/m3. Considering that cork represents 10% of the substrate’s volume, the price is then 21 SEK/m2.
The carbon footprint of granular cork was difficult to assess as it is a by-product resulting from cork board production. Hence, assessing the life cycle of this by-product poses some allocation challenges. Nevertheless, Demertzi, Sierra-Pérez, Paulo, Arroja, & Dias, (2017) investigated the environmental impacts associated with the production of expanded cork slabs and granules used in construction for insulation. This study included the biogenic carbon in the climate change impact category. This study used mass allocation, where the allocation factors considered were 75% for the cork slab and 25% for the cork granules. Following this reasoning, their findings show that expanded cork granules have an estimated footprint of 1.49 kg CO2
eq for every kilogram of cork granule resulting from the production of cork slabs. The life cycle steps taken into account here include the extraction of raw material, production and packaging. Knowing that the density of the cork granules is 70 kg/m3, the climate impact of 1m3 of cork granules is thus about 104 kg CO2
eq (Demertzi et al., 2017). This corresponds to 1.04 kg CO2
eq/m2 of GR.
Water Holding Layer
Upon consultation with the expert from the SGRI, an experimental water holding layer made from biochar is used in the prototype. A thickness of 30mm is assumed to provide roughly the same water holding properties as would stone wool. Using the estimated biochar price and climate impact mentioned above, a layer of 30mm corresponds to a price of 84.51 SEK/m2 with a carbon impact of -18.8kg CO2
eq/m2.
Drainage Layer
A recent study also mentions the possible use of insulation cork boards for drainage and water storage (Tadeu, Simões, Almeida, & Manuel, 2019). Their results indicate that insulation cork boards are suitable for use as a drainage layer on GRs. Depending on the density and thickness of the board, a higher drainage value could be achieved compared to the polyolefin reference product. Their results therefore encourage the use of this new material for drainage (Tadeu et al., 2019). An experimental drainage layer made of cork will be used on this prototype. The same data was used as for the insulation board, which is further detailed below. While the insulation board has a thickness of 50mm, the drainage layer is 10mm. The climate impact thus becomes -4.3 kg CO2
eq/m2 for the drainage layer.
The price of a typical cork board was shared by Korkbyg and revolved around 62 DKK/m2,
for a thickness of 10mm (Korkbyg, n.d.). This gives an estimated price of 88 SEK/m2.
Insulation Board
Korkbyg was also contacted regarding a typical expanded cork insulation board with a thickness of 50mm. Their estimated price for the Swedish market was 191 DKK/m2 which corresponds to 270 SEK/m2 (Korkbyg, n.d.). This price is quite consequent, but Korkbyg indicated that it would most likely be lower if high quantities of the product where to be ordered. This possibility will be tested by the means of a sensitivity analysis.

Re-Thinking Greeen Roof Design
39
Silvestre, Pargana, De Brito, Pinheiro, & Durão, (2016) LCA study was used to estimate the carbon footprint associated with the production of an insulation cork board. This insulation material is made of expanded cork agglomerates manufactured in Portugal. Since Portugal is the world’s largest producer of and exporter of cork based-materials, the material under study in the LCA was deemed representative of what could be obtained on the Swedish market (Silvestre et al., 2016). This study was also chosen as it is one of the recent LCA studies on cork products which includes the biogenic carbon sequestration and emission in their calculations. This study investigates the following life cycle stages: A1: raw materials, A2: transport, A3.1: packaging, A3.2: manufacturing, and A3.3: packaging waste for one cubic metre of insulation cork board with a density of 110 kg/m3.
Table 4-3. Net carbon emissions for A1-A3 with and without consideration of CO2 capture and biogenic CO2
emissions
Life cycle Stages - Total per m3 in kg CO2eq
A1 A2 A3.1 A3.2 A3.3 Total
Cradle to Gate Impact 7.15 1.23 4.92 26.7 0.233 40.2
Gross biogenic CO2 emissions -627.15 - -6.04 158.3 -0.063 -474.95
Net biogenic CO2 emissions -620 1.23 -1.12 185 0.170 -435
Source: Information retrieved from (Silvestre et al., 2016)
There is a considerable difference between the estimated 40.2 kg CO2eq resulting from the life
cycle steps A1-A3 and the -435 kg CO2eq estimate obtained when considering the CO2 capture
and biogenic CO2 emissions. It must be noted that in their study, Silvestre et al., (2016) indicated that the 185 kg CO2
eq estimate for step A3.2 which corresponds to the manufacturing phase is actually divided between: fossil CO2 emissions, biogenic CO2 emissions and CO2 capture.
Respectively these steps have a net carbon impact of 26.7, 222, -63.6 kg CO2eq respectively. Since a
growing body of studies highlight the importance of considering biogenic emissions in LCA calculations, the value used in this study is -435 kg CO2
eq which corresponds to -21.75 kg CO2
eq/m2 (Demertzi et al., 2018).
Root Barrier
The root barrier is the same as for the baseline. The same estimates were therefore used.
4.2.3 Additional costs of GR Systems
Installation
The SGRI provided an estimation of the installation cost for GRs in Malmö, derived from the numerous projects they have been involved in. The total cost of a 100mm sedum roof established with sedum cuttings ranges between 360 SEK and 500 SEK, per m2 of GR. The installation cost is estimated at 152 SEK/m2 and rests on the assumption that labour costs revolve around 450 SEK/hour and that the use of a crane costing 1,000 SEK/hour is required. The installation cost will vary depending on the size of the GR and its location. Furthermore,

Aziliz Le Rouzo, IIIEE, Lund University
40
this does not include the cost of eaves profiles,5 whose price will depend on how many meters of profiles are needed and what types are being used.
Maintenance
In order to consider the costs associated with the maintenance of GR systems, an Urban Biodiversity and Green infrastructure expert from Zurich University of Applied Sciences was contacted (Urban Biodiversity & Green Infrastructure Expert, personal communication, March 27th 2020). The long establishment of GR systems in Switzerland justified contacting one of their experts on the subject. According to that expert, a minimum of maintenance needs to be performed one or twice a year from an insurance perspective. However, the maintenance requirements vary greatly for each type of roof and depend on the type of vegetation. For extensive GRs, the average maintenance cost per m2 are estimated to be around 0.28€ if maintenance is done one or twice a year. In this study it is considered that maintenance is performed twice a year, which results in a cost of 6 SEK/m2 per year. This is likely to be a low estimate, but in Sweden, where knowledge on the maintenance of GRs is less developed an estimated maintenance frequency of once or twice a year seems realistic. It can however be expected that overtime as GRs become established and with the appearance of warmer summers, maintenance requirements and costs will increase.
4.2.4 Additional Benefits of GR Systems
Avoided Carbon Emissions
Muhammed et al., (2019) review of the studies looking into the carbon sequestration benefit of GRs highlighted that most studies had been conducted in very different contexts to that of Malmö. Their review indicated that substrate depth, soil media and plant type all play a large role in the carbon sequestration potential of GRs. Accordingly, these aspects were deemed most important when choosing a study from which to borrow data from.
Heusinger & Weber, (2017) study was found most relevant to estimate the carbon emissions sequestered by the plant cover yearly. This study looked at an extensive GR located in Berlin, Germany with a 90mm substrate, and a sedum cover. Considering that this study was conducted recently, in northern Europe, and on a very similar type of GR it was deemed most relevant to use for benefit transfer. To assess the climate mitigation potential of GR systems, the net ecosystem exchange of CO2 was investigated for a whole annual cycle to capture seasonal variations. The roof under investigation had a surface area of 8,600m2 and the GR vegetation was mainly composed of Sedum species (Sedum floriferu & Sedum album) and herbaceous plants (Allium schoenoprasum). The plant height varied between 100mm and 300mm (Heusinger & Weber, 2017). Their results revealed that while, with proper watering, GRs act as a carbon sink removing 0.313 kg CO2/m2 yearly, under dry conditions and low volumetric water content of the substrate, GRs can turn into CO2 sources. Analysis of dry periods showed that the volumetric water content of the substrate should be greater than 0.05m3m-3 in order to optimise the CO2 uptake of GRs. Moreover, seasonal variations imply that the CO2 uptake is not constant over the year. Generally, this study showed that the highest CO2 uptake occurred during the growth period, with the month of May showing the highest uptake rates (Heusinger & Weber, 2017).
5 More simply defined as the edges or the roof.
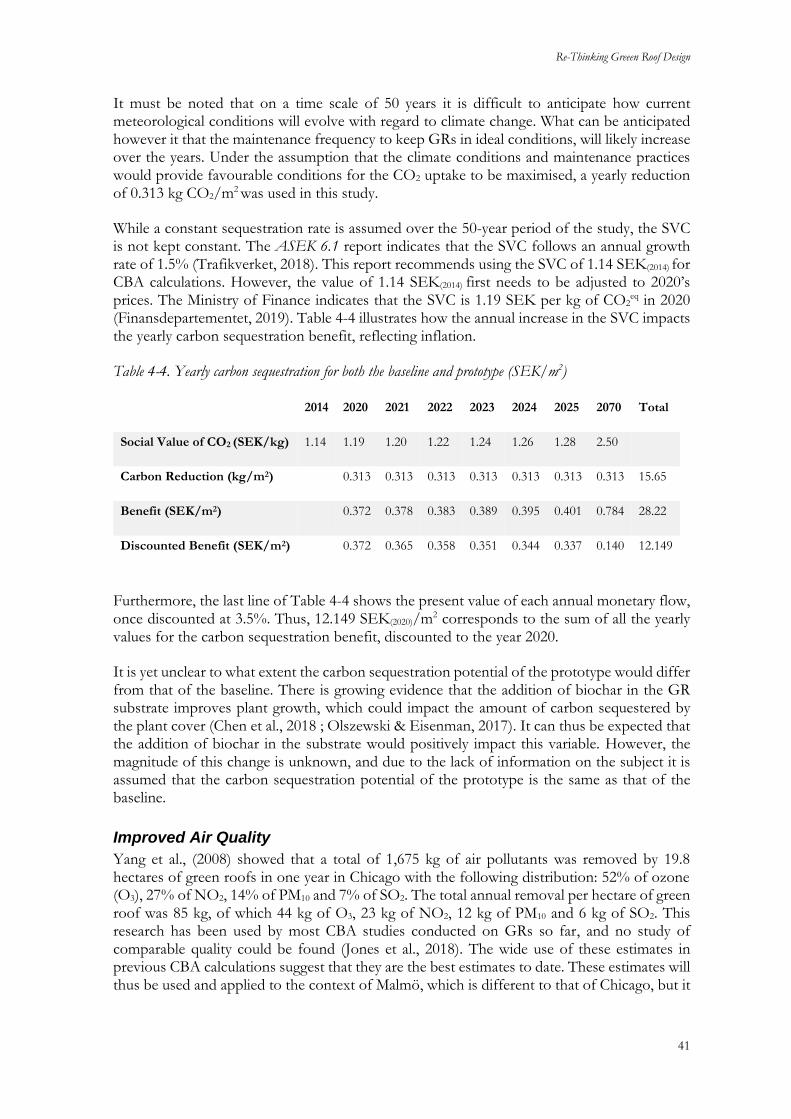
Re-Thinking Greeen Roof Design
41
It must be noted that on a time scale of 50 years it is difficult to anticipate how current meteorological conditions will evolve with regard to climate change. What can be anticipated however it that the maintenance frequency to keep GRs in ideal conditions, will likely increase over the years. Under the assumption that the climate conditions and maintenance practices would provide favourable conditions for the CO2 uptake to be maximised, a yearly reduction of 0.313 kg CO2/m2 was used in this study.
While a constant sequestration rate is assumed over the 50-year period of the study, the SVC is not kept constant. The ASEK 6.1 report indicates that the SVC follows an annual growth rate of 1.5% (Trafikverket, 2018). This report recommends using the SVC of 1.14 SEK(2014) for CBA calculations. However, the value of 1.14 SEK(2014) first needs to be adjusted to 2020’s prices. The Ministry of Finance indicates that the SVC is 1.19 SEK per kg of CO2
eq in 2020 (Finansdepartementet, 2019). Table 4-4 illustrates how the annual increase in the SVC impacts the yearly carbon sequestration benefit, reflecting inflation.
Table 4-4. Yearly carbon sequestration for both the baseline and prototype (SEK/m2)
2014 2020 2021 2022 2023 2024 2025 2070 Total
Social Value of CO2 (SEK/kg) 1.14 1.19 1.20 1.22 1.24 1.26 1.28 2.50
Carbon Reduction (kg/m2) 0.313 0.313 0.313 0.313 0.313 0.313 0.313 15.65
Benefit (SEK/m2) 0.372 0.378 0.383 0.389 0.395 0.401 0.784 28.22
Discounted Benefit (SEK/m2) 0.372 0.365 0.358 0.351 0.344 0.337 0.140 12.149
Furthermore, the last line of Table 4-4 shows the present value of each annual monetary flow, once discounted at 3.5%. Thus, 12.149 SEK(2020)/m2 corresponds to the sum of all the yearly values for the carbon sequestration benefit, discounted to the year 2020.
It is yet unclear to what extent the carbon sequestration potential of the prototype would differ from that of the baseline. There is growing evidence that the addition of biochar in the GR substrate improves plant growth, which could impact the amount of carbon sequestered by the plant cover (Chen et al., 2018 ; Olszewski & Eisenman, 2017). It can thus be expected that the addition of biochar in the substrate would positively impact this variable. However, the magnitude of this change is unknown, and due to the lack of information on the subject it is assumed that the carbon sequestration potential of the prototype is the same as that of the baseline.
Improved Air Quality
Yang et al., (2008) showed that a total of 1,675 kg of air pollutants was removed by 19.8 hectares of green roofs in one year in Chicago with the following distribution: 52% of ozone (O3), 27% of NO2, 14% of PM10 and 7% of SO2. The total annual removal per hectare of green roof was 85 kg, of which 44 kg of O3, 23 kg of NO2, 12 kg of PM10 and 6 kg of SO2. This research has been used by most CBA studies conducted on GRs so far, and no study of comparable quality could be found (Jones et al., 2018). The wide use of these estimates in previous CBA calculations suggest that they are the best estimates to date. These estimates will thus be used and applied to the context of Malmö, which is different to that of Chicago, but it
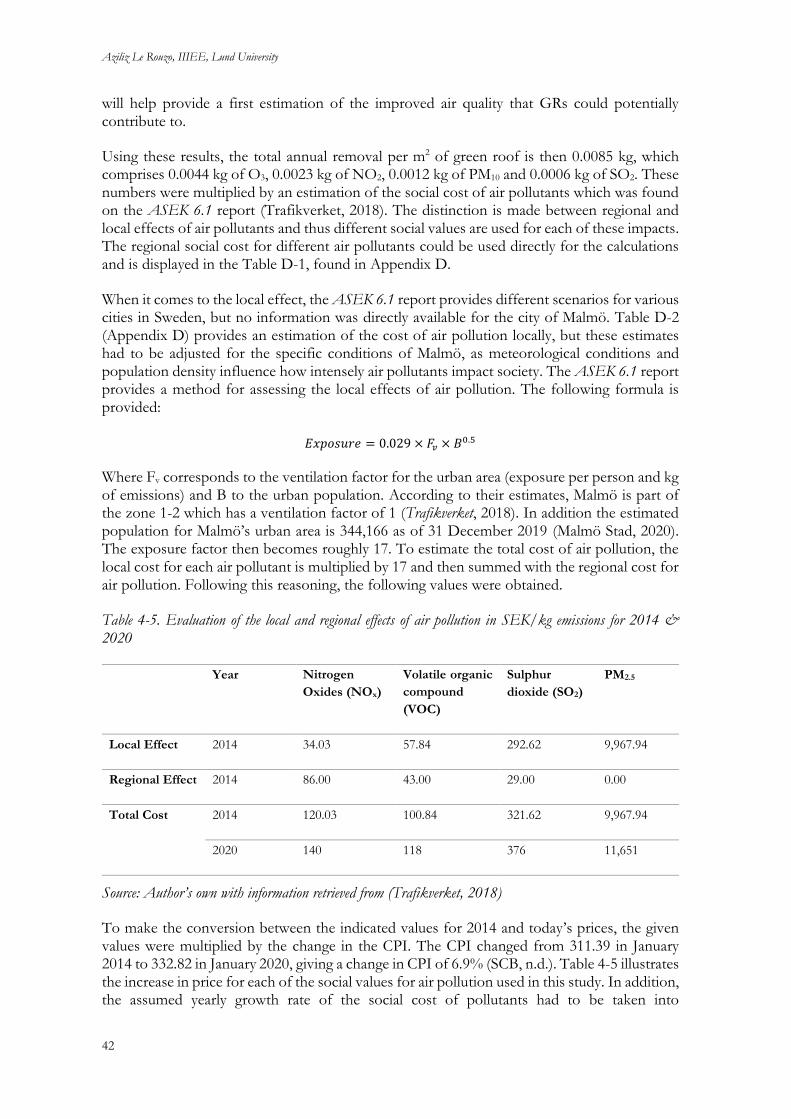
Aziliz Le Rouzo, IIIEE, Lund University
42
will help provide a first estimation of the improved air quality that GRs could potentially contribute to.
Using these results, the total annual removal per m2 of green roof is then 0.0085 kg, which comprises 0.0044 kg of O3, 0.0023 kg of NO2, 0.0012 kg of PM10 and 0.0006 kg of SO2. These numbers were multiplied by an estimation of the social cost of air pollutants which was found on the ASEK 6.1 report (Trafikverket, 2018). The distinction is made between regional and local effects of air pollutants and thus different social values are used for each of these impacts. The regional social cost for different air pollutants could be used directly for the calculations and is displayed in the Table D-1, found in Appendix D.
When it comes to the local effect, the ASEK 6.1 report provides different scenarios for various cities in Sweden, but no information was directly available for the city of Malmö. Table D-2 (Appendix D) provides an estimation of the cost of air pollution locally, but these estimates had to be adjusted for the specific conditions of Malmö, as meteorological conditions and population density influence how intensely air pollutants impact society. The ASEK 6.1 report provides a method for assessing the local effects of air pollution. The following formula is provided:
𝐸𝑥𝑝𝑜𝑠𝑢𝑟𝑒 = 0.029 × 𝐹𝑣 × 𝐵0.5
Where Fv corresponds to the ventilation factor for the urban area (exposure per person and kg of emissions) and B to the urban population. According to their estimates, Malmö is part of the zone 1-2 which has a ventilation factor of 1 (Trafikverket, 2018). In addition the estimated population for Malmö’s urban area is 344,166 as of 31 December 2019 (Malmö Stad, 2020). The exposure factor then becomes roughly 17. To estimate the total cost of air pollution, the local cost for each air pollutant is multiplied by 17 and then summed with the regional cost for air pollution. Following this reasoning, the following values were obtained.
Table 4-5. Evaluation of the local and regional effects of air pollution in SEK/kg emissions for 2014 & 2020
Year Nitrogen
Oxides (NOx)
Volatile organic
compound
(VOC)
Sulphur
dioxide (SO2)
PM2.5
Local Effect 2014 34.03 57.84 292.62 9,967.94
Regional Effect 2014 86.00 43.00 29.00 0.00
Total Cost 2014 120.03 100.84 321.62 9,967.94
2020 140 118 376 11,651
Source: Author’s own with information retrieved from (Trafikverket, 2018)
To make the conversion between the indicated values for 2014 and today’s prices, the given values were multiplied by the change in the CPI. The CPI changed from 311.39 in January 2014 to 332.82 in January 2020, giving a change in CPI of 6.9% (SCB, n.d.). Table 4-5 illustrates the increase in price for each of the social values for air pollution used in this study. In addition, the assumed yearly growth rate of the social cost of pollutants had to be taken into
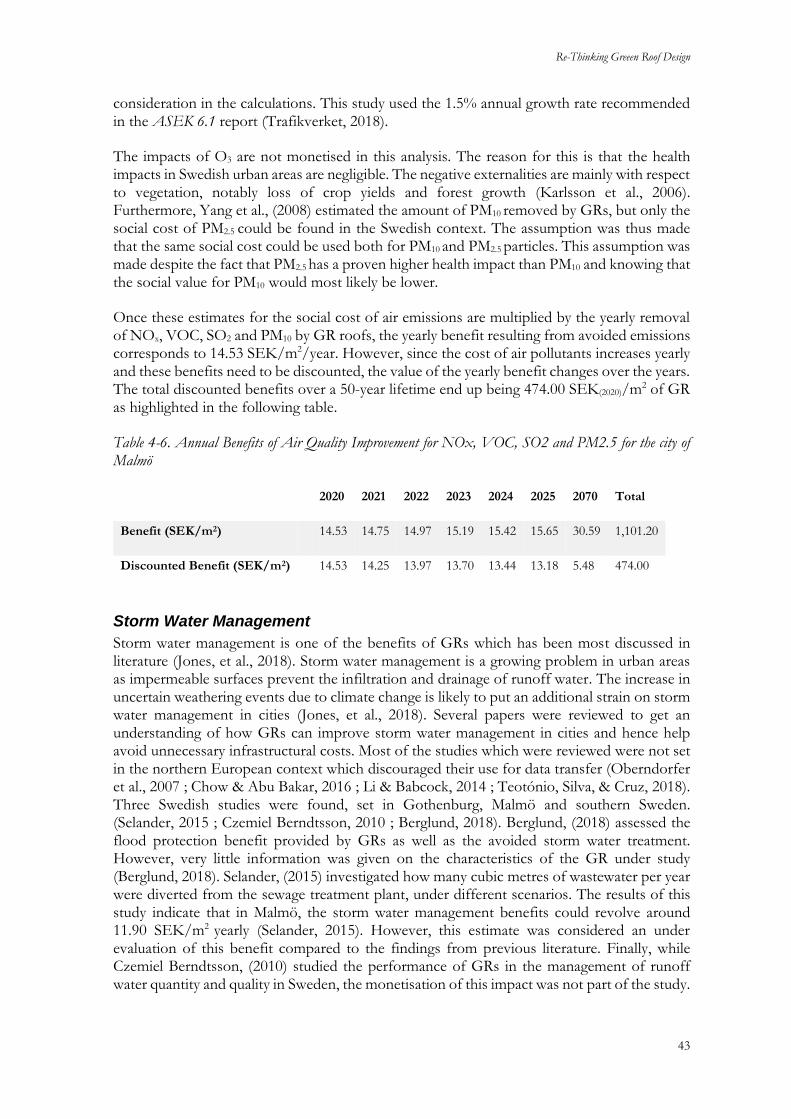
Re-Thinking Greeen Roof Design
43
consideration in the calculations. This study used the 1.5% annual growth rate recommended in the ASEK 6.1 report (Trafikverket, 2018).
The impacts of O3 are not monetised in this analysis. The reason for this is that the health impacts in Swedish urban areas are negligible. The negative externalities are mainly with respect to vegetation, notably loss of crop yields and forest growth (Karlsson et al., 2006). Furthermore, Yang et al., (2008) estimated the amount of PM10 removed by GRs, but only the social cost of PM2.5 could be found in the Swedish context. The assumption was thus made that the same social cost could be used both for PM10 and PM2.5 particles. This assumption was made despite the fact that PM2.5 has a proven higher health impact than PM10 and knowing that the social value for PM10 would most likely be lower.
Once these estimates for the social cost of air emissions are multiplied by the yearly removal of NOx, VOC, SO2 and PM10 by GR roofs, the yearly benefit resulting from avoided emissions corresponds to 14.53 SEK/m2/year. However, since the cost of air pollutants increases yearly and these benefits need to be discounted, the value of the yearly benefit changes over the years. The total discounted benefits over a 50-year lifetime end up being 474.00 SEK(2020)/m2 of GR as highlighted in the following table.
Table 4-6. Annual Benefits of Air Quality Improvement for NOx, VOC, SO2 and PM2.5 for the city of Malmö
2020 2021 2022 2023 2024 2025 2070 Total
Benefit (SEK/m2) 14.53 14.75 14.97 15.19 15.42 15.65 30.59 1,101.20
Discounted Benefit (SEK/m2) 14.53 14.25 13.97 13.70 13.44 13.18 5.48 474.00
Storm Water Management
Storm water management is one of the benefits of GRs which has been most discussed in literature (Jones, et al., 2018). Storm water management is a growing problem in urban areas as impermeable surfaces prevent the infiltration and drainage of runoff water. The increase in uncertain weathering events due to climate change is likely to put an additional strain on storm water management in cities (Jones, et al., 2018). Several papers were reviewed to get an understanding of how GRs can improve storm water management in cities and hence help avoid unnecessary infrastructural costs. Most of the studies which were reviewed were not set in the northern European context which discouraged their use for data transfer (Oberndorfer et al., 2007 ; Chow & Abu Bakar, 2016 ; Li & Babcock, 2014 ; Teotónio, Silva, & Cruz, 2018). Three Swedish studies were found, set in Gothenburg, Malmö and southern Sweden. (Selander, 2015 ; Czemiel Berndtsson, 2010 ; Berglund, 2018). Berglund, (2018) assessed the flood protection benefit provided by GRs as well as the avoided storm water treatment. However, very little information was given on the characteristics of the GR under study (Berglund, 2018). Selander, (2015) investigated how many cubic metres of wastewater per year were diverted from the sewage treatment plant, under different scenarios. The results of this study indicate that in Malmö, the storm water management benefits could revolve around 11.90 SEK/m2 yearly (Selander, 2015). However, this estimate was considered an under evaluation of this benefit compared to the findings from previous literature. Finally, while Czemiel Berndtsson, (2010) studied the performance of GRs in the management of runoff water quantity and quality in Sweden, the monetisation of this impact was not part of the study.

Aziliz Le Rouzo, IIIEE, Lund University
44
Consequently, Nurmi et al., (2016) study was deemed most relevant for data transfer as it investigated the storm water management benefit of GRs in the context of Helsinki, which just like Malmö, is a coastal town in Scandinavia with historical infrastructure. In Helsinki, the average annual rainfall was of 669mm in 2016 and had an average of 656mm over the 1981-2010 time period (Finnish Meteorological Institute, n.d.). While such detailed estimates could not be found for Malmö, the average annual rainfall is thought to be around 612mm (Climate Data, n.d.). Such similarity in rainfall patterns suggests that the costs for storm water management in the two cities could be comparable, provided that the sewage systems are similar and in similar conditions.
Thus, Nurmi et al., (2016) study was chosen because it provided an in-depth review of the benefits GRs can provide for storm water management in a similar context to that of Malmö. Indeed, their calculations not only consider the avoided costs from three types of capital expenditure: 1) building a new separate sewer system, 2) the repair of existing separate sewer infrastructure and 3) the repair of existing combined sewer system but it also considers the cost of rainwater purification. Their assumptions and step-by-step considerations are listed below:
• It must be noted that in Helsinki, storm water management is divided in two main categories: combined storm water sewer systems and separated systems. From the 1900 km of sewer pipes existing in 2016, about 250 km are built as combined sewer system and 1650 km as separate system.
• Nurmi et al., (2016) estimate that the expansion of the sewer network for storm water alone incurs annual costs of 4 million euros. Moreover, the repair of existing storm water pipes costs 2 million euros per year while the repair costs of the combined system revolve around 5-10 million yearly, of which, 2-4 million euros is allocated to stormwater induced repairs.
• It is assumed that the repair costs will double or triple in the future as a result of the aging of the sewer system. Moreover, the annual expansion costs of the network are expected to increase by 20% since larger pipes will be used in the context of climate change adaptation.
• The storm water management cost-reduction estimates are based on a 10% GR space infrastructure scenario.
This scenario assumption of 10% green roof space made by Nurmi et al., (2016) requires further explanations. It is not an assumption about the future share of green roofs within a specific time period. The assumption can only be understood against the background of the conflict between short-run marginal benefits and long-run incremental benefits. While the benefit of a single GR is negligible, if widely implemented, GRs could have a large impact on the city storm water management system. Thus, the total storm water benefits of a hypothetical 10% increase of green roof space has been estimated, upon which the benefits are divided by the total amount of m2 that contributed to this increase of benefits.
• Finally, it is assumed that the resizing costs of pipes would go down by 10% while the other costs will decrease by 2-3% with the 10% rooftop scenario. These assumptions lead to estimations for the avoided costs, which are available in Table D-3 of Appendix D.
Nurmi et al., (2016) results showed that the benefit for storm water management varies between 3.9€ and 9.4€ per m2 of GR, for the city of Helsinki. It can be expected that storm

Re-Thinking Greeen Roof Design
45
water management costs will increase in the future for coastal cities such as Malmö, due to sea level rise and more intense precipitations. To take this factor into consideration, the value of 3.9€ was used as an estimation of the benefit for storm water management in 2020 while 9.4€ was taken as an estimation of how much this benefit could increase by 2070. The increase from 3.9€ to 9.4€ over a 50-year period corresponds to an interest rate of 1.75%. Moreover, it must be noted that Nurmi et al., (2016) calculations rely on values obtained prior to 2016. However, the conversion was only made between the date of publication of the study and 2020. As mentioned previously, the change in the CPI over this time period is 1.029. Taking into consideration the Finnish inflation of 2.9% from 2016 to 2020 results in a benefit of 4.01€ in 2020. Then, if the conversion is made using 10.59 as an exchange rate (see 3.4.2 Calculations methods), the value for storm water management becomes 42.49 SEK/m2. Finally, applying the 1.75% yearly increase, this leads to a benefit of 101.17 SEK/m2 in 2070. Table 4-7 illustrates how the yearly storm water management benefit per m2 of GR varies over time, when a discount rate of 3.5% is applied.
Table 4-7. Yearly storm water management benefit per m2 of GR
Finally, there is growing evidence showing that amending GR substrate with biochar improves the water holding capacity of the roof. Beck, Johnson, & Spolek, (2011) found that soil containing 7% of biochar retained more rainfall water than the control soil which was a mix of gravel, sand, silt, and clay. Their results indicated that biochar retains on average 21.1% of rainfall water compared with 17.8% for the control soil. An even higher estimate was found by Cao et al., (2014) where a maximum increase of 74% in the water holding capacity was achieved by adding 40% of biochar in volume to a 180mm scoria-based green substrate. Their results indicated that the water holding capacity increased with higher proportions of biochar in the substrate, ranging from 10% to 40%. Qianqian et al., (2019) conducted a similar experiment with the assumption that GRs amended with biochar have a higher runoff water retention capacity. They tested two extensive GRs with a 100mm substrate. However, no significant difference was found in the average runoff retention rates between the commercial and the biochar substrate. In light of these diverging results, a precautionary approach was taken, and in the absence of stronger conclusions regarding the superior performance of biochar enriched substrate for the water holding capacity, the same values were used for both the baseline and the prototype.
Energy Savings
Nurmi et al., (2016) used an avoided cost approach to estimate the costs in energy savings for an extensive GR in Helsinki. They make the distinction between the energy used for heating and the energy used for cooling. The impact of GRs on energy reduction is highly dependent on the location, not only because of the meteorological conditions but also in terms of the dominant architectural characteristics and the overall quality of the insulation. Hence, in Sweden and in Finland, the high insulation standards demand that new buildings will be
2016 2020 2021 2022 2023 2024 2025 2070 Total
Benefit (€/m2) 3.9 4.01 4.08 4.15 4.22 4.30 4.37 9.55 326.19
Benefit (SEK/m2) 42.49 43.23 43.99 44.76 45.54 46.34 101.17 3,454.16
Discounted Benefit
(SEK/m2)
42.49 41.77 41.07 40.37 39.69 39.02 18.11 1,460.03

Aziliz Le Rouzo, IIIEE, Lund University
46
equipped with high-quality insulation. In these conditions, the addition of a GR will have a marginal impact on energy savings. However, for older buildings, GRs can have a much larger impact. This aspect could not be taken into consideration in the calculations and the estimates of Nurmi et al., (2016) were used.
The annual savings for cooling and heating are not available in the main text of Nurmi et al., (2016) paper, but additional information is provided in their appendix where the following estimates can be found:
• The annual savings for heating are 1.37 kWh/m2.
• The annual savings for cooling of residential buildings range between 17-25% of 3.25 kWh/m2 which corresponds to either 0.55 kWh/m2 or 0.81 kWh/m2.
• The annual saving for cooling in office buildings corresponds to 10% of 7.25 kWh/m2 which is 0.73 kWh/m2.
These estimates are used in this study, where the annual savings for heating are assumed to be 1.37 kWh/m2, while the conservative estimate for residential buildings of 0.55 kWh/m2 was chosen for annual savings for cooling. It is unclear how energy prices in Sweden will change in the coming 50 years. It could be expected that, with continued energy efficiency and a more sustainable energy mix, prices could decrease in the future. However, the European Commission’s report on energy prices and costs in Europe does not seem to indicate any significant drop in electricity prices on the horizon of 2030 (European Commission, 2019). In addition, a study on energy systems in Sweden suggests that today’s electricity price is below the production cost and that future investments in new production facilities will likely contribute to higher electricity prices in Sweden (The Boston Consulting Group, 2017). Due to the high level of uncertainty regarding the evolution of electricity prices in the coming years, an average over the last 10 years was taken as a conservative estimate.
The average of electricity prices in Malmö over ten years is 43.32 öre/kWh6 (see Table D-4 in Appendix D). To take into account the value added tax of 25%, this value was multiplied by 1.25 which results in 0.5415 SEK/kWh. The annual energy savings for heating are then 0.75 SEK/m2, while the annual energy savings for cooling are 0.30 SEK/m2. This gives a total benefit of 1.04 SEK/m2 yearly which must be then discounted as illustrated in Table 4-12. The social discount rate used for these calculations is 3.5%. Table 4-8 shows that while the energy savings yield a benefit of 1.04 SEK/m2 annually, the NPV of these monetary flows is 25.42 SEK/m2 for the year 2020.
Table 4-8. Yearly energy savings for both the baseline and the prototype, between 2020-2070
2020 2021 2022 2023 2024 2025 2070 Total
Price of Electricity (SEK/kWh) 0.54 0.54 0.54 0.54 0.54 0.54 0.54
Annual Energy Savings (SEK/m2) 1.04 1.04 1.04 1.04 1.04 1.04 1.04 53.02
Discounted Benefit (SEK/m2) 1.04 1.00 0.97 0.94 0.90 0.88 0.19 25.42
6 One krona is subdivided into 100 öre.

Re-Thinking Greeen Roof Design
47
The energy savings are assumed to be the same for the baseline and the prototype. It is unclear whether the prototype would perform better or worse than the baseline in terms of improving the building insulation. Considering that both have the same substrate thickness and approximately the same height, it can be assumed that they would perform similarly.
Improved Aesthetics
Nurmi et al., (2016) study was chosen to estimate the potential benefit derived from improved aesthetics in Malmö, following the wide implementation of GRs. This study was deemed most relevant as it is one of the rare studies that actually quantified this benefit, alongside the fact it took place in the northern European context. The scenic value of small urban areas with a green cover was used as a proxy for their calculations. They performed several scenarios, one of which was deemed most relevant for this study. This scenario assumed a uniform distribution of GRs across Helsinki, with 10% of the central business district covered by GRs. Their assumptions were that GRs would bring value to the areas with the lowest amount of greenery such as the centre town, that the scenic value of GRs would be similar to that of small parks without including the use value, and that the scenic value of GRs would approach zero as supply of green areas increases. Following this reasoning, their results indicate that the estimated benefit varies between 0 and 10€/m2. Considering that GRs, depending on their type and location, may not have as high a benefit as green areas, zero euro was chosen as a lower estimate and 10 euro was chosen as a high estimate (Nurmi et al., 2016).
The scenic value of GR systems can be expected to vary depending on the characteristics of the city in which they are implemented. For example, in a city where there is very little greenery and where the potential for residents to see extensive GRs from their home or work location is high, then it can be expected that the marginal value for the scenic benefits provided by GRs is high. However, in Malmö where green areas are already abundant and where the possibility to have a view over a GR is limited due to the architectural characteristics of the city which comprises few highly-elevated buildings, it can be expected that the marginal value will be lower. Thus, in the context of Malmö, the scenic benefit is considered to be marginal and the conservative value of zero will be used. However, a sensitivity analysis will be performed with the higher bound estimate of 10 €/m2. This value is converted using the exchange rate of 10.59 (see 3.4.2 Calculations methods) and the change in CPI between 2016 and 2020, which leads to a benefit of 185.24SEK/m2.
Finally, it is assumed that there is no difference in terms of the aesthetic benefits between the two GR models. Indeed, the only impact on the aesthetic value that could potentially differ between the baseline and the prototype would come from different species of vegetation establishing over time which could vary because of the different types of substrate. However, this impact would most likely be marginal as well as extremely subjective.
Increased Biodiversity
Few studies attempted to monetise the positive impact of GR implementation on urban biodiversity. Due to the lack of relevant data, this variable was thus excluded from the calculations. However, the impact of a 100mm substrate extensive GR on biodiversity is assumed to be rather limited. Moreover, Gabrych, Kotze, & Lehvävirta, (2016) highlighted that substrate depth, roof age, size and height of GR will determine which plant communities establish overtime. This suggests that the impact of the baseline versus the prototype of biodiversity will most likely differ. Moreover, it also suggests that calculating the increase in biodiversity per m2 of GR would not be relevant as parameters such as height and size of the GR should be taken into account. Thus, while it is likely that the two GR systems have a
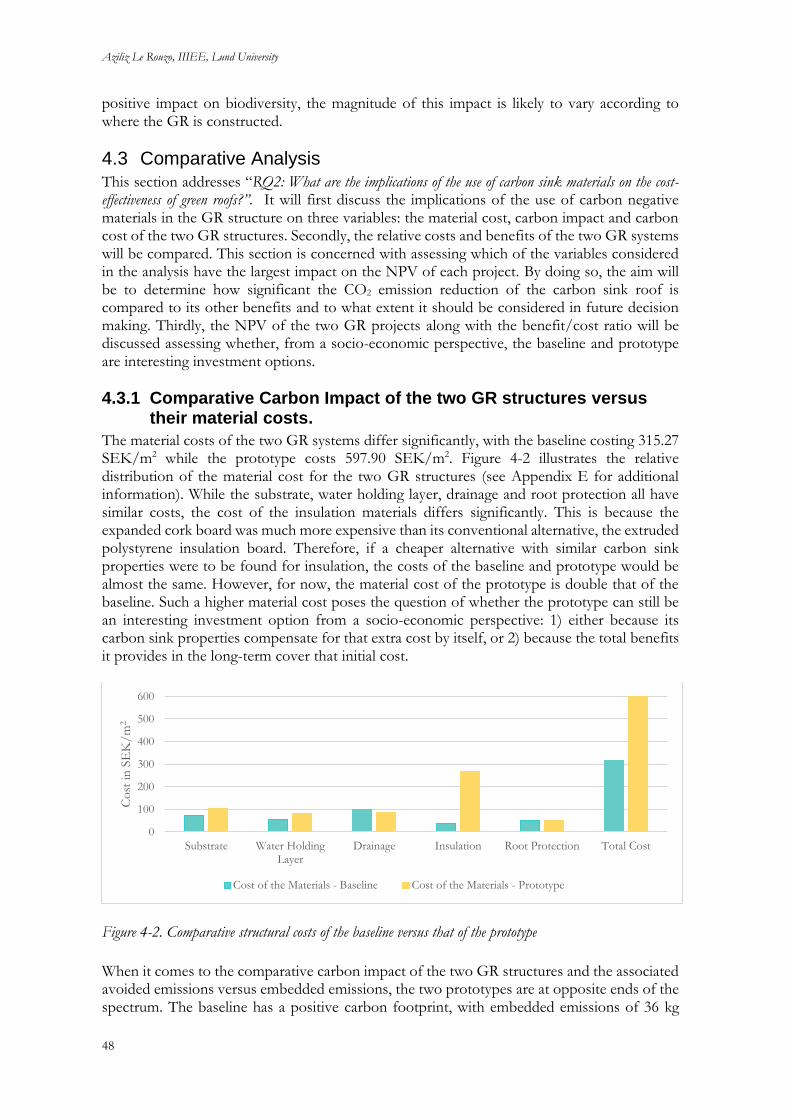
Aziliz Le Rouzo, IIIEE, Lund University
48
positive impact on biodiversity, the magnitude of this impact is likely to vary according to where the GR is constructed.
4.3 Comparative Analysis This section addresses “RQ2: What are the implications of the use of carbon sink materials on the cost-effectiveness of green roofs?”. It will first discuss the implications of the use of carbon negative materials in the GR structure on three variables: the material cost, carbon impact and carbon cost of the two GR structures. Secondly, the relative costs and benefits of the two GR systems will be compared. This section is concerned with assessing which of the variables considered in the analysis have the largest impact on the NPV of each project. By doing so, the aim will be to determine how significant the CO2 emission reduction of the carbon sink roof is compared to its other benefits and to what extent it should be considered in future decision making. Thirdly, the NPV of the two GR projects along with the benefit/cost ratio will be discussed assessing whether, from a socio-economic perspective, the baseline and prototype are interesting investment options.
4.3.1 Comparative Carbon Impact of the two GR structures versus their material costs.
The material costs of the two GR systems differ significantly, with the baseline costing 315.27 SEK/m2 while the prototype costs 597.90 SEK/m2. Figure 4-2 illustrates the relative distribution of the material cost for the two GR structures (see Appendix E for additional information). While the substrate, water holding layer, drainage and root protection all have similar costs, the cost of the insulation materials differs significantly. This is because the expanded cork board was much more expensive than its conventional alternative, the extruded polystyrene insulation board. Therefore, if a cheaper alternative with similar carbon sink properties were to be found for insulation, the costs of the baseline and prototype would be almost the same. However, for now, the material cost of the prototype is double that of the baseline. Such a higher material cost poses the question of whether the prototype can still be an interesting investment option from a socio-economic perspective: 1) either because its carbon sink properties compensate for that extra cost by itself, or 2) because the total benefits it provides in the long-term cover that initial cost.
Figure 4-2. Comparative structural costs of the baseline versus that of the prototype
When it comes to the comparative carbon impact of the two GR structures and the associated avoided emissions versus embedded emissions, the two prototypes are at opposite ends of the spectrum. The baseline has a positive carbon footprint, with embedded emissions of 36 kg
0
100
200
300
400
500
600
Substrate Water HoldingLayer
Drainage Insulation Root Protection Total Cost
Co
st in
SE
K/
m2
Cost of the Materials - Baseline Cost of the Materials - Prototype

Re-Thinking Greeen Roof Design
49
CO2eq/m2. These embedded emissions result in socio-economic costs of 42 SEK/m2 of GR.
Conversely, since the prototype is mostly made of carbon negative materials, excluding the root protection layer, compost and cork granules, its structure stores more emissions than were emitted during its production. This leads to 53 kg CO2
eq/m2 of avoided emissions which correspond to avoided socio-economic costs of 63 SEK/m2. Figure 4-3 highlights that for the prototype, the expanded cork insulation board leads to the highest benefit, followed by the water holding layer, substrate and cork drainage layer, while the root barrier which is made of LDPE incurs a small cost of 0.71 SEK/m2 of GR (see Appendix E). For the baseline, the insulation board also has the highest impact, followed by the substrate, water holding layer, drainage and finally root barrier. It can be observed that the climate footprint of the structure is directly linked to the thickness of the different layers, and thus ultimately, the proportion of the material used in the GR. This suggests that when re-thinking GR design and envisaging the substitution of traditional components, the materials that represent the largest volume should be targeted first.
This reasoning was adopted when designing the prototype, and Figure 4-3 clearly illustrates that the structure of an extensive GR can easily be shifted from a carbon source to a carbon sink. The baseline which has a lower material cost incurs long-term societal damages which represent 12% of the total of material costs and carbon costs of its structure. On the other hand, the prototype has a carbon negative impact, with 53.29 kg CO2
eq stored in every m2 of GR. From an avoidance cost approach this corresponds to avoided damages to society which, in the Swedish context, would have resulted in societal costs of 63.42 SEK/m2. While these avoided emissions do not merely compensate for the difference in price between the baseline and the prototype using an SVC of 1.19 SEK/kg, the sensitivity analysis will reveal to what extent an increase in the SVC changes that conclusion.
Figure 4-3. Climate impact of the structure of the baseline versus the prototype - comparative values in SEK/m2, where positive values represent a benefit and negative values represent a cost
4.3.2 Life cycle CBA results: comparison of the two GR systems
The results obtained in the last sections are summarised in Table 4-9, which displays all the discounted costs and benefits of the two GRs, including the carbon impact of their structure. The last line of Table 4-9 provides the NPV of the two projects, which corresponds to the sum of all the discounted costs and benefits, to the year 2020. It must be noted that this NPV
-50 -30 -10 10 30 50 70
Cost/Benfit of the Climate Impact of the GR structure measured in SEK/m2
Total Root Protection Insulation Drainage Water Holding Layer Substrate
Climate Impact - Prototype
Climate Impact - Baseline

Aziliz Le Rouzo, IIIEE, Lund University
50
considers both private and social costs and benefits of the two GR systems, thus leading to a positive NPV for both projects which would not be the case if the long-term societal benefits had not been considered.
Table 4-9. Present values of the costs & benefits of the baseline versus the prototype
It must be noted that the values on the left are for the baseline, the values in the middle apply both to the baseline and prototype and the values to the left signify a change between the baseline and the prototype. As an example, while the carbon impact of the structure is a cost for the baseline, it is accounted as a benefit for the prototype.
Baseline Prototype
Variable Present Values SEK(2020)/m2
Costs Material Cost of the
Structure
315.27 597.90
Installation Cost 152
Maintenance Cost 145.02
Carbon Impact of the
Structure
42.31
Benefits Carbon Impact of the
Structure
63.42
Reduction in CO2
Emissions
12.5
Improved Air Quality 474.00
Storm water
management
1,460.03 >1,460.03
Energy Savings 25.42
Improved Aesthetics 0
Increased Biodiversity (+) (++)
NPV
SEK(2020)/m2
1,316.96 1,140.07
While the NPV of the two projects is positive, it is important to closely examine the distribution of costs and benefits for each option. Figure 4-4 and Figure 4-5 illustrate the percentage share of the total costs/ benefits for each variable, thus highlighting which variable yields the highest benefit and which variable incurs the highest cost.

Re-Thinking Greeen Roof Design
51
Figure 4-4. Percentage share of the total costs for each variable – total equals 100
Figure 4-5. Percentage share of the total benefits for each variable – total equals 100
Firstly, with regard to the costs, it is clear that for both alternatives the material cost of the structure is most consequent, followed by the installation cost and the maintenance cost which are comparable, while the carbon cost of the structure is lowest. It must also be noted that the carbon impact of the structure is only counted as a cost for the baseline while it is counted as a benefit for the prototype. This cost corresponds to 6% of the total costs for the baseline, which is arguably low. It must however be remembered that while the material, installation and maintenance costs of the GR structure are private costs, the carbon cost of the structure is a societal cost. Thus, these costs do not impact the same actors, nor do they occur at the same point in time or location. Moreover, the cost associated with the carbon footprint of the structure depends on the value attributed to the emissions of CO2 in the atmosphere, which is country-dependent and subject to change over time. The sensitivity of the carbon impact to this parameter will be further discussed in section 4.4.
Secondly, with regard to the benefits, storm water management is the most significant benefit, followed by improved air quality, the avoided CO2 emissions resulting from the carbon
0% 10% 20% 30% 40% 50% 60% 70%
Material Cost of the Structure
Installation Cost
Maintenance Cost
Carbon Impact of the Structure
Percentage share of the total costs for each variable
Baseline Prototype
0% 10% 20% 30% 40% 50% 60% 70% 80%
Carbon Impact of the Structure
Reduction in CO2 Emissions
Improved Air Quality
Storm water management
Energy Savings
Percentage share of the total benefits for each variable
Baseline Prototype
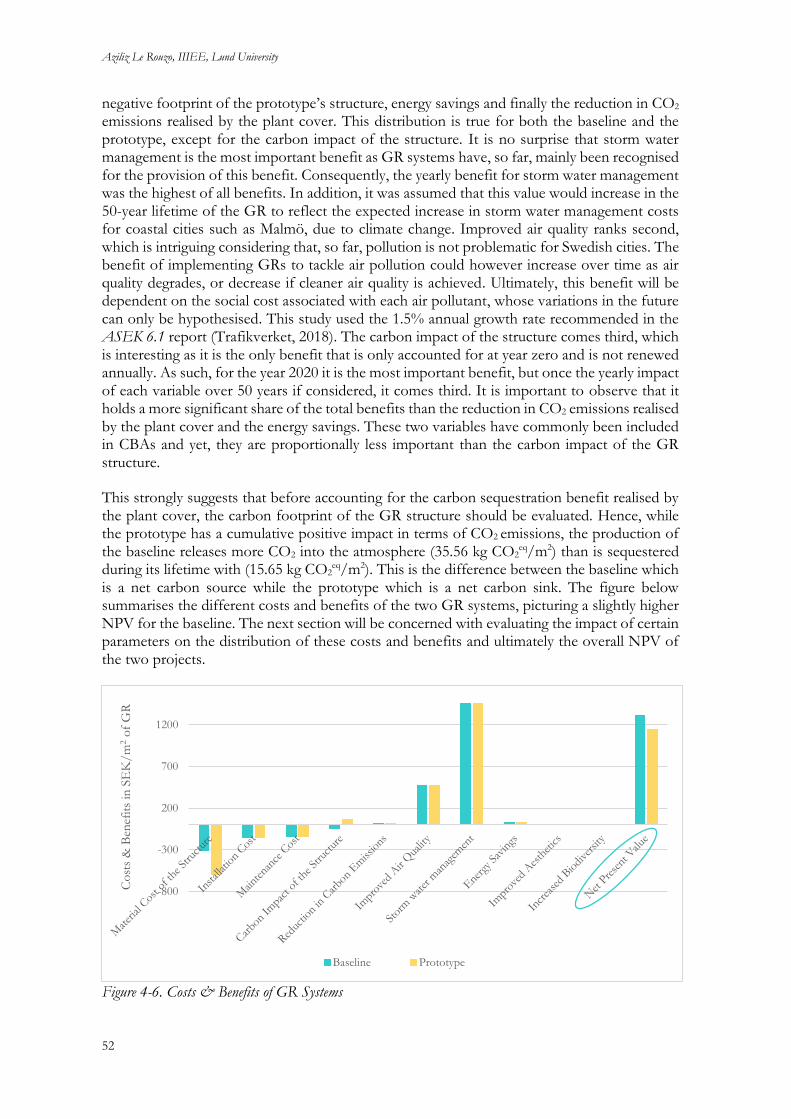
Aziliz Le Rouzo, IIIEE, Lund University
52
negative footprint of the prototype’s structure, energy savings and finally the reduction in CO2
emissions realised by the plant cover. This distribution is true for both the baseline and the prototype, except for the carbon impact of the structure. It is no surprise that storm water management is the most important benefit as GR systems have, so far, mainly been recognised for the provision of this benefit. Consequently, the yearly benefit for storm water management was the highest of all benefits. In addition, it was assumed that this value would increase in the 50-year lifetime of the GR to reflect the expected increase in storm water management costs for coastal cities such as Malmö, due to climate change. Improved air quality ranks second, which is intriguing considering that, so far, pollution is not problematic for Swedish cities. The benefit of implementing GRs to tackle air pollution could however increase over time as air quality degrades, or decrease if cleaner air quality is achieved. Ultimately, this benefit will be dependent on the social cost associated with each air pollutant, whose variations in the future can only be hypothesised. This study used the 1.5% annual growth rate recommended in the ASEK 6.1 report (Trafikverket, 2018). The carbon impact of the structure comes third, which is interesting as it is the only benefit that is only accounted for at year zero and is not renewed annually. As such, for the year 2020 it is the most important benefit, but once the yearly impact of each variable over 50 years if considered, it comes third. It is important to observe that it holds a more significant share of the total benefits than the reduction in CO2 emissions realised by the plant cover and the energy savings. These two variables have commonly been included in CBAs and yet, they are proportionally less important than the carbon impact of the GR structure.
This strongly suggests that before accounting for the carbon sequestration benefit realised by the plant cover, the carbon footprint of the GR structure should be evaluated. Hence, while the prototype has a cumulative positive impact in terms of CO2 emissions, the production of the baseline releases more CO2 into the atmosphere (35.56 kg CO2
eq/m2) than is sequestered during its lifetime with (15.65 kg CO2
eq/m2). This is the difference between the baseline which is a net carbon source while the prototype which is a net carbon sink. The figure below summarises the different costs and benefits of the two GR systems, picturing a slightly higher NPV for the baseline. The next section will be concerned with evaluating the impact of certain parameters on the distribution of these costs and benefits and ultimately the overall NPV of the two projects.
Figure 4-6. Costs & Benefits of GR Systems
-800
-300
200
700
1200
Co
sts
& B
enef
its
in S
EK
/m
2o
f G
R
Baseline Prototype
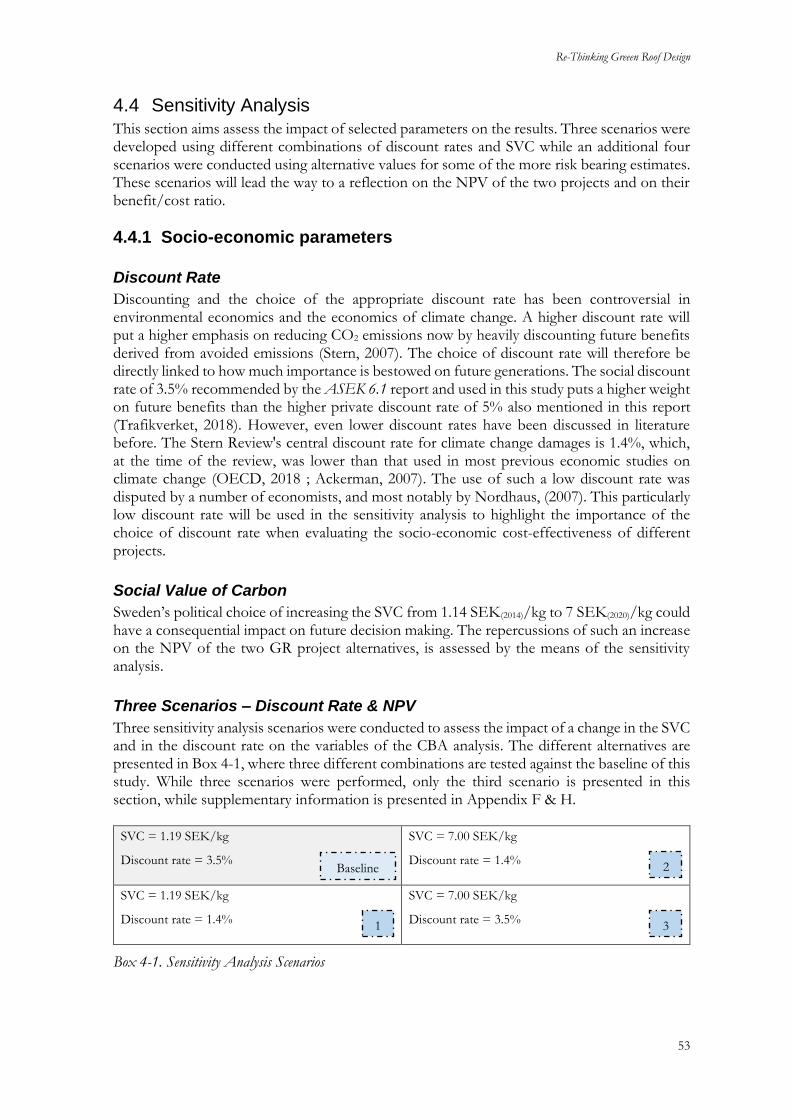
Re-Thinking Greeen Roof Design
53
4.4 Sensitivity Analysis This section aims assess the impact of selected parameters on the results. Three scenarios were developed using different combinations of discount rates and SVC while an additional four scenarios were conducted using alternative values for some of the more risk bearing estimates. These scenarios will lead the way to a reflection on the NPV of the two projects and on their benefit/cost ratio.
4.4.1 Socio-economic parameters
Discount Rate
Discounting and the choice of the appropriate discount rate has been controversial in environmental economics and the economics of climate change. A higher discount rate will put a higher emphasis on reducing CO2 emissions now by heavily discounting future benefits derived from avoided emissions (Stern, 2007). The choice of discount rate will therefore be directly linked to how much importance is bestowed on future generations. The social discount rate of 3.5% recommended by the ASEK 6.1 report and used in this study puts a higher weight on future benefits than the higher private discount rate of 5% also mentioned in this report (Trafikverket, 2018). However, even lower discount rates have been discussed in literature before. The Stern Review's central discount rate for climate change damages is 1.4%, which, at the time of the review, was lower than that used in most previous economic studies on climate change (OECD, 2018 ; Ackerman, 2007). The use of such a low discount rate was disputed by a number of economists, and most notably by Nordhaus, (2007). This particularly low discount rate will be used in the sensitivity analysis to highlight the importance of the choice of discount rate when evaluating the socio-economic cost-effectiveness of different projects.
Social Value of Carbon
Sweden’s political choice of increasing the SVC from 1.14 SEK(2014)/kg to 7 SEK(2020)/kg could have a consequential impact on future decision making. The repercussions of such an increase on the NPV of the two GR project alternatives, is assessed by the means of the sensitivity analysis.
Three Scenarios – Discount Rate & NPV
Three sensitivity analysis scenarios were conducted to assess the impact of a change in the SVC and in the discount rate on the variables of the CBA analysis. The different alternatives are presented in Box 4-1, where three different combinations are tested against the baseline of this study. While three scenarios were performed, only the third scenario is presented in this section, while supplementary information is presented in Appendix F & H.
SVC = 1.19 SEK/kg
Discount rate = 3.5%
SVC = 7.00 SEK/kg
Discount rate = 1.4%
SVC = 1.19 SEK/kg
Discount rate = 1.4%
SVC = 7.00 SEK/kg
Discount rate = 3.5%
Box 4-1. Sensitivity Analysis Scenarios
Baseline
1
2
3
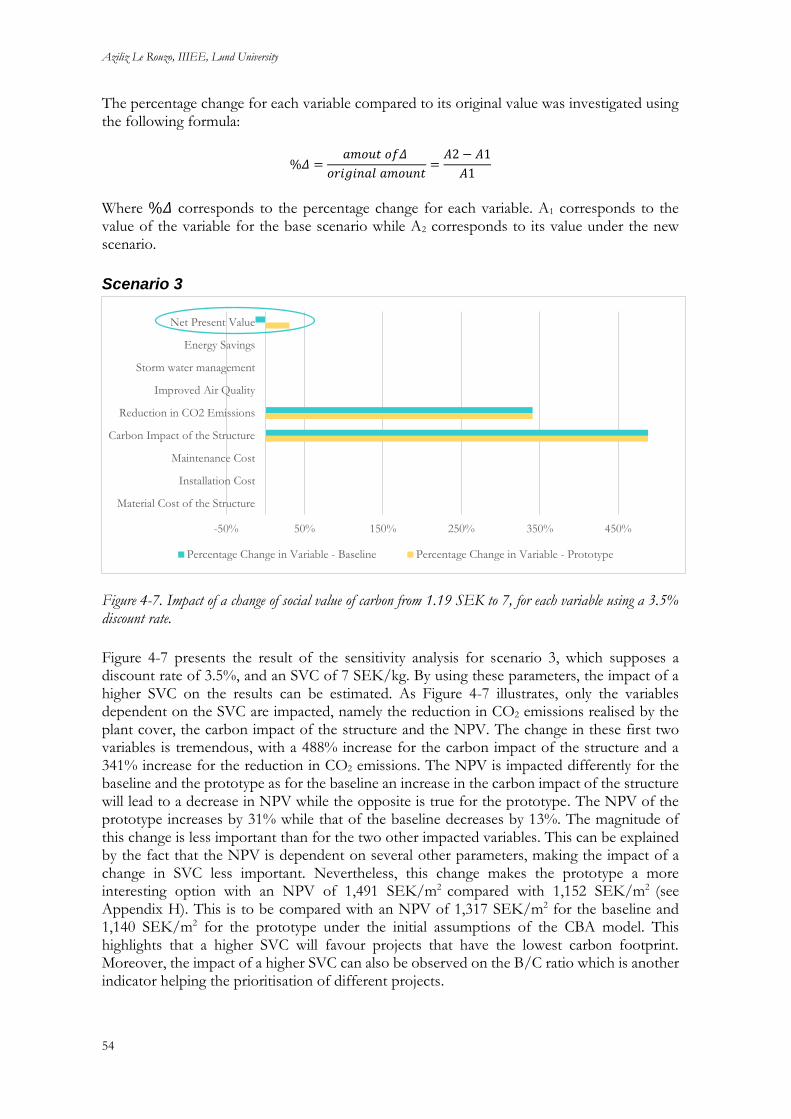
Aziliz Le Rouzo, IIIEE, Lund University
54
The percentage change for each variable compared to its original value was investigated using the following formula:
%𝛥 =𝑎𝑚𝑜𝑢𝑡 𝑜𝑓𝛥
𝑜𝑟𝑖𝑔𝑖𝑛𝑎𝑙 𝑎𝑚𝑜𝑢𝑛𝑡=
𝐴2 − 𝐴1
𝐴1
Where %𝛥 corresponds to the percentage change for each variable. A1 corresponds to the value of the variable for the base scenario while A2 corresponds to its value under the new scenario.
Scenario 3
Figure 4-7. Impact of a change of social value of carbon from 1.19 SEK to 7, for each variable using a 3.5% discount rate.
Figure 4-7 presents the result of the sensitivity analysis for scenario 3, which supposes a discount rate of 3.5%, and an SVC of 7 SEK/kg. By using these parameters, the impact of a higher SVC on the results can be estimated. As Figure 4-7 illustrates, only the variables dependent on the SVC are impacted, namely the reduction in CO2 emissions realised by the plant cover, the carbon impact of the structure and the NPV. The change in these first two variables is tremendous, with a 488% increase for the carbon impact of the structure and a 341% increase for the reduction in CO2 emissions. The NPV is impacted differently for the baseline and the prototype as for the baseline an increase in the carbon impact of the structure will lead to a decrease in NPV while the opposite is true for the prototype. The NPV of the prototype increases by 31% while that of the baseline decreases by 13%. The magnitude of this change is less important than for the two other impacted variables. This can be explained by the fact that the NPV is dependent on several other parameters, making the impact of a change in SVC less important. Nevertheless, this change makes the prototype a more interesting option with an NPV of 1,491 SEK/m2 compared with 1,152 SEK/m2 (see Appendix H). This is to be compared with an NPV of 1,317 SEK/m2 for the baseline and 1,140 SEK/m2 for the prototype under the initial assumptions of the CBA model. This highlights that a higher SVC will favour projects that have the lowest carbon footprint. Moreover, the impact of a higher SVC can also be observed on the B/C ratio which is another indicator helping the prioritisation of different projects.
-50% 50% 150% 250% 350% 450%
Material Cost of the Structure
Installation Cost
Maintenance Cost
Carbon Impact of the Structure
Reduction in CO2 Emissions
Improved Air Quality
Storm water management
Energy Savings
Net Present Value
Percentage Change in Variable - Baseline Percentage Change in Variable - Prototype

Re-Thinking Greeen Roof Design
55
4.4.2 Risk Bearing Values
Four additional scenarios
Some values used in the main analysis involved a certain level of uncertainty. In order to assess to what extent these values could affect the economic outcome of the analysis, a sensitivity analysis was performed using alternative estimates. For instance, the price range for biochar was found to be quite broad. The highest estimate of that bracket, 4,500 SEK/m3, will be used to reflect possibly higher prices associated with a superior quality of biochar. Likewise, the price of the expanded cork insulation board was thought to be particularly high. One potential
explanation could come from the fact that the square metre prices do not reflect the discounted prices when larger quantities are purchased. A lowest price scenario was thus conducted using 60% of the original value, which corresponds to a price of 162 SEK/m2. Finally, the aesthetic benefit was assumed to be null in the case of Malmö, but a tentative value of 185.24 SEK/m2 is used to assess how the inclusion of this benefit can impact the NPV. Finally, a fourth scenario is conducted using these three assumptions simultaneously. All the results are presented in the Appendix H, under the names scenarios 4 to 7.
Figure 4-8. Different scenarios for the risk bearing values (4-7): biochar price, cork price and aesthetic value.
4.4.3 Reflection on NPV
Seven scenarios were conducted to assess the impact of certain parameters on the NPV of the two projects. Figure 4-9 shows that while the use of different assumptions can shift the order of preferability between the baseline and the prototype, in all cases the NPV of the two projects is positive. The NPV of the baseline ranges between 1,152 and 2,455 SEK(2020)/m
2 while the NPV of the prototype ranges between 1,056 and 2,649 SEK(2020)/m
2.
The most profitable scenarios for the baseline and the prototype are scenario 1 and 2, with a discount rate of 1.4%. This shows that giving more weight to future benefits increases the socio-economic value of implementing GRs. However, while for scenario 1 the baseline is the most profitable option, the opposite is true for scenario 2. This comes from the fact that scenario 1 has an SVC of 1.19 SEK/kg while scenario 2 has an SVC of 7 SEK/kg. The only variable responsible for that change is the carbon impact of the structure, which is a cost for the baseline and a benefit for the prototype. Consequently, under scenario 1 this cost/benefit remains the same as for the base scenario while both increase under scenario two.
When it comes to scenario 4 to 7, they all show how uncertain variables can have an impact on the economic outcome of the projects. For these four scenarios however, the baseline remains more profitable than the prototype, but the difference between the two varies. It can be observed that in this case, uncertainty around certain chosen values has a lower impact on the overall economic outcome of the two projects than the choice of discount rate or the choice of SVC.

Aziliz Le Rouzo, IIIEE, Lund University
56
Figure 4-9. Summary of the 7 scenarios for the sensitivity analysis
4.4.4 Reflection on the Benefit/Cost Ratio
A complicated trade-off
Figure 4-10. Comparative Benefit/Cost Ratio of the baseline versus the prototype
Two types of B/C Ratio are depicted in the Figure: 1) the sum of all benefits over the sum of all costs 2) the carbon sink benefit of the structure over its material cost. There two ratios are calculated under two different scenarios for the social value of carbon.
The benefit/cost ratio corresponds to the sum of all the benefits over the sum of all the costs. Figure 4-10 illustrates the impact of a higher SVC on the benefit/cost ratio. Three key elements can be derived from this figure.
• First, it can be observed that when considering the sum of all the benefits over the sum of all the costs both the baseline and the prototype have a benefit/cost ratio over 1,
0
500
1000
1500
2000
2500
3000
b p b p b p b p b p b p b p b p
BaseScenario
1 2 3 4 5 6 7
Net
Pre
sen
t V
alue
(SE
K/
m2 )
Sensitivity Analysis scenarios with "b" for baseline and "p" for prototype

Re-Thinking Greeen Roof Design
57
for each SVC scenario. This means that both projects yield higher benefits than they incurred costs.
• The second observation, however, shows an inversion of preferability between the baseline and the prototype. With an SVC of 1.19 SEK/kg the baseline is the best alternative, while with an SVC of 7 SEK/kg the prototype is preferred. This again highlights the importance that the choice of SVC plays in decision making when considering the two GR alternatives.
• Finally, the most important change can be observed when the sole benefit considered is the carbon impact of the structure over the material cost that structure. While in both cases the benefit/cost ratio is lower than one, a sharp increase from 0.11 to 0.62 can be noted (see Table G-6 of Appendix G). While the material cost of the structure remains higher than the benefit derived from the avoided carbon emissions resulting from the use of carbon sink materials, this benefit/cost ratio highlights that under a 7 SEK/kg scenario, a large proportion of the additional material costs is balanced by the carbon benefit.
The benefit/cost ratio consequently highlights a trade-off between the material cost of the structure and the carbon sink benefit which is exemplified by Figure 4-11 below, which displays the breakdown of this relation (see Appendix G).
Layer by Layer
The difference in material costs between the baseline and the prototype was calculated along with the difference in climate impact under an SVC of 1.19 SEK/kg and 7 SEK/kg. This figure highlights which changes of materials between the baseline and the prototype are most profitable. For example, the drainage layer is a win-win situation as not only its cost is reduced by 12 SEK but its climate benefit increases by 9 SEK/m2 under the 1.19 SEK/kg scenario and by 51 SEK/m2 under the 7 SEK/kg scenario. In addition, while the price of the insulation board was found to be high for the prototype, with an increase of 233 SEK/m2 compared to its polystyrene alternative, the increase in climate benefit of 221 SEK/m2 under the 7 SEK/kg scenario seems to offset that price difference.
Furthermore, an obvious but important observation evidenced by Figure 4-11 is that the material costs do not vary under different SVC scenarios. However, the carbon impact does, leading to significant benefits for the prototype and significant costs for the baseline. In short, Figure 4-11 seems to indicate that from a socio-economic point of view, all the proposed layers of the prototype are worth investing into. In particular, the cork drainage layer is a particularly interesting option compared to its plastic alternative. The water holding layer and substrate mix comprising Biochar, Carbon8, Cork Granules and Compost are the two next preferred alternatives as their cost difference with traditional materials is low and their carbon benefit is significant. Finally, the expanded cork insulation board is the least cost-effective option but its use in a GR can be of potential interest from a socio-economic perspective.

Aziliz Le Rouzo, IIIEE, Lund University
58
Figure 4-11. Change in the material costs and carbon impact of the baseline versus the prototype for each layer
Ideal Material Combination
To further investigate the best material combinations for the prototype, three additional scenarios were conducted (Figure 4-12). Scenario 1 corresponds to the original prototype design without cork, except from the cork granules. Scenario 2 corresponds to the original prototype without the biochar water holding layer. Finally, scenario 3 corresponds to the original prototype without any biochar at all. The specific characteristics of these alternatives are available in Appendix G. These scenarios were performed to better understand the trade-off between the cost of each material and their carbon impact.
What clearly stands out in that figure is the direct link between the price of materials and their carbon sink properties. Hence, if some materials are removed to reach a lower material cost, the carbon sink benefit will in turn be reduced. Furthermore, this figure suggests that the material cost of a carbon sink GR ranges between 376 SEK/m2 and 598 SEK/m2 and cannot be much lower without foregoing its carbon sink benefit. In addition, this figure sheds light on the carbon cost of GRs made from conventional materials such as the baseline.
-250 -150 -50 50 150 250
Substrate
Water Holding Layer
Drainage Layer
Insulation Board
Cost/Benefit in SEK/m2
Change in Material Costs Change in Carbon Impact with SVC=1.19 SEK/kg
Change in Carbon Impact with SVC=7 SEK/kg

Re-Thinking Greeen Roof Design
59
Figure 4-12. Material costs of the prototype versus its carbon sink benefit
Base Scenario compared with Scenario 1,2,3. The base scenario is the main scenario of this study, scenario 1 corresponds to a prototype without cork except from the granules, scenario 2 corresponds to a prototype without a biochar water holding layer and scenario 3 corresponds to a prototype without biochar.
As a result, these findings encourage the replacement of conventional materials in the GR structure with materials that have a reduced or negative carbon footprint. From a socio-economic perspective, the greater number of materials replaced, the better. This substitution is likely to lead to higher material costs which are partly offset by the avoided CO2 emissions stored in the structure. However, while some individual layers are cost-effective, the prototype can only be considered as a cost-effective solution when all the services it provides as a system are considered. Therefore, the life cycle CBA has highlighted that, while the carbon impact of the GR’s structure should be included in decision making, other variables have a greater impact on the overall economic outcome. The most important cost is by far the material cost, while the most important benefit is by far the improved storm water management. While these two variables have the largest impact on the NPV, the sensitivity analysis showed that the use of a higher SVC increases the impact of carbon aspects on the economic outcome of the project. These methodological choices and their potential implications will be further discussed in the next chapter along a broader reflection on the results and their implications for future research.
-600 -500 -400 -300 -200 -100 0 100
Baseline
Prototype
Scenario 1 - Prototype
Scenario 2 - Prototype
Scenario 3 - Prototype
Cost versus Benefit in SEK/m2
Material Cost Carbon Impact

Aziliz Le Rouzo, IIIEE, Lund University
60
5 Discussion The aim of this research was to investigate the implications of the use of carbon sink materials in the GR structure on the socio-economic cost-effectiveness of GR systems. This was investigated through the lens of a life cycle CBA, in which the carbon footprint of two GR structures were incorporated in CBA calculations. Including the carbon footprint of the GR structure into CBA calculations not only shed light on the high carbon footprint of traditional GR structures, but also helped reveal the associated socio-economic costs. Similarly, the use of life cycle CBA highlighted that when a GR structure is composed of materials that have a low carbon footprint or even a negative carbon footprint, this structure can become a carbon sink. The associated avoided CO2 emissions are relatively marginal compared to more important benefits such as storm water management and improved air quality, but nonetheless more important than some other benefits which have been considered in CBA before, such as energy savings and the carbon sequestration from the plant cover. These findings seem to encourage the inclusion of the carbon footprint of GR structures in future decision making and CBA studies. These results are the subject of this chapter, where they are discussed in comparison to previous findings in literature. The methodological and theoretical choices leading to these results are reflected upon, highlighting potential limitations, future prospects and ultimately the generalisability of the findings.
5.1 Overview of the findings and their significance
5.1.1 Carbon footprint of the GR structure – a good estimate?
RQ1) How can the conventional green roof cost-benefit analysis be extended to consider the life cycle carbon profile of the green roof structure?
While the carbon footprint of GR structures was majorly omitted from previous CBAs, its impact was previously investigated in LCA studies. None of these studies were conducted on the exact same GR systems as those under study in this thesis. However, it is possible to compare this study’s findings with LCAs that investigated extensive GRs with similar dimensions and characteristics. This is, of course, only valid for the baseline as, to the best of the author’s knowledge, no LCA study has yet investigated the carbon footprint of a carbon sink GR system.
The findings of this study highlight that the structure of the baseline is a source of carbon with a carbon footprint of 35.6 kg CO2
eq/m2 while the structure of the prototype is a carbon sink with a carbon footprint of -53.3 kg CO2
eq/m2. The carbon footprint of the baseline is comparable to that of previous estimates. Estimations range from 21.1 kg CO2
eq/m2 for Peri et al., (2012), 25.2 kg CO2
eq/m2 for Kuronuma et al., (2018) and from 22.13 kg CO2eq/m2 to
32.23 kg CO2eq/m2 for Bozorg Chenani et al., (2015). While all these estimates are based on
extensive GRs whose substrate differs in depth and for which a range of different materials are used, the estimated values all revolve around 20-30 kg CO2
eq/m2 (see Appendix B). Thus, it seems that the estimated carbon footprint of 35.6 kg CO2
eq/m2 of this study situates itself in a range that is credible. The marginal difference with previous estimates can either be explained by the fact that a full LCA was not conducted and data was derived from EPDs, or by the fact that the baseline comprised materials with a relatively higher carbon footprint than average. However, the obtention of such a similar estimate to previous findings suggests that the estimated carbon footprint of the prototype is close to what a full LCA could achieve. The estimated carbon footprint of -53.3 kg CO2
eq/m2 for the prototype thus provides a first reliable evaluation of how much carbon can be stored in the GR structure, if built with carbon sink materials.
Re-Thinking Greeen Roof Design
61
It must be remembered that the carbon footprint of the recycled light-weight aggregates was assumed to be null due to the lack of data, despite the fact that Carbon8 aggregates are thought to have a carbon negative impact. Therefore, the first estimate of -53.3 kg CO2
eq/m2 could be an underestimation of the carbon sink potential of the prototype. It must also be noted that the prototype constituted a first proposal of what a carbon sink GR could look like. Better information on the carbon footprint of each layer will facilitate the optimisation of different materials to reduce the carbon footprint of the structure. In this prototype, one plastic based component remained, the root protection layer. To create a GR free from plastics, this material should be replaced. This will not only have to be done with consideration to the functional requirements of GRs, but also with an understanding of local regulations such as fire safety requirements which are likely to add additional constraints on the choice of materials. In addition, the delicate trade-off between the additional costs of new materials and the benefit derived from their carbon sink properties will have to be considered when re-thinking GR design. This trade-off is addressed by RQ2, whose results are discussed below.
5.1.2 CBA results – Comparable to previous studies?
RQ2) What are the implications of the use of carbon sink materials on the socio-economic cost-effectiveness of green roofs?
After conducting the life cycle CBA comparing the baseline with the prototype whose structure was almost entirely made from carbon sink materials, the analysis of the results helped answer RQ2. The aim of this comparison was to shed light on the implications of the use of materials with a carbon negative footprint on the socio-economic cost-effectiveness of GRs. The life cycle CBA did not only consider private costs and benefits, but it took into account the long-term societal costs and benefits of GR systems. GRs’ implementation is thus seen from a societal perspective and not from a private perspective where such GRs would not be profitable investments. GRs are instead perceived as a city scale climate mitigation and adaptation strategy, which, in the long term will provide both private and social benefits.
This is confirmed by the positive NPV and benefit/cost ratio presented in Chapter 4 which show that the baseline and the prototype are both interesting investment options from a socio-economic point of view. The CBA however highlighted that the use of carbon sink materials incurred additional material costs which led to a lower NPV compared to the baseline. Nevertheless, the sensitivity analysis demonstrated that when a higher SVC was used, the prototype became a more profitable socio-economic investment than the baseline. In addition, when using a combination of a higher SVC and a lower discount rate, the prototype saw the highest increase in NPV while the baseline saw lower increase in NPV (see Appendix H).
These findings highlight how sensitive the socio-economic aspects are to the choice of parameters, such as the discount rate, the SVC and ultimately the political decisions around the wellbeing of future generations and their environment. This is what makes the comparison of this study’s results with previous findings difficult. Previous CBAs did not necessarily include the same costs and benefits in their model and different values for the socio-economic parameters were used which leads to highly diverging NPVs (Table 5-1). While this study found an NPV of 1,317 SEK/m2 for the baseline and an NPV of 1,140 SEK/m2 for the prototype, Table 5-1 provides previous estimates of the social NPV for different GR projects which range from -560 SEK/m2 at the worst and 35,968 SEK/m2 at the best7. Such a wide range makes the
7 It must be noted that all values were converted using the average exchange rate between 02/01/2019 - 03/01/2020 but no
other conversion was made.

Aziliz Le Rouzo, IIIEE, Lund University
62
comparison with previous findings difficult, and again highlights the impact that the inclusion of certain variables, as well as different parameter values, in decision making can have on the economic outcome of a project.
Table 5-1. Previous findings of the social NPV of extensive GR systems
Study Discount Rate NPV (SEK/m2) Social & Private?
Bianchini & Hewage, (2012b) 2% Base Scenario: 3,784
Worst Scenario: -95
Best Scenario: 35,968
Yes
Claus & Rousseau, (2012) 4% Base Scenario: 407
Worst Scenario: -559.85
Best Scenario: 469
Yes
Nurmi et al., (2016) 3% Between -50 and 401
Likely to be 142
Yes
5.2 Critical reflections and further research
5.2.1 Methodological choices & Incertitude
The methodological choices were supported by an extensive literature review which facilitated the conceptualisation of an analytical framework. This analytical framework rested on the observation that previous CBAs did not consider an important factor, the carbon impact of GR structures. The elaboration of a new analytical framework required the formulation of assumptions along with difficult methodological choices, which implications will be discussed below.
Implications following the choice of scope
The choice of which life cycle steps to include in the model was crucial, but also relied on data availability. The impact of the production of each material was investigated, ranging from raw-material extraction to transport and production. It could have been valuable to include further life cycle steps such as the use and end-of-life of these materials. This study was however based on the data available in EPDs and not enough information was available on these steps. In addition, the inclusion of these steps would have necessitated a full life cycle assessment. While performing a full life cycle assessment could bring additional information for further studies on the topic, when solely considering the production of each material, the use of EPDs has provided similar results to what full LCAs could achieve.
This choice of scope surely has its limitations. The end-of-life phase is crucial in determining whether the carbon stored in the carbon sink materials will be released back to the atmosphere. If the prototype were to be incinerated, all the stored CO2 emissions would be released thus cancelling out all previous societal benefits. It can however be argued that delaying the release of these emissions by 50 years has a certain merit, regardless of whether these stored emissions are released upon reaching the end-of-life. Moreover, there is a lot of uncertainty around the end-of-life of such a GR, which would make the inclusion of this life cycle step particularly challenging. While, from a climate mitigation perspective, it can be argued that preventing these

Re-Thinking Greeen Roof Design
63
emissions to be released back to the atmosphere today will provide some time to reduce global CO2 emissions, the alternative argument can also be used. If a sharp reduction in global CO2 emissions is not observed in the coming 50 years, is it likely that the SVC will in fact increase. In that case, the release of these emissions in 50 years-time rather than now will have a more detrimental effect on global wellbeing.
On the other hand, the prototype is also made from materials that can be reused or recycled. It can thus be hypothesised that if such GRs were to be built as a climate mitigation and adaptation instrument, upon reaching their end-of-life the most sustainable end-of-life alternative would be chosen. There is, however, no assurance that the best or the worst alternative would apply, and while the expected lifespan of a GR revolves around 50 years, this also depends on the lifetime of the building upon which it is built. This study, as most previous CBAs, viewed GRs as separate systems from the building envelope in which they belong. However, depending on whether GRs are built on new buildings or old buildings, the need for renovation can require the whole GR to be replaced before it reaches its optimal lifespan. In addition, by considering GRs and buildings as two separate systems the additional costs and environmental impacts associated with building a structure that can support the extra weight of a GR were not taken into account. Hence, if the whole building system was to be considered, the proportional cost and environmental impact of the GR system compared to that of the overall building would not bear the same significance.
Uncertainty around the variability of prices
One additional element to bear in mind is the uncertainty around the evolution of the price of certain materials. On a 50 years time scale, the price of certain materials might vary a lot due to various factors such as reaching economies of scale, or increased pressures from the environment that will make the material scarcer. Cork seems to show a certain level of risk in that regard. Not only is it not a material that shows a great potential to be scaled up, but in addition increased climate pressures are likely to make cork products scarcer and more expensive. One important point to consider when looking at the materials used in the protype is that their use is most likely sustainable on a small scale, but there is a large degree of uncertainty when it comes to scaling them up. This is, however, a common problem that is encountered in various fields and that pushes for the implementation of small-scale and context specific solutions.
Data Transfer Shortcomings
Another shortcoming of this study comes from the fact that data transfer had to be used due to the lack of case specific data. While data transfer was performed using the best estimates available, to achieve more accurate results case specific data should have been generated prior to the calculations. This was however not possible in the case of the prototype as such a type of GR has never been tested and empirical data was non-existent.
How to Understand a CBA
While this can be perceived as a limitation of CBA, it must be remembered that CBA serves as a decision support tool. The use of CBA does not prove that one alternative is with absolute certainty better than another. It rather provides an estimate of which alternative is most desirable in a certain context, under a certain time frame and for a certain category of actors, as demonstrated with the use of different discount rates.
Climate Mitigation Perspective

Aziliz Le Rouzo, IIIEE, Lund University
64
In the context of climate change mitigation, looking only at the carbon footprint of materials is justified. Projects can be prioritised looking primarily at their carbon footprint. However, this type of analysis does not give any indication on the other life cycle impacts of these materials. Hence, depending on the context, it might be necessary to not only prioritise materials in terms of their carbon footprint but also in terms of other life cycle impact categories such as water consumption and eutrophication potential, and other air pollutants to name a few. These impacts might however be problematic as they pose challenges in terms of comparability between the different categories. In the wake of Sweden’s goal to achieve carbon neutrality however, considering the carbon footprint of the GR structure in CBA is a first step to achieve more informed decision making.
5.2.2 Own Contribution & Future Prospects
Previous studies investigated the costs and benefits associated with GR systems using CBA while the carbon footprint of GRs was assessed using an LCA approach. However, and to the best of the author’s knowledge, no other study adopted an approach where the carbon footprint of GR layers was incorporated in the calculations of a CBA. Yao et al., (2018) did monetise the carbon footprint of a 1,372m2 GR, but no information was given regarding the impact of individual GR layers nor was the impact of the use of carbon sink materials investigated. This study is therefore novel and brings a new perspective on the carbon impact of the GR structure and its associated costs and benefits. It provides a clear indication of which layers in the GR structure have the highest carbon footprint and should ideally be substituted. In addition, it proposes a GR prototype in which carbon negative materials were used. The impact of these materials on the carbon footprint of the GR structure is assessed, along with the additional material costs and overall socio-economic cost-effectiveness of this GR system. While the potential implications of this new GR design on the traditional ecosystem services provided by GRs was reflected upon, too little data prevented its inclusion in the calculations.
In short, this thesis contributed to advancing research by answering the originally posed questions which addressed the lack of research around the carbon impact of the GR structure and its potential inclusion in decision making. The elaboration of an analytical framework incorporating this impact complemented the few previous attempts to include life cycle impacts in CBA. By doing so, this study proposes an analytical framework with which to investigate the carbon impact of other types of GR systems along the other costs and benefits that arise from their implementation. This will serve as a strong basis for future decision making while providing detailed information which can guide the design of carbon sink GRs. In order to provide an idea of the socio-economic implications that the implementation of a carbon sink GR could have instead of a GR which acts as a source of carbon, various scenarios were conducted.
Scenario at the city scale of Malmö
After revealing the potential of GRs to act as a carbon sink, it is interesting to scale up the results. While it is difficult to picture what the avoidance of 53.3 kg CO2
eq/m2 of GRs represents, let us ask ourselves what these savings could mean for a city like Malmö. To provide an overview of what various degrees of implementation of the baseline and the prototype could mean for the city of Malmö, three scales are tested:
- 100m2 green roof - 29,652m2 of municipally administrated buildings covered by existing GRs - 2,485,359m2 representing a hypothetical scenario based on the example of
Augustenborg
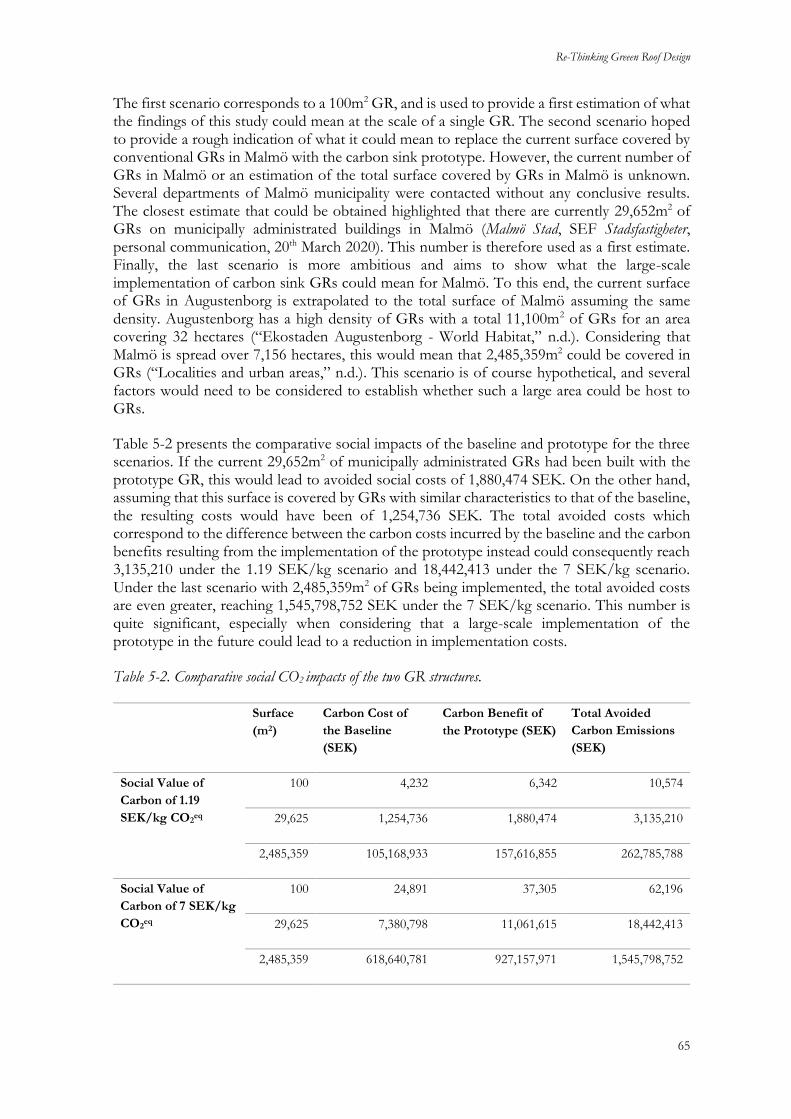
Re-Thinking Greeen Roof Design
65
The first scenario corresponds to a 100m2 GR, and is used to provide a first estimation of what the findings of this study could mean at the scale of a single GR. The second scenario hoped to provide a rough indication of what it could mean to replace the current surface covered by conventional GRs in Malmö with the carbon sink prototype. However, the current number of GRs in Malmö or an estimation of the total surface covered by GRs in Malmö is unknown. Several departments of Malmö municipality were contacted without any conclusive results. The closest estimate that could be obtained highlighted that there are currently 29,652m2 of GRs on municipally administrated buildings in Malmö (Malmö Stad, SEF Stadsfastigheter, personal communication, 20th March 2020). This number is therefore used as a first estimate. Finally, the last scenario is more ambitious and aims to show what the large-scale implementation of carbon sink GRs could mean for Malmö. To this end, the current surface of GRs in Augustenborg is extrapolated to the total surface of Malmö assuming the same density. Augustenborg has a high density of GRs with a total 11,100m2 of GRs for an area covering 32 hectares (“Ekostaden Augustenborg - World Habitat,” n.d.). Considering that Malmö is spread over 7,156 hectares, this would mean that 2,485,359m2 could be covered in GRs (“Localities and urban areas,” n.d.). This scenario is of course hypothetical, and several factors would need to be considered to establish whether such a large area could be host to GRs.
Table 5-2 presents the comparative social impacts of the baseline and prototype for the three scenarios. If the current 29,652m2 of municipally administrated GRs had been built with the prototype GR, this would lead to avoided social costs of 1,880,474 SEK. On the other hand, assuming that this surface is covered by GRs with similar characteristics to that of the baseline, the resulting costs would have been of 1,254,736 SEK. The total avoided costs which correspond to the difference between the carbon costs incurred by the baseline and the carbon benefits resulting from the implementation of the prototype instead could consequently reach 3,135,210 under the 1.19 SEK/kg scenario and 18,442,413 under the 7 SEK/kg scenario. Under the last scenario with 2,485,359m2 of GRs being implemented, the total avoided costs are even greater, reaching 1,545,798,752 SEK under the 7 SEK/kg scenario. This number is quite significant, especially when considering that a large-scale implementation of the prototype in the future could lead to a reduction in implementation costs.
Table 5-2. Comparative social CO2 impacts of the two GR structures.
Surface
(m2)
Carbon Cost of
the Baseline
(SEK)
Carbon Benefit of
the Prototype (SEK)
Total Avoided
Carbon Emissions
(SEK)
Social Value of
Carbon of 1.19
SEK/kg CO2eq
100 4,232 6,342 10,574
29,625 1,254,736 1,880,474 3,135,210
2,485,359 105,168,933 157,616,855 262,785,788
Social Value of
Carbon of 7 SEK/kg
CO2eq
100 24,891 37,305 62,196
29,625 7,380,798 11,061,615 18,442,413
2,485,359 618,640,781 927,157,971 1,545,798,752

Aziliz Le Rouzo, IIIEE, Lund University
66
Image 5-1. Extensive GRs in Lund – High Density Example
Credit: Lars Hansson
In short, these three scenarios illustrate how different scales of implementation of the baseline or the prototype could lead to socio-economic costs in the first case and socio-economic benefits in the other. When envisaging the implementation of GRs in the future, Table 5-2 shows a clear preference towards the prototype with its reduced carbon footprint.
5.2.3 Generalisability
Theoretically, the GR prototype is interesting from a carbon neutrality point of view. However, it must be noted that it has not been tested and its technical capacities are yet to be demonstrated. While, in theory, this prototype could be implemented in any country, it must be noted that the national fire safety regulations might not tolerate the implementation of a GR with such a high organic content. In addition, the implementation of a GR with such a high organic content is susceptible to require extra irrigation in the future, due to the increased frequent of dry episodes. Finally, in the Swedish context where GRs are relatively well-established, comparing two different GR systems from a carbon footprint point of view was justified. However, in countries where GRs are not yet commodified, a first step would be to compare a GR alternative with a normal roof.

Re-Thinking Greeen Roof Design
67
6 Conclusions
6.1 Summary GRs are recognised as an essential contribution to greening cities while providing a range of services to society such as storm water management, energy savings, improved air quality and increased biodiversity amongst others. While they provide well known services to society, the profitability of their implementation has long been investigated through the lens of private actors’ interests only. Gradually, decision support tools such as CBA have investigated their implementation by considering the long-term impact they can have, not only on private actors, but also on society’s overall wellbeing. While several of the ES they provide have been investigated, too little attention has been given to the indirect environmental and social impacts from their production, the characteristics of their structure layers and at their end-of-life. More specifically, one aspect omitted from most studies is the carbon impact of their structure and the related socio-economic costs induced by components that have a high carbon footprint. While the carbon footprint of GRs had been investigated in LCA before, the associated socio-economic cost was omitted from the vast majority of CBA studies. In addition, while growing attention was given to using more sustainable materials in the GR structure, no other study proposed a carbon sink structure in which the carbon impact of every single layer was investigated.
This thesis was focused on developing an analytical framework which would allow the inclusion of the socio-economic impact of the GR structure in CBA. An in-depth literature review supported the elaboration of this framework which was then applied to a comparison between two extensive GRs. The use of a life cycle CBA allowed for the comparison of a baseline made from conventional materials with an experimental prototype almost entirely made from carbon negative materials. This analysis was conducted to reveal the implications of the use of carbon sink materials in the GR structure on the overall cost-effectiveness of the whole system, as well as the carbon cost-effectiveness of structure layers. As such, the impact of the carbon footprint of the structure was assessed in comparison to some other costs and benefits associated with GRs. In short, this research was designed to highlight the implications of a conventional structure which is a source of carbon versus a novel carbon sink structure on the socio-economic profitability of GRs. The key findings of this study can be summarised as follows:
• Firstly, while the carbon impact of the structure was found to be less consequent than other variables considered in CBA, this study shows that its impact is not marginal and should thus be considered in future studies.
• Secondly, an important distinction between the baseline and the prototype is that the baseline is a source of carbon and its structure incurs socio-economic costs of 42 SEK/m2 of GR, while the prototype is a sink of carbon and its structure corresponds to an avoided socio-economic cost of 63 SEK/m2. This corresponds to total avoided carbon costs of 105 SEK/m2 which would be even greater under an SVC of 7 SEK/kg.
• Thirdly, while the substitution of conventional materials incurs higher material costs in most cases, there is room for win-win situations. The cork drainage layer, for example, is cheaper than its plastic based alternative and yields an important benefit in terms of its carbon impact. On the other hand, even materials that have a high material cost such as the expanded cork board seem to be of potential interest from a socio-economic perspective as they allow for a sharp reduction in the carbon footprint of the structure.

Aziliz Le Rouzo, IIIEE, Lund University
68
• Finally, from a CO2 mitigation perspective it is crucial that cities such as Malmö would invest in GR designs that have a lower carbon impact. This study showed that there are different ways to lower the carbon footprint of the GR structure and that a carbon sink design can easily be achieved. It must however be noted that despite the high carbon footprint of conventional GR structures, the multiple ES they provide still make them an interesting investment option from a socio-economic perspective. What this study suggests however, is that by using carbon sink materials, GRs can not only act as a climate adaptation solution in cities, but also that their carbon mitigation potential can be improved.
Overall, this thesis developed an analytical framework which allowed for the integration of the carbon impact of GRs’ structure in CBA and tested it on two GR systems. When it comes to the carbon footprint of conventional GRs, the findings are consistent with prior research. This research brings novelty by providing an assessment of the carbon footprint of a carbon sink structure. In addition, not only is the carbon impact of these two structures quantified, but it is also monetised and assessed alongside other costs and benefits provided by GRs. By doing so, this research encourages novel GR designs and provides a framework for better informed decision making.
6.2 Recommendations for future research The analytical framework developed in this thesis is intended to help future research further investigate the carbon impact of GR systems along with the broader socio-economic costs and benefits resulting from their implementation. The discussion opened the way to several areas that future research could expand upon.
First, while the material costs and carbon impact of the baseline and prototype were compared, too little research was available to allow for the comparison of the other variables. While there is growing evidence suggesting that the use of biochar in the substrate improves storm water management, inconsistent results highlighted the need for further research. In addition, since the design of the prototype is a novel idea its performance in terms of insulation, carbon sequestration, and improved air quality to name a few, was assumed to be the same as that of a conventional roof. It is important for further research to investigate whether this is the case, especially if similar designs, including other substitute layers, are to be implemented in the future. Thus, future studies could expand the analytical framework to test whether the prototype is only better than the baseline from a carbon mitigation perspective or if it also provides additional benefits.
Another way for future research to use the analytical framework developed in this thesis while broadening its scope would be to include the use phase, and more importantly the end-of-life phase of the life cycle. As mentioned in the discussion, the end-of-life could play a large role in the either releasing the CO2 emissions stored in the structure of the GR or in retaining them from being emitted for even longer. As there is a large share of uncertainty around the end-of-life of GRs, future research should further investigate potential scenarios and their implications on the socio-economic cost-effectiveness of GRs.
In addition, this study proposes a novel GR design which uses uncommon materials such as biochar, cork and Carbon8. These materials were chosen because of their carbon sink potential, low impact on the environment and availability in Sweden. However, there is a need to re-think GR design globally to eliminate the use of plastic based component and this should be done taking into consideration the constraints of each location. The socio-economic cost-

Re-Thinking Greeen Roof Design
69
effectiveness of each material is likely to vary from country to country and novel designs should be investigated in different contexts.
Finally, while this research strongly suggests that from a socio-economic perspective a carbon sink GR could be an interesting investment option for cities such as Malmö such a prototype comes with higher material costs which would most likely discourage private investors. Thus, future research should investigate how governmental incentives such as market-based instruments or public procurement could give further incentives for private actors to invest in GR systems that have a lower carbon footprint.
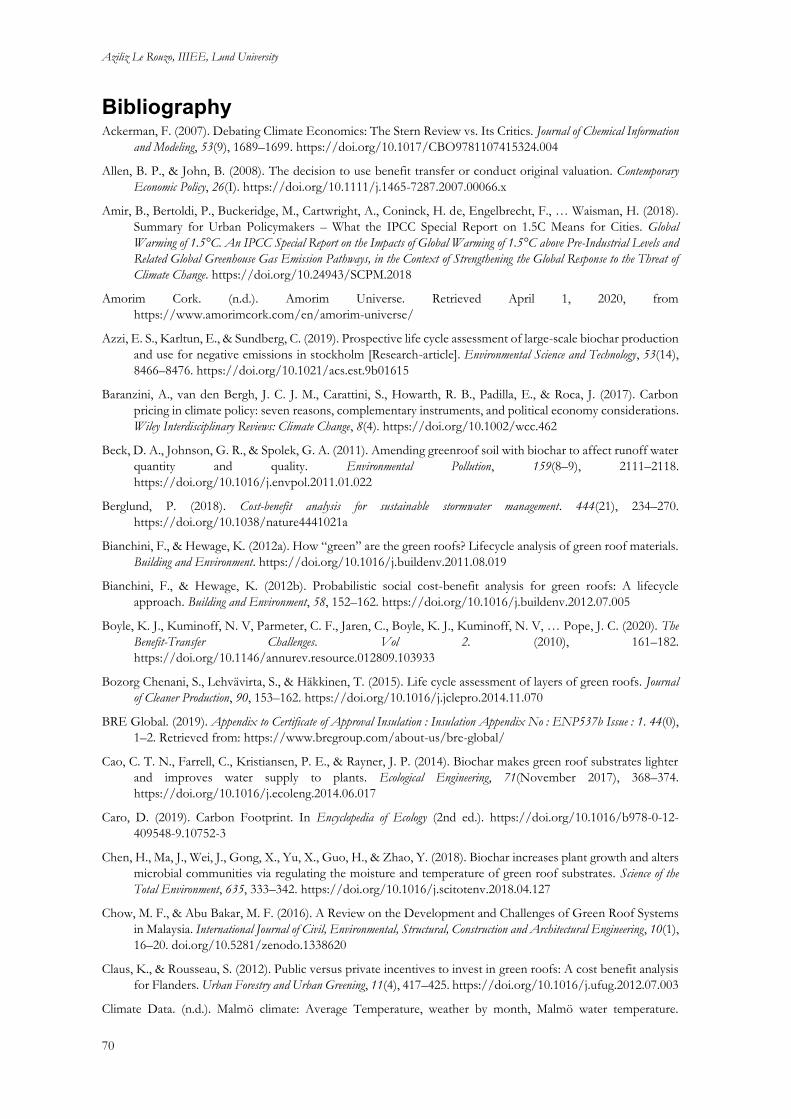
Aziliz Le Rouzo, IIIEE, Lund University
70
Bibliography Ackerman, F. (2007). Debating Climate Economics: The Stern Review vs. Its Critics. Journal of Chemical Information
and Modeling, 53(9), 1689–1699. https://doi.org/10.1017/CBO9781107415324.004
Allen, B. P., & John, B. (2008). The decision to use benefit transfer or conduct original valuation. Contemporary
Economic Policy, 26(I). https://doi.org/10.1111/j.1465-7287.2007.00066.x
Amir, B., Bertoldi, P., Buckeridge, M., Cartwright, A., Coninck, H. de, Engelbrecht, F., … Waisman, H. (2018).
Summary for Urban Policymakers – What the IPCC Special Report on 1.5C Means for Cities. Global
Warming of 1.5°C. An IPCC Special Report on the Impacts of Global Warming of 1.5°C above Pre-Industrial Levels and
Related Global Greenhouse Gas Emission Pathways, in the Context of Strengthening the Global Response to the Threat of
Climate Change. https://doi.org/10.24943/SCPM.2018
Amorim Cork. (n.d.). Amorim Universe. Retrieved April 1, 2020, from
https://www.amorimcork.com/en/amorim-universe/
Azzi, E. S., Karltun, E., & Sundberg, C. (2019). Prospective life cycle assessment of large-scale biochar production
and use for negative emissions in stockholm [Research-article]. Environmental Science and Technology, 53(14),
8466–8476. https://doi.org/10.1021/acs.est.9b01615
Baranzini, A., van den Bergh, J. C. J. M., Carattini, S., Howarth, R. B., Padilla, E., & Roca, J. (2017). Carbon
pricing in climate policy: seven reasons, complementary instruments, and political economy considerations.
Wiley Interdisciplinary Reviews: Climate Change, 8(4). https://doi.org/10.1002/wcc.462
Beck, D. A., Johnson, G. R., & Spolek, G. A. (2011). Amending greenroof soil with biochar to affect runoff water
quantity and quality. Environmental Pollution, 159(8–9), 2111–2118.
https://doi.org/10.1016/j.envpol.2011.01.022
Berglund, P. (2018). Cost-benefit analysis for sustainable stormwater management. 444(21), 234–270.
https://doi.org/10.1038/nature4441021a
Bianchini, F., & Hewage, K. (2012a). How “green” are the green roofs? Lifecycle analysis of green roof materials.
Building and Environment. https://doi.org/10.1016/j.buildenv.2011.08.019
Bianchini, F., & Hewage, K. (2012b). Probabilistic social cost-benefit analysis for green roofs: A lifecycle
approach. Building and Environment, 58, 152–162. https://doi.org/10.1016/j.buildenv.2012.07.005
Boyle, K. J., Kuminoff, N. V, Parmeter, C. F., Jaren, C., Boyle, K. J., Kuminoff, N. V, … Pope, J. C. (2020). The
Benefit-Transfer Challenges. Vol 2. (2010), 161–182. https://doi.org/10.1146/annurev.resource.012809.103933
Bozorg Chenani, S., Lehvävirta, S., & Häkkinen, T. (2015). Life cycle assessment of layers of green roofs. Journal
of Cleaner Production, 90, 153–162. https://doi.org/10.1016/j.jclepro.2014.11.070
BRE Global. (2019). Appendix to Certificate of Approval Insulation : Insulation Appendix No : ENP537b Issue : 1. 44(0),
1–2. Retrieved from: https://www.bregroup.com/about-us/bre-global/
Cao, C. T. N., Farrell, C., Kristiansen, P. E., & Rayner, J. P. (2014). Biochar makes green roof substrates lighter
and improves water supply to plants. Ecological Engineering, 71(November 2017), 368–374.
https://doi.org/10.1016/j.ecoleng.2014.06.017
Caro, D. (2019). Carbon Footprint. In Encyclopedia of Ecology (2nd ed.). https://doi.org/10.1016/b978-0-12-
409548-9.10752-3
Chen, H., Ma, J., Wei, J., Gong, X., Yu, X., Guo, H., & Zhao, Y. (2018). Biochar increases plant growth and alters
microbial communities via regulating the moisture and temperature of green roof substrates. Science of the
Total Environment, 635, 333–342. https://doi.org/10.1016/j.scitotenv.2018.04.127
Chow, M. F., & Abu Bakar, M. F. (2016). A Review on the Development and Challenges of Green Roof Systems
in Malaysia. International Journal of Civil, Environmental, Structural, Construction and Architectural Engineering, 10(1),
16–20. doi.org/10.5281/zenodo.1338620
Claus, K., & Rousseau, S. (2012). Public versus private incentives to invest in green roofs: A cost benefit analysis
for Flanders. Urban Forestry and Urban Greening, 11(4), 417–425. https://doi.org/10.1016/j.ufug.2012.07.003
Climate Data. (n.d.). Malmö climate: Average Temperature, weather by month, Malmö water temperature.

Re-Thinking Greeen Roof Design
71
Retrieved April 6, 2020, from https://en.climate-data.org/europe/sweden/skane-laen/malmoe-382/
CO2Chem. (2018). Mineralization Worked Examples for the TEA and LCA Guidelines for CO2 Utilization. CO2Chem
Media & Publishing Ltd.
Czemiel Berndtsson, J. (2010). Green roof performance towards management of runoff water quantity and
quality: A review. Ecological Engineering, 36(4), 351–360. https://doi.org/10.1016/j.ecoleng.2009.12.014
Demertzi, M., Paulo, J. A., Faias, S. P., Arroja, L., & Dias, A. C. (2018). Evaluating the carbon footprint of the
cork sector with a dynamic approach including biogenic carbon flows. International Journal of Life Cycle
Assessment, 23(7), 1448–1459. https://doi.org/10.1007/s11367-017-1406-8
Demertzi, M., Sierra-Pérez, J., Paulo, J. A., Arroja, L., & Dias, A. C. (2017). Environmental performance of
expanded cork slab and granules through life cycle assessment. Journal of Cleaner Production, 145, 294–302.
https://doi.org/10.1016/j.jclepro.2017.01.071
Dorst, H., van der Jagt, A., Raven, R., & Runhaar, H. (2019). Urban greening through nature-based solutions –
Key characteristics of an emerging concept. Sustainable Cities and Society, 49(January), 101620.
https://doi.org/10.1016/j.scs.2019.101620
Dushkova, D., & Haase, D. (2020). Not simply green: Nature-based solutions as a concept and practical approach
for sustainability studies and planning agendas in cities. Land, 9(1). https://doi.org/10.3390/land9010019
E.ON. (2020). Prisutveckling för rörligt pris indelat i Sveriges elområden. 2020. Retrieved from: https://www.eon.se/
EBC (2012). (2015). European Biochar Certificate - Guidelines for a Sustainable Production of Biochar’. European
Biochar Foundation (EBC), Arbaz, Switzerland. Version 6.1 of 19th June, (June), 1–22.
https://doi.org/10.13140/RG.2.1.4658.7043
Ekostaden Augustenborg - World Habitat. (n.d.). Retrieved May 22, 2020, from https://www.world-
habitat.org/world-habitat-awards/winners-and-finalists/ekostaden-augustenborg/#award-content
Emilsson, T. (2006). Extensive Vegetated Roofs in Sweden: Establishment, Development and Environmental
Quality. Faculty of Landscape Planning, Horticulture and Agricultural Science Department of Landscape
Management and Horticultural Technology Alnarp. Doctoral Thesis at Swedish University of Agricultural
Sciences Uppsala 2005. https://pub.epsilon.slu.se/1088/1/Tobias_Emilsson_epsilon.pdf
EPD. (n.d.). What is an EPD? - The International EPD® System. Retrieved February 21, 2020, from
https://www.environdec.com/What-is-an-EPD/
European Commission. (2019). Energy prices and costs in Europe. Retrieved from:
https://ec.europa.eu/energy/sites/ener/files/documents/epc_report_final.pdf
European Environmental Agency. (2019). Carbon Sequestration. Retrieved from:
https://www.eea.europa.eu/help/glossary/eea-glossary/carbon-sequestration
Finansdepartementet. (2019). Beräkningskonventioner 2020. Retrieved from:
https://www.regeringen.se/4ad5e6/contentassets/eab5f519d5ad4ade95b02390c700b2ff/berakningskonv
entioner-2020.pdf
Finnish Meteorological Institute. (n.d.). Statistics from 1961 onwards. Retrieved April 6, 2020, from
https://en.ilmatieteenlaitos.fi/statistics-from-1961-onwards
FLL. (2018). Guidelines for the Planning, Construction and Maintenance of Green Roofs.
Gabrych, M., Kotze, D. J., & Lehvävirta, S. (2016). Substrate depth and roof age strongly affect plant abundances
on sedum-moss and meadow green roofs in Helsinki, Finland. Ecological Engineering, 86, 95–104.
https://doi.org/10.1016/j.ecoleng.2015.10.022
Gasparatos, A., & Scolobig, A. (2012). Choosing the most appropriate sustainability assessment tool. Ecological
Economics, 80, 1–7. https://doi.org/10.1016/j.ecolecon.2012.05.005
Ghinea, C., & Gavrilescu, M. (2010). Decision support models for solid waste management - An overview.
Environmental Engineering and Management Journal, 9(6), 869–880. https://doi.org/10.30638/eemj.2010.116
GRO. (2011). The GRO Green Roof Code: Green roof code of Best Pratice for the UK. 25. Retrieved from
http://www.nfrc.co.uk/docs/initiatives/grogreenroofcodeuk2011online.pdf?sfvrsn=0

Aziliz Le Rouzo, IIIEE, Lund University
72
Hamedani, S. R., Kuppens, T., Malina, R., Bocci, E., Colantoni, A., & Villarini, M. (2019). Life cycle assessment
and environmental valuation of biochar production: Two case studies in Belgium. Energies, 12(11), 1–21.
https://doi.org/10.3390/en12112166
Heusinger, J., & Weber, S. (2017). Extensive green roof CO2 exchange and its seasonal variation quantified by
eddy covariance measurements. Science of the Total Environment, 607–608, 623–632.
https://doi.org/10.1016/j.scitotenv.2017.07.052
Hoogmartens, R., Van Passel, S., Van Acker, K., & Dubois, M. (2014). Bridging the gap between LCA, LCC and
CBA as sustainability assessment tools. Environmental Impact Assessment Review, 48, 27–33.
https://doi.org/10.1016/j.eiar.2014.05.001
IBU. (n.d.). EPD Programm. Retrieved February 27, 2020, from https://ibu-epd.com/epd-programm/
IEAGHG. (2016). Review of GHG Accounting Rules for CCS. Accountancy (1995), 116(1228), 93.
https://ieaghg.org/docs/General_Docs/Reports/2016-TR3.pdf
Institut Bauen und Umwelt. (2018). Environmental Product Declaration. Sustainaspeak, 106–107.
https://doi.org/10.4324/9781315270326-75
Institut Bauen und Umwelt, & Ibu, V. (2016). PonsBlock - Environmental Product Declaration. Retrieved from:
https://ibu-epd.com/
International Biochar Innitiative. (n.d.). Biochar Carbon Offset Methodology. Retrieved March 6, 2020, from
https://biochar-international.org/protocol/
International EPD System. (2008). Climate Declaration. Power, 14025. Retrieved from:
https://www.environdec.com/
International EPD System. (2019). Mineralische Dämmstoffe aus Glaswolle. (00000052), 1–23. Retrieved from:
https://www.environdec.com/
IPCC. (2005). IPCC Special Report on Carbon Dioxide Capture and Storage. Prepared by Working Group III of
the Intergovernmental Panel on Climate Change [Metz, B., O. Davidson, H. C. de Coninck, M. Loos, and
L. A. Meyer (eds.)]. Cambridge University Press, Cambridge, United Kingdom and New York, NY, USA,
442 pp. https://www.ipcc.ch/site/assets/uploads/2018/03/srccs_wholereport-1.pdf
IPCC. (2018). Global warming of 1.5°C An IPCC Special Report on the impacts of global warming of 1.5°C
above pre-industrial levels and related global greenhouse gas emission pathways, in the context of strengthening
the global response to the threat of climate change, sustainable development, and efforts to eradicate poverty
[Masson-Delmotte, V., P. Zhai, H.-O. Pörtner, D. Roberts, J. Skea, P.R. Shukla, A. Pirani, W. Moufouma-Okia,
C. Péan, R. Pidcock, S. Connors, J.B.R. Matthews, Y. Chen, X. Zhou, M.I. Gomis, E. Lonnoy,T. Maycock, M.
Tignor, and T. Waterfield (eds.)]. In Press.Intergovernmental Panel on Climate Change.
https://www.ipcc.ch/site/assets/uploads/sites/2/2019/06/SR15_Full_Report_High_Res.pdf
ISOVER. (n.d.). Key figures. Retrieved March 31, 2020, from https://www.isover.com/key-figures
Jeong, S. T., Cho, S. R., Lee, J. G., Kim, P. J., & Kim, G. W. (2019). Composting and compost application: Trade-
off between greenhouse gas emission and soil carbon sequestration in whole rice cropping system. Journal
of Cleaner Production, 212, 1132–1142. https://doi.org/10.1016/j.jclepro.2018.12.011
Jones, R. N., Bathgate, R.S., Symons, J. and Williams, N. S. G. (2018). Quantifying the Benefits of Green
Infrastructure: Literature Review and Gap Analysis. A report to the City of Melbourne. Institute of Sustainable
Industries and Liveable Cities, Victoria University, Melbourne and Green Infrastructure Research Group,
School of Ecosystem and Forest Sciences, University of Melbourne. Retrieved from:
https://www.melbourne.vic.gov.au/SiteCollectionDocuments/quantifying-benefits-green.pdf
Karlsson, P.-E., Pleijel, H., Danielsson, H., Belhaj, M., Andersson, M., & Hellsten, S. (2006). En ekonomisk
utvärdering av inverkan av marknära ozon på växtligheten i Sverige i relation till föreslagna miljömål. Retrieved from:
https://www.ivl.se/download/18.343dc99d14e8bb0f58b74d1/1445515622588/B1678.pdf
Korkbyg. (n.d.). Kork er et af naturens egne vidundere. Retrieved April 1, 2020, from https://korkbyg.dk/
Krey, V., Masera, O., Blanforde, G., Bruckner, T., Cooke, R., Fish-Vanden, K., … Zwickel, T. (2014). Annex II:
Metrics & Methodology. Climate Change 2014: Mitigation of Climate Change. Contribution of Working Group III to
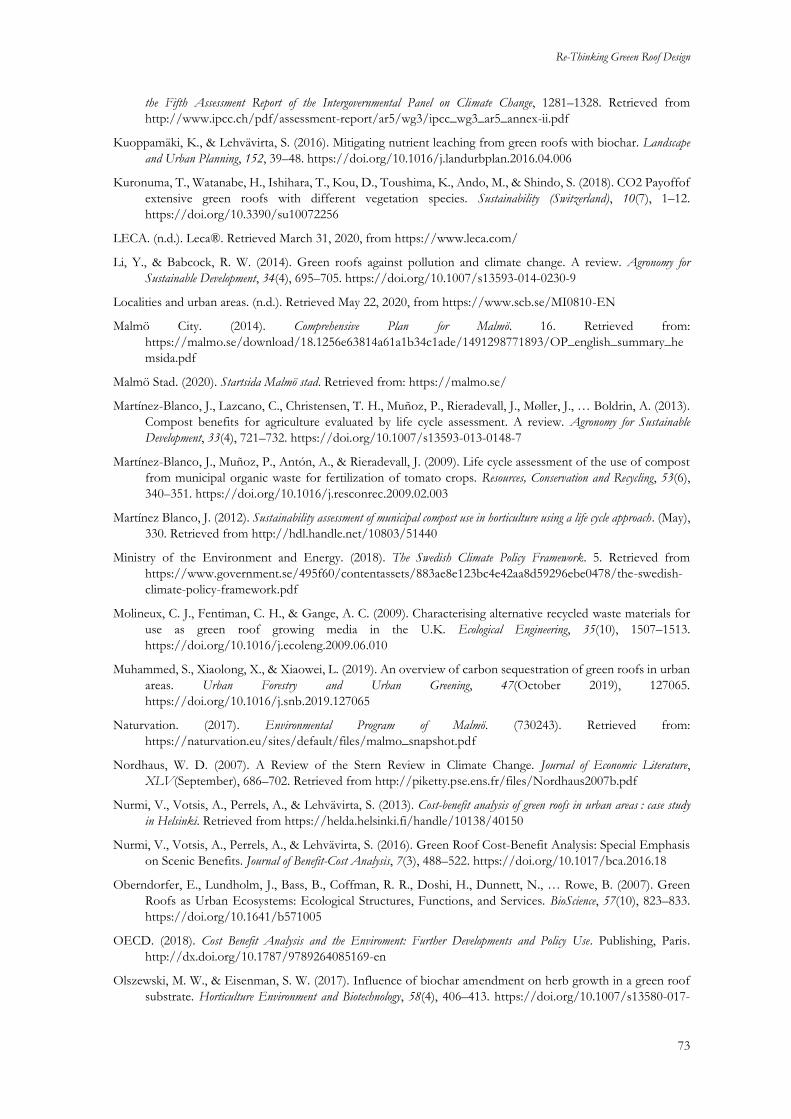
Re-Thinking Greeen Roof Design
73
the Fifth Assessment Report of the Intergovernmental Panel on Climate Change, 1281–1328. Retrieved from
http://www.ipcc.ch/pdf/assessment-report/ar5/wg3/ipcc_wg3_ar5_annex-ii.pdf
Kuoppamäki, K., & Lehvävirta, S. (2016). Mitigating nutrient leaching from green roofs with biochar. Landscape
and Urban Planning, 152, 39–48. https://doi.org/10.1016/j.landurbplan.2016.04.006
Kuronuma, T., Watanabe, H., Ishihara, T., Kou, D., Toushima, K., Ando, M., & Shindo, S. (2018). CO2 Payoffof
extensive green roofs with different vegetation species. Sustainability (Switzerland), 10(7), 1–12.
https://doi.org/10.3390/su10072256
LECA. (n.d.). Leca®. Retrieved March 31, 2020, from https://www.leca.com/
Li, Y., & Babcock, R. W. (2014). Green roofs against pollution and climate change. A review. Agronomy for
Sustainable Development, 34(4), 695–705. https://doi.org/10.1007/s13593-014-0230-9
Localities and urban areas. (n.d.). Retrieved May 22, 2020, from https://www.scb.se/MI0810-EN
Malmö City. (2014). Comprehensive Plan for Malmö. 16. Retrieved from:
https://malmo.se/download/18.1256e63814a61a1b34c1ade/1491298771893/OP_english_summary_he
msida.pdf
Malmö Stad. (2020). Startsida Malmö stad. Retrieved from: https://malmo.se/
Martínez-Blanco, J., Lazcano, C., Christensen, T. H., Muñoz, P., Rieradevall, J., Møller, J., … Boldrin, A. (2013).
Compost benefits for agriculture evaluated by life cycle assessment. A review. Agronomy for Sustainable
Development, 33(4), 721–732. https://doi.org/10.1007/s13593-013-0148-7
Martínez-Blanco, J., Muñoz, P., Antón, A., & Rieradevall, J. (2009). Life cycle assessment of the use of compost
from municipal organic waste for fertilization of tomato crops. Resources, Conservation and Recycling, 53(6),
340–351. https://doi.org/10.1016/j.resconrec.2009.02.003
Martínez Blanco, J. (2012). Sustainability assessment of municipal compost use in horticulture using a life cycle approach. (May),
330. Retrieved from http://hdl.handle.net/10803/51440
Ministry of the Environment and Energy. (2018). The Swedish Climate Policy Framework. 5. Retrieved from
https://www.government.se/495f60/contentassets/883ae8e123bc4e42aa8d59296ebe0478/the-swedish-
climate-policy-framework.pdf
Molineux, C. J., Fentiman, C. H., & Gange, A. C. (2009). Characterising alternative recycled waste materials for
use as green roof growing media in the U.K. Ecological Engineering, 35(10), 1507–1513.
https://doi.org/10.1016/j.ecoleng.2009.06.010
Muhammed, S., Xiaolong, X., & Xiaowei, L. (2019). An overview of carbon sequestration of green roofs in urban
areas. Urban Forestry and Urban Greening, 47(October 2019), 127065.
https://doi.org/10.1016/j.snb.2019.127065
Naturvation. (2017). Environmental Program of Malmö. (730243). Retrieved from:
https://naturvation.eu/sites/default/files/malmo_snapshot.pdf
Nordhaus, W. D. (2007). A Review of the Stern Review in Climate Change. Journal of Economic Literature,
XLV(September), 686–702. Retrieved from http://piketty.pse.ens.fr/files/Nordhaus2007b.pdf
Nurmi, V., Votsis, A., Perrels, A., & Lehvävirta, S. (2013). Cost-benefit analysis of green roofs in urban areas : case study
in Helsinki. Retrieved from https://helda.helsinki.fi/handle/10138/40150
Nurmi, V., Votsis, A., Perrels, A., & Lehvävirta, S. (2016). Green Roof Cost-Benefit Analysis: Special Emphasis
on Scenic Benefits. Journal of Benefit-Cost Analysis, 7(3), 488–522. https://doi.org/10.1017/bca.2016.18
Oberndorfer, E., Lundholm, J., Bass, B., Coffman, R. R., Doshi, H., Dunnett, N., … Rowe, B. (2007). Green
Roofs as Urban Ecosystems: Ecological Structures, Functions, and Services. BioScience, 57(10), 823–833.
https://doi.org/10.1641/b571005
OECD. (2018). Cost Benefit Analysis and the Enviroment: Further Developments and Policy Use. Publishing, Paris.
http://dx.doi.org/10.1787/9789264085169-en
Olszewski, M. W., & Eisenman, S. W. (2017). Influence of biochar amendment on herb growth in a green roof
substrate. Horticulture Environment and Biotechnology, 58(4), 406–413. https://doi.org/10.1007/s13580-017-
Aziliz Le Rouzo, IIIEE, Lund University
74
0180-7
Patwardhan, A., Semenov, S., Schnieder, S., Burton, I., Magadza, C., Oppenheimer, M., … Suarez, A. (2007).
Assessing key vulnerabilities and the risk from climate change. Climate Change, 779–810. Retrieved from:
https://www.ipcc.ch/site/assets/uploads/2018/02/ar4-wg2-chapter19-1.pdf
Pergola, M., Persiani, A., Pastore, V., Palese, A. M., D’Adamo, C., de Falco, E., & Celano, G. (2020). Sustainability
assessment of the green compost production chain from agricultural waste: A case study in southern Italy.
Agronomy, 10(2). https://doi.org/10.3390/agronomy10020230
Peri, G., Traverso, M., Finkbeiner, M., & Rizzo, G. (2012). Embedding “substrate” in environmental assessment
of green roofs life cycle: Evidences from an application to the whole chain in a Mediterranean site. Journal
of Cleaner Production, 35, 274–287. https://doi.org/10.1016/j.jclepro.2012.05.038
Pincetl, S., Franco, G., Grimm, N. B., Hogue, T. S., Hughes, S., Pardyjak, E., … Gilchrist, M. (2013). Urban areas.
Assessment of Climate Change in the Southwest United States: A Report Prepared for the National Climate Assessment,
267–296. https://doi.org/10.5822/978-1-61091-484-0_13
Pizzol, M., Weidema, B., Brandão, M., & Osset, P. (2015). Monetary valuation in Life Cycle Assessment: A review.
Journal of Cleaner Production, 86(February 2016), 170–179. https://doi.org/10.1016/j.jclepro.2014.08.007
PlasticsEurope. (2014). Eco-profiles (HDPE, LDPE, LLDPE) 2014. (April). Retrieved from
http://www.plasticseurope.org/plastics-sustainability-14017/eco-profiles/browse-by-
flowchart.aspx?LCAID=r26
Pushkar, S. (2019). Modeling the substitution of natural materials with industrial byproducts in green roofs using
life cycle assessments. Journal of Cleaner Production, 227, 652–661.
https://doi.org/10.1016/j.jclepro.2019.04.237
Qianqian, Z., Liping, M., Huiwei, W., & Long, W. (2019). Analysis of the effect of green roof substrate amended
with biochar on water quality and quantity of rainfall runoff. Environmental Monitoring and Assessment, 191(5).
https://doi.org/10.1007/s10661-019-7466-4
Ramstein, C., Dominioni, G., Ettehad, S., Lam, L., Quant, M., Zhang, J., … Trim, I. (2019). State and Trends of
Carbon Pricing 2019. In State and Trends of Carbon Pricing 2019. https://doi.org/10.1596/978-1-4648-1435-
8
Revi, A., D.E. Satterthwaite, F. Aragón-Durand, J. Corfee-Morlot, R.B.R. Kiunsi, M. Pelling, D.C. Roberts, and
W. Solecki, (2014). Urban areas. In: Climate Change 2014: Impacts, Adaptation, and Vulnerability. Part A:
Global and Sectoral Aspects. Contribution of Working Group II to the Fifth Assessment Report of the
Intergovernmental Panel on Climate Change [Field, C.B., V.R. Barros, D.J. Dokken, K.J. Mach, M.D.
Mastrandrea, T.E. Bilir, M. Chatterjee, K.L. Ebi, Y.O. Estrada, R.C. Genova, B. Girma, E.S. Kissel, A.N. Levy,
S. MacCracken, P.R. Mastrandrea, and L.L. White (eds.)]. Cambridge University Press, Cambridge, United
Kingdom and New York, NY, USA, pp. 535-612. Retrieved from:
https://www.ipcc.ch/site/assets/uploads/2018/02/WGIIAR5-Chap8_FINAL.pdf
Rincón, L., Coma, J., Pérez, G., Castell, A., Boer, D., & Cabeza, L. F. (2014). Environmental performance of
recycled rubber as drainage layer in extensive green roofs. A comparative Life Cycle Assessment. Building
and Environment, 74, 22–30. https://doi.org/10.1016/j.buildenv.2014.01.001
Rosasco, P., & Perini, K. (2019). Selection of (green) roof systems: A sustainability-based multi-criteria analysis.
Buildings, 9(5). https://doi.org/10.3390/buildings9050134
Rowe, D. B., & Getter, K. L. (2006). The role of extensive green roofs in sustainable development. HortScience,
41(5), 1276–1285. https://doi.org/10.21273/HORTSCI.41.5.1276
Scandinavian Green Roof Institute. (2020). Scandinavian Green Roof Institute. Retrieved from:
https://greenroof.se/en/
SCB. (n.d.). Konsumentprisindex (1980=100), fastställda tal. Retrieved March 16, 2020, from
https://www.scb.se/hitta-statistik/statistik-efter-amne/priser-och-
konsumtion/konsumentprisindex/konsumentprisindex-kpi/pong/tabell-och-
diagram/konsumentprisindex-kpi/kpi-faststallda-tal-1980100/
Selander, S. J. (2015). Gröna taks samhällsekonomiska nytta och kostnader. Retrieved from:
Re-Thinking Greeen Roof Design
75
http://lup.lub.lu.se/luur/download?func=downloadFile&recordOId=8893034&fileOId=8893035
Shafique, M., Azam, A., Rafiq, M., Ateeq, M., & Luo, X. (2019). An overview of life cycle assessment of green
roofs. Journal of Cleaner Production, 250. https://doi.org/10.1016/j.jclepro.2019.119471
Silvestre, J. D., Pargana, N., De Brito, J., Pinheiro, M. D., & Durão, V. (2016). Insulation cork boards-
environmental life cycle assessment of an organic construction material. Materials, 9(5), 1–16.
https://doi.org/10.3390/ma9050394
Söderqvist, H. (2019). Carbon Stability of Biochar. Retrieved from: http://kth.diva-
portal.org/smash/get/diva2:1334635/FULLTEXT01.pdf
Soprema. (n.d.). About us - Soprema. Retrieved March 31, 2020, from https://www.soprema.com/en/about-us
Spokas, K. A. (2010). Review of the stability of biochar in soils: Predictability of O:C molar ratios. Carbon
Management, 1(2), 289–303. https://doi.org/10.4155/cmt.10.32
Statistics Finland. (n.d.). Consumer Price Index 2015=100 by commodity groups. Retrieved March 16, 2020, from
https://www.stat.fi/til/khi/2020/02/khi_2020_02_2020-03-13_tau_001_en.html
Stern, N. (2007). The Economics of Climate Change - The Stern Review. 41–54. Retrieved from:
http://mudancasclimaticas.cptec.inpe.br/~rmclima/pdfs/destaques/sternreview_report_complete.pdf
Sveriges Riksbank. (n.d.). Search interest & exchange rates. Retrieved March 3, 2020, from
https://www.riksbank.se/en-gb/statistics/search-interest--exchange-rates/?g130-
SEKDKKPMI=on&g130-SEKEURPMI=on&g130-SEKGBPPMI=on&g130-
SEKUSDPMI=on&from=03%2F02%2F2010&to=03%2F03%2F2020&f=Year&c=cAverage&s=Com
ma
Swedish Environmental Protection Agency. (n.d.). Sweden’s Climate Act and Climate Policy Framework.
Retrieved February 24, 2020, from http://www.swedishepa.se/Environmental-objectives-and-
cooperation/Swedish-environmental-work/Work-areas/Climate/Climate-Act-and-Climate-policy-
framework-/
Sysav. (n.d.). Grönkompost | Sysav – tar hand om och återvinner avfall. Retrieved March 31, 2020, from
https://www.sysav.se/Privat/Produkter-och-tjanster/Jordprodukter/Gronkompost/
Tadeu, A., Simões, N., Almeida, R., & Manuel, C. (2019). Drainage and water storage capacity of insulation cork
board applied as a layer on green roofs. Construction and Building Materials, 209, 52–65.
https://doi.org/10.1016/j.conbuildmat.2019.03.073
Tártaro, A. S., Mata, T. M., Martins, A. A., & Esteves da Silva, J. C. G. (2017). Carbon footprint of the insulation
cork board. Journal of Cleaner Production, 143, 925–932. https://doi.org/10.1016/j.jclepro.2016.12.028
Teotónio, I., Silva, C. M., & Cruz, C. O. (2018). Eco-solutions for urban environments regeneration: The
economic value of green roofs. Journal of Cleaner Production, 199, 121–135.
https://doi.org/10.1016/j.jclepro.2018.07.084
The Boston Consulting Group. (2017). Värden av ett förnybart energisystem i Sverige. Retrieved from:
https://www.skekraft.se/wp-
content/uploads/2018/01/BCG_Varden_av_ett_fornybart_energisystem_i_Sverige.pdf
The Norwegian EPD Foundation. (2015). Environmental Product Declaration. 1–8. Retrieved from:
https://www.epd-norge.no/?lang=en_GB
Trafikverket. (2014). Samhällsekonomiska principer och kalkylvärden för transportsektorn: ASEK 5.1. Kapitel 3
Kalkylprinciper och generella kalkylvärden. 6, 19. Retrieved from:
https://www.trafikverket.se/contentassets/4b1c1005597d47bda386d81dd3444b24/asek-
6.1/05_generella_principer_o_varden_a61.pdf
Trafikverket. (2018). Analysmetod och samhällsekonomiska kalkylvärden för transportsektorn: ASEK 6.1 Förord och Innehåll
1 Inledning. 6, 1–19. Retrieved from
https://www.trafikverket.se/contentassets/4b1c1005597d47bda386d81dd3444b24/asek-
6.1/09_trafiksakerhet_a61.pdf
Trafikverket. (2019). Åtgärder för ökad andel godstransporter på järnväg och med fartyg. Retrieved from:
Aziliz Le Rouzo, IIIEE, Lund University
76
https://www.trafikverket.se/contentassets/ba17ede140da4ccaad607bd4f188f136/ny-rapport-
regeringsuppdrag-verka-for-battre-forutsattningar_trv-2018-93267-justerad.pdf
VegTech. (n.d.). Sedumtak Gröna Tak. Retrieved February 26, 2020, from https://www.vegtech.se/sedumtak---
grona-tak/sedumtak/
Vinnova. (n.d.). Swedish guidelines for green roofs. Retrieved from www.ecourse.se/nigeriagreenroof.
Wang, J., Xiong, Z., & Kuzyakov, Y. (2016). Biochar stability in soil: Meta-analysis of decomposition and priming
effects. GCB Bioenergy, 8(3), 512–523. https://doi.org/10.1111/gcbb.12266
Yang, J., Yu, Q., & Gong, P. (2008). Quantifying air pollution removal by green roofs in Chicago. Atmospheric
Environment, 42(31), 7266–7273. https://doi.org/10.1016/j.atmosenv.2008.07.003
Yao, L., Chini, A., & Zeng, R. (2018). Integrating cost-benefits analysis and life cycle assessment of green roofs:
a case study in Florida. Human and Ecological Risk Assessment, 0(0), 1–16.
https://doi.org/10.1080/10807039.2018.1514251
Zhu, Q. (2019). Developments on CO2-utilization technologies. Clean Energy, 3(2), 85–100.
https://doi.org/10.1093/ce/zkz008
ZinCo. (n.d.). Ornamental Sedum. Retrieved April 1, 2020, from https://zinco-usa.com/systems/ornamental-
sedum
ZinCo Green Roof Systems. (n.d.). Extensive Green Roof Rockery Type Plants. Retrieved February 26, 2020,
from https://zinco-greenroof.com/systems/rockery-type-plants
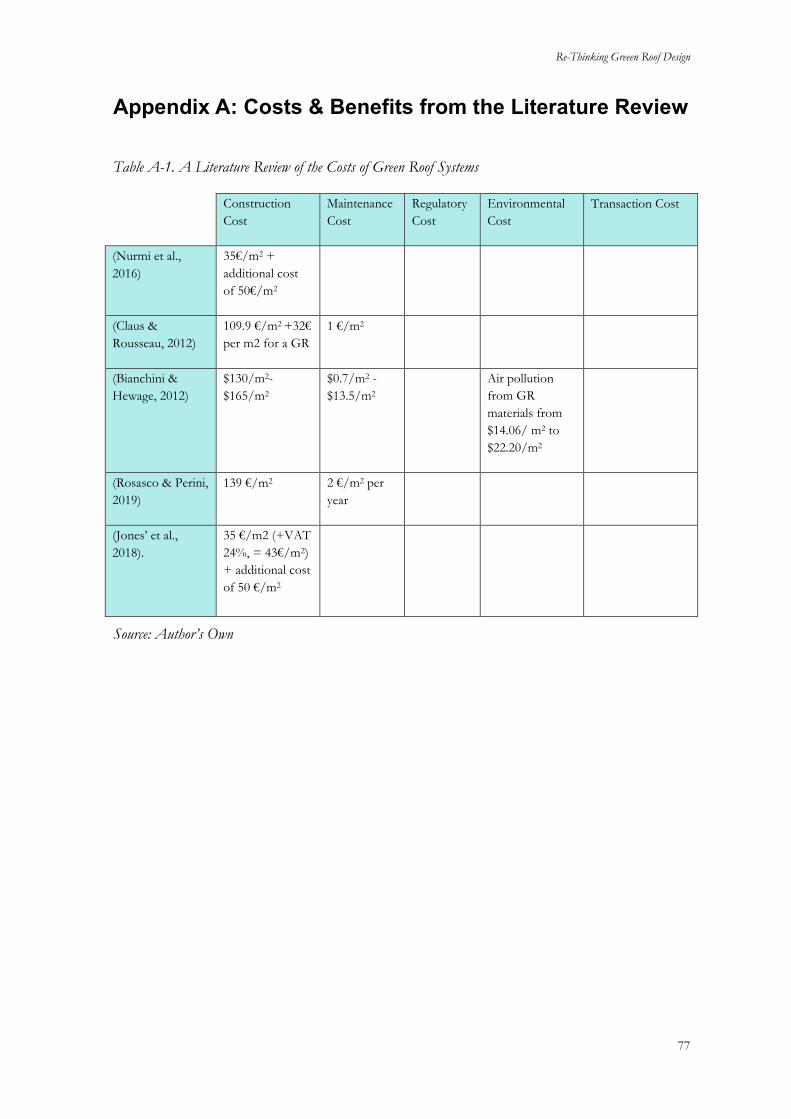
Re-Thinking Greeen Roof Design
77
Appendix A: Costs & Benefits from the Literature Review
Table A-1. A Literature Review of the Costs of Green Roof Systems
Construction
Cost
Maintenance
Cost
Regulatory
Cost
Environmental
Cost
Transaction Cost
(Nurmi et al.,
2016)
35€/m2 +
additional cost
of 50€/m2
(Claus &
Rousseau, 2012)
109.9 €/m2 +32€
per m2 for a GR
1 €/m2
(Bianchini &
Hewage, 2012)
$130/m2-
$165/m2
$0.7/m2 -
$13.5/m2
Air pollution
from GR
materials from
$14.06/ m2 to
$22.20/m2
(Rosasco & Perini,
2019)
139 €/m2 2 €/m2 per
year
(Jones’ et al.,
2018).
35 €/m2 (+VAT
24%, = 43€/m2)
+ additional cost
of 50 €/m2
Source: Author’s Own

Aziliz Le Rouzo, IIIEE, Lund University
78
Table A-2. A Literature Review of the Benefits of Green Roof Systems
Source: Author’s Own
Life
Span
Energy Air
Quality
Storm
Water
Heat
Islan
d
Acoustic
s
CO2 Scenic Biodivers
ity
(Nurmi
et al.,
2016) 23.8€/
m2
Heating:
2.9€/m2
Cooling:
2 to
10€/m2
4.8€-
6.9€/m2
3.9€–
9.4€/m2
10€/m2 0-
17€/m2
(Claus &
Roussea
u, 2012) 180.3 €
per m2
in the
25th
year.
0.133
€/m2
NOx:
0.0124
€/m2/ye
ar
NO2:
0.369
€/m2/ye
ar
0.303
€/m2
+ 0.10
€/m2
0.287
€/m2/ye
ar
0.03
€/m2/ye
ar
(Bianchi
ni &
Hewage,
2012) $160/
m2
every
20 year
Heating:
$0.22/m2
Cooling:
$0.18/m2 to
$0.68/m2
$0.025/
m2
$0.03/m
2
$0/m2
and
$0.38/
m2
$8.3
E-
3/m2
and
$1.2
E-
3/m2
$132/
m2 to
$174/
m2
$0/m2 to
$10.2/m2
(Rosasc
o &
Perini,
2019)
heating
of 0.19
€/m2/ye
ar
cooling
1.62
€/m2/ye
ar
(Jones’
et al.,
2018).
23.6
€/m2
every
20
years
Heating:
3.33
€/m2
4.8 €/m2
to 6.9
€/m2
1.9 to
3.4
€/m2
20€/m2
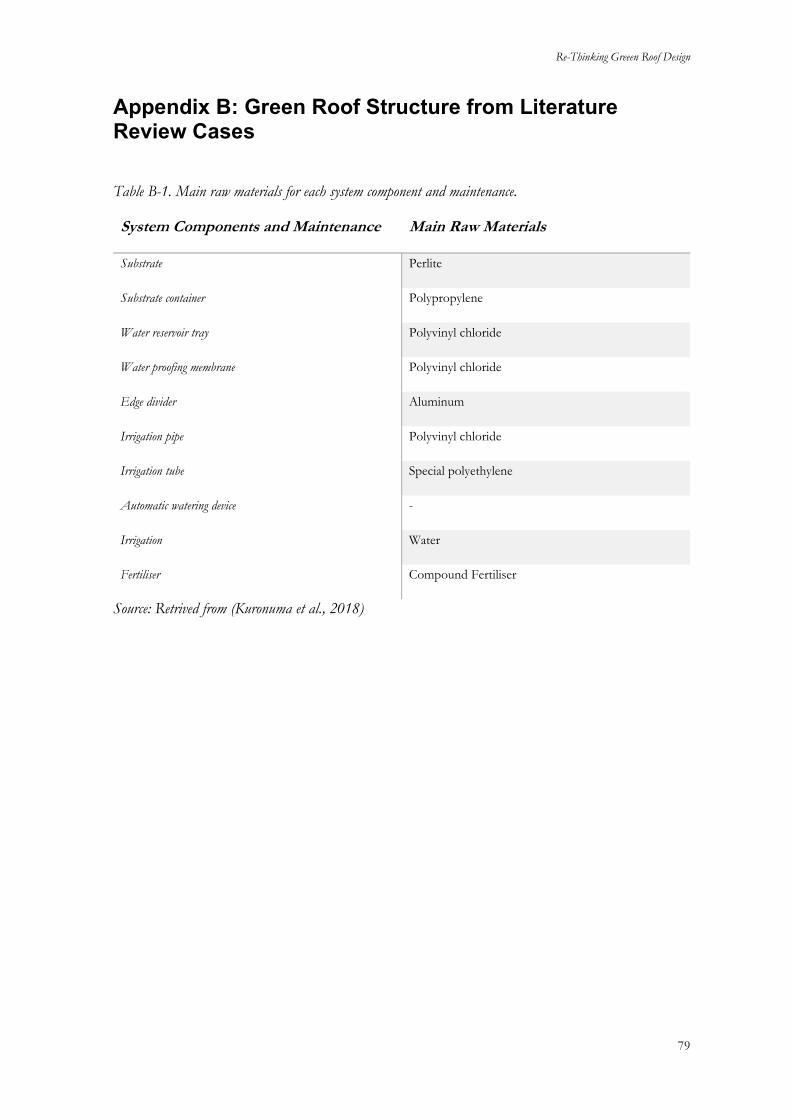
Re-Thinking Greeen Roof Design
79
Appendix B: Green Roof Structure from Literature Review Cases
Table B-1. Main raw materials for each system component and maintenance.
System Components and Maintenance Main Raw Materials
Substrate Perlite
Substrate container Polypropylene
Water reservoir tray Polyvinyl chloride
Water proofing membrane Polyvinyl chloride
Edge divider Aluminum
Irrigation pipe Polyvinyl chloride
Irrigation tube Special polyethylene
Automatic watering device -
Irrigation Water
Fertiliser Compound Fertiliser
Source: Retrived from (Kuronuma et al., 2018)
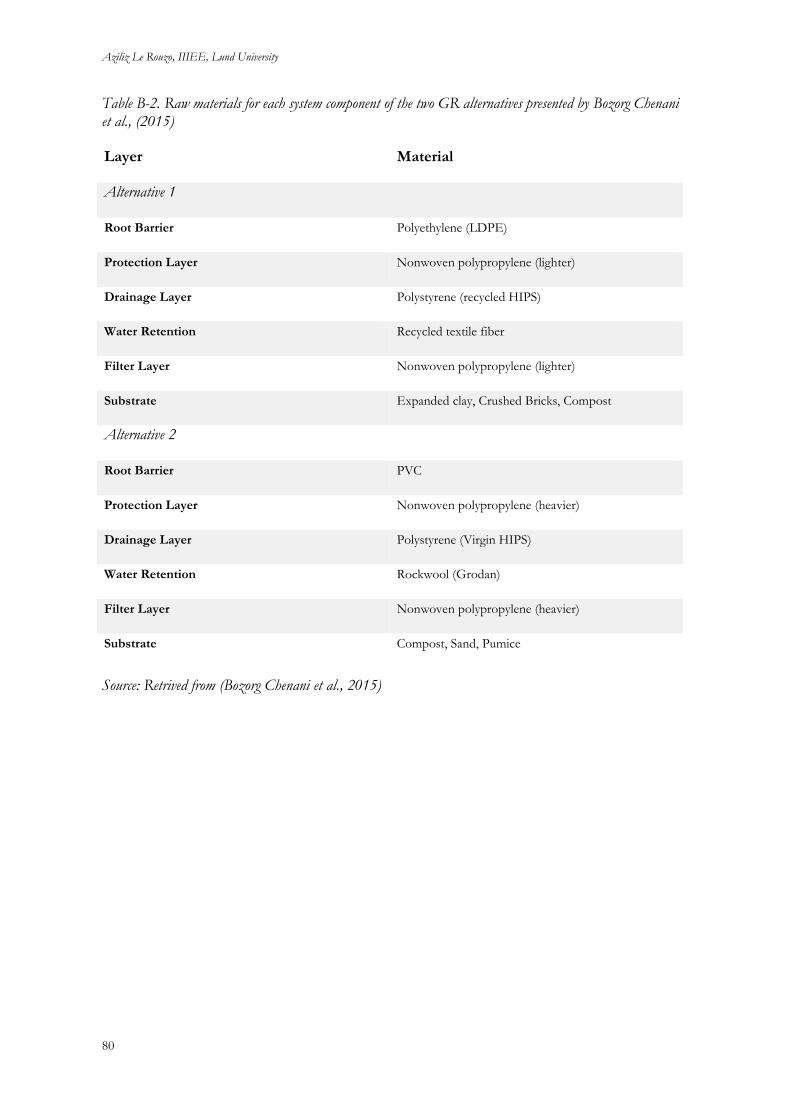
Aziliz Le Rouzo, IIIEE, Lund University
80
Table B-2. Raw materials for each system component of the two GR alternatives presented by Bozorg Chenani et al., (2015)
Source: Retrived from (Bozorg Chenani et al., 2015)
Layer Material
Alternative 1
Root Barrier Polyethylene (LDPE)
Protection Layer Nonwoven polypropylene (lighter)
Drainage Layer Polystyrene (recycled HIPS)
Water Retention Recycled textile fiber
Filter Layer Nonwoven polypropylene (lighter)
Substrate Expanded clay, Crushed Bricks, Compost
Alternative 2
Root Barrier PVC
Protection Layer Nonwoven polypropylene (heavier)
Drainage Layer Polystyrene (Virgin HIPS)
Water Retention Rockwool (Grodan)
Filter Layer Nonwoven polypropylene (heavier)
Substrate Compost, Sand, Pumice
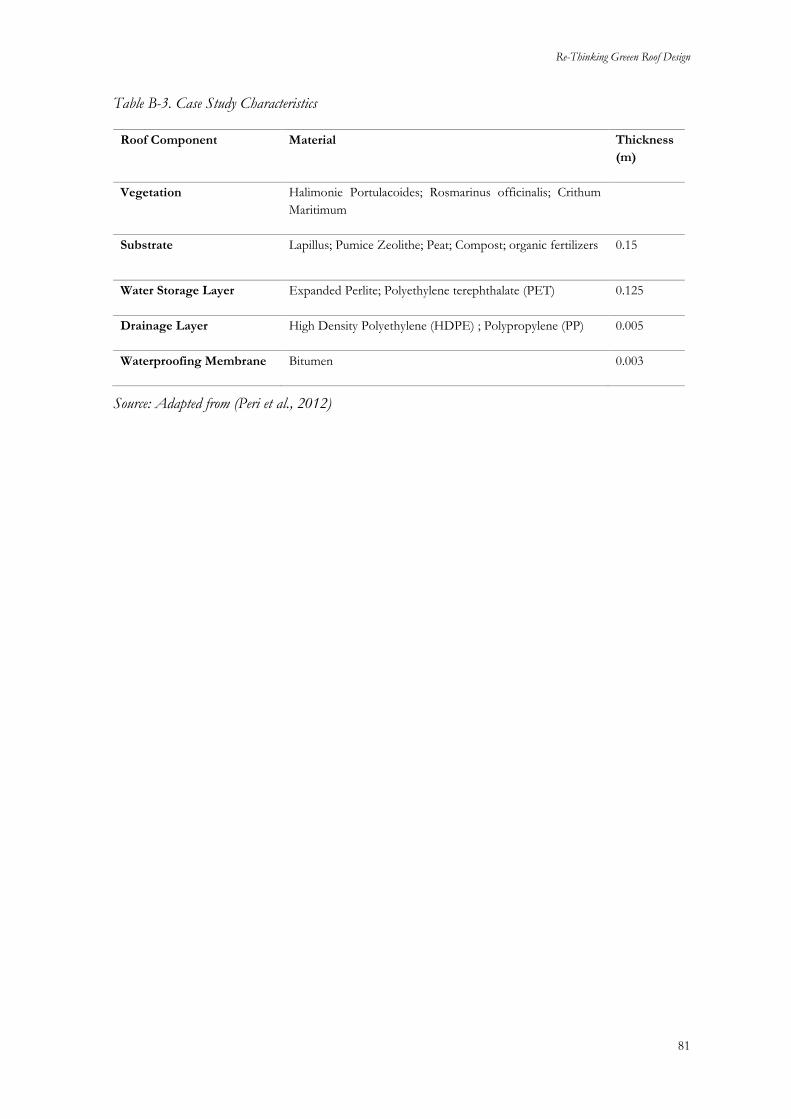
Re-Thinking Greeen Roof Design
81
Table B-3. Case Study Characteristics
Roof Component Material Thickness
(m)
Vegetation Halimonie Portulacoides; Rosmarinus officinalis; Crithum
Maritimum
Substrate Lapillus; Pumice Zeolithe; Peat; Compost; organic fertilizers 0.15
Water Storage Layer Expanded Perlite; Polyethylene terephthalate (PET) 0.125
Drainage Layer High Density Polyethylene (HDPE) ; Polypropylene (PP) 0.005
Waterproofing Membrane Bitumen 0.003
Source: Adapted from (Peri et al., 2012)

Aziliz Le Rouzo, IIIEE, Lund University
82
Appendix C: Summary Table of the Necessary Data For the CBA
Table C-1. Necessary Data for the CBA
Included Variables Description of the Data Needed
Construction Costs Costs of the different materials used in the prototypes + additional
installation cost of the GR compared to the baseline
Maintenance Costs Estimated frequency and cost of maintenance
Carbon footprint of the Structure Estimated CO2 emissions from the production of the GR materials
Energy Savings In Sweden deemed marginal for heating, only consider cooling. Average
energy consumption per household. Estimate how much energy is
typically saved with a GR. Compare to the price of cooling via another
mean. Look at the price of district heating/cooling
Air Quality Estimates of the pollution removal for different pollutants (O3, NO2,
PM10, SO2). Monetised using the social cost of air pollution
Storm Water Management Water retention capacity depending on substrate type and plant species
Carbon Sequestration Estimates of carbon sequestered by the plant cover (kg CO2/m2)
Scenic Benefits Use hedonic valuation and estimate the increase in property value
associated with a GR
Biodiversity Estimates of the increase in biodiversity. Compare with the price of
other solutions used to increase biodiversity in cities
Source: Author’s Own

Re-Thinking Greeen Roof Design
83
Appendix D: Tables used for the calculation of the results
Air Pollution
Table D-1. Evaluation of the regional impacts of air pollution, SEK/kg emissions for 2014
Nitric oxides (NOx) 86
Volatile Organic Compounds (VOC) 43
Sulphur dioxide (SO2) 29
Particles 0
Source: Information retrieved from Trafikverket, (2018)
Table D-2. Evaluation of the local effects of air pollution in SEK/exposure unit
Nitric oxides (NOx) 2
Volatile Organic Compounds (VOC) 3.4
Sulphur dioxide (SO2) 17.2
Fine Particles (PM2.5) 585.9
Source: Information retrieved from Trafikverket, (2018)
Storm Water Management
Table D-3. Expenditure categories and estimated avoided costs
Cost Type Estimates of the Avoided Costs for a 10%
Infrastructure Scenario (million €)
Rainwater purification 0.5
Expansion of sewer network 1-4
Repair of separate sewer infrastructure 3-6.3
Repair of combined seer infrastructure 2.3-5.6
Source: Nurmi et al., (2016)

Aziliz Le Rouzo, IIIEE, Lund University
84
Electricity Prices
Table D-4. Yearly Average of electricity prices in Malmö from 2010-2020
Year 2020 2019 2018 2017 2016 2015 2014 2013 2012 2011 2010
Yearly Average
(öre/kWh)
26.93 49.73 57.25 37.21 28.13 35.89 41.68 37.51 51.37 62.57 48.21
Source: (E.ON, 2020)

Re-Thinking Greeen Roof Design
85
Appendix E: Summary Tables of the Structural Costs & Carbon Impact of the two GR structures.
Table E-1. Structural Costs & Carbon Impact of the Baseline (SEK/m2).
Material Climate Impact (kg
CO2eq)
Cost of Climate Impact
(SEK/m2)
Cost of the Material
(SEK/m2)
Seeds 20
Su
bst
rate
Pumice 6.05 7.20 44
Compost 5.00 5.95 4
LECA 0.53 0.63 5.82
Sub-
Total
12 14 74
Str
uctu
re
Water
Holding
7.60 9.04 55
Drainage 2.88 3.42 100
Insulation 12.90 15.35 36
Root
Protection
0.59 0.71 50
Sub-
Total
24 28 241
TOTAL 36 42 315
Source: Author’s own.
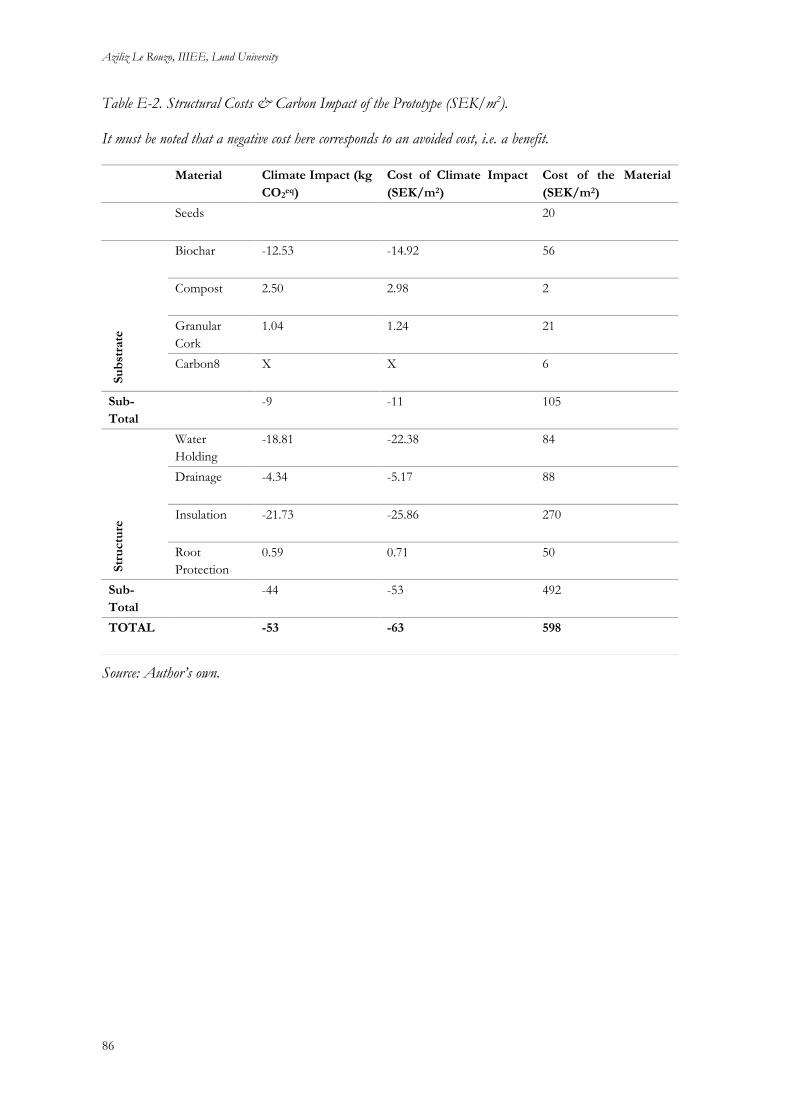
Aziliz Le Rouzo, IIIEE, Lund University
86
Table E-2. Structural Costs & Carbon Impact of the Prototype (SEK/m2).
It must be noted that a negative cost here corresponds to an avoided cost, i.e. a benefit.
Source: Author’s own.
Material Climate Impact (kg
CO2eq)
Cost of Climate Impact
(SEK/m2)
Cost of the Material
(SEK/m2)
Seeds 20
Su
bst
rate
Biochar -12.53 -14.92 56
Compost 2.50 2.98 2
Granular
Cork
1.04 1.24 21
Carbon8 X X 6
Sub-
Total
-9 -11 105
Str
uctu
re
Water
Holding
-18.81 -22.38 84
Drainage -4.34 -5.17 88
Insulation -21.73 -25.86 270
Root
Protection
0.59 0.71 50
Sub-
Total
-44 -53 492
TOTAL -53 -63 598
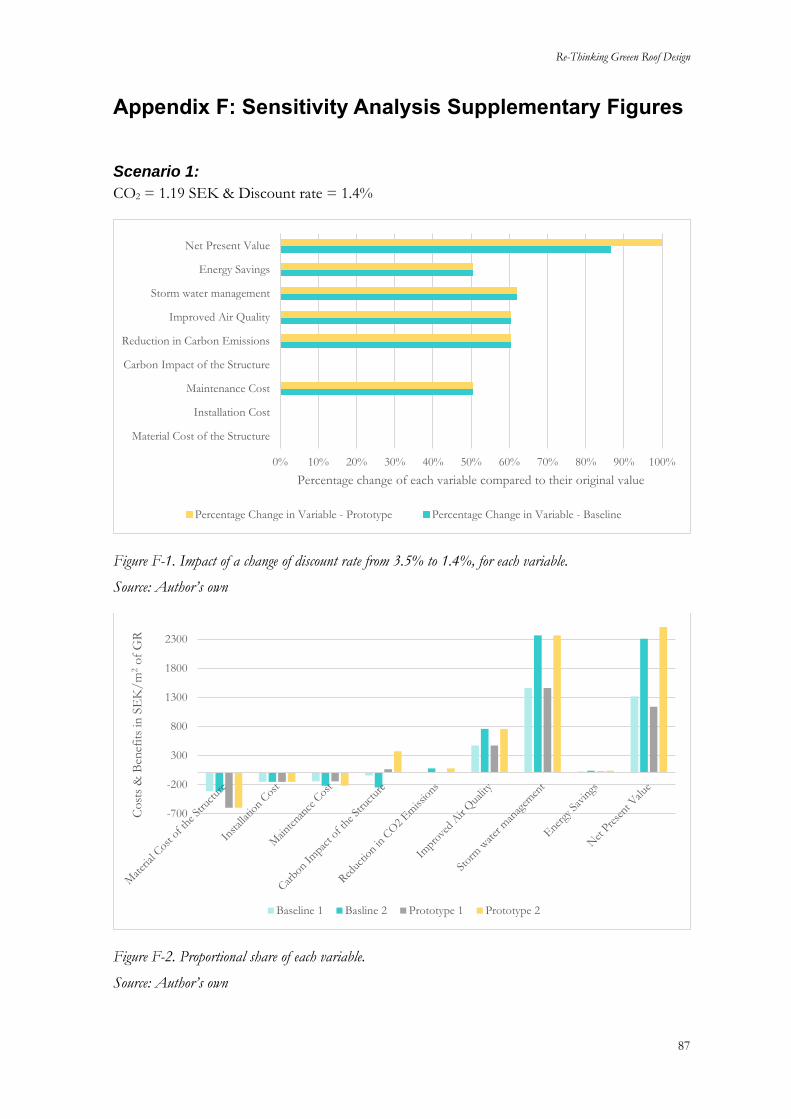
Re-Thinking Greeen Roof Design
87
Appendix F: Sensitivity Analysis Supplementary Figures
Scenario 1:
CO2 = 1.19 SEK & Discount rate = 1.4%
Figure F-1. Impact of a change of discount rate from 3.5% to 1.4%, for each variable.
Source: Author’s own
Figure F-2. Proportional share of each variable.
Source: Author’s own
0% 10% 20% 30% 40% 50% 60% 70% 80% 90% 100%
Material Cost of the Structure
Installation Cost
Maintenance Cost
Carbon Impact of the Structure
Reduction in Carbon Emissions
Improved Air Quality
Storm water management
Energy Savings
Net Present Value
Percentage change of each variable compared to their original value
Percentage Change in Variable - Prototype Percentage Change in Variable - Baseline
-700
-200
300
800
1300
1800
2300
Co
sts
& B
enef
its
in S
EK
/m
2o
f G
R
Baseline 1 Basline 2 Prototype 1 Prototype 2
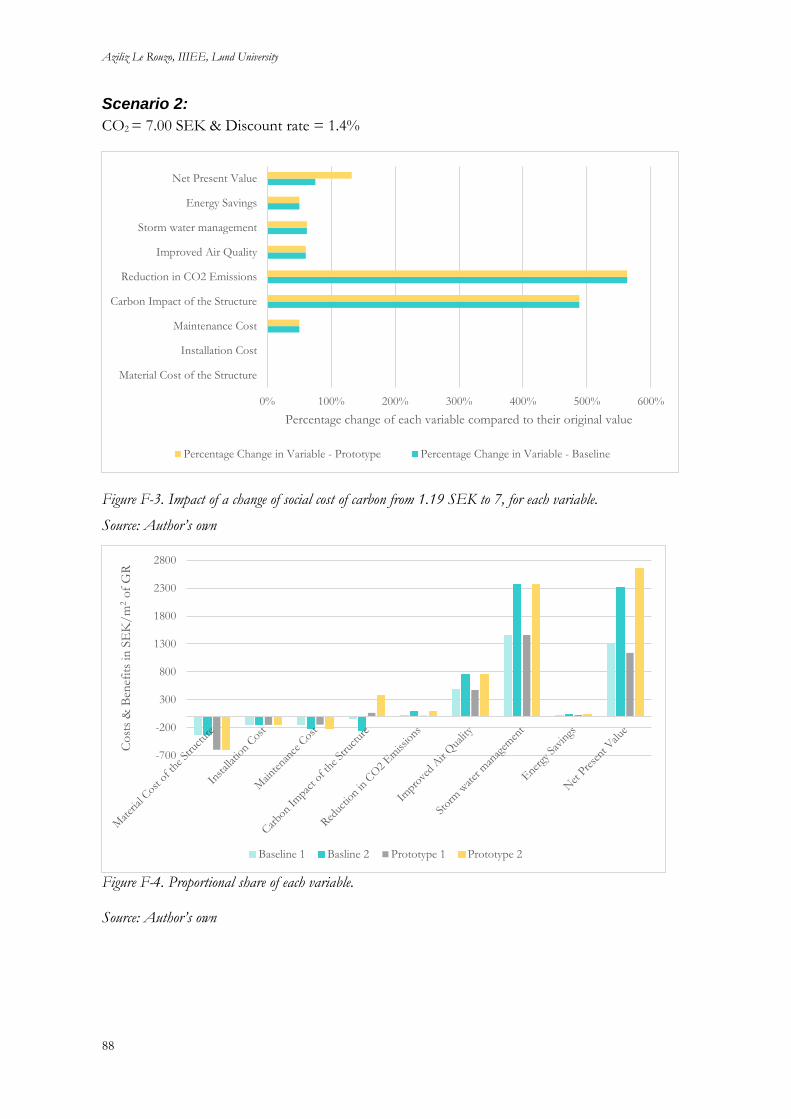
Aziliz Le Rouzo, IIIEE, Lund University
88
Scenario 2:
CO2 = 7.00 SEK & Discount rate = 1.4%
Figure F-3. Impact of a change of social cost of carbon from 1.19 SEK to 7, for each variable.
Source: Author’s own
Figure F-4. Proportional share of each variable.
Source: Author’s own
0% 100% 200% 300% 400% 500% 600%
Material Cost of the Structure
Installation Cost
Maintenance Cost
Carbon Impact of the Structure
Reduction in CO2 Emissions
Improved Air Quality
Storm water management
Energy Savings
Net Present Value
Percentage change of each variable compared to their original value
Percentage Change in Variable - Prototype Percentage Change in Variable - Baseline
-700
-200
300
800
1300
1800
2300
2800
Co
sts
& B
enef
its
in S
EK
/m
2o
f G
R
Baseline 1 Basline 2 Prototype 1 Prototype 2

Re-Thinking Greeen Roof Design
89
Scenario 3:
Figure F-5. Proportional share of each variable
Source: Author’s own
-800
-300
200
700
1200
1700C
ost
s &
Ben
efit
s in
SE
K/
m2
of
GR
Basline 1 Basline 2 Prototype 1 Prototype 2
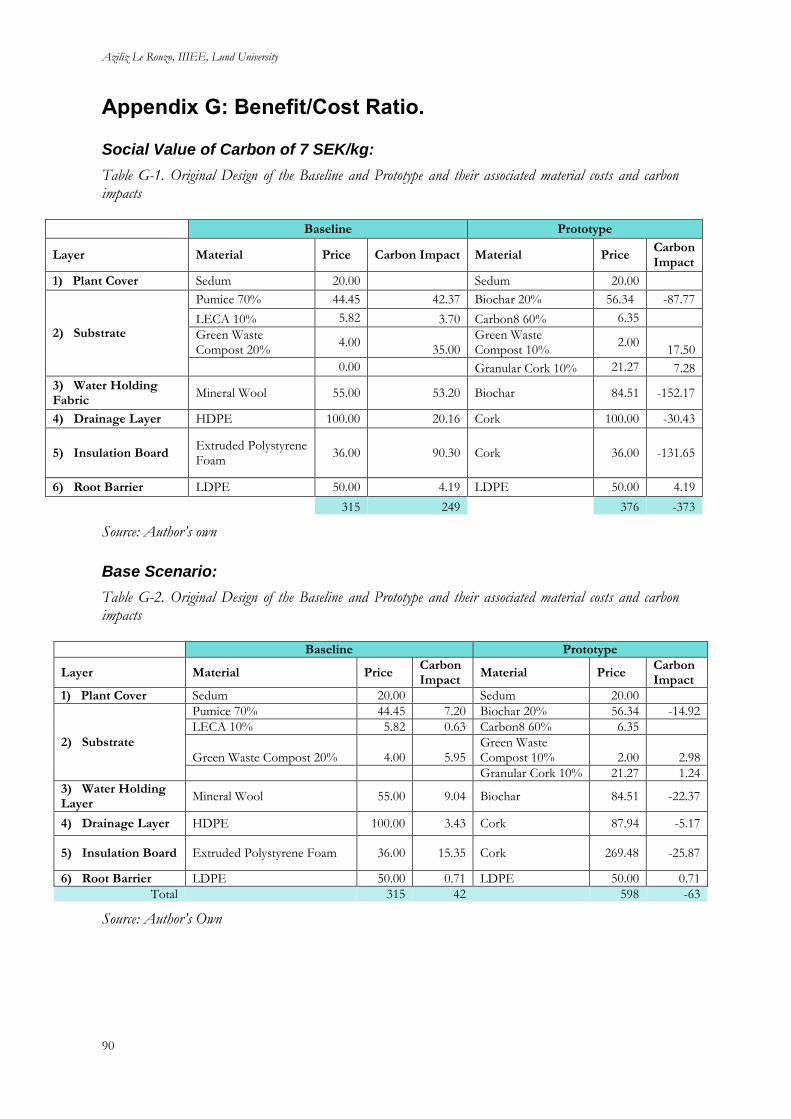
Aziliz Le Rouzo, IIIEE, Lund University
90
Appendix G: Benefit/Cost Ratio.
Social Value of Carbon of 7 SEK/kg:
Table G-1. Original Design of the Baseline and Prototype and their associated material costs and carbon impacts
Baseline Prototype
Layer Material Price Carbon Impact Material Price Carbon Impact
1) Plant Cover Sedum 20.00 Sedum 20.00
2) Substrate
Pumice 70% 44.45 42.37 Biochar 20% 56.34 -87.77
LECA 10% 5.82 3.70 Carbon8 60% 6.35
Green Waste Compost 20%
4.00 35.00
Green Waste Compost 10%
2.00 17.50
0.00 Granular Cork 10% 21.27 7.28
3) Water Holding Fabric
Mineral Wool 55.00 53.20 Biochar 84.51 -152.17
4) Drainage Layer HDPE 100.00 20.16 Cork 100.00 -30.43
5) Insulation Board Extruded Polystyrene Foam
36.00 90.30 Cork 36.00 -131.65
6) Root Barrier LDPE 50.00 4.19 LDPE 50.00 4.19
315 249 376 -373
Source: Author’s own
Base Scenario:
Table G-2. Original Design of the Baseline and Prototype and their associated material costs and carbon impacts
Baseline Prototype
Layer Material Price Carbon Impact
Material Price Carbon Impact
1) Plant Cover Sedum 20.00 Sedum 20.00
2) Substrate
Pumice 70% 44.45 7.20 Biochar 20% 56.34 -14.92
LECA 10% 5.82 0.63 Carbon8 60% 6.35
Green Waste Compost 20% 4.00 5.95 Green Waste Compost 10% 2.00 2.98
Granular Cork 10% 21.27 1.24
3) Water Holding Layer
Mineral Wool 55.00 9.04 Biochar 84.51 -22.37
4) Drainage Layer HDPE 100.00 3.43 Cork 87.94 -5.17
5) Insulation Board Extruded Polystyrene Foam 36.00 15.35 Cork 269.48 -25.87
6) Root Barrier LDPE 50.00 0.71 LDPE 50.00 0.71
Total 315 42 598 -63
Source: Author’s Own

Re-Thinking Greeen Roof Design
91
Scenario 1: No cork except the granules
Table G-3. Original Design of the Baseline versus a Prototype without cork except from the granules - and their associated material costs and carbon impacts
Source: Author’s Own
Scenario 2: Less Biochar
Table G-4. Original Design of the Baseline versus a Prototype without a biochar water holding layer - and their associated material costs and carbon impacts
Baseline Prototype
Layer Material Price Carbon Impact
Material Price Carbon Impact
1) Plant Cover Sedum 20.00 Sedum 20.00
2) Substrate
Pumice 70% 44.45 7.20 Biochar 20% 56.34 -14.92
LECA 10% 5.82 0.63 Carbon8 60% 6.35
Green Waste Compost 20% 4.00 5.95
Green Waste Compost 10% 2.00 2.98
Granular Cork 10% 21.27 1.24
3) Water Holding Layer
Mineral Wool 55.00 9.04 Mineral Wool 55.00 9.04
4) Drainage Layer HDPE 100.00 3.43 Cork 87.94 -5.17
5) Insulation Board Extruded Polystyrene Foam
36.00 15.35 Cork 269.48 -25.87
6) Root Barrier LDPE 50.00 0.71 LDPE 50.00 0.71
Total 315 42 568 -32
Source: Author’s Own
Baseline Prototype
Layer Material Price Material Price
1) Plant Cover Sedum 20.00 Sedum 20.00
2) Substrate
Pumice 70% 44.45 7.20 Biochar 20% 56.34 -14.92
LECA 10% 5.82 0.63 Carbon8 60% 6.35
Green Waste Compost 20% 4.00 5.95
Green Waste Compost 10% 2.00 2.98
Granular Cork 10% 21.27 1.24
3) Water Holding Layer
Mineral Wool 55.00 9.04 Biochar 84.51 -22.37
4) Drainage Layer HDPE 100.00 3.43 HDPE 100.00 3.43
5) Insulation Board
Extruded Polystyrene Foam
36.00 15.35 Extruded Polystyrene Foam
36.00 15.35
6) Root Barrier LDPE 50.00 0.71 LDPE 50.00 0.71
Total 315 42 376 -14

Aziliz Le Rouzo, IIIEE, Lund University
92
Scenario 3: No Biochar
Table G-5. Original Design of the Baseline versus a Prototype without a biochar - and their associated material costs and carbon impacts
Baseline Prototype
Layer Material Price Carbon Impact
Material Price Carbon Impact
1) Plant Cover Sedum 20.00 Sedum 20.00
2) Substrate
Pumice 70% 44.45 7.20 Pumice 20% 12.70 2.06
LECA 10% 5.82 0.63 Carbon8 60% 6.35
Green Waste Compost 20% 4.00 5.95
Green Waste Compost 10% 2.00 2.98
Granular Cork 10% 21.27 1.24
3) Water Holding Layer
Mineral Wool 55.00 9.04 Mineral Wool 55.00 9.04
4) Drainage Layer HDPE 100.00 3.43 Cork 87.94 -5.17
5) Insulation Board Extruded Polystyrene Foam
36.00 15.35 Cork 269.48 -25.87
6) Root Barrier LDPE 50.00 0.71 LDPE 50.00 0.71
Total 315 42 525 -15
Source: Author’s Own
Figure G-1. Benefit/Cost Ratio of the Prototype - taking into account the carbon impact and material cost of the structure. The base scenario is the main scenario of this study, scenario 1 corresponds to a prototype without cork except from the granules, scenario 2 corresponds to a prototype without a biochar water holding layer and scenario 3 corresponds to a prototype without biochar.
Source: Author’s Own
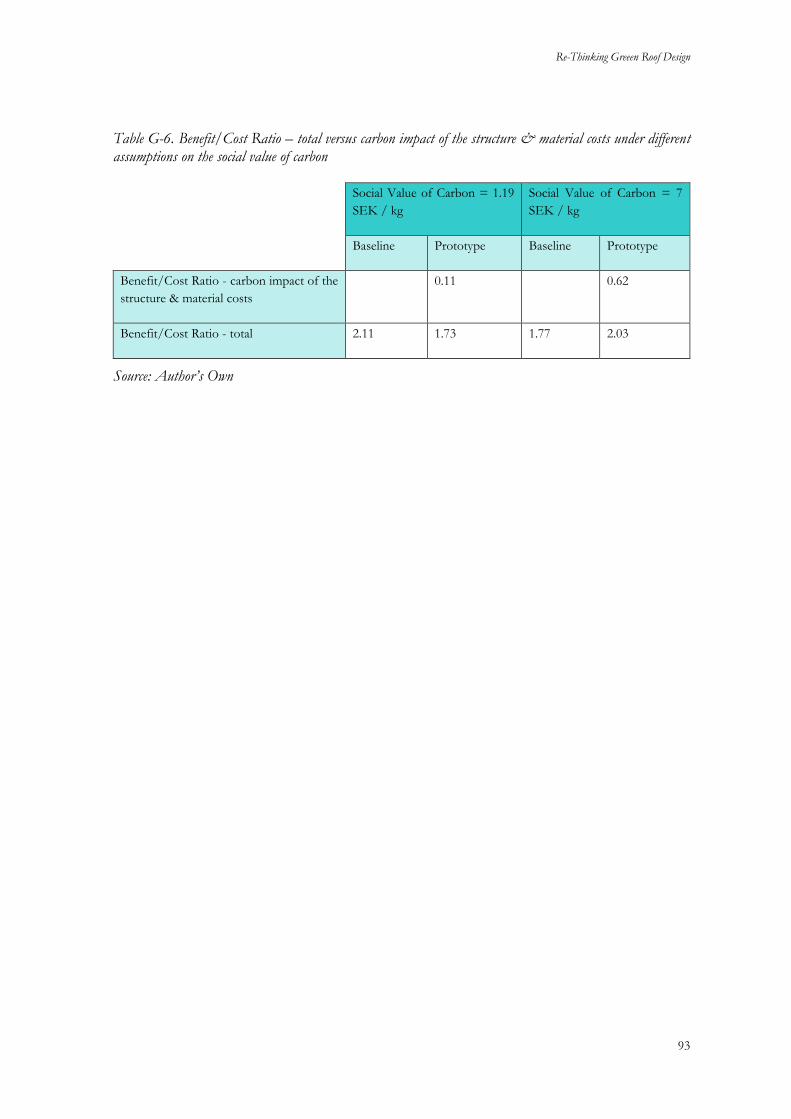
Re-Thinking Greeen Roof Design
93
Table G-6. Benefit/Cost Ratio – total versus carbon impact of the structure & material costs under different assumptions on the social value of carbon
Social Value of Carbon = 1.19
SEK / kg
Social Value of Carbon = 7
SEK / kg
Baseline Prototype Baseline Prototype
Benefit/Cost Ratio - carbon impact of the
structure & material costs
0.11 0.62
Benefit/Cost Ratio - total 2.11 1.73 1.77 2.03
Source: Author’s Own
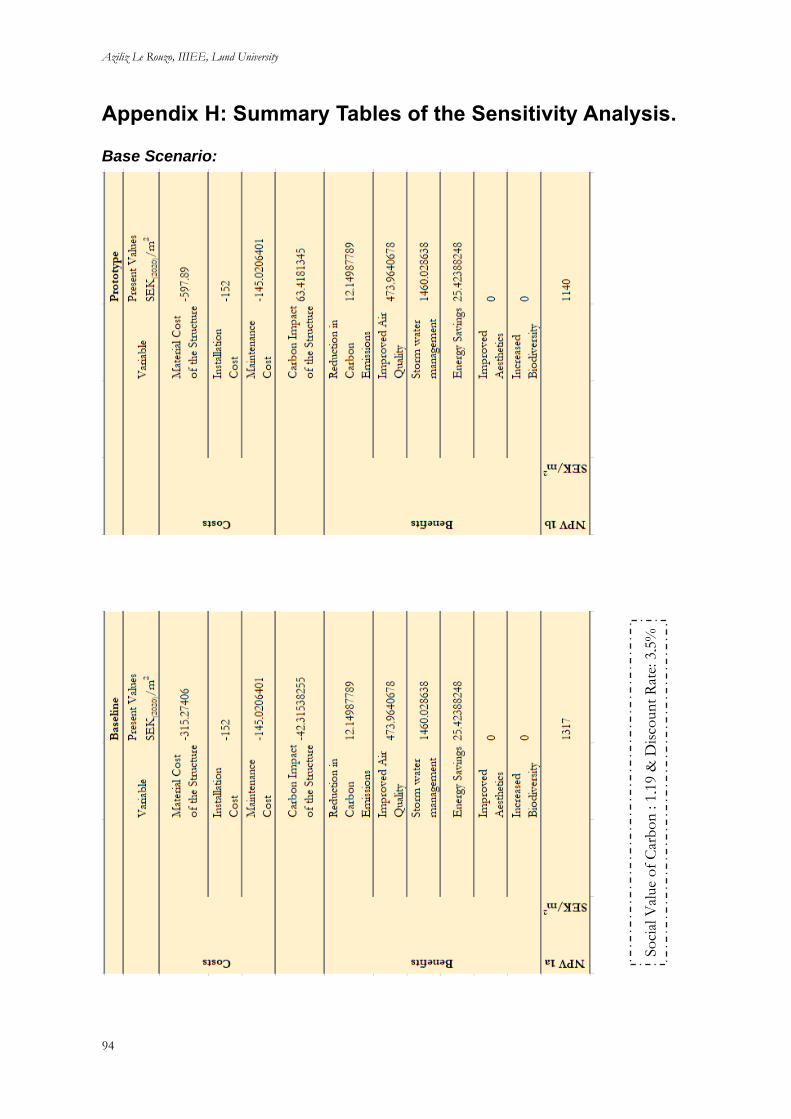
Aziliz Le Rouzo, IIIEE, Lund University
94
Appendix H: Summary Tables of the Sensitivity Analysis.
Base Scenario:
So
cial
Val
ue
of
Car
bo
n : 1
,19 &
Dis
coun
t R
ate:
3,5
%

Re-Thinking Greeen Roof Design
95
Scenario 1:
So
cial
Val
ue
of
Car
bo
n : 1
,19 &
Dis
coun
t R
ate:
1,4
%

Aziliz Le Rouzo, IIIEE, Lund University
96
Scenario 2:
So
cial
Val
ue
of
Car
bo
n : 7
& D
isco
un
t R
ate:
1.4
%
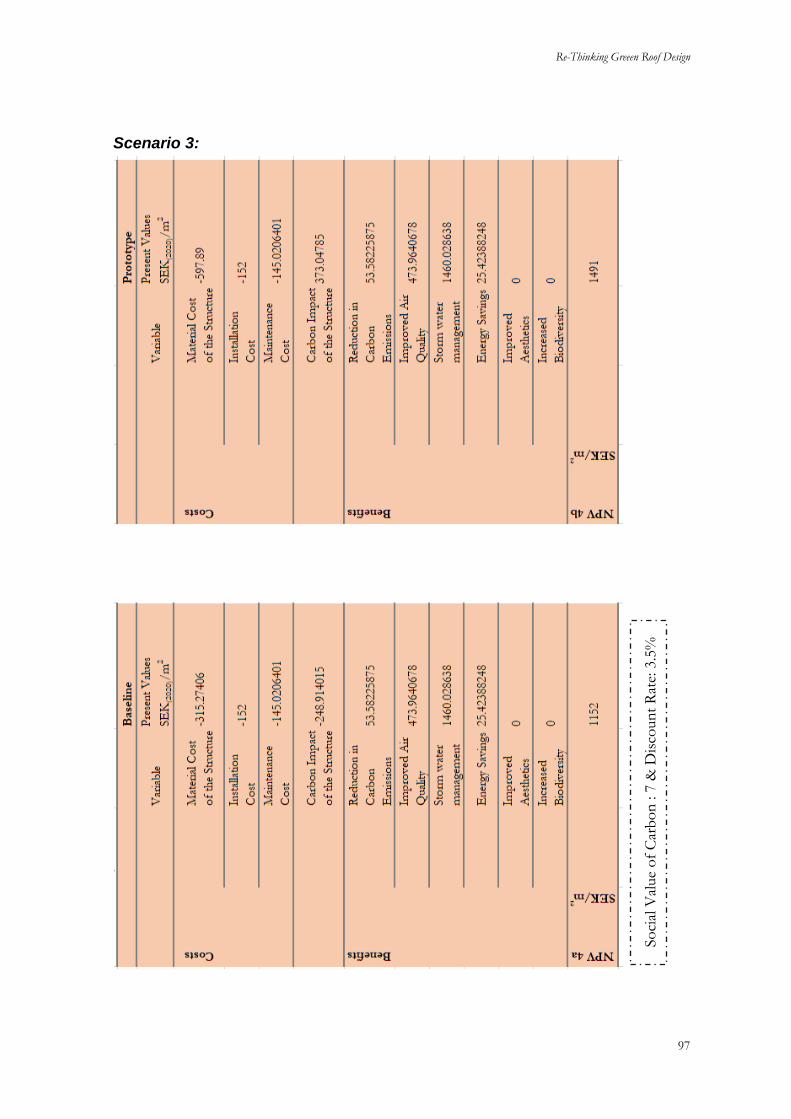
Re-Thinking Greeen Roof Design
97
Scenario 3:
So
cial
Val
ue
of
Car
bo
n : 7
& D
isco
un
t R
ate:
3.5
%
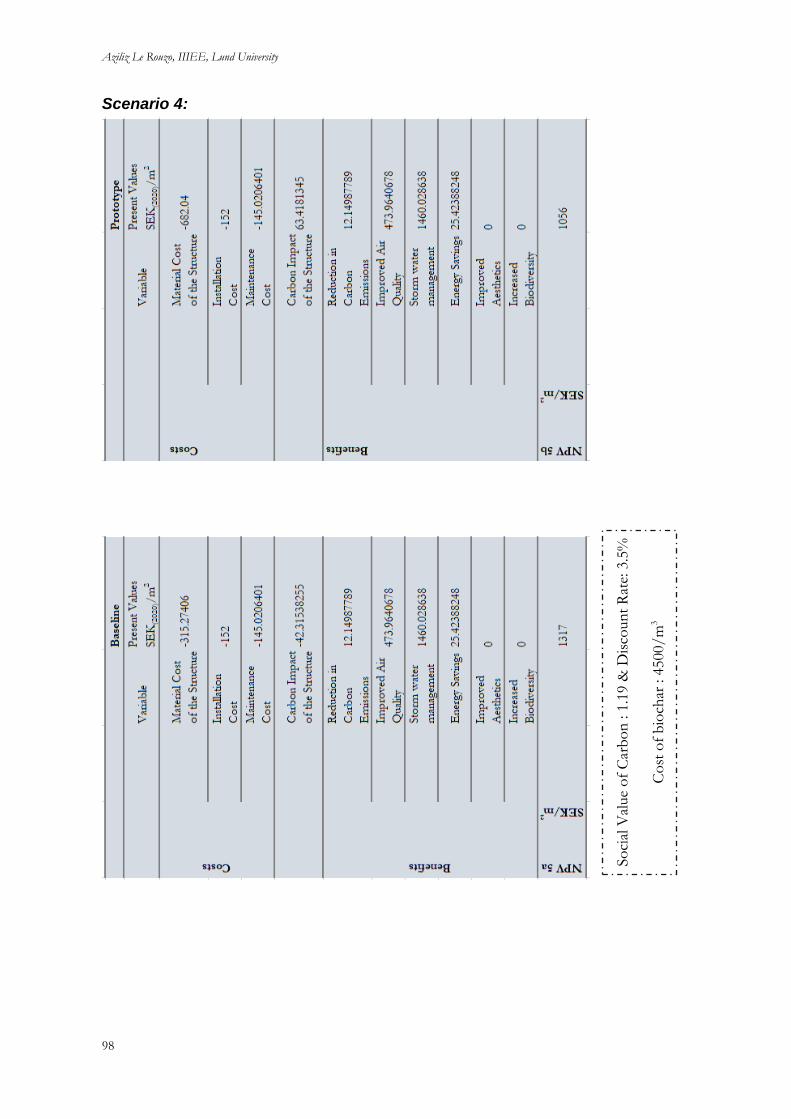
Aziliz Le Rouzo, IIIEE, Lund University
98
Scenario 4:
So
cial
Val
ue
of
Car
bo
n : 1
.19 &
Dis
coun
t R
ate:
3.5
%
Co
st o
f b
ioch
ar : 4
500/m
3
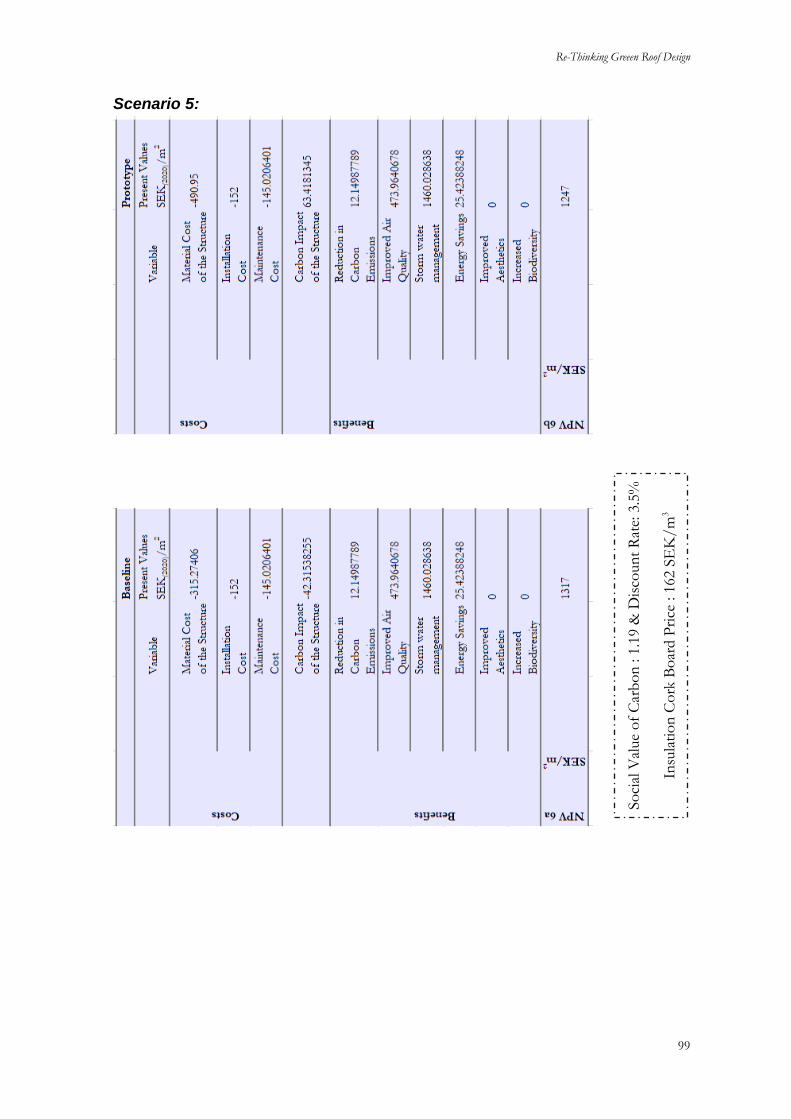
Re-Thinking Greeen Roof Design
99
Scenario 5:
So
cial
Val
ue
of
Car
bo
n : 1
.19 &
Dis
coun
t R
ate:
3.5
%
Insu
lati
on
Co
rk B
oar
d P
rice
: 1
62 S
EK
/m
3

Aziliz Le Rouzo, IIIEE, Lund University
100
Scenario 6:
So
cial
Val
ue
of
Car
bo
n : 1
.19 &
Dis
coun
t R
ate:
3.5
%
Aes
thet
ic B
enef
it: 185.2
4 S
EK
/m
3

Re-Thinking Greeen Roof Design
101
Scenario 7:
So
cial
Val
ue
of
Car
bo
n : 1
.19 &
Dis
coun
t R
ate:
3.5
%
Aes
thet
ic B
enef
it: 185.2
4 S
EK
/m
3 &
In
sula
tio
n C
ork
Bo
ard P
rice
: 1
62 S
EK
/m
3 &
Co
st o
f b
ioch
ar : 4
500/m
3
Aziliz Le Rouzo, IIIEE, Lund University
102
Appendix I: Communication records
Continuous Communication
Jonatan Malmberg, Project & Development Manager at the Scandinavian Green Roof Institute
Email Interviews
David Andersson, CEO at ECOERA, personal communication, 24th February 2020
Malmö Stad, SEF Stadsfastigheter, personal communication, 20th March 2020
Paula Carey, Director at Carbon8, personal communication, February 27th 2020
Urban Biodiversity & Green Infrastructure Expert, personal communication, March 27th 2020
ZinCo representative, personal communication, February 19th 2020
Communication by Topic
Information on the total area in Malmö Covered by Green Roofs: Valuable help and information was obtained from all these contacts which allowed to come up with an estimated 29,652 square meters of green roofs on municipally administrated buildings in Malmö, given by a representative from SEF Stadsfastigheter (Malmö Stad).
- Malmö Stad - Environment Department
- Malmö Stad - Service management – Environmental Coordinator
- Johan Niss, The County Administrative Board of Skåne - Malmö Stad - SEF Stadsfastigheter - MKB: general office & project leader environmental development
Information on the price of materials (most notable communications):
Biochar:
- Email contact with a representative from Ecotopic. - Email contact with a representative from Ecoera.
Cork:
- Email and phone contact with Kåre Fjalland - Amorim Ambassador – Korkbyg - Email and phone contact with a Sales Manager at Amorim Cork Insulation
Carbon8:
- Email contact with Paula Carey – Director of Carbon8 Systems - Phone contact with another representative from Carbon8 Systems
Compost:
- Phone contact with an employee of Sysav: https://www.sysav.se/Privat/
Re-Thinking Greeen Roof Design
103
Pumice:
- Phone contact with a representative of JEI: https://jei.is/
Waterproofing Layer and Insulation Board:
- Email and phone contact with the Sales Manager at Soprema Sweden
Stone Wool:
- Phone contact with a representative of Saint-Gobain Isover Sweden
LECA:
- Phone contact with a representative of LECA Sweden
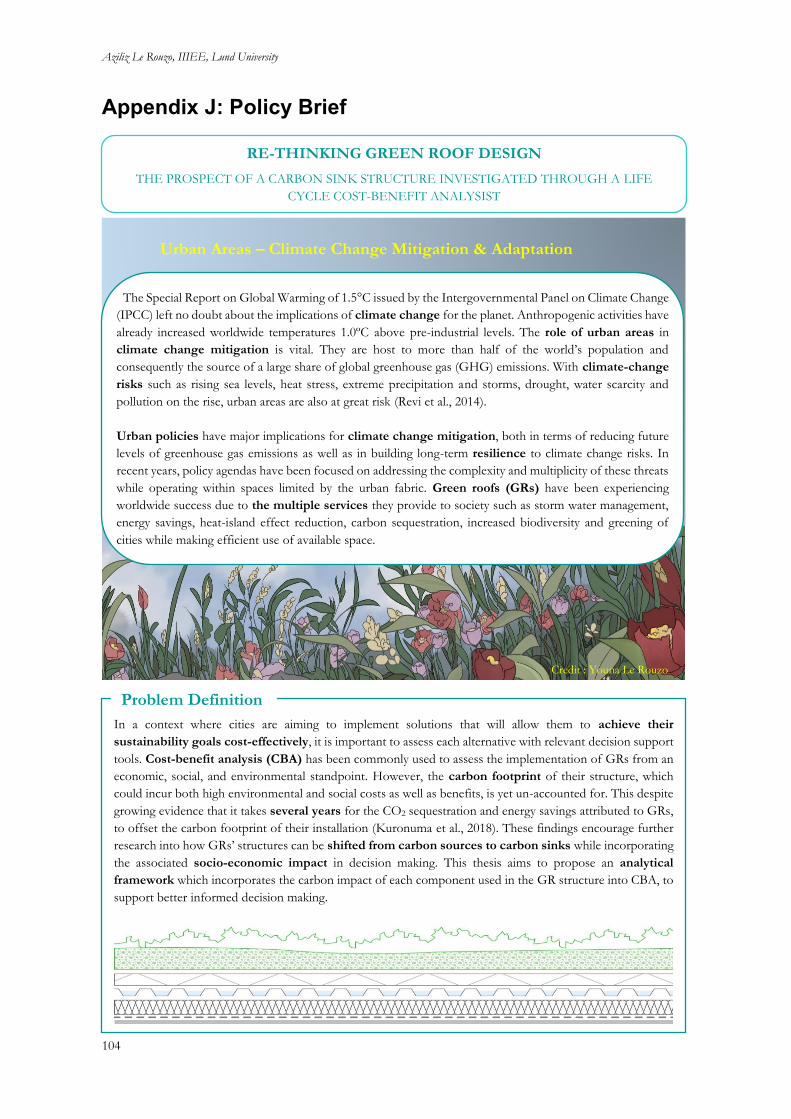
Aziliz Le Rouzo, IIIEE, Lund University
104
Appendix J: Policy Brief
RE-THINKING GREEN ROOF DESIGN
THE PROSPECT OF A CARBON SINK STRUCTURE INVESTIGATED THROUGH A LIFE
CYCLE COST-BENEFIT ANALYSIST
The Special Report on Global Warming of 1.5°C issued by the Intergovernmental Panel on Climate Change
(IPCC) left no doubt about the implications of climate change for the planet. Anthropogenic activities have
already increased worldwide temperatures 1.0ºC above pre-industrial levels. The role of urban areas in
climate change mitigation is vital. They are host to more than half of the world’s population and
consequently the source of a large share of global greenhouse gas (GHG) emissions. With climate-change
risks such as rising sea levels, heat stress, extreme precipitation and storms, drought, water scarcity and
pollution on the rise, urban areas are also at great risk (Revi et al., 2014).
Urban policies have major implications for climate change mitigation, both in terms of reducing future
levels of greenhouse gas emissions as well as in building long-term resilience to climate change risks. In
recent years, policy agendas have been focused on addressing the complexity and multiplicity of these threats
while operating within spaces limited by the urban fabric. Green roofs (GRs) have been experiencing
worldwide success due to the multiple services they provide to society such as storm water management,
energy savings, heat-island effect reduction, carbon sequestration, increased biodiversity and greening of
cities while making efficient use of available space.
Urban Areas – Climate Change Mitigation & Adaptation
In a context where cities are aiming to implement solutions that will allow them to achieve their
sustainability goals cost-effectively, it is important to assess each alternative with relevant decision support
tools. Cost-benefit analysis (CBA) has been commonly used to assess the implementation of GRs from an
economic, social, and environmental standpoint. However, the carbon footprint of their structure, which
could incur both high environmental and social costs as well as benefits, is yet un-accounted for. This despite
growing evidence that it takes several years for the CO2 sequestration and energy savings attributed to GRs,
to offset the carbon footprint of their installation (Kuronuma et al., 2018). These findings encourage further
research into how GRs’ structures can be shifted from carbon sources to carbon sinks while incorporating
the associated socio-economic impact in decision making. This thesis aims to propose an analytical
framework which incorporates the carbon impact of each component used in the GR structure into CBA, to
support better informed decision making.
Credit : Youna Le Rouzo
Problem Definition
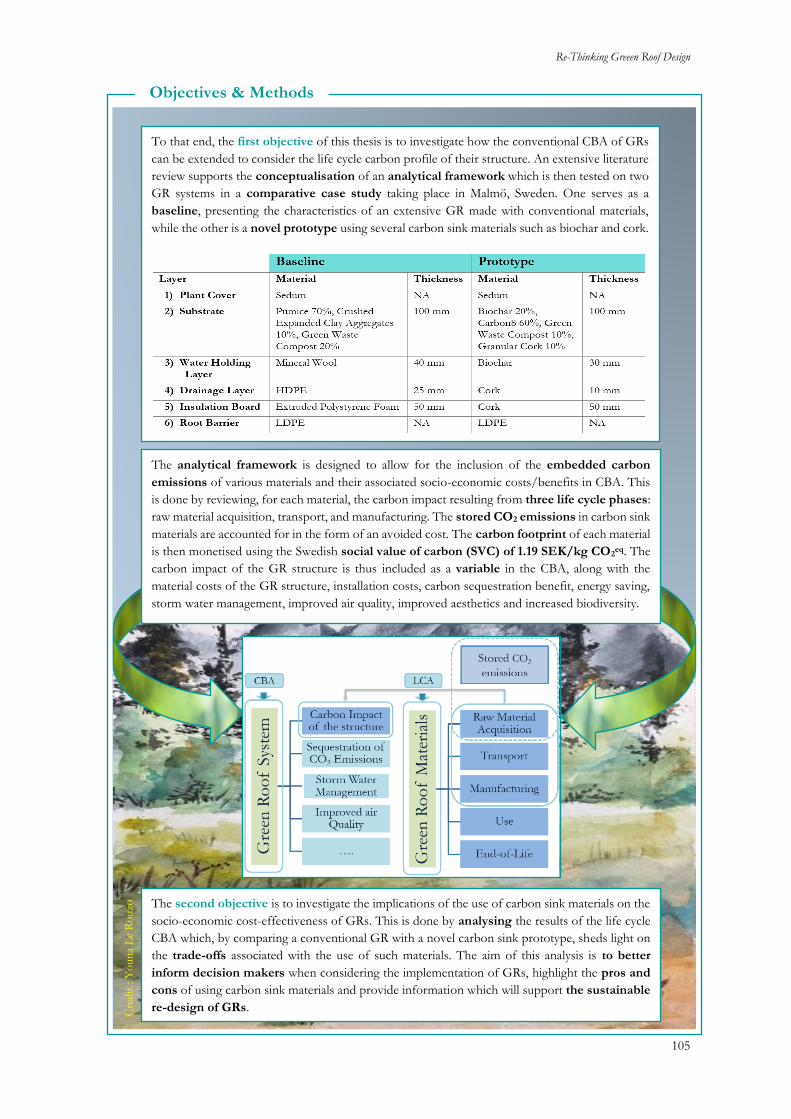
Re-Thinking Greeen Roof Design
105
To that end, the first objective of this thesis is to investigate how the conventional CBA of GRs
can be extended to consider the life cycle carbon profile of their structure. An extensive literature
review supports the conceptualisation of an analytical framework which is then tested on two
GR systems in a comparative case study taking place in Malmö, Sweden. One serves as a
baseline, presenting the characteristics of an extensive GR made with conventional materials,
while the other is a novel prototype using several carbon sink materials such as biochar and cork.
0
The analytical framework is designed to allow for the inclusion of the embedded carbon
emissions of various materials and their associated socio-economic costs/benefits in CBA. This
is done by reviewing, for each material, the carbon impact resulting from three life cycle phases:
raw material acquisition, transport, and manufacturing. The stored CO2 emissions in carbon sink
materials are accounted for in the form of an avoided cost. The carbon footprint of each material
is then monetised using the Swedish social value of carbon (SVC) of 1.19 SEK/kg CO2eq. The
carbon impact of the GR structure is thus included as a variable in the CBA, along with the
material costs of the GR structure, installation costs, carbon sequestration benefit, energy saving,
storm water management, improved air quality, improved aesthetics and increased biodiversity.
The second objective is to investigate the implications of the use of carbon sink materials on the
socio-economic cost-effectiveness of GRs. This is done by analysing the results of the life cycle
CBA which, by comparing a conventional GR with a novel carbon sink prototype, sheds light on
the trade-offs associated with the use of such materials. The aim of this analysis is to better
inform decision makers when considering the implementation of GRs, highlight the pros and
cons of using carbon sink materials and provide information which will support the sustainable
re-design of GRs.
Cre
dit
: Y
oun
a L
e R
ouzo
Objectives & Methods

Aziliz Le Rouzo, IIIEE, Lund University
106
+
Results & Main Findings
Firstly, while the baseline and the
prototype show very similar
structural characteristics, the
overwhelming use of plastic based
materials in one and carbon sink
materials in the other makes a major
difference in terms of their carbon
impact. The baseline has a positive
carbon footprint, resulting in socio-
economic costs of 42 SEK/m2,
while the prototype stores more
emissions than were emitted during
its production leading to avoided
socio-economic costs of 63
SEK/m2 of GR.
The main results of this study can be summarised as follows:
1
Secondly, the use of carbon sink materials in the prototype leads to significantly higher material costs.
These higher material costs are not completely offset by the avoided CO2 emissions stored in the
prototype. However, when considering the wide range of benefits that the prototype provides, it is
almost as profitable as the baseline with respective net present values (NPV) of 1,316.96 SEK/m2 for
the baseline and 1,140.07 SEK/m2 for the prototype.
2
Thirdly, while substituting
conventional materials incurs higher
material costs in most cases, there is
room for win-win situations. The
cork drainage layer, for example, is
cheaper than its plastic based
alternative and yields an important
benefit in terms of its carbon
impact. On the other hand, even
costly materials such as the
expanded cork board seem to be of
potential interest from a socio-
economic perspective as they
sharply reduce the carbon
footprint of the structure.
3 3. Change in the Material Costs & Carbon Impact of the Baseline vs. the Prototype
1. Climate Impact of the structure of the Baseline versus the Prototype - Comparative
Values in SEK/m2, where positive values represent a benefit and negative values
represent a cost.
To conclude, what this study suggests is that by using carbon sink materials, GRs can continue to act as a
climate adaptation solution in cities, while their carbon mitigation potential is also improved. From
a CO2 mitigation perspective, it is crucial that cities such as Malmö start investing in GR designs that
have a lower carbon impact. This study showed that a carbon sink GR design is easily achievable, in a
variety of ways, but that it comes with higher material costs which would likely discourage private
investors. Therefore, future research should investigate how governmental incentives, such as market-
based instruments or public procurement, could give further incentives for private actors to invest in GR
systems that have a lower carbon footprint. This needs to be supported by further research on the carbon
footprint of the GR structure and its inclusion in decision making.
Related Documents