69 1. MATERIALS 1.1. SAMPLES SELECTED FOR STUDY Fresh petals of Borage (Echium amoenum) belonging to Borago officinalis family and Valerian (Valerian officinalis) belonging to valerianaceae were collected from a farm near Ardebil (a city in north western of Iran). Dry Ginger (Zingiber officinale) belonging to Zingiberaceae family were powdered from local market of Mysore city. Dry Shallot (Allium ascalonicum) belonging to Amaryllidaceae family and Lime (Citrus aurantifolia) belonging to Rutaceae family were procured from Tehran, Iran, local market. Samples were identified by a taxonomist. All the samples were washed with distilled water and dried in oven at 40ºC, for 36 hours ground and stored in air tight container under refrigeration at 4ºC. 1.2. CHEMICALS USED FOR THE STUDY The chemicals used for the study were procured from Qualigen Company Mumbai, India, Himedia Company, Mumbai, India and Sigma Company, USA. They were all of analytical grade. Glass double distilled water, methanol, ethanol, acetone, 80% methanol and 80% ethanol were used for extraction.

Welcome message from author
This document is posted to help you gain knowledge. Please leave a comment to let me know what you think about it! Share it to your friends and learn new things together.
Transcript
69
1. MATERIALS
1.1. SAMPLES SELECTED FOR STUDY
Fresh petals of Borage (Echium amoenum) belonging to Borago officinalis family and
Valerian (Valerian officinalis) belonging to valerianaceae were collected from a farm
near Ardebil (a city in north western of Iran). Dry Ginger (Zingiber officinale) belonging
to Zingiberaceae family were powdered from local market of Mysore city. Dry Shallot
(Allium ascalonicum) belonging to Amaryllidaceae family and Lime (Citrus aurantifolia)
belonging to Rutaceae family were procured from Tehran, Iran, local market. Samples
were identified by a taxonomist. All the samples were washed with distilled water and
dried in oven at 40ºC, for 36 hours ground and stored in air tight container under
refrigeration at 4ºC.
1.2. CHEMICALS USED FOR THE STUDY
The chemicals used for the study were procured from Qualigen Company Mumbai, India,
Himedia Company, Mumbai, India and Sigma Company, USA. They were all of
analytical grade. Glass double distilled water, methanol, ethanol, acetone, 80% methanol
and 80% ethanol were used for extraction.
70
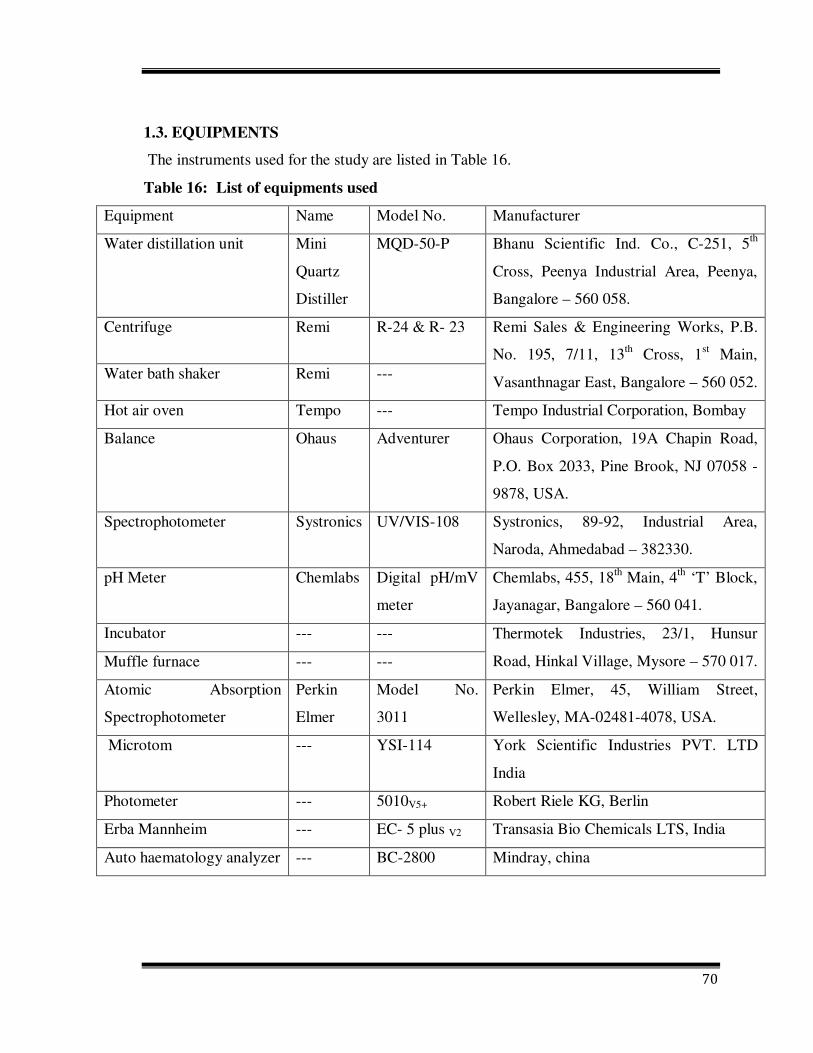
1.3. EQUIPMENTS
The instruments used for the study are listed in Table 16.
Table 16: List of equipments used
Equipment Name Model No. Manufacturer
Water distillation unit Mini
Quartz
Distiller
MQD-50-P Bhanu Scientific Ind. Co., C-251, 5th
Cross, Peenya Industrial Area, Peenya,
Bangalore – 560 058.
Centrifuge Remi R-24 & R- 23 Remi Sales & Engineering Works, P.B.
No. 195, 7/11, 13th Cross, 1st Main,
Vasanthnagar East, Bangalore – 560 052. Water bath shaker Remi ---
Hot air oven Tempo --- Tempo Industrial Corporation, Bombay
Balance Ohaus Adventurer Ohaus Corporation, 19A Chapin Road,
P.O. Box 2033, Pine Brook, NJ 07058 -
9878, USA.
Spectrophotometer Systronics UV/VIS-108 Systronics, 89-92, Industrial Area,
Naroda, Ahmedabad – 382330.
pH Meter Chemlabs Digital pH/mV
meter
Chemlabs, 455, 18th Main, 4th ‘T’ Block,
Jayanagar, Bangalore – 560 041.
Incubator --- --- Thermotek Industries, 23/1, Hunsur
Road, Hinkal Village, Mysore – 570 017. Muffle furnace --- ---
Atomic Absorption
Spectrophotometer
Perkin
Elmer
Model No.
3011
Perkin Elmer, 45, William Street,
Wellesley, MA-02481-4078, USA.
Microtom --- YSI-114 York Scientific Industries PVT. LTD
India
Photometer --- 5010V5+ Robert Riele KG, Berlin
Erba Mannheim --- EC- 5 plus V2 Transasia Bio Chemicals LTS, India
Auto haematology analyzer --- BC-2800 Mindray, china
71
2. STUDY DESIGN
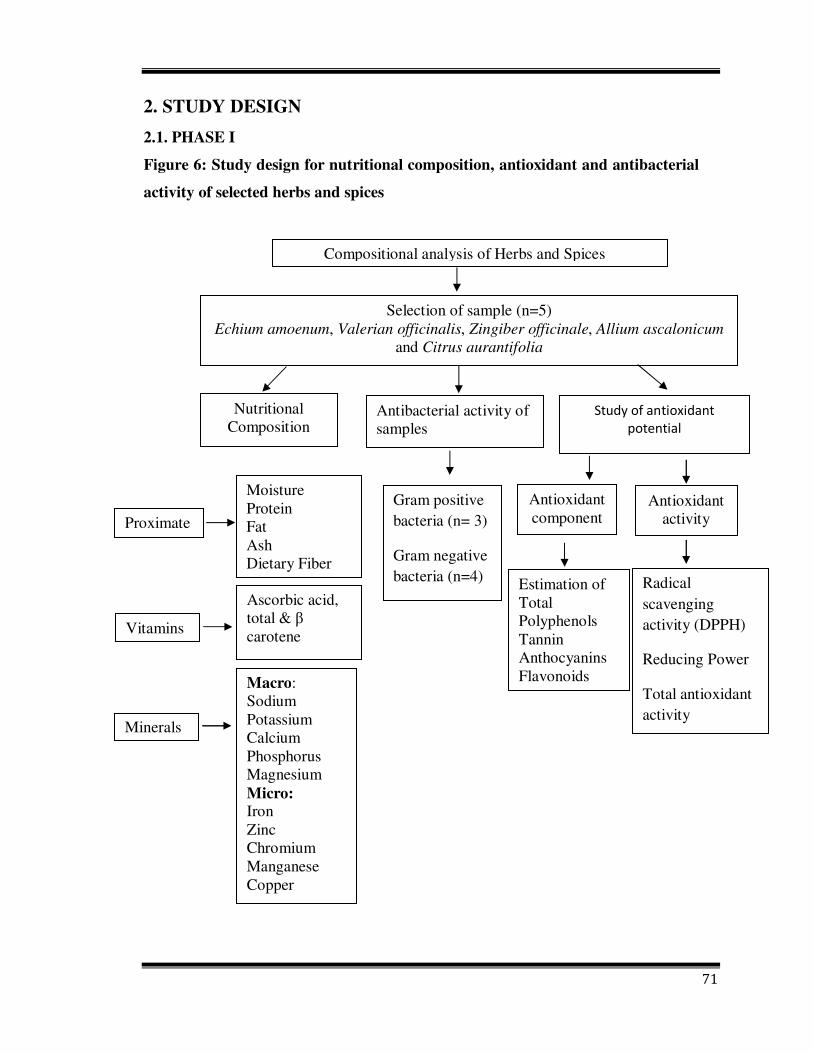
2.1. PHASE I
Figure 6: Study design for nutritional composition, antioxidant and antibacterial
activity of selected herbs and spices
Compositional analysis of Herbs and Spices
Moisture Protein Fat Ash Dietary Fiber
Ascorbic acid, total & β carotene
Macro: Sodium Potassium Calcium Phosphorus Magnesium Micro: Iron Zinc ChromiumManganeseCopper
Selection of sample (n=5) Echium amoenum, Valerian officinalis, Zingiber officinale, Allium ascalonicum
and Citrus aurantifolia
Nutritional Composition
Study of antioxidant
potential
Vitamins
Proximate
Minerals
Antioxidant component
Antioxidant activity
Estimation of Total Polyphenols Tannin Anthocyanins Flavonoids
Radical scavenging activity (DPPH)
Reducing Power
Total antioxidant activity
Antibacterial activity of samples
Gram positive bacteria (n= 3)
Gram negative bacteria (n=4)
72
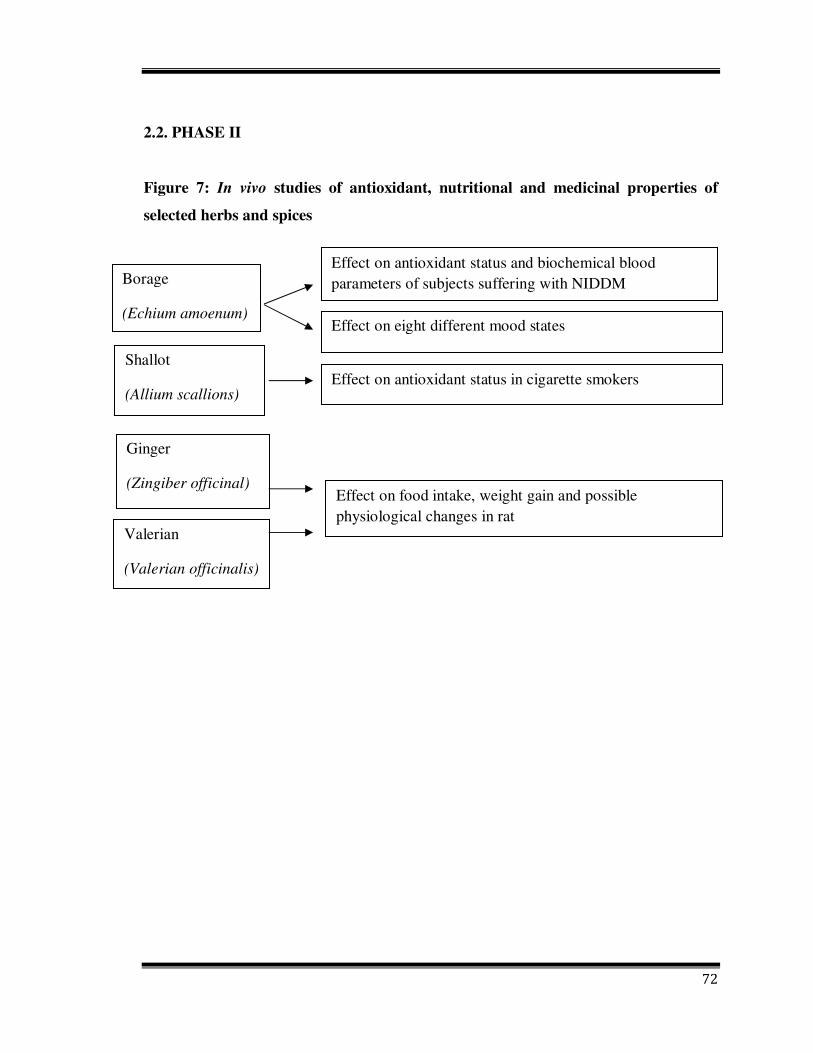
2.2. PHASE II
Figure 7: In vivo studies of antioxidant, nutritional and medicinal properties of
selected herbs and spices
Effect on antioxidant status and biochemical blood parameters of subjects suffering with NIDDM
Effect on eight different mood states
Effect on antioxidant status in cigarette smokers
Effect on food intake, weight gain and possible physiological changes in rat
Borage
(Echium amoenum)
Ginger
(Zingiber officinal)
Valerian
(Valerian officinalis)
Shallot
(Allium scallions)
73
PHASE I –
3. METHODOLOGY
3.1. NUTRITIONAL COMPOSITION, ANTIOXIDANT AND
ANTIBACTERIAL ACTIVITY OF SELECTED HERBS AND SPICES
3.1.1. Preprocessing
The fresh were procured from the local markets or field locations. The petals of borage,
whole fruit of lime, root of valerian, ginger and shallot were separated from other part of
plant and washed under running water followed by double glass-distilled water. Double
glass-distilled water was used for preparation of reagents used in the entire analysis. All
chemicals used for the study were of analytical grade.
The samples were dried in a hot air oven at 50 ± 5°C for 10 - 12 h, finely powdered and
stored in airtight containers for analysis. Moisture, vitamins (ascorbic acid, total and β-
carotene), protein, fat, ash, dietary fiber (soluble and insoluble), minerals (iron, calcium,
phosphorus, copper, zinc, manganese and chromium) were determined with standard
techniques.
3.1.2. Chemical Analysis
Sample preparation for determination of antioxidant activity:
250 mg of samples were mixed with 25 ml of extraction media and extracted for 3 hours,
centrifuged at 4000 rpm for 20 min, and passed through filter paper (Whatman No.1) to
get clear extract. Water extracts were taken at 30°C and 100°C and solvent extracts at 10
to 12ºC.
a) Analysis of Proximate Constituents
i) Moisture
The moisture content of green leafy vegetables was estimated by AOAC method
(9261.12,41.1.02) (Horwitz and Latimer, 2005). A known amount of sample was
taken in a petri plate and dried in an oven. The dry weight of the sample was
determined by repeated consistent weighing. The moisture content was then
calculated using the following formula.

74
Moisture %� Initial weight � Final weight
Weight of sample� 100
ii) Total protein
The estimation of nitrogen was done by Kjeldhal method that depends on the fact that
organic nitrogen when digested with sulphuric acid in the presence of a catalyst is
converted into ammonium sulphate. Ammonia liberated by making the solution alkaline
is distilled into a known volume of a standard acid, which is then back titrated. The
protein content was obtained by multiplying the nitrogen value with 6.25 (Horwitz and
Latimer, 2005) (960.52,12.1.07).
iii) Total Fat
Fat is estimated as crude ether extract of the dry material. The dry sample (5 - 10 g) is
weighed accurately into a thimble and plugged with cotton. The thimble is placed in a
Soxhlet apparatus and extracted with petroleum ether for about 16 h. The ether extract is
filtered into a weighed conical flask. The flask containing the ether extract is washed 4 -
5 times with small quantities of ether and the washings are also transferred. The ether is
then removed by evaporation, the flask with the residue dried in an oven at 80 - 100°C,
cooled in a dessicator and weighed (Horwitz and Latimer, 2005) (948.22,40.1.05).
Fat content Wt. of ether extract
Wt. of sample� 100
iv) Ash
The grayish white residue that remains after the food sample taken in a silica crucible is
charred on a hot plate, incinerated in a muffle furnace at 600°C for 3 - 5 h and weighed is
total ash (Horwitz and Latimer, 2005) (942.05,4.1.10).
75
Ash contentsg per 100g sample� Wt. of ash after incineration
Wt. of the sample taken� 100
v) Total Iron
To a known volume of mineral solution (taken from the total ash as described
previously), 1.0 ml each of 30% H2SO4 and 7% potassium persulphate solution and 1.5
ml of 40% potassium thiocyanate solution were added with thorough mixing. The red
color that developed was measured within 20 min at 540 nm. Similarly a standard curve
was generated by using ferrous ammonium sulphate. The iron content of sample was then
read off from the standard curve (Horwitz and Latimer, 2005)
vi) Phosphorous
Phosphorus was determined by treating the ash solution with ammonium molybdate and
the phosphomolybdate thus formed was reduced and the blue color that developed was
estimated colorimetrically at 660 nm (Horwitz and Latimer, 2005).
vii) Calcium
Calcium is precipitated as calcium oxalate. The precipitate is dissolved in hot dilute
H2SO4 and titrated against standard potassium permanganate (Helrich, 1990).
Pipette an aliquot (25 ml) of the ash solution obtained by dry ashing to a 250 ml conical
flask. Dilute to 150 ml with water. Add a few drops of methyl red indicator (0.5 g in 100
ml of 95% alcohol) and neutralize the mixture with ammonia (concentrated) till the pale
pink color changes to yellow. Heat the solution to boiling point, add 10 ml of ammonium
oxalate (6%) and boil again for a few min. Add glacial acetic acids (concentrated) till
color of the mixture is distinctly pink. Allow to stand at room temperature for at least 4 h
or preferably overnight. Filter through Whatman No. 42 paper and wash with warm
water, till the filtrate is oxalate free. (Since HCl had been used for preparing the ash
solution, it is convenient to test for the absence of chloride using AgNO3). Add 5 - 10 ml
of dilute H2SO4 (2N) on the filter paper, break the point of the filter paper with a pointed
glass rod and transfer it to the conical flask. The solution is heated to 70°C and titrated
against 0.01 N KMnO4 to a permanent pale pink color.
76
Calculation: 1 ml of 0.01N KMnO4 = 0.2004 mg of calcium
If the normality of standard KMnO4 solution is not exactly 0.01N, the following formula
can be used.
Calcium mg/ 100 g
Titer value � normality of KMnO4 � 0.2004 � Total volume of ash solution
ml of ash solution taken for estimation � weight of sample taken for ashing
� 100
viii) Trace mineral
Zinc, copper, manganese and chromium were analyzed by atomic absorption
spectrophotometer (AAS). In AAS, a light radiation from a specific wavelength from a
hollow cathode lamp (HCL-cathode made of specific metal to be assayed) passes through
the flame to the detector. The ash solution is aspirated into the flame (Temperature =
24000 C). The sample is atomized in the flame, where the atoms of the element which are
in the ground state, absorb energy from the hollow cathode lamp radiation and go to the
excited state. The amount of radiation energy absorbed by the element is proportional to
its concentration of metal under assay.
Instrument parameters such as resonant wavelength, slit width and air-acetylene flow rate
that are appropriate for each element were selected (AOAC, 2000). The instrument was
set up and calibrated as per the guidelines in the manual provided by the manufacturer. A
calibration curve (Concentration Vs absorbance) for each mineral to be determined was
prepared using a range of working standards. The flame parameters were optimized in
accordance with the instrument manufacturer’s instructions.
The standard solutions were read before and after each group of 6 - 12 samples. The
burner was flushed with water between samples and zero was reestablished each time.
Suitable dilutions of the ash solutions were made to read the content of the minerals in
the ash solution. In case of sodium and potassium assay, the ash solutions as well as
standard sodium and potassium should have a cesium content of 0.5% (w/v). Lanthanum
chloride solution was added to the final dilution of each standard and test dilution to
make 0.1% (w/v) lanthanum for determination of magnesium only. The concentration of
77
metals in ash solutions of samples as well as in blank solutions were read from the
calibration curve and the concentration in the test sample calculated taking into account
the dilutions and the weight of the sample taken.
Calculation:
Concenteration of metal in sample µg metal per g sample� CS � CB� � V � D
W
Where: CS = Conc. of metal in ash solution of sample (µg/ml) CB = Conc. of metal in blank solution (µg/ml) V = Volume of ash solution made up (ml) D = Dilution volume (ml)/aliquot taken for dilution (ml), if original solution is diluted W = Sample weight (g)
ix) Total dietary fiber
The method is based on the separation of non-starch polysaccharide by enzymatic and
gravimetric method. This method measures the dietary fiber equivalent to physiologically
unavailable fiber (Asp et al., 1983).
Weigh 1 g of sample in a 100 ml conical flask. Add 25 ml of 0.1M sodium phosphate
buffer (pH 6.0), 100 mg of diastase and incubate at 37°C for 30 min. Inactivate enzymes
by boiling in a water bath for 15 min. Cool, add 20 ml distilled water and adjust pH to 2.5
with 4M HCl. Add 100 mg pepsin and incubate at 40°C for 1 h with shaking. Add 20 ml
water and adjust pH to 6.8 with 4M NaOH. Add 100 mg pancreatin, cover and incubate
for 1 h at 40°C with shaking. Adjust the pH to 4.5 with 4M HCl. Filter through a dry and
weighed G2 crucible containing 0.5 g of celite. Wash with 2 X 10 ml of water, 2 X 10 ml
of 95% ethanol and 2 X 10 ml of acetone. The residue in the crucible is insoluble fiber,
which was dried at 105°C to get constant weight (D1). To determine the ash content, it
was incinerated at 550°C for 5 - 6 h, cooled in a dessicator and weighed (I1). Correction
for in vitro indigestible protein was made by determining the nitrogen using Kjeldhal
method and converting it to protein by multiplying with 6.25.
The volume of the filtrate and water washings of the residue was made up to 100 ml. To
this 200 ml warm (∼ 60°C) 95% ethanol was added and allowed to precipitate for 1 h. It
was then filtered through another dry and weighed G2 crucible containing 0.5 g of celite.
78
Its residue was then washed with 2 X 10 ml of 78% ethanol, 2 X 10 ml of 95% ethanol
and 2 X 10 ml of acetone. The crucible was then dried at 105°C and weighed after
cooling in a dessicator to get constant weight (D2). Incineration (I2) and correction for
protein was done in the same way as stated above for insoluble fiber.
Blank values were obtained by following the above procedure without sample. The blank
values were checked occasionally with each batch of enzyme.
Insoluble Dietary Fiber %
Wt. after drying D1� � Wt. after incineration I1� � Blank B1�
Weight of the sample� 100
Soluble Dietary Fiber
Wt. after drying D2� � Wt. after incineration I2� � Blank B1�
Weight of the sample � 100
x) Ascorbic acid
It was estimated by a visual titrimetric method using 2, 6-dichlorophenol indopenol dye
which is blue in alkaline solution and red in acid solution and turns colorless when
reduced by ascorbic acid (Horwitz and Latimer, 2005).
xi) Total and ββββ-Carotene
Samples extracted in acetone and transferred to petroleum ether phase. Total carotene is
read colorimetrically using petroleum ether for baseline correction. β-carotene was
separated by column chromatography and read colorimetrically (Ranganna, 1986).
Weigh 0.5 - 1.0 g sample, grind in a pestle and mortar with acetone. Use pure sand if
necessary to assist grinding. Filter through a wad of cotton into a conical flask. Continue
extraction and filtration. Transfer the residue to a separating funnel. Add 10 -15 ml of
petroleum ether (60-80ºC), transfer pigments into the ether phase by diluting the acetone
with water. Repeat the extraction of the acetone phase with small volumes of petroleum
ether if necessary until no more color is extracted. Filter the petroleum ether extract
through anhydrous Na2SO4 and note the volume.
79
Plug the adsorption tube with non-absorbent cotton, add the adsorbent (Aluminium oxide,
neutral) and pack it tight till column is approximately 10 cm length. Place 1 cm Na2SO4
over the top of the column. Wet the column with 25 - 50 ml of the petroleum ether. While
the last ml of petroleum ether is still above the Na2SO4, pipette out an aliquot (5 - 10 ml)
of the extract to be chromatographed into the column. Add successive portions of the
eluent (3% Acetone in petroleum ether), when the preceding one is just barely visible
above Na2SO4. β-carotene, which moves down the column prior to all the pigments, is
collected. Continue washing, till the desired pigments have moved off the column and the
eluent is colorless. Eluent is made up to a known volume and the intensity of color is
measured at 452 nm using 3% acetone in petroleum ether as blank.
Read the concentration of β-carotene in per ml of the solution from the standard curve.
To measure total carotene, pipette an aliquot of the petroleum ether extract of the sample
(unadsorbed) to a 100 ml volumetric flask containing 3 ml of acetone and dilute to 100
ml with petroleum ether. Measure the color at 452 nm.
Preparation of standard curve:
Weigh accurately 25 mg of β-carotene, dissolve in 2.5 ml of chloroform and make up to
250 ml with petroleum ether (1 ml = 0.1 mg or 100 µg). Dilute this solution to 100 ml
with petroleum ether (1 ml = 10 µg). Pipette 5, 10, 15, 25, and 30 ml of this solution to
separate 100 ml volumetric flasks, each containing 3 ml of acetone. Dilute to mark with
petroleum ether. The concentration will be 0.5, 1.0, 1.5, 2.0, 2.5 and 3.0 µg per ml.
Measure the color at 450 nm using 3% acetone in petroleum ether as blank. Plot
absorbance against concentration.
Calculation:
mg of total carotene/100 g 3.857 � Absorbance � Dilution � 100
Weight of sample
µg of β � carotene/100 g Conc. of carotene � Final volume � Dilution � 100
Weight of the sample
80
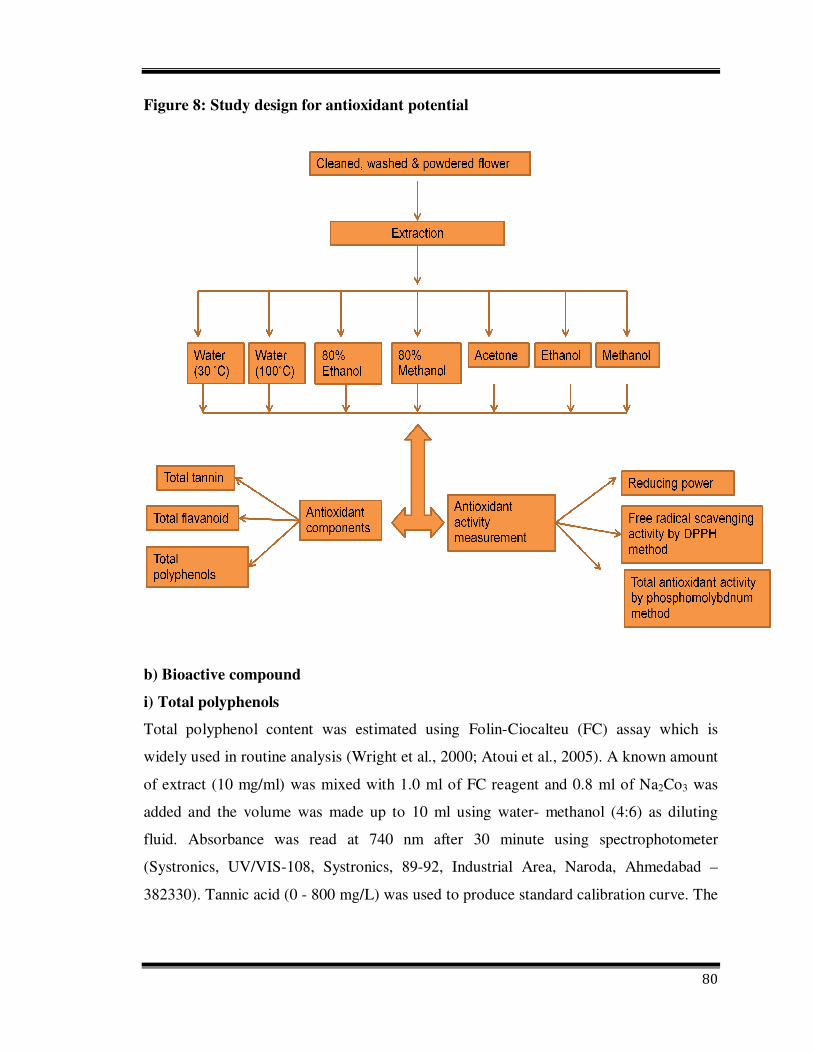
Figure 8: Study design for antioxidant potential
b) Bioactive compound
i) Total polyphenols
Total polyphenol content was estimated using Folin-Ciocalteu (FC) assay which is
widely used in routine analysis (Wright et al., 2000; Atoui et al., 2005). A known amount
of extract (10 mg/ml) was mixed with 1.0 ml of FC reagent and 0.8 ml of Na2Co3 was
added and the volume was made up to 10 ml using water- methanol (4:6) as diluting
fluid. Absorbance was read at 740 nm after 30 minute using spectrophotometer
(Systronics, UV/VIS-108, Systronics, 89-92, Industrial Area, Naroda, Ahmedabad –
382330). Tannic acid (0 - 800 mg/L) was used to produce standard calibration curve. The
81
total phenolic content was expressed in mg of tannic acid equivalents (TAE) /100 g of
sample (Matthaus, 2002).
ii) Total flavonoids
The total flavonoid content was estimated using the Dowd method as adapted by
(Arvouet-Grand et al., 1994). A 5.0 ml of 2 % aluminium trichloride (AlCl3) in methanol
was mixed with the same volume of the extract solution (10 mg/ml). Absorption readings
at 415 nm using Perkin Elmer UV-VIS spectrophotometer were taken after 10 minutes
against a blank sample consisting of extract solution with 5.0 ml methanol without AlCl3.
The total flavonoid content was determined using a standard curve with quercetin. Total
flavonoid content is expressed as g of quercetin equivalents / 100g of sample.
iii) Anthocyanin
The procedure involved extraction of the anthocyanins with ethanolic HCL and
measurement at wavelength of maximum absorption. 2.0g of sample was blended with 70
ml of ethanolic HCL. Extract was stored overnight in a refrigerator at 4°C. It was filtered
on a Whatman No.1 paper and made up to 100 ml. To prepare extract for
spectrophotometric measurement, 1.0 ml of sample was diluted to 10 ml. OD was taken
after storing the sample in dark for 2 hours and color was measured at the maximum
absorption (545 nm) (Ranganna, 1986).
iv) Total tannin
Colorimetric estimation of tannins is based on the measurement of blue colour formed by
the reduction of phosphotungstomolybdic acid by tannin like compounds in alkaline
solution (Ranganna, 1986). A known amount of extract was mixed with 5.0 ml of Folin-
Denis reagent (FD) and Na2Co3 solution and made up to 100 ml, mixed well and
absorbance was read at 760 nm after 30 minutes using spectrophotometer. Total tannin
content as expressed as mg tannic acid equivalent /100 g of sample.
82
c) Determination of antioxidant Activity of different extract
i) Free radical scavenging activity by DPPH (2, 2-diphenyl-1-picrylhydrazyl)
Effect of different extracts on DPPH free radical was measured according to Lee (1996).
Positive control (standard) was prepared by mixing 4.0 ml of ascorbic acid (0.05 mg/ml)
and 1.0 ml of DPPH (0.4 mg/ml) for water extract, and negative control (blank) was
prepared by mixing extract base (water/methanol/ethanol/acetone) with 1.0 ml of DPPH.
Four different concentration of extract was mixed with 4.0 ml of DPPH, the volume made
up to known volume and mixed well and left to stand at room temperature in a dark place
for 30 min. Absorbance was read using a spectrophotometer at 520 nm. The ability of
extract to scavenge DPPH was calculated using the following equation.
Free radical scavenging activity%� Control OD � Sample OD�
Control OD� 100
ii) Reducing power
In this assay, Fe3+/ferricyanide complex is reduced to the ferrous form by antioxidants.
The Fe2+ formed is monitored by measuring the formation of Perl’s Prussian blue at 700
nm. Different concentration of extracts was mixed with 2.5 ml phosphate buffer (0.2 M,
pH 6.6) and 2.5 ml of 1% potassium ferricyanide (10 mg ml-1). The mixture was
incubated at 50°C for 20 min, then rapidly cooled, mixed with 2.5 ml of 10%
trichloroactic acid and centrifuged at 6500 rpm for 10 min. The supernatant (2.5 ml) was
mixed with distilled water (2.5 ml) and then ferric chloride (0.5 ml, 0.1%) was added and
allowed to stand for 10 min. The absorbance was read spectrophotometrically at 700 nm
(Oyaizu, 1986).
iii) Total antioxidant activity by phosphomolybdenum method
The amount of 0.1 ml of extract (10mg/ml) was mixed with reagent solution (0.6 M
sulphuric acid, 28 mM sodium phosphate and 4 mM ammonium molybdate in 100 ml),
tubes capped and incubated in boiling water bath at 95°C for 90 minutes. Then cooled to
room temperature and absorbance was read at 695 nm with spectrophotometer against
83
blank. Water soluble antioxidant capacity expressed as equivalent of ascorbic acid
(µmol/g of sample) (Prieto et al., 1999).
3.1.3. Antibacterial study
a) Bacterial cultures
Clinical isolates of Escherichia coli (MTCC 7410), Klebsiella pneumonia (MTCC 7407),
Bacillus subtilis (MTCC 121), Bacillus cereus (MTCC 1272), Salmonella typhi (MTCC
733), Ps. aeruginosa (MTCC 424) and Staphylococcus aureus (MTCC 7443) were
obtained from Microbial Type Culture Collection, Chandigarh, India and they served as
test bacteria. All the test strains were maintained on nutrient agar slopes (Hi-Media) and
were subcultured once every two-week. These bacteria served as test pathogens for
antibacterial activity assay.
b) Antibacterial activity
Antibacterial activity of the different extracts was determined in water and methanolic
extract by cup diffusion method on nutrient agar medium (Anonymous, 1996). Cups are
made in nutrient agar plate using cork borer (5 mm) and inoculums containing CFU/ml of
bacteria were spread on the solid plates with a sterile swab moistened with the bacterial
suspension. Then 2-50 µL concentration of the aqueous extract and different solvent
extracts were placed in the cups made in inoculated plates, the treatments also included
50 µL of sterilized distilled water and respective solvents alone, which served as control.
All the plates were incubated for 24 hrs at 37ºC and zone of inhibition if any around the
wells after incubation was measured in mm (millimeter). For each treatment 12 replicates
were maintained.
c) Determination of Minimal Inhibitory Concentration (MIC)
MIC was determined by both dilution methods. 0.1ml of test bacteria (CFU/ml) were
inoculated to series of culture tubes (microdilution assays) (Valdeira et al., 2003) with
same volume of medium containing different concentrations of the aqueous extract (200-
1000 µg/ml). The lowest concentration of sample at which the subculture from test
dilution yielded no viable organisms was recorded as minimum bactericidal concentration
84
(Nazaruk and Jakoniuk, 2005). Each assay was performed in quadruplet. One tube was
left without aqueous extract to serve as positive control and other without aqueous extract
and inoculum to serve as negative control. The cultures were incubated at a temperature
optimal for growth of the test organism and a period of time sufficient for growth for at
least 10-15 generations (usually 24 hrs for bacteria at 37 °C). The tubes were inspected
visually to determine the growth of organisms by the presence of turbidity and the tubes
in which aqueous extract is present in minimum concentration sufficient to inhibit the
microbial growth which remains clear was noted as MIC of the extract.
85
Phase II
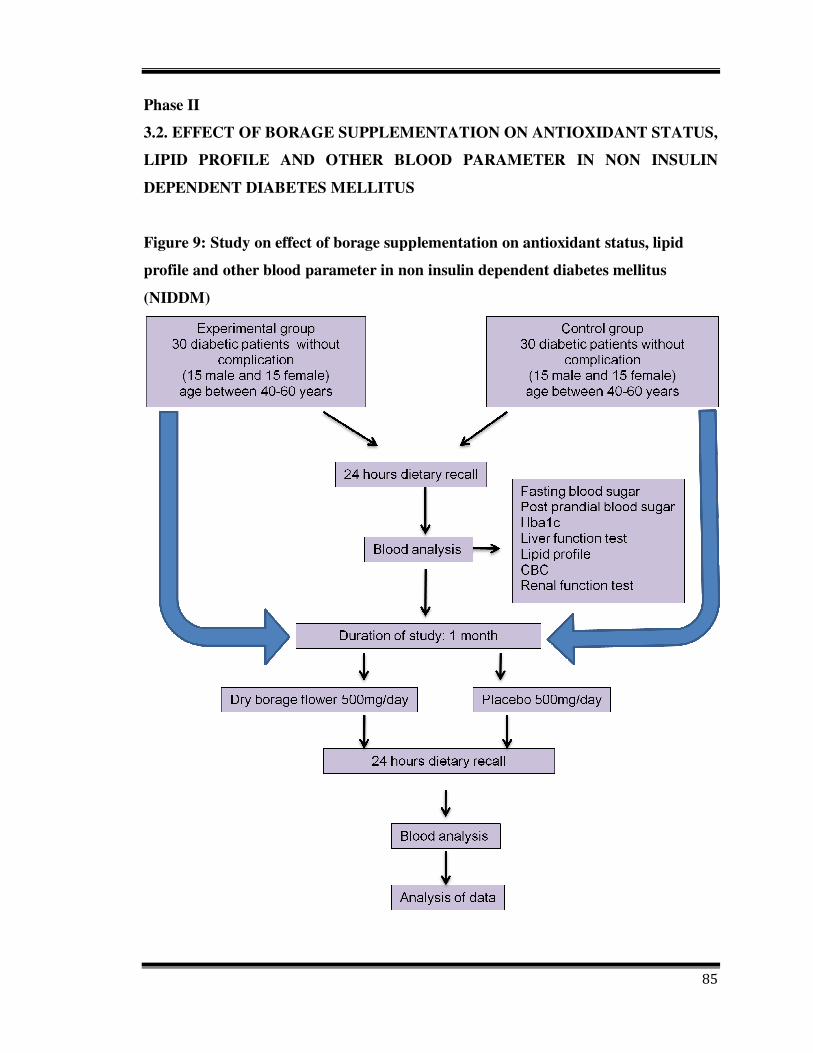
3.2. EFFECT OF BORAGE SUPPLEMENTATION ON ANTIOXIDANT STATUS,
LIPID PROFILE AND OTHER BLOOD PARAMETER IN NON INSULIN
DEPENDENT DIABETES MELLITUS
Figure 9: Study on effect of borage supplementation on antioxidant status, lipid
profile and other blood parameter in non insulin dependent diabetes mellitus
(NIDDM)
86
A clinical trial study with a total of 60 subjects was designed and the study approval was
taken from Human Ethical Committee, University of Mysore. Subjects were volunteer
suffering with NIDDM without any complication and 40 to 55 years old from Ashwini
Diabetes Clinic Mysore, Karnataka, India. Subjects were selected on a simple random
basis from volunteers. All participants were provided with specific written consents
which was obtained prior to entrance into the study. Each individual was extensively
interviewed for specific information like smoking, dietary habits, sports habits and
history of special disease. Dietary details of subjects were collected with 24 hours food
recall, before obtaining blood. Exclusion criteria included smoking, vitamin or mineral
supplementation. Experimental group were administered daily 500 mg of powdered dry
petals of E. amoenum in the form of capsule and control group were given placebo
capsules for 30 days.
The dose was selected on the basis of traditional use information.
3. 2.1. Plant Material
Capsules were filled with powdered E. amoenum in a hygienic condition by Ayur Drugs
and pharmaceuticals.
3.2.2. Plasma Preparation
Five milliliters of heparinized blood was collected from each subject before and after 30
days treatment, centrifuged at 1200 g for 10 min at 4ºC and plasma frozen at 80ºC until
analysis. Blood samples were collected 24 h after the last dose of capsule was taken.
3.2.3. Hematological analysis
The following hematological parameters were performed using the instrument
MINDRAY, BC 2800 Auto hematology analyzer.
• Hemoglobin
• Red blood cell
• White blood cell
• Lymphocyte %
87
• Haematocrit
• Mean corpuscular volume
• Mean corpuscular hemoglobin
• Mean corpuscular hemoglobin concentration
• Platelet
3.2.4. Liver function test
a) Bilirubin (direct/ total)
It was measured using Kit from AGAPPE Company, India, (kit No. 11003001 and batch
No. 10031063). It is based on the principle that total bilirubin in the sample reacts with
diazotized sulphalinic acid in the presence of DMSO.
Direct bilirubin (conjugated) reacts in acid environment with diazotized sulphalinic acid.
The formed colored azobilirubin is measured photometrically at 546 nm. For total
bilirubin the amount of 1000 µl of reagent I and 20 µl of reagent II and 50 µl of sample
and for direct bilirubin 1000µl of reagent III, 20µl reagent IV and 50µl of sample was
mixed well and incubated at room temperature for 5 min for total bilirubin and 2 min for
direct bilirubin. Absorbance of sample (Ac) was measured against sample blank (reagent
I and sample) (Ab) before 8 min at 546 nm (Tietz, 1983).
Ac � Ab� � 20.2 mg/dl Total or Direct bilirubin
b) Total protein
Total protein was measured using Kit from Erba Company, India, (kit No.120231 and
batch No. B021136). Cupric ions in an alkaline medium interact with protein peptide
bonds resulting in the formation of a colored complex. Blank (1000 µl reagent), standard
(20 µl std + 1000 µl reagent) and sample (20 µl sample + 1000 µl reagent), was mixed
and incubated for 10 min at 20-25ºC. Absorbance of sample (Ac) and standard (As) was
measured against blank (Gornall et al., 1949).
Ac As � Conc. Standard g/dl Protein⁄
88
c) Albumin
Albumin was measured using Kit from Erba Company, India, (kit No. 120223 and
batch No. B021181). The measurement of serum albumin is based on its quantitative
binding to the indicator 3, 3’,5, 5’- tetrabromo-m-cresol sulphophthalein
(bromocresol green, BCG). The albumin-BCG complex absorbs maximally at 578
nm. Sample ( sample 10 µl + BCG reagent 1000 µl), albumin standard (5 µl+ 1000 µ l
BCG regent) and blank (reagent only) was mixed and incubated for 5 min at room
temperature. The absorbance of sample (Ac) and standard (As) was measured against
blank (Gindler and Westgard, 1973).
Ac As � Conc. Standard g/dl Albumin⁄
d) Serum glutamic oxaloacetic transaminase
SGOT was measured with IFCC method, using kit from AGAPPE Company, India, (kit
No. 11408003 and batch No. 14081011). Aspartate transaminase (GOT-AST) catalyses
the reaction between alpha-ketoglutaric acid and L-aspartate giving glutamate and
oxaloacetate. Oxaloacetate in presence of malate dehydrogenase (MDH) reacts with
NADH giving malate and NDA. The rate of NADH decrease is determined
photometrically and is directly proportional to the GOT activity in the samples.
Amount of 100 µl of serum was mixed with 1000 µl of reagent and let stand for one min
in 37ºC. absorbance decrease per min during 3 min (Teitz, 1976a).
∆A min⁄ � 1746 U l⁄ AST
e) Serum glutamic pyruvic transaminase
SGPT was measured with IFCC method, using kit from AGAPPE Company, India, (kit
No. 11409003 and batch No. 14091031).
Glutamic-pyruvic Transaminase (GPT-ALT) catalyses the reaction between alpha-
ketoglutaric acid and alanine giving L-glutamic acid and pyruvic acid. Pyruvic acid, in
the in the presence of lactate dehydrogenase (LDH) reacts with NADH giving lactic acid
and NAD. The rate of NADH consumption was determined photometrically and was

89
directly proportional to the GPT activity in the sample. Hundred µl of serum sample was
mixed with 1000 µl of reagent and let it to stand for 1 min at 37ºC. During 3 minutes the
absorbance decrease per minute was measured (Teitz, 1976a).
f) Alkaline phosphatase
DGKC-SCE procedure was used for analysis of alkaline phosphatase (ALP). A kit from
AGAPPE, India, was used for this analysis. (Kit No. was 11401002 and batch No. was
14011081).
Kinetic determination of ALP based upon the following reactions.
An amount of 1000 µl of working reagent was mixed with 20 µl of serum sample,
incubated for 1 minute at 37ºC. The change in absorbance per minute was observed
during 3 minutes (Schlebusch et al., 1974).
ALP Activity (U/l) = (∆ OD/ min) × 2750
3.2.5. Serum glucose
a) Plasma Glucose
Fasting blood glucose and post prandial plasma glucose was measured using glucose kit
from Erba company, India. Kit No. 120235, batch No. BC51119. Glucose was
determined after enzymatic oxidation in the presence of glucose oxidase. The hydrogen
peroxide formed reacts, under catalysis of peroxidase, with 4 hydroxy benzoic acid and
4-aminophenazone to form a red-violet quinoeimine dye as indicator. Sample (10 µl+
1000 µl reagent), glucose standard (10 µl standard+ 1000 µl reagent) and blank (only
reagent) was incubated for 15 minutes at 37ºC. Absorbance of Sample (AT) and standard
(AS) was measured against blank within 30 minutes (Trinder, 1969).
90
Total Glucose (mg/dl) = AT/AS × conc. Standard
b) Hemoglobin A1c
Glycozilated hemoglobin A1c was measured using kit No. 1042184 (batch No.
10155058), from Mycocard company, Norway.
3.2.6. Lipid profile test
a) Total Cholesterol
It was measured using kit from Autospan Company from India. (Kit No. 71LS200-60 and
batch No. 4000006580). Cholesterol esters are hydrolyzed to produce cholesterol.
Hydrogen peroxide is then produced from oxidation of cholesterol by cholesterol oxidase.
The indicator quinoneimine is formed from hydrogen peroxide and 4-aminoantipyrine in
the presence of phenol and peroxide. The absorption of the red quinoneimine dye is
proportional to the concentration of cholesterol in the sample. Sample (10 µl+1000 µl
reagent), standard cholesterol ( 10 µl standard+ 1000 µl reagent) and blank (reagent only)
were prepared and incubated for 5 minutes at 37ºC. Absorbance of sample (AT) and
standard (AS) was measured against reagent blank at 505 nm (Tietz, 1973).
AT/AS × conc. Standard= mg/dl Cholesterol
b) Triglycerides
Kit was used from Autospan, India. (Kit No. 72LS100-60, batch No. 4000006173).
Triglycerides were determined after enzymatic hydrolysis with lipases. The quinoneimine
indicator is formed from hydrogen peroxide, 4-aminophenazone, and 4-cholrophenol
under the catalytic influence of peroxidase. Sample (Heparinised serum 10 µl+ 1000 µ l
reagent), standard (10 µl+ 1000 µl reagent) and reagent blank (1000 µl reagent) was
prepared and incubated for 5 minutes at 37ºC. Absorbance of sample (AT) and standard
(AS) was measured against reagent blank at 520 nm. The color was stable for 60 minutes
at 20 -25ºC (Bucolo and David, 1973).
AT/AS × conc. Standard= mg/dl Triglycerides
91
c) High density lipoprotein
Kit No, 71LS300-56, batch No. 4000005636, from Autospan, India, was used for HDL
determitation. Direct determination of serum HDL Cholestrol levels without the need for
any pre-treatment or centrifugation of sample was done. The method depends on the
properties of a detergent which solubillizes only the HDL so that HDL-c is released to
react with the cholesterol esterase, cholesterol oxidase and chromogens to give color.
Then HDL lipoprotein LDL, VLDL and chylomicrons are inhibited from reacting with
the enzymes due to absorption of the detergents on their surfaces. The intensity of the
color formed is proportional to the HDLc concentration in sample. Sample (300 µl
reagent 1+ 3 µl sample), calibrator (300 µl reagent 1+ 3 µl calibrator) and blank (300 µ l
reagent 1) were prepared and incubated for 5 minutes at 37ºC. Absorbance of the sample
and calibrator was read at 650 nm (A1). After reading, 100 µl of reagent 2 was added to
sample, calibrator and blank. After 5 minutes incubation at 37ºC, absorbance (A2) of
sample and calibrator was read against blank.
The increase of absorbance was calculated (Kaplan and Natio, 1984).
∆ A= A2 – A1
∆A sample
∆A calibrator � calibrator cancentration mg dl of HDLc in the sample⁄
Conversion factore: mg/dl ×0.0259= mmol/L
d) Low density lipoprotein
Low density lipoprotein cholesterol was measured with Diasys kit. (Kit No.
141219910930 and batch No. 14096). Direct determination of serum LDLc levels
without the need for any pre-treatment or centrifugation steps.
92
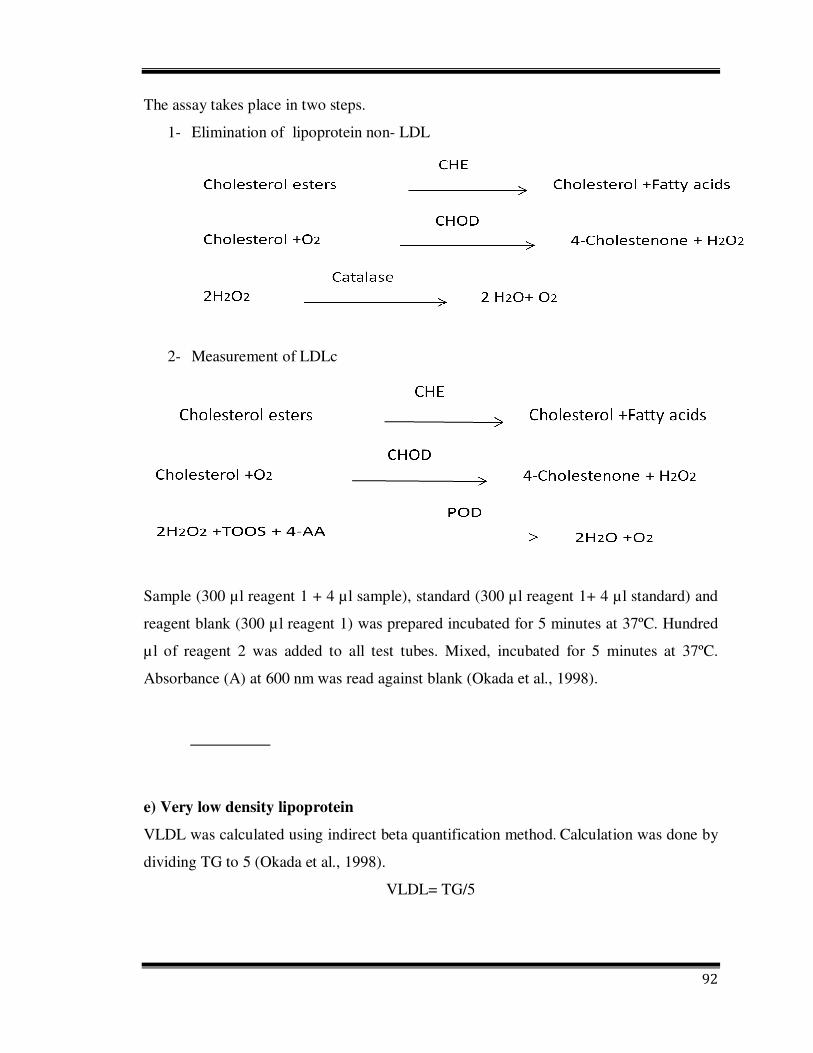
The assay takes place in two steps.
1- Elimination of lipoprotein non- LDL
2- Measurement of LDLc
Sample (300 µl reagent 1 + 4 µl sample), standard (300 µl reagent 1+ 4 µl standard) and
reagent blank (300 µl reagent 1) was prepared incubated for 5 minutes at 37ºC. Hundred
µl of reagent 2 was added to all test tubes. Mixed, incubated for 5 minutes at 37ºC.
Absorbance (A) at 600 nm was read against blank (Okada et al., 1998).
e) Very low density lipoprotein
VLDL was calculated using indirect beta quantification method. Calculation was done by
dividing TG to 5 (Okada et al., 1998).
VLDL= TG/5

93
3.2.7. Renal test
a) Urea
Urea was measured using kit from Aspen Company, India. (Batch No. URE-L-1073).
Urea was converted to ammonium by the use of urease. Ammonium ion then reacts with
a mixture of salicylate, sodium nitroprusside and hypochlorite to yield a blue- green
chromophore. The intensity of the color formed is proportional to the urea concentration
in the sample. Sample (1000 µl of reagent 1 +10 µl sample), standard (1000 µl of reagent
1 +10 µl standard) and blank (1000 µl reagent 1) was incubated for 5 minutes at 37ºC
then 1000 µl of reagent 2 was added to all tubes and incubated at 37ºC for 5 minutes.
Absorbance of standard (AT) and test sample (AS) was measured against blank at 578
nm (Teitz, 1976b).
Urea (mg/dl) = AT/AS × Conc. of standard
b) Uric Acid
Autospan kit was used for measurement of acid uric in sample. (Kit No. 82LS200-5,
batch No. 4000006773). Uric acid is converted by uricase to allantoin and hydrogen
peroxide which under the catalytic influence of peroxidase, oxidises 3,5-dichloro-2-
hydroxybenzenesulfonic acid and 4-aminophenazone to form a red-violet quinoneimine
compound. Sample (25 µl sample+ 1000 µl reagent), standard (25 µl standard+ 1000 µ l
reagent) and blank (1000 µl reagent) was incubated for 10 minutes at 37ºC. Absorbance
of sample (AC) and standard (AS) were measured at 520 nm (Trivedi et al., 1978).
AC/AS × C. = mg/dl Uric acid in serum
c) Creatinine
It was measured by Aspen kit (Batch No. CRE-021). Creatinine in alkaline solution
reacts with picrate to form a colored complex which absorbs at 500-520 nm. The amount
of complex formed is directly proportional to the creatinine concentration. Sample (1000
µl reagent + 100 µl sample), standard (1000 µl reagent + 100 µl standard) and reagent
blank (1000 µl reagent) was prepared and after 30 secs at room temperature, initial
94
absorbance was read at 500 nm. After 1 minute second reading was taken. The ∆A min.
of standard (AS) and sample (AC) was determined against reagent blank.
∆AC/∆AS× concentration of std = mg Creatinine /dl Serum
3.2.8. Measurement of Lipid peroxidation level
Lipid peroxidation level of plasma was determined by the reaction of thiobarbituric acid
(TBA) with MDA and other lipid peroxides. To 0.5 ml serum, 2.5 ml of 20 mg/dl
trichloroacetic acid is added and tubes are left to stand for 10 min at room temperature.
After centrifugation at 3500 rev./min for 10 min, the supernatant is decanted and the
precipitate is washed once with 0.05 M sulfuric acid. Then 2.5 ml of 0.05 M sulfuric acid
and 3.0 ml of 0.2 mg/dl TBA in 2 M sodium sulfate are added to this precipitate and the
coupling of lipid peroxide with TBA is carried out by heating in a boiling water bath for
30 min. after cooling in cold water, the resulting chromogen is extracted with 4.0 ml of n-
butyl alcohol by vigorous shaking. Separation of the organic phase is facilitated by
centrifugation at 3000 rev./min for 10 min and its absorbance is determined at the
wavelength of 530 nm. Malondialdehyde was used to produce standard calibration curve.
And the determined values are expressed in the terms of malondialdehyde (nmol/ml) used
as reference standard (Satoh kei, 1978).
3.2.9. Measurement of Plasma TAC (FRAP assay)
Working FRAP reagent was prepared freshly by adding acetate buffer pH.3.6, 10 mM
TPTZ in 40 mM HCL and 20 mM FeCl3.6H2O in the ratio of 10:1:1. To three ml of
working FRAP reagent, 100 µl of serum or standard was added in a test tube, vortex
mixed and absorbance was read at 593 nm against a reagent blank at a predetermined
time after sample reagent mixing. Test was performed at room temperature and
absorbance was red at 0-6 min. the results were calculated with following formula
(Benzie and Strain, 1999).
TAC ?@A BCD ∆ AFGHDB IJKI KLBMNJ
?@A BCD ∆ AFGHDB KILDOLPO � FRAP valude of standard μM�
95
3.2.10. Measurement of Plasma Total Thiol Molecules
Total sulfhydryl content was determined in plasma by the method of Hu and Dillard
(1994). An aliquot of plasma (0.2 ml) was mixed in a 10 ml test tube with 0.6 ml of the
Tris-EDTA buffer followed by addition of 40 µl of 10 mM DTNB and 3.16 ml of
absolute methanol. The test tube is capped and the color is developed for 15-20 min,
followed by centrifugation at 3000 g for 10 min at ambient temperature. The absorbance
of the supernatant is measured at 412 nm (A) and subtracted from a DTNB blank (B) and
a blank containing the sample without DTNB (C).
(A-B-C) x (4.0/0.2)/13.6 = (A-B-C) x 1.47 mM
3.3. IN VIVO ANTIOXIDANT ACTIVITY OF SHALLOT ON CIGARETTE
SMOKERS
In a clinical trial study the antioxidant properties of shallot were studied in 40 human
subjects. The study approval was taken from Human Ethical Committee, University of
Mysore. Subjects were volunteer Iranian male cigarette smokers who were smoking
cigarette from last 3 years with minimum of 5 cigarettes per day. The age group of 25 to
40 was included and subjects with specific disease or on medication were excluded from
this study. All participants were provided with specific written consents obtained prior to
entrance into the study. Randomly subjects were divided to 2 different groups (control
and study group). Five hundred mg of dry shallot powder and placebo in the form of
capsule were given to study group and control group respectively. Each individual was
extensively interviewed for specific information like smoking, dietary habits,
medications, history of special disease, before obtaining blood. The supplementation was
given for duration of one month. Before and after the study 24 hours food recall and
blood were taken. Blood was analyzed for lipid peroxidation (Satoh kei, 1978), total thiol
(Hu and Dillard, 1994) and total antioxidant capacity (Benzie and Strain, 1999).
96
3.4. EFFECT OF BORAGE SUPPLEMENTATION ON EIGHT DIFFERENT
MOOD STATES
Hundred healthy human age from 25 to 35 years were selected for the study. The study
approval was taken from human ethical Committee, University of Mysore. Subjects were
Iranian student in Mysore city. All participants were provided with specific written
consents obtained prior to entrance into the study. Subjects were given eight state
questionnaire (8SQ) and subjects with sten score 6 or more were included for the study.
Subjects were treated with 500 mg dry borage flower capsule once in a day for duration
of 30 days. For analysis of data, subjects with at least 5 mood states in high score were
considered as experimental group and subject with at least 5 stated in average score, were
considered in control group. Raw data were converted to sten score as given in the
manual of eight state questionnaire (8SQ).
97
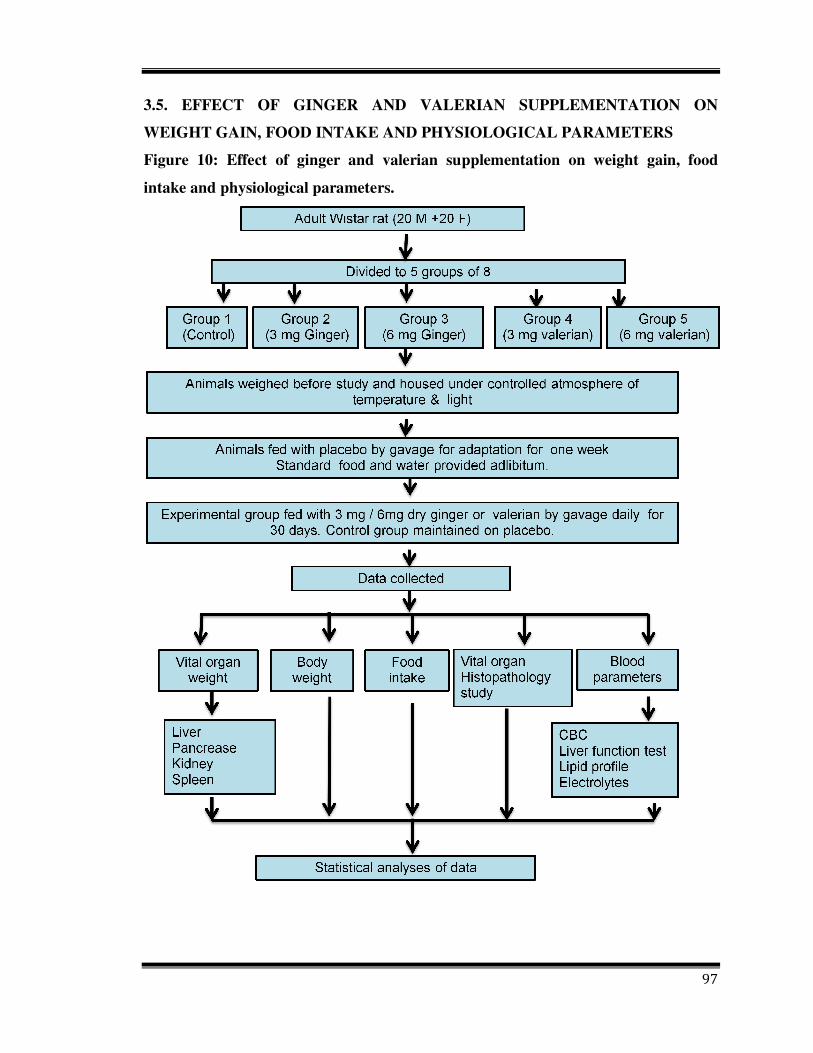
3.5. EFFECT OF GINGER AND VALERIAN SUPPLEMENTATION ON
WEIGHT GAIN, FOOD INTAKE AND PHYSIOLOGICAL PARAMETERS
Figure 10: Effect of ginger and valerian supplementation on weight gain, food
intake and physiological parameters.
98
Forty adult wistar rats (20 male and 20 female) were used in this study. the studt was
approved from the Animal Ethical Committee, from Department of Zoology, University
of Mysore, India. Disease free animals were provided from animal house of same
Department. They were acclimatized to the laboratory condition for 7 days. Animals were
fed with the commercial diet which they were taking before the study, housed
individually in wire mesh cages under controlled atmosphere of temperature & light.
Room temperature was maintained at 22-26°C and light cycle was 12 hours with lights
out at 18:00. The animals were accustomed to wire mesh cages and gavage (plain corn
starch paste) for one week. They were divided into 5 groups of 8 animals (4 male and 4
female) each by random design with average weight of 200 g at the beginning of the
study.
Corn starch was prepared (1g/ 30 ml water) heated to get suitable consistency and cooled
to 37°C. Three and 6 mg of dry ginger and valerian was added to corn starch to get 3.0
and 6.0 mg of ginger and valerian per ml of paste. For the control group plain corn starch
was used.
3.5.1. Mode of administration
At the start of acclimation period administration was started with giving plain corn starch
via gavage. After adaptation period animals were weighed and grouped by random design
method so that there were no marked differences in animal weight among the groups.
They were fed with medicinal plant via gavage once a day every morning for 30 days.
Three and 6.0 mg (15 and 30 mg/kg body weight) of ginger were given to group I and II,
3 and 6 mg (15 and 30 mg/kg body weight) of valerian was given to group III and IV and
control group (V) was given placebo which contained only corn starch paste.
3.5.2. Body weight gain and food intake
Food intake was recorded throughout the experiment; body weight was recorded once in
10 days with electronic balance.
99
3.5.3. Organ weight and blood parameters
All rats were anaesthetized with ether. Blood was collected from heart and 4 vital organ
weights (spleen, liver, pancreases and kidney) were measured and expressed as relative
weight.
Relative weight Absolute weight
weight of animals� 100
Lipid profile, liver function test, serum electrolytes and complete blood count were
assayed on a chemistry analyzer using standard methods.
During the 30 days of the experiment, all rats were observed daily. Notations were made
regarding their physical activity/lethargy, eye and skin condition, fur condition and stools
and others.
3.5.4. Histopathology study
Liver, pancreas, kidney and spleen was separated after dissection, weighed and kept in
70% alcohol and fixed in bouin’s fluid. Dehydration in grades of alcohol, clearance in
chloroform was done then organ was embedded in paraffin wax. Sections were taken at 5
µm thickness using microtomand stained with hematoxyline and eosine as per the
standard procedure and observed under light microscope.
3.5.5. Hematological analysis
The following hematological parameters were performed using the instrument
MINDRAY, BC 2800 Auto hematology analyzer.
• Hemoglobin
• Red blood cell
• White blood cell
• Lymphocyte %
• Haematocrit
• Mean corpuscular volume
100
• Mean corpuscular hemoglobin
• Mean corpuscular hemoglobin concentration
• Platelet
3.5.6. Liver function test
a) Bilirubin (direct/ total) (King and Coxon, 1950)
b) Total protein (Thomas, 1998)
c) Albumin (Grant et al., 1987)
d) SGPT (Thomas, 1998)
e) SGOT (Thomas, 1998)
f) Alkaline phosphatase (Thomas, 1998)
3.5.7. Lipid profile
a) Total cholesterol (Allain et al., 1974)
b) Triglyceride (Foster and Dunn, 1973)
c) High density lipoprotein (Warnick et al., 1982)
d) Very low density lipoprotein (Okada et al., 1998)
e) LDL (Friedewald et al., 1972)
3.5.8. Blood electrolytes
a) Sodium (Oser and summerson, 1965)
b) Potassium (Oser and summerson, 1965)
c) Chloride (Van Slyke, 1923)
3.6. STATISTICS
3.6.1. Phase I
Data were expressed as mean ± standard deviation (SD) in all experiments. To determine
the extent of association between antioxidant activity and antioxidant components in
different extracts, data were subjected to correlation coefficient was computed using
computer, the probability level was fixed at 0.5. All analysis done in 4 replicate.
101
3.6.2. Phase II
Data were analyzed using statistical program xlstat 2011. Animal weight, organ weight,
food consumption, clinical blood parameters were analyzed were analyzed for variance.
The result with P value less than 0.05 were considered to be statistically significant. Data
from human study was statistically analyzed by SPSS 16 for significant difference using
paired T-test, correlation and frequency distribution.
Related Documents